Epidemiological and nutritional transition in Mexico: rapid increase of non-communicable chronic...
10
Epidemiological and nutritional transition in Mexico: rapid increase of non-communicable chronic diseases and obesity Juan A Rivera 1 , Simo ´n Barquera 1, *, Fabricio Campirano 1 , Ismael Campos 1 , Margarita Safdie 1 and Vı ´ctor Tovar 2 1 Centro de Investigacio ´n en Nutricio ´ n y Salud, Instituto Nacional de Salud Pu ´blica, Avenida Universidad 655 Col. Santa Marı ´a Ahuacatitla ´ n, Cuernavaca, Morelos, Mexico, CP 62508: 2 Centro de Investigacio ´ n en Poblaciones, Instituto Nacional de Salud Pu ´blica, Cuernavaca, Morelos, Mexico Abstract Objective: The objective of this paper is to characterise the epidemiological and nutritional transition and their determinants in Mexico. Design: Age-adjusted standardised mortality rates (SMRs) due to acute myocardial infarction (AMI), diabetes mellitus and hypertension were calculated for 1980 – 1998. Changes in the prevalences of overweight and obesity in women and children and of dietary intake from 1988 to 1999 were also used in the analysis. Quantities of food groups purchased by adult equivalent (AE) and food expenditures away from home between 1984 and 1989 were used to assess trends. All information was analysed at the national and regional levels, and by urban and rural areas. Results: SMR for diabetes, AMI and hypertension increased dramatically parallel to obesity at the national and regional levels. Fat intake in women and the purchase of refined carbohydrates, including soda, also increased. Discussion: The results suggest that obesity is playing a role in the increased SMRs of diabetes, AMI and hypertension in Mexico. Total energy dietary intake and food purchase data could not explain the rise in the prevalence of obesity. The increases in fat intake and the purchase of refined carbohydrates may be risk factors for increased mortality. Information on physical activity was not available. Conclusion: SMRs due to diabetes, hypertension and AMI have increased dramatically in parallel with the prevalence of obesity; therefore actions should be taken for the prevention of obesity. Reliable information about food consumption and physical activity is required to assess their specific roles in the aetiology of obesity. Keywords Diabetes mellitus Acute myocardial infarction Hypertension Obesity Dietary intake Mortality trends Mexico is currently undergoing an epidemiological transition 1–4 characterised as the retarded variant of the transition model 4,5 . Several studies have described a phenomenon of polarisation in the country, where the more developed industrial states (those in the north) have epidemiological profiles similar to those of developed countries and less developed states reflect pre-transitional epidemiological profiles 2,3,6 . This polarisation has been attributed to the uneven distribution of wealth, education, access to health services and overall quality of basic services between rich and poor families 1–3 ; however, in recent years obesity, diabetes and other non-communic- able chronic diseases (NCCDs) have been increasing among the poor 7,8 . Moreover, a growing number of studies are finding an association of low birth weight with obesity, diabetes and coronary heart disease in adults 9–13 . Access to inexpensive but high energy-dense foods is rising and physical activity is decreasing, since large numbers of people now live in urban areas and are engaged in less physical activity 14,15 . The objective of this paper is to characterise the epidemiological and nutri- tional transitions and their determinants in Mexico. Methods There were two types of information for this study: (1) datasets from national probabilistic surveys that were analysed specifically for this paper and (2) information that had been published. The sources of information are described below. Trends of NCCD mortality in Mexico Mortality rates for acute myocardial infarction (AMI), diabetes mellitus and hypertension were obtained from the National Institute of Informatics, Statistics and Geography (INEGI) using the International Classification of Diseases, version 9 (ICD-9) for the years 1980 to 1997 16 and version 10 (ICD-10) for 1998 17 . AMI included causes 410 to 414 (ICD-9) in 1980 – 1997 and I20 to I25 (ICD-10) in 1998. Diabetes mellitus included cause 250 (ICD-9) in 1980 – 1997 and E10 to E14 (ICD-10) in 1998. Hypertension included causes 401 to 405 (ICD-9) in 1980–1987 and I10 to I15 (ICD-10) in 1998. The mortality rates were calculated using population estimates for Mexico provided by INEGI. Once crude mortality rates were obtained, they q The Authors 2002 *Corresponding author: Email [email protected] Public Health Nutrition: 5(1A), 113–122 DOI: 10.1079/PHN2001282
Transcript of Epidemiological and nutritional transition in Mexico: rapid increase of non-communicable chronic...

Epidemiological and nutritional transition in Mexico: rapidincrease of non-communicable chronic diseases and obesity
Juan A Rivera1, Simon Barquera1,*, Fabricio Campirano1, Ismael Campos1,Margarita Safdie1 and Vıctor Tovar21Centro de Investigacion en Nutricion y Salud, Instituto Nacional de Salud Publica, Avenida Universidad 655 Col.Santa Marıa Ahuacatitlan, Cuernavaca, Morelos, Mexico, CP 62508: 2Centro de Investigacion en Poblaciones,Instituto Nacional de Salud Publica, Cuernavaca, Morelos, Mexico
Abstract
Objective: The objective of this paper is to characterise the epidemiological andnutritional transition and their determinants in Mexico.Design: Age-adjusted standardised mortality rates (SMRs) due to acute myocardialinfarction (AMI), diabetes mellitus and hypertension were calculated for 1980–1998.Changes in the prevalences of overweight and obesity in women and children and ofdietary intake from 1988 to 1999 were also used in the analysis. Quantities of foodgroups purchased by adult equivalent (AE) and food expenditures away from homebetween 1984 and 1989 were used to assess trends. All information was analysed atthe national and regional levels, and by urban and rural areas.Results: SMR for diabetes, AMI and hypertension increased dramatically parallel toobesity at the national and regional levels. Fat intake in women and the purchase ofrefined carbohydrates, including soda, also increased.Discussion: The results suggest that obesity is playing a role in the increased SMRs ofdiabetes, AMI and hypertension in Mexico. Total energy dietary intake and foodpurchase data could not explain the rise in the prevalence of obesity. The increases infat intake and the purchase of refined carbohydrates may be risk factors for increasedmortality. Information on physical activity was not available.Conclusion: SMRs due to diabetes, hypertension and AMI have increased dramaticallyin parallel with the prevalence of obesity; therefore actions should be taken for theprevention of obesity. Reliable information about food consumption and physicalactivity is required to assess their specific roles in the aetiology of obesity.
KeywordsDiabetes mellitus
Acute myocardial infarctionHypertension
ObesityDietary intake
Mortality trends
Mexico is currently undergoing an epidemiological
transition1–4 characterised as the retarded variant of the
transition model4,5. Several studies have described a
phenomenon of polarisation in the country, where the
more developed industrial states (those in the north) have
epidemiological profiles similar to those of developed
countries and less developed states reflect pre-transitional
epidemiological profiles2,3,6. This polarisation has been
attributed to the uneven distribution of wealth, education,
access to health services and overall quality of basic
services between rich and poor families1–3; however, in
recent years obesity, diabetes and other non-communic-
able chronic diseases (NCCDs) have been increasing
among the poor7,8. Moreover, a growing number of
studies are finding an association of low birth weight with
obesity, diabetes and coronary heart disease in adults9–13.
Access to inexpensive but high energy-dense foods is
rising and physical activity is decreasing, since large
numbers of people now live in urban areas and are
engaged in less physical activity14,15. The objective of this
paper is to characterise the epidemiological and nutri-
tional transitions and their determinants in Mexico.
Methods
There were two types of information for this study: (1)
datasets from national probabilistic surveys that were
analysed specifically for this paper and (2) information
that had been published. The sources of information are
described below.
Trends of NCCD mortality in Mexico
Mortality rates for acute myocardial infarction (AMI),
diabetes mellitus and hypertension were obtained from
the National Institute of Informatics, Statistics and
Geography (INEGI) using the International Classification
of Diseases, version 9 (ICD-9) for the years 1980 to 199716
and version 10 (ICD-10) for 199817. AMI included causes
410 to 414 (ICD-9) in 1980–1997 and I20 to I25 (ICD-10) in
1998. Diabetes mellitus included cause 250 (ICD-9) in
1980–1997 and E10 to E14 (ICD-10) in 1998. Hypertension
included causes 401 to 405 (ICD-9) in 1980–1987 and I10
to I15 (ICD-10) in 1998. The mortality rates were
calculated using population estimates for Mexico provided
by INEGI. Once crude mortality rates were obtained, they
q The Authors 2002*Corresponding author: Email [email protected]
Public Health Nutrition: 5(1A), 113–122 DOI: 10.1079/PHN2001282

were age-adjusted according to the new World Health
Organization (WHO) reference population to allow
international comparisons18. In addition, the relative
change from 1980 to 1998 was estimated for each year
and compared across the selected mortality causes.
Geographic location
Age-adjusted standardised mortality rate (SMR) data are
also presented by four regions to allow comparisons with
the Mexican Nutrition Survey and the National Chronic
Diseases Survey, which were representative of four
regions constructed on the basis of common character-
istics, such as development and per capita income19. The
states included in each region are: North (Baja California,
Baja California Sur, Coahuila, Chihuahua, Durango, Nuevo
Leon, Sonora, Sinaloa, Tamaulipas and Zacatecas), Central
(Aguascalientes, Colima, Guanajuato, Hidalgo, Jalisco,
Mexico, Michoacan, Nayarit, Queretaro, San Luis Potosı
and Tlaxcala), Mexico City and South (Campeche,
Chiapas, Guerrero, Morelos, Oaxaca, Puebla, Quintana
Roo, Tabasco, Veracruz and Yucatan). Data were also
analysed by rural (population equal to or less than 15 000)
or urban location (population more than 15 000). All data
were weighted for the analysis using the corresponding
expansion factors provided by INEGI.
Diabetes, hypertension and hyperlipidaemia
Prevalences of diabetes, hypertension and hypercholes-
terolaemia were obtained from the National Chronic
Diseases Survey (NCDS) conducted in 1992–93 in a
probabilistic sample of adults 20–69 years old from urban
locations (more than 2500 habitants)20. The survey was
designed to be representative of urban areas at the
national level and for the four regions identified above.
Hypertension was defined as systolic pressure
$140 mmHg and/or diastolic pressure $90 mmHg during
two measurements. Diabetes was defined as a concen-
tration of glucose in fasting venous blood serum
$120 mg dl21 or $200 mg dl21 in casual samples.
Hypercholesterolaemia was defined as the concentration
of total cholesterol in plasma $240 mg dl21.
Obesity and dietary intake
Published information about malnutrition and obesity are
based on two probabilistic National Nutrition Surveys
(NNS) conducted in 1988 (NNS-88) and 1999 (NNS-99).
Both surveys were designed to be representative at the
national level and by the four regions described above.
These surveys collected information of children under 5
years old and reproductive-age women (12–49 years old).
For this paper, published information about overweight in
children 0–5 years of age, as well as body mass index
(BMI) in women 18–49 years old, is reported. Overweight
and obesity in women were defined according to the
WHO criteria for body mass index: BMI of 25.0–
29.9 kg m22 for overweight and $30 kg m22 for obesity21.
Overweight in children was defined22 as a Z-score of
weight-for-height above +2. Dietary intake from the two
NNS is presented for women 12–49 years of age. Both
surveys used the 24-hour recall method. The median total
energy intake (kcal) as well as the intake of protein,
carbohydrates and fat (g) is presented.
Quantity of food purchased per adult equivalent
Household food quantities purchased, per adult equiva-
lent, were used as a proxy for food intake. Data from six
National Income and Expenditure Surveys (NIES) con-
ducted between 1984 and 1998 were used. These surveys
were collected by the National Institute of Geography,
Informatics and Statistics. They contain nationally repre-
sentative information of about 15 000 households and their
members. Information from the following years was
available: 1984, 1988, 1992, 1994, 1996 and 1998.
Household adult equivalents (AE)
For each household member, the individual adult
equivalent was obtained by dividing the Recommended
Dietary Allowance (RDA) for energy23 of each household
member, according to the specific age and sex, by the
average energy RDA for an adult (2550 kcal). The sum of
all of the individual adult equivalents within a household
was further computed to obtain the household adult
equivalent (AE). Family members not currently living in
the house were excluded from this estimation, but their
contribution to the household income was included in the
total household income.
Food expenditure
About 215 foods were included in each NIES, with slight
variations in some years. Expenditures are reported per
week in Mexican pesos. A database with household
expenditures for each food per household was developed.
Expenditures for selected food groups were created and
converted to US dollars (US$) using the average exchange
rate of the year in which the survey was conducted. The
food groups were: (1) fruits, vegetables and legumes; (2)
meat, poultry and eggs; (3) milk and dairy products; (4)
cereals; (5) fats and oils; (5) sugars and refined
carbohydrates (which, in addition to carbohydrates,
included all sugar-sweetened beverages). Results are
presented for the food groups and for two individual food
items, already included in the food groups, that have high
consumption in the Mexican diet: tortilla (the traditional
staple) and soda. The median weekly total food
expenditure per AE was obtained, as well as the median
food group expenditure per AE.
Quantity of food purchased per adult equivalent
Food prices experienced important changes during the
study period, even after adjusting for inflation. This was
probably due, in part, to removal of food subsidies during
this period for staples (tortilla and white bread) and milk,
JA Rivera et al.114
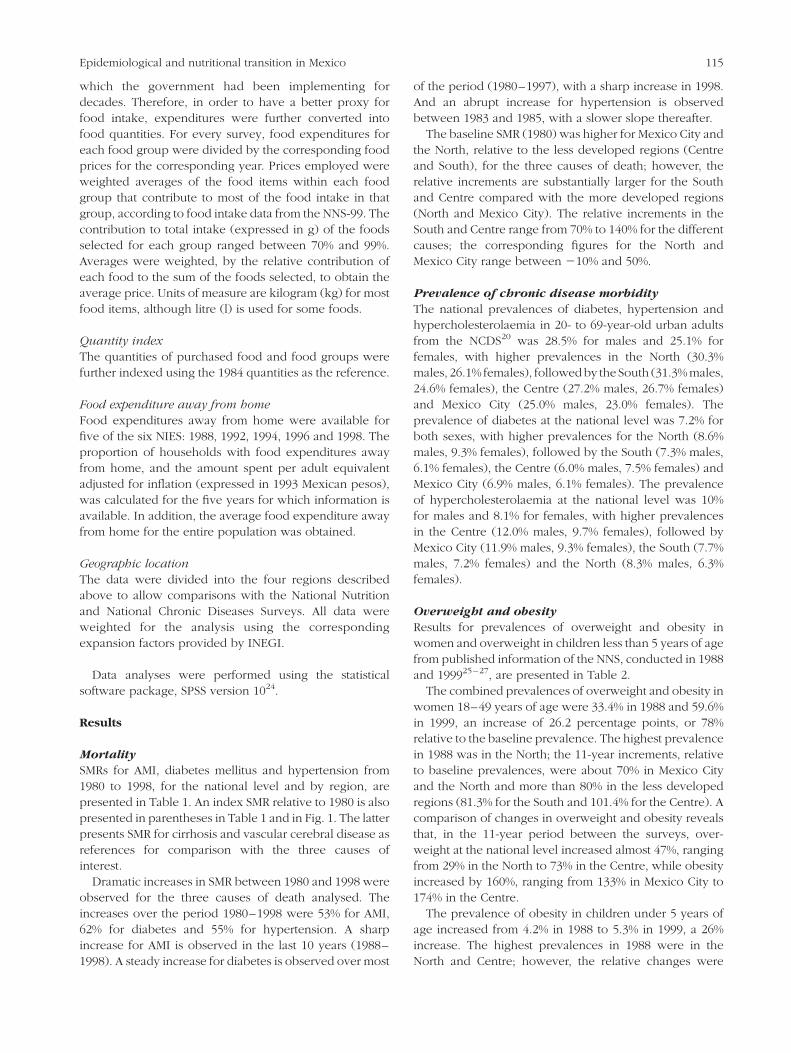
which the government had been implementing for
decades. Therefore, in order to have a better proxy for
food intake, expenditures were further converted into
food quantities. For every survey, food expenditures for
each food group were divided by the corresponding food
prices for the corresponding year. Prices employed were
weighted averages of the food items within each food
group that contribute to most of the food intake in that
group, according to food intake data from the NNS-99. The
contribution to total intake (expressed in g) of the foods
selected for each group ranged between 70% and 99%.
Averages were weighted, by the relative contribution of
each food to the sum of the foods selected, to obtain the
average price. Units of measure are kilogram (kg) for most
food items, although litre (l) is used for some foods.
Quantity index
The quantities of purchased food and food groups were
further indexed using the 1984 quantities as the reference.
Food expenditure away from home
Food expenditures away from home were available for
five of the six NIES: 1988, 1992, 1994, 1996 and 1998. The
proportion of households with food expenditures away
from home, and the amount spent per adult equivalent
adjusted for inflation (expressed in 1993 Mexican pesos),
was calculated for the five years for which information is
available. In addition, the average food expenditure away
from home for the entire population was obtained.
Geographic location
The data were divided into the four regions described
above to allow comparisons with the National Nutrition
and National Chronic Diseases Surveys. All data were
weighted for the analysis using the corresponding
expansion factors provided by INEGI.
Data analyses were performed using the statistical
software package, SPSS version 1024.
Results
Mortality
SMRs for AMI, diabetes mellitus and hypertension from
1980 to 1998, for the national level and by region, are
presented in Table 1. An index SMR relative to 1980 is also
presented in parentheses in Table 1 and in Fig. 1. The latter
presents SMR for cirrhosis and vascular cerebral disease as
references for comparison with the three causes of
interest.
Dramatic increases in SMR between 1980 and 1998 were
observed for the three causes of death analysed. The
increases over the period 1980–1998 were 53% for AMI,
62% for diabetes and 55% for hypertension. A sharp
increase for AMI is observed in the last 10 years (1988–
1998). A steady increase for diabetes is observed over most
of the period (1980–1997), with a sharp increase in 1998.
And an abrupt increase for hypertension is observed
between 1983 and 1985, with a slower slope thereafter.
The baseline SMR (1980) was higher for Mexico City and
the North, relative to the less developed regions (Centre
and South), for the three causes of death; however, the
relative increments are substantially larger for the South
and Centre compared with the more developed regions
(North and Mexico City). The relative increments in the
South and Centre range from 70% to 140% for the different
causes; the corresponding figures for the North and
Mexico City range between 210% and 50%.
Prevalence of chronic disease morbidity
The national prevalences of diabetes, hypertension and
hypercholesterolaemia in 20- to 69-year-old urban adults
from the NCDS20 was 28.5% for males and 25.1% for
females, with higher prevalences in the North (30.3%
males, 26.1% females), followedby the South (31.3%males,
24.6% females), the Centre (27.2% males, 26.7% females)
and Mexico City (25.0% males, 23.0% females). The
prevalence of diabetes at the national level was 7.2% for
both sexes, with higher prevalences for the North (8.6%
males, 9.3% females), followed by the South (7.3% males,
6.1% females), the Centre (6.0% males, 7.5% females) and
Mexico City (6.9% males, 6.1% females). The prevalence
of hypercholesterolaemia at the national level was 10%
for males and 8.1% for females, with higher prevalences
in the Centre (12.0% males, 9.7% females), followed by
Mexico City (11.9% males, 9.3% females), the South (7.7%
males, 7.2% females) and the North (8.3% males, 6.3%
females).
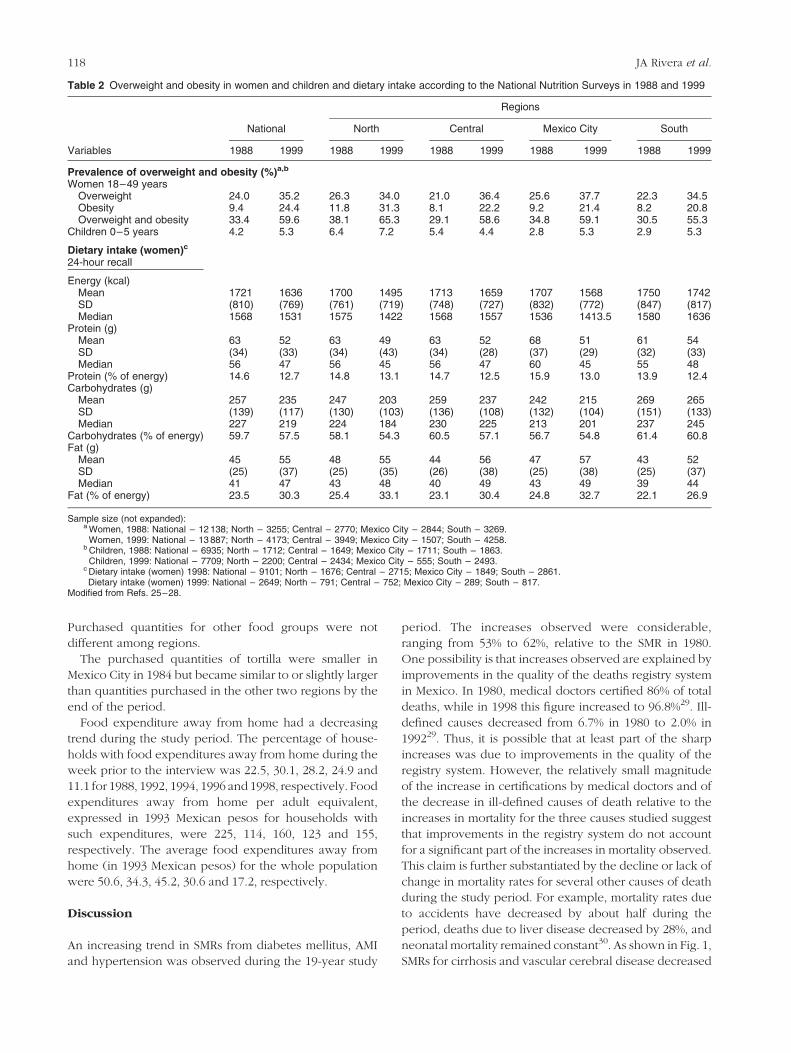
Overweight and obesity
Results for prevalences of overweight and obesity in
women and overweight in children less than 5 years of age
from published information of the NNS, conducted in 1988
and 199925–27, are presented in Table 2.
The combined prevalences of overweight and obesity in
women 18–49 years of age were 33.4% in 1988 and 59.6%
in 1999, an increase of 26.2 percentage points, or 78%
relative to the baseline prevalence. The highest prevalence
in 1988 was in the North; the 11-year increments, relative
to baseline prevalences, were about 70% in Mexico City
and the North and more than 80% in the less developed
regions (81.3% for the South and 101.4% for the Centre). A
comparison of changes in overweight and obesity reveals
that, in the 11-year period between the surveys, over-
weight at the national level increased almost 47%, ranging
from 29% in the North to 73% in the Centre, while obesity
increased by 160%, ranging from 133% in Mexico City to
174% in the Centre.
The prevalence of obesity in children under 5 years of
age increased from 4.2% in 1988 to 5.3% in 1999, a 26%
increase. The highest prevalences in 1988 were in the
North and Centre; however, the relative changes were
Epidemiological and nutritional transition in Mexico 115

much higher in Mexico City and the South (increases of
over 80%) than in the North (12.5%) and the Centre
(218.5%).
Dietary intake
Total energy intake at the national level was about 80% of
the recommended intake23, reflecting the underreporting
often shown in 24-hour recall data. Fat intake in 1999
represented over 30% of the energy intake in all regions,
except the South, while carbohydrate intake was between
55 and 60%. Total energy and carbohydrates intake
showed a declining trend in all regions but the South, from
1988 to 1999. However, the declines were small, relative to
the standard deviation of the distribution (less than 0.2 of a
standard deviation). Protein intake declined from 1988 to
1999 in all regions. The difference in protein intake is
relatively large for all regions (<0.33–0.45 of a standard
deviation) except for the South (<0.20 of a standard
deviation). Fat intake shows a change from 1988 to 1999
similar to the national level and consistent in all regions;
the increases are relatively large in the Centre, South and
Mexico City (<0.25–0.45 of a standard deviation) and
smaller for the North (<0.25 of a standard deviation)27,28.
Quantities of food purchased per adult equivalent
Mean quantities of food purchased in the households per
adult equivalent for the six years for which data were
available (1984 to 1998) are presented in Table 3.
Information is presented for the food groups and food
items listed in the Methods section.
A general decline in food quantities purchased at the
national level is observed for food groups from 1984 to
1998, except for sugars and refined carbohydrates, which
increased by 10%. In general, food quantities purchased
remained constant or increased from 1984 to 1989,
declined in 1992, increased again in 1994, and declined
sharply thereafter. The exceptions are cereals, which
declined steadily during the study period, and sugars,
which increased after 1992. Trends in individual food
items agree, in general, with the findings for the
corresponding food groups. Tortillas follow the steady
decline observed in cereals, while soda shows an
important increase in quantity purchased without
decreases in any particular year. Results in urban and
rural areas show trends almost identical to those observed
at the national level, although the quantities of food
groups purchased are higher in urban areas for the whole
period. This difference is substantial (almost double) for
most food items, except for fats and oils and for sugars.
Tortilla, the traditional staple in Mexico, is the only food
item with larger quantities purchased in rural than in urban
areas.
Purchased food quantities show similar trends in the
four regions except for sugars, which declined slightly in
the South and increased slightly in the other three regions,
and fats and milk, which declined in all areas except
Mexico City. Tortillas showed no change, or a small
decline, in Mexico City, with larger declines in the other
three areas, while soda showed an important increase in
Mexico City (150%), with more modest increases in the
other regions (20–30%).
The purchased quantities of fruits, vegetables and
legumes and meat, poultry and eggs were substantially
higher (1.5 to 2.5 times) in Mexico City compared with the
other three regions during the period. Purchased
quantities for sugars and refined carbohydrates were
larger in Mexico City and the North (25–40% higher)
compared with the other regions during the period.
Fig. 1 Age-adjusted death rates, relative to 1980, from high blood pressure (HBP), diabetes mellitus (DM), acute myocardial infarction(AMI), cirrhosis and stroke from 1980 to 1998 in Mexico. HBP included causes 401 to 405 (ICD-9) and I10 to I15 (ICD-10). DM includedcause 250 (ICD-9) and E10 to E14 (ICD-10). AMI included causes 410 to 414 (ICD-9) and I20 to I25 (ICD-10). Cirrhosis included causes571.2, 571.5, 571.6 (ICD-9) and K70.3, K74.3, K74.6 (ICD-10). Stroke included causes 430 to 438 (ICD-9) and I60 to I69 (ICD-10)
JA Rivera et al.116

Table 1 Mortality due to diet-related chronic diseases in Mexico from 1980 to 1998
Numberof cases
Crude mortalityrate*
Standardisedmortality
rate (SMR)†
Regional SMR‡ SMR increaserelative
to 1980 (%)Cause Year North Central Mexico City South
Acute myocardial infarction§ 1980 13 058 17.5 39.5 59.2 34.1 45.2 27.5 100.01981 13 406 18.3 40.9 65.4 35.6 42.1 27.9 103.61982 13 537 18.0 40.2 64.2 34.8 42.4 27.1 101.91983 14 133 18.4 40.7 65.2 35.0 42.3 27.8 103.21984 14 874 19.0 41.7 64.4 36.7 42.8 29.1 105.71985 16 030 20.0 43.5 64.0 38.1 43.2 33.9 110.31986 15 292 18.8 40.5 58.1 38.3 39.5 29.4 102.61987 16 517 19.6 41.8 68.4 38.7 38.4 29.0 106.01988 19 408 22.9 48.5 72.4 45.9 44.9 34.2 122.91989 21 347 24.5 51.2 78.6 46.0 50.2 35.7 129.81990 23 398 26.5 54.2 79.0 48.3 56.7 39.6 137.31991 21 520 27.3 55.1 79.7 49.9 58.6 39.2 139.71992 25 646 28.1 55.7 77.2 52.3 59.9 39.8 141.21993 27 302 29.4 57.0 76.8 53.4 60.5 43.1 144.51994 29 092 30.8 58.6 79.8 54.1 62.2 44.4 148.41995 30 945 32.3 60.2 82.0 54.9 60.8 47.8 152.51996 32 746 33.8 61.7 83.1 56.3 60.3 51.3 156.31997 34 651 25.0 62.2 85.0 57.4 61.0 50.1 157.81998 34 587 34.8 60.4 85.6 61.5 63.8 55.2 153.2
Diabetes mellitus{ 1980 14 515 20.8 46.9 52.5 42.3 76.6 33.9 100.01981 15 299 21.3 47.8 52.9 41.8 81.2 35.2 101.81982 16 616 22.6 50.5 58.5 48.1 76.2 35.1 107.71983 18 726 25.0 55.2 64.6 53.0 76.1 40.2 117.61984 19 274 25.2 55.0 64.5 53.8 71.6 40.6 117.21985 20 763 26.5 57.2 63.8 56.3 78.5 42.6 122.01986 23 100 28.9 61.8 72.3 60.9 74.1 48.6 131.81987 23 882 29.3 62.1 70.5 58.6 77.9 51.6 132.21988 24 986 28.7 59.6 62.0 59.8 73.4 50.4 127.01989 25 519 30.2 61.4 72.9 59.2 71.8 49.2 130.81990 25 592 29.7 59.6 67.7 60.4 72.3 45.4 127.11991 26 989 30.8 60.6 65.8 63.8 69.2 47.7 129.21992 28 135 31.6 61.0 64.0 65.5 69.2 48.2 129.91993 29 428 32.5 61.2 63.6 66.3 66.4 50.1 130.51994 30 156 32.8 60.4 62.4 64.4 64.1 51.7 128.71995 33 168 35.5 63.9 64.4 70.3 66.5 53.6 136.21996 34 692 36.6 64.5 64.8 71.2 64.7 55.8 137.51997 35 835 37.3 64.2 66.2 71.1 61.9 55.0 136.71998 41 714 45.3 76.1 83.7 90.6 79.0 72.2 162.1
High blood pressurek 1980 3221 4.7 10.9 15.9 8.9 15.8 7.2 100.01981 3394 4.7 10.9 13.7 9.2 17.7 7.9 100.61982 3525 4.8 11.0 13.4 10.1 17.0 7.4 101.31983 3727 4.9 11.4 13.6 10.4 16.5 8.4 104.61984 4580 6.0 13.6 16.4 12.8 18.7 9.8 124.91985 5468 7.0 15.7 18.5 15.0 19.6 12.3 144.41986 5602 7.0 15.6 17.3 15.5 20.3 11.9 143.31987 5907 7.2 16.0 18.5 15.5 21.1 11.9 146.81988 6416 7.7 16.9 18.6 17.3 20.8 13.0 155.51989 6550 7.7 16.5 19.0 17.5 18.4 12.3 152.11990 6647 7.7 16.3 19.0 16.7 15.8 13.8 149.91991 6587 7.5 15.6 16.9 16.6 14.8 13.7 143.51992 6969 7.8 15.9 17.1 16.9 15.0 14.2 146.11993 7627 8.4 16.7 18.4 17.5 14.8 15.4 153.91994 8065 8.8 17.0 18.7 18.4 14.3 15.3 156.61995 8560 9.2 17.3 18.7 18.3 15.7 15.9 159.51996 8643 9.1 16.9 17.8 18.3 14.0 16.1 155.51997 9087 9.4 17.0 17.9 17.9 14.3 16.7 156.51998 9361 9.6 16.9 18.7 20.3 14.4 17.7 155.1
* Per 100 000 inhabitants.† Age-standardised according to WHO criteria17.‡ Regions include the following states: North – Baja California, Baja California Sur, Coahuila, Chihuahua, Durango, Nuevo Leon, Sonora, Sinaloa, Tamauli-pas and Zacatecas; Central – Aguascalientes, Colima, Guanajuato, Hidalgo, Jalisco, Mexico, Michoacan, Nayarit, Queretaro, San Luis Potosı and Tlaxcala;Mexico City; and South – Campeche, Chiapas, Guerrero, Morelos, Oaxaca, Puebla, Quintana Roo, Tabasco, Veracruz and Yucatan.§ Acute myocardial infarction included causes 410 to 414 (ICD-9) and I20 to I25 (ICD-10).{Diabetes mellitus included cause 250 (ICD-9) and E10 to E14 (ICD-10).kHigh blood pressure included causes 401 to 405 (ICD-9) and I10 to I15 (ICD-10).
Epidemiological and nutritional transition in Mexico 117
Purchased quantities for other food groups were not
different among regions.
The purchased quantities of tortilla were smaller in
Mexico City in 1984 but became similar to or slightly larger
than quantities purchased in the other two regions by the
end of the period.
Food expenditure away from home had a decreasing
trend during the study period. The percentage of house-
holds with food expenditures away from home during the
week prior to the interview was 22.5, 30.1, 28.2, 24.9 and
11.1 for 1988, 1992, 1994, 1996 and 1998, respectively. Food
expenditures away from home per adult equivalent,
expressed in 1993 Mexican pesos for households with
such expenditures, were 225, 114, 160, 123 and 155,
respectively. The average food expenditures away from
home (in 1993 Mexican pesos) for the whole population
were 50.6, 34.3, 45.2, 30.6 and 17.2, respectively.
Discussion
An increasing trend in SMRs from diabetes mellitus, AMI
and hypertension was observed during the 19-year study
period. The increases observed were considerable,
ranging from 53% to 62%, relative to the SMR in 1980.
One possibility is that increases observed are explained by
improvements in the quality of the deaths registry system
in Mexico. In 1980, medical doctors certified 86% of total
deaths, while in 1998 this figure increased to 96.8%29. Ill-
defined causes decreased from 6.7% in 1980 to 2.0% in
199229. Thus, it is possible that at least part of the sharp
increases was due to improvements in the quality of the
registry system. However, the relatively small magnitude
of the increase in certifications by medical doctors and of
the decrease in ill-defined causes of death relative to the
increases in mortality for the three causes studied suggest
that improvements in the registry system do not account
for a significant part of the increases in mortality observed.
This claim is further substantiated by the decline or lack of
change in mortality rates for several other causes of death
during the study period. For example, mortality rates due
to accidents have decreased by about half during the
period, deaths due to liver disease decreased by 28%, and
neonatal mortality remained constant30. As shown in Fig. 1,
SMRs for cirrhosis and vascular cerebral disease decreased
Table 2 Overweight and obesity in women and children and dietary intake according to the National Nutrition Surveys in 1988 and 1999
Regions
National North Central Mexico City South
Variables 1988 1999 1988 1999 1988 1999 1988 1999 1988 1999
Prevalence of overweight and obesity (%)a,b
Women 18–49 yearsOverweight 24.0 35.2 26.3 34.0 21.0 36.4 25.6 37.7 22.3 34.5Obesity 9.4 24.4 11.8 31.3 8.1 22.2 9.2 21.4 8.2 20.8Overweight and obesity 33.4 59.6 38.1 65.3 29.1 58.6 34.8 59.1 30.5 55.3
Children 0–5 years 4.2 5.3 6.4 7.2 5.4 4.4 2.8 5.3 2.9 5.3
Dietary intake (women)c
24-hour recall
Energy (kcal)Mean 1721 1636 1700 1495 1713 1659 1707 1568 1750 1742SD (810) (769) (761) (719) (748) (727) (832) (772) (847) (817)Median 1568 1531 1575 1422 1568 1557 1536 1413.5 1580 1636
Protein (g)Mean 63 52 63 49 63 52 68 51 61 54SD (34) (33) (34) (43) (34) (28) (37) (29) (32) (33)Median 56 47 56 45 56 47 60 45 55 48
Protein (% of energy) 14.6 12.7 14.8 13.1 14.7 12.5 15.9 13.0 13.9 12.4Carbohydrates (g)
Mean 257 235 247 203 259 237 242 215 269 265SD (139) (117) (130) (103) (136) (108) (132) (104) (151) (133)Median 227 219 224 184 230 225 213 201 237 245
Carbohydrates (% of energy) 59.7 57.5 58.1 54.3 60.5 57.1 56.7 54.8 61.4 60.8Fat (g)
Mean 45 55 48 55 44 56 47 57 43 52SD (25) (37) (25) (35) (26) (38) (25) (38) (25) (37)Median 41 47 43 48 40 49 43 49 39 44
Fat (% of energy) 23.5 30.3 25.4 33.1 23.1 30.4 24.8 32.7 22.1 26.9
Sample size (not expanded):a Women, 1988: National – 12 138; North – 3255; Central – 2770; Mexico City – 2844; South – 3269.
Women, 1999: National – 13 887; North – 4173; Central – 3949; Mexico City – 1507; South – 4258.b Children, 1988: National – 6935; North – 1712; Central – 1649; Mexico City – 1711; South – 1863.
Children, 1999: National – 7709; North – 2200; Central – 2434; Mexico City – 555; South – 2493.c Dietary intake (women) 1998: National – 9101; North – 1676; Central – 2715; Mexico City – 1849; South – 2861.Dietary intake (women) 1999: National – 2649; North – 791; Central – 752; Mexico City – 289; South – 817.
Modified from Refs. 25–28.
JA Rivera et al.118

during the study period. Further support for the mortality
findings is the morbidity information presented, which
shows high prevalences of diabetes, hypertension and
hypercholesterolaemia. Moreover, preliminary data of
diabetes mortality in 1999 confirms the high SMR found in
1998, suggesting that the sharp increase observed from
1997 to 1998 seems to be real. Our conclusion is that
important increases in SMR for the three causes studied
actually took place.
Epidemiological studies indicate that the three causes of
death are of multiple aetiologies and result from a variety
of risk factors. Heredity plays a role in all, but the three
causes of death share common risk factors such as obesity,
inadequate dietary intakes (high energy, fat, cholesterol
and carbohydrates intake) and physical inactivity.
Overweight and obesity increased dramatically during
the last decade by 78%. This increase is consistent with the
increases in mortality for the three causes considered, for
which obesity is a risk factor. Moreover, obesity rates
parallel mortality rates in the four regions studied. The
highest prevalences of overweight and obesity in 1984
were found in the North and in Mexico City, coincident
with the highest SMRs during the first half of the 1980s in
these regions. The changes in overweight and obesity in
women from 1980 to 1999 were larger for the South and
Centre, which is consistent with the largest increases in
SMR in the same regions. Comparisons of trends in obesity
and SMRs for the NCCDs suggest that overweight and
obesity are playing an important role in the aetiology of
these NCCDs in Mexico.
Energy intake in women did not increase between 1988
and 1999 as expected, given the increase in obesity. It is
well known that 24-hour recall, the technique employed in
both surveys, underestimates energy intake. The degree to
which energy intake is underestimated is influenced by
factors that changed between 1988 and 1999. For example,
we have documented that obese women tend to under-
estimate their intake to a greater extent than non-obese
women31. The larger proportion of obese women in 1999
relative to 1988 suggests a higher degree of under-
reporting in 1999. We suspected that more women
consumed food out of their homes in 1999 than in 1988.
It is well known that underreporting is higher when food is
consumed out of home. However, we found that food
expenditure away from home did not increase during the
study period. Despite the possible higher underestimation
of intakes in 1999, fat intake increased substantially during
the decade, both in absolute terms and relative to total
energy intake. This is an important finding, given the role
of fat intake as a risk factor for some NCCDs and obesity.
In addition to dietary intake data, we obtained
quantities of food purchased by food groups using
expenditure data from 1984 to 1998. The only quantities of
food groups that were higher for Mexico City and the
North in 1984 (at the time when SMRs for NCCDs and
obesity were clearly higher in these two regions) were
sugars and refined carbohydrates, which were 20–30%
above the quantities reported for the Centre and South.
Mexico City also reported higher quantities of meat,
poultry and eggs, which contain foods that are high in
saturated fatty acids and cholesterol; however, Mexico City
also reported the highest quantities of fruits, vegetables
and legumes, which include foods that are considered
protective for several NCCDs.
To explain the changes in SMRs for NCCDs and obesity
during the study period, the changes in quantities of food
purchased during the period were analysed. The only
food group with increased quantities purchased was sugar
and refined carbohydrates. Soda, a component of that
group, showed a substantial increase. However, compari-
sons among regions show similar or larger changes in
Mexico City and the North (the regions with the smallest
change in SMR and obesity) relative to those observed in
the Centre and South (the regions with the highest change
in SMR and obesity). Therefore, the findings do not
support attributing a role in explaining the changes in
obesity observed to sugar and refined carbohydrates. One
limitation of the food expenditure data used to construct
quantities purchased is that, although questions are asked
in the surveys to account for expenditures outside the
home, no questions directed at identifying the particular
foods purchased outside the home were made. Therefore,
the expenditure data clearly underestimate all food
consumed at work, at school or in the street. Results
using food expenditure data indicate that food expendi-
tures away from home not only did not increase from 1988
to 1998, but actually dropped. These results suggest that
energy and macronutrient intake out of the home did not
increase during the study period. Unfortunately, we do not
have information regarding the specific foods purchased
away from home. Although unlikely, it could be possible
that people spent less money but purchased larger
amounts of cheaper foods. Therefore, we cannot be
conclusive about the changes of energy and nutrient
intake away from home using only food expenditure data.
We conclude that food expenditure data do not explain
the increases in obesity observed during the period.
However, the increasing trends in the quantities of sugars
and refined carbohydrates purchased, and more particu-
larly the purchase quantities of soda, could be associated
with the increased mortality from NCCDs, and therefore
should be considered a sign of caution. It is recommended
that food policy and nutrition specialists should monitor
the trends closely.
Taken together, energy dietary intake of women and
quantities of food purchased per adult equivalent do not
seem to explain the changes observed in obesity.
However, higher fat dietary intakes may be partially
responsible for the increases in obesity and NCCDs.
One limitation of the study is that we do not have
reliable information about other lifestyle risk factors for
NCCDs. For example, reduced physical activity may be an
Epidemiological and nutritional transition in Mexico 119

Table 3 Quantities of food purchased (quantity index) from 1984 to 1998 for national level, by region and urban or rural location*
Region
Food group Year North Central Mexico City SouthMore than 15 000
inhabitantsLess than 15 000
inhabitants Total
Fruits, vegetables and legumes 1984 6.1 (1.0) 7.0 (1.0) 11.8 (1.0) 6.2 (1.0) 9.5 (1.0) 4.9 (1.0) 7.5 (1.0)1989 6.1 (1.0) 7.1 (1.0) 11.9 (1.0) 6.1 (1.0) 9.2 (1.0) 4.7 (1.0) 7.2 (1.0)1992 4.4 (0.7) 5.7 (0.8) 12.1 (1.0) 4.2 (0.7) 7.0 (0.7) 3.6 (0.7) 5.5 (0.7)1994 6.0 (1.0) 8.5 (1.2) 15.9 (1.3) 5.9 (1.0) 9.9 (1.0) 5.3 (1.1) 7.9 (1.1)1996 5.6 (0.9) 5.0 (0.7) 11.9 (1.0) 3.8 (0.6) 7.2 (0.8) 3.7 (0.8) 5.6 (0.7)1998 4.4 (0.7) 5.0 (0.7) 10.4 (0.9) 3.9 (0.6) 6.6 (0.7) 3.6 (0.7) 5.3 (0.7)
Meat, poultry and eggs 1984 3.9 (1.0) 4.9 (1.0) 7.5 (1.0) 3.8 (1.0) 6.1 (1.0) 2.5 (1.0) 4.8 (1.0)1989 4.5 (1.2) 4.5 (0.9) 6.9 (0.9) 4.1 (1.1) 5.8 (1.0) 2.6 (1.0) 4.7 (1.0)1992 2.9 (0.7) 3.6 (0.7) 6.4 (0.9) 2.8 (0.7) 4.3 (0.7) 2.0 (0.8) 3.4 (0.7)1994 4.3 (1.1) 5.2 (1.1) 9.6 (1.3) 3.8 (1.0) 6.7 (1.1) 2.8 (1.1) 4.9 (1.0)1996 4.3 (1.1) 3.3 (0.7) 7.9 (1.1) 3.1 (0.8) 5.4 (0.9) 2.6 (1.0) 4.1 (0.9)1998 3.6 (0.9) 3.1 (0.6) 7.1 (0.9) 3.4 (0.9) 4.8 (0.8) 2.5 (1.0) 3.9 (0.8)
Milk and dairy products 1984 12.9 (1.0) 14.6 (1.0) 12.8 (1.0) 11.3 (1.0) 14.9 (1.0) 8.7 (1.0) 13.1 (1.0)1989 12.7 (1.0) 14.2 (1.0) 11.1 (0.9) 11.1 (1.0) 13.6 (0.9) 10.6 (1.2) 12.8 (1.0)1992 9.3 (0.7) 10.0 (0.7) 11.9 (0.9) 6.5 (0.6) 10.0 (0.7) 7.2 (0.8) 9.3 (0.7)1994 12.5 (1.0) 14.7 (1.0) 17.8 (1.4) 9.6 (0.8) 15.4 (1.0) 9.0 (1.0) 13.4 (1.0)1996 12.7 (1.0) 10.6 (0.7) 13.8 (1.1) 6.8 (0.6) 12.7 (0.9) 6.5 (0.7) 10.9 (0.8)1998 10.1 (0.8) 9.6 (0.7) 12.5 (1.0) 6.7 (0.6) 10.9 (0.7) 6.9 (0.8) 9.6 (0.7)
Cereals† 1984 27.8 (1.0) 27.4 (1.0) 28.3 (1.0) 26.8 (1.0) 29.5 (1.0) 22.0 (1.0) 27.4 (1.0)1989 20.9 (0.8) 23.2 (0.8) 21.9 (0.8) 23.8 (0.9) 23.8 (0.8) 20.1 (0.9) 22.9 (0.8)1992 11.2 (0.4) 13.1 (0.5) 14.8 (0.5) 11.4 (0.4) 13.5 (0.5) 10.4 (0.5) 12.6 (0.5)1994 14.9 (0.5) 18.0 (0.7) 20.3 (0.7) 15.2 (0.6) 18.4 (0.6) 14.1 (0.6) 17.0 (0.6)1996 13.1 (0.5) 12.7 (0.5) 17.4 (0.6) 11.1 (0.4) 14.7 (0.5) 11.0 (0.5) 13.2 (0.5)1998 12.8 (0.5) 11.3 (0.4) 16.1 (0.6) 10.6 (0.4) 13.6 (0.5) 10.2 (0.5) 12.3 (0.4)
Fats and oils 1984 2.3 (1.0) 2.3 (1.0) 1.7 (1.0) 1.8 (1.0) 2.2 (1.0) 2.0 (1.0) 2.1 (1.0)1989 2.2 (1.0) 2.1 (0.9) 2.1 (1.2) 2.0 (1.1) 2.1 (1.0) 2.0 (1.0) 2.1 (1.0)1992 1.8 (0.8) 1.6 (0.7) 1.9 (1.1) 1.2 (0.7) 1.6 (0.7) 1.3 (0.7) 1.5 (0.7)1994 2.3 (1.0) 2.3 (1.0) 2.9 (1.7) 1.8 (1.0) 2.5 (1.1) 1.8 (0.9) 2.2 (1.0)1996 2.5 (1.1) 1.5 (0.7) 2.1 (1.2) 1.3 (0.7) 1.9 (0.9) 1.4 (0.7) 1.7 (0.8)1998 1.9 (0.8) 1.3 (0.6) 1.7 (1.0) 1.3 (0.7) 1.6 (0.7) 1.3 (0.7) 1.5 (0.7)
Sugars and refined carbohydrates‡ 1984 11.4 (1.0) 9.1 (1.0) 11.4 (1.0) 8.2 (1.0) 11.5 (1.0) 6.5 (1.0) 9.6 (1.0)1989 12.2 (1.1) 10.5 (1.2) 12.6 (1.1) 9.1 (1.1) 12.1 (1.1) 8.1 (1.2) 10.6 (1.1)1992 9.6 (0.8) 7.9 (0.9) 10.3 (0.9) 6.0 (0.7) 9.1 (0.8) 5.7 (0.9) 7.8 (0.8)1994 12.8 (1.1) 11.1 (1.2) 14.6 (1.3) 8.4 (1.0) 13.2 (1.1) 7.5 (1.2) 10.8 (1.1)1996 14.0 (1.2) 10.3 (1.1) 15.4 (1.4) 8.6 (1.0) 13.7 (1.2) 7.7 (1.2) 11.3 (1.2)1998 13.6 (1.2) 9.6 (1.1) 12.9 (1.1) 7.6 (0.9) 12.3 (1.1) 7.0 (1.1) 10.2 (1.1)
Tortilla† 1984 11.7 (1.0) 16.8 (1.0) 8.7 (1.0) 18.5 (1.0) 13.1 (1.0) 17.0 (1.0) 14.1 (1.0)1989 10.0 (0.9) 11.4 (0.7) 4.9 (0.6) 19.5 (1.1) 9.5 (0.7) 16.7 (1.0) 11.2 (0.8)1992 5.4 (0.5) 7.8 (0.5) 4.7 (0.5) 8.7 (0.5) 6.2 (0.5) 8.8 (0.5) 7.1 (0.5)1994 7.6 (0.6) 10.7 (0.6) 5.8 (0.7) 12.5 (0.7) 8.7 (0.7) 11.9 (0.7) 9.5 (0.7)1996 8.6 (0.7) 9.8 (0.6) 7.6 (0.9) 10.0 (0.5) 8.4 (0.6) 10.8 (0.6) 9.2 (0.7)1998 7.5 (0.6) 7.4 (0.4) 7.6 (0.9) 8.4 (0.5) 7.4 (0.6) 8.4 (0.5) 7.7 (0.5)
Soda‡ 1984 5.5 (1.0) 4.1 (1.0) 2.7 (1.0) 4.1 (1.0) 4.5 (1.0) 3.8 (1.0) 4.3 (1.0)1989 7.7 (1.4) 5.1 (1.2) 4.5 (1.7) 4.4 (1.1) 5.7 (1.3) 4.6 (1.2) 5.5 (1.3)1992 5.4 (1.0) 3.4 (0.8) 4.6 (1.7) 4.0 (1.0) 4.2 (0.9) 4.0 (1.1) 4.2 (1.0)1994 7.4 (1.3) 5.7 (1.4) 6.9 (2.6) 5.2 (1.3) 6.7 (1.5) 4.9 (1.3) 6.2 (1.4)1996 7.7 (1.4) 4.5 (1.1) 6.3 (2.3) 4.2 (1.0) 6.1 (1.4) 4.3 (1.1) 5.4 (1.3)1998 6.9 (1.3) 5.2 (1.3) 6.8 (2.5) 5.0 (1.2) 6.1 (1.4) 5.2 (1.4) 5.9 (1.4)
* Data obtained from the National Income and Expenditure Surveys 1984–1998; income and expenditure are expressed in US$, estimated with the average exchange rate of each year’s surveys. Income representsthe sum of monetary and non-monetary three-month normalised reported income.† Cereals include tortillas.‡ Sugars and refined carbohydrates include soda.
JARiv
era
eta
l.120
important factor that has not been considered in our
analysis. We suspect that physical activity has declined
over time in recent years, as a result of urbanisation,
increased availability of motorised transportation and
more sedentary occupations. Unfortunately, we do not
have information at this time to confirm our suspicions.
Neither have other risk factors, such as smoking, been
considered to explain the causes of death studied.
Finally, mortality from these diseases can be reduced
through adequate medical attention. Therefore, part of the
differences in mortality rates among regions in Mexico
may be due to differences in coverage and quality of
medical attention, which has not been considered in this
analysis.
Conclusions
SMRs due to diabetes, hypertension and AMI have
increased dramatically in parallel with an increase in
obesity. The association of overweight and obesity with
mortality rates among regions at baseline, as well as their
parallel evolution over time, suggests that overweight and
obesity are playing an important role in the increasing
trends observed in these three NCCDs. Overweight and
obesity should, therefore, be considered public health
problems and actions should be taken for their prevention
and control. We were unable to consistently relate the
changes in overweight, obesity or mortality from NCCDs
with the total energy intake or food quantities purchased
by adult equivalent. An increase in fat intake is evident
from the dietary intake data, suggesting that increases in
fat intake may explain the rise in overweight and obesity
as well as mortality. However, the results are not
supported by the changes in quantities of food purchased,
probably due to methodological problems; therefore, the
evidence is not conclusive. An increase in the purchase of
sugars and refined carbohydrates, particularly soda, is
worrisome and may be related to the increases in mortality
due to NCCDs. Other factors such as changes in physical
activity, which are not considered in the analysis, may
explain the increment in the prevalence of overweight and
obesity. Reliable information about food consumption and
physical activity is required in order to assess their specific
roles in the aetiology of obesity.
Acknowledgements
We would like to acknowledge Eric Monterrubio for his
help in the configuration of the income–expenditure
databases, Luis Vazquez Segovia for his assistance in the
analysis and interpretation of the food expenditure
databases, Drs. Steffano Bertotzi and Paul Gertler for
their advice in the adjustment and interpretation of food
expenditure data.
References
1 Chavez A, De Chavez M, Roldan A, Bermejo S, Avila A,Madrigal H. The Food and Nutrition Situation in Mexico: AFood Consumption, Nutritional Status and Applied Pro-grams Tendencies Report from 1960 to 1990, 1st ed. MexicoCity: Editorial Pax, Mexico, 1996.
2 Hernandez-Diaz S, Peterson K, Dixit S, Hernandez-Prado B,Parra S, Barquera S, Sepulveda J, Rivera J. Association ofmaternal short stature with stunting in Mexican children:common genes vs common environment. Eur. J. Clin. Nutr.1999; 53: 938–45.
3 Frenk J, Frejka T, Bobadilla JL, Stern C, Lozano M, SepulvedaJ, et al. The epidemiologic transition in Latin America [inSpanish]. Boletin de la Oficina Sanitaria Panamericana1991; 111(6): 485–96.
4 Omran AR. The epidemiologic transition. A theory of theepidemiology of population change. Milbank Mem. FundQuart. 1971; 49(4): 509–38.
5 Omran AR. The epidemiologic transition theory. Apreliminary update. J. Trop. Pediatr. 1983; 29: 305–16.
6 Bobadilla J, Frenk J, Lozano R, Frejka T, Stern C. Theepidemiologic transition and health priorities. In: Jamison D,ed. Disease Control Priorities in Developing Countries. NewYork: Oxford University Press, 1993.
7 Drewnowski A, Popkin BM. The nutrition transition: newtrends in the global diet. Nutr. Rev. 1997; 55(2): 31–43.
8 Pena M, Bacallao J. Obesity and poverty: an emergingproblem in the Americas. In: Pena MaBJ, ed. Obesity andPoverty: A New Public Health Challenge. PAHO ScientificPublication No. 576. Washington, DC: Pan American HealthOrganization, 2000; 132.
9 Barker DJ. The intrauterine environment and adultcardiovascular disease. Ciba Foundation Symp. 1991; 156:3–10.
10 Barker DJ. Fetal growth and adult disease. Br. J. Obstet.Gynaecol. 1992; 99(4): 275–6.
11 Barker DJ, Hales CN, Fall CH, Osmond C, Phipps K, ClarkPM. Type 2 (non-insulin-dependent) diabetes mellitus,hypertension and hyperlipidaemia (syndrome X): relationto reduced fetal growth. Diabetologia 1993; 36(1): 62–7.
12 Barker DJ, Martyn CN, Osmond C, Hales CN, Fall CH.Growth in utero and serum cholesterol concentrations inadult life. BMJ 1993; 307(6918): 1524–7.
13 Phillips DI, Hirst S, Clark PM, Hales CN, Osmond C. Fetalgrowth and insulin secretion in adult life. Diabetologia 1994;37(6): 592–6.
14 Anon. Urbanization and public health. WHO Chronicle 1967;21(10): 428–35.
15 Popkin BM. The nutrition transition in low-incomecountries: an emerging crisis. Nutr. Rev. 1994; 52(9): 285–98.
16 Pan American Health Organization (PAHO)/World HealthOrganization (WHO). International Classification of Dis-eases, Revision 9 (ICD-9). Washington, DC: PAHO/WHO,1978.
17 World Health Organization (WHO). International StatisticalClassification of Diseases and Related Health Problems, ICD-10. Geneva: WHO, 1992.
18 World Health Organization (WHO). World Health StatisticsAnnual. Geneva: WHO, 1999.
19 Sepulveda-Amor J, Lezana MA, Tapia-Conyer R, ValdespinoJL, Madrigal H, Kumate J. Nutritional status of pre-schoolchildren and women in Mexico: results of a probabilisticnational survey [in Spanish]. Gaceta Medica de Mexico 1990;126(3): 207–24.
20 Secretarıa de Salud, Direccion de Epidemiologıa. EncuestaNacional de Enfermedades Cronicas. Mexico DF: Secretarıade Salud, Direccion de Epidemiologıa, 1993.
21 World Health Organization (WHO). Obesity. Preventing and
Epidemiological and nutritional transition in Mexico 121

Managing the Global Epidemic. Report of a WHOConsultation on Obesity, June. Geneva: WHO, 1997.
22 National Center for Health Statistics (NCHS)/Centers forDisease Control (CDC). NCHS Growth Curves for Children,birth–18 y. Series 11, 165. DHEW Publication (PHS) 78 1650.Washington, DC: US Government Printing Office, 1978.
23 Food and Nutrition Board Commission of Life Sciences,National Research Council. Recommended Dietary Allow-ances, 10th ed. Washington, DC: Subcommittee on the 10thedition of the RDAs, 1989.
24 SPSS, Inc. SPSS for Windows, Release 10.0.0. Chicago, IL:SPSS Inc., 1999.
25 Rivera J, Long K, Gonzalez-Cossıo T, Parra S, Rivera M,Rosado J. Nutricion y Salud: Un Menu para la Familia.Cuadernos de Salud. Problemas Pretransicionales. Mexico:Secretarıa de Salud, 1994.
26 Instituto Nacional de Salud Publica (INSP). EncuestaNacional de Nutricion 1999. Tomo I. Ninos Menores de 5anos. Cuernavaca Morelos: INSP, 2000.
27 Rivera-Dommarco J, Shamah T, Villalpando-Hernandez S,
Gonzalez de Cossıo T, Hernandez-Prado B, Sepulveda J.Encuesta Nacional de Nutricion 1999. Estado Nutricio enNinos y Mujeres en Mexico. Cuernavaca Morelos: InstituoNacional de Salvd Publica, 2001.
28 Flores M, Melgar H, Cortes C, Rivera M, Rivera J, Sepulveda J.Consumo de energıa y nutrimentos en mujeres mexicanas enedad reproductiva. Salud Publica de Mexico 1998; 40:161–71.
29 Cuadernos de Salud. La Mortalidad en Mexico: Registro,Estructura y Tendencias, 1st ed. Mexico: Secretarıa de Salud,1994.
30 Secretarıa de Salud. Mortalidad 1998. Contexto Actual yAspectos Relevantes. Perfiles Estadısticos No. 13. Mexico:Direccion General de Estadıstica e Informatica, 1999.
31 Campirano F, Barquera S, Rivera J, Hernandez-Prado B,Flores-Lopez ML, Monterrubio E. Estimation of energyunder-reporting in obese and non-obese Mexican womenusing different equations: analysis of the Mexican NationalNutrition Survey. Ann. Nutr. Metab 2001; 45(Suppl. 1): 146.
JA Rivera et al.122