Non-communicable diseases among low income adults in ...
13
RESEARCH Open Access Non-communicable diseases among low income adults in rural coastal communities in Eastern Sabah, Malaysia Hazriani Harris † , Yasmin B. H. Ooi *† , Jau-Shya Lee and Patricia Matanjun Abstract Background: Rural coastal communities in Sabah are still overly represented in the hardcore poor economic status. The aim of this study was to determine the prevalence of hypertension, diabetes mellitus and hypercholesterolemia among adults, in relation to economic status. Methods: A cross-sectional study using stratified random sampling was conducted in seven coastal villages in Semporna, Sabah: Kabogan Laut, Salimbangun, Pekalangan, Pokas, Tampi-Tampi Timbayan, Sum Sum and Selinggit. Socio-demographic data were obtained via interviewer administered questionnaires in Sabah Malay creole. Anthropometric measurements, blood pressure, fasting blood glucose and blood lipids were obtained. Results: A total of 330 adults (133 males, 197 females) completed the study. Mean age was 43.7 ± 15.8 years. Most participants (87%) were living below the Poverty Line Income. Median per capita household income was RM83.33/ month (≈ USD20/month). The number of newly diagnosed cases of hypercholesterolemia was 40.6%, diabetes mellitus was 5.8%, and hypertension was 24.5%. Adults from the hardcore poor economic status (household income ≤RM760/ month (≈USD183/month) were the most represented in those who did not have a blood pressure, blood sugar and blood lipids check in the 12 months preceding the study (Χ 2 , p < 0.01). Adults from hardcore poor economic status were also the most represented in undiagnosed hypertension and uncontrolled blood pressure among those diagnosed (Χ 2 , p = 0.013). Among diabetics from the hardcore poor group, the undiagnosed fasting blood glucose was 11.2 ± 4.5 compared to 5.1 ± 0.6 mmol/L for diagnosed diabetics (p < 0.001). Among hypercholesterolemics from the hardcore poor group, total cholesterol and LDL cholesterol values were significantly higher in the undiagnosed group compared to the diagnosed group (p < 0.001). Conclusion: Many people in this rural coastal community were unaware that they had high cholesterol level (40.6%) and elevated blood pressure (24.5%). Routine health check is not common among low income adults in rural coastal communities in Semporna. The findings suggest public health initiatives should emphasize access to and the necessity of routine health checks for those aged 40 years. Keywords: Non-communicable diseases, Rural, Coastal © The Author(s). 2019 Open Access This article is distributed under the terms of the Creative Commons Attribution 4.0 International License (http://creativecommons.org/licenses/by/4.0/), which permits unrestricted use, distribution, and reproduction in any medium, provided you give appropriate credit to the original author(s) and the source, provide a link to the Creative Commons license, and indicate if changes were made. The Creative Commons Public Domain Dedication waiver (http://creativecommons.org/publicdomain/zero/1.0/) applies to the data made available in this article, unless otherwise stated. * Correspondence: [email protected] † Hazriani Harris and Yasmin B.H. Ooi are contributed equally to this work Faculty of Food Science and Nutrition, Universiti Malaysia Sabah, Jalan UMS, 88400 Kota Kinabalu, Sabah, Malaysia Harris et al. BMC Public Health 2019, 19(Suppl 4):554 https://doi.org/10.1186/s12889-019-6854-6
-
Upload
khangminh22 -
Category
Documents
-
view
0 -
download
0
Transcript of Non-communicable diseases among low income adults in ...

RESEARCH Open Access
Non-communicable diseases among lowincome adults in rural coastal communitiesin Eastern Sabah, MalaysiaHazriani Harris†, Yasmin B. H. Ooi*†, Jau-Shya Lee and Patricia Matanjun
Abstract
Background: Rural coastal communities in Sabah are still overly represented in the hardcore poor economic status.The aim of this study was to determine the prevalence of hypertension, diabetes mellitus and hypercholesterolemiaamong adults, in relation to economic status.
Methods: A cross-sectional study using stratified random sampling was conducted in seven coastal villages inSemporna, Sabah: Kabogan Laut, Salimbangun, Pekalangan, Pokas, Tampi-Tampi Timbayan, Sum Sum and Selinggit.Socio-demographic data were obtained via interviewer administered questionnaires in Sabah Malay creole.Anthropometric measurements, blood pressure, fasting blood glucose and blood lipids were obtained.
Results: A total of 330 adults (133 males, 197 females) completed the study. Mean age was 43.7 ± 15.8 years. Mostparticipants (87%) were living below the Poverty Line Income. Median per capita household income was RM83.33/month (≈ USD20/month). The number of newly diagnosed cases of hypercholesterolemia was 40.6%, diabetes mellituswas 5.8%, and hypertension was 24.5%. Adults from the hardcore poor economic status (household income ≤RM760/month (≈USD183/month) were the most represented in those who did not have a blood pressure, blood sugar andblood lipids check in the 12months preceding the study (Χ2, p < 0.01). Adults from hardcore poor economic status werealso the most represented in undiagnosed hypertension and uncontrolled blood pressure among those diagnosed (Χ2,p = 0.013). Among diabetics from the hardcore poor group, the undiagnosed fasting blood glucose was 11.2 ± 4.5compared to 5.1 ± 0.6mmol/L for diagnosed diabetics (p < 0.001). Among hypercholesterolemics from the hardcore poorgroup, total cholesterol and LDL cholesterol values were significantly higher in the undiagnosed group compared to thediagnosed group (p < 0.001).
Conclusion: Many people in this rural coastal community were unaware that they had high cholesterol level (40.6%) andelevated blood pressure (24.5%). Routine health check is not common among low income adults in rural coastalcommunities in Semporna. The findings suggest public health initiatives should emphasize access to and the necessityof routine health checks for those aged 40 years.
Keywords: Non-communicable diseases, Rural, Coastal
© The Author(s). 2019 Open Access This article is distributed under the terms of the Creative Commons Attribution 4.0International License (http://creativecommons.org/licenses/by/4.0/), which permits unrestricted use, distribution, andreproduction in any medium, provided you give appropriate credit to the original author(s) and the source, provide a link tothe Creative Commons license, and indicate if changes were made. The Creative Commons Public Domain Dedication waiver(http://creativecommons.org/publicdomain/zero/1.0/) applies to the data made available in this article, unless otherwise stated.
* Correspondence: [email protected]†Hazriani Harris and Yasmin B.H. Ooi are contributed equally to this workFaculty of Food Science and Nutrition, Universiti Malaysia Sabah, Jalan UMS,88400 Kota Kinabalu, Sabah, Malaysia
Harris et al. BMC Public Health 2019, 19(Suppl 4):554https://doi.org/10.1186/s12889-019-6854-6

BackgroundThe current body of research into rural health in Malaysiashowed 41.3% of indigenous adults in Sabah [1], 33.6% ofadults in rural Kedah [2], and 29.8% of adults in ruralPenang [3] had hypertension. The nationally representativeNational Health and Morbidity Survey 2015 showed overallhypertension among adults aged 18 years and older was33.5% (95%CI: 31.6–35.4) in rural areas compared to 29.3%in urban areas (95%CI: 28.2–30.4). At the national level,prevalence was higher in males (30.7, 95%CI: 29.5–32.2)compared to females (29.7% (95%CI: 28.5–30.9) [4]. TheREDISCOVER study investigated hypertension in urbanand rural Malaysian communities from 2007 to 2011. Italso reported that rural communities had higher prevalenceof hypertension (51.2, 95%CI: 49.8–52.4) compared tourban communities (44.9, 95%CI: 43.6–46.2) [5]. In Sabah,the prevalence was reported as 26.8% (95% CI: 23.8–30.0),but the prevalence of undiagnosed hypertension was 13.9%(95% CI: 11.8–16.3) [4]. Nationally representative studiesreported that the prevalence of hypertension in Sabah hadbeen 29.1% (95% CI: 26.3–32.0) from NHMS 2011 and29.9% (95%CI: 28.2–31.6) from NHMS 2006 [6]. For thesame reporting period, the country prevalence were 32.7%(95% CI: 31.6–33.7) from NHMS 2011 [7] and 32.2% (95%CI: 31.6–32.8) from NHMS 2006 [8]. The trend was thatprevalence of hypertension in the state of Sabah decreasedfrom 2006 to 2015 and had been consistently lower thanthe country prevalence. At the national level, the prevalenceof overall and undiagnosed hypertension were higher inlower income groups [4].The NHMS 2015 reported that the prevalence of hyper-
cholesterolemia was 47.7% in both rural and urban areas inthe country. In Sabah, the prevalence was 40.9% (95%CI:36.9–45.0), and the prevalence of undiagnosed hypercholes-terolemia in the state was 32.6% (95%CI: 28.7–36.8) [4].This was an increase from 31.1% (95%CI: 27.9–34.5) inSabah from the NHMS 2011. The country wide prevalencefrom the NHMS 2011 was 32.7% (95%CI: 31.6–33.7) [7].There was no available data from the NHMS 2006 andNHMS 1996 for the prevalence of hypercholesterolemia inSabah [6]. Sabah had lower prevalence of hypercholesterol-emia since nationally representative data were collected. Be-tween NHMS 2011 and NHMS 2015, there was an increasein prevalence of hypercholesterolemia in Sabah. At the na-tional level, the prevalence of overall and undiagnosedhypercholesterolemia were about the same in all incomegroups. In relation to gender, the prevalence were found tobe significantly higher among females (52.2, 95% CI: 50.7–53.7) compared to males (43.5, 95% CI: 42.0–45.1) [4].There was an increasing trend for all NCD risk factors.NHMS 2011 showed that at least 63% of adult Malaysiansaged ≥18 years had at least one NCD risk factor, whichwere either overweight/obesity, high blood pressure, highblood sugar and high cholesterol [4].
The NHMS 2015 also reported that the prevalence ofdiabetes mellitus type II in rural Malaysia was 16.7%(95%CI: 15.4–18.1) compared to 17.7% (95%CI: 16.7–18.8)in urban areas. In Sabah, the prevalence was 14.2%(95%CI: 12.2–16.4), and the prevalence of undiagnoseddiabetes in the state was 8.3% (95%CI: 6.7–10.3) [4]. Overthe period of available nationally representative data, theprevalence of diabetes mellitus in Malaysia had been in-creasing: 15.2% (95% CI: 14.3–16.1) in NHMS 2011 [7],14.9% for adults aged ≥30 years in NHMS 2006 and 8.3%adults aged ≥30 years in NHMS 1996 [9]. For the corre-sponding period, the prevalence in Sabah from availabledata were 9% (95% CI: 7.2–11.3) in NHMS 2011 and 4.9%in NHMS 2006 [6]. Sabah had lower prevalence of dia-betes mellitus compared to the national prevalence, butthere was an increase in prevalence from 2006 to 2015. Atthe national level, the prevalence of overall and undiag-nosed diabetes were higher in lower income groups [4].The most recent NHMS 2015 showed that prevalence ofdiabetes was higher in females (18.3, 95%CI 17.2–19.4)compared to males (16.7, 95%CI: 15.7–17.8): [4].Nationally representative data showed that the prevalence
of non-communicable diseases (NCDs) have continued torise for the last two decades in Malaysia. In response tothat, the Ministry of Health implemented the National Stra-tegic Plan for Non-Communicable Diseases (NSP-NCD)2010–2014 and the NCD Prevention 1 Malaysia (NCDP-1M) programmes. Through the NCDP-1M, the governmenthealth services took the approach of engaging the commu-nity as a partner in prevention and promotion, such asNCD risk factor screening and intervention in the commu-nity, workplace and schools [10, 11]. The NCDP-1M wasproject based and focused on NCD risk factors. Each statedetermined its own NCDP-1M project decisions. The limi-tations were that the quality of the projects and implemen-tations were inconsistent, inadequate human resources andincreased burden to existing services [10]. In comparison,China as a middle income country which also has anincreasing NCD prevalence and burden like Malaysia,focused on comprehensive interventions in high-risk popu-lation. Like Malaysia’s NCDP-1M programme, China en-couraged its local governments to develop their ownstrategies and measures. In contrast, Japan as a high incomecountry has a stable NCD prevalence. Its main strategy forNCDs control is primary prevention, with a universalNCDs prevention programme for all adults aged 40–74years [12]. Japanese on low income had better access to theuniversal health care system in Japan compared to theirChinese counterparts in China. The social health in-surance system in China did not prioritise outpatientcosts, which would have been the most needed ser-vice for NCD patients [12]. It is important for gov-ernments to have adequate budget for prevention andpromotion activities via effective channels.
Harris et al. BMC Public Health 2019, 19(Suppl 4):554 Page 2 of 13

Data for the state of Sabah might not give a represen-tative idea on the health status of a rural coastal com-munity such as Semporna. Semporna’s most dominantethnic group is the Bajau, which constitutes 57% of thepopulation in that district [13]. They mostly speak theSabah Malay creole and Bajau. The Bajaus consist of in-dividuals who hold Malaysian citizenship and those whodo not. The former are also known as the Bajau Tempa-tan (‘emplaced Bajau’) and the latter are known as theBajau Laut. The two groups are also labelled withinSabah as simply the ‘Bajau’. The Malaysian census re-ported that Semporna had a population of 133,164 com-prising of Malaysian citizens and non-citizens [13].Individuals who hold Malaysian citizenship have oftenoriented themselves to terrestrial livelihoods whilstmaintaining some orientation to the marine based liveli-hoods, for example seaweed cultivation and fishing [14].These groups are also more sedenterised than the BajauLauts who continue to ply the seas in their houseboats.Many parts of Sabah, East Malaysia are considered rural
and low income in terms of development. Populationshere face significant health and nutritional challengesoften observed in low-income situations. Rural health isoften approached as challenges and strategies within thecontext of inaccessible interior regions [15] and less oftenwithin the context of coastal regions far from urban areas.However, Sabah being about half the size of PeninsularMalaysia, has challenges in health access for populationsin interior regions as well as its vast coastal regions andinhabited islands. Verbal communication among healthprofessionals indicated that non-communicable diseasesin coastal regions in Sabah are largely undiagnosed, butthere is no published evidence. We sought to fill this gapby conducting a cross-sectional study in Semporna, Sabah.Semporna is on the southeast of Sabah, facing theSulawesi Sea. A similar gap in absence of NCD prevalencedata for the island and coastal areas in China also pre-sented challenges in confirming the authenticity of theirpublished statistics [16]. Elucidation of NCD prevalenceand observation of socio-economic situations in diagnosedand undiagnosed individuals will support more effectivepublic health strategies.
MethodsStudy design and samplingThis cross-sectional study was carried out in seven coastalvillages on the Semporna mainland. All heads of coastal vil-lages on the Semporna mainland that were deemed safe tovisit by a local informant were visited and briefed about thestudy. Many areas were not accessible during the field workperiod because of recent armed incursions by foreignersand the resultant military operations by the MalaysianArmed Forces [17]. The local social dynamics were suchthat potential researchers and respondents should obtain
the approval of village heads before commencement ofstudies. The village heads who agreed to participateprovided information about number of households in theirvillage. Based on the information gathered, invitation flierswere distributed by hand to each household (n = 355). Thevillages that agreed to participate were Kabogan Laut, Sal-imbangun, Pekalangan, Pokas, Tampi-Tampi Timbayan,Sum Sum and Selinggit. The inclusion criteria were thatpotential respondents aged ≥19 years were able to commu-nicate in Malay or Sabah Malay creole, without mental ill-ness and physical disability, were not pregnant or lactating.Sample size was calculated as n = Z2P(1-P)/d2, where
p = 0.291 based on the prevalence of hypertension of29.1% for adults aged ≥18 years in Sabah [7]. Published na-tional data only showed prevalence by states in the feder-ation of Malaysia. Discussions with the district nutritionistindicated that hypertension and diabetes were prevalentamong adults in Semporna. As the prevalence for diabetesin Sabah was 9.0% [7], the sample size was calculatedusing the prevalence of hypertension to generate a largersample size. At 95% level of confidence and 5% precision,therefore n = 1.962 X 0.291 (1–0.291)/0.052, a sample sizeof 317 adults were calculated. Stratified random samplingmethod was employed to recruit the respondents. Therewere an estimate of 1420 adults aged ≥19 years in theseven villages. The population was stratified according toage group: adults aged 19–59 years and elderly aged ≥60years to ensure we had respondents from the older adults.Respondents were recruited randomly from each stratum.Fliers were distributed throughout daylight hours everydayuntil all houses in all participating villages were visited.When nobody was at home, the household was visitedagain so that fliers could be handed in person and studyinformation could be provided face to face and invitationto participate could be conveyed. Randomness wasachieved as every household had equal chances of beingvisited at any daylight hour, and any potential respondentcould be home at that the time of the visit. A maximumof one adult and one elderly person from each householdwithin the inclusion criteria could freely participate as re-spondents. A total of 330 individuals (284 (86.1%) individ-uals aged 19–59 years; 46 (13.9%) individuals aged ≥60years) completed the study procedures. Ethics approvalwas obtained from the Medical Research Ethics Commit-tee, Faculty of Medicine and Health Sciences, UniversitiMalaysia Sabah. The approval code is JKEtika 3/14(3).Preliminary groundwork to seek permissions at the studylocation was conducted from December 2014 to January2015. All respondents were interviewed and biologicalsamples were collected from February to May 2015.
Study proceduresWritten informed consent was obtained from each respond-ent before they began their participation. Socio-demography
Harris et al. BMC Public Health 2019, 19(Suppl 4):554 Page 3 of 13

and medical history data were obtained using interviewer-administered questionnaires. One researcher interviewed allrespondents in their respective households. The socio-demographic data recorded were gender, age, ethnic group,religious affiliation, educational level, marital status, occupa-tion, household income, household size and cigarette/to-bacco smoking status. Medical history data were obtainedusing an adapted questionnaire [7]. Respondents were askedregarding family history and whether they had attended ahealth check in the past 12months or diagnosed with hyper-tension, hypercholesterolemia and/or diabetes mellitus.Respondents were then given weekend appointments from8 to 11 a.m. at the village hall for anthropometric and bloodpressure measurements and biological sampling. Body massindex (BMI), body fat, waist circumference, blood pressure,and fasting venous blood sample were obtained during thisappointment. Venous blood samples were collected by aqualified health professional to determine fasting blood glu-cose, HDL-cholesterol, LDL-cholesterol, total cholesteroland triglycerides. Respondents were reminded to fast over-night for at least 8 h prior to blood sample collection. Plainwater consumption was not restricted throughout thatperiod. Respondents were asked to confirm their fasting sta-tus before a blood sample was taken. If they had not fastedor were feeling unwell, they were given another appointmentfor the following weekend. All blood samples were analysedin the accredited BP Diagnostic Centre, Kota Kinabalu,Sabah, Malaysia using ARCHITECT c800 Clinical Chemis-try Analyser. All respondents were informed in writing oftheir anthropometric, blood pressure and blood samplingresults. When diagnosed as hypertensive, hypercholesterol-emic and/or diabetic, they were informed to seek a physi-cian’s attention with their results.
Socio-demographyRespondents were asked to state their ethnic group and re-ligious affiliations. Educational levels were classified intofive categories as ‘no formal education’, ‘primary’, ‘lower sec-ondary’, ‘upper secondary’, ‘foundation, matriculation, highschool certificate, diploma or equivalent’, and ‘undergradu-ate degree’. Marital status was classified into four categoriesas ‘single’, ‘married’, ‘divorced or separated’, and ‘widow/wid-ower’. Occupation was classified into four categories as‘not working or unemployed’, ‘home maker’, ‘self-employed’and ‘public or private employee’. Cigarette smoking statuswas classified into three categories as ‘do not smoke’, ‘havesmoked in the past’ and ‘smoking’. The former two categor-ies were merged as ‘non- or ex-smoker’ in data analysis.Household income was classified into three categories
as ‘hardcore poor, with a household income of ≤RM760/month’, ‘poor, with a household income of RM761 –1,180/month’ and ‘above rural Poverty Line Income’.The hardcore poor cut-off of ≤RM760/month and Pov-erty Line Income of RM1,180/month for households in
rural Sabah were obtained from the Economic PlanningUnit, a Malaysian government agency, and based on mon-itoring data from January to December 2014 [18]. ThePoverty Line Income (PLI) was calculated based on theminimum requirements for basic food and non-food itemsof every individual in a household. The basic food itemswere based on the Recommended Nutrient Intake andphysical activity level. The non-food items were based onclothing, shoes, accommodation, fuel, utilities, basichousehold furniture and appliances, transportation andcommunication as identified by the Household Expend-iture Surveys. Hardcore poverty was defined as incomethat is less than the cost of the basic food items [18].
Anthropometric measurementsThe anthropometric measurements were conducted basedon standard procedures. Height was measured to the near-est 0.1 cm using SECA Portable Stadiometer 213. Weightwas measured to the nearest 0.1 kg and body fat was givenas percentage of body fat using OMRON Karada ScanBody Composition Monitor HBF-375. Respondents weremeasured in light clothing without shoes. BMI was calcu-lated as kg/m2, and the WHO (2004) cut-offs were used:underweight (< 18.5 kg/m2), normal (18.5–22.9), over-weight/pre-obese (23.0–27.4), obese I (27.5–34.9), obese II(35.0–39.9) and obese III (≥40.0) [19].Percent body fat cut-offs used were: ‘low body fat’ [(20–
39 years: < 13% for men and < 25% for women), (40–59years: < 13% for men and < 25% for women) and (60–79years: < 14% for men and < 25% for women)], ‘normal bodyfat’ [(20–39 years: 13–22% for men and 25–34% forwomen), (40–59 years: 13–23% for men and 25–34% forwomen) and (60–79 years: 14–23% for men and 25–35%for women)], ‘moderate body fat’ [(20–39 years: 23–27%for men and 35–39% for women), (40–59 years: 24–28%for men and 35–40% for women) and (60–79 years: 24–28% for men and 36–40% for women)] and ‘high body fat[(20–39 years: ≥28% for men and ≥ 40% for women), (40–59 years: ≥29% for men and ≥ 41% for women) and (60–79 years: ≥29% for men and ≥ 41% for women)] [20].Waist circumference was measured to the nearest 0.1
cm using SECA Measuring Tape 201 to determine ab-dominal obesity. The cut-offs were: ‘normal waist cir-cumference’ (< 90 cm for men and < 80 cm for women)and ‘positive abdominal obesity’ (≥90 cm for men and ≥80 cm for women) [21].
Blood pressure measurementsBlood pressure was measured using OMRON AutomaticBlood Pressure Monitor SEM-1. Respondents were mea-sured in a rested and seated condition at their villagehall. At least two measurements were performed at fiveminutes apart on respondents’ right arm rested on atable at heart level. If the two systolic and diastolic
Harris et al. BMC Public Health 2019, 19(Suppl 4):554 Page 4 of 13
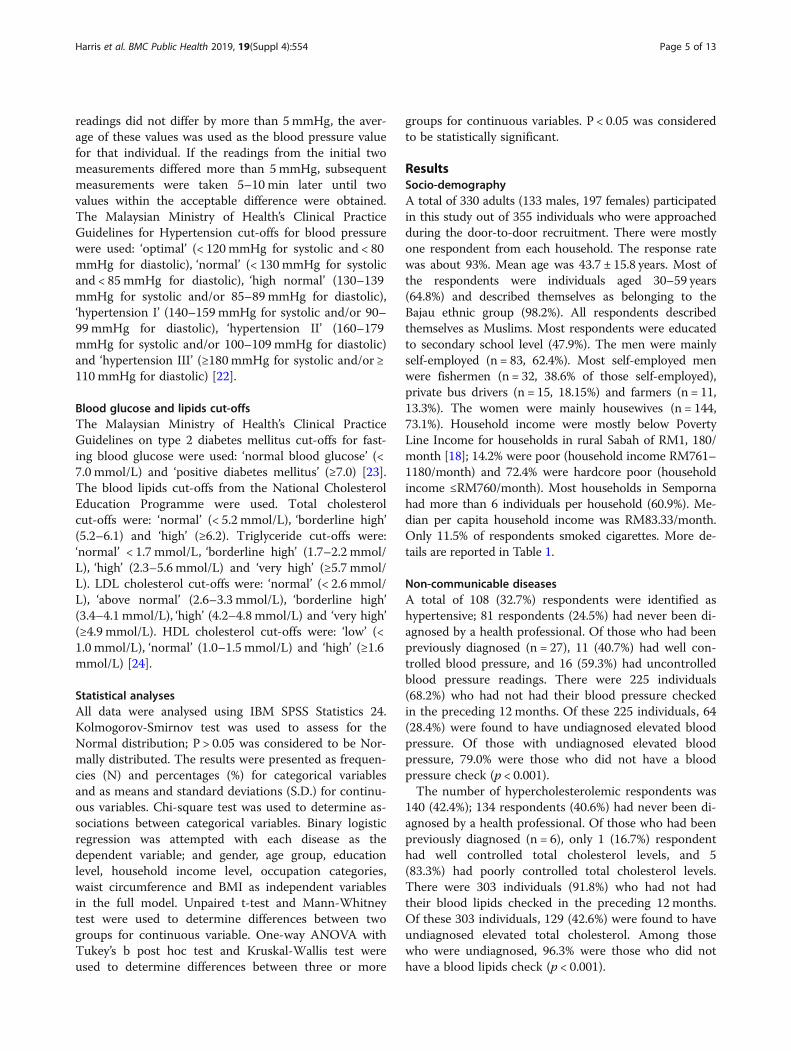
readings did not differ by more than 5mmHg, the aver-age of these values was used as the blood pressure valuefor that individual. If the readings from the initial twomeasurements differed more than 5mmHg, subsequentmeasurements were taken 5–10 min later until twovalues within the acceptable difference were obtained.The Malaysian Ministry of Health’s Clinical PracticeGuidelines for Hypertension cut-offs for blood pressurewere used: ‘optimal’ (< 120 mmHg for systolic and < 80mmHg for diastolic), ‘normal’ (< 130 mmHg for systolicand < 85 mmHg for diastolic), ‘high normal’ (130–139mmHg for systolic and/or 85–89mmHg for diastolic),‘hypertension I’ (140–159 mmHg for systolic and/or 90–99mmHg for diastolic), ‘hypertension II’ (160–179mmHg for systolic and/or 100–109 mmHg for diastolic)and ‘hypertension III’ (≥180mmHg for systolic and/or ≥110 mmHg for diastolic) [22].
Blood glucose and lipids cut-offsThe Malaysian Ministry of Health’s Clinical PracticeGuidelines on type 2 diabetes mellitus cut-offs for fast-ing blood glucose were used: ‘normal blood glucose’ (<7.0 mmol/L) and ‘positive diabetes mellitus’ (≥7.0) [23].The blood lipids cut-offs from the National CholesterolEducation Programme were used. Total cholesterolcut-offs were: ‘normal’ (< 5.2 mmol/L), ‘borderline high’(5.2–6.1) and ‘high’ (≥6.2). Triglyceride cut-offs were:‘normal’ < 1.7 mmol/L, ‘borderline high’ (1.7–2.2 mmol/L), ‘high’ (2.3–5.6 mmol/L) and ‘very high’ (≥5.7 mmol/L). LDL cholesterol cut-offs were: ‘normal’ (< 2.6 mmol/L), ‘above normal’ (2.6–3.3 mmol/L), ‘borderline high’(3.4–4.1 mmol/L), ‘high’ (4.2–4.8 mmol/L) and ‘very high’(≥4.9 mmol/L). HDL cholesterol cut-offs were: ‘low’ (<1.0 mmol/L), ‘normal’ (1.0–1.5 mmol/L) and ‘high’ (≥1.6mmol/L) [24].
Statistical analysesAll data were analysed using IBM SPSS Statistics 24.Kolmogorov-Smirnov test was used to assess for theNormal distribution; P > 0.05 was considered to be Nor-mally distributed. The results were presented as frequen-cies (N) and percentages (%) for categorical variablesand as means and standard deviations (S.D.) for continu-ous variables. Chi-square test was used to determine as-sociations between categorical variables. Binary logisticregression was attempted with each disease as thedependent variable; and gender, age group, educationlevel, household income level, occupation categories,waist circumference and BMI as independent variablesin the full model. Unpaired t-test and Mann-Whitneytest were used to determine differences between twogroups for continuous variable. One-way ANOVA withTukey’s b post hoc test and Kruskal-Wallis test wereused to determine differences between three or more
groups for continuous variables. P < 0.05 was consideredto be statistically significant.
ResultsSocio-demographyA total of 330 adults (133 males, 197 females) participatedin this study out of 355 individuals who were approachedduring the door-to-door recruitment. There were mostlyone respondent from each household. The response ratewas about 93%. Mean age was 43.7 ± 15.8 years. Most ofthe respondents were individuals aged 30–59 years(64.8%) and described themselves as belonging to theBajau ethnic group (98.2%). All respondents describedthemselves as Muslims. Most respondents were educatedto secondary school level (47.9%). The men were mainlyself-employed (n = 83, 62.4%). Most self-employed menwere fishermen (n = 32, 38.6% of those self-employed),private bus drivers (n = 15, 18.15%) and farmers (n = 11,13.3%). The women were mainly housewives (n = 144,73.1%). Household income were mostly below PovertyLine Income for households in rural Sabah of RM1, 180/month [18]; 14.2% were poor (household income RM761–1180/month) and 72.4% were hardcore poor (householdincome ≤RM760/month). Most households in Sempornahad more than 6 individuals per household (60.9%). Me-dian per capita household income was RM83.33/month.Only 11.5% of respondents smoked cigarettes. More de-tails are reported in Table 1.
Non-communicable diseasesA total of 108 (32.7%) respondents were identified ashypertensive; 81 respondents (24.5%) had never been di-agnosed by a health professional. Of those who had beenpreviously diagnosed (n = 27), 11 (40.7%) had well con-trolled blood pressure, and 16 (59.3%) had uncontrolledblood pressure readings. There were 225 individuals(68.2%) who had not had their blood pressure checkedin the preceding 12 months. Of these 225 individuals, 64(28.4%) were found to have undiagnosed elevated bloodpressure. Of those with undiagnosed elevated bloodpressure, 79.0% were those who did not have a bloodpressure check (p < 0.001).The number of hypercholesterolemic respondents was
140 (42.4%); 134 respondents (40.6%) had never been di-agnosed by a health professional. Of those who had beenpreviously diagnosed (n = 6), only 1 (16.7%) respondenthad well controlled total cholesterol levels, and 5(83.3%) had poorly controlled total cholesterol levels.There were 303 individuals (91.8%) who had not hadtheir blood lipids checked in the preceding 12months.Of these 303 individuals, 129 (42.6%) were found to haveundiagnosed elevated total cholesterol. Among thosewho were undiagnosed, 96.3% were those who did nothave a blood lipids check (p < 0.001).
Harris et al. BMC Public Health 2019, 19(Suppl 4):554 Page 5 of 13

A total of 24 respondents (7.3%) were identified as dia-betic; 19 respondents (5.8%) had never been diagnosed bya health professional. Of those who had been previously
diagnosed (n = 5), 3 (60%) respondents had well controlledfasting blood glucose and 2 had poorly controlled levels(40%). There were 287 individuals (87.0%) who had not
Table 1 Socio-demographic characteristics of respondents
Characteristics Sex, N (column %) All (n = 330)
Men (n = 133) Women (n = 197)
N (%) N (%) N (%)
Age group (years) 43.0 ± 16.4a 44.1 ± 15.4a 43.7 ± 15.8a
19–29 32 (24.1) 38 (19.3) 70 (21.3)
30–59 80 (60.2) 134 (68.0) 214 (64.8)
≥ 60 21 (15.8) 25 (12.7) 46 (13.9)
Ethnic group
Bajau 131 (98.5) 193 (98.0) 324 (98.2)
Bugis 0 (0.0) 2 (1.0) 2 (0.6)
Jawa 1 (0.8) 0 (0.0) 1 (0.3)
Suluk 1 (0.8) 1 (0.5) 2 (0.6)
Sungai 0 (0.0) 1 (0.5) 1 (0.3)
Religion
Islam 133 (100.0) 197 (100.0) 330 (100.0)
Educational level
No formal education 20 (15.0) 63 (32.0) 83 (25.2)
Primary school 26 (19.5) 39 (19.8) 65 (19.7)
Secondary school 75 (56.4) 83 (42.1) 158 (47.9)
High school certificate / Diploma 7 (5.3) 9 (4.6) 16 (4.8)
Bachelor’s degree 5 (3.8) 3 (1.5) 8 (2.4)
Marital status
Single 39 (29.3) 38 (19.3) 77 (23.3)
Married 88 (66.2) 128 (65.0) 216 (65.5)
Divorced/Separated 0 (0.0) 2 (1.0) 2 (0.6)
Widow/Widower 6 (4.5) 29 (14.7) 35 (10.6)
Occupation
Unemployed 32 (24.1) 31 (15.7) 63 (19.1)
Housewife 0 (0.0) 144 (73.1) 144 (43.6)
Self-employed 83 (62.4) 19 (9.6) 102 (30.9)
Employed 18 (13.5) 3 (1.5) 21 (6.4)
Household income (RM/month) 750.0 ± 713.0a 618.8 ± 443.6a 671.7 ± 569.9a
Hardcore poor 97 (72.9) 142 (72.1) 239 (72.4)
Poor 15 (11.3) 32 (16.2) 47 (14.2)
Above PLI 21 (15.8) 23 (11.7) 44 (13.3)
Household size (Number of individuals) 6.4 ± 3.1a 6.8 ± 3.2a 6.7 ± 3.2a
1–5 59 (44.4) 70 (35.5) 129 (39.1)
≥ 6 74 (55.6) 127 (64.5) 201 (60.9)
Smoking status
Smoker 31 (23.3) 7 (3.6) 38 (11.5)
Non/Ex-smoker 102 (76.7) 190 (96.4) 292 (88.5)a Values are in mean ± S.D.
Harris et al. BMC Public Health 2019, 19(Suppl 4):554 Page 6 of 13

had their blood glucose checked in the preceding 12months. Of these 287 individuals, 17 (5.9%) were found tohave undiagnosed elevated fasting blood glucose. Amongthose who were undiagnosed, 89.5% were those who didnot have a blood glucose check (p < 0.001).As expected, older individuals were more represented
among those with hypertension, hypercholesterolemiaand diabetes mellitus (p = 0.001). For hypertension, theOR for respondents aged 30 – 59y was 0.34 (95% CI:0.14–0.79, p = 0.012) compared to respondents aged≥60y. The ≥60y age group had the highest number of in-dividuals with hypertension. For diabetes mellitus, theOR for respondents aged 30 – 59y was 0.21 (95% CI:0.06–0.75, p = 0.016) compared to respondents aged≥60y. The 30 – 59y age group had the highest numberof individuals with diabetes mellitus and hypercholester-olemia. More details are shown in Tables 2 and 3.Adults with lower educational levels were more repre-
sented among those with hypertension and hypercholester-olemia (p < 0.001) (Table 2). For hypertension, the OR forrespondents with no formal education was 40.1 (95% CI:2.77–581.52, p = 0.007) compared to respondents with anundergraduate degree level of education. The OR for hyper-tension decreased as education level increased (Table 3).Adults form hardcore poor households were the most
represented in those who did not have a blood pressure,blood sugar and blood lipids check in the 12monthspreceding this present study (p < 0.01). More details arereported in Table 4. Individuals living in hardcore poorhouseholds who had not been previously diagnosed withNCDs also had significantly higher systolic blood pres-sure, total cholesterol, LDL-cholesterol and fasting bloodglucose compared to individuals in similar economicsituation who were without the NCD or had been diag-nosed with it (p < 0.001). Fasting blood glucose was sig-nificantly higher in non-diabetic individuals living inhardcore poor households compared to non-diabetic in-dividuals in poor and above PLI households (p = 0.006).More details are reported in Table 5. Respondents whowere obese, had very high body fat percentage and posi-tive abdominal obesity were significantly representedamong those who had hypertension, hypercholesterol-emia and diabetes mellitus (p < 0.001). More details arereported in Table 6.
DiscussionHypercholesterolemia (42.4%) was the most prevalentNCD, followed by hypertension (32.7%) and diabetesmellitus (7.3%) in Semporna, Sabah. These are com-parable to the national prevalence in rural areas of47.7% for hypercholesterolemia and 33.5% for hyper-tension [4]. The prevalence for diabetes mellitus inSemporna was half of the national prevalence in ruralareas of 16.7% for diabetes [4]. The Sabah state’s
prevalence for hypercholesterolemia was 40.9%, hyper-tension was 26.8% and diabetes mellitus was 14.2%[4]. The prevalence for diabetes was lower in Sem-porna despite 202 (61.2%) of respondents were foundto have abdominal obesity. In comparison, the preva-lence of abdominal obesity was 46.4% for the state ofSabah, 48.6% for the country, and 46.2% for ruralareas throughout the country [4]. These differencescould be attributable to differences in genetics andfood intake. It has been demonstrated that indigenousSarawakians in the northwestern part of Borneo is-land, had higher adjusted prevalence ratios for meta-bolic syndrome compared to ethnic Malays andChinese in Malaysia [25]. The staple food of theBajau Lauts, a marine nomadic group, was tapioca,rice and fish [26]. The settled Bajau shared similarfood culture with the Bajau Lauts. The Bajau Lautshad recently been shown to have genetic variants inthe PDE10A gene which resulted in increased spleensizes [27]. The spleen might have a physiological rolein diabetes mellitus as demonstrated by splenecto-mised patients who had significantly higher mean glu-cose level (114 mg/dL) than in the control group (90mg/dL) (p = 0.04) [28]. These findings showed thatthe coastal communities in Sabah were not similar toMalaysians from other regions and of other ethnicgroups in terms of risk factors of NCDs.It is important to note that the prevalence of hyperten-
sion in this rural coastal community was higher than theSabah state wide prevalence. A similar trend in preva-lence of hypertension was noted among adults fromcoastal areas and islands in China in the 2000s. The esti-mated prevalence in Chinese coastal areas was 29.1%(95%CI:24.8–33.9) and in island regions was 33.9%(955%CI: 29.4–38.8) compared to China’s pooled, ad-justed national prevalence of 20.3% (95%CI:14.1–28.4)[16]. Several studies on hypertension among rural adultsin Peninsular Malaysia (also known as West Malaysia)reported comparable prevalence of 26.8–33.6% [2, 3, 29].The only reported study conducted in three islandswithin marine park areas in Peninsular Malaysia re-ported very much lower rates of hypertension (10.7%)and diabetes (0.7%) [30]. In 1985, prevalence of hyper-tension in rural areas of developing island nations likeVanuatu was lower than that of urban areas. It was 1.1%for rural men and 2.6% for rural women compared to6.0% for urban men and 4.2% in urban women inVanuatu [31]. By 2007, 19.7% of households on a ruralisland in Vanuatu were reporting that they had familymembers with hypertension or cardiovascular diseasescompared to 45.1% in an urban area [32]. Increasingsedentary activities and changes in economic activitiesseemed to increase prevalence levels in rural islands andrural coastal areas to urban prevalence levels in
Harris et al. BMC Public Health 2019, 19(Suppl 4):554 Page 7 of 13

developing countries such as the South Pacific islandcountries [32] and China [33].The occurrence of these three NCDs increased signifi-
cantly with increasing age, BMI, percent body fat andwaist circumference (p < 0.05). Other studies in Malaysiaalso reported similar observations [2, 3, 29, 34]. As waistcircumference increased, the OR for hypertension (OR =
1.09, 95%CI: 1.04–1.14, p < 0.001) and for diabetes (OR =1.07, 95%CI: 1.00–1.15, p = 0.044) increased (Table 3).In Asian populations, waist circumference might be amore appropriate indicator of obesity and insulin resist-ance [35]. Obesity had increased in Asian populationswith the gap between rural and urban communities nar-rowing. In a longitudinal study on Filipino women,
Table 2 Prevalence of hypertension (HPN), hypercholesterolemia (HPC) and diabetes mellitus (DM) by socio-demography ofrespondents
Risk factors Hypertension,N (row %)
Chi-square/p-value
Hypercholesterolemia,N (row %)
Chi-square/p-value
Diabetes Mellitus,N (row %)
Chi-square/p-value
HPN(n = 108)
Non-HPN(n = 222)
HPC(n = 140)
Non-HPC(n = 190)
DM(n = 24)
Non-DM(n = 306)
N (%) N (%) N (%) N (%) N (%) N (%)
Sex 0.133/ 0.303/ 0.523/
Men 42 (31.6) 91 (68.4) 0.715 54 (40.6) 79 (59.4) 0.582 8 (6.0) 125 (94.0) 0.524
Women 66 (33.5) 131 (66.5) 86 (43.7) 111 (56.3) 16 (8.1) 181 (91.9)
Age group (years) 32.226/ 21.754/ 13.058/
19–29 9 (11.2) 71 (88.8) < 0.001 16 (20.0) 64 (80.0) < 0.001 0 (0.0) 80 (100.0) 0.001
30–59 75 (35.5) 136 (64.5) 105 (49.8) 106 (50.2) 17 (8.1) 194 (91.9)
≥ 60 24 (61.5) 15 (38.5) 19 (48.7) 20 (51.3) 7 (17.9) 32 (82.1)
Educational level 32.218/ 34.319/ 5.237/
No formal education 47 (56.6) 36 (43.4) < 0.001 56 (67.5) 27 (32.5) < 0.001 9 (10.8) 74 (89.2) 0.264
Primary school 21 (32.3) 44 (67.7) 26 (40.0) 39 (60.0) 5 (7.7) 60 (92.3)
Secondary school 37 (23.4) 121 (76.6) 52 (32.9) 106 (67.1) 10 (6.3) 148 (93.7)
High School Certificate/Diploma
2 (12.5) 14 (87.5) 2 (12.5) 14 (87.5) 0 (0.0) 16 (100.0)
Bachelor’s degree 1 (12.5) 7 (87.5) 4 (50.0) 4 (50.0) 0 (0.0) 8 (100.0)
Marital status 19.410/ 21.696/ 8.725/
Single 12 (15.6) 65 (84.4) < 0.001 18 (23.4) 59 (76.6) < 0.001 1 (1.3) 76 (98.7) 0.033
Married 76 (35.2) 140 (64.8) 100 (46.3) 116 (53.7) 18 (8.3) 198 (91.7)
Divorced/Separated 1 (50.0) 1 (50.0) 0 (0.0) 2 (100.0) 0 (0.0) 2 (100.0)
Widow/Widower 19 (54.3) 16 (45.7) 22 (62.9) 13 (37.1) 5 (14.3) 30 (85.7)
Occupation 11.521/ 11.494/ 3.375/
Unemployed 11 (17.5) 52 (82.5) 0.009 15 (23.8) 48 (76.2) 0.009 2 (3.2) 61 (96.8) 0.337
Housewife 56 (38.9) 88 (61.1) 70 (48.6) 74 (51.4) 12 (8.3) 132 (91.7)
Self-employed 31 (30.4) 71 (69.6) 46 (45.1) 56 (54.9) 6 (5.9) 96 (94.1)
Employed 10 (47.6) 11 (52.4) 9 (42.9) 12 (57.1) 1 (4.8) 20 (95.2)
Household income (RM/month) 0.450/ 0.837/ 0.095/
Hardcore poor 78 (32.6) 161 (67.4) 0.799 101 (42.3) 138 (57.7) 0.658 18 (7.5) 221 (92.5) 0.954
Poor 14 (29.8) 33 (70.2) 18 (38.3) 29 (61.7) 3 (6.4) 44 (93.6)
Above PLI 16 (36.4) 28 (63.6) 21 (47.7) 23 (52.3) 3 (12.5) 41 (93.2)
Household size (People) 0.035/ 0.724/ 0.360/
1–5 43 (33.3) 86 (66.7) 0.851 51 (39.5) 78 (60.5) 0.395 8 (6.2) 121 (93.8) 0.666
≥ 6 65 (32.3) 136 (67.7) 89 (44.3) 112 (55.7) 16 (8.0) 185 (92.0)
Smoking status 0.043/0.836
1.832/0.176
1.372/0.334
Smoker 13 (34.2) 25 (65.8) 20 (52.9) 18 (47.4) 1 (2.6) 37 (97.4)
Non/Ex-smoker 95 (32.5) 197 (67.5) 120 (41.1) 172 (58.9) 23 (7.9) 269 (92.1)
Harris et al. BMC Public Health 2019, 19(Suppl 4):554 Page 8 of 13

diabetes was associated with higher waist circumferencein relation to higher socioeconomic status and urbanisa-tion [36]. An Indonesian cross-sectional study alsoshowed waist circumference was associated with bloodglucose levels [37]. Higher salt intake was associatedwith higher prevalence of hypertension in coastal ruralcommunities in India [38, 39]. The most recent Malay-sian nationally representative data (MANS 2014) onnutrient intake showed that the indigenous populationin Sabah had a higher median sodium intake (2026 mg)compared to the national median (1935mg) [40].The prevalence of undiagnosed hypertension (24.5%),
hypercholesterolemia (40.6%) and diabetes mellitus (5.8%)in this rural coastal community were comparable to theMalaysian national prevalence of undiagnosed NCDs inrural areas, which were 20.7, 40.5 and 9.5% respectively.In contrast, the Malaysian national prevalence of undiag-nosed NCDs in urban areas were 16.1, 38.0 and 9.1% re-spectively [4]. The REDISCOVER study on hypertensionin Malaysia found that awareness, treatment and control
among hypertensive respondents were significantly lowerin rural communities compared to their urban counter-parts [5]. Similarly, rural hypertensive adults in Chinawere 49.4% less likely to be detected and 89.5% less likelyto be medicated than their urban counterparts [41].The over-representations of individuals from hardcore
poor households in the undiagnosed NCDs (p < 0.001)and among those who did not have a health check in thepreceding 12months (p < 0.001) are a matter of publichealth concern. Blood pressure is the easiest to administercompared to blood lipids and blood glucose checks. Yet,only 68.2% of adults in Semporna had access to a bloodpressure check in the preceding 12months. This rate ofaccess had not improved over the 25 years since Gan &Chin reported an access rate of 70.4% for rural popula-tions in Sabah [42]. At that time, the prevalence for hyper-tension in Kota Belud, another rural community innorth-western Sabah was 20.1% [42], which was slightlylower than the prevalence of 24.5% reported for this Sem-porna study. The high prevalence of undiagnosed NCDs
Table 3 Odd ratios for hypertension, hypercholesterolemia and diabetes mellitus
Hypertension (yes vs. no),Nagelkerke R2 = 0.351),overall predictiveaccuracy = 75.5%
Hypercholesterolemia (yes vs. no),Nagelkerke R2 = 0.253), overallpredictive accuracy = 68.2%
Diabetes mellitusa (yes vs. no),Nagelkerke R2 = 0.270, overallpredictive accuracy = 93.0%
OR (95% CI) P value OR (95% CI) P value OR (95% CI) P value
Education level with undergraduatedegree as the reference
No formal education 40.1 (2.77–581.52) 0.007 2.66 (0.33–21.62) 0.361
Primary 15.4 (1.09–217.12) 0.043 0.74 (0.10–5.64) 0.769
Lower secondary 14.5 (1.06–197.14) 0.045 0.74 (0.10–5.40) 0.758
Upper secondary 14.1 (1.02–196.13) 0.048 0.44 (0.06–3.30) 0.427
High school certificate /diploma 13.7 (0.57–326.01) 0.106 0.24 (0.02–3.00) 0.262
Household income with above PLIas the reference
Hardcore poor 0.48 (0.18–1.27) 0.139 0.34 (0.14–0.85) 0.020 0.56 (0.09–3.36) 0.525
Poor 0.53 (0.17–1.60) 0.256 0.48 (0.17–1.34) 0.161 0.65 (0.08–5.20) 0.688
Occupation with public / privateemployee as the reference
Unemployed 0.27 (0.05–1.47) 0.129 2.04 (0.42–9.79) 0.375 3.83 (0.15–99.29) 0.418
Home maker 0.29 (0.05–1.79) 0.182 2.23 (0.44–11.45) 0.336 3.43 (0.12–101.34) 0.476
Self employed 0.28 (0.06–1.31) 0.106 2.64 (0.62–11.22) 0.187 1.98 (0.12–33.22) 0.634
Age with ≥60y as the reference
19 – 29y 0.37 (0.10–1.40) 0.143 1.70 (0.52–5.57) 0.384 0 0 0.997
30 – 59y 0.34 (0.14–0.79) 0.012 1.59 (0.71–3.58) 0.260 0.21 (0.06–0.75) 0.016
Gender with females as the reference
Males 1.96 (0.62–6.15) 0.252 2.44 (0.92–6.48) 0.074 2.16 (0.26–17.67) 0.473
Waist circumference (cm) 1.09 (1.04–1.14) < 0.001 1.04 (1.00–1.08) 0.085 1.07 (1.00–1.15) 0.044
BMI (kg/m2) 1.20 (0.77–1.86) 0.543 0.86 (0.58–1.29) 0.472 1.09 (0.41–2.90) 0.867a OR for education level for diabetes was not reported as there were no respondents who were diabetic with foundation / high school / diploma andundergraduate degree levels
Harris et al. BMC Public Health 2019, 19(Suppl 4):554 Page 9 of 13

among respondents in the present study could be relatedto low health consciousness in the community. Resultsshowed that only a small proportion of respondents hadundergone health check-up for hypertension (31.8%),hypercholesterolemia (8.2%) and diabetes mellitus (13.0%).NCDs could be asymptomatic which caused individuals to
not seek health checks as they perceived themselves ashealthy [10]. Low health consciousness in the communitycould be a result of approaches which were disease fo-cused. When a continuous health programme was de-signed to be family focused within rural communities inWestern Sabah, it was found that many families were
Table 5 Blood pressure and blood chemistry by status of diagnosis of hypertension (HPN), hypercholesterolemia (HPC) and diabetesmellitus (DM) according to household income levels
Hardcore poor Poor Above PLI p valueA,B
N Mean ± S.D. p valuea,b N Mean±S.D. p valuea,b N Mean±S.D. P valuea,b
Systolic BP (mmHg) No HPN 161 118.5±11.2aA < 0.001 33 117.5±10.1aA < 0.001 28 118.5±12.5aA < 0.001 0.883
Known HPN 13 140.8±19.9bA 4 133.5±19.0bA 10 159.6±30.4bA 0.113
Unknown HPN 65 155.4±18.9cA 10 147.2±6.7cA 6 157.3±14.7bA 0.371
Diastolic BP (mmHg) No HPN 161 71.8±8.1aA < 0.001 33 72.9±7.8aA 0.010 28 71.3±8.8aA < 0.001 0.686
Known HPN 13 83.7±12.9bA 4 81.3±11.6aA 10 88.2±12.5bA 0.574
Unknown HPN 65 86.6±9.0bA 10 81.9±9.9aA 6 90.2±11.4bA 0.195
Total cholesterol (mmol/L) No HPC 138 4.3±0.6aA < 0.001 29 4.3±0.5A < 0.001 23 4.2±0.6aA < 0.001 0.858
Known HPC 2 4.8±0.9a 1 8.1 3 6.4±0.6b 0.068
Unknown HPC 99 6.2±0.8b 17 5.9±0.5A 18 6.2±0.8bA 0.319
HDL-C (mmol/L) No HPC 138 1.2±0.2aA 0.004 29 1.3±0.2A 0.070 23 1.3±0.3aA 0.774 0.390
Known HPC 2 1.3±0.1a 1 1.4 3 1.3±0.2a 0.867
Unknown HPC 99 1.3±0.3aA 17 1.5±0.3A 18 1.3±0.2aA 0.164
LDL-C (mmol/L) No HPC 138 2.5±0.5aA < 0.001 29 2.5±0.4A < 0.001 22 2.5±0.6aA < 0.001 0.228
Known HPC 2 3.0±0.7a 1 5.6 3 4.2±0.6b 0.806
Unknown HPC 98 4.1±0.7bA 17 3.8±0.5A 18 4.1±0.6bA 0.124
Trg (mmol/L) No HPC 138 1.2±0.6aA < 0.001 29 1.1±0.5A 0.025 23 1.1±1.0aA 0.045 0.817
Known HPC 2 1.1±0.3a 1 2.5 3 2.1±0.4a 0.096
Unknown HPC 99 1.8±1.0aA 17 1.4±0.6A 18 1.8±0.8aA 0.367
FBG (mmol/L) No DM 221 5.0±0.7aA < 0.001 44 4.8±0.7A < 0.001 41 4.7±0.6A < 0.001 0.006
Known DM 3 5.1±0.6a 1 12.2 1 19.7 0.005
Unknown DM 15 11.2±4.5bA 2 15.7±6.6A 2 10.8±4.6A 0.446a,bDifferent superscripts within the same column denote significant difference between NCD status (p < 0.05) for each blood chemistry. The group sizes areunequal. Type I error levels might occur for the ANOVAA, B Different superscripts within the same row denote significant difference between household income levels (p < 0.05) for each blood chemistry. The group sizesare unequal. Type I error levels might occur for the ANOVA
Table 4 Access to health checks by economic status of households
Economic statusof household
Had a health check in the preceding 12months Chi squaretest, p valueNo, n (row%) Yes, n (row %)
Blood pressure check Hardcore poor 178 (74.5) 61 (25.5) < 0.001
Poor 30 (63.8) 17 (36.2)
Above PLI 17 (38.6) 27 (61.4)
Blood lipids check Hardcore poor 226 (94.6%) 13 (5.4) 0.009
Poor 42 (89.4) 5 (10.6)
Above PLI 35 (79.5) 9 (20.5)
Blood glucose check Hardcore poor 220 (92.1) 19 (7.9) < 0.001
Poor 36 (76.6) 11 (23.4)
Above PLI 31 (70.5) 13 (29.5)
Harris et al. BMC Public Health 2019, 19(Suppl 4):554 Page 10 of 13

unaware of their health problems. Over the period ofintervention, those families became more empowered toaccess health services and community resources such aswelfare payments, and there were reductions in bloodpressure and blood glucose levels [43].Semporna has two publicly funded health clinics where
such health checks are available for a minimal payment,one on the Semporna mainland and the other on the lar-gest island opposite the mainland. However access to healthclinics for NCD detection in this rural coastal communitymight have been a challenge. There are also eight publiclyfunded community clinics which are located nearer to thecommunities that they serve. Unlike the health clinics,community clinics are staffed by community nurses whosefocus are on maternal and child health, contraception, im-munisation and child developmental assessments [15]. An-other issue that required attention is the access to NCDprevention and promotion strategy in rural coastal commu-nities in Sabah. The cost of access to health checks at pri-vate clinics is beyond the reach of most individuals in thisrural coastal community as median per capita householdincome was RM83.33/month (≈ USD 20). Public fundedNCD prevention and health promotions, whilst they werefree, they did not reach those who may not have a need tovisit health facilities or did not have access to health ser-vices [10]. The NCDP-1M with its community partneringin NCD risk screening and health promotion were availablein the rural coastal community in Semporna, but for vari-ous reasons, many adults had not accessed the free NCD
risk screening. The high proportion of respondents in thepresent study who did not have a health check in the past12months could be due to a combination of access issuesand lack of health awareness.The situation in Semporna is unique compared to
rural coastal communities in other parts of Malaysia andother Southeast Asian countries. Rural coastal commu-nities in Sabah host settled people who might be of simi-lar or different ethnic groups. In the present study,coastal Semporna, the islands off Semporna and its sur-rounding waters are also home to stateless Bajau Lautswho are of similar ethnicity and to a varying degree,similar culture with the citizen Bajaus. The statelessBajau Lauts are mostly very poor and are habitually de-nied access to affordable health care services as Malay-sian law does not distinguish the Bajau Lauts asundocumented inhabitants, from refugees and asylumseekers [14].
ConclusionsMany people in this rural coastal community were un-aware that they had high cholesterol and elevated bloodpressure. Their lack of health checks could either be at-tributable to limitations in access to affordable healthservices for NCD prevention and monitoring, or lowhealth seeking behaviour, or both. Based on the findings,we suggest further studies in (1) the changes in foodhabits in a rural coastal community and their effects onNCD risks, (2) identifying risk factors for NCDs in rural
Table 6 Prevalence of hypertension (HPN), hypercholesterolemia (HPC) and diabetes mellitus (DM) by nutritional status ofrespondents
Risk factors Hypertension,N (row %)
Chi-square/p-value
Hypercholesterolemia,N (row %)
Chi-square/p-value
Diabetes Mellitus,N (row %)
Chi-square/p-value
HPN(n = 108)
Non-HPN(n = 222)
HPC(n = 140)
Non-HPC(n = 190)
DM(n = 24)
Non-DM(n = 306)
N (%) N (%) N (%) N (%) N (%) N (%)
Body Mass Index (BMI) 29.426/ 29.120/ 20.015/
Underweight (< 18.5 kg/m2) 2 (5.9) 32 (94.1) < 0.001 6 (17.6) 28 (82.4) < 0.001 0 (0.0) 34 (100.0) < 0.001
Normal (18.5–22.9 kg/m2) 18 (19.8) 73 (80.2) 24 (26.4) 67 (73.6) 0 (0.0) 91 (100.0)
Overweight (23–27.4 kg/m2) 39 (38.6) 62 (61.4) 52 (51.5) 49 (48.5) 8 (7.9) 93 (92.1)
Obese (≥27.5 kg/m2) 49 (47.1) 55 (52.9) 58 (55.8) 46 (44.2) 16 (15.4) 88 (84.6)
Body Fat (BF) 39.055/<0.001
34.919/ 21.404/<0.001
Low BF 1 (2.6) 38 (97.4) 4 (10.3) 35 (89.7) < 0.001 0 (0.0) 39 (100.0)
Normal BF 33 (24.3) 103 (75.7) 48 (35.3) 88 (64.7) 3 (2.2) 133 (97.8)
Moderate BF 49 (44.5) 61 (55.5) 59 (53.6) 51 (46.4) 13 (11.8) 97 (88.2)
High BF 25 (56.8) 19 (43.2) 29 (65.9) 15 (34.1) 8 (18.2) 36 (81.8)
Waist Circumference (WC) 22.936/<0.001
25.991/ 16.401/<0.001
Positive abdominal obesity(Men: ≥90 cm; Women: ≥80 cm)
86 (42.6) 116 (57.4) 108 (53.5) 94 (46.5) < 0.001 24 (11.9) 178 (88.1)
Normal WC (Men: < 90 cm;Women: < 80 cm)
22 (17.2) 106 (82.8) 32 (25.0) 96 (75.0) 0 (0.0) 128 (100.0)
Harris et al. BMC Public Health 2019, 19(Suppl 4):554 Page 11 of 13

coastal communities and, (3) the mechanisms for earlydetection of new cases and provision of adequate treat-ment. These studies should be conducted in both citi-zens and undocumented inhabitants who for all mattersand purposes are settled within these rural communities.
AbbreviationsBMI: Body mass index; NCD: Non-communicable disease; NDCP-1 M: NCDPrevention 1 Malaysia; NHMS: National Health and Morbidity Survey; OR: Oddratio; PLI: Poverty Line Income; RM: Ringgit Malaysia; WHO: World HealthOrganization
AcknowledgementsAll authors would like to acknowledge the medical officer and nutritionist ofKlinik Kesihatan Semporna (Semporna Health Clinic), village heads andparticipants for their support and cooperation throughout the datacollection.
FundingThis research was funded by the Malaysian Government through the Ministryof Science, Technology and Innovation’s Science Fund Research Project withthe grant code 06–01-10SF0164. The funding body had no role in the designof the study or collection, analysis, and interpretation of data or in writingthe manuscript. The authors also acknowledged the financial assistance forpublication received from the Research University Grant awarded by theMinistry of Health to the National University of Malaysia specifically for theConsortium of B40 Research (CB40R) under the auspice of B40 GrandChallenges (IDE 2018-01).
Availability of data and materialsThe datasets used and/or analysed during the current study are availablefrom the corresponding author on reasonable request.
About this supplementThis article has been published as part of BMC Public Health Volume 19Supplement 4, 2019: Health and Nutritional Issues Among Low IncomePopulation in Malaysia. The full contents of the supplement are availableonline at https://bmcpublichealth.biomedcentral.com/articles/supplements/volume-19-supplement-4.
Authors’ contributionsYBHO, JSL, and PM made contributions to the conception and design of thisstudy. YBHO and JSL made substantial contribution to the study design andmanagement of the research activities. HH interviewed all respondents withthe aid of one paid enumerator. YBHO and HH drafted the manuscript andanalysed the data. JSL and PM were involved in critical revision for importantintellectual content. All authors have read and approved the finalmanuscript.
Ethics approval and consent to participateEthics approval was obtained from the Medical Research Ethics Committee,Faculty of Medicine and Health Sciences, Universiti Malaysia Sabah. Theapproval code is JKEtika 3/14(3). Written informed consent was obtainedfrom all the participants.
Consent for publicationNot applicable.
Competing interestsThe authors declare they have no competing interests.
Publisher’s NoteSpringer Nature remains neutral with regard to jurisdictional claims inpublished maps and institutional affiliations.
Published: 13 June 2019
References1. Rampal L, Rampal S, Azhar MZ, Rahman AR. Prevalence, awareness,
treatment and control of hypertension in Malaysia: a national study of16,440 subjects. Public Health. 2008;122(1):11–8.
2. Narayan KA, A Rashid K. Blood pressure patterns and the prevalence ofhypertension and its associated factors in a rural community in northernMalaysia. Malays J Public Health Med. 2007;7(1):14–9.
3. Tee SR, Teoh XY, Aiman WARWM, Aiful A, Har CSY, Tan ZF, et al. Theprevalence of hypertension and its associated risk factors in two ruralcommunities in Penang, Malaysia. Int E-J Sci Med Educ. 2010;4(2):27–40.
4. Institute for Public Health (IPH). Non-communicable diseases, risk factors &other health problems. In: Volume II National Health and Morbidity Survey2015 (NHMS 2015). 2015. Available from: http://iku.moh.gov.my/images/IKU/Document/REPORT/nhmsreport2015vol2.pdf. Accessed 29 Oct 2018.
5. Abdul-Razak S, Daher AM, Ramli AS, Ariffin F, Mazapuspavina MY, AmbiggaKS, et al. Prevalence, awareness, treatment, control and socio demographydeterminants of hypertension in Malaysian adults. BMC Public Health. 2016;16(351).
6. Institute for Public Health (IPH). Summary of NHMS report on disease prevalence.In: National prevalence of noncommunicable diseases / risks factors from NHMS1996 to 2015. 2017. Available from: http://iku.moh.gov.my/images/IKU/Document/REPORT/nhmsreport2015vol2.pdf. Accessed 29 Oct 2018.
7. Institute for Public Health (IPH). Methodology and general findings. In:Voume 1 National Health and Morbidity Survey 2011 (NHMS 2011). 2011.Available from: http://iku.moh.gov.my/images/IKU/Document/REPORT/NHMS2011-VolumeI.pdf. Accessed 29 Oct 2018.
8. Institute for Public Health (IPH). Executive Summary. In: The Third NationalHealth and Morbidity Survey (NHMS III) 2006. 2008. Available from: http://iku.moh.gov.my/images/IKU/Document/REPORT/2006/ExecutiveSummary.pdf. Accessed 29 Oct 2018.
9. Institute for Public Health (IPH). Diabetes mellitus.In: The third NationalHealth and Morbidity Survey 2006 (NHMS III). 2008. Available from: http://iku.moh.gov.my/images/IKU/Document/REPORT/2006/DiabetesMellitus.pdf.Accessed 29 Oct 2018.
10. Mustapha FI, Omar ZA, Mihat O, Noh KM, Hassan N, Bakar RA, et al.Addressing non-communicable diseases in Malaysia: an integrative processof systems and community. BMC Public Health. 2014;14:54.
11. Liyanatul NZ, Nadiatul IZ, Wan MK, Noor HI, Intan SS, Hasneezah H, et al.The concept of district health management in Malaysia. Int J Public HealthClin Sci. 2016;3(1):1–6.
12. Wu F, Narimatsu H, Li X, Nakamura S, Sho R, Zhao G, et al. Non-communicablediseases control in China and Japan. Glob Health. 2017;13:19.
13. Department of Statistics Malaysia. Putrajaya: Department of StatisticsMalaysia; 2010: p. 137.
14. Acciaioli G, Brunt H, Clifton J. Foreigners everywhere, nationals nowhere:exclusion, irregularity, and invisibility of stateless Bajau Laut in EasternSabah, Malaysia. J Immigr Refug Stud. 2017;15(3):232–49.
15. Ariff KM, Lieng TC. Rural health care in Malaysia. Aust J Rural Health. 2002;10:99–103.
16. Chen X, Wei W, Zou S, Wu X, Zhou B, Fu L, et al. Trends in the prevalenceof hypertension in island and coastal areas of China: a systematic reviewwith meta-analysis. Am J Hypertens. 2014;27(12):1503–10.
17. Dollah R, Hassan WSW, Peters D, Othman Z. Old threats, new approach andnational security in Malaysia: issues and challenges in dealing with cross-border crime in East Coast of Sabah. Mediterr J Soc Sci. 2016;7(3):178–86.
18. Ministry of Rural Development. Data asas Malaysia. Carta 8: Pendapatangaris kemiskinan (PGK) purata mengikut wilayah (Malaysia basic data. Chart8: Average poverty line income (PLI) by region), 2014. Available from: http://www.rurallink.gov.my/wp-content/uploads/2015/05/1-DATA-ASAS-MALAYSIA1.pdf. Accessed 30 Apr 2019.
19. Expert Consultation WHO. Appropriate body mass index for Asianpopulations and its implication for policy and intervention strategies.Lancet. 2004;363:157–63.
20. Gallagher D, Heymsfield SB, Heo M, Jebb SA, Murgatroyd PR, Sakamoto Y.Healthy percentage body fat ranges: an approach for developing guidelinesbased on body mass index. Am J Clin Nutr. 2000;72(3):697–701.
21. WHO/IOTF/IASO. The Asia Pacific perspective: redefining obesity and itstreatment. 2000. Available from: http://www.wpro.who.int/nutrition/documents/docs/Redefiningobesity.pdf. Accessed 29 Oct 2018.
Harris et al. BMC Public Health 2019, 19(Suppl 4):554 Page 12 of 13

22. Ministry of Health Malaysia (MOH). Clinical practice guidelines. Managementof hypertension. 5th ed. Putrajaya: Ministry of Health Malaysia; 2018.Available from http://www.moh.gov.my/moh/penerbitan/CPG/MSH%20Hypertension%20CPG%202018%20V3.8%20FA.pdf. Accessed 30 Apr2019.
23. Ministry of Health Malaysia (MOH). Clinical practice guidelines. Managementof type 2 diabetes mellitus. 5th ed. Putrajaya: Ministry of Health Malaysia;2015. Available from: http://www.moh.gov.my/moh/resources/Penerbitan/CPG/Endocrine/3a.pdf. Accessed 30 Apr 2019.
24. NIH. Third report of the National Cholesterol Education Program (NCEP)Expert Panel on detection, evaluation and treatment of high bloodcholesterol in adults (adult treatment panel III): final report. Circulation.2002;17(106):3143–421.
25. Rampal S, Mahadeva S, Guallar E, Bulgiba A, Mohamed R, Rahmat R, et al.Ethnic differences in the prevalence of metabolic syndrome: results from amulti-ethnic population-based survey in Malaysia. PLoS One. 2012;7(9):e46365.
26. Schagatay E, Abrahamsson E. A living based on breath-hold diving in theBajau Laut. Hum Evol. 2014;29(1–3):171–83.
27. Ilardo MA, Moltke I, Korneliussen TS, Cheng J, Stern AJ, Racimo F, et al.Physiological and genetic adaptations to diving in sea nomads. Cell. 2018;173:569–80.
28. Ley EJ, Singer MB, Clond MA, Johnson T, Bukur M, Chung R, et al. Long-term effect of trauma splenectomy on blood glucose. J Surg Res. 2012;177:152–6.
29. Mohd Yunus AS, Sherina MS, Nor Afiah MZ, Rampal L, Tiew KH. Prevalenceof cardiovascular risk factors in a rural community in Mukim Dengkil,Selangor. Malays J Nutr. 2004;10(1):5–11.
30. Masud MM, Kari F, Yahaya SRB, Al-Amin AQ. Livelihood assets andvulnerability context of marine park community development in Malaysia.Soc Indic Res. 2016;125:771–92.
31. Taylor R, Badcock J, King H, Pargeter K, Zimmet P, Fred T, et al. Dietary intake,exercise, obesity and noncommunicale disease in rural and urban populationsof three Pacific island countries. J Am Coll Nutr. 1992;11(3):283–93.
32. Dancause KN, Dehuff C, Soloway LE, Vilar M, Chan C, Wilson M, et al.Behavioural changes associated with economic development in the SouthPacific: health transition in Vanuatu. Am J Hum Biol. 2011;23:366–76.
33. Yang J, Lu F, Zhang C, Liu Z, Zhao Y, Gao F, et al. Prevalence ofprehypertension and hypertension in a Chinese rural area from 1991 to2007. Hypertens Res. 2010;33:331–7.
34. Narayan KA, Khan AR. Body mass index and nutritional status of adults intwo rural villages in northern Malaysia. Malays J Nutr. 2007;13(1):9–17.
35. Yoon KH, Lee JH, Kim JW, Cho JH, Choi YH, Ko SH, et al. Epidemic obesityand type 2 diabetes in Asia. Lancet. 2006;368:1681–8.
36. Adair LS, Kuzawa C, McDade T, Carba DB, Borja JB. Seventeen-year changesin body mass index, waist circumference, elevated blood pressure, anddiabetes phenotypes in a cohort of Filipino women. Asia Pac J PublicHealth. 2018;30(6):567–71.
37. Hardiman SL, Bernanthus IN, Rustati PK, Susiyanti E. Waist circumference asa predictor for blood glucose levels in adults. Universa Medicina. 2009;(28):77–82.
38. Annadurai K, Balan N, Ranaganathan K. Non-communicable disease riskfactor profile among fishermen community of Kancheepuram district, TamilNadu: a cross sectional study. Int J Community Med Public Health. 2018;5:708–13.
39. Kini S, Kamath VG, Kulkarni MM, Kamath A, Shivalli S. Pre-hypertensionamong young adults (20 - 30 years) in coastal villages of Udupi District inSouthern India: an alarming scenario. PLoS One. 2016;11:e0154538.
40. Institute for Public Health (IPH): National Health and Morbidity Survey 2014:Malaysian Adult Nutrition Survey (MANS) In., vol. II: Survey Findings; 2014:343.
41. Li J, Shi L, Li S, Xu L, Qin W, Wang H. Urban-rural disparities in hypertensionprevalence, detection, and medication use among Chinese adults from1993 to 2011. Int J Equity Health. 2017;16:50.
42. Gan CY, Chan MKC. A blood pressure profile of rural Kadazans and Bajaus inSabah, East Malaysia. Southeast Asian J Trop Med Public Health. 1993;24(3):583–9.
43. Faris A, Robinson F, Tha NO, Shoesmith W, Ali O, Naing DKS. PuPUK: acommunity engaged medical curriculum by the School of Medicine,Universiti Malaysia Sabah. Int J Collab Res Intern Med Public Health. 2013;5(1):79–88.
Harris et al. BMC Public Health 2019, 19(Suppl 4):554 Page 13 of 13