Rheumatic Diseases
179
Official journal of the Asia Pacific League of Associations for Rheumatology (APLAR) Indexed by ISI (SCI-E), MEDLINE (A) (B) (C) (D) (E) ISSN 1756ͳ1841 VOLUME 23 NUMBER 3 2020 International Journal of Rheumatic Diseases
-
Upload
khangminh22 -
Category
Documents
-
view
0 -
download
0
Transcript of Rheumatic Diseases

Official journal of the Asia Pacific League of Associations for Rheumatology (APLAR)
Indexed by I
SI (SC
I-E),
MEDLINE
(A) (B)
(C) (D)
(E)
ISSN 1756 1841 VOLUME 23 NUMBER 3 2020
International Journal of
Rheumatic Diseases
apl_v23_i3_issueinfo.indd 1apl_v23_i3_issueinfo.indd 1 19-02-2020 17:48:5319-02-2020 17:48:53

International Journal of Rheumatic Diseases
Editor-in-ChiefKevin Pile, Sydney, AustraliaSenior EditorsChi-Chiu Mok, Hong Kong, ChinaDebashish Danda, Vellore, IndiaFereydoun Davatchi, Tehran, IranLars Klareskog, Stockholm, SwedenRamnath Misra, Lucknow, IndiaZhanguo Li, Beijing, ChinaAssociate EditorsAlberta Hoi, Melbourne, AustraliaAman Sharma, Chandigarh, IndiaAnand Kumthekar, New York, USAAndrew Harrison, Wellington, New ZealandAnselm Mak, SingaporeAtsushi Kawakami, Nagasaki, JapanBenny Samual Eathakkattu Antony, Hobart, AustraliaCatherine Hill, Adelaide, AustraliaChi-Chen Chang, TaiwanChin Teck Ng, SingaporeChristina Boros, Adelaide, AustraliaCho Mar Lwin, Myanmar
Dae Hyun Yoo, Seoul, KoreaDavid S. Pisetsky, Durham, USADawn Aitken, Hobart, AustraliaEnrico Tombetti, London, UKEvange Romas, Melbourne, AustraliaGeorge D. Kitas, Birmingham, UKGerard Espinosa, Barcelona, SpainGraeme Jones, Tasmania, AustraliaHaider Mannan, Sydney, AustraliaHaner Direskeneli, Istanbul, TurkeyHo Ying Chung, Hong Kong, ChinaIng Soo Lau, MalaysiaIngrid Lundberg, Stockholm, SwedenJames Cheng Chung Wei, Taichung, TaiwanJohannes J. Rasker, Enschede, NetherlandsJulian Thumboo, SingaporeKarina Torralba, Los Angeles, USAKaty Ying Ying Leung, SingaporeKeith Lim, Melbourne, AustraliaKok Yong Fong, SingaporeLai Shan Tam, Hong Kong, ChinaLatika Gupta, Lucknow, India
Lingyun Sun, Nanjing, ChinaLiwei Lu, Hong Kong, ChinaMajda Khoury, SyriaManjari Lahiri, SingaporeMarie Feletar, Melbourne, AustraliaMarwan Adwan, JordanMaureen Rischmueller, Adelaide, AustraliaMeiying Wang, ChinaNan Shen, Shanghai, ChinaNazrul Islam, Dhaka, BangladeshNigil Haroon, Toronto, CanadaNina Kello, New York, USAPadmanabha Shenoy, IndiaPaul Bird, New South Wales, AustraliaPaul Kubler, Brisbane, AustraliaPaul Wordsworth, Oxford, UKPeter Wong, Sydney, AustraliaPhilip Robinson, Brisbane, AustraliaPrasanta Padhan, IndiaR Hal Scofi eld, Oklahoma, USARam Pyare Singh, Los Angeles, USARam Raj Singh, Los Angeles, USARobert Lahita, New Jersey, USARonald Yip, Hong Kong, ChinaSam Whittle, Adelaide, Australia
Sami Salman, Baghdad, IraqSang-Heon Lee, Seoul, KoreaSargunan Sockalingam, Kuala Lumpur, MalaysiaSeong-Kyu Kim, KoreaShin-Seok Lee, KoreaSumaira Farman Raja, PakistanSurjit Singh, Chandigarh, IndiaSyed Atiqul Haq, Dhaka, BangladeshTamer Gheita, Cairo, EgyptTatsuya Atsumi, Sapporo, JapanTemy Mok, Hong Kong, ChinaTsang Tommy Cheung, Hong Kong, ChinaTsutomu Takeuchi, Tokyo, JapanVaidehi Chowdhary, Rochester, Minnesota, USAVinod Scaria, New Delhi, IndiaVS Negi, Pondicherry, IndiaWang-Dong Xu, Luzhou, P.R. ChinaWen-Chan Tsai, TaiwanWorawith Louthrenoo, Chiang Mai, ThailandYehuda Shoenfeld, Tel Aviv, IsraelYoshiya Tanaka, Kitakyushu, JapanYuho Kadono, Japan
Production Editor
Jovel Marie Domingo ([email protected])
Editorial Assistant
Gabriel Orosa ([email protected])
Past Editors-in-Chief
D Danda, Vellore, India (International Journal of Rheumatic Diseases, 2013–2018)CS Lau, Hong Kong, China (APLAR Journal of Rheumatology/International Journal of Rheumatic Diseases, 2004–2012)PH Feng, Singapore (APLAR Journal of Rheumatology, 1998–2004)KD Muirden, Australia (APLAR Bulletin)
Cover: Renal biopsy specimens of a patient with glomerular microthrombosis (GMT). c/o Zhou Y, Chen P, Li Y. Association between an-tiphospholipid antibodies and factor Bb in lupus nephritis patients with glomerular microthrombosis. Int J Rheum Dis. 2019;22:2185–2190
APL.JEB.Mar20
apl_v23_i3_issueinfo.indd 2apl_v23_i3_issueinfo.indd 2 19-02-2020 17:48:5719-02-2020 17:48:57

Disclaimer: The Publisher, Asia Pacific League of Associations for Rheumatology and Editors cannot be held responsible for errors or any consequences arising from the use of information con-tained in this journal; the views and opinions expressed do not necessarily reflect those of the Publisher, Asia Pacific League of Associations for Rheumatology and Editors, neither does the publication of advertisements constitute any endorsement by the Publisher, Asia Pacific League of Associations for Rheumatology and Editors of the products advertised.
International Journal of Rheumatic Diseases @ 2020 Asia Pacific League of Associations for Rheumatology and John Wiley & Sons Australia, Ltd
For submission instructions, subscription and all other information visit http://onlinelibrary.wiley.com/journal/10.1111/(ISSN)1756-185X
View this journal online at wileyonlinelibrary.com/journal/apl
APL.JEB.Mar20
apl_v23_i3_issueinfo.indd 3apl_v23_i3_issueinfo.indd 3 19-02-2020 17:48:5719-02-2020 17:48:57

Reviews and Recommenda ons Depression has an impact on disease activity and health-related quality of life in rheumatoid arthritis: A systematic review and meta-analysis . . . . . . . . . . . . . . . . . . . . . . . . . . . . . . . . . . . . . . . . . . . . . . . . . . . . . . . . . . . . . . . . . . . . . . . . . . . . 285 L. Zhang, P. Cai and W. Zhu
Original Ar cles Mindfulness is associated with sleep quality among patients with fi bromyalgia . . . . . . . . . . . . . . . . . . . . . . . . . . . . . . . . . . . . . . . . . . . 294 M. Park, Y. Zhang, L. L. Price, R. R. Bannuru and C. Wang Prevalence of and factors associated with depression and anxiety in patients with rheumatoid arthritis: A multicenter prospective cross-sectional study . . . . . . . . . . . . . . . . . . . . . . . . . . . . . . . . . . . . . . . . . . . . . . . . . . . . . . . . . . . . . . . . . . . . . 302 W. Katchamart, P. Narongroeknawin, W. Chanapai, P. Thaweera hakul and A. Srisomnuek Adaptation and validation of an Arabic version of a 10-item patient-reported outcome measure of physical function in rheumatoid arthritis . . . . . . . . . . . . . . . . . . . . . . . . . . . . . . . . . . . . . . . . . . . . . . . . . . . . . . . . . . . . . . . . . . . . . . . . . . . . . . . . . . . . . . . . . 309 S. M. Farrag, M. M. Abdelnaby, and A. E. Mohamed Factors associated with successful discontinuation of certolizumab pegol in early rheumatoid arthritis . . . . . . . . . . . . . . . . . . . . . . . . 316 Y. Tanaka, T. Atsumi, K. Yamamoto, T. Takeuchi, H. Yamanaka, N. Ishiguro, K. Eguchi, A. Watanabe, H. Origasa, T. Shoji, N. Miyasaka and T. Koike Estimation of direct cost of managing rheumatoid arthritis treatment to Pakistani patients using real-world follow-up data . . . . . . . . . . . . . . . . . . . . . . . . . . . . . . . . . . . . . . . . . . . . . . . . . . . . . . . . . . . . . . . . . . . . . . . . . . . . . . . . . . . . . . . . . . . . . . . . 325 A. A. Naqvi, M. A. Hassali, S. B. S. Naqvi, B. Kachela and I. Khan The direct and indirect costs of axial spondyloarthritis (axSpA) in Singapore . . . . . . . . . . . . . . . . . . . . . . . . . . . . . . . . . . . . . . . . . . . . . . 334 Y. H. Kwan, S. Y. Kwoh, J. K. Phang, M. H. H. Cheen, K. K. Lim, C. T. M. Wang, Y. Y. Leung, H.-L. Koh, T. Ostbye, J. Thumboo and W. Fong Gastrointestinal risk factors and patient-reported outcomes of ankylosing spondylitis in Korea . . . . . . . . . . . . . . . . . . . . . . . . . . . . . . 342 S.-H. Lee, Y.-w. Park, J.-Y. Choe, K. Shin, S.-R. Kwon, J.-H. Cha, Y.-J. Kim, J. Lee and T.-H. Kim P2 receptors mRNA expression profi les in macrophages from ankylosing spondylitis patients and healthy individuals . . . . . . . . . . . 350 M. Akhtari, S. J. Zargar, M. Vojdanian, A. Ashraf-Ganjouei, A. Javinani, E. Hamzeh, A. Rezaiemanesh, A. Jamshidi and M. Mahmoudi Measuring bone density in axial spondyloarthropathy: Time to turn things on their side? . . . . . . . . . . . . . . . . . . . . . . . . . . . . . . . . . . . 358 G. Fitzgerald, T. Anachebe, K. McCarroll and F. O’Shea Prevalence, correlates, and impact of sleep disturbance in Chinese patients with primary Sjögren’s syndrome . . . . . . . . . . . . . . . . . . 367 Y. Cui, J. Li, L. Li, Q. Zhao, S. Chen, L. Xia, T. Fu, J. Ji and Z. Gu Serum levels of interleukin-34 and clinical correlation in patients with primary Sjögren's syndrome . . . . . . . . . . . . . . . . . . . . . . . . . . 374 Y. Liu, B. Zhang, Y. Lei, L. Xia, J. Lu and H. Shen Quantitative analysis for modifi ed Schall's classifi cation by stimulation test with dynamic scintigraphy in Sjögren's syndrome . . . . . . . . . . . . . . . . . . . . . . . . . . . . . . . . . . . . . . . . . . . . . . . . . . . . . . . . . . . . . . . . . . . . . . . . . . . . . . . . . . . . . . . . . . . . 381 G.-w. Zhu, Z. Gao, H.-b. Feng and J.-j. Qiu Long-term outcome in children with juvenile dermatomyositis: A single-center study from north India . . . . . . . . . . . . . . . . . . . . . . . . 392 A. Sharma, A. Gupta, A. Rawat, D. Suri and S. Singh
Interna onal Journal of Rheuma c DiseasesVolume 23 | Number 3 | March 2020
Contents
apl_v23_i3_issueinfo.indd 4apl_v23_i3_issueinfo.indd 4 19-02-2020 17:48:5819-02-2020 17:48:58

Aberrant expansion of circulating CD4 + CXCR5 + CCR7 lo PD1 hi Tfh precursor cells in idiopathic infl ammatory myopathy . . . . . . . . . . . . . 397 L. Zhang, W. Li, Y. Cai, X. Liu, Q. Peng and L. Liang Eff ects of thalidomide on Th17, Treg cells and TGF-β1/Smad3 pathway in a mouse model of systemic sclerosis . . . . . . . . . . . . . . . . . 406 Y. Lu, C. Zhao, L. Lei, Z. Tao, L. Zheng, J. Wen and X. Li Relationship between coff ee consumption and serum uric acid level in the general Korean population: A nationwide cross-sectional study . . . . . . . . . . . . . . . . . . . . . . . . . . . . . . . . . . . . . . . . . . . . . . . . . . . . . . . . . . . . . . . . . . . . . . . . . . . . . . . . . . . . . . . . . . . 420 J. H. Jung, H. Seok, S. J. Choi, C. Kim, C. H. Bang and G. G. Song Clinical signifi cance of reduced expression of lncRNA TUG1 in the peripheral blood of systemic lupus erythematosus patients . . . . . . . . . . . . . . . . . . . . . . . . . . . . . . . . . . . . . . . . . . . . . . . . . . . . . . . . . . . . . . . . . . . . . . . . . . . . . . . . . . . . . . . . . 428 H.-Y. Cao, D. Li, Y.-P. Wang, H.-X. Lu, J. Sun and H.-B. Li Associations of serum citrate levels with knee structural changes and cartilage enzymes in patients with knee osteoarthritis . . . . . . . . . . . . . . . . . . . . . . . . . . . . . . . . . . . . . . . . . . . . . . . . . . . . . . . . . . . . . . . . . . . . . . . . . . . . . . . . . . . . . . . . . . . . . 435 F. Bian, G. Ruan, J. Xu, K. Wang, J. Wu, J. Ren, B. Chang and C. Ding
Expert Comments Rheumatology workforce issues in South Asia: Challenges and solutions . . . . . . . . . . . . . . . . . . . . . . . . . . . . . . . . . . . . . . . . . . . . . . . . . 443 A. Aggarwal and S. A. Haq
APLAR Grand Round Case Common variable immunodefi ciency presenting as sarcoidosis in a 9-year-old child . . . . . . . . . . . . . . . . . . . . . . . . . . . . . . . . . . . . . . . 448 I. Maccora, E. Marrani, S. Ricci, C. Azzari, G. Simonini, R. Cimaz and T. Giani
Correspondence Secukinumab can treat psoriasis induced by anti-TNF-alpha therapy in patients with ankylosing spondylitis: Case series . . . . . . . . . 454 H. Apaydin, I. Dogan and Ş. Erten
apl_v23_i3_issueinfo.indd 5apl_v23_i3_issueinfo.indd 5 19-02-2020 17:48:5819-02-2020 17:48:58

Int J Rheum Dis. 2020;23:285–293. wileyonlinelibrary.com/journal/apl | 285© 2019 Asia Pacific League of Associations for Rheumatology and John Wiley & Sons Australia, Ltd
1 | INTRODUC TION
Rheumatoid arthritis (RA) is a chronic, progressive, debilitating autoimmune disease with frequent psychological co-morbidities,
of which depression is one of the most common manifestations, affecting 14.8%-41.5% of patients with RA.1,2 Previous studies reported there were 2-4 times higher prevalence of depression in RA than the general population.3,4 Depressed patients with
Received: 16 October 2019 | Revised: 27 November 2019 | Accepted: 28 November 2019
DOI: 10.1111/1756-185X.13774
R E V I E W
Depression has an impact on disease activity and health-related quality of life in rheumatoid arthritis: A systematic review and meta-analysis
Lijuan Zhang1 | Pingping Cai2 | Weiyi Zhu2
1Department of Gastrointestinal Surgery, Shanghai Minimally Invasive Surgery Center, Ruijin Hospital, Shanghai Jiao Tong University School of Medicine, Shanghai, China2Department of Nursing, Shanghai Minimally Invasive Surgery Center, Ruijin Hospital, Shanghai Jiao Tong University School of Medicine, Shanghai, China
CorrespondenceLijuan Zhang, Department of Gastrointestinal Surgery, Shanghai Minimally Invasive Surgery Center, Ruijin Hospital, Shanghai Jiao Tong University School of Medicine, 197, Ruijin Er Road, Shanghai 200025, China.Email: [email protected]
Weiyi Zhu, Department of Nursing, Ruijin Hospital, Shanghai Jiao Tong University School of Medicine, 197, Ruijin Er Road, Shanghai 200025, China.Email: [email protected]
Funding informationthe Chinese National Natural Science Foundation, Grant/Award Number: 71904118
AbstractObjective: The aim of this study was to explore the impact of depression on pain, disease activity, functional disability and quality of life in patients with rheumatoid arthritis (RA).Methods: English (PubMed, the Cochrane Library, Web of Science and PsycINFO) and Chinese (Wan Fang Database and Chinese National Knowledge Infrastructure) databases were systematically and independently searched from their inception until 30 September, 2019. Studies evaluating the impact of depression on pain, disease activity, functional disability and quality of life with the use of the Short Form-36 questionnaire (SF-36) scoring system were included. Statistical analyses were per-formed with Revman5.3. Data were pooled using a fixed or random-effects model according to heterogeneity.Results: A total of 7 identified studies matched the inclusion criteria, reporting on a total of 1078 patients with RA in the analysis. The total Disease Activity Score in 28 joints was significantly higher in patients with depression than in patients without depression [standardized mean difference (SMD) =0.47, 95% CI 0.10-0.85, P = .01]. All SF-36 dimensions (physical function, role physical function, emotional role func-tion, vitality, mental health, social function, body pain, general health, physical com-ponent scale, mental component scale) were lower in patients with depression than in groups without depression. Interestingly, the results of this meta-analysis showed no significant difference between patients with and without depression in pain (SMD = 0.57, 95% CI − 0.03-1.17, P = .06) and functional disability (SMD = 0.48, 95% CI − 0.03-0.99, P = .43).Conclusion: This meta-analysis showed that RA patients with depression tended to have higher disease activity and lower quality of life than patients without depression.
K E Y W O R D S
depression, disease activity, meta-analysis, quality of life, rheumatoid arthritis

286 | ZHANG et Al.
RA have poorer long-term outcomes, including increased pain,5 high disease activity,1,6 increased levels of functional disability,7 and reduced health-related quality of life (HRQoL).8 Depression in patients with RA may therefore be a useful target for interven-tions aimed at improving subjective health and HRQoL. HRQoL is a multi-domain and subjective concept that encompasses the im-pact of rheumatic disease and its treatment on a person's percep-tion of their daily life, and it has emerged as an important outcome of interest.9 The Short Form-36 questionnaire (SF-36) is a generic instrument that has been widely used to measure physical and mental health constructs, which has been widely applied to assess the HRQoL of patients with RA.10 It includes 8 domains: physi-cal function (PF); role physical function (RP); body pain (BP); gen-eral health (GH); vitality (VT); social function (SF); role-emotional function (RE); mental health (MH). Z-transformed and normalized domain scores were grouped into Physical Component Summary (PCS) and Mental Component Summary (MCS). However, despite having been measured in many studies, the degree of quality of life in each domain differed among different samples,10 and no systematic review was conducted to quantify the association of depression and quality of life assessed by the SF-36 in RA using meta-analysis techniques. The aims of this systematic review and meta-analysis were to answer the following questions: (a) was the score of quality of life assessed by the SF-36 lower in depres-sion than non-depression groups; and (b) were there associations among depression, pain, disease activity, and functional disability in adult patients with RA?
2 | MATERIAL S AND METHODS
2.1 | Search strategy
This systematic review was conducted within the Preferred Reporting Items for Systematic Reviews and Meta-Analyses (PRISMA) statement.11 A systematic review of published literature in scientific journals that reported on the prevalence of depres-sion among patients with RA was conducted by 2 independent re-viewers using the following databases, from their inception to 30 September, 2019: PubMed, the Cochrane Library, Web of Science, PsycINFO, Wan Fang Database, and Chinese National Knowledge Infrastructure. The computer-based searches combined terms related to patients with RA (depress* or depress* disorder$ or af-fective disorder$ or mood disorder$ or adjustment disorder$ or af-fective symptom$ or dysthymi*) AND (rheumatoid arthritis or RA). No language restriction was imposed. A manual search was also performed on reference lists from included articles, reviews, edito-rials, and proceedings of international congresses. Two independ-ent authors analyzed each article and independently performed the data extraction. In case of disagreement, a third investigator was consulted.
2.2 | Inclusion and exclusion criteria
The study inclusion criteria were: (a) studies with a cross-sectional design, baseline cross-sectional data from a longitudinal study or baseline cross-sectional data from a trial, before group allocation; (b) studies that used validated methods (clinical interviews or self-report instruments) to assess depression, pain, disease activity, functional disability, and quality of life; (c) the outcome variables had to include at least 1 of the following variables: depression, dis-ease activity, pain, functional disability, and quality of life assessed by the SF-36. Studies were excluded if they did not meet the above criteria.
2.3 | Data extraction and quality assessment
Two researchers read the relative studies independently by the ti-tles and abstracts to exclude the references which did not met the inclusion criteria. Then, they read full texts in the remaining stud-ies as mentioned above, and determined whether these references included were final studies or not. All articles were retrieved and
F I G U R E 1 Flow chart showing selection of studies for inclusion in this meta-analysis
87 potential appropriate studieswere included for detailed
evaluation
7 studies included in themeta-analysis
80 studies were excluded afterfull-text screening:
No relevant (n = 67)Insufficient or useless data
provided (n = 8)Duplicate publication (n = 5)
2314 potential relevant articlesidentified through database
searching
699 duplicates were removed byEndNote software
1615 articles were selected forfurther evaluation
1528 studies were excluded afterreviewing titles and abstracts

| 287ZHANG et Al.
assessed independently by 2 reviewers who extracted data includ-ing authors, publication date, country of origin, characteristics of the study population including diagnostic criteria for RA, disease dura-tion, number of subjects, type of study, and details of outcomes. If we encountered multiple publications from the same cohort, we used the data from the most recent or the paper reporting data from the largest number of participants. The quality of the selected stud-ies was assessed by a modified version of the Newcastle–Ottawa Scale (NOS) for cross-sectional and cohort studies.12,13 It evaluated primary study quality in terms of 4 criteria such as participant selec-tion, comparability, exposure and outcome that were adopted in the study. Studies were judged to be at low risk of bias (≥3 points) or high risk of bias (<3 points). Any disagreement was resolved by discussion and re-examination of the paper.
2.4 | Outcome measures
The outcomes were major/minor depression diagnosed with a struc-tured clinical assessment (eg Diagnostic and Statistical Manual of Mental Disorders 4th edn.) or depression assessed with validated
assessment tools (eg the Hospital Anxiety and Depression Scale [HADS], the Self-rating Depression Scale [SDS]). In addition, the out-comes also included disease activity, pain, functional disability, and quality of life assessed by the SF-36.
2.5 | Statistical analyses
Meta-analysis was done with Revman5.3. The standardized mean difference (SMD) or mean difference (MD) and 95% confidence in-tervals (CIs) were calculated for continuous data. Between-study heterogeneity was assessed by the I2 statistic.14 We used a fixed effects model to pool the results together unless significant hetero-geneity was observed (I2 > 50%), which needed a random-effects model. Because the 8 domains of the SF-36 scale indicated different aspects of HRQoL, this study separately summarized and analyzed 8 domains. In addition, the 2 summary scores (PCS and MCS) were synthesized to provide a direct understanding of the HRQoL. To as-sess the extent of publication bias, a funnel plot was used. Funnel plots and Egger's test were combined to explore the potential publi-cation bias in this meta-analysis.15,16
TA B L E 1 Characteristics of studies included in the meta-analysis
First author, year
Country of study
No. of subjects
Disease duration, y Type of study
Ascertainment of depression
Proportion depressed
RA criteria
Instruments: main outcomes
Mok et al, 20128
Hong Kong 200 4.00 (2.00-9.00)
Cross-sectional
DSM-IV 14.5% 1987 ACR SF-36: quality of life
Zhang et al, 20171
China 160 7.20 ± 8.20 Cross-sectional
HADS 27.5% ACR SF-36: quality of life;VAS: pain;DAS28: disease
activity;HAQ: functional
disability
Nas et al, 201118
Turkey 421 Depression: 9.59 ± 7.66/non-depression: 8.77 ± 6.67
Retrospective study
HADS 25% ACR SF-36: quality of life;VAS: pain;DAS28: disease
activity
Cui et al, 200919
China 60 4.51 ± 8.62 Cross-sectional
HAMD 65% 1987 ACR SF-36: quality of life
Zhang et al, 201713
China 60 6.35 ± 6.26 Cross-sectional
SDS 56% 1987 ACR VAS: pain;DAS28: disease
activity
Uguz et al, 200917
Turkey 83 9.00 ± 8.30 Cross-sectional
DSM-IV 41.8% ACR DAS28: disease activity;
HAQ: functional disability
Chen et al, 201321
China 112 4.89 ± 2.50 Cross-sectional
HAMD 55.4% 1987 ACR DAS28: disease activity;
HAQ: functional disability
Abbreviations: RA, rheumatoid arthritis; DSM-IV, Diagnostic and Statistical Manual of Mental Disorders-IV; HADS, the Hospital Anxiety and Depression Scale; HAMD, Hamilton Depression Scale; SDS, Self-rating Depression Scale; ACR, the American College of Rheumatology; VAS, visual analog scale; DAS28, Disease Activity Score in 28 joints; HAQ: Health Assessment Questionnaire; SF-36: the Medical Outcomes Study Short Form-36.

288 | ZHANG et Al.
3 | RESULTS
3.1 | Search results
The review process is summarized in Figure 1. We first retrieved 2314 potentially relevant studies from electronic databases. Of these, 87 full-text articles were reviewed and 7 articles were finally included in this study. Inter-rater reliability of reviewers regarding study relevancy was high (κ = .85).
3.2 | Study characteristics
A summary of the included study characteristics is shown in Table 1. One took place in Hong Kong, 2 in Turkey, and 4 in China. Four stud-ies had large sample sizes (≥100 cases) and 3 were of small sample
size (<100 cases). When evaluated by modified NOS criteria, out of 5 possible points, 2 received 4 points, 2 received 3 points, and 3 received 2 points (Table 2).
3.3 | Impact of depression
There were 7 studies that compared pain, disease activity, functional disability and quality of life between depression and non-depression in patients with RA.1,8,17-21 Table 3 presents the summary of meta-analyses for each of the outcomes.
3.4 | Disease activity for patients with RA
Five studies1,17,18,20,21 involving 836 patients compared disease ac-tivity assessed by the Disease Activity Score in 28 joints (DAS-28)
TA B L E 2 Quality assessment of the included studies measured by M-NOS
Study ID Representativeness Size Comparability Outcome Statistics Total
Mok et al, 20128 0 1 1 1 1 4
Zhang et al, 20171 0 0 1 1 1 3
Nas et al, 201118 1 1 0 1 1 4
Cui et al, 200919 0 0 0 1 1 2
Zhang et al, 201713 0 0 0 1 1 2
Uguz et al, 200917 0 0 1 1 1 3
Chen et al, 201321 0 0 0 1 1 2
Note: Low risk of bias (≥3 points); high risk of bias (<3 points).Abbreviation: M-NOS, modified Newcastle–Ottawa Scale.
TA B L E 3 Meta-analysis of outcome measures
Outcome No. of studiesSample size (depression/ non-depression)
Heterogeneity test(I2, %) SMD 95% CI P value
DAS-28 5 486/350 80 0.47 0.10, 0.85 .01
VAS-pain 3 395/246 88 0.57 −0.03, 1.17 .06
HAQ 3 135/220 80 0.48 −0.03, 0.99 .06
Domains of SF-36
PF 4 429/394 58 −0.77 −1.05, −0.49 <.00001
RP 4 429/394 9 −0.52 −0.70, −0.35 <.00001
BP 4 429/394 56 −0.71 −0.99, −0.44 <.00001
GH 4 429/394 68 −0.79 −1.12, −0.47 <.00001
PCS 2 73/269 72 −1.17 −1.69, −0.64 <.0001
VT 4 429/394 85 −1.06 −1.55, −0.57 <.0001
SF 4 429/394 83 −0.90 −1.34, −0.46 <.0001
RE 4 429/394 76 −0.81 −1.18, −0.44 <.0001
MH 4 429/394 94 −1.28 −2.04, −0.51 .001
MCS 2 73/269 69 −1.60 −2.13, −1.08 <.00001
Abbreviation: SMD, standardized mean difference; DAS28, Disease Activity Score in 28 joints; VAS, visual analog scale; HAQ, Health Assessment Questionnaire; SF-36, the Medical Outcomes Study Short Form-36; PF, physical functioning; RP, role physical function; BP, body pain; GH, general health; PCS: physical components summary; VT, vitality; SF, social functioning; RE, role-emotional function; MH, mental health; MCS, mental components summary

| 289ZHANG et Al.
with depression or non-depression in patients with RA. A random-effects model was used, because heterogeneity analyses revealed substantial heterogeneity across studies (I2 = 80%). The results re-ported that a significant difference was observed between in RA patients with or without depression (SMD = 0.47, 95% CI 0.10-0.85, P = .01; Figure 2).
3.5 | Pain for patients with RA
Three studies1,18,21 involving 641 participants reported pain assessed by a visual analog scale (VAS); 395 patients had depression and 246 did not have depression. A random-effects model was used because the heterogeneity test showed an I2 of 88% among the studies.
However, no significant difference was observed between depres-sion and non-depression groups (SMD = 0.57, 95% CI − 0.03-1.17), P = .06; Figure 3).
3.6 | Functional disability for patients with RA
Three studies1,17,21 involving 355 participants reported functional dis-ability assessed by the Health Assessment Questionnaire (HAQ); 135 patients had depression and 220 did not have depression. A random-effects model was used because the heterogeneity test showed an I2 of 80% among the studies. The results of the meta-analysis found that there was no significant difference between depression and non-depression groups (SMD = 0.48, 95% CI − 0.03-0.99, P = .06; Figure 4).
F I G U R E 2 Forest plot of disease activity achievement in depression patients vs non-depression patients with rheumatoid arthritis
Study or subgroup
Chen et al [21]
Nas et al [18]
Uguz et al [17]
Zhang et al [13]
Zhang et al [1]
Total (95% CI)
Heterogeneity: Tau² = 0.14; Chi² = 20.21, df = 4 (P = .0005); I² = 80%
Test for overall effect: Z = 2.49 (P = 0.01)
Mean
4.28
4.96
4.8
5.2
4.2
SD
0.81
1.64
1.72
1.16
1.6
Total
62
317
29
34
44
486
Mean
3.92
4.22
5.25
3.64
3.5
SD
0.78
1.58
1.39
1.11
1.2
Total
50
104
54
26
116
350
Weight
20.5%
23.7%
18.7%
16.1%
21.0%
100.0%
IV, Random, 95% CI
0.45 [0.07, 0.83]
0.45 [0.23, 0.68]
–0.29 [–0.75, 0.16]
1.35 [0.78, 1.92]
0.53 [0.18, 0.88]
0.47 [0.10, 0.85]
Depression Non-depression Std. mean difference Std. mean difference
IV, Random, 95% CI
–4 –2 0 2 4Depression Non-depression
F I G U R E 3 Forest plot of pain achievement in depression patients vs non-depression patients with rheumatoid arthritis
Study or subgroup
Nas et al [18]
Zhang et al [13]
Zhang et al [1]
Total (95% CI)
Heterogeneity: Tau² = 0.24; Chi² = 16.71, df = 2 (P = .0002); I² = 88%
Test for overall effect: Z = 1.88 (P = 0.06)
Mean
47.39
6.18
56
SD
33.08
1.64
32.1
Total
317
34
44
395
Mean
43.17
3.73
45.2
SD
27.66
1.8
31.2
Total
104
26
116
246
Weight
37.0%
28.7%
34.4%
100.0%
IV, Random, 95% CI
0.13 [–0.09, 0.35]
1.41 [0.84, 1.99]
0.34 [–0.01, 0.69]
0.57 [–0.03, 1.17]
Depression Non-depression Std. mean difference Std. mean difference
IV, Random, 95% CI
–4 –2 0 2 4Depression Non-depressiom
F I G U R E 4 Forest plot of functional disability achievement in depression patients vs non-depression patients with rheumatoid arthritis
Study or subgroup
Chen et al [21]
Uguz et al [17]
Zhang et al [1]
Total (95% CI)
Heterogeneity: Tau² = 0.16; Chi² = 9.97, df = 2 (P = .007); I² = 80%
Test for overall effect: Z = 1.85 (P = .06)
Mean
1.48
1.48
0.9
SD
0.61
0.84
0.8
Total
62
29
44
135
Mean
1.07
1.56
0.4
SD
0.47
0.84
0.6
Total
50
54
116
220
Weight
33.8%
31.5%
34.7%
100.0%
IV, Random, 95% CI
0.74 [0.35, 1.12]
–0.09 [–0.55, 0.36]
0.75 [0.40, 1.11]
0.48 [–0.03, 0.99]
Depression Non-depression Std. mean Difference Std. mean Difference
IV, Random, 95% CI
–4 –2 0 2 4Depression Non-depression

290 | ZHANG et Al.
(A)
Study or subgroup
4.1.1 PF
Cui et al [19]
Mok et al [8]
Nas et al [18]
Zhang et al [1]Subtotal (95% CI)
Heterogeneity: Tau² = 0.05; Chi² = 7.20, df = 3 (P = .07); I² = 58%
Test for overall effect: Z = 5.34 (P < .00001)
4.1.2 RP
Cui et al [19]
Mok et al [8]
Nas et al [18]
Zhang et al [1]Subtotal (95% CI)
Heterogeneity: Tau² = 0.00; Chi² = 3.31, df = 3 (P = .35); I² = 9%
Test for overall effect: Z = 5.82 (P < .00001)
4.1.3 BP
Cui et al [19]
Mok et al [8]
Nas et al [18]
Zhang et al [1]Subtotal (95% CI)
Heterogeneity: Tau² = 0.04; Chi² = 6.86, df = 3 (P = .08); I² = 56%
Test for overall effect: Z = 5.07 (P < .00001)
4.1.4 GH
Cui et al [19]
Mok et al [8]
Nas et al [18]
Zhang et al [1]Subtotal (95% CI)
Heterogeneity: Tau² = 0.07; Chi² = 9.40, df = 3 (P = .02); I² = 68%
Test for overall effect: Z = 4.79 (P < .00001)
4.1.5 PCS
Mok et al [8]
Zhang et al [1]Subtotal (95% CI)
Heterogeneity: Tau² = 0.10; Chi² = 3.55, df = 1 (P = .06); I² = 72%
Test for overall effect: Z = 4.37 (P < .0001)
Test for subgroup differences: Chi² = 7.28, df = 4 (P = .12), I² = 45.0%
Mean
65.1
34.8
37.84
41.5
66.6
11.2
29.91
8
60.5
26.4
36.49
29.4
40.6
17.8
36.95
29.9
22.2
27.2
SD
19.9
22
27.74
31.4
26
22.7
33.85
24
18.4
16.9
21.47
26.2
13.4
15
21.09
17.2
14.8
18.1
Total
39
29
317
44429
39
29
317
44429
39
29
317
44429
39
29
317
44429
29
4473
Mean
74.8
61.7
55.57
64
75.1
42.5
45.33
26.7
70.9
49
47.87
49.2
52.1
43
47.27
46.7
50.4
46.7
SD
21.6
22
31.13
27.5
19.6
38.5
33.15
41.7
16
20.3
24.25
29.3
17.6
22.2
21.47
20.4
20.1
22.3
Total
21
153
104
116394
21
153
104
116394
21
153
104
116394
21
153
104
116394
153
116269
Weight
17.0%
22.6%
34.5%
25.9%100.0%
10.4%
17.4%
49.4%
22.8%100.0%
16.5%
22.5%
35.1%
25.9%100.0%
18.3%
23.5%
32.3%
26.0%100.0%
47.8%
52.2%100.0%
IV, Random, 95% CI
–0.47 [–1.00, 0.07]
–1.22 [–1.63, –0.80]
–0.62 [–0.84, –0.39]
–0.78 [–1.14, –0.42]–0.77 [–1.05, –0.49]
–0.35 [–0.88, 0.18]
–0.85 [–1.26, –0.45]
–0.46 [–0.68, –0.23]
–0.49 [–0.84, –0.14]–0.52 [–0.70, –0.35]
–0.58 [–1.12, –0.04]
–1.14 [–1.55, –0.72]
–0.51 [–0.74, –0.29]
–0.69 [–1.05, –0.34]–0.71 [–0.99, –0.44]
–0.76 [–1.31, –0.21]
–1.18 [–1.60, –0.77]
–0.49 [–0.71, –0.26]
–0.85 [–1.21, –0.49]–0.79 [–1.12, –0.47]
–1.45 [–1.87, –1.03]
–0.91 [–1.28, –0.55]–1.17 [–1.69, –0.64]
Depression Non-depression Std. mean difference Std. mean difference
IV, Random, 95% CI
–4 –2 0 2 4Depressiom Non-depression
F I G U R E 5 A Forest plot of health-related quality of life achievement in depression patients vs nondepression patients with rheumatoid arthritis. A: Four domains of PCS (PF, RP, BP, and GH) and PCS. Abbreviations: PCS, physical component summary; PF, physical function; RP, role physical function; BP, body pain; GH, general health. B Forest plot of health-related quality of life achievement in depression patients vs nondepression patients with rheumatoid arthritis. B: Four domains of MCS (VT, SF, RE and MH) and MCS. Abbreviations: MCS, mental component summary; VT, vitality; SF, social function; RE, role-emotional function; MH, mental health

| 291ZHANG et Al.
(B)
Study or subgroup
5.1.1 VT
Cui et al [19]
Mok et al [8]
Nas et al [18]
Zhang et al [1]Subtotal (95% CI)
Heterogeneity: Tau² = 0.21; Chi² = 20.62, df = 3 (P = .0001); I² = 85%
Test for overall effect: Z = 4.23 (P < .0001)
5.1.2 SF
Cui et al [19]
Mok et al [8]
Nas et al [18]
Zhang et al [1]Subtotal (95% CI)
Heterogeneity: Tau² = 0.16; Chi² = 17.30, df = 3 (P = .0006); I² = 83%
Test for overall effect: Z = 3.98 (P < .0001)
5.1.3 RE
Cui et al [19]
Mok et al [8]
Nas et al [18]
Zhang et al [1]Subtotal (95% CI)
Heterogeneity: Tau² = 0.10; Chi² = 12.25, df = 3 (P = .007); I² = 76%
Test for overall effect: Z = 4.30 (P < .0001)
5.1.4 MH
Cui et al [19]
Mok et al [8]
Nas et al [18]
Zhang et al [1]Subtotal (95% CI)
Heterogeneity: Tau² = 0.56; Chi² = 48.15, df = 3 (P < .00001); I² = 94%
Test for overall effect: Z = 3.28 (P = .001)
5.1.5 MCS
Mok et al [8]
Zhang et al [1]Subtotal (95% CI)
Heterogeneity: Tau² = 0.10; Chi² = 3.21, df = 1 (P = .07); I² = 69%
Test for overall effect: Z = 6.04 (P < .00001)
Test for subgroup differences: Chi² = 6.70, df = 4 (P = .15), I² = 40.3%
Mean
35.3
22.1
39.82
42.2
55
34.6
45.38
42.9
48.2
3.4
37.01
22
44.5
34.5
48.23
53.8
22.6
40.2
SD
20.1
17.5
19.15
14.1
17.9
24.5
24.83
27
21.1
18.6
36.59
39.3
19
16.4
20.11
13.1
14.8
15.5
Total
39
29
317
44429
39
29
317
44429
39
29
317
44429
39
29
317
44429
29
4473
Mean
47.1
56.5
53.79
60.7
67
71.8
57.71
69.4
62.4
56.2
59.93
57.8
56.6
72.3
62.42
71.9
59.9
64.9
SD
18.2
21
24.01
14.5
13.4
26.5
27.67
24.9
19.7
41.8
65.87
47
16.1
15.4
23.82
13.1
20.5
19.1
Total
21
153
104
116394
21
153
104
116394
21
153
104
116394
21
153
104
116394
153
116269
Weight
22.0%
24.3%
28.2%
25.5%100.0%
21.1%
24.3%
28.9%
25.7%100.0%
19.7%
23.8%
30.5%
26.0%100.0%
23.8%
24.5%
26.4%
25.3%100.0%
47.6%
52.4%100.0%
IV, Random, 95% CI
–0.60 [–1.14, –0.06]
–1.67 [–2.10, –1.24]
–0.68 [–0.91, –0.46]
–1.28 [–1.65, –0.90]–1.06 [–1.55, –0.57]
–0.72 [–1.27, –0.17]
–1.41 [–1.84, –0.99]
–0.48 [–0.71, –0.26]
–1.03 [–1.40, –0.67]–0.90 [–1.34, –0.46]
–0.68 [–1.22, –0.13]
–1.34 [–1.77, –0.92]
–0.50 [–0.73, –0.28]
–0.79 [–1.15, –0.43]–0.81 [–1.18, –0.44]
–0.66 [–1.21, –0.12]
–2.42 [–2.89, –1.95]
–0.67 [–0.90, –0.45]
–1.38 [–1.75, –1.00]–1.28 [–2.04, –0.51]
–1.88 [–2.33, –1.44]
–1.35 [–1.73, –0.97]–1.60 [–2.13, –1.08]
Depression Non-depression Std. mean difference Std. mean difference
IV, Random, 95% CI
–4 –2 0 2 4Depression Non-depression
F I G U R E 5 Continued

292 | ZHANG et Al.
3.7 | Quality of life for patients with RA
As shown in Figure 5, 4 studies1,8,18,19 involving 823 participants were included in this review for PF, RP, BP, GH, PCS, VT, SF, RE, MH, and MCS of HRQoL dimensions with RA. They were all significantly lower in every domain, with an overall SMD of −0.77 for PF (95% CI −1.05 to −0.49), −0.52 for RP (95% CI −0.70 to −0.35), −0.71 for BP (95% CI −0.99 to −0.44), −0.79 for GH (95% CI −1.12 to −0.47), −1.17 for PCS (95% CI −1.69 to −0.64), −1.06 for VT (95% CI −1.55 to −0.57), −0.90 for SF (95% CI −1.34 to −0.46), −0.81 for RE (95% CI −1.18 to −0.44), −1.28 for MH (95% CI −2.04 to −0.51), and −1.60 for MCS (95% CI −2.13 to −1.08). A random-effect model was used to estimate the overall effect instead of a fixed-effect model because of the heterogeneity among aspects.
3.8 | Sensitivity analyses and publication bias
Sensitivity analyses showed that the results were unchanged by serially excluding each study. For all comparisons between patients with and without depression, the omission of any study made no significant difference, indicating the stability of our meta-analysis. Assessment of publication bias suggested no significant publication bias according to Egger's test (Egger: t = −1.86, P = .143).
4 | DISCUSSION
To our knowledge, this is the first meta-analysis to explore the impact of depression on pain, disease activity, functional disability and quality of life in patients with RA. Depression is common in clinical practice, especially in RA; prevalence estimates for depres-sion in RA range between 9.5% and 41.5%.3 This vast inter-study difference was previously attributed to multiple factors, including study quality, unclear definition of depression, diverse screening strategies used across studies.3 Depression is believed to be a use-ful target for interventions aimed at improving subjective health and quality of life in patients with RA. Likewise, depression gener-ally worsens outcomes of treatments, leading to increased pain, high disease activity,2 increased levels of functional disability,7 and reduced HRQoL.10 In RA, the association between depression and treatment outcomes such as pain, disease activity, functional disability and quality of life has not been widely explored. Some studies reported that depression was associated with a poorer dis-ease activity outcome22; however, another study found that de-pression was not associated with functional disability.17 Thus, we performed this meta-analysis to evaluate the impact of depression on pain, disease activity, functional disability and quality of life in patients with RA.
This meta-analysis showed that RA patients with depression tended to have higher disease activity and lower quality of life than the patients without depression. Interestingly, the results showed there was no significant difference between patients with
and without depression in pain and functional disability. It may be explained by several factors, such as the small number of studies included in the analysis, which may limit the power of our calcula-tions, type of included study, different measures used across the studies and limitations of insufficient data provided. It is important to better know patients’ depression patterns and their behaviors, as well as to provide supportive measures to lower their disease activity and improve quality of life. Our previous study suggested there were significant relationships among education, pain, disease activity, quality of life, and depression in Chinese patients with RA.1,23 The results indicated that it is necessary for rheumatolo-gists and nurses to have psychological evaluations and formulate an integrated approach for managing mental health in patients with RA. More recently, a meta-analysis found that various nurs-ing interventions, including exercise training, medication guide, health education and psychotherapy may have positive effects on depression of patients with RA.24 Knittle et al25 concluded that psychological interventions are beneficial for many patients with RA, particularly when it comes to increasing physical activity lev-els. Intervention techniques derived from self-regulation theory appear to play a role in reducing depressive symptoms and anxiety among patients with RA.
However, this study has some limitations. First, the data were derived from studies that used different designs and involved dif-ferent groups of patients (eg from different countries), which could result in heterogeneity among the studies; as a result, random-effect analyses were used, resulting in wider CIs and relatively more weight being given to smaller studies. Second, a substantial amount of the heterogeneity among the studies remained unexplained by the vari-ables examined, but all results were confirmed in sensitivity analyses and no publication bias was found in our study. Third, this meta-anal-ysis was based mainly on cross-sectional data and the number of articles was relatively small, which showed that more high-quality prospective studies with larger sample sizes are required to be car-ried out.
5 | CONCLUSION
This meta-analysis suggested that RA patients with depression tended to have higher disease activity and lower quality of life than the patients without depression.
ACKNOWLEDG EMENTSThe authors would like to thank all of the subjects for completing the article. This study was supported by Grants from the Chinese National Natural Science Foundation (Grant no. 71904118).
CONFLIC T OF INTERE S TThe authors declared that they have no competing interests.
ORCIDLijuan Zhang https://orcid.org/0000-0003-4341-7511

| 293ZHANG et Al.
R E FE R E N C E S 1. Zhang L, Xia Y, Zhang Q, et al. The correlations of socioeconomic
status, disease activity, quality of life, and depression/anxiety in Chinese patients with rheumatoid arthritis. Psychol Health Med. 2017;22:28-36.
2. Silva CFR, Duarte C, Ferreira RJO, Santos E, da Silva JAP. Depression, disability and sleep disturbance are the main explanatory factors of fatigue in rheumatoid arthritis: a path analysis model. Clin Exp Rheumatol. 2019.
3. Matcham F, Rayner L, Steer S, Hotopf M. The prevalence of depres-sion in rheumatoid arthritis: a systematic review and meta-analysis. Rheumatology (Oxford). 2013;52:2136-2148.
4. Zyrianova Y, Kelly BD, Gallagher C, et al. Depression and anxiety in rheumatoid arthritis: the role of perceived social support. Ir J Med Sci. 2006;175:32-36.
5. Chancay MG, Guendsechadze SN, Blanco I. Types of pain and their psychosocial impact in women with rheumatoid arthritis. Womens Midlife Health. 2019;5:3.
6. Cheon YH, Lee SG, Kim M, et al. The association of disease activ-ity, pro-inflammatory cytokines, and neurotrophic factors with de-pression in patients with rheumatoid arthritis. Brain Behav Immun. 2018;73:274-281.
7. Ji J, Zhang L, Zhang Q, et al. Functional disability associated with disease and quality-of-life parameters in Chinese patients with rheumatoid arthritis. Health Qual Life Outcomes. 2017;15:89.
8. Mok CC, Lok EY, Cheung EF. Concurrent psychiatric disorders are associated with significantly poorer quality of life in patients with rheumatoid arthritis. Scand J Rheumatol. 2012;41:253-259.
9. Li L, Cui Y, Chen S, et al. The impact of systemic sclerosis on health-related quality of life assessed by SF-36: a systematic review and meta-analysis. Int J Rheum Dis. 2018;21:1884-1893.
10. Matcham F, Scott IC, Rayner L, et al. The impact of rheumatoid arthritis on quality-of-life assessed using the SF-36: a systematic review and meta-analysis. Semin Arthritis Rheum. 2014;44:123-130.
11. Stroup DF, Berlin JA, Morton SC, et al. Meta-analysis of obser-vational studies in epidemiology: a proposal for reporting. Meta-analysis of Observational Studies in Epidemiology (MOOSE) group. JAMA. 2000;283:2008-2012.
12. Mata DA, Ramos MA, Bansal N, et al. Prevalence of depression and depressive symptoms among resident physicians: a systematic re-view and meta-analysis. JAMA. 2015;314:2373-2383.
13. Zhang L, Fu T, Yin R, Zhang Q, Shen B. Prevalence of depression and anxiety in systemic lupus erythematosus: a systematic review and meta-analysis. BMC Psychiatry. 2017;17:70.
14. Higgins JP, Thompson SG, Deeks JJ, Altman DG. Measuring incon-sistency in meta-analyses. BMJ. 2003;327:557-560.
15. Sterne JA, Egger M. Funnel plots for detecting bias in meta-analysis: guidelines on choice of axis. J Clin Epidemiol. 2001;54:1046-1055.
16. Egger M, Davey Smith G, Schneider M, Minder C. Bias in meta-anal-ysis detected by a simple, graphical test. BMJ. 1997;315:629-634.
17. Uguz F, Akman C, Kucuksarac S, Tufekci O. Anti-tumor necrosis fac-tor-alpha therapy is associated with less frequent mood and anxi-ety disorders in patients with rheumatoid arthritis. Psychiatry Clin Neurosci. 2009;63:50-55.
18. Nas K, Sarac AJ, Gur A, et al. Psychological status is associated with health related quality of life in patients with rheumatoid arthritis. J Back Musculoskelet Rehabil. 2011;24:95-100.
19. Cui X, Wang G, Wei X. The analysis of quality of life and correla-tion factor about rheumatic arthritis patients. Guide China Med. 2009;7:46-47.
20. Zhang Y, Ci C, Wang X, Megn S, Su Y. An investigation of depression and related factors in rheumatoid arthritis patients. Acta Acad Med Weifang. 2017;39:233-235.
21. Chen X, Yang M, Wang T, Fu R, Zeng X. Analysis on depression and the related factors in patients with rheumatoid arthritis. Chin J Clinicians (Electronic Edition). 2013;7:2809-2812.
22. Matcham F, Ali S, Irving K, Hotopf M, Chalder T. Are depression and anxiety associated with disease activity in rheumatoid arthritis? A prospective study. BMC Musculoskelet Disord. 2016;17:155.
23. Guo G, Fu T, Yin R, et al. Sleep quality in Chinese patients with rheu-matoid arthritis: contributing factors and effects on health-related quality of life. Health Qual Life Outcomes. 2016;14:151.
24. Zhou B, Li G, Zhang Y, Zhao Z. Effects of nursing interventions on depression of patients with rheumatoid arthritis: a meta-analysis of randomized controlled trials. Arch Psychiatr Nurs. 2016;30:717-721.
25. Knittle K, Maes S, de Gucht V. Psychological interventions for rheu-matoid arthritis: examining the role of self-regulation with a sys-tematic review and meta-analysis of randomized controlled trials. Arthritis Care Res (Hoboken). 2010;62:1460-1472.
How to cite this article: Zhang L, Cai P, Zhu W. Depression has an impact on disease activity and health-related quality of life in rheumatoid arthritis: A systematic review and meta-analysis. Int J Rheum Dis. 2020;23:285–293. https ://doi.org/10.1111/1756-185X.13774

294 | wileyonlinelibrary.com/journal/apl Int J Rheum Dis. 2020;23:294–301.© 2019 Asia Pacific League of Associations for Rheumatology and John Wiley & Sons Australia, Ltd
Received: 24 June 2019 | Revised: 3 November 2019 | Accepted: 6 November 2019
DOI: 10.1111/1756-185X.13756
O R I G I N A L A R T I C L E
Mindfulness is associated with sleep quality among patients with fibromyalgia
Michelle Park1 | Yuan Zhang2 | Lori Lyn Price3,4 | Raveendhara R. Bannuru1,5,6 | Chenchen Wang1,6
1Tufts University School of Medicine, Boston, MA, USA2Susan and Alan Solomont School of Nursing, University of Massachusetts Lowell, Lowell, MA, USA3Institute for Clinical Research and Health Policy Studies, Tufts Medical Center, Boston, MA, USA4Tufts Clinical and Translational Science Institute, Tufts University, Boston, MA, USA5Center for Treatment Comparison and Integrative Analysis, Tufts Medical Center, Boston, MA, USA6Center for Complementary and Integrative Medicine & Division of Rheumatology, Tufts Medical Center, Tufts University School of Medicine, Boston, MA, USA
CorrespondenceChenchen Wang, Center for Complementary & Integrative Medicine, Division of Rheumatology, Tufts Medical Center, 800 Washington Street, Box 406, Boston, MA 02111, USA.Email: [email protected]
Funding informationThe study was supported by the National Center for Complementary and Integrative Health of the National Institutes of Health (R01AT006367, K24AT007323, and K23AT009374) and the National Center for Research Resources, National Institutes of Health (UL1 RR025752) and the National Center for Advancing Translational Sciences, National Institutes of Health (UL1TR000073 and UL1TR001064). The contents of this manuscript are solely the responsibility of the authors and do not necessarily represent the official views of the NCCIH. The investigators are solely responsible for the content of the manuscript and the decision to submit for publication.
AbstractAim: Previous studies suggest higher mindfulness may be associated with better sleep quality in people with chronic pain conditions. However, the relationship be-tween mindfulness and sleep in fibromyalgia patients, who commonly suffer from sleep problems, remains unstudied. We examined the relationship between mindful-ness and sleep, and how this relationship may be mediated by depression, anxiety, and pain interference in fibromyalgia patients.Method: We performed a cross-sectional analysis of baseline data from a randomized trial in fibromyalgia patients. We measured mindfulness (Five Facet Mindfulness Questionnaire), sleep quality and disturbance (Pittsburgh Sleep Quality Index [PSQI], PROMIS Sleep Disturbance [PROMIS-SD]), pain interference (PROMIS Pain Interference), and anxiety and depression (Hospital Anxiety and Depression Scale). Pearson correlations were used to examine associations among mindfulness and sleep quality and disturbance. Mediation analysis was conducted to assess whether pain interference, depression, and anxiety mediated the relationship between mind-fulness and sleep.Results: A total of 177 patents with fibromyalgia were included (93% female; mean age 52 ± 12 years; body mass index 30 ± 7 kg/m2; 59% White). Higher mindfulness was associated with better sleep quality and less sleep disturbance (PSQI r = −0.23, P = .002; PROMIS-SD r = −.24, P = .002) as well as less pain interference (r = −.31, P < .0001), anxiety (r = −.58, P < .001), and depression (r = −0.54, P < .0001). Pain interference, depression, and anxiety mediated the association between mindfulness and sleep quality and disturbance.Conclusion: Higher mindfulness is associated with better sleep in patients with fi-bromyalgia, with pain interference, depression, and anxiety mediating this relation-ship. Longitudinal studies are warranted to examine the potential effect of cultivating mindfulness on sleep in fibromyalgia.
K E Y W O R D S
anxiety, chronic pain, depression, fibromyalgia, mediation, sleep

| 295PARK et Al.
1 | INTRODUC TION
Over 90% of patients with fibromyalgia report having problems with sleep, making it one of the central concerns of patients with the condition.1,2 The impact of poor sleep is all-encompassing; it affects mood, quality of life, work productivity, and the ability to cope with pain.3-5 Moreover, individuals with fibromyalgia who have sleep problems also tend to experience more pain, disability, and emotional stress than those who do not have sleep problems.2,6 Although the mechanisms leading to poor sleep in fibromyalgia are still under study, many of the features of fibromyalgia such as pain and depression are known to contribute to poor sleep quality.1,7 Conversely, sleep problems likely interact with clinical dimensions such as depression and anxiety to have a synergistic negative impact on well-being in fibromyalgia patients.5,8 In order to better under-stand the complex nature of sleep in fibromyalgia, further inves-tigation of sleep in relation to overall psychological functioning is essential.
Growing evidence over the past decades has identified mindful-ness as a contributor to better psychological and physical health.9-11 Mindfulness is a characteristic defined as the ability to observe, de-scribe, or be aware of present moment experiences without judgment or reactivity. Mindfulness has been linked to better psychological health because it promotes increased attention and emotional regu-lation, and an enhanced awareness of self.12 In fibromyalgia, studies have demonstrated that patients with higher mindfulness experience better psychological health, less pain interference in daily activities, better coping with pain, and lower overall impact of symptoms.13,14 Moreover, prior literature has demonstrated that higher mindfulness is associated with better sleep quality in chronic conditions such as human immunodeficiency virus, multiple sclerosis, and asthma.15-17 However, the relationship between mindfulness and sleep in fibro-myalgia remains unknown. Elucidating this relationship in fibromyal-gia patients will inform our understanding of the complex interplay of clinical dimensions of the condition.
Recent literature has further characterized mindfulness as composed of 5 facets: observing, describing, acting with aware-ness, non-judging, and non-reacting.18,19 Stronger levels of the describing, acting with awareness, and non-judging facets of mind-fulness have consistently been associated with better psycholog-ical health.10,11,13,20-23 A study in fibromyalgia patients showed that these 3 facets are associated with less anxiety, depression, stress, and better quality of life in these patients.14 It is unknown whether the same facets of mindfulness may be associated with better sleep.
The primary objective of this study was to examine the asso-ciation between mindfulness and sleep quality and disturbance in the context of fibromyalgia. Further, we evaluated the potential me-diating effects of pain interference, anxiety, and depression in the association between mindfulness and sleep. We hypothesized that higher levels of mindfulness would be associated with better sleep quality in fibromyalgia, and this relationship may be mediated by pain interference, anxiety, and depression.
2 | METHODS
2.1 | Study design
We conducted a cross-sectional secondary analysis of baseline data from a randomized controlled trial comparing Tai Chi and aerobic exercise for patients with fibromyalgia. All data were collected at Tufts Medical Center, an urban academic tertiary hospital in Boston, Massachusetts, USA. A detailed protocol was previously published in reference to recruitment, intervention, and follow-up procedures.24
Participants were recruited through flyers and advertisements in local media and the rheumatology clinic at Tufts Medical Center, which identified and referred potential participants. Interested re-spondents received information about the study and completed a preliminary screening over the phone. Respondents were invited to a formal screening at the clinic if they met eligibility criteria, in-cluding: (a) being 21 years or older and (b) fulfilling the American College of Rheumatology (ACR) 1990 classification criteria and 2010 diagnostic criteria for fibromyalgia.25,26 Respondents were excluded if they: (a) had participated in Tai Chi or other similar types of mind-body approaches such as qigong or yoga in the past 6 months; (b) had serious medical conditions limiting ability to participate in Tai Chi or aerobic exercise; (c) had diagnosed medical conditions known to contribute to fibromyalgia symptomatology, such as thyroid disease, inflammatory arthritis, systemic lupus erythematosus, rheumatoid arthritis, myositis, vasculitis, or Sjögren's syndrome; (d) were unable to pass the Physical Activity Readiness Questionnaire; (e) scored below 24 on the Mini-Mental Status Examination27; (f) planned to re-locate from the region during the trial period; (g) verbally confirmed they were pregnant or planned to become pregnant during the study period; or (h) did not speak English. Signed informed consent was ob-tained from each study participant. All randomized participants who completed the Five Facet Mindfulness Questionnaire (FFMQ) were included in this study. The study was approved by the Institutional Review Board at Tufts Medical Center (approval #9945).
2.2 | Measures
2.2.1 | Mindfulness
Mindfulness was measured using the FFMQ, a validated, 39-item self-report questionnaire that measures the ability to be mindful of one's daily life.18,28 Items are rated on a 5-point Likert-like scale. Total FFMQ score ranges from 39-195 and is composed of 5 subscales that measure the 5 facets of mindfulness: (a) observing (8 items, range 8-40), defined as attending to internal or external experiences, such as sensations, thoughts, and emotions; (b) describing (8 items, range 8-40), defined as conveying internal experiences with words; (c) acting with awareness (8 items, range 8-40), defined as attending to activities in the present moment; (d) non-judging of inner expe-rience (8 items, range 8-40), defined as applying a non-evaluative stance toward thoughts and feelings; and (e) non-reactivity to inner

296 | PARK et Al.
experience (7 items, range 7-35), defined as allowing thoughts and feelings to flow without becoming engrossed in them. Higher scores indicate higher levels of mindfulness.
2.2.2 | Fibromyalgia impact
Fibromyalgia impact was measured using the Revised Fibromyalgia Impact Questionnaire (FIQR). The FIQR is a 21-item, validated self-report instrument that assesses overall impact of fibromyalgia symp-toms including pain, function, fatigue, mental health, and overall well-being over the past 7 days.29 Total scores, calculated from the 3 subscales, range from 0-100. Higher scores indicate greater impact of fibromyalgia symptoms.
2.2.3 | Sleep quality and disturbances
Sleep quality and disturbance was assessed by the Pittsburg Sleep Quality Index (PSQI).30 This 19-item scale assesses seven com-ponents of sleep quality and disturbances during the past month, including subjective sleep quality, sleep latency, sleep duration, habitual sleep efficiency, sleep disturbances, use of sleeping medi-cation, and daytime dysfunction. Each component is assessed on a 4-point Likert scale with a range in global score from 0 to 21. Higher scores indicate worse sleep quality.
Sleep quality and disturbance was also measured using the Participant-Reported Outcomes Measurement Information System (PROMIS) Adult Short Form: Sleep Disturbance (PROMIS-SD), 1 of 7 subscales comprising the PROMIS static short forms.31 The 8-item PROMIS-SD measure evaluates overall sleep quality, disturbances, and satisfaction over the past 7 days on 5-point scales. Raw scores were converted into t scores ranging from 28.9 to 76.5, with higher scores indicating greater sleep disturbance.
The PSQI is the most widely used self-report instrument for measuring sleep quality and disturbance, although it has been re-ported to have relatively poor ability to discriminate between lower sleep disturbance scores.32 PROMIS-SD, which was developed using classical test theory methods and item response theory analyses, is thought to have greater measurement precision than the PSQI.32 In this study, we used both measures for a more robust assessment of sleep quality and disturbance.
2.2.4 | Pain interference
Pain interference was assessed using the PROMIS Adult Short Form 6b: Pain Interference (PROMIS-PI), which measures the degree to which pain limits or interferes with physical, mental, emotional, and social activities in the past 7 days.33 The instrument consists of 6 items measured on a 5-point Likert scale and has high validity and re-liability. Raw scores were converted into t scores ranging from 41.0 to 78.3, with higher scores representing worse pain impact.
2.2.5 | Depression and anxiety
Levels of depression and anxiety were assessed using the Hospital Anxiety and Depression Scale (HADS), a validated, 14-item self-re-port questionnaire.34 The questionnaire contains 2 7-item subscales with scores ranging from 0-21. The two subscales are HADS-A for anxiety and HADS-D for depression. Higher scores reflect greater symptom severity.
2.3 | Statistical analysis
Data were checked for normality of distribution. Pearson correla-tions were used to assess associations of mindfulness with sleep quality and disturbance, pain interference, anxiety, and depression.
For the mediation analysis, the FFMQ scale was inverted to fa-cilitate interpretation such that higher values indicated worse mind-fulness. Linear regression models were used to test whether pain interference, depression, and anxiety mediated the association be-tween mindfulness and PSQI, and the association between mind-fulness and PROMIS-SD, following the criteria outlined below. Each potential mediating variable was introduced into a single mediator model to assess its effect after controlling for age, sex, race, and education. Prior to data analysis, these variables were determined to be the major demographic factors that may be associated with sleep, pain, depression, and anxiety in patients with fibromyalgia.
Mediation was determined according to the implementation of Baron and Kenny criteria.35 Partial mediation was fulfilled if: (a) the causal variable (mindfulness) was significantly associated with the outcome variable (PSQI or PROMIS-SD) (path c); (b) the causal vari-able (mindfulness) was significantly associated with the proposed mediator (pain interference, depression, or anxiety) (path a); and (c) the proposed mediator was significantly associated with the out-come variable (PSQI or PROMIS-SD) after adjusting for the causal variable (mindfulness) (path b) (Figures 1 and 2). The amount of me-diation, or indirect effect, was calculated as a*b. The Sobel test was used to test the significance of the indirect effect. All analyses were performed using SAS 9.4 (SAS Institute Inc), and P values less than .05 were considered statistically significant.
3 | RESULTS
Table 1 shows descriptive characteristics of the 177 patients with fibromyalgia included in our analysis. Participants had a mean age of 52.0 years, were 93% female, 59% White, 38% college gradu-ates, and had an average body mass index of 30.1 kg/m2. The mean disease duration was 13.1 years. The mean total mindfulness score (FFMQ) was 131.3, and mean scores of the 5 individual facets of mindfulness ranged from 21.7 to 29.5.
Table 2 illustrates the associations between mindfulness and sleep, pain interference, and psychological health measures. All significant associations were in the expected direction of higher

| 297PARK et Al.
mindfulness correlating with better health outcomes. Specifically, higher total mindfulness was significantly associated with better sleep (PSQI r = −.23, P = .002; PROMIS-SD r = −.24, P = .002), less pain interference (PROMIS-PI r = −.31, P < .001), and better psy-chological health (HADS-D r = −.54, P < .0001; HADS-A r = −.58, P < .001).
Of the five facets, the describing, acting with awareness, and non-judging facets were significantly associated with all measures (PSQI, PROMIS-SD, PROMIS-PI, HADS-D, HADS-A). The non-react-ing facet was significantly associated with all measures except PSQI. In contrast, the observing facet was only significantly associated with depression (HADS-D).
3.1 | Mediating effects of pain interference, depression, and anxiety
Figure 1 illustrates the conceptual models and the results of the mediation analyses on the association between mindfulness and sleep quality and disturbance (PSQI). Mindfulness was significantly
correlated with sleep (path c: β = .04; P = .01), establishing a signifi-cant effect that may be mediated (Figure 1A). The criteria for partial mediation as outlined by Baron and Kenny were fulfilled with pain interference as the mediating variable, such that: (a) mindfulness was significantly correlated with pain interference (path a: β = 0.08; P = .0002); and (b) pain interference was significantly correlated with sleep (path b: β = 0.20; P = .0002) after adjusting for age, sex, race, and education (Figure 1B). The direct effect of mindfulness on sleep, controlling for pain interference, was β = 0.02, P = .14 (path c’). Since the effect size of path c’ was not 0, partial mediation by pain interfer-ence was fulfilled. The indirect effect of mediation (a*b = 0.015) was significant (Sobel Z = 2.71; P = .007). Thus, the relationship between mindfulness and sleep quality and disturbance as measured by PSQI was significantly mediated by pain interference.
Based on these criteria, anxiety and depression were also par-tial mediators of the effect of mindfulness on sleep quality and dis-turbance (PSQI) (Figure 1C-D). Similarly, the relationship between mindfulness and sleep quality and disturbance as measured by PROMIS-SD was also significantly mediated by all 3 proposed medi-ators: pain interference, anxiety, and depression (Figure 2).
F I G U R E 1 (A) Total effect (path c) of mindfulness on sleep disturbance and quality, measured by Pittsburgh Sleep Quality Index (PSQI). (B-D) Effect of mindfulness on the mediator (path a) and effect of the mediator on sleep, controlling for mindfulness (path b). Direct effect (path c’) of mindfulness on sleep, ie total effect adjusted for effects of pain interference (B), depression (C) and anxiety (D). All analyses are controlled for age, sex, race, and education. *P < .05, **P < .01, ***P < .001. Mindfulness is measured by the Five Facet Mindfulness Questionnaire, sleep quality and disturbance by PSQI, pain interference by PROMIS Pain Interference, depression and anxiety by the Hospital Anxiety and Depression Scale. †Indicates significance of the indirect effect at the level of P < .05 based on the Sobel test

298 | PARK et Al.
In summary, higher mindfulness was associated with less pain in-terference, less anxiety, and less depression, which in turn were asso-ciated with better sleep quality. Mediation results were maintained when using 2 different measures of sleep quality and disturbance.
4 | DISCUSSION
This is the first study to investigate the relationship between mind-fulness and sleep among a large and diverse sample of patients with fibromyalgia. We found that higher mindfulness was associated with better sleep quality and less sleep disturbance in patients with fibro-myalgia. We further demonstrated that pain interference, depres-sion, and anxiety mediated the relationship between mindfulness and sleep in fibromyalgia patients.
Our results align with evidence showing higher mindfulness is associated with better sleep quality in males living with HIV, post-menopausal women with insomnia, post-treatment patients with cancer, and patients with asthma and multiple sclerosis.15-17,36,37 Our findings are also consistent with studies examining the effect of
mindfulness-cultivating interventions on sleep quality in fibromyal-gia patients. Such interventions have been shown to improve sleep quality, as well as reduce symptoms of depression, anxiety, and pain interference.38-42 Understanding the factors that may influence the effect of mindfulness will enhance the development of therapies that aim to cultivate mindfulness in patients with fibromyalgia and their implementation into clinical care.
Of the five facets of mindfulness, higher levels of three facets, describing, acting with awareness, and non-judging, were associ-ated with better sleep quality, less pain interference, and fewer depressive and anxiety symptoms. Higher levels of the describing, acting with awareness, and non-judging facets have previously been demonstrated to be associated with better psychological health in chronic pain and other clinical and healthy populations.10,11,13,20-23 However, this is the first study to our knowledge to show that these 3 facets of mindfulness also correlate with better sleep quality and less sleep disturbance. This supports the conceptualization of mind-fulness as being composed of distinct but related components, in which related components may have similar therapeutic value for health.
F I G U R E 2 (A) Total effect (path c) of mindfulness on sleep quality and disturbance, measured by PROMIS Sleep Disturbance (PROMIS-SD). (B-D) Effect of mindfulness on the mediator (path a) and effect of the mediator on sleep, controlling for mindfulness (path b). Direct effect (path c’) of mindfulness on sleep, ie total effect adjusted for effects of pain interference (B), depression (C), and anxiety (D). All analyses are controlled for age, sex, race, and education. *P < .05, **P < .01, ***P < .001. Mindfulness is measured by the Five Facet Mindfulness Questionnaire, sleep quality and disturbance by PROMIS-SD, pain interference by PROMIS Pain Interference, depression and anxiety by the Hospital Anxiety and Depression Scale. †Indicates significance of the indirect effect at the level of P < .05 based on the Sobel test

| 299PARK et Al.
In addition, our mediation analyses indicate that higher mindful-ness is associated with less pain interference and fewer depressive and anxiety symptoms, which in turn relate to better sleep quality and less sleep disturbance. The individual relationships that compose these mediation models are conceptually supported by previous ev-idence. The positive effects of mindfulness on pain interference, depression, and anxiety have been recognized in studies of patients with fibromyalgia.14,43 Of note, higher mindfulness can attenuate the subjective experience of pain and protect against psychological symptoms. It is also supported that greater pain interference, de-pression, and anxiety contribute to poor sleep quality in fibromyal-gia.1,5,44 These relationships among mindfulness, anxiety, depression, pain interference, and sleep reveal a complex interplay of clinical and psychosocial parameters that contribute to sleep problems in fibro-myalgia. This suggests that symptom-specific treatment targeting poor sleep alone in fibromyalgia may be ineffective. Therefore, a more holistic approach to patient evaluation assessing psychosocial and physical health is warranted. Taken together, clinicians may find
it most effective to devise a multimodal therapeutic strategy that influences multiple clinical characteristics, such as mindfulness and depression, in order to improve sleep in fibromyalgia.
Our findings should be interpreted with caution due to some limitations. First, even though previous evidence supports the con-ceptual models of mediation presented, the cross-sectional nature of the study precludes definitive conclusions about the direction of associations among variables.5,43 Future longitudinal studies are warranted to further disentangle these relationships. Second, aver-age FFMQ score was higher in this population than in other samples of patients with chronic pain and healthy adults.13,19,45,46 It is un-clear how higher average mindfulness score influenced our findings. Finally, as this study was a secondary analysis, we were not able to investigate the influence of sleep-related factors that were not mea-sured in the parent study, such as the effects of sleep disorders or medications affecting sleep.
However, an important strength of this study is the large and diverse sample of patients with fibromyalgia, as it increases
TA B L E 1 Demographic and clinical characteristics of participants (n = 177)a
Variable Mean ± SD
Age, y 52.0 ± 12.2
Sex, n (%)
Female 165 (93.2)
Race, n (%)
White 104 (58.8)
Other 73 (41.2)
Level of education, n (%)
Less than college degree 110 (62.2)
College degree or higher 67 (37.8)
Body mass index, kg/m2 30.1 ± 6.7
Duration of disease, y 13.1 ± 10.1
Pittsburgh Sleep Quality Index, range: 0-21b 11.7 ± 4.0
Five Facet Mindfulness Questionnaire
Total, range: 39-195 131.3 ± 20.7
Observing, range: 8-40 29.5 ± 5.7
Describing, range: 8-40 27.8 ± 6.2
Acting with awareness, range: 8-40 24.9 ± 6.8
Non-judging, range: 8-40 27.4 ± 7.5
Non-reacting, range: 7-35 21.7 ± 4.9
PROMIS Pain Interference, range: 41-78.3b,c 65.2 ± 5.9
PROMIS Sleep Disturbance, range 28.9-76.5b,c 59.9 ± 7.8
Symptom severity, range: 0-12b 8.7 ± 2.0
HADS-Depression, range: 0-21b 7.6 ± 4.1
HADS-Anxiety, range: 0-21b 8.9 ± 4.1
Revised Fibromyalgia Impact Questionnaire, range: 0-100b 57.0 ± 19.4
Abbreviations: HADS, Hospital Anxiety and Depression Scale; PROMIS. Patient-Reported Outcomes Measurement Information System.aValues reported as mean ± SD unless otherwise noted. bIndicates tests with higher scores indicating worse outcomes; better outcomes unmarked. cPROMIS Pain Interference and PROMIS Sleep Disturbance reported in t scores.

300 | PARK et Al.
generalizability to patient populations encountered in clinical set-tings. In addition, the results regarding sleep quality and disturbance were consistent between analyses using PSQI and PROMIS-SD mea-sures, which strengthen support for our findings.
In conclusion, our study demonstrated that higher mindfulness is associated with better sleep quality and less sleep disturbance in patients with fibromyalgia. The associations between mindfulness and sleep measures were mediated by pain interference, anxiety, and depression. Thus, multimodal therapeutic strategies influencing multiple clinical characteristics, including mindfulness and psycho-social factors, may be essential to improving sleep quality for indi-viduals with fibromyalgia. Longitudinal studies are needed to further evaluate the causality and directionality of these relationships and should consider measuring change in mindfulness to evaluate its lon-gitudinal effect on sleep in fibromyalgia populations.
CONFLIC T OF INTERE S TSNone.
AUTHOR CONTRIBUTIONSCW and YZ conceived of and implemented the original idea. LLP conducted the statistical analyses. MP led the drafting of the manu-script with help from YZ and input from all authors. All authors con-tributed to the interpretation of the data and critically reviewed the manuscript.
ORCIDChenchen Wang https://orcid.org/0000-0003-1817-6656
R E FE R E N C E S 1. Bigatti SM, Hernandez AM, Cronan TA, Rand KL. Sleep distur-
bances in fibromyalgia syndrome: Relationship to pain and depres-sion. Arthritis Rheum. 2008;59:961-967.
2. Theadom A, Cropley M, Humphrey K-L. Exploring the role of sleep and coping in quality of life in fibromyalgia. J Psychosom Res. 2007;62:145-151.
3. Stranges S, Tigbe W, Gómez-Olivé FX, Thorogood M, Kandala N-B. Sleep problems: an emerging global epidemic? Findings from the INDEPTH WHO-SAGE study among more than 40,000 older adults from 8 countries across Africa and Asia. Sleep. 2012;35:1173-1181.
4. Strine TW, Chapman DP. Associations of frequent sleep insuffi-ciency with health-related quality of life and health behaviors. Sleep Med. 2005;6:23-27.
5. Choy EHS. The role of sleep in pain and fibromyalgia. Nat Rev Rheumatol. 2015;11:513-520.
6. Mirõ E, Martínez MP, Sánchez AI, Prados G, Medina A. When is pain related to emotional distress and daily functioning in fibromyalgia syndrome? the mediating roles of self-efficacy and sleep quality. Br J Health Psychol. 2011.
7. Nicassio PM, Moxham EG, Schuman CE, Gevirtz RN. The contribu-tion of pain, reported sleep quality, and depressive symptoms to fatigue in fibromyalgia. Pain. 2002;100:271-279.
8. Clauw DJ. Fibromyalgia. JAMA. 2014;311:1547. 9. Reiner K, Tibi L, Lipsitz JD. Do mindfulness-based interventions
reduce pain intensity? A critical review of the literature. Pain Med. 2013;14:230-242.
10. Lee AC, Harvey WF, Price LL, Morgan LPK, Morgan NL, Wang C. Mindfulness is associated with psychological health and moderates pain in knee osteoarthritis. Osteoarthr Cartil. 2017;25:824-831.
11. Poulin PA, Romanow HC, Rahbari N, et al. The relationship between mindfulness, pain intensity, pain catastrophizing, depression, and quality of life among cancer survivors living with chronic neuro-pathic pain. Support Care Cancer. 2016;24:4167-4175.
12. Hölzel BK, Lazar SW, Gard T, Schuman-Olivier Z, Vago DR, Ott U. How does mindfulness meditation work? Proposing mechanisms of action from a conceptual and neural perspective. Perspect Psychol Sci. 2011;6:537-559.
13. Jones KD, Mist SD, Casselberry MA, Ali A, Christopher MS. Fibromyalgia Impact and Mindfulness Characteristics in 4986 People with Fibromyalgia. Explor J Sci Heal. 2015;11:304-309.
14. Pleman B, Park M, Han X, et al. Mindfulness is associated with psy-chological health and moderates the impact of fibromyalgia. Clin Rheumatol. 2019;38:1737-1745.
PSQI PROMIS Sleep PROMIS Pain HADS-D HADS-A
Total FFMQa −0.23** −0.24** −0.31** −0.54** −0.58**
FFMQa Facet
Observing 0.01 −0.07 −0.04 −0.19* −0.11
Describing −0.15* −0.17* −0.26** −0.38** −0.33**
Acting with awareness
−0.15* −0.16* −0.25** −0.47** −0.53**
Non-judging −0.29** −0.19* −0.26** −0.40** −0.57**
Non-reacting −0.13 −0.19* −0.19* −0.30** −0.28**
Abbreviations: PSQI, Pittsburgh Sleep Quality Index (range 0-21), higher scores indicate worse sleep quality; PROMIS-SD, PROMIS Sleep Disturbance t score (range 28.9-76.5), higher scores indicate more sleep disturbance; PROMIS-PI, PROMIS Pain Interference t score (range 41-78.3), higher scores indicate worse pain interference; HADS-D/HADS-A, Hospital Anxiety and Depression Scale depression/anxiety subscales (range 0-21), higher scores indicate worse symptoms.aHigher scores indicate higher mindfulness *P < .05. **P < .01.
TA B L E 2 Associations between facets of mindfulness and sleep, pain interference, anxiety, and depression (n = 177)

| 301PARK et Al.
15. Campbell R, Vansteenkiste M, Delesie L, et al. The role of basic psychological need satisfaction, sleep, and mindfulness in the health-related quality of life of people living with HIV. J Health Psychol. 2016.
16. Pagnini F, Cavalera C, Rovaris M, et al. Longitudinal associations be-tween mindfulness and well-being in people with multiple sclerosis. Int J Clin Heal Psychol. 2019.
17. Zhao D, Wang H, Feng X, Lv G, Li P. Relationship between neuroti-cism and sleep quality among asthma patients: the mediation effect of mindfulness. Sleep Breath. 2019;23(3):925–931.
18. Baer RA, Smith GT, Hopkins J, Krietemeyer J, Toney L. Using self-report assessment methods to explore facets of mindfulness. Assessment. 2006;13:27-45.
19. Baer RA, Smith GT, Lykins E, et al. Construct validity of the five facet mindfulness questionnaire in meditating and nonmeditating samples. Assessment. 2008;15:329-342.
20. van Son J, Nyklíček I, Nefs G, Speight J, Pop VJ, Pouwer F. The as-sociation between mindfulness and emotional distress in adults with diabetes: Could mindfulness serve as a buffer? Results from Diabetes MILES: The Netherlands. J Behav Med. 2015;38:251-260.
21. Bränström R, Duncan LG, Moskowitz JT. The association between dispositional mindfulness, psychological well-being, and perceived health in a Swedish population-based sample. Br J Health Psychol. 2011;16:300-316.
22. Desrosiers A, Klemanski DH, Nolen-Hoeksema S. Mapping mind-fulness facets onto dimensions of anxiety and depression. Behav Ther. 2013;44:373-384.
23. Kraemer KM, McLeish AC, Johnson AL. Associations between mindfulness and panic symptoms among young adults with asthma. Psychol Heal Med. 2015;20:322-331.
24. Wang C, McAlindon T, Fielding RA, et al. A novel comparative effec-tiveness study of Tai Chi versus aerobic exercise for fibromyalgia: study protocol for a randomized controlled trial. Trials. 2015;16:34.
25. Wolfe F, Smythe HA, Yunus MB, Bennett RM, Bombardier C, Goldenberg DL, et al. The American College of Rheumatology 1990 Criteria for the Classification of Fibromyalgia. Report of the Multicenter Criteria Committee. Arthritis Rheum 1990;33:160–172.
26. Wolfe F, Clauw DJ, Fitzcharles MA, et al. The American College of Rheumatology preliminary diagnostic criteria for fibromyal-gia and measurement of symptom severity. Arthritis Care Res. 2010;62:600-610.
27. Folstein MF, Folstein SE, McHugh PR. “Mini-mental state”. A prac-tical method for grading the cognitive state of patients for the clini-cian. J Psychiatr Res. 1975;12:189-198.
28. Park T, Reilly-Spong M, Gross CR. Mindfulness: A systematic review of instruments to measure an emergent patient-reported outcome (PRO). Qual Life Res. 2013;22:2639-2659.
29. Bennett RM, Friend R, Jones KD, Ward R, Han BK, Ross RL. The Revised Fibromyalgia Impact Questionnaire (FIQR): validation and psychometric properties. Arthritis Res Ther. 2009;11:R120.
30. Buysse DJ, Reynolds CF, Monk TH, et al. The Pittsburgh Sleep Quality Index: a new instrument for psychiatric practice and re-search. Psychiatry Res. 1989;28:193-213.
31. Buysse DJ, Yu L, Moul DE, et al. Development and validation of patient-reported outcome measures for sleep disturbance and sleep-related impairments. Sleep. 2010;33:781-792.
32. Yu L, Buysse DJ, Germain A, et al. Development of Short Forms From the PROMISTM Sleep Disturbance and Sleep-Related Impairment Item Banks. Behav Sleep Med. 2011;10:6-24.
33. Cella D, Riley W, Stone A, et al. The patient-reported outcomes measurement information system (PROMIS) developed and tested its first wave of adult self-reported health outcome item banks: 2005–2008. J Clin Epidemiol. 2010;63:1179-1194.
34. Zigmond AS, Snaith RP. The Hospital Anxiety and Depression Scale. Acta Psychiatr Scand. 1983;67:361-370.
35. Kenny DA. Mediation. 2018. Available at: http://david akenny.net/cm/media te.htm#REF. Accessed March 30, 2018.
36. Garcia MC, Pompéia S, Hachul H, et al. Is mindfulness associated with insomnia after menopause? Menopause. 2014;21:301-305.
37. Garland SN, Campbell T, Samuels C, Carlson LE. Dispositional mind-fulness, insomnia, sleep quality and dysfunctional sleep beliefs in post-treatment cancer patients. Pers Individ Dif. 2013;55:306-311.
38. Wang C, Schmid CH, Fielding RA, et al. Effect of tai chi versus aer-obic exercise for fibromyalgia: comparative effectiveness random-ized controlled trial. BMJ. 2018;360:k851.
39. Grossman P, Tiefenthaler-Gilmer U, Raysz A, Kesper U. Mindfulness training as an intervention for fibromyalgia: evidence of postinter-vention and 3-year follow-up benefits in well-being. Psychother Psychosom. 2007;76:226-233.
40. Cash E, Salmon P, Weissbecker I, et al. Mindfulness meditation al-leviates fibromyalgia symptoms in women: results of a randomized clinical trial. Ann Behav Med. 2015;49:319-330.
41. Van GW, Shonin E, Dunn TJ, Garcia-Campayo J, Griffiths MD. Meditation awareness training for the treatment of fibromyal-gia syndrome: a randomized controlled trial. Br J Health Psychol. 2017;22:186-206.
42. Amutio A, Franco C, Sánchez-Sánchez LC, et al. Effects of mindful-ness training on sleep problems in patients with fibromyalgia. Front Psychol 2018;9:1365.
43. Brooks JM, Muller V, Sánchez J, et al. Mindfulness as a protective factor against depressive symptoms in people with fibromyalgia. J Ment Heal. 2017;1-7.
44. Munguia-Izquierdo D, Legaz-Arrese A. Determinants of sleep qual-ity in middle-aged women with fibromyalgia syndrome. J Sleep Res. 2012;21:73-79.
45. Curtis K, Osadchuk A, Katz J. An eight-week yoga intervention is associated with improvements in pain, psychological functioning and mindfulness, and changes in cortisol levels in women with fi-bromyalgia. J Pain Res. 2011;4:189-201.
46. Veehof MM, Oskam MJ, Schreurs KMG, Bohlmeijer ET. Acceptance-based interventions for the treatment of chronic pain: A systematic review and meta-analysis. Pain. 2011;152:533-542.
How to cite this article: Park M, Zhang Y, Price LL, Bannuru RR, Wang C. Mindfulness is associated with sleep quality among patients with fibromyalgia. Int J Rheum Dis. 2020;23:294–301. https ://doi.org/10.1111/1756-185X.13756

302 | wileyonlinelibrary.com/journal/apl Int J Rheum Dis. 2020;23:302–308.© 2020 Asia Pacific League of Associations for Rheumatology and John Wiley & Sons Australia, Ltd
Received: 4 May 2019 | Revised: 1 October 2019 | Accepted: 30 November 2019
DOI: 10.1111/1756-185X.13781
O R I G I N A L A R T I C L E
Prevalence of and factors associated with depression and anxiety in patients with rheumatoid arthritis: A multicenter prospective cross-sectional study
Wanruchada Katchamart1 | Pongthorn Narongroeknawin2 | Wanwisa Chanapai3 | Phakhamon Thaweeratthakul1 | Ananya Srisomnuek3
1Department of Medicine, Division of Rheumatology, Faculty of Medicine Siriraj Hospital, Mahidol University, Bangkok, Thailand2Department of Medicine, Division of Rheumatology, Phramongkutklao Hospital and College of Medicine, Bangkok, Thailand3Research Department, Division of Clinical Trials, Faculty of Medicine Siriraj Hospital, Mahidol University, Bangkok, Thailand
CorrespondenceWanruchada Katchamart, Department of Medicine, Division of Rheumatology, Faculty of Medicine Siriraj Hospital, Mahidol University, 2 Wanglang Road, Bangkoknoi, Bangkok 10700, Thailand.Email: [email protected]
AbstractAim: To investigate the prevalence of and factors associated with depression and anxiety in patients with rheumatoid arthritis (RA).Methods: This prospective cross-sectional study included patients who were con-secutively enrolled in the Siriraj Rheumatoid Arthritis Registry or the Thai Army Rheumatoid Arthritis Cohort during the September 2016 to March 2018 study period. Demographic data and clinical variables, including disease activity, functional status, health-related quality of life, and cognitive function, were collected. Depression and anxiety were assessed using the Thai version of the Hospital Anxiety and Depression Scale (Thai HADS).Results: Four hundred and sixty-four patients were included. Mean age was 59 years, median disease duration was 9.9 years, and 85% of patients were female. Based on the Thai HADS cutoff value of 8 or higher, 12.5% and 14.5% of patients had some degree of depression and anxiety, respectively. Multivariate analysis revealed global health score (risk ratio [RR]: 0.98, P = .001) to be the only factor independently nega-tively associated with depression. Regarding anxiety, functional disability (RR: 2.46, P = .004) and married status (RR: 2.43, P = .009) were significantly associated with increased risk, whereas disease duration of 10 years or more (RR: 0.45, P = .007) and global health score (RR: 0.97, P < .001) were significantly associated with decreased risk of developing anxiety.Conclusion: Depression and anxiety are common in patients with RA. Patients' per-ceptions of their current health are significantly related to mood disorders. Therefore, mental health status, especially mood disturbances, should be addressed in routine practice to improve quality of life in RA.
K E Y W O R D S
anxiety, associated factors, depression, prevalence, rheumatoid arthritis

| 303KATCHAMART eT Al.
1 | INTRODUC TION
Rheumatoid arthritis (RA) is a chronic inflammatory joint disease that is characterized by unknown etiology, and heterogeneous presenta-tion, manifestation, and response to treatment. Clinical manifesta-tions vary from very mild symptoms to severe aggressive arthritis with joint erosion and deformities. Some patients may develop ex-tra-articular manifestations, including constitutional symptoms, sicca, rheumatoid nodules, interstitial lung disease, pericarditis, vas-culitis, and/or premature atherosclerosis. Among patients who were inadequately treated for RA, 20% developed severe disability, and 35% were dead within 20 years.1 RA was shown to be associated with a 60% increase in the risk of cardiovascular death compared with the general population.2 This cardiovascular compromise is likely related to premature atherosclerosis from chronic inflamma-tion, and comorbidities that include diabetes mellitus, hypertension, and dyslipidemia. Consequently, RA results in substantial morbidity and mortality, and it has a major economic and psychological im-pact on RA patients and their families. A 2010 longitudinal popula-tion-based study found chronic arthritis to be associated with mood disorders (ie anxiety or depression).3 The prevalence of depressive disorder in RA was 17% (95% CI 10%-24%), and was found to be associated with poorer outcomes.4,5 Improved understanding of the prevalence and impact of mood disorders in patients with RA will lead to early diagnosis and intervention, and improved patient qual-ity of life. Accordingly, the aim of this study was to investigate the prevalence of and factors significantly associated with depression and anxiety in patients with RA.
2 | METHODS
This prospective cross-sectional study included patients who were consecutively enrolled in 1 of 2 RA registries (Siriraj Rheumatoid Arthritis [SiRA] Registry6 or Thai Army Rheumatoid Arthritis Cohort [TARAC])7 during the September 2016 to March 2018 study period. The SiRA Registry was established by the Division of Rheumatology, Department of Medicine, Faculty of Medicine, Siriraj Hospital, Mahidol University, Bangkok, Thailand. TARAC was estab-lished by the Division of Rheumatology, Department of Medicine, Phramongkutklao Hospital and College of Medicine, Bangkok, Thailand.
Patients aged 18 years or older who were diagnosed with RA according to the American College of Rheumatology 1987 revised criteria for the classification of RA8 or the 2010 RA classification criteria9 were eligible for inclusion. Patients with syndromes that overlapped with other rheumatic or autoimmune diseases were ex-cluded. Written informed consent was obtained from all participants prior to enrollment. This study was conducted in accordance with the ethical principles set forth in the Declaration of Helsinki (1964) and all of its subsequent provisions, and it adhered to the principles outlined in the Guideline for Good Clinical Practice International Conference on Harmonization (ICH) Tripartite Guideline (January
1997). The study protocol was approved by the institutional review board of both participating hospitals.
Demographic data, clinical manifestations, and variables in-cluding gender, age, occupation, marital status, education, co-morbidity, tobacco use, alcohol use, disease duration, pain score, patient and physician global assessment of disease activity mea-sured on a 10 cm visual analog scale (VAS), number of tender joints, number of swollen joints, erythrocyte sedimentation rate, rheumatoid factor (RF), anti-citrullinated peptide (CCP) antibodies, and radiographic evidence of hand and/or feet erosion were col-lected and analyzed. Disease activity and functional status were evaluated using the Disease Activity Score of 28 joints (DAS28)10 and the Thai version of the Health Assessment Questionnaire (HAQ),11 respectively. The Thai version of the EuroQoL 5-dimen-sional questionnaire (EQ-5D) was used to assess health-related quality of life (HRQoL).12 The EQ-5D consists of a descriptive system and the EQ VAS. The descriptive system comprises five dimensions, including mobility, self-care, usual activities, pain/discomfort, and anxiety/depression. The EQ VAS measures the patient's self-rated assessment of their health status on a 0-100 vertical VAS. Cognitive function was assessed using the Montreal Cognitive Assessment-Thai version (MoCA-T).13
Depression and anxiety at the most recent visit were assessed using the Thai version of the Hospital Anxiety and Depression Scale (Thai HADS).14 Thai HADS is a self-administered questionnaire that consists of 14 questions, of which 7 relate to anxiety and 7 relate to depression. Each item is answered using a 4-point Likert scale (0-3), for a total possible score of 21 for anxiety and 21 for depression. A score of 8 or higher for either type of mood disorder indicated the presence of some degree of anxiety or depression. All variables were examined on the same day.
2.1 | Statistical analysis
Demographic and baseline characteristics are described using mean and standard deviation for normally distributed continuous data, and median and range for non-normally distributed continu-ous data. Categorical data are shown as number and percentage. Comparisons of demographics and characteristics between pa-tients with or without depression and anxiety were performed using Chi-square test or Fisher's exact test for categorical data, and Student's t test or Kruskal-Wallis test for continuous data. Univariate and multiple logistic regression analyses were per-formed to identify independent factors associated with depres-sion and anxiety. Variables that were reported in previous studies to be associated with depression and/or anxiety, and variables with a P value of <.2 in univariate analysis, were included in multi-ple logistic regression analysis because the more traditional levels such as 0.05 can fail in identifying variables known to be impor-tant.15 All statistical tests were 2-sided, and a P value <.05 was considered statistically significant. All analyses were performed using SPSS version 20 (SPSS Inc).

304 | KATCHAMART eT Al.
3 | RESULTS
Four hundred and sixty-four patients were included. The mean ± SD age of patients was 59 ± 11.4 years, the median disease duration was 9.9 years (interquartile range [IQR]: 5.1-16.6), and 85% were fe-male. The median number of years of education was 9 (IQR: 4-14). Almost half (48%) of patients were unemployed. The DAS28 was moderate (3.50 ± 0.81), and the median functional disability score (HAQ) was mild (0.50, IQR: 0.13-1.10). Presence of RF and anti-CCP was found in 75% and 72% of cases, respectively. Eighty-five percent of patients had radiographic erosion at the hands or feet. Cognitive impairment was detected in 70% of patients. The mean EQ-5D and global health scores were 0.87 ± 0.13 and 79.37 ± 16.98, respectively.
Regarding mood disorders, the mean score for depression was 3.83 ± 3.11, and the mean score for anxiety was 4.71 ± 2.95. Based on the Thai HADS cutoff value of 8 or higher for indicating the pres-ence of a mood disorder, 12.5% and 14.5% of patients had some de-gree of depression and anxiety, respectively.
Regarding the relationship between mood disorders and disease activity or functional status (Figure 1), we found that the proportion of depression and anxiety increased with increases in disease activ-ity or decreases in functional status.
Univariate analysis (Tables 1 and 2) revealed depression and anxiety to be more common in patients with high disease activity, impaired functional status, low quality of life, and low global health score. Anxiety was also more prevalent in patients with RA disease
duration of <10 years, and in those who were married, had cognitive impairment, and/or had high pain scores.
However, in multiple logistic regression analysis (Table 3), only global health score (risk ratio [RR]: 0.98, 95% confidence interval [95% CI]: 0.96-0.99; P = .001) was found to be independently neg-atively associated with depression. Regarding anxiety, functional disability (RR: 2.46, 95% CI: 1.33-4.54; P = .004) and married status (RR: 2.43, 95% CI: 1.25-4.73; P = .009) were significantly associated with increased risk, whereas disease duration of 10 years or more (RR: 0.45, 95% CI: 0.25-0.80; P = .007) and global health score (RR: 0.97, 95% CI: 0.95-0.98; P < .001) were significantly associated with decreased risk of developing anxiety.
4 | DISCUSSION
Mood disturbances, especially depression and anxiety, are quite common among patients with RA. A meta-analysis of 72 studies that included 13 189 patients found a pooled prevalence of major depression of 17% (range: 3%-75%).4 The wide variation in the prevalence of depression in that meta-analysis can be explained by the fact that 40 different methods were used to assess depression. In the present study, we used the HADS assessment tool because it was the most often used screening questionnaire in the afore-mentioned meta-analysis (30 out of 72 studies). Moreover and importantly, the HADS tool was previously translated into Thai language and validated in a Thai population.14 When meta-analysis
F I G U R E 1 Disease activity (Disease Activity Score of 28 joints [DAS28]) and functional status (Health Assessment Questionnaire [HAQ]) in rheumatoid arthritis (RA) patients with depression and anxiety

| 305KATCHAMART eT Al.
depression data from only studies that used the HADS tool were evaluated, the prevalence rates of significant major depressive disorders were still wide-ranging (range: 15%-48%). In this in-stance, the wide variation in prevalence rates is attributable to the inclusion of heterogeneous populations and different thresholds used to define depressive disorder. We used a HADS cutoff value of 8 or more out of 21 to indicate the presence of some degree of anxiety or depression. In contrast, some studies in the afore-mentioned meta-analysis used a more conservative HADS cutoff threshold of 11. Nevertheless, our study population had a lower prevalence of depressive disorder than the rates reported from other previous studies that also used a HADS cutoff of 8 (range: 20%-56%).16-20 The prevalence of depression was much higher in a cohort of RA patients from the UK (47.5%)17 than the prevalence found in our cohort (12.5%). This discrepancy may be explained by the fact that the patients in that study had more severe dis-ease, with a median DAS28 of 7.2 (IQR: 6.5-7.8). Moreover, all of
those patients had inadequate response to conventional disease-modifying anti-rheumatic drugs (DMARDs) and they were going to start anti-tumor necrosis factor agents. In contrast, the patients in our cohort had moderate disease activity, and up to 95% re-sponded to conventional DMARDs. We cannot compare our re-sults to other studies, since those studies did not report clinical variables related to disease activity and/or functional status, as well as treatment. Regarding anxiety, not many studies specifically addressed this type of mood disorder. Similar to our study, Lok, et al reported a prevalence of 13% for point anxiety and 16% for lifetime anxiety, as measured by the Chinese-bilingual Structured Clinical Interview for Diagnostic and Statistical Manual of Menta Disorders IV Axis I Disorders, Patient Research Version (CB-SCID-I/P) in Hong Kong.21 A study in Chinese a population using the Hamilton Anxiety Scale scores reported a high 60% prevalence of anxiety. They found association between mood disorders and a low level of vitamin D. Jamshidi et al found an 84% prevalence of
TA B L E 1 Univariate analysis comparing patients with and without depression
Patient with depression (N = 58)
Patient without depression (N = 406) RR (95% CI) P value
Age, y, mean ± SD 59.16 ± 11.43 59.11 ± 11.53 1.0 (0.98-1.02) .975
Women (%) 52 (89.7) 343 (84.5) 1.59 (0.66-3.86) .300
Tobacco use (%) 6 (10.3) 40 (9.9) 1.06 (0.43-2.61) .907
Alcohol consumption (%) 15 (25.9) 90 (22.2) 1.23 (0.65-2.31) .529
Education, y, median (IQR) 9 (4-12) 9 (4-16) 0.95 (0.90-1.01) .089
Unemployed (%) 27 (46.6) 194 (47.8) 0.95 (0.55-1.65) .861
Disease duration, y, median (IQR) 10.17 (4.30-16.16) 9.88 (5.11-16.68) 1.0 (0.96-1.03) .839
DAS28 (0-9), mean ± SD 3.60 ± 0.73 3.49 ± 0.81 1.19 (0.85-1.66) .324
HAQ (0-3), median (IQR) 0.88 (0.38-1.50) 0.50 (0.12-1.0) 1.80 (1.24-2.61) .002
Rheumatoid factor (%) 37 (67.3) 297 (75.8) 0.66 (0.36-1.21) .175
ACPA (%) 32 (64.0) 244 (73.5) 0.64 (0.34-1.20) .162
Hands or feet erosion (%) 46 (83.6) 311 (83.6) 1.0 (0.47-2.16) .995
Comorbidity (%) 31 (53.4) 229 (56.4) 0.89 (0.51-1.54) .671
Diabetes mellitus (%) 3 (5.2) 43 (10.6) 0.46 (0.14-1.54) .196
Hypertension (%) 25 (43.1) 163 (40.1) 1.13 (0.65-1.97) .668
Stroke (%) 1 (1.7) 7 (1.7) 1.0 (0.12-8.28) 1.0
Dyslipidemia (%) 22 (37.9) 160 (39.4) 0.94 (0.53-1.66) .829
Coronary artery disease (%) 2 (3.4) 10 (2.5) 1.41 (0.30-6.62) .652
Global health score, mean ± SD 67.74 ± 18.81 80.74 ± 16.27 0.97 (0.96-0.98) <.001
EQ-5D score, mean ± SD 0.76 ± 0.19 0.88 ± 0.11 0.004 (0.001-0.03) <.001
tMOCA, mean ± SD 20.97 ± 4.40 21.86 ± 4.14 0.95 (0.89-1.02) .130
Pain score, median (IQR) 3 (1-6) 2 (1-4) 1.16 (1.04-1.29) .008
Marital status
Single 11 (19.0) 76 (18.7) 2.75 (0.33-22.64) .660
Married 37 (63.8) 264 (65.0) 2.66 (0.35-20.48)
Widowed 9 (15.5) 47 (11.6) 3.64 (0.43-30.73)
Divorced 1 (1.7) 19 (4.7) 1
Abbreviations: ACPA, anti-citrullinated peptide antibodies; DAS28, Disease Activity Score of 28 joints; HAQ, Health Assessment Questionnaire; IQR, interquartile range; RR, relative risk; tMOCA, Thai version of Montreal Cognitive Assessment.

306 | KATCHAMART eT Al.
anxiety among Iranian patients with RA as assessed by the Beck and Cattell inventories.22 These results may reflect differences in patient characteristics, perceptions, beliefs, healthcare systems, and socioeconomic structures, as well as different performance of assessment tools used to detect anxiety.
Regarding factors associated with mood disorders, we found global health, which reflects patients’ perceptions of their
overall health, to be independently negatively associated with both depression and anxiety, which is similar to a previous study.23 Moreover, we found functional disability to be significantly as-sociated with anxiety. When patients consider themselves to be disabled, or they perceive their RA-related or non-RA-related health to be poor, they tend to have increased levels of depres-sion. Interestingly, we also found that patients who had RA for
Patients with anxiety (N = 67)
Patients without anxiety (N = 397) RR (95% CI) P value
Age, y, mean ± SD 58.92 ± 11.63 59.19 ± 11.41 1.0 (0.98-1.02) .859
Women (%) 59 (88.1) 336 (84.6) 1.34 (0.61-2.94) .466
Tobacco use (%) 5 (7.5) 41 (10.3) 0.70 (0.27-1.84) .468
Alcohol consumption (%)
19 (28.4) 86 (21.7) 1.43 (0.80-2.56) .226
Education, y, median (IQR)
6 (4-12) 9 (4-15) 0.96 (0.91-1.01) .085
Unemployed (%) 31 (46.3) 190 (47.9) 0.94 (0.56-1.58) .809
Disease duration, y, median (IQR)
7.99 (3.52-15.02) 10.70 (5.29-16.82) 0.97 (0.94-1.01) .096
DAS28 (0-9), mean ± SD
3.67 ± 0.87 3.48 ± 0.79 1.35 (0.98-1.85) .063
HAQ (0-3), median (IQR)
1 (0.38-1.75) 0.50 (0.0-1.0) 2.34 (1.64-3.33) <.001
Rheumatoid factor (%)
43 (67.2) 291 (76.0) 0.65 (0.37-1.15) .134
ACPA (%) 23 (63.9) 253 (73.1) 0.71 (0.39-1.30) .239
Hands or feet erosion (%)
50 (83.3) 307 (83.7) 0.98 (0.47-2.03) .951
Comorbidity (%) 36 (53.7) 224 (56.4) 0.90 (0.53-1.51) .681
Diabetes mellitus (%)
10 (14.9) 36 (9.1) 1.76 (0.83-3.74) .138
Hypertension (%) 31 (46.3) 157 (39.5) 1.32 (0.78-2.22) .300
Stroke (%) 2 (3.0) 6 (1.5) 2.01 (0.40-10.15) .325
Dyslipidemia (%) 26 (38.8) 156 (39.3) 0.98 (0.58-1.67) .940
Coronary artery disease (%)
4 (6.0) 8 (2.0) 3.09 (0.90-10.56) .080
Global health score, mean ± SD
68.51 ± 17.86 81.20 ± 16.15 0.96 (0.95-0.98) <.001
EQ-5D score, mean ± SD
8.40 ± 5.05 0.89 ± 0.11 0.001 (0.001-0.005)
<.001
tMOCA, mean ± SD 20.87 ± 3.86 21.89 ± 4.21 0.95 (0.89-1.01) .064
Pain score, median (IQR)
3 (1-5) 2 (1-4) 1.12 (1.01-1.24) .038
Marital status
Single 6 (9.0) 81 (20.4) 1.41 (0.16-12.39) .088
Married 51 (76.1) 250 (63.0) 3.88 (0.51-29.61)
Widowed 9 (13.4) 47 (11.8) 3.64 (0.43-30.73)
Divorced 1 (1.5) 19 (4.8) 1
Abbreviations: ACPA, anti-citrullinated peptide antibodies; DAS28, Disease Activity Score of 28 joints; HAQ, Health Assessment Questionnaire; IQR, interquartile range; RR, relative risk; tMOCA, Thai version of Montreal Cognitive Assessment.
TA B L E 2 Univariate analysis comparing patients with and without anxiety

| 307KATCHAMART eT Al.
more than 10 years were at significantly lower risk of having or developing anxiety. This may be due to the fact that patients with prolonged duration of RA may have less active disease compared to those with newly diagnosed RA. Furthermore, individuals with chronic illness may develop better coping mechanisms for manag-ing physical and psychological difficulties than those with new-on-set disease. Regarding marital status, we found married patients to be at significantly higher risk for developing anxiety. In contrast, widowed and divorced patients had a high prevalence of anxiety and depression in Iranian populations.22 This difference between populations may be due to differences in patient beliefs, religions, ethnicities, and socioeconomic structures.
This study has some mentionable limitations. First, we used a cross-sectional design that assesses a group at a certain point in time. However, RA is a chronic disease, and mood disturbances in this disease are likely influenced and then increased in severity with increases in disease activity and functional impairment. Additionally, we were unable to evaluate how different factors influence changes in mood disturbances. Second, we recruited patients from tertiary re-ferral centers, which means that these patients may have had more severe disease, complications, and/or comorbidities. Thus, our results may not be generalizable to patients in other types of healthcare set-tings. Third and last, we did not collect and analyze data relating to patient economic status or social and family support systems. These factors may influence mood disturbances. The strength of this study is its multicenter prospective design, and the fact that it reflects recent real-world data collected from patients with guideline-diagnosed RA.
In conclusion, depression and anxiety are prevalent in individu-als with RA. Patients' perceptions of their current health are signifi-cantly related to mood disorders. Therefore, patient mental health status, especially mood disturbances, should be addressed in routine practice to improve quality of life in RA.
ACKNOWLEDG EMENTThe authors gratefully acknowledge Ms Khemajira Karaketklang of the Research & Academic Services Unit, Department of Medicine, Faculty of Medicine Siriraj Hospital, Mahidol University for assistance with sta-tistical analysis.
CONFLIC T OF INTERE S TAll authors declare no personal or professional conflicts of inter-est, and no financial support from the companies that produce and/or distribute the drugs, devices, or materials described in this report.
ORCIDWanruchada Katchamart https://orcid.org/0000-0002-8952-5967 Pongthorn Narongroeknawin https://orcid.org/0000-0001-8202-6746
R E FE R E N C E S 1. Scott DL, Symmons DP, Coulton BL, Popert AJ. Long-term out-
come of treating rheumatoid arthritis: results after 20 years. Lancet. 1987;1:1108-1111.
2. Meune C, Touze E, Trinquart L, Allanore Y. Trends in cardiovascular mortality in patients with rheumatoid arthritis over 50 years: a sys-tematic review and meta-analysis of cohort studies. Rheumatology. 2009;48:1309-1313.
3. van 't Land H, Verdurmen J, ten Have M, van Dorsselaer S, Beekman A, de Graaf R. The association between arthritis and psychiatric disorders; results from a longitudinal population-based study. J Psychosom Res. 2010;68:187-193.
4. Matcham F, Rayner L, Steer S, Hotopf M. The prevalence of depres-sion in rheumatoid arthritis: a systematic review and meta-analysis. Rheumatology. 2013;52:2136-2148.
5. Michelsen B, Kristianslund EK, Sexton J, et al. Do depression and anxiety reduce the likelihood of remission in rheumatoid arthritis and psoriatic arthritis? Data from the prospective multicentre NOR-DMARD study. Ann Rheum Dis. 2017;76:1906-1910.
6. Katchamart W, Koolvisoot A, Aromdee E, Chiowchanwesawakit P, Muengchan C. Associations of rheumatoid factor and anti-ci-trullinated peptide antibody with disease progression and treat-ment outcomes in patients with rheumatoid arthritis. Rheum Int. 2015;35:1693-1699.
7. Darawankul B, Chaiamnuay S, Pakchotanon R, Asavatanabodee P, Narongroeknawin P. The good EULAR response at the first year is strongly predictive of clinical remission in rheumatoid arthritis: re-sults from the TARAC cohort. Clin Rheumatol. 2015;34:43-49.
8. Arnett FC, Edworthy SM, Bloch DA, et al. The American Rheumatism Association 1987 revised criteria for the classification of rheuma-toid arthritis. Arthritis Rheum. 1988;31:315-324.
Factors
Depression Anxiety
RR (95% CI) P value RR (95% CI) P value
DAS28 > 2.6 1.66 (0.49-5.70) .418
HAQ > 0.5 1.38 (0.75-2.54) .303 2.46 (1.33-4.54) .004
Comorbidity 1.04 (0.58-1.89) .890 1.05 (0.59-1.86) .875
Global health 0.98 (0.96-0.99) .001 0.97 (0.95-0.98) <.001
Cognitive impairment 1.12 (0.59-2.15) .727 1.66 (0.84-3.30) .144
Pain score 1.07 (0.95-1.20) .275 1.01 (0.90-1.14) .819
Disease duration ≥ 10 y 0.45 (0.25-0.80) .007
Marital status—married 2.43 (1.25-4.73) .009
Abbreviations: CI, confidence interval; DAS28, Disease Activity Score of 28 joints; HAQ, Health Assessment Questionnaire; RR, risk ratio.
TA B L E 3 Multivariate analysis for factors significantly associated with depression and anxiety in patients with rheumatoid arthritis

308 | KATCHAMART eT Al.
9. Aletaha D, Neogi T, Silman AJ, et al. 2010 rheumatoid arthritis clas-sification criteria: an American College of Rheumatology/European League Against Rheumatism collaborative initiative. Ann Rheum Dis. 2010;69:1580-1588.
10. Vander Cruyssen B, Van Looy S, Wyns B, et al. DAS28 best re-flects the physician's clinical judgment of response to infliximab therapy in rheumatoid arthritis patients: validation of the DAS28 score in patients under infliximab treatment. Arthritis Res Ther. 2005;7:R1063-R1071.
11. Osiri M, Wongchinsri J, Ukritchon S, Hanvivadhanakul P, Kasitanon N, Siripaitoon B. Comprehensibility, reliability, validity, and re-sponsiveness of the Thai version of the Health Assessment Questionnaire in Thai patients with rheumatoid arthritis. Arthritis Res Ther. 2009;11:R129.
12. Tongsiri S. The Thai population-based preference scores for EQ-5D health states (Doctoral dissertation). London, UK: London School of Hygiene and Tropical Medicine, University of London; 2009.
13. Tangwongchai S, Phanasathit M, Charernboon T, et al. The validity of Thai version of The Montreal Cognitive Assessment (MoCA-T). Dement Neuropsychol. 2009;3(2):172.
14. Nilchaikovit TLM, Phisansuthidth U. Development of Thai ver-sion of hospital anxiety and depression scale in cancer patients. J Psychiatr Assoc Thai. 1996;41(1):18-31.
15. Mickey RM, Greenland S. The impact of confounder selection crite-ria on effect estimation. Am J Epidemiol. 1989;129:125-137.
16. Dirik G, Karanci AN. Psychological distress in rheumatoid arthritis patients: an evaluation within the conservation of resources theory. Psychol Health. 2010;25:617-632.
17. Hider SL, Tanveer W, Brownfield A, Mattey DL, Packham JC. Depression in RA patients treated with anti-TNF is common and un-der-recognized in the rheumatology clinic. Rheumatology (Oxford). 2009;48:1152-1154.
18. Covic T, Pallant JF, Tennant A, Cox S, Emery P, Conaghan PG. Variability in depression prevalence in early rheumatoid arthritis:
a comparison of the CES-D and HAD-D Scales. BMC Musculoskelet Disord. 2009;10:18.
19. Barlow JH, Cullen LA, Rowe IF. Comparison of knowledge and psychological well-being between patients with a short disease duration (< or =1 year) and patients with more established rheu-matoid arthritis (> or =10 years duration). Patient Educ Couns. 1999;38:195-203.
20. Pincus T, Griffith J, Pearce S, Isenberg D. Prevalence of self-re-ported depression in patients with rheumatoid arthritis. Br J Rheumatol. 1996;35:879-883.
21. Lok EY, Mok CC, Cheng CW, Cheung EF. Prevalence and determi-nants of psychiatric disorders in patients with rheumatoid arthritis. Psychosomatics. 2010;51:338.e8.
22. Jamshidi AR, Banihashemi AT, Paragomi P, Hasanzadeh M, Barghamdi M, Ghoroghi S. Anxiety and depression in rheumatoid arthritis: an epidemiologic survey and investigation of clinical cor-relates in Iranian population. Rheum Int. 2016;36:1119-1125.
23. Nakajima A, Kamitsuji S, Saito A, et al. Disability and patient's ap-praisal of general health contribute to depressed mood in rheu-matoid arthritis in a large clinical study in Japan. Mod Rheumatol. 2006;16:151-157.
How to cite this article: Katchamart W, Narongroeknawin P, Chanapai W, Thaweeratthakul P, Srisomnuek A. Prevalence of and factors associated with depression and anxiety in patients with rheumatoid arthritis: A multicenter prospective cross-sectional study. Int J Rheum Dis. 2020;23:302–308. https ://doi.org/10.1111/1756-185X.13781

Int J Rheum Dis. 2020;23:309–315. wileyonlinelibrary.com/journal/apl | 309© 2019 Asia Pacific League of Associations for Rheumatology and John Wiley & Sons Australia, Ltd
1 | INTRODUC TION
Rheumatoid arthritis (RA) is a chronic autoimmune disease that typ-ically affects the small joints of the hands and feet, often symmet-rically. It usually presents with constant pain, stiffness, progressive
joint destruction and deformity, with significant disability.1 The prevalence of RA in Egyptian rural areas is about 0.29% according to the American College of Rheumatology (ACR) 1987 diagnostic crite-ria for RA. The overall prevalence could not be reported because of significant heterogeneity between studies.2,3
Received: 28 May 2019 | Revised: 9 October 2019 | Accepted: 17 November 2019
DOI: 10.1111/1756-185X.13763
O R I G I N A L A R T I C L E
Adaptation and validation of an Arabic version of a 10-item patient-reported outcome measure of physical function in rheumatoid arthritis
Shaza Mohamed Farrag1 | Mai Mohamed Abdelnaby2 | Aly Elsayed Mohamed2
1Deptartment of Physical Medicine, Rheumatology and Rehabilitation, Damietta Specialized Hospital, Damietta, Egypt2Department of Physical Medicine, Rheumatology and Rehabilitation, Faculty of Medicine, Suez Canal University, Ismailia, Egypt
CorrespondenceAly Elsayed Mohamed, Department of Physical Medicine, Rheumatology and Rehabilitation, Faculty of Medicine, Suez Canal University, Ring Road, K4.5, P.O. 41522, Ismailia, Egypt.Email: [email protected]
AbstractAim: To adapt and validate an Arabic version of the short form of physical function measure (PF-10a), a generic questionnaire for physical function, in Egyptian patients with rheumatoid arthritis (RA).Methods: After standardized linguistic validation of the Arabic version of PF-10a, with forward and backward translation, the questionnaire was completed by 70 Egyptian RA patients who were diagnosed according to American College of Rheumatology/European League Against Rheumatism 2010 classification criteria, on two occa-sions 3-5 days apart. The internal consistency and test–retest reliability were evalu-ated using Cronbach's alpha and intra-class correlation. The content validity of the Arabic PF-10a was tested against Health Assessment Questionnaire Disability Index (HAQ-DI), Clinical Disease Activity Index (CDAI) and Disease Activity Score in 28 joints using erythrocyte sedimentation rate (DAS28-ESR). In addition, serology re-sults, hand radiographs, and treatments received were all recorded.Results: Most of our patients were female (88.6%) with a mean age of 49.2 ± 10.5 years. They had a mean disease duration of 7.3 ± 7 years and an active disease with a mean CDAI of 33.1 ± 12.6. The mean value of PF-10a was 34.6 ± 6.2. The Cronbach's alpha for Arabic PF-10a was 0.904. Intra-CLASS CORRELATION was 0.897. Arabic PF-10a correlated strongly with HAQ-DI (−0.746), moderately with CDAI, patient global as-sessment, and pain (−0.457, −0.417, and −0.371 respectively).Conclusion: The validation study showed that the Arabic PF-10a had acceptable psy-chometric characteristics, in terms of internal consistency and construct validity. The Arabic PF-10a is a reliable and valid instrument to be used by Arabic RA patients.
K E Y W O R D S
Arabic PF-10a, patient-reported outcomes measures, physical function, rheumatoid arthritis, validation

310 | FARRAG et Al.
Assessment of physical function of those patients is important to evaluate the impact of disease and to assess the treatment effects.4 According to the ACR preliminary definition of RA improvement cri-teria, patient physical function assessment has been considered one of the predictors of disease activity.5
There are several tools to measure functional disability, starting from physical assessment by trained evaluators, to self-administered questionnaires6 such as Health Assessment Questionnaire (HAQ) and the modified version of the same questionnaire which are de-signed for patients with RA.7,8
The National Institutes of Health, USA, has developed a new set of questionnaires called Patient-Reported Outcome Measurement Information System (PROMIS)TM which are designed to assess func-tioning and well-being in the physical, mental, and social domains of health. These measures had many advantages. First it is efficient and sensitive to changes across a broad range of functioning and are not specific for any disease, yielding scores that can be compared across many different diseases.9,10
PROMIS physical function (PF) items are available in many for-mats and translations. They can be completed by computer adaptive test, and as stand-alone 6-, 8-, 10-, or 20-item paper questionnaires (PF-10a and PF-20) or as part of a 29-item profile; the method of administration does not affect score precision.11,12
Recently, PROMIS-PF-10a was validated in a RA general popula-tion. It includes ability of patients to do vigorous activities, walking more than a mile, running, washing and drying of the body and get-ting on and off the toilet.9 There is a paucity of validated patient-re-ported outcomes (PROs) for physical function in Arabic language; only the HAQ has been validated for Arabic language.13 Therefore, this study was conducted to adapt and validate an Arabic version of the PF-10a questionnaire, a simple and efficient physical measure-ment tool, in Egyptian patients with RA.
2 | PATIENTS AND METHODS
This cross-sectional study was conducted at Physical Medicine, Rheumatology and Rehabilitation Department, Suez Canal University Hospital, a tertiary teaching hospital and Damietta Specialized Hospital, a semi-urban secondary care hospital. A convenience sam-ple of 70 consecutive RA patients satisfying the ACR/ European League Against Rheumatism 2010 criteria for RA14 aged 18 years or older of both sexes were invited to participate in the study. Patients who had cognitive deficits, or psychiatric symptoms were excluded. The study was approved by the research ethics committees of both hospitals and all patients signed an informed consent.
2.1 | Assessments
All patients were subjected to thorough rheumatological his-tory, physical examination, and laboratory assessment. Socio-demographic data including age, gender, educational level, marital
status, occupation and smoking habits were collected. Clinical and laboratory data regarding disease duration, 28-tender joint count (28-TJC), 28-swollen joint count (28-SJC), visual analog scale of pain (VAS), extra-articular disease manifestations, medications, erythrocyte sedimentation rate (ESR), and C-reactive protein (CRP) were also obtained. Composite disease measures including Disease Activity Score for 28 joints with ESR (DAS28-ESR), and Clinical Disease Activity Index (CDAI) were calculated.
2.2 | Original PF-10a
The original PF-10a questionnaire consists of 10 questions. Each question has five response options ranging in value from 1 to 5. The total raw score ranges from 10 to 50 and can be translated into a T score. A higher PROMIS-PF-10a T score represents better physical function. PF-10a can be scored if the participant answers at least 5 of 10 items.
2.3 | Translation process
Five items of PF10-a (PFA1, PFA5, PFA3, PFA11, and PFA16r1) were already translated into Arabic and were available at PROMIS item bank v215 (http://www.healt hmeas ures.net/explo re-measu rement-syste ms/promis). The translation and linguistic validation of the remaining five items (PFC36r1, PFC37, PFB26, PFA55, and PFC45) were performed following the forward/backward trans-lation approach to ensure conceptual equivalence between the original and its translation. Two independent Arabic translators translated the original English version into Arabic, and back trans-lation was done by two native English speakers.16 A small pilot study consisting of five RA patients with different educational levels (not included in the original study) was done by request to complete the questionnaire. There was no report of confu-sion in understanding the questions. Two questions were slightly modified. Question no. 2-PFC36r1, kilometer was used in Arabic version instead of mile in English version, as the International System of Units is the one used in our country. Also, question no. 8-PFB26, the word “shampoo” in English version was omitted from the Arabic version. No changes were made on the response an-swers during the process of developing the Arabic version. After these minor modifications, a final Arabic PF-10a version was ob-tained (Appendix 1).
2.4 | Reliability
Reliability was tested by test–retest reliability and internal consist-ency. The test–retest was performed by asking the patients to com-plete the questionnaire by themselves and it was re-applied after a 3-5-day interval.16 Internal consistency was calculated from the results of the first administration.

| 311FARRAG et Al.
2.5 | Validity
Validity was assessed by comparing the response of the first administration and validated Arabic version of HAQ-DI.13 The HAQ-DI questionnaire contains 20 questions grouped into 8 sub-scales (dressing and grooming, arising, eating, walking, hygiene, reach, grip, activities). The response categories are ''without any difficulty'' (score = 0), ''with some difficulty'' (score = 1), ''with much difficulty'' (score = 2), and ''unable to do'' (score = 3). The highest score for any question determines the score for the sub-scale in question. The use of any assistive device or any other person's help was given a score of 2. The HAQ-DI was calculated as the sum of the scores for various subscales. In addition, the Arabic PF-10a score was compared with some clinical and labora-tory measures such as VAS for pain, 28-TJC, 28-SJC, ESR, CRP, DAS28-ESR, and CDAI.
2.6 | Data management and statistical analysis
Data were then imported into Statistical Package for the Social Sciences (SPSS) version 20.0 (IBM SPSS Ver. 20.0) and MedCalc ver-sion 12.1.3.0 software for analysis. Baseline characteristics of the study population are presented as frequencies and percentages (%) in qualitative data or mean values and standard deviations in quanti-tative data. Internal reliability was evaluated by applying Cronbach's alpha coefficient. To test construct validity, Spearman correlation coefficient was used to assess the relationship between items of PF-10a and total scores of HAQ-DI. The test–retest reliability of the items between measurement points was assessed by calculating Spearman rank correlations.
3 | RESULTS
3.1 | Socio-demographic and clinical disease characteristics
Most of our patients were middle-aged females (88.6%) with a mean age of 49.2 ± 10.5 years with different levels of education and mostly housewives (Table 1). A large percentage of our patients (47; 67.1%) had disease duration more than 2 years with high 28-TJC, VAS for pain, elevated acute phase reactants, almost half of them had co-morbid conditions (47.1%), and 62.9% of them received combination synthetic disease-modifying antirheumatic drugs (DMARDs) with only one on biological drugs (Table 2).
3.2 | Composite disease activity measures
Most of our patients had active disease (Table 2). The mean value of CDAI was 33.1 ± 12.6. Three-quarters of our patients (75.7%) had high disease activity, 20% had moderate activity and 4.3% had low
disease activity with no one in remission. The mean value of DAS28-ESR score among the studied patients was 5.14 ± 1.01 and most of them (62.9%) had high activity then moderate activity (31.4%) while the rest (1.4% and 4.3%) had mild activity and remission, respectively.
TA B L E 1 Socio-demographic characteristics of the studied patients
Character Patients (N = 70)
Age, y, mean ± SD (range) 49.2 ± 10.5 (22-75)
Females, no. (%) 62 (88.6%)
Education, no. (%)
≤High school 61 (87.1%)
College 9 (12.9%)
Employment status no. (%)
Working 7 (10%)
Not working/housewives 55 (78.6%)
Retired 8 (11.4%)
Marital status, no. (%)
Single 2 (2.9%)
Married 61 (87.1%)
Divorced 1 (1.4%)
Widow 6 (8.6%)
Smoking, no. (%)
Smoker 0 (0%)
Non-smoker 70 (100%)
TA B L E 2 Disease characteristics among studied patients
Disease characteristicsRA patients (N = 70)
Disease duration, y 7.3 ± 7
28 tender joint count 19.1 ± 9.5
28 swollen joint count 1.7 ± 4.2
VAS (pain score) 61.43 ± 20.7
CRP mg/dL 12.9 ± 10.6
ESR mm/h 45.8 ± 28.4
Positive RF, no. (%) 58 (82.8%)
CDAI score 33.1 ± 12.6
DAS28-ESR 5.14 ± 1.01
HAQ score 1.2 ± 0.6
PF-10a 34.6 ± 6.2
Comorbidity, no. (%) 33 (47.1%)
Drug history
Monotherapy 25 (35.7%)
Combined therapy 44 (62.9%)
Biologicals, no. (%) 1 (1.4%)
Note: All data are mean ± SD, except where mentioned otherwise.Abbreviations: CDAI, Clinical Disease Activity Index; CRP, C-reactive protein; DAS, Disease Activity Score; ESR, erythrocyte sedimentation rate; HAQ, Health Assessment Questionnaire; RF, rheumatoid factor; VAS, visual Analog Scale.

312 | FARRAG et Al.
3.3 | Disability scales
The results of HAQ-DI and PF-10a are presented in Table 2. The mean value of HAQ-DI was 1.2 ± 0.6. Most patients (41; 58.6%) had moderate to severe disability; 26 (37.1%) had mild to moderate dis-ability and 3 (4.3%) had severe to very severe disability. The mean value of the T score of PF-10a was 34.6 ± 6.2 indicating poor physi-cal function of the studied patients. The mean value of patient global assessment of pain (VAS) was 61.43 ± 20.7
3.4 | Reliability of PF 10-a items
Internal consistency was evaluated with Cronbach's alpha coeffi-cient of reliability; Cronbach's alpha was 0.904 indicating acceptable and strong levels of internal consistency as presented in Table 3.
The test–retest reliability of the Arabic version of the PF-10a questionnaire yielded an intra-class correlation of 0.897, which is >0.7 so it is acceptable and strong, Cronbach alpha was good for all questions and the total questionnaire in test–retest analysis except for Q1 and Q3 (˂0.7) as shown in Table 3.
3.5 | Validity of PF-10a items
The validity of PF-10a was tested against selected clinical and laboratory measures (Table 4). There was a strong significant nega-tive correlation between PF-10a and HAQ-DI (rs −0.746). A mod-erate negative correlation was found between PF-10a score and CDAI, patient global assessment and VAS pain scores (rs −0.457, −0.417, −0.371, respectively). A weak negative correlation was found between PF-10a and SJC, and TJC (rs −0.245, and −0.301) respectively.
3.6 | Predictors of disability according to PF-10a items
In a multinomial logistic regression for prediction of PF-10a only dis-ease duration could predict disability among the studied patients as presented in Table 5. Physical function is affected by presence of bone erosions as PF-10a value was 28.6 ± 6.5 for patients who had bone erosions and was 35 ± 6.1 for patients who had no bone ero-sions (P < .05). It was also affected by presence of comorbid diseases such as diabetes mellitus and hypertension as PF-10a mean value was 28.8 ± 5.4 in presence of comorbid diseases and was 35.5 ± 6 in absence of it (P < .05).
4 | DISCUSSION
This study was carried out as a presentation to the process of cross-cultural adaptation of the PF-10a to the Arabic language and pro-vided evidence of its reliability and validity in Egyptian patients with RA.
The procedures of translation and cultural adaptation found no major problems and most of the participants found the questionnaire easy to understand and complete and reported the questions to be good descriptions, which fit with their feelings. We believe that this result indicates the statements in PF-10a were easy to comprehend and the questionnaire is ready for use by the Arabic population. The next stage of the study was to determine whether the PF-10a was a valid and reliable instrument. The two forms of reliability are internal consistency and test–retest reliability.
The Cronbach's alpha value related to PF-10a was strong (0.904). Except for questions 1 and 3. Test–retest reliability was based on the results of applying the same instrument to the same individuals twice in a predetermined time interval. The interval in our study was determined to be 3-5 days;16 intra-class correlation was used to as-sess reliability between the 2 measurements, and it was 0.897. The results indicated that the PF-10a had excellent test–retest reliability. TA B L E 3 Intra-class correlation coefficient of the PF-10a
questionnaire
ItemsCronbach's alpha
Intra-class correlation
95% CI
Lower boundary
Upper boundary
Q1 0.595 0.597 0.351 0.75
Q2 0.726 0.727 0.561 0.83
Q3 0.667 0.66 0.456 0.788
Q4 0.722 0.702 0.51 0.817
Q5 0.861 0.861 0.777 0.913
Q6 0.742 0.744 0.588 0.841
Q7 0.795 0.792 0.666 0.87
Q8 0.769 0.624 0.629 0.856
Q9 0.828 0.829 0.725 0.894
Q10 0.742 0.738 0.58 0.837
Total 0.904 0.897 0.829 0.938
TA B L E 4 Spearman's correlation of PF-10a scores and clinical and laboratory measures in 70 rheumatoid arthritis patients
Variable
PF-10a
Rho P
HAQ-DI −0.746 <.001*
CDAI −0.457 <.001*
VAS global −0.417 <.001*
VAS pain −0.371 .002*
28 TJC −0.301 .011*
28 SJC −0.245 .041*
Abbreviations: CDAI, Clinical Disease Activity Index; HAQ-DI, Health Assessment Questionnaire Disability Index; PF-10a, Physical Function; SJC, swollen joint count; TJC, tender joint count; VAS global, patient global assessment of disease activity; VAS, Visual analog scale.*Correlation is significant at the 0.05 level (2-tailed).

| 313FARRAG et Al.
PF-10a seems both practical and acceptable for use in a general practice setting.
In our evaluation of convergent and discriminant validity, PF-10a scores correlated strongly with the HAQ (−0.746), moderately with CDAI, patient global assessment and pain scores (−0.457, −0.417, −0.371) and poorly correlated with SJC, TJC. This is consistent with a study reported by Wahl et al, (2017) who found that PF-10a scores correlated strongly with the HAQ, patient global assessment by VAS, and pain scores (VAS) (−0.874, −0.720, −0.631), but did not correlate with SJCs or TJCs (−0.280, −0.293).17 Also, in another study by Wahl et al (2018), they reported that the shorter physical function mea-sure PROMIS-PF-10a outperformed HAQ in an ethnically diverse, urban RA clinic population.18 There was a statistically significant correlation between PROMIS-PF-10a and HAQ scores of r = −0.61, and a modest significant correlation between PROMIS-PF-10a and CDAI scores of r = −0.48. This high correlation with HAQ strongly suggests that PF-10a and HAQ are measuring the same underlying construct, so clinicians will still be able to monitor physical function as they have with HAQ.
Several interpretations of the poor correlation of PF10-a with joint counts are possible. Tender and swollen joint counts are per-formed by a physician and are not self-reported. Others have sug-gested that clinical outcome measures (tender and swollen joints) should be less strongly related to a patient-reported PF scale.
RA has a significant effect on the health-related quality of life of patients. Most of our studied patients were disabled (46; 65.7%), according to HAQ score with mean value of HAQ-DI being 1.2 ± 0.6. This is consistent with those of the RA patients studied by Kamel et al in Egypt (2018).19 Also, the mean value of PF-10a was 34.6 ± 6.2, indicating low physical function of studied patients compared to PF-10a mean value reported from the USA either from Caucasians, and multi-ethnic patients (42.4 ± 10.2 and 44.3 ± 9.3).17,18 This may be due to Egyptian RA patients being significantly younger, had more
active disease, and more frequent use of non-steroidal anti-inflam-matory drugs, methotrexate and steroids and significantly lower use of bDMARDs. The average patient global assessment pain score (VAS) among our studied patients was 61.43 ± 20.7; this is consistent with the results stated by Vlaar and colleagues' study, as they found that Egyptian patients suffer from higher pain intensity than did Dutch patients.20 This high level of TJC and other PROs also might affect the composite measures of disease activities in disabilities in these patients.
In our study the disease duration was the most influencing factor on PF which is consistent with the study performed by Gamal et al, in quality of life assessment of Egyptian RA patients as they reported that the disease duration was the most influencing factor on both physical and mental functions.21
Several limitations of this study include the small number of pa-tients, no longitudinal data, no comparison with a generic measure such as Short Form-36 physical function and no normative data for PF-10a for the general Egyptian population to compare with it.
In conclusion, this cross-cultural study provided evidence that a linguistically validated Arabic version of PF10-a had an acceptable reliability and validity in a cohort of middle-aged patients with active RA from a developing country with a limited resource for biological therapy. The Arabic version of PF-10a is a valid and reliable instru-ment to be used to assess the physical function of RA patients in Arabic-speaking nations.
ACKNOWLEDG EMENTThe authors thank Helena Correia, Director of Translations, Dept. of Medical Social Sciences, Northwestern University and Emna Maksud, Research Project Coordinator, Dept. of Medical Social Sciences, Northwestern Univ. Feinberg School of Medicine for their cooperation in translation of PF10-a measure.
ORCIDAly Elsayed Mohamed https://orcid.org/0000-0003-0122-4180
R E FE R E N C E S 1. Söderlin MK, Kautiainen H, Skogh T, Leirisalo-Repo M. Quality
of life and economic burden of illness in very early arthritis. A population based study in southern Sweden. J Rheumatol. 2004;31(9):1717-1722.
2. Abdel-Nasser AM, Rasker JJ, Valkenburg HA. Epidemiological and clinical aspects relating to the variability of rheumatoid arthritis. Semin Arthritis Rheum. 1997;27(2):123-140.
3. Usenbo A, Kramer V, Young T, Musekiwa A. Prevalence of arthritis in Africa: a systematic review and meta-analysis. Nurmohamed M, ed. PLoS ONE. 2015;10:e0133858. https ://doi.org/10.1371/journ al.pone.0133858
4. Gabriel SE, Michaud K. Epidemiological studies in incidence, prev-alence, mortality, and comorbidity of the rheumatic diseases. Arthritis Res Ther. 2009;11(3):229.
5. Felson DT, Anderson JJ, Boers M, et al. American college of rheu-matology preliminary definition of improvement in rheumatoid ar-thritis. Arthritis Rheum. 1995;38(6):727-735.
6. Liang MH, Jette AM. Measuring functional ability in chronic arthri-tis: a critical review. Arthritis Rheum. 1981;24(1):80-86.
TA B L E 5 Multinomial logistic regression for prediction of physical function as determined by PF-10a score in 70 Egyptian patients with rheumatoid arthritis
Independent variables OR
95% CI OR
PLower Upper
Age 0.137 −1.797 1.201 .692
Gender 0.260 −0.004 0.017 .244
Disease duration −0.009 0.064 0.710 .02*
ESR 0.085 −0.015 0.014 .938
CRP 0.014 −0.003 0.006 .489
RF −0.012 −0.222 0.253 .899
Erosions −0.015 −0.001 0.001 .914
VAS for pain 0.095 −0.501 0.441 .9
Global VAS 0.173 −0.004 0.008 .469
Abbreviations: CRP, C-reactive protein; ESR, erythrocyte sedimentation rate; RF, rheumatoid factor; VAS, visual analog scale.*Multivariate logistic regression is statistically significant (P ˂ .05).

314 | FARRAG et Al.
7. Fries JF, Spitz P, Kraines RG, Holman HR. Measurement of patient outcome in arthritis. Arthritis Rheum. 1980;23(2):137-145.
8. Pincus T, Summey JA, Soraci SA, Wallston KA, Hummon NP. Assessment of patient satisfaction in activities of daily living using a modified Stanford Health Assessment Questionnaire. Arthritis Rheum. 1983;26(11):1346-1353.
9. Fries JF, Witter J, Rose M, Cella D, Khanna D, Morgan-DeWitt E. Item Response theory, computerized adaptive testing, and PROMIS: assessment of physical function. J Rheumatol. 2014;41(1):153-158.
10. Fries JF, Cella D, Rose M, Krishnan E, Bruce B. Progress in assessing physical function in arthritis: PROMIS short forms and computer-ized adaptive testing. J Rheumatol. 2009;36(9):2061-2066.
11. Bjorner JB, Rose M, Gandek B, Stone AA, Junghaenel DU, Ware JE. Method of administration of PROMIS scales did not signifi-cantly impact score level, reliability, or validity. J Clin Epidemiol. 2014;67(1):108-113.
12. Rose M, Bezjak A. Logistics of collecting patient-reported outcomes (PROs) in clinical practice: an overview and practical examples. Qual Life Res. 2009;18(1):125-136.
13. El Meidany YM, El Gaafary MM, Ahmed I. Cross-cultural adapta-tion and validation of an Arabic Health Assessment Questionnaire for use in rheumatoid arthritis patients. Joint Bone Spine. 2003;70(3):195-202.
14. Aletaha D, Neogi T, Silman AJ, et al. 2010 Rheumatoid arthritis clas-sification criteria: an American College of Rheumatology/European League Against Rheumatism collaborative initiative. Arthritis Rheum. 2010;62(9):2569-2581.
15. PROMIS. http://www.healt hmeas ures.net/explo re-measu rement- syste ms/promis
16. Sousa VD, Rojjanasrirat W. Translation, adaptation and valida-tion of instruments or scales for use in cross-cultural health care research: a clear and user-friendly guideline. J Eval Clin Pract. 2011;17(2):268-274.
17. Wahl E, Gross A, Chernitskiy V, et al. Validity and Responsiveness of a 10-item patient-reported measure of physical function in a rheumatoid arthritis clinic population. Arthritis Care Res (Hoboken). 2017;69(3):338-346.
18. Less Is More: The Shorter Physical Function Measure Promis-PF10a Outperforms HAQ in an Ethnically Diverse, Urban Rheumatoid Arthritis Clinic Population - ACR Meeting Abstracts. https ://acrab strac ts.org/abstr act/less-is-more-the-short er-physi cal-funct ion-measu re-promis-pf10a-outpe rforms-haq-in-an-ethni cally-diver se-urban-rheum atoid-arthr itis-clinic-popul ation/
19. Kamel S. Using Rheumatoid Arthritis Disease Activity Index-5 questionnaire in the assessment of disease activity in patients with rheumatoid arthritis: correlation with quality of life, pain, and func-tional status. Egypt Rheumatol Rehabil. 2018;45(2):43.
20. Vlaar APJ, ten Klooster PM, Taal E, et al. A cross-cultural study of pain intensity in Egyptian and Dutch women with rheumatoid ar-thritis. J Pain. 2007;8(9):730-736.
21. Gamal RM, Mahran SA, Abo El Fetoh N, Janbi F. Quality of life assessment in Egyptian rheumatoid arthritis patients: Relation to clinical features and disease activity. Egyptian Rheumatol. 2016;38(2):65-70.
How to cite this article: Farrag SM, Abdelnaby MM, Mohamed AE. Adaptation and validation of an Arabic version of a 10-item patient-reported outcome measure of physical function in rheumatoid arthritis. Int J Rheum Dis. 2020;23:309–315. https ://doi.org/10.1111/1756-185X.13763

| 315FARRAG et Al.
© 2008- 2019 PROMIS Health Organization (PHO)
APPENDIX 1
THE AR ABIC VERSION OF PF-10A

316 | wileyonlinelibrary.com/journal/apl Int J Rheum Dis. 2020;23:316–324.
Received: 14 May 2019 | Revised: 4 September 2019 | Accepted: 30 November 2019
DOI: 10.1111/1756-185X.13780
O R I G I N A L A R T I C L E
Factors associated with successful discontinuation of certolizumab pegol in early rheumatoid arthritis
Yoshiya Tanaka1 | Tatsuya Atsumi2 | Kazuhiko Yamamoto3 | Tsutomu Takeuchi4 | Hisashi Yamanaka5 | Naoki Ishiguro6 | Katsumi Eguchi7 | Akira Watanabe8 | Hideki Origasa9 | Toshiharu Shoji10 | Nobuyuki Miyasaka11 | Takao Koike2,12
1The First Department of Internal Medicine, University of Occupational and Environmental Health, Japan, Kitakyushu, Japan2Hokkaido University Graduate School of Medicine, Sapporo, Japan3Center for Integrative Medical Sciences, RIKEN, Kanagawa, Japan4Keio University School of Medicine, Tokyo, Japan5Institute of Rheumatology, Tokyo Women's Medical University, Tokyo, Japan6Faculty of Medicine, Nagoya University Graduate School, Nagoya, Japan7Rheumatic and Collagen Disease Center, Sasebo Chuo Hospital, Sasebo, Japan8Tohoku Bunka Gakuen University, Sendai, Japan9Division of Biostatistics and Clinical Epidemiology, The University of Toyama Graduate School of Medicine, Toyama, Japan10UCB Pharma, Tokyo, Japan11Tokyo Medical and Dental University, Tokyo, Japan12Hokkaido Medical Center for Rheumatic Diseases, Sapporo, Japan
CorrespondenceYoshiya Tanaka, The First Department of Internal Medicine, University of Occupational and Environmental Health, Japan, Kitakyushu, Fukuoka, Japan.Email: [email protected]
Funding informationUCB Pharma.
AbstractAim: The Certolizumab–Optimal Prevention of joint damage for Early Rheumatoid Arthritis (C-OPERA) study demonstrated that in methotrexate (MTX)-naïve early RA patients with poor prognostic factors, 1-year certolizumab pegol (CZP) therapy added to the first year of 2-year optimized MTX therapy brings radiographic and clinical benefits through 2 years even after stopping CZP. This exploratory analysis aimed to identify factors at baseline and at CZP discontinuation associated with suc-cessful CZP discontinuation.Methods: MTX-naïve early RA patients with poor prognostic factors entered C-OPERA (NCT01451203), a multicenter, randomized controlled trial. Patients were randomized to CZP + MTX (n = 159) or PBO + MTX (n = 157); those who completed the 1-year, double-blind period received MTX alone in Year 2 (CZP + MTX→MTX, n = 108; PBO + MTX→MTX, n = 71). Association between factors at baseline or at discontinuation of CZP and clinical/radiographic outcomes were evaluated by multiple logistic regression analysis. Predictive value cut-offs were calculated using receiver operating characteristic analysis.Results: Sex (male) and low baseline Disease Activity Score of 28 joints – erythrocyte sedimentation rate (DAS28-ESR) were associated with simple disease activity index (SDAI) remission (≤3.3), whereas high baseline DAS28-ESR and modified total Sharp score (mTSS) were associated with clinically relevant radiographic progression (yearly progression mTSS > 3) at Week 104 (across both treatment arms). Low DAS28-ESR (<2.1) and rheumatoid factor (RF; <74 IU/mL) at discontinuation of CZP were associ-ated with SDAI remission at Week 104. At Week 104, SDAI remission was achieved by 75.0% (42/56) of patients with low DAS28-ESR and RF at discontinuation, com-pared to 15.4% (2/13) of patients with high DAS28-ESR and RF.Conclusion: Patients with low RF and low disease activity after treatment with CZP + MTX may be able to discontinue CZP without risk of loss of response.
K E Y W O R D S
anti-TNF, certolizumab pegol, discontinuation, early rheumatoid arthritis, prognostic factor
This is an open access article under the terms of the Creative Commons Attribution License, which permits use, distribution and reproduction in any medium, provided the original work is properly cited.© 2020 The Authors. International Journal of Rheumatic Diseases published by Asia Pacific League of Associations for Rheumatology and John Wiley & Sons Australia, Ltd

| 317TANAKA eT Al.
1 | INTRODUC TION
Rheumatoid arthritis (RA) is a chronic inflammatory disease char-acterized by progressive inflammatory synovitis, joint destruction and chronic disability. Anti-tumor necrosis factor (anti-TNF) agents provide an effective treatment option for patients with RA.1,2 Certolizumab pegol (CZP) is a humanized anti-TNF antibody frag-ment conjugated to polyethylene glycol, approved for the treatment of inflammatory diseases, including RA.3 Early treatment of patients with CZP has been associated with a reduction in inflammation, in-hibition of structural damage and improved long-term outcomes.4,5 Recent studies have investigated whether the clinical benefits of early CZP treatment are maintained following CZP withdrawal.
The Certolizumab–Optimal Prevention of joint damage for Early RA (C-OPERA) study was a phase 3, 2-year, multicenter study.5,6 C-OPERA demonstrated the clinical benefit of initial 1-year CZP treatment on 2-year optimized methotrexate (MTX) therapy, in MTX-naïve early RA patients with poor prognostic factors. C-OPERA was double-blind (DB) for the first year, with patients randomized to re-ceive either CZP or placebo (PBO) alongside MTX.6 For the second year (post-treatment [PT] period), CZP and PBO were discontinued and all patients were maintained on MTX alone.5 During the PT pe-riod, although most patients who had received CZP + MTX main-tained good clinical status after withdrawal of CZP, approximately 25% of patients (28/108) went on to flare.5 Identifying factors at baseline or at CZP discontinuation that are associated with dis-ease flare may help clinicians decide whether to cease or continue CZP treatment after attaining the desired response with initial CZP + MTX treatment.
In this present study, we performed post-hoc analyses on the C-OPERA data to identify factors at baseline and at CZP discontinu-ation associated with successful CZP discontinuation.
2 | METHODS
In the C-OPERA study (NCT01451203), the efficacy and safety of CZP + MTX were compared with PBO + MTX in MTX-naïve patients with early RA in Japan. Details of the C-OPERA study have been published elsewhere.5,6 In brief, eligible patients were within 1 year of disease onset and had poor prognostic factors including: positive for anti-cyclic citrullinated peptide antibody (anti-CCP, >3 times the upper limit of the normal range [ULN]), positive for rheumatoid fac-tor (RF) and/or bone erosions on radiographs of the hands or feet. Prior to the DB period, patients were randomized to receive either PBO + MTX or CZP + MTX. Optimized oral MTX was started at 8 mg/wk and escalated up to 16 mg/wk by Week 8, if tolerated. Patients who completed the 52-week DB period were eligible to enter the 52-week PT period. In the PT period, administration of PBO or CZP was discontinued but patients remained on optimized MTX ther-apy. Disease activity and van der Heijde modified total Sharp score (mTSS) were evaluated at baseline, Week 52, Week 104, and at with-drawal. Last observation carried forward analysis was employed for
clinical outcomes, and linear extrapolation was used for estimation of mTSS in patients who withdrew from the study.
2.1 | Baseline factors associated with simple disease activity index (SDAI) remission and clinically relevant radiographic progression at Week 52 in PBO + MTX patients
Associations between baseline factors and Week 52 outcomes were analyzed by logistic regression analysis. Factors included in the analysis were: Disease Activity Index of 28 joints – erythrocyte sedimentation rate (DAS28-ESR), Health Assessment Questionnaire Disability Index (HAQ-DI), mTSS, RF, anti-CCP antibody, matrix met-alloproteinase (MMP)-3, tumor necrosis factor (TNF)α, and interleu-kin (IL)-6. Log value + 1 was used to normalize mTSS, RF, anti-CCP antibody, MMP-3, TNFα, and IL-6 values. Univariate logistic regres-sion analysis was used to identify factors that were possibly associ-ated with SDAI remission (<3.3) and clinically relevant radiographic progression (cRRP, yearly progression mTSS > 3, unpublished). Multivariate logistic regression analysis was applied for factors with a P value <0.1 to identify independent predictive factors. Factors with a P value <.05 were considered to be associated.
2.2 | Baseline factors associated with maintenance of clinical response
Analyses in this section were performed for all patients who entered the C-OPERA study (irrespective of treatment arm allocation). The association of baseline factors and CZP treatment with Week 104 outcomes was evaluated by logistic regression analysis. Patient char-acteristics, including age, gender, and body mass index (BMI), and baseline disease status, including DAS28-ESR, HAQ-DI, mTSS, RF, anti-CCP antibody, and MMP-3 were evaluated in the analysis. Log value + 1 was used to normalize mTSS, RF, anti-CCP antibody and MMP-3 values. Multiple logistic regression analysis was applied to factors identified with a P value <.1 during the univariate analysis.
2.3 | Factors at CZP discontinuation associated with maintenance of clinical response
All analyses in this section were performed for patients who were originally allocated to the CZP + MTX group and entered the PT pe-riod. Association between factors at Week 52 (discontinuation of CZP) and Week 104 outcomes were analyzed by logistic regression analy-sis. Factors included in the analysis were: DAS28-ESR, HAQ-DI, mTSS, RF, anti-CCP antibody, and MMP-3. Log value + 1 was used for mTSS, RF, anti-CCP antibody, and MMP-3 to normalize values. Univariate lo-gistic regression analysis was used to identify factors associated with the clinical outcomes. Factors with P value <.1 were included in the multiple logistic regression analysis to identify independent predictive

318 | TANAKA eT Al.
factor(s); the Youden index on the receiver operating characteristic curves was used to estimate appropriate cut-off values for these fac-tors. The proportion of patients achieving SDAI remission was calcu-lated for patients with values that were lower than, and equal to or higher than, the cut-off value of the relevant predictive factor(s).
3 | RESULTS
Patients in the C-OPERA study were randomized to CZP + MTX (n = 159) or PBO + MTX (n = 157); patients who completed the 1-year, DB period received MTX alone in Year 2 (CZP + MTX→MTX, n = 108; PBO + MTX→MTX, n = 71).5,6 As previously reported, SDAI remission (≤3.3) at baseline, Week 52, and Week 104 was 0.0% (0/157), 33.8% (53/157) and 29.3% (46/157) in the PBO + MTX group, and 0.0% (0/159), 57.9% (92/159) and 41.5% (66/159) in the CZP + MTX group, respectively.5,6 In patients who were treated with CZP + MTX in Year 1 (DB period) and entered Year 2 (PT period), the
previously reported SDAI remission at Week 52 and Week 104 was 79.6% (86/108) and 55.6% (60/108), respectively.5
cRRP during Year 1 (DB period) was 15.3% (24/157) and 5.0% (8/159), in PBO + MTX and CZP + MTX, respectively. cRRP during Year 2 (PT period) in patients who were treated with CZP + MTX in Year 1 was 0.9% (1/108).
3.1 | Baseline factors associated with a clinical response at Week 52 in the PBO + MTX treatment group
In the MTX + PBO arm, low baseline DAS28-ESR and low HAQ-DI were associated with SDAI remission at Week 52 by univariate analysis (Table 1). After multivariate adjustment, low DAS28-ESR was the only factor associated with SDAI remission (odds ratio 0.57, 95% CI 0.38-0.86, P = .007). Using univariate analysis, base-line DAS28-ESR, HAQ-DI, mTSS, MMP-3, and IL-6 were all shown to associate with cRRP in the PBO + MTX group. Multivariate
SDAI remissionOdds ratio95% CIP value
cRRPOdds ratio95% CIP value
Univariate Multivariate Univariate Multivariate
DAS28-ESR 0.560.41-0.77<.001
0.570.38-0.86.007
2.031.33-3.1.001
1.390.74-2.59.302
HAQ-DI 0.520.31-0.88.016
0.940.48-1.83.847
2.491.33-4.65.004
1.380.57-3.35.475
mTSS 0.820.59-1.14.229
- 2.041.38-3.02<.001
2.021.3-3.17.002
RF 1.060.77-1.45.728
- 1.510.97-2.36.068
1.180.74-1.87.492
Anti-CCP antibody 0.880.59-1.3.509
- 0.940.56-1.56.801
-
MMP-3 0.890.63-1.27.530
- 1.821.14-2.9.012
1.000.54-1.86.989
TNFα 1.00.69-1.65.778
- 1.160.69-1.95.576
-
IL-6 0.80.61-1.05.109
- 1.981.32-2.96<.001
1.610.95-2.72.077
Abbreviations: CCP, cyclic citrullinated peptide; cRRP, clinically relevant radiographic progression; CZP, certolizumab pegol; DAS28-ESR, Disease Activity Score of 28 joints - erythrocyte sedimentation rate; HAQ-DI, Health Assessment Questionnaire Disability Index; IL-6, interleukin 6; MMP-3, matrix metalloproteinase; mTSS, van der Heijde modified total Sharp score; MTX, methotrexate; PBO, placebo; RF, rheumatoid factor; SDAI, simple disease activity index; TNFα, tumor necrosis factor α.
TA B L E 1 Logistic regression analysis of association between baseline factors and clinical and radiographic outcomes at Week 52 in patients assigned to the PB0 + MTX treatment arm

| 319TANAKA eT Al.
analyses identified mTSS as the only independent predictive fac-tor for cRRP (Table 1).
3.2 | Baseline factors associated with maintenance of clinical response
In univariate analyses, CZP treatment was associated with a higher SDAI remission rate and a lower cRRP rate at Week 104. Out of the remaining factors included in the analysis, only gender, BMI, base-line DAS28-ESR and HAQ-DI were also associated with SDAI re-mission at Week 104 (Table 2). After adjustment for these factors, Week 104 SDAI remission was associated with gender (P = .026),
baseline DAS28-ESR (P = .012), and CZP treatment (P = .047; Table 2).
Baseline factors associated with cRRP were DAS28-ESR, HAQ-DI, mTSS, RF, MMP-3, and CZP treatment. After adjustment for these factors, Week 104 cRRP was associated with baseline DAS28-ESR (P = .044), mTSS (P < .001), and CZP treatment (P = .017; Table 1).
3.3 | Factors at CZP discontinuation associated with maintenance of clinical response
Univariate and multiple logistic regression analyses showed that DAS28-ESR and RF at CZP discontinuation (Week 52) were
SDAI remissionodds ratio(95% CI)P value
cRRPodds ratio95% CIP value
Univariate Multiple Univariate Multiple
Age 0.99(0.97-1.01).322
1.00(0.96-1.04).950
Gender 0.51(0.29-0.91).022
0.51(0.28-0.92).026
1.20(0.44-3.26).727
BMI 0.94(0.88-1.01).082
0.93(0.87-1.00).051
0.97(0.87-1.08).589
DAS28-ESR 0.63(0.51-0.79)<.001
0.70(0.53-0.92).012
2.03(1.42-2.90)<.001
1.63(1.01-2.62).044
HAQ-DI 0.56(0.38-0.80).002
0.78(0.48-1.26).309
2.32(1.34-4.02).003
1.37(0.67-2.81).393
mTSS 0.77(0.61-0.98).032
0.80(0.62-1.02).077
2.08(1.50-2.89)<.001
2.00(1.37-2.92)<.001
RF 1.00(1.00-1.00).971
1.00(1.00-1.00).009
1.00(1.00-1.00).353
Anti-CCP antibody 1.00(1.00-1.00).381
1.00(1.00-1.01).379
MMP-3 1.00(1.00-1.00).312
1.00(1.00-1.00).024
1.00(1.00-1.00).948
CZP treatment 1.71(1.07-2.73).024
1.65(1.01-2.69).047
0.33(0.14-0.76).009
0.33(0.13-0.81).017
Abbreviations: BMI, body mass index; CCP, cyclic citrullinated peptide; cRRP, clinically relevant radiographic progression; CZP, certolizumab pegol; DAS28-ESR, Disease Activity Score of 28 joints - erythrocyte sedimentation rate; HAQ-DI, Health Assessment Questionnaire Disability Index; MMP-3, matrix metalloproteinase; mTSS, van der Heijde modified total Sharp score; MTX, methotrexate; PBO, placebo; RF, rheumatoid factor; SDAI, simple disease activity index.Bold indicates factors shown to reach significance in univariate/multivariate analyses.
TA B L E 2 Logistic regression analysis of association between baseline factors and clinical and radiographic outcomes at Week 104 in patients randomized to CZP + MTX (n = 159) or PBO + MTX (n = 157)

320 | TANAKA eT Al.
associated with SDAI remission 1 year after stopping CZP treatment (Week 104; Table 3). There was a rapid reduction in disease activity (indicated by both DAS28-ESR and SDAI measures) with CZP treat-ment, and only a slight increase was observed after discontinuation of CZP (Figure 1). RF at discontinuation of CZP treatment (Week 52) was lower compared to baseline (Figure 2).
Calculated Week 52 DAS28-ESR and RF cut-off values for SDAI remission at Week 104 were 2.1 and 74 IU/mL, respectively. SDAI re-mission rates at Week 104 in patients with lower and higher DAS28-ESR at discontinuation were 70.1% (47/67) and 31.7% (13/41), respectively. Out of the patients with lower RF values at discon-tinuation of CZP, 63.1% (53/84) achieved SDAI remission at Week 104, compared to 29.2% (7/24) of patients with RF values above the cut-off (74 IU/mL) at discontinuation. Higher rates of SDAI remission (75.0%, 42/56) at Week 104 were observed in patients with lower DAS28-ESR and RF at Week 52, whereas a very low remission rate (15.4%, 2/13) was reported among patients with higher values for both DAS28-ESR and RF. Patients with higher DAS28-ESR and lower RF, and patients with lower DAS28-ESR and higher RF at Week 52 showed intermediate rates of remission (Figure 3). The distribution of disease activity at baseline, Week 52, and Week 104 stratified by
Week 52 DAS28-ESR and RF is presented in Figure 4. In patients with high disease activity at baseline, 16 out of 24 patients (66.7%) with low DAS28-ESR and low RF at Week 52 were in SDAI remis-sion at Week 104; whereas only 1 patient out of 9 (11.1%) with high DAS28-ESR and high RF at baseline was in remission at Week 52.
4 | DISCUSSION
In recent years, the use of MTX as an anchor drug, the introduction of biological disease-modifying anti-rheumatic drugs and implemen-tation of treat-to-target (T2T) strategies, along with the introduction and increased use of early intervention treatment protocols, have markedly improved RA patient outcomes. Owing to these advances in RA treatment, many patients achieve either remission or a low disease activity state. Nevertheless, the number of patients with an active disease state is not negligible. Consequently, identification of risk factors associated with poor outcomes after initiation of treat-ment is important for the development of effective personalized treatment strategies.
Some studies have suggested the possibility of discontinuing or interrupting treatment with biologics after attainment of clini-cal response.7-9 However, identifying the patients who can discon-tinue treatment without going on to flare, can prove challenging. Therefore, it is of therapeutic value to identify factors that can be used to predict maintenance of a “good disease state” following dis-continuation of treatment with biologics. Furthermore, if biologic treatment could be stopped successfully in some patients, it would dramatically reduce the economic burden of RA therapy and any risk of adverse events related to prolonged biologic use.
The post-hoc analyses presented here aimed to provide clinicians with information to aid their decision-making both at the start of treatment, to help determine whether to opt for biologic co-therapy with MTX, and following disease control, to guide their decision re-garding the discontinuation of biologic treatment.
4.1 | Baseline factors associated with maintenance of clinical response
In C-OPERA, a substantial number of patients withdrew from the study, particularly from the placebo group. In the post-hoc analyses reported here, patient characteristics and baseline disease status were associated with clinical and radiographic outcomes; therefore, patient withdrawal due to disease activity has the potential to bias the observed results. However, after adjustment by multiple logistic regression analyses, there were significant improvements following treatment with CZP compared with placebo, suggesting that any bias had a limited impact on the results. Out of the factors evaluated, in-cluding patient characteristics and baseline disease status, sex (male) and a low DAS28-ESR were identified as independent predictive factors of Week 104 SDAI remission, and high DAS28-ESR and mTSS at baseline were associated with cRRP at Week 104. Although these
TA B L E 3 Logistic regression analysis of association between factors at Week 52 (CZP discontinuation) and clinical outcomes at Week 104 in patients who were treated with CZP + MTX in Year 1 and entered the post-treatment period (CZP + MTX→MTX, n = 108)
SDAI remissionodds ratio(95% CI)P value
Univariate Multiple
DAS28-ESR 0.29(0.16-0.54)<.001
0.29(0.16-0.54)<.001
HAQ-DI 0.47(0.11-2.03).309
mTSS 0.85(0.57-1.26).408
RF 0.69(0.50-0.95).022
0.67(0.47-0.96).028
Anti-CCP antibody 0.86(0.63-1.19).370
MMP-3 0.77(0.35-1.70).516
Abbreviations: CCP, cyclic citrullinated peptide; CZP, certolizumab pegol; DAS28-ESR, Disease Activity Score of 28 joints - erythrocyte sedimentation rate; HAQ-DI, Health Assessment Questionnaire Disability Index; MMP-3, matrix metalloproteinase; mTSS, van der Heijde modified total Sharp score; MTX, methotrexate; RF, rheumatoid factor; SDAI, simple disease activity index.

| 321TANAKA eT Al.
findings should be interpreted with caution due to the high num-ber of patient dropouts, these results are in line with findings from previous studies.10-12 Other factors, including auto-antibodies, were not associated with Week 104 outcomes (P > .05). In the C-OPERA study, only patients with high levels of anti-CCP antibody at baseline were included, therefore, it is not possible to draw conclusions re-garding the importance of baseline auto-antibodies, especially anti-CCP antibodies, in the prediction of long-term outcomes.
4.2 | Factors at CZP discontinuation associated with maintenance of clinical response
It has been suggested that discontinuation of biologic treatment without subsequent disease flare may be an achievable target, for example in early RA patients.13 In a previous study in early RA, lower disease activity at withdrawal (deep remission) was associated with discontinuation without disease flare,7,8 and the importance of the immunological state of patients in achieving disease “cure” was emphasized.14
In C-OPERA, patients treated with CZP + MTX who entered the PT period (discontinued CZP at Week 52) achieved SDAI remission rates at Weeks 52 and 104 of 79.6% and 55.6%, respectively.5 The post-hoc analysis presented here included factors utilized in the assessment of disease status. Lower levels of disease activity and lower levels of RF were independently associated with higher remis-sion rates after discontinuation of CZP. A better prediction of clinical response maintenance was observed when using a combination of
DAS28-ESR and RF, compared to DAS28-ESR or RF alone. Patients with both low disease activity and low RF at CZP discontinuation had a lower risk of active disease, whereas patients with relatively high disease activity and high RF at Week 52 had a higher risk of loss of response at Week 104. A small number of patients had ac-tive disease despite low disease activity and low RF at discontinua-tion, which may suggest the involvement of other, unknown factors. Nevertheless, the data presented here implicate disease activity and RF in the maintenance of disease control after discontinuation of CZP treatment.
In CZP-treated patients, both DAS28-ESR and RF were reduced at Week 52 compared to baseline. Both DAS28-ESR at baseline and at
F I G U R E 1 Change in disease activity in patients who were treated with CZP + MTX in Year 1 and entered the post-treatment period (CZP + MTX→MTX; N = 108). CZP, certolizumab pegol; DAS28(ESR), disease activity score 28(erythrocyte sedimentation rate); MTX, methotrexate; SDAI, Simple Disease Activity Index
F I G U R E 2 Reduction in rheumatoid factor levels in patients who were treated with CZP + MTX in Year 1 and entered the post-treatment period (CZP + MTX→MTX; N = 108). BL, baseline; CZP, certolizumab pegol; IQR, inter-quartile range; MTX, methotrexate

322 | TANAKA eT Al.
discontinuation were associated with SDAI remission at Week 104, in-dicating the importance of disease activity both before and after treat-ment with CZP. Overall, there was no association between baseline RF and Week 104 outcomes. This may reflect the greater importance
of immunological status at discontinuation, versus at baseline before biologic initiation, in maintenance of remission after cessation of CZP treatment. Recently, factors associated with maintenance of low dis-ease activity after stopping adalimumab in early RA patients were
F I G U R E 3 Subgroup analyses of SDAI remission at Week 104 by DAS28(ESR) and RF at Week 52 in patients who were treated with CZP + MTX in Year 1 and entered the post-treatment period (CZP + MTX→MTX; N = 108). CZP, certolizumab pegol; DAS28(ESR), disease activity score 28(erythrocyte sedimentation rate); MTX, methotrexate; RF, rheumatoid factor; SDAI, Simple Disease Activity Index
F I G U R E 4 Distribution of disease activity by Week 52 DAS28(ESR) and rheumatoid factor in patients who were treated with CZP + MTX in Year 1 and entered the post-treatment period (CZP + MTX→MTX; N = 108). CZP, certolizumab pegol; DAS28(ESR), disease activity score 28(erythrocyte sedimentation rate); MTX, methotrexate; RF, rheumatoid factor; SDAI, Simple Disease Activity Index

| 323TANAKA eT Al.
reported. In that report, disease activity and RF were associated with low disease activity 2 years after discontinuation of adalimumab.15 Taken together, immunological status PT and the good clinical status achieved with anti-TNFs may play a crucial role in long-term disease management in addition to the short-term control of disease activity.
CZP + MTX patients who entered the PT period of the C-OPERA study, maintained a very high radiographic non-progression rate, de-spite some patients withdrawing from the study due to disease flare. Radiographic non-progression during the first year of treatment was 91.7% and was maintained after CZP discontinuation (94.4%).5 Due to the small number of patients with radiographic progression in this group, the association between factors at Week 52 and cRRP was not analyzed.
The results of these post-hoc analyses suggest that patients with low disease activity and low RF may be able to consider discontinua-tion of CZP, whereas patients with high disease activity and/or high RF should consider continuing CZP treatment.
5 | CONCLUSIONS
The results of this post-hoc analyses indicate that disease activity and joint damage at the start of treatment are predictive of long-term outcomes in patients treated with optimized MTX plus CZP. Therefore, patients with poor prognostic factors may benefit from initial aggressive treatment with CZP and MTX. In addition to deep remission, low RF at discontinuation may be predictive of remission maintenance following discontinuation of CZP.
ACKNOWLEDG EMENTSThe authors thank the patients, the investigators and their teams who took part in this study. The authors acknowledge Pauline Ralston, UCB Pharma, for statistical support. The authors also ac-knowledge Arianna Psichas, PhD, and Simon Foulcer, PhD, from Costello Medical, UK, for medical writing and editorial assistance in preparing this manuscript for publication, based on the authors' input and direction.
CONFLIC T OF INTERE S TYT: Research grants and/or consulting fees: AbbVie, Asahi Kasei, Astellas, AstraZeneca, Bristol-Myers Squibb, Chugai, Daiichi-Sankyo, Eisai, Eli Lilly, GlaxoSmithKline, Janssen, Mitsubishi Tanabe Pharma, MSD, Pfizer, Quintiles, Takeda, and UCB Pharma; TA: Speakers’ fees: Astellas, Bristol-Myers Squibb, Chugai, and Mitsubishi Tanabe Pharma; KY: Research grants and/or consult-ing fees: Abbott, Bristol-Myers Squibb, Chugai, Eisai, Mitsubishi Tanabe Pharma, Pfizer, Roche, Santen, and UCB Pharma; TT: Research grants: Astellas, Chugai, Daiichi-Sankyo, Takeda, AbbVie GK, Asahi Kasei, Mitsubishi Tanabe Pharma, Pfizer Japan, Eisai, AYUMI, Nippon Kayaku, and Novartis; Speakers’ fees: AbbVie GK, Bristol-Myers KK, Chugai, Mitsubishi Tanabe Pharma, Pfizer Japan, Astellas, Daiichi-Sankyo, Eisai, Sanofi KK, Teijin Pharma, Takeda, Novartis KK; Consultant fees: AstraZeneca KK, Eli Lilly
KK, Novartis KK, Mitsubishi Tanabe Pharma, AbbVie GK, Nippon Kayaku, Janssen KK, Astellas, Taiho Pharmaceutical, Chugai, Taisho Toyama Pharmaceutical, GlaxoSmithKline KK, and UCB Pharma Japan; HY: Research grants and/or consulting fees: Abbott, Astellas, Bristol-Myers Squibb, Chugai, Eisai, Janssen, Mitsubishi Tanabe Pharma, Pfizer, Takeda, and UCB Pharma; NI: Research grants and/or speakers’ fees: Abbott, Astellas, Bristol-Myers Squibb, Chugai, Eisai, Janssen, Kaken, Mitsubishi Tanabe Pharma, Otsuka, Pfizer, Taisho-Toyama, and Takeda; KE: Consulting fees from UCB Pharma; AW: Research grants and/or speakers’ fees: Daiichi-Sankyo, Dainippon-Sumitomo, GlaxoSmithKline, Kyorin, Meiji Seika, Mitsubishi Tanabe Pharma, MSD, Pfizer, Shionogi, Taiho, and Taisho-Toyama; HO: None declared; NM: None de-clared; TK: Speakers’ bureau: AbbVie, Astellas, Asuka Pharma, Bristol-Myers, Chugai, Daiichi-Sankyo, Eisai, Mitsubishi Tanabe Pharma, Pfizer Japan, Teijin Pharma, and UCB Pharma; Consultant for: Bristol-Myers, Eli Lilly Japan, and Pfizer Japan.
DATA AVAIL ABILIT Y S TATEMENTThe datasets generated and analyzed for this article were derived from study data available in anonymized format upon reasonable re-quest via the Clinical Study Data Request platform (www.clini calst udyda tareq uest.com).
ORCIDTsutomu Takeuchi https://orcid.org/0000-0003-1111-8218
R E FE R E N C E S 1. Smolen JS, Landewé R, Bijlsma J, et al. EULAR recommendations
for the management of rheumatoid arthritis with synthetic and bi-ological disease-modifying antirheumatic drugs: 2016 update. Ann Rheum Dis. 2017;76:960-977.
2. Singh JA, Hossain A, Mudano AS, et al. Biologics or tofacitinib for people with rheumatoid arthritis naive to methotrexate: a system-atic review and network meta-analysis. Cochrane Database Syst Rev. 2017;5:Cd012657.
3. Deeks ED. Certolizumab pegol: a review of its use in the manage-ment of rheumatoid arthritis. Drugs. 2013;73:75-97.
4. Emery P, Bingham CO 3rd, Burmester GR, et al. Certolizumab pegol in combination with dose-optimised methotrexate in DMARD-naive patients with early, active rheumatoid arthritis with poor prognostic factors: 1-year results from C-EARLY, a randomised, double-blind, placebo-controlled phase III study. Ann Rheum Dis. 2017;76:96-104.
5. Atsumi T, Tanaka Y, Yamamoto K, et al. Clinical benefit of 1-year certolizumab pegol (CZP) add-on therapy to methotrexate treat-ment in patients with early rheumatoid arthritis was observed fol-lowing CZP discontinuation: 2-year results of the C-OPERA study, a phase III randomised trial. Ann Rheum Dis. 2017;76:1348-1356.
6. Atsumi T, Yamamoto K, Takeuchi T, et al. The first double-blind, randomised, parallel-group certolizumab pegol study in methotrex-ate-naive early rheumatoid arthritis patients with poor prognostic factors, C-OPERA, shows inhibition of radiographic progression. Ann Rheum Dis. 2016;75:75-83.
7. Tanaka Y, Hirata S, Kubo S, et al. Discontinuation of adalimumab after achieving remission in patients with established rheumatoid arthritis: 1-year outcome of the HONOR study. Ann Rheum Dis. 2015;74:389-395.
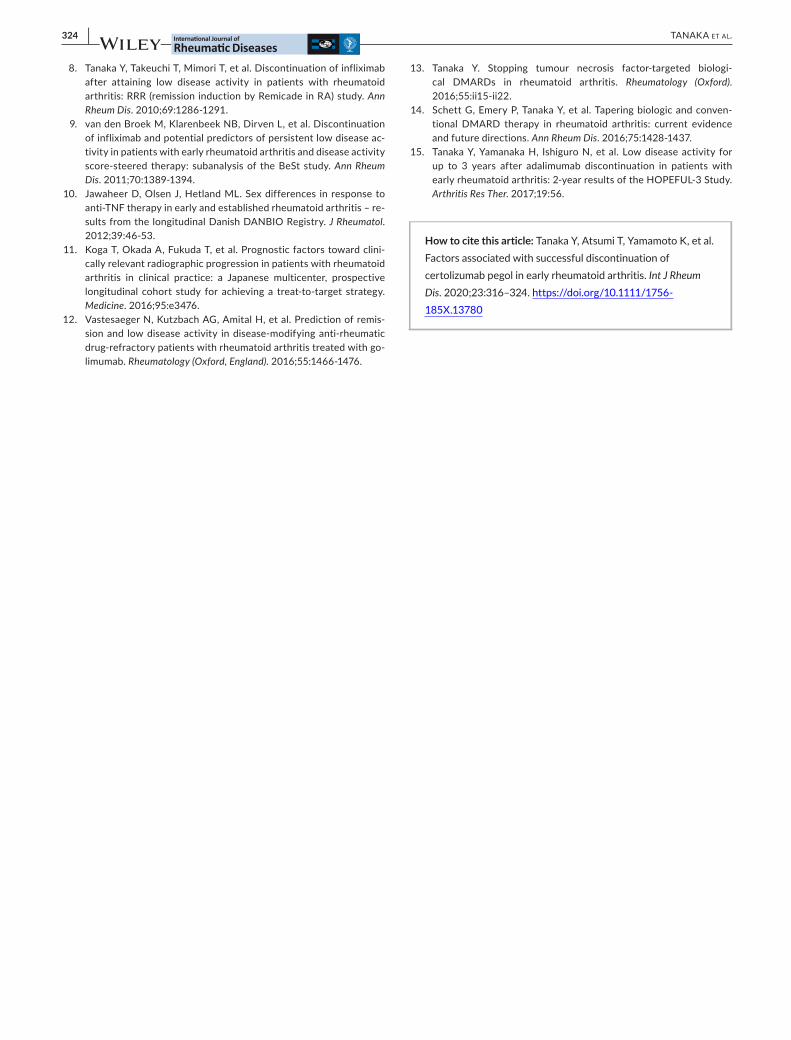
324 | TANAKA eT Al.
8. Tanaka Y, Takeuchi T, Mimori T, et al. Discontinuation of infliximab after attaining low disease activity in patients with rheumatoid arthritis: RRR (remission induction by Remicade in RA) study. Ann Rheum Dis. 2010;69:1286-1291.
9. van den Broek M, Klarenbeek NB, Dirven L, et al. Discontinuation of infliximab and potential predictors of persistent low disease ac-tivity in patients with early rheumatoid arthritis and disease activity score-steered therapy: subanalysis of the BeSt study. Ann Rheum Dis. 2011;70:1389-1394.
10. Jawaheer D, Olsen J, Hetland ML. Sex differences in response to anti-TNF therapy in early and established rheumatoid arthritis – re-sults from the longitudinal Danish DANBIO Registry. J Rheumatol. 2012;39:46-53.
11. Koga T, Okada A, Fukuda T, et al. Prognostic factors toward clini-cally relevant radiographic progression in patients with rheumatoid arthritis in clinical practice: a Japanese multicenter, prospective longitudinal cohort study for achieving a treat-to-target strategy. Medicine. 2016;95:e3476.
12. Vastesaeger N, Kutzbach AG, Amital H, et al. Prediction of remis-sion and low disease activity in disease-modifying anti-rheumatic drug-refractory patients with rheumatoid arthritis treated with go-limumab. Rheumatology (Oxford, England). 2016;55:1466-1476.
13. Tanaka Y. Stopping tumour necrosis factor-targeted biologi-cal DMARDs in rheumatoid arthritis. Rheumatology (Oxford). 2016;55:ii15-ii22.
14. Schett G, Emery P, Tanaka Y, et al. Tapering biologic and conven-tional DMARD therapy in rheumatoid arthritis: current evidence and future directions. Ann Rheum Dis. 2016;75:1428-1437.
15. Tanaka Y, Yamanaka H, Ishiguro N, et al. Low disease activity for up to 3 years after adalimumab discontinuation in patients with early rheumatoid arthritis: 2-year results of the HOPEFUL-3 Study. Arthritis Res Ther. 2017;19:56.
How to cite this article: Tanaka Y, Atsumi T, Yamamoto K, et al. Factors associated with successful discontinuation of certolizumab pegol in early rheumatoid arthritis. Int J Rheum Dis. 2020;23:316–324. https ://doi.org/10.1111/1756-185X.13780

Int J Rheum Dis. 2020;23:325–333. wileyonlinelibrary.com/journal/apl | 325© 2019 Asia Pacific League of Associations for Rheumatology and John Wiley & Sons Australia, Ltd
1 | INTRODUC TION
Rheumatoid arthritis (RA) is one of those chronic musculoskeletal illnesses that are responsible for disability globally.1,2 The disease
predominantly affects joints that result in difficulty in mobilization and locomotion.3 Gradually it deforms the joints resulting in joint stiff-ness, pain, inflammation and diminished joint movement.4 The disease is known to affect work ability and studies report that many patients
Received: 10 October 2019 | Revised: 27 November 2019 | Accepted: 2 December 2019
DOI: 10.1111/1756-185X.13776
O R I G I N A L A R T I C L E
Estimation of direct cost of managing rheumatoid arthritis treatment to Pakistani patients using real-world follow-up data
Atta Abbas Naqvi1 | Mohamed Azmi Hassali1 | Syed Baqir Shyum Naqvi2 | Bharti Kachela3 | Irfanullah Khan4
1Discipline of Social and Administrative Pharmacy, School of Pharmaceutical Sciences, Universiti Sains Malaysia, Penang, Malaysia2Faculty of Pharmacy, Hamdard University, Karachi, Pakistan3Department of Medical Affairs and Pharmacovigilance, Searle Pakistan Ltd, Karachi, Pakistan4Discipline of Clinical Pharmacy, School of Pharmaceutical Sciences, Universiti Sains Malaysia, Penang, Malaysia
CorrespondenceAtta Abbas Naqvi, Discipline of Social and Administrative Pharmacy, School of Pharmaceutical Sciences, Universiti Sains Malaysia, 11800 Penang, Malaysia.Email: [email protected]
AbstractObjective: This study aimed to estimate annual direct cost attributed to rheumatoid arthritis (RA) treatment from a patient's perspective using real-world patient follow-up data from hospitals’ electronic database.Methods: A prospective 1-year study was conducted in rheumatology clinics of ter-tiary care hospitals of Karachi, Pakistan. Cost-of-illness methodology was used and all patient data related to costs of rheumatologist visits, physical therapy sessions, medications, assistive devices and laboratory investigations were obtained directly in printed hardcopies from patient electronic databases using their medical record numbers. Transportation cost was calculated from patient-reported log books. Data were analyzed through IBM SPSS version 23. Patients were asked to sign a written consent and the study was ethically approved.Results: The mean age of patients (N = 358) was 48 years. Most patients (73.7%) were female, married (86%) and had basic education (71.8%). Average cost of rheu-matologist visits was PKR 11 510.61 (USD: 72.05) while it was PKR 66 947.37 (USD: 419.07) for physical therapy sessions. On average, medicines and medical devices costs were estimated at PKR 10 104.23 (USD: 63.25) and PKR 7848.48 (USD: 49.13) respectively. Cost attributed to diagnostic and laboratory charges was PKR 1962.12 (USD: 12.28) and travel expense was PKR 6541 (USD: 40.95). The direct expenditure associated with managing RA was PKR 37 558 (USD: 235.1). All costs were reported per annum.Conclusion: Patient with RA in Pakistan pay a considerable amount of their income for managing their condition. Most patients have no provision for insurance which is a need considering the nature of the disease and associated productivity loss that would significantly lower income as the disease progresses.
K E Y W O R D S
cost analyses, direct cost, health care economics, health expenditure, rheumatoid arthritis

326 | NAQVI et Al.
with RA retire from work early. Thus, employability of an individual is grossly affected due to RA and together with sufferings, it adversely affects health-related quality of life.5 The economic burden of RA is high not from a patient's perspective alone. From the perspective of an employer, the direct and indirect expenditure on an employee with RA was almost three times more than the expenditure on a healthy worker, that is, USD: 17 822 compared to USD: 6131, respectively.6
Studies report a relatively low prevalence of RA globally, that is, 0.5%-1%.5 The prevalence of the disease varies according to re-gions and has been higher in countries of polar and torrid regions. Hunter and colleagues reported that prevalence of RA in US popula-tion during 2004-14 was between 0.53% to 0.55%. The disease was more common among females and a prevalence of 0.73%-0.78% was estimated in females.7 The prevalence of RA in the USA appeared to increase during the period from 2004 to 2014, affecting a conser-vative estimate of 1.28-1.36 million adults in 2014. The prevalence was 0.9% in Canadian population, while it was between 0.6%-1% in Japan.1,8,9 A national study in the UK reported a prevalence of 0.67% for RA.10 In the European region, prevalence of RA disease was 0.14%, (0.0%-0.22%) for males and 0.38%, (0.24%-0.57%) for females. Further, in Western Europe it was 0.24%, (0.21%-0.28%) for males and 0.63%, (0.55%-0.75%) for females. There is a dearth of epidemiological studies estimating prevalence of RA in Pakistani population. In a systematic review, Naqvi and colleagues reported a prevalence of 0.142% for RA disease in Pakistani population.1
Although global prevalence of RA is not as high as other chronic ill-nesses, evidence indicates that a high economic burden is attributed to the disease. The annual direct cost of managing this rheumatic condi-tion was estimated at 1812 to 11 792 Euros while annual indirect costs were seen to be even higher, that is, 1260 to 37 994 Euros.11 Annual RA treatment and management accounted for USD 10.9 billion.12 In a Polish study, it was reported that the disease resulted in productivity loss that was mainly due to absenteeism and informal care.13
Two studies have been conducted in Pakistani populations that have endeavored to estimate direct health expenditure on RA from a patient's perspective. However, both had shortcomings as the study by Waheed and colleagues did not report what service within RA treatment (for example, consultation, physical therapy, labora-tory, etc., accounted for what proportion within total cost.14 Study by Ahmed did not incorporate physical therapy costs while calculat-ing total direct expenditure attributed to RA treatment.15 Therefore, there was a likelihood that the direct cost of managing this disease is underreported in this population. This study was conducted with the aim to include all possible treatment care within management of RA and estimate their annual cost prospectively using real-world patient follow-up data.
2 | METHODS
A 1-year prospective study was conducted in rheumatology depart-ments of five tertiary care hospitals in Karachi during March 2018
to February 2019. The study targeted patients with RA disease who presented to rheumatology clinics.
2.1 | Study objectives
The study aimed to estimate direct costs incurred in the treatment of RA from a patient's perspective using real-world patient follow-up data from hospitals’ electronic database.
2.2 | Study setting and duration
This study was conducted in rheumatology departments of two public sector and three private sector tertiary care hospitals lo-cated in the city of Karachi, Pakistan. All hospitals were located in different areas and had campuses spread across different city districts that catered for demands of patients from different so-cio-economic background. This approach helped in sampling a rep-resentative population.
2.3 | Cost calculation and perspective
The cost-of-illness methodology was used to estimate annual direct costs of treating RA.14-17 According to Rat and Boissier, direct costs associated with RA treatment include visits to rheumatologists, visits to other healthcare professionals for treatment such as physical thera-pists, diagnostic imaging such as X-rays, magnetic resonance imaging, and so on, laboratory tests, assistive devices and medications. Other di-rect costs include visiting other clinics such as emergency department, surgery, and so on, and non-medical costs such as travel expenses.11 We calculated all costs that were available in electronic database of the hospitals. However, travel expenses were documented prospectively by providing patients with a logbook. The costing was based on a pa-tient's perspective and mode of calculation was prospective.
2.4 | Outcomes
We estimated the cost of; rheumatologist visits, sessions with a physical therapist, any assistive devices and medications. For each patient, the annual cost of visits to a rheumatologist was calculated as the product of visits and the cost per visit:
where, CRh is the annual cost of visits to rheumatologist, naRh, the num-ber of visits annually and Cv is the cost per visit. The annual cost of sessions with a physical therapist was calculated as the product of total sessions and per session cost:
CRh=naRh×Cv
CPt=ns×Cs

| 327NAQVI et Al.
where, CPt is the annual cost of sessions with a physical therapist, ns is total number of sessions and Cs is the cost of a single session. The cost of assistive devices, diagnostic and laboratory charges and medications was available directly from the billing sections of electronic database. The travel expense was calculated as the sum of all rides to and from the rheumatologist, physical therapist, laboratory, pharmacy, and so on:
where, CT is the transportation cost per year, CTRh is the cost of trans-portation attributed to the rheumatologist visit while CTPt,CTLab and CTRx are the costs associated with travel expenses incurred on visits to the physical therapy center, laboratory and pharmacy. All these costs, that is, costs of visits to the rheumatologist, sessions with a physical thera-pist, purchase of assistive devices, diagnostic and laboratory charges, as well as medications, were verified from patients’ medical records while travel expenses were verified from a logbook. The total cost of treat-ment was calculated by adding all costs incurred on treatment in a year:
where, ∑
C is the total annual direct expenditure associated with RA treatment, CMD is the total cost of assistive medical devices, CLab is the total cost of diagnostic and laboratory charges and, CMed is medications cost. The cost calculated through this methodology was available in Pakistani pupees (PKR) that was later converted to United States dol-lars (USD) using the exchange rate of that time.17 It was done using the equation below:
2.5 | Target population and exclusion criteria
Patients with confirmed diagnosis of RA over 3 months were the target population. Patients who fulfilled the 2015 American College of Rheumatology criteria for RA based on their medical information available in the database, were considered eligible.18,19 Patients with self-reported RA, and incomplete medical information that hindered the investigators in re-establishing their diagnosis based on clinical criteria, were left out. Patients with more than 1 form of arthritis, history of surgery or a planned surgery related to the condition were excluded. Only out-patients were included. Patients who did not consent to participate, and patients with incomplete data files were excluded from study.
2.6 | Sample size calculation and sampling
We used the prevalence-based sample size calculation.20 The for-mula is described as follows:
where, N is the sample size required, Z = confidence level, P is the prev-alence of disease and d is precision. According to Naqvi and colleagues the point prevalence of RA was reported to be between 12.9%-26.9% in Karachi during 2011-2015.1 We used the most recent evidence that mentioned a point prevalence of 26.9% to calculate our sample size.3 The sample size obtained was 295. We selected a representative sam-ple of patients using real-world follow-up data of patients from elec-tronic database of the hospitals over the course of 1 year.
2.7 | Data collection process and analysis
We used the Urdu version of the EuroQol EQ-5D quality of life tool to measure patients’ Quality of Life Index (EQ VI) and Best Health Score (EQ visual analog scale [VAS]).21,22 Permission was granted from the developers (#ID20884). Apart from that, the required pa-tient data were directly printed from hospital electronic databases and were used as primary source files for data entry purposes. Files were segregated using medical record numbers. No personal iden-tifiable information was accessed or printed. Patients who were selected after data screening, were approached to provide their written consent for use of their medical information for research purposes.
The medical record numbers of patients who consented to par-ticipate were noted and accessed in the hospital databases. The whole process of data collection was conducted with supervision of department heads of rheumatology, physical therapy, finance, phar-macy as well as a designated officers from the Institutional Review Board that granted ethics approval. The primary source files were handed back to the ethics officer for disposal, after data entry and cross-verification. The data were analyzed through SPSS version 23 (IBM Corp, 2013). Patients’ demographic data were expressed as sample counts (n) and percentage (%). Data related to cost were ex-pressed by mean (X), median (X) and standard deviation (SD).
2.8 | Ethics approval and patient consent
The study was approved by the Institutional Review Board of Allied Med Ethics, Pakistan Engineers Cooperative Society (PECHS) Hospital (approval#NOV:15) and the ethics committee of Clifton Central Hospital (REF#17-11-17). All patients who were invited to participate in this study were briefed about the objectives and were asked to sign an informed written consent.
3 | RESULTS
3.1 | Participants’ information
A total of 371 patients consented to participate out of 413 po-tential patients. Thirteen patients were left out during screen-ing and a final 358 patients were followed up over the course of
CT=(
CTRh+CTPt+CTLab+CTRx
)
.
∑
C=CRh+Cpt+CMD+CLab+CMed+CT
�
C (USD) at time (t)=
∑
C (PKR) at time (t)
PKR to USD exchange rate at time (t)
N=Z2.P (1−P)∕d2

328 | NAQVI et Al.
1 year. The mean age of patients was 48 years (X = 47.97 ± 14.62). Almost three-quarters of patients (n = 264, 73.7%) were females. Most patients (n = 308, 86%) were married and a third of patients (n = 104, 29.1%) were employed. The majority (n = 257, 71.8%) had an education of at least 10 years, that is, secondary, were non-co-morbid (n = 223, 62.3%), lived in urban localities (n = 249, 69.6%),
had a monthly family income of more than PKR 50 000 (more than USD: 357.4). Slightly less than half of patients (n = 166, 46.4%) were diagnosed with the disease less than a year ago. More than three-quarters of patients (n = 279, 77.9%) had no medical insur-ance (Table 1).
3.2 | Treatment details
The average annual visits to the rheumatologist were 7 (6.80 ± 2.88), and average annual physical therapy sessions were 10 (10.17 ± 19.71). The average annual cost of rheumatologist visits was PKR 11 510.61 ± 4884.50 (USD: 72.05). Minimum cost was PKR 6800 (USD: 42.57) while maximum cost reported was PKR 40 800 (USD: 255.4). The average annual cost of sessions with a physical therapist was reported to be PKR 66 947.37 ± 37 526.89 (USD: 419.07). Minimum cost reported was PKR 14 000 (USD: 87.64) while maximum cost reported was PKR 1 82 000 (USD: 1139.28). The average annual expenditure on diagnostic and laboratory investi-gations was PKR 1962.12 ± 1202.13 (USD: 12.28). Minimum cost attributed to diagnostic and laboratory investigations was PKR 500 (USD: 3.13) while PKR 5000 (USD: 31.3) was the maximum reported cost. The average annual cost of assistive medical devices was PKR 7848.48 ± 4808.52 (USD: 49.13). Minimum cost for assistive de-vices was reported at PKR 2000 (USD: 12.52) while PKR 20 000 (USD: 125.20) was the maximum cost associated with purchase of assistive devices. Average annual cost of medications was PKR 10 104.23 ± 9564.83 (USD: 63.25). Minimum cost of medicines was reported to be PKR 1755 (USD: 10.99) while maximum cost payable for medicines was PKR 52 056 (USD: 325.86). The average annual travel expense was reported to be PKR 6541 ± 6607.62 (USD: 40.95). Minimum travel expense recorded was PKR 2000 (USD: 12.52) while maximum was PKR 34 000 (USD: 212.83).
The average annual direct expenditure associated with managing RA was PKR 37 558 (X = 37 558.10 ± 32 200.52) (USD: 235.10). Minimum cost was reported at PKR 8800 (USD: 55.09) while max-imum cost for managing RA was PKR 238 800 (USD: 1494.84). On average the cost for rheumatologist visits accounted for 32% while cost incurred in physical therapy sessions accounted for 30% of total expenditure. Costs for assistive device, diagnostic, transportation and laboratory service as well as medications accounted for 1%, 4%, 5% and 28% respectively.
3.3 | Relationship between patient variables and costs
There was a significant, positive and moderate correlation (ρ = 0.423, P < .01) between patients' age and total annual direct expenditure attributed to disease treatment (Figure 1). Additionally, a significant, weak-to-moderate correlation was reported between total annual direct expenditure attributed to disease treatment with EQ VAS (ρ = −0.128, P < .05) (Figure 2). Furthermore, a significant, negative
TA B L E 1 Participants’ information
Participant information Sample (n) %
Gender
Male 94 26.3
Female 264 73.7
Marital status
Single 50 14
Married 308 86
Education
Educated 257 71.8
Uneducated 101 28.2
Occupation
Household 173 48.3
Employed 104 29.1
Self-employed 18 5
Retired 16 4.5
Unemployed 47 13.1
Monthly family incomea
PKR ≤ 10 000 (USD ≤ 62.6) 4 1.1
PKR 10 000 ≅ 25 000 (USD 62.6 ≅ 156.49)
21 5.9
PKR 25 000 ≅ 50 000 (USD 156.49 ≅ 312.99)
140 39.1
PKR > 50 000 (USD > 312.99) 193 53.9
Residence
Urban 249 69.6
Rural 109 30.4
Duration of illness
Less than 1 y 166 46.4
Between 1 to 3 y 122 34.1
Between 3 to 5 y 47 13.1
Between 5 to 10 y 17 4.7
More than 10 y 6 1.7
Insurance
Full insurance 29 8.1
Partial insurance 50 14
Uninsured 279 77.9
Comorbidity
Yes 135 37.7
No 223 62.3
a1 USD equals PKR 159.75 at the time of this writing, that is 8 August 2019.

| 329NAQVI et Al.
weak-to-moderate correlation existed between duration of illness and EQ VAS (ρ = −0.124, P < .05) as well as EQ VI (ρ = −0.152, P < .01) (Figure 3). All correlations are listed in Table 2.
4 | DISCUSSION
This study aimed to document the direct annual expenditure at-tributed to the treatment and management of RA in Pakistani
patients. RA is one of those diseases that result in disability. Although its prevalence in Pakistan is not as high as other endo-crine and cardiovascular diseases, the figures for disease-adjusted life years (DALYs) and years lived with disability (YLDs) are quite high in this population.1,4
The mean age of patients in our study was 48 years. This was in line with findings of a systematic review that the mean age of pa-tients who presented with RA in Pakistani settings was 44 years.1 It was further consistent with the findings that the mean age for
F I G U R E 1 Relationship between patient age and total direct annual expenditure
F I G U R E 2 Relationship between EQ VAS and total direct annual expenditure

330 | NAQVI et Al.
patients who reported RA in Karachi city was 46.5 years.1 A study conducted in Norway reported a mean patient age of 57 years while a US-based study reported an average age of 61 years for patients who reported RA.18,23,24 This suggests that RA affects patients in Pakistan at an early age compared to patients in Norway and the USA. There could be several explanations as health status, age ex-pectancy and, healthcare access and quality in Norway and USA are better than Pakistan.24-26
One of the key findings of this study was the proportion each type of direct cost accounted for, in the total expenditure. The study reported that costs related to rheumatologist visits, physical therapy and medications, each comprised roughly a third of total costs while laboratory and diagnostics were less than 5%. In a review, it was re-ported that physician visits account for 20% while physical therapy accounts for 5% of total direct cost; 12% of cost is linked to laboratory while pharmacy expenditure accounts for 20% of total direct costs.11 In a study in Pakistan, an annual cost of USD 1194 per patient was reported.14 Moreover, the monthly cost for treating RA was reported to be between USD 20-100 in another study.15 Waheed et al15 did not report the breakdown of costs or the proportion each treatment service accounted for, in the total expenditure. A study by Ahmed documented costs incurred on visits, hospital stays, laboratory inves-tigations, and so on, but did not document costs of physical therapy sessions.14 Our study is novel in this aspect that it documented all pre-viously reported costs along with costs of physical therapy sessions.
We observed that almost three-quarters of the patients were female. This occurrence was in line with previous findings that the majority of Pakistani patients with RA were female.1 A study by Ahmed observed that the male-to-female ratio in RA was 1:3.14 Pakistani women have a higher incidence of RA. The YLDs are
estimated to be over 40 years while DALYs of 50 or more are re-ported.1,4 This proportion for Pakistani women with RA was con-sistent with findings of Kawatkar and colleagues who reported more than 60% women in a RA patient cohort in the USA.23 Most patients mentioned that they were graduates, that is, had at least 16 years or education, as well as, were either employed or asso-ciated with household activities. Altogether, over 75% of patients were working. It is pertinent to mention that RA could result in work disability and early retirement.27 It may significantly reduce the ability to perform household chores and impact household work performance of women.26 Barrett and colleagues had documented work-related disability and found that the disease may hamper pro-ductivity and may force individuals to leave work early.27,28 A study in USA reported that the rate of work disability was more than 25%, after 10 years with RA.29 Higher rates were reported in European countries.27 In a Finnish study, it was reported that most female RA patients (≅84%) had difficulty performing household activities and more than 50% required assistance.28 Another study reported that other family members may spend up to 7 hours in performing household activities if the female member of the family such as mother or wife has RA.2 The financial burden of disease may fur-ther increase if these costs are taken into consideration.
Since most patients were working, the monthly family income for more than half of patients was above PKR 50 000. This amount in PKR could be considered a considerable income as data from the 2015-16 survey report from the Pakistan Bureau of Statistics indi-cated average monthly income between PKR 30 000-40 000.29,30 Most patients in our study had no medical insurance. Previous stud-ies have noted that patients in Pakistan mostly pay out-of-pocket costs for treatment. This may act as a barrier to treatment espe-cially in patients with low socioeconomic status.17,31,32 Although most patients in our study had a nominal income, there is a need to formulate a policy for insurance coverage as this, coupled with work disability and early retirement, may lead to income loss as foregone employment, and would significantly impact a patient's quality of life and socioeconomic status. Moreover, the indirect burden of RA on society would be more if these variables are considered.
The annual direct expenditure attributed to RA treatment was PKR 37 558 (USD: 235.10) per patient. A study in the USA reported an annual direct expenditure of USD 13 012 per RA patient. A re-view mentioned that direct cost attributed to RA treatment may range from Euro 3959-10 490.11 The cost of treating RA in Pakistan was quite low compared to other places such as the USA and Europe. However, considering from a Pakistani patient perspective with an average income between PKR 30 000-40 000, the cost was about 8%-11% of total annual income.
5 | CONCLUSION
The cost of treating RA takes away a considerable amount of income from patients. Most patients were middle-aged individuals whose employability would be affected. The authorities must provide
F I G U R E 3 Relationship among EQ VAS, EQ VI and illness duration

| 331NAQVI et Al.
TAB
LE 2
C
orre
latio
n m
atrix
Corr
elat
ion
mat
rixA
geIn
com
eIll
ness
du
ratio
nCR
h vi
sits
CPt
sess
ions
CLab
CMd
CMed
sTD
EEQ
VA
SEQ
IV
Age
ρ1
0.17
0**
0.38
1**
0.33
5**
0.34
8*0.
130
0.13
00.
098
0.42
3**
−0.0
20−0
.062
Sig.
0.
001
0.00
00.
000
0.03
20.
136
0.13
60.
277
0.00
00.
707
0.24
6
Inco
me
ρ0.
170*
*1
0.04
80.
275*
*−0
.299
0.12
90.
129
0.05
40.
144*
*0.
051
−0.0
19
Sig.
0.00
1
0.36
70.
000
0.06
80.
141
0.14
10.
550
0.00
60.
335
0.72
4
Illne
ss d
urat
ion
ρ0.
381*
*0.
048
10.
318*
*0.
260
0.16
40.
164
0.08
60.
203*
*−0
.124
*−0
.152
**
Sig.
0.00
00.
367
0.
000
0.11
50.
060
0.06
00.
340
0.00
00.
020
0.00
4
CRh
vis
itsρ
0.33
5**
0.27
5**
0.31
8**
1−0
.019
0.10
20.
102
−0.0
180.
435*
*−0
.107
*−0
.190
**
Sig.
0.00
00.
000
0.00
0
0.91
10.
247
0.24
70.
843
0.00
00.
043
0.00
0
CPt
ses
sion
sρ
0.34
8*−0
.299
0.26
0−0
.019
10.
127
0.12
70.
281
0.97
8**
−0.0
720.
011
Sig.
0.03
20.
068
0.11
50.
911
0.
664
0.66
40.
147
0.00
00.
666
0.94
9
Cla
bρ
0.13
00.
129
0.16
40.
102
0.12
71
0.91
**0.
106
0.11
90.
079
−0.0
45
Sig.
0.13
60.
141
0.06
00.
247
0.66
4
0.00
00.
481
0.17
30.
366
0.61
5
CM
dρ
0.13
00.
129
0.16
40.
102
0.12
70.
91**
10.
106
0.11
90.
079
−0.0
45
Sig.
0.13
60.
141
0.06
00.
247
0.66
40.
000
0.
481
0.17
30.
366
0.61
5
CM
eds
ρ0.
098
0.05
40.
086
−0.0
180.
281
0.10
60.
106
10.
232*
*−0
.075
−0.1
12
Sig.
0.27
70.
550
0.34
00.
843
0.14
70.
481
0.48
1
0.00
90.
408
0.21
2
TDE
ρ0.
423*
*0.
144*
*0.
203*
*0.
435*
*0.
978*
*0.
119
0.11
90.
232*
*1
−0.1
28*
−0.0
49
Sig.
0.00
00.
006
0.00
00.
000
0.00
00.
173
0.17
30.
009
0.
016
0.35
8
EQ V
AS
ρ−0
.020
0.05
1−0
.124
*−0
.107
*−0
.072
0.07
90.
079
−0.0
75−0
.128
*1
0.16
7**
Sig.
0.70
70.
335
0.02
00.
043
0.66
60.
366
0.36
60.
408
0.01
6
0.00
2
EQ IV
ρ−0
.062
−0.0
19−0
.152
**−0
.190
**0.
011
−0.0
45−0
.045
−0.1
12−0
.049
0.16
7**
1
Sig.
0.24
60.
724
0.00
40.
000
0.94
90.
615
0.61
50.
212
0.35
80.
002
Abb
revi
atio
ns: C
Lab,
cos
t of d
iagn
ostic
and
labo
rato
ry s
ervi
ces;
CM
d, c
ost o
f med
ical
dev
ices
; CM
eds,
cos
t of m
edic
atio
ns; C
Pt, c
ost o
f ses
sion
s w
ith p
hysi
cal t
hera
pist
; CRh
, cos
t of v
isits
to
rheu
mat
olog
ist;
EQ V
AS,
Eur
oQol
the
best
hea
lth s
core
; EQ
IV, E
uroQ
ol In
dex
Valu
e; T
DE,
tota
l dire
ct e
xpen
ditu
re a
ttrib
uted
to tr
eatm
ent.
*Cor
rela
tion
is s
igni
fican
t at t
he 0
.05
leve
l (2-
taile
d).
**C
orre
latio
n is
sig
nific
ant a
t the
0.0
1 le
vel (
2-ta
iled)
.

332 | NAQVI et Al.
interventions such as a medical health insurance scheme for patients to relieve them from direct health expenditure. In addition, there is a need to create awareness for early diagnosis and treatment of this condition so that patients could satisfactorily adjust the disease in their lives with minimal productivity loss.
ACKNOWLEDG MENTSThe authors would like to thank all staff of Clifton Central Hospital and especially Dr Muntazir A. Zaidi, Head of Department of Physical Therapy, and Dr Zain Azhar, Occupational Therapy Unit Head, for providing guidance in cost calculation and for liaising with rheu-matologists and physical therapists across different hospitals. We would also like to thank all patients who documented their trans-portation costs honestly throughout the year. Without their support this task would have been impossible to complete.
CONFLIC T OF INTERE S TSAll authors declare that no conflict of interests exists.
AUTHOR CONTRIBUTIONSThe idea was conceived by AAN and MAH. SBSN provided signifi-cant guidance in study design and data collection method. The data were analyzed by AAN and MAH. The cost analysis was conducted by BK and IK. The introduction, methodology, abstract and conclu-sion were written by AAN, MAH and SBSN. Results and discussion were written by BK and IK with assistance from AAN. All authors read and approved the final manuscript.
E THIC S APPROVALThe study was approved by the Institutional Review Board of Allied Med Ethics, Pakistan Engineers Cooperative Society (PECHS) Hospital (approval#NOV:15) and the ethics committee of Clifton Central Hospital (REF#17-11-17). All patients who were invited to participate in this study were briefed about the objectives and were asked to sign an informed written consent.
DATA AVAIL ABILIT Y S TATEMENTThe data generated and analyzed as a result of this study are avail-able from the corresponding author on reasonable request.
ORCIDAtta Abbas Naqvi https://orcid.org/0000-0003-4848-6807
R E FE R E N C E S 1. Naqvi AA, Hassali MA, Aftab MA. Epidemiology of rheumatoid
arthritis, clinical aspects and socio-economic determinants in Pakistani patients: a systematic review and meta-analysis. J Pak Med Assoc. 2019;69:389.
2. Allaire SH, Meenan RF, Anderson JJ. The impact of rheumatoid arthritis on the household work performance of women. Arthritis Rheum. 1991;34(6):669-678.
3. Shamim R, Jan MD, Zafar U. Prevalence of rheumatoid arthritis in population with arthralgia presenting to a tertiary care hospital. J Pak Med Assoc. 2015;65:1202-1205.
4. Naqvi AA, Hassali MA, Naqvi SBS, Aftab MT. Impact of pharmacist educational intervention on disease knowledge, rehabilitation and medication adherence, treatment-induced direct cost, health-re-lated quality of life and satisfaction in patients with rheumatoid arthritis: study protocol for a randomized controlled trial. Trials. 2019;20:488.
5. Naqvi AA, Hassali MA, Aftab MT, et al. Development of evi-dence-based disease education literature for Pakistani rheumatoid arthritis patients. Diseases. 2017;5(4):27.
6. Birnbaum HG, Barton M, Greenberg PE, et al. Direct and indirect costs of rheumatoid arthritis to an employer. J Occup Environ Med. 2000;42(6):588-596.
7. Hunter TM, Boytsov NN, Zhang X, Schroeder K, Michaud K, Araujo AB. Prevalence of rheumatoid arthritis in the United States adult population in healthcare claims databases, 2004–2014. Rheumatol Int. 2017;37(9):1551-1557.
8. Ohinmaa AE, Thanh NX, Barnabe C, et al. Canadian estimates of health care utilization costs for rheumatoid arthritis patients with and without therapy with biologic agents. Arthritis Care Res (Hoboken). 2014;66(9):1319-1327.
9. Dougados M, Soubrier M, Antunez A, et al. Prevalence of comor-bidities in rheumatoid arthritis and evaluation of their monitoring: results of an international, cross-sectional study (COMORA). Ann Rheum Dis. 2014;73:62-68.
10. Abhishek A, Doherty M, Kuo CF, Mallen CD, Zhang W, Grainge MJ. Rheumatoid arthritis is getting less frequent-results of a na-tionwide population-based cohort study. Rheumatology (Oxford). 2017;56(5):736-744.
11. Rat AC, Boissier MC. Rheumatoid arthritis: direct and indirect cost. Joint Bone Spine. 2004;71:518-524.
12. Birnbaum H, Pike C, Kaufman R, Marynchenko M, Kidolezi Y, Cifaldi M. Societal cost of rheumatoid arthritis patients in the US. Curr Med Res Opin. 2010;26(1):77-90.
13. Raciborski F, Kłak A, Kwiatkowska B. Indirect costs of rheumatoid arthritis. Reumatologia. 2015;53(5):268-275.
14. Waheed A, Hameed K, Khan AM, Syed JA, Mirza AI. The burden of anxiety and depression among patients with chronic rheumatologic disorders at a tertiary care hospital clinic in Karachi, Pakistan. J Pak Med Assoc. 2006;56:243-247.
15. Ahmad M. THU0631 Direct financial burden of rheumatoid arthritis on patients' life in a developing nation of pakistan, one year pro-spective study. Ann Rheum Dis. 2017;76:444.
16. Naqvi AA, Naqvi SB, Zehra F, Ahmad R, Ahmad N. The cost of po-liomyelitis: lack of cost-of-illness studies on poliomyelitis rehabilita-tion in Pakistan. Arch Pharma Pract. 2016;7:182-184.
17. Naqvi AA, Naqvi SBS, Zehra F, et al. Estimation of the direct cost of poliomyelitis rehabilitation treatment to Pakistani patients: a 53-year retrospective study. Appl Health Econ Health Policy. 2018;16(6):871-878.
18. Kvamme MK, Lie E, Kvien TK, Kristiansen IS. Two-year direct and indirect costs for patients with inflammatory rheumatic joint dis-eases: data from real-life follow-up of patients in the NOR-DMARD registry. Rheumatology. 2012;51(9):1618-1627.
19. Singh JA, Saag KG, Bridges SL Jr, et al. 2015 American College of Rheumatology guideline for the treatment of rheumatoid arthritis. Arthritis Rheumatol. 2016;68(1):1-26.
20. Naing L, Winn T, Rusli BN. Practical issues in calculating the sample size for prevalence studies. Arch Orofacial Sci. 2006;1:9-14.
21. Herdman M, Gudex C, Lloyd A, et al. Development and preliminary testing of the new five-level version of EQ-5D (EQ-5D-5L). Qual Life Res. 2011;20(10):1727-1736.
22. Janssen MF, Pickard AS, Golicki D, et al. Measurement properties of the EQ-5D-5L compared to the EQ-5D-3L across eight patient groups: a multi-country study. Qual Life Res. 2013;22(7):1717-1727.

| 333NAQVI et Al.
23. Kawatkar AA, Jacobsen SJ, Levy GD, Medhekar SS, Venkatasubramaniam KV, Herrinton LJ. Direct medical expenditure associated with rheumatoid arthritis in a nationally representative sample from the medical expenditure panel survey. Arthritis Care Res (Hoboken). 2012;64(11):1649-1656.
24. Institute for Health Metrics and Evaluation, Pakistan. Available from: http://www.healt hdata.org/pakistan. Accessed 13 November 2019.
25. Institute for Health Metrics and Evaluation, Norway. Available from: http://www.healt hdata.org/norway. Accessed 14 November 2019.
26. Barrett EM, Scott DGI, Wiles NJ, Symmons DPM. The im-pact of rheumatoid arthritis on employment status in the early years of disease: a UK community-based study. Rheumatology. 2000;39(12):1403-1409.
27. Leino M, Tuominen S, Pirilä L, Tuominen R. Effects of rheumatoid arthritis on household chores and leisure-time activities. Rheumatol Int. 2015;35(11):1881-1888.
28. De Roos AJ, Callahan LF. Differences by sex in correlates of work status in rheumatoid arthritis patients. Arthritis Care Res. 1999;54:455-460.
29. Pakistan Bureau of Statistics. Household integrated economic sur-vey (HIES). 2015/16. 2017. http://www.pbs.gov.pk/. Accessed 20 November 2019.
30. Naqvi AA, Hassali MA, Aftab MT, Nadir MN. A qualitative study investigating perceived barriers to medication adherence in chronic illness patients of Karachi, Pakistan. J Pak Med Assoc. 2019;69(2):216-223.
31. Hussain M, Naqvi S, Khan MA, et al. Direct cost of treatment of diabetes mellitus type 2 in Pakistan. Int J Pharm Pharm Sci. 2014;6(11):261-264.
32. Athar M, Khokhar SA, Shakeel A, Abbas A. A brief outlook of rheu-matoid arthritis RA patients in health facilities of Karachi, Pakistan. Med Sci. 2014;15(61):34-38.
How to cite this article: Naqvi AA, Hassali MA, Naqvi SBS, Kachela B, Khan I. Estimation of direct cost of managing rheumatoid arthritis treatment to Pakistani patients using real-world follow-up data. Int J Rheum Dis. 2020;23:325–333. https ://doi.org/10.1111/1756-185X.13776

334 | wileyonlinelibrary.com/journal/apl Int J Rheum Dis. 2020;23:334–341.© 2020 Asia Pacific League of Associations for Rheumatology and John Wiley & Sons Australia, Ltd
Received: 15 August 2019 | Revised: 26 November 2019 | Accepted: 2 December 2019
DOI: 10.1111/1756-185X.13777
O R I G I N A L A R T I C L E
The direct and indirect costs of axial spondyloarthritis (axSpA) in Singapore
Yu Heng Kwan1 | Shi Yun Kwoh2 | Jie Kie Phang3 | Mcvin Hua Heng Cheen4 | Ka Keat Lim1 | Charmaine Tze May Wang3 | Ying Ying Leung3,5,6 | Hwee-Ling Koh2 | Truls Ostbye1 | Julian Thumboo1,3,6 | Warren Fong3,5,6
Kwan and Kwoh are co-first authors.
1Program in Health Services and Systems Research, Duke-NUS Medical School, Singapore, Singapore2Department of Pharmacy, Faculty of Science, National University of Singapore, Singapore, Singapore3Department of Rheumatology and Immunology, Singapore General Hospital, Singapore, Singapore4Department of Pharmacy, Singapore General Hospital, Singapore, Singapore5Duke-NUS Medical School, Singapore, Singapore6Department of Medicine, Yong Loo Lin School of Medicine, National University of Singapore, Singapore, Singapore
CorrespondenceYu Heng Kwan, Program in Health Services and Systems Research, Duke-NUS Medical School, 8 College Road, Singapore 169857.Email: [email protected]
AbstractObjective: To estimate the economic annual direct and indirect costs of axial spondy-loarthritis (axSpA) in Singapore, and to identify factors associated with these costs.Methods: A retrospective, cross-sectional, Institutional Review Board-approved study was conducted. A questionnaire was administered to the patients between 2013 and 2016 from the Singapore General Hospital (SGH) spondyloarthritis regis-try. Direct medical costs and indirect costs were estimated using the SGH database and the human capital approach respectively. Multivariate analyses using generalized linear model with gamma distribution and a log-linked function was conducted to identify factors associated with these total, direct and indirect costs. All costs were adjusted to 2017 using the Singapore Consumer Price Index and converted to 2017 US dollars (USD) by purchasing power parity.Results: A total of 135 consecutive patients were included in the study, with a mean age of 40.4 ± 13.2 years. The overall annual total economic cost to society was around USD 74 790 820, with annual direct cost being the main component of total cost (90.8%). Annual direct cost was around USD 67 931 457, while annual indirect cost was around USD 6 855 951. Presence of extra-spinal symptoms (ever) was as-sociated with an increase in total and direct costs. Higher education level and Patient Global Assessment were associated with an increase in indirect costs. Lack of em-ployment was associated with a decrease in indirect costs.Conclusion: The disease burden of axSpA in Singapore is not trivial given that the disease is relatively common. This highlights the need for measures to accommodate patients with axSpA economically in Singapore.
K E Y W O R D S
ankylosing spondylitis, cost of illness, direct cost, human capital approach, indirect cost, spondyloarthritis

| 335KWAN et Al.
1 | INTRODUC TION
Axial spondyloarthritis (axSpA) is a chronic inflammatory rheumatic disease primarily affecting the axial skeleton.1 AxSpA can lead to limitations of functional capacity, decreased work productivity, and reduced overall quality of life.2 AxSpA can also be further divided into two different sub-types: ankylosing spondylitis (AS) and non-radiographic axSpA (nr-axSpA).1
Before the availability of biologics, non-steroidal anti-inflamma-tory drugs (NSAIDs) were one of the few available pharmacologi-cal options for the treatment of axSpA. Both biologics and NSAIDs suppress inflammation.1 However, biologics are recommended for patients not responding well to NSAIDs3 and are much more ex-pensive than NSAIDs. Thus, the overall treatment cost of axSpA has increased with the use of biologics. Using AS as a prototype disease of axSpA, studies estimated that the annual costs per patient have increased from US dollars (USD) 1800 to USD 23 000.4,5
Few studies have been conducted in Asia to estimate the cost of axSpA.6 Studies conducted in Hong Kong7 and South Korea8 provided the cost estimates for the Asian population. However, the Hong Kong study7 did not include the cost of biologics into their cost calculations. Since biologics were found to increase costs,8 the study may not be applicable to current practice. The South Korean study8 took into account the cost of biologics. However, since the study only included 1 subtype of axSpA (patients with AS), the overall cost remains unknown. Additionally, to the best of our knowledge, there is no published cost study regarding axSpA in Southeast Asia (SEA). Also, Singapore has a hybrid healthcare model whereby patients also pay out-of-pocket for healthcare from a medical savings account and private insurance after deducting government subsidies and a safety net for the poorest.9 This is drastically different from the USA, in which patients pay largely by private insurance and the UK whereby healthcare is fully funded by the state. Thus, this study could serve as a benchmark for other countries in SEA and would also allow us to compare how costs vary across different healthcare models.
Therefore, we aimed to estimate the economic direct and in-direct costs of the disease, and to identify factors associated with total, direct and indirect costs for patients with axSpA in Singapore. The findings of this study will be used to inform key policy makers on the disease burden of axSpA in Singapore.
2 | METHODS
2.1 | Study design
A retrospective, cross-sectional, Institutional Review Board-approved (CIRB Ref No: 2012/498/E) study with a societal per-spective was conducted using data from 2013 to 2016 from the PREcision medicine in SPondyloarthritis for better Outcomes aNd Disease remission (PRESPOND) registry from the Department of Immunology and Rheumatology at the Singapore General Hospital (SGH), a tertiary referral center in Singapore.
2.2 | Patients
All patients included in the analyses were at least 21 years old, had a clinical diagnosis of axSpA and fulfilled the Assessment of Spondyloarthritis International Society (ASAS) Classification 2009 for axSpA.10 Patients with a clinical diagnosis of psoriatic arthritis and enteropathic arthritis were excluded from the study.
2.3 | Data collection
A self-administered questionnaire was conducted with the patients who consented to the study supplemented by an interviewer-admin-istration if the patient had any difficulties.
We collected demographic characteristics on age, gender, eth-nicity, highest education level and occupation from all patients. Clinical information and Patient-Reported Outcome Measures (PROMs) were collected. Clinical information included duration of disease, axSpA features and Modified Stoke Ankylosing Spondylitis Spinal Score (mSASSS). PROMs included pain score on a visual an-alog scale (VAS), Bath Ankylosing Spondylitis Disease Activity Index (BASDAI),11 Bath Ankylosing Spondylitis Functioning Index (BASFI)11 and Patient Global Assessment (PGA). Pain score and PGA were measured using a 100 mm VAS while BASDAI and BASFI were measured using numeric rating scales.
2.4 | Direct cost
Annual direct cost, which is the sum of all resources associated with a medical intervention,12 was retrieved from the SGH database. We considered only the direct medical costs as most patients reported not being able to recall direct non-medical costs (eg: cost of trans-portation to seek care, hiring domestic workers for caregiving etc8). The direct medical costs in the analysis of this study were inpatient costs, emergency department (ED) costs, professional costs, labora-tory costs, imaging costs, and medication costs. Imaging costs in-cluded computed tomography scans, magnetic resonance imaging and plain radiographs. The costs were calculated by multiplying the units consumed and the unit price for the year of 2018.
Expenses charged to patients before subsidies were used as a proxy for the direct medical cost incurred in this study as per published cost of illness studies.12 The expenses charged to patients can also be assumed to be close to the cost of providing the healthcare service since SGH is a not-for-profit publicly funded healthcare provider.
2.5 | Indirect cost
Annual indirect cost is defined as the loss in productivity due to a disease.12,13 The annual indirect cost was estimated using the human capital approach (HCA),14 which estimates all potential earning lost assuming there is no underemployment.13 The HCA is selected as it

336 | KWAN et Al.
can also be used to estimate productivity loss for unpaid labor (eg: homemakers and retirees).13 The indirect cost for students was as-sumed to be zero.
Patients were asked to estimate the number of days of sick leave (only for those who are employed, unemployed and National Servicemen Full-Time [NSF]) or the number of days off housework (only for homemakers and retirees) for the previous year. It was as-sumed that they will be fully productive upon returning to work. The economic loss in productivity was calculated by multiplying the number of days of sick leave or days off housework for the preceding year by the estimated average salary per day. Salary estimates were used as such information is deemed sensitive.
Methods for estimating the average salary per day differ between patients who are NSFs and those who are not. For patients who were not NSFs, the highest education level, age and gender of each patient were matched to the salary estimates found in the Ministry of Manpower (MOM) Labor Force in Singapore reports 2015 and 2016.15,16 These salary estimates were used for the unemployed, homemakers and re-tirees as a proxy measure for the calculation of their indirect cost due to the opportunity cost of the loss of economic output that they could have otherwise produced had they been employed.
NSFs are abled-bodied males, aged between 18 and 22, con-scripted into a uniformed service for two years due to a statutory requirement. As salary data were not available for NSFs in the MOM report, salary estimates found in the Singapore Ministry of Defense (MINDEF) website17 were used. Since NSF salary is based on the rank of the individual, we assumed a lower rank of corporal in NSFs due to lower physical function attributable to axSpA.18
2.6 | Statistical analysis
Data were analyzed using STATA SE14.0 for WINDOWS (StataCorp, College Station, TX, USA). Descriptive statistics were computed for patient demographics. Continuous variables were expressed in mean ± standard deviation, while categorical variables were ex-pressed as frequencies (n) and percentages (%).
Costs were adjusted to 2017 using the Singapore Healthcare Consumer Price Index (CPI) for direct costs while All Items CPI was used for indirect costs.19-24 The annual total cost of axSpA per patient is the sum of the annual direct and annual indirect costs per patient. Results were expressed in 2017 USD by purchasing power parity (USD 1 = SGD 0.84925), and were presented as mean costs ± stan-dard deviation and median (interquartile range) per annum per pa-tient. We estimated the overall cost of axSpA for the total axSpA patient population in Singapore (N = 7932). Due to the lack of local prevalence data, the total local patient population was estimated based on the prevalence of 20 per 10 000 in South-East Asia26,27 and the Singapore resident population of 3 965 800.28
To account for the non-normal distribution of costs, multivariate analyses using generalized linear model (GLM) with gamma distri-bution and a log-linked function was conducted to identify demo-graphic characteristics, clinical information and PROMs associated
with these costs.29 GLM compares the natural log of the costs while controlling for covariates. The exponent of the coefficient β of the model can be interpreted as the fold increase in cost. Univariable regression was conducted to identify the factors with P values < .1. These factors with P < .1 were included in the multivariable regres-sion. Factors with P < .05 in the multivariable regression were con-sidered statistically significant. The coefficient and its corresponding 95% confidence interval were accordingly presented.
3 | RESULTS
3.1 | Patient characteristics
In total, data of 201 patients were collected in the registry, among which 66 were excluded due to incomplete demographic, clinical and cost data. Therefore, a total of 135 consecutive patients were in-cluded in the study. Although a third of the patients were excluded from the analysis, the demographic profiles of the patients included in the analysis were largely similar to those excluded. We present the patient demographic characteristics in Table 1. The mean age of the patients was 40.4 ± 13.2 years, with a majority of the included patients being male (n = 103; 76.3%), of Chinese ethnicity (n = 122; 90.4%), employed (n = 95; 70.4%) and diagnosed with AS (n = 119; 88.2%). The unemployed and homemakers and retirees constitute 13.3% (n = 18) of the patients. The mean disease duration was 8.6 ± 8.4 years. More patients were currently on NSAIDs (n = 70; 51.9%) at the time of study compared to patients currently on biologics (n = 22; 16.3%) or sul-fasalazine (n = 20; 14.8%). The mean BASDAI score was 2.5 ± 1.8.
3.2 | Utilization of healthcare services
The utilization of healthcare services for the preceding 12 months is presented in Table 2. Hospital admission was reported for 21 patients (15.6%) in the preceding year with a mean length of stay of 3.0 ± 2.5 days. The mean number of outpatient visits for all patients was 5.6 ± 4.6 visits the preceding year. ED visits were reported in 11 patients (8.2%) with a mean of 1.4 ± 0.7 visits a year. A majority of the patients (n = 123; 91.1%) required labora-tory tests and 60.7% of the patients (n = 82) required at least one imaging done in a year.
There was no statistically significant difference between the healthcare utilization in AS patients and nr-axSpA patients, though AS patients generally utilized more healthcare services compared to nr-axSpA patients, except for the number of outpatient visits which was 35% higher in nr-axSpA patients (7.3 ± 7.2 visits).
3.3 | Total costs
Detailed breakdown of the different cost components is given in Table 3. The mean annual total cost to society was USD 9429 per

| 337KWAN et Al.
patient, with the direct cost (90.8%) being the main component of the total cost. Based on an estimated 7932 patients in Singapore, the overall annual total economic cost to society was USD 74 790 820 per year for Singapore.
3.4 | Direct costs
The mean annual direct cost to society was USD 8565 per patient. The main expense for direct cost was medication (81.0%), followed by professional cost (7.2%) and laboratory cost (4.9%). The overall annual direct cost to society was USD 67 931 457 per year for Singapore.
3.5 | Indirect costs
We calculated the indirect costs for all patients except those who were students (n = 121). Of those who were employed, unemployed and NSFs, 66 (59.5%) out of 111 patients required sick leave to be taken from work the preceding year. Of those who were homemak-ers or retirees, only 2 of the 10 (20%) took days off housework the preceding year. The average sick leave and days off housework taken for the preceding year for all patients was 3.9 ± 9.7 days. The esti-mated mean annual indirect cost to society was USD 864 per pa-tient, and the overall annual indirect cost to society for Singapore was USD 6 855 951 per year.
3.6 | Factors associated with total cost, direct cost and indirect cost
Results from the univariable regression can be found in Table S1. In the univariable regression, female gender, longer disease duration, presence of extra-spinal symptoms (ever), higher BASDAI, higher BASFI, higher PGA and higher levels of pain were associated with both total cost and indirect cost. Presence of extra-spinal symptoms (ever) includes pres-ence of peripheral arthritis, dactylitis and heel enthesitis (ever). Female gender, higher education level, lack of employment, longer disease du-ration and higher PGA were associated with indirect costs.
As shown in Table 4, the multivariable regression revealed that presence of extra-spinal symptoms (ever) was the only factor that was associated with an increase in both total cost and direct cost. Higher education level and higher PGA were associated with an increase in indirect cost, while lack of employment was associated with a decrease in indirect cost.
4 | DISCUSSION
To our knowledge, this is the first study to estimate the annual direct, indirect and total cost and to investigate the factors associated with
TA B L E 1 Characteristics of patients with axSpA
Characteristics N = 135
Age 40.4 ± 13.2
Male 103 (76.3%)
Chinese ethnicity 122 (90.4%)
Highest education level, y of education
Primary and below (≤6) 5 (3.7%)
Lower secondary (<10) 9 (6.7%)
Secondary (10) 24 (17.8%)
Post-secondary (non-tertiary) (12) 14 (10.4%)
Diploma (13) 36 (26.7%)
Degree and higher degrees (≥16) 47 (34.8%)
Occupation
Employed 95 (70.4%)
Unemployed 8 (5.9%)
Full-time student 14 (10.4%)
National servicemen (Full-Time) (NSF) 8 (5.9%)
Homemakers and retirees 10 (5.9%)
Disease diagnosis based on ASAS 2009 Criteria for axSpA
Ankylosing spondylitis 119 (88.2%)
Non-radiographic axSpA 16 (11.9%)
Disease duration, mo 102.9 ± 100.8
Presence of HLA-B27 allele 112 (83.0%)
Extra-spinal symptoms, ever 75 (55.6%)
Peripheral arthritis, ever 58 (43.0%)
Dactylitis, ever 8 (5.9%)
Heel enthesitis, ever 41 (30.4%)
Extra-articular symptoms, ever 44 (32.6%)
Uveitis, ever 37 (27.4%)
Psoriasis, ever 4 (3.0%)
IBD, ever 4 (3.0%)
On NSAIDs, currently 70 (51.9%)
On biologics, currently 22 (16.3%)
On sulfasalazine, currently 20 (14.8%)
PROMs
BASDAI (0-10) 2.5 ± 1.8
BASFI (0-10) 1.7 ± 1.8
PGA (0-100) 31.1 ± 22.7
Pain (0-100) 28.9 ± 23.1
Modified Stoke Ankylosing Spondylitis Spinal Score (0-72)
14.1 ± 22.0
Note: Data are represented as mean ± standard deviation or n (%).Abbreviation: ASAS, Assessment of Spondyloarthritis International Society; axSpA, axial spondyloarthritis; BASDAI, Bath Ankylosing Spondylitis Disease Activity Index; BASFI, Bath Ankylosing Spondylitis Functioning Index; IBD, inflammatory bowel disease; NSAIDs, non-steroidal anti-inflammatory drugs; PGA, Patient Global Assessment; PROMs, patient-reported outcomes measures; SpA, spondyloarthritis.

338 | KWAN et Al.
economic costs of patients with axSpA after biologics were introduced in Singapore. We also found that presence of extra-spinal symptoms (ever) was associated with higher total and direct cost. Higher education level and higher PGA were associated with higher indirect cost while lack of employment was associated with a decrease in indirect cost.
The main expense for the mean annual direct costs per year in Singapore was medications, consistent with other studies.14,30 The di-rect cost in Singapore was higher than in Hong Kong (USD 3368)7 but comparable to that of South Korea (USD 7981)8 among Asian coun-tries. However, the Hong Kong7 study was done more than 10 years ago when biologic treatment was not widely available. Compared to Western countries, the mean direct cost in Singapore was higher than that of Germany (USD 6662)30 and the UK (USD 4530),31 but lower than that of Greece (USD 14 515).32 Across these studies,7,8,30-32 the higher the proportion of patients on biologics, the higher the direct costs. This is consistent with the results published in other studies, which found that patients on biologics tend to have a higher direct cost.8 However, the proportion of patients on biologics for our sam-ple was lower than that of similar economies.33 This could be due to patients having to co-pay as part of the Singapore healthcare system, thus limiting financial accessibility to biologics.34,35
The indirect cost in Singapore constituted a minor compo-nent (9.2%) of the total cost, unlike in two other studies (62%7 and 40.1%8). There are several possible explanations. First, the other studies may have a lower proportion of patients on biologics treat-ment,7 and thus leading to a lower direct cost and therefore causing indirect cost to constitute a higher component of total cost. Second, our study did not take into account indirect cost due to early re-tirement7,31 and presenteeism.31 Presenteeism is the reduction of a worker's productivity due to an illness even though he is present at work.31 This can lead to an underestimation of indirect costs since presentism can potentially account for a higher proportion of indi-rect costs compared to absenteeism.31 Thirdly, the unemployment rate in our sample is lower than that of South Korea (37.7%)8 and the UK (53%).31 Nonetheless, the unemployment rate in our sample is almost three times higher than the Singapore population (5.9% vs
1.9%-2.2% for the same time period36), reflecting that the work ca-pacities of the patients were hindered by axSpA.
We attempted to identify factors associated with higher direct, indirect and total costs. Studies5,7,8 have found that deteriorat-ing physical function is associated with an increase in total costs. Nevertheless, in our study, physical function measured by BASFI was not shown to be a significant driver for total costs. Presence of extra-spinal symptoms (ever) was instead found to be the key cost driver for total cost in our study. Patients with extra-spinal symptoms may face significant disabilities37 and lower quality of life,35 resulting in more visits to rheumatologists, higher direct cost and higher total cost. Higher education level and higher PGA were also associated with an increase in indirect cost in our study. This was different from the results found in other studies,8,31 where the main cost driver for indirect cost was functional status. Those with higher education lev-els in general, would secure jobs with higher salaries in Singapore.16 Since indirect cost calculated using the HCA is directly proportional to the number of sick leave days and the salary, an increase in salary would lead to an increase in indirect costs. Meanwhile, a decrease in physical and mental well-being (higher PGA score)38 would likely lead to patients not turning up for work, and thus increases the in-direct costs. Lack of employment was also found to be associated with lower indirect costs, which may not be surprising as the salary contributions of those without employment (USD 2218 ± 3143) are lower than those with employment (USD 6749 ± 3218).
There are some limitations to our study. One of the limitations is that we only included patients attending clinics in a tertiary referral center. However, in Singapore, all patients with axSpA are managed in second-ary or tertiary centers under the care of rheumatologists, rather than in primary care. Hence, our data are likely to be representative of patients with axSpA in Singapore. Another limitation is that patients might visit their local primary care physicians when they experience minor flares in their disease or to manage comorbidities. Such information will not be captured in the SGH database and will underestimate the direct cost. The small number of nr-axSpA patients included in our analysis poses another limitation as we cannot fully test for the differences between
axSpA (n = 135) AS (n = 119) nr-axSpA (n = 16) P value*
Days of inpatient visits
0.5 ± 1.5 0.5 ± 1.6 0.1 ± 0.3 .33
Number of outpa-tient visits
5.6 ± 4.6 5.4 ± 4.1 7.3 ± 7.2 .12
Number of emer-gency depart-ment visits
0.1 ± 0.4 0.1 ± 0.4 0.1 ± 0.3 .62
Number of labora-tory tests done
14.0 ± 11.8 14.1 ± 12.2 13.1 ± 8.6 .74
Number of imaging done
1.6 ± 2.3 1.7 ± 2.4 1.1 ± 1.2 .32
Note: Data are represented as mean ± SD.Abbreviations: axSpA, axial spondyloarthritis; AS, ankylosing spondylitis; nr-axSpA, non-radiographic axial spondyloarthritis.*P value calculated using 2-sample t test with equal variances for AS and nr-axSpA.
TA B L E 2 Utilization of healthcare services in patients with axSpA over a year

| 339KWAN et Al.
the healthcare utilization of AS and nr-axSpA patients. However, the low representation of nr-axSpA patients in our study is comparable to the axSpA cohort in our center and in Singapore.35 The use of HCA over Friction Cost Approach (FCA) in the calculation of the indirect costs is another limitation as HCA tends to overestimate the indirect cost.13 It can be argued that FCA would give a precise estimate for indirect cost, since it captures actual productivity losses, compared to HCA, which captures potential losses in productivity. However, it was not feasible to adopt the FCA due to patient confidentiality and salary information being considered to be sensitive. We did not estimate intangible costs, defined as the costs associated with a decrease in a patient's quality of life,39 in our study due to difficulties in estimating these costs. Such intangible costs include the cost of pain, inconvenience to daily life, lost jobs and school opportunities. This is another limitation since such intangible costs may pose a significant burden to patients and may lead to an underestimate of the total economic cost of axSpA in Singapore.
However, it is difficult to place a monetary value on these intangible costs. Another limitation is that we did not calculate the net economic cost of axSpA, which is the cost solely due to the disease. We instead calculated the costs among patients with axSpA, which includes costs due to other diseases not related to axSpA, thereby providing an over-estimate of the cost. We also did not consider the direct non-medical costs, leading to an underestimate of the direct costs. However, these costs were deemed to be trivial due to the nature of the disease and our patient characteristics. We also did not include the cost of comple-mentary and alternative medicines (CAMs) even though there has been a global increase in demand for CAMs,40 as most patients reported not being able to recall such information. This may underestimate the direct cost calculations. Lastly, we lack local data on the prevalence of axSpA and the costs calculated were estimates. Future prevalence studies are required to ensure a more precise estimate of the overall annual cost of axSpA in Singapore.
Mean annual costs ± SDMedian (IQR, 25th-75th percentile)
Direct costs
Inpatient cost 248 ± 802 0 (0-0)
Emergency department cost 16 ± 59 0 (0-0)
Professional cost 616 ± 509 355 (178-621)
Laboratory cost 416 ± 465 210 (98-444)
Imaging cost 329 ± 1127 83 (0-203)
Medication cost 6940 ± 39 314 446 (110-1507)
Average annual direct cost to society
8565 ± 39 504 1327 (731-4200)
Overall annual direct cost to society
67 931 457 ± 313 343 348 10 529 254 (5 800 354-33 314 797)
Sick leave and days off housework
No. of days of sick leave (employed, unemployed and NSF), d
4.3 ± 10.6 1 (0-3)
No. of days of housework (home-maker and retirees), d
0.6 ± 1.3 0 (0-0)
No. of days of sick leave and off housework, d
3.9 ± 9.7 1 (0-3)
Indirect costs
Due to sick leave (employed, unemployed and NSF)
973 ± 3325 0 (0-543)
Due to days off housework 11 ± 23 0 (0-23)
Average annual indirect cost to society
864 ± 3010 30 (0-543)
Overall annual indirect cost to society
6 855 951 ± 23 879 112 236 254 (0-4 303 467)
Total costs
Average annual total cost to society
9429 ± 39 621 1984 (1104-6298)
Overall annual total cost to society
74 790 820 ± 314 275 120 15 736 097 (8 758 974-49 955 458)
Note: Expressed in 2017 US purchasing power parity dollars.Abbreviations: axSpA, axial spondyloarthritis; NSF, national servicemen (full-time).
TA B L E 3 Average and overall annual direct, indirect and total costs with axSpA

340 | KWAN et Al.
In conclusion, axSpA poses a non-trivial economic burden given that the disease is relatively common in Singapore. Presence of extra-spi-nal symptoms (ever) was associated with an increase in total and direct costs. Higher education level and higher PGA were associated with an increase in indirect costs, while lack of employment was associated with a decrease in indirect costs. This highlights the need for economic mea-sures to better accommodate patients diagnosed with axSpA.
CONFLIC T OF INTERE S TThe authors declare there is no other conflict of interest to disclose. There is no funding provided for the production of this manuscript.
AUTHOR CONTRIBUTIONSYHK, TO, WF and JT conceived and designed this study. YHK, JKP, SYK, WF, NLL and YYL acquired the data for this study. SYK and YHK performed the analyses and prepared the first draft of the manuscript. MVHHC, KKL, TO and WF advised the statistical analyses. YHK, SYK, JKP, MVHHC, KKL, NLL, HLK, TO, JT, and WF interpreted the results. All authors read, revised critically, and approved the final manuscript.
E THIC S APPROVALThe SingHealth Centralized Institutional Review Board approved this research. All patients provided written informed consent to par-ticipate in this research.
ORCIDYu Heng Kwan https://orcid.org/0000-0001-7802-9696 Charmaine Tze May Wang https://orcid.org/0000-0002-6411-5427 Julian Thumboo https://orcid.org/0000-0001-6712-5535 Warren Fong https://orcid.org/0000-0003-1891-1892
R E FE R E N C E S 1. Sieper J, Poddubnyy D. Axial spondyloarthritis. Lancet.
2017;390(10089):73-84. 2. Strand V, Singh JA. Patient burden of axial spondyloarthritis. J Clin
Rheumatol. 2017;23(7):383-391. 3. Taurog JD, Chhabra A, Colbert RA. Ankylosing spondylitis and axial
spondyloarthritis. N Engl J Med. 2016;374(26):2563-2574. 4. Kobelt G, Sobocki P, Mulero J, Gratacos J, Pocovi A, Collantes-
Estevez E. The burden of ankylosing spondylitis in Spain. Value Health. 2008;11(3):408-415.
5. Boonen A, van der Heijde D, Landewé R, et al. Direct costs of an-kylosing spondylitis and its determinants: an analysis among three European countries. Ann Rheum Dis. 2003;62(8):732-740.
6. Malinowski KP, Kawalec P. The indirect costs of ankylosing spondylitis: a systematic review and meta-analysis. Expert Rev Pharmacoecon Outcomes Res. 2015;15(2):285-300.
7. Zhu TY, Tam L-S, Lee V w-y, et al. Costs and quality of life of patients with ankylosing spondylitis in Hong Kong. Rheumatology (Oxford). 2008;47(9):1422-1425.
8. Lee TJ, Park BH, Kim JW, Shin K, Lee EB, Song YW. Cost-of-illness and quality of life in patients with ankylosing spondylitis at a ter-tiary hospital in Korea. J Korean Med Sci. 2014;29(2):190-197.
TA B L E 4 Factors associated with total, direct and indirect costs of patients with axSpA
Factor
Annual total cost Annual direct cost Annual indirect cost
β (95% CI) P value β (95% CI) P value β (95% CI) P value
Gendera If female
1.261 (0.635, 2.503) .508 1.436 (0.690, 2.988) .334 0.478 (0.171, 1.331) .158
Educationb If post-secondary and highere
3.945 (1.532, 10.157) .004*
Occupationc If lack of employmentf
0.204 (0.078, 0.530) .001*
Disease duration, mo 1.002 (0.999, 1.005) .119 1.002 (0.999, 1.005) .321 1.002 (0.997, 1.008) .443
Extra-spinal symptoms, everd,g 2.095 (1.134, 3.869) .018* 2.713 (1.399, 5.263) .003*
BASDAI (0-10) 1.058 (0.782, 1.431) .715 1.091 (0.793, 1.501) .593
BASFI (0-10) 1.106 (0.845, 1.446) .463 1.107 (0.838, 1.462) .474
PGA (0-100) 1.016 (0.992, 1.040) .197 1.011 (0.987, 1.036) .354 1.035 (1.016, 1.054) <.001*
Pain (0-100) 0.998 (0.974, 1.023) .889 1.002 (0.976, 1.028) .898
Abbreviations: axSpA, axial spondyloarthritis; BASDAI, Bath Ankylosing Spondylitis Disease Activity Index; BASFI, Bath Ankylosing Spondylitis Functioning Index; PGA, Patient Global Assessment.References*P value < .05. aMale. bSecondary and lower. cEmployed. dNo extra-spinal symptoms. eIncludes post-secondary (non-tertiary), diploma and degree and higher degrees. fIncludes unemployed, full-time student, national servicemen (full-time) and homemakers and retirees. gIncludes peripheral arthritis, dactylitis and heel enthesitis, ever.

| 341KWAN et Al.
9. Lim J. Sustainable health care financing: the Singapore experience. Global Policy. 2017;8(S2):103-109.
10. Rudwaleit M, van der Heijde D, Landewe R, et al. The development of Assessment of SpondyloArthritis international Society classifica-tion criteria for axial spondyloarthritis (part II): validation and final selection. Ann Rheum Dis. 2009;68(6):777-783.
11. National Ankylosing Spondylitis Society. The Bath Indices. 12. Xie F, Thumboo J, Fong KY, et al. Direct and indirect costs of osteo-
arthritis in Singapore: a comparative study among multiethnic Asian patients with osteoarthritis. J Rheumatol. 2007;34(1):165-171.
13. Liljas B. How to calculate indirect costs in economic evaluations. Pharmacoeconomics. 1998;13(1):1-7.
14. Akkoç N, Direskeneli H, Erdem H, et al. Direct and indirect costs associated with ankylosing spondylitis and related disease activity scores in Turkey. Rheumatol Int. 2015;35(9):1473-1478.
15. Ministry of Manpower Singapore. Labour Force in Singapore 2015, 2016. In: Manpower and Research Statistics Department (ed.).
16. Ministry of Manpower Singapore. Labour Force in Singapore 2016, 2017In: Manpower and Research Statistics Department (ed.).
17. Ministry of Defence Singapore (MINDEF). Revision of National Service Rank Allowance, 2015.
18. Central Manpower Base (CMPB). Physical Employment Standards (PES). Singapore.
19. Department of Statistics Singapore. Singapore Consumer Price Index (2014 = 100) December 2018 and Year 2018, 2019.
20. Department of Statistics Singapore. Singapore Consumer Price Index (2014 = 100) December 2017 and Year 2017, 2018.
21. Department of Statistics Singapore. Singapore Consumer Price Index (2014 = 100) December 2016 and Year 2016, 2017.
22. Department of Statistics Singapore. Singapore Consumer Price Index (2014 = 100) December 2015 and Year 2015, 2016.
23. Department of Statistics Singapore. Singapore Consumer Price Index (2009 = 100) December 2014, 2015.
24. Department of Statistics Singapore. Singapore Consumer Price Index (2009 = 100) December 2013 and Year 2013, 2014.
25. World Bank. PPP conversion factor, GDP (LCU per international $). 26. Wang R, Ward MM. Epidemiology of axial spondyloarthritis: an up-
date. Curr Opin Rheumatol. 2018;30(2):137-143. 27. Stolwijk C, van Onna M, Boonen A, van Tubergen A. Global preva-
lence of spondyloarthritis: a systematic review and meta-regression analysis. Arthritis Care Res (Hoboken). 2016;68(9):1320-1331.
28. Department of Statistics Singapore. Population and Population Structure.
29. Mihaylova B, Briggs A, O'Hagan A, Thompson SG. Review of statis-tical methods for analysing healthcare resources and costs. Health Econ. 2011;20(8):897-916.
30. Krüger K, von Hinüber U, Meier F, et al. Ankylosing spondyli-tis causes high burden to patients and the healthcare system:
results from a German claims database analysis. Rheumatol Int. 2018;38(11):2121-2131.
31. Cooksey R, Husain MJ, Brophy S, et al. The cost of ankylosing spon-dylitis in the UK using linked routine and patient-reported survey data. PLoS ONE ONE. 2015;10(7):e0126105.
32. Tsifetaki N, Migkos MP, Papagoras C, Voulgari PV, Athanasakis K, Drosos AA. Counting costs under severe financial constraints: a cost-of-illness analysis of spondyloarthropathies in a Tertiary Hospital in Greece. J Rheumatol. 2015;42(6):963-967.
33. Reveille JD, Ximenes A, Ward MM, Deodhar A, Clegg D. Economic considerations of the treatment of ankylosing spondylitis. Am J Med Sci. 2012;343(5):371-374.
34. Png WY, Kwan YH, Lee YX, et al. Factors associated with initiation of biologics in patients with axial spondyloarthritis in an Urban Asian City: a PRESPOND study. J Clin Rheumatol. 2019;25(2):59-64.
35. Kwan YH, Fong W, Leung YY, et al. Are extra-spinal symptoms as-sociated with quality of life in patients with axial spondyloarthritis? A 1-year follow-up study. Clin Rheumatol. 2019;38(7):1881-1887.
36. Ministry of Manpower Singapore. Summary Table: Unemployment, 2019 In: Manpower Research and Statistics Department (ed.).
37. Garcia-Montoya L, Marzo-Ortega H. The role of secukinumab in the treatment of psoriatic arthritis and ankylosing spondylitis. Ther Adv Musculoskelet Dis. 2018;10(9):169-180.
38. Nikiphorou E, Radner H, Chatzidionysiou K, et al. Patient global assessment in measuring disease activity in rheumatoid arthritis: a review of the literature. Arthritis Res Ther. 2016;18(1):251.
39. Xie F, Thumboo J, Fong K-Y, et al. A study on indirect and intangi-ble costs for patients with knee osteoarthritis in Singapore. Value Health. 2008;11:S84-S90.
40. World Health Organization. WHO Traditional Medicine Strategy. Geneva, Switzerland: World Health Organization; 2013: 2014-2023
SUPPORTING INFORMATIONAdditional supporting information may be found online in the Supporting Information section.
How to cite this article: Kwan YH, Kwoh SY, Phang JK, et al. The direct and indirect costs of axial spondyloarthritis (axSpA) in Singapore. Int J Rheum Dis. 2020;23:334–341. https ://doi.org/10.1111/1756-185X.13777

342 | wileyonlinelibrary.com/journal/apl Int J Rheum Dis. 2020;23:342–349.
Received: 28 August 2019 | Revised: 6 November 2019 | Accepted: 7 November 2019
DOI: 10.1111/1756-185X.13758
O R I G I N A L A R T I C L E
Gastrointestinal risk factors and patient-reported outcomes of ankylosing spondylitis in Korea
Sang-Hoon Lee1 | Yong-wook Park2 | Jung-Yoon Choe3 | Kichul Shin4 | Seong-Ryul Kwon5 | Jin-Hye Cha6 | Young-Joo Kim6 | Juneyoung Lee7 | Tae-Hwan Kim8
1Department of Rheumatology, Hospital at Gangdong, School of Medicine, Kyung Hee University, Seoul, South Korea2Department of Rheumatology, Chonnam National University Hospital, Gwangju, Korea3Department of Rheumatology, Catholic University of Daegu School of Medicine, Daegu, Korea4Department of Rheumatology, SMG-SNU Boramae Medical Center, Seoul, Korea5Department of Rheumatology, Inha University Hospital, Incheon, Korea6Pfizer Pharmaceuticals Korea Limited, Seoul, Korea7Department of Biostatistics, Korea University College of Medicine, Seoul, Korea8Department of Rheumatology, The Hanyang University Hospital for Rheumatic Diseases, Seoul, Korea
CorrespondenceTae-Hwan Kim, Department of Rheumatology, The Hanyang University Hospital for Rheumatic Diseases, 17 Haengdang-Dong, Sungdong-Gu, Seoul 133-792, Korea.Email: [email protected]
Funding informationThis study was sponsored by Pfizer Pharmaceuticals Korea Ltd.
AbstractAim: This study examined the degree of gastrointestinal (GI) risk and patient-re-ported outcomes including GI-related symptoms, adherence to non-steroidal anti-inflammatory drugs (NSAIDs), disease activity and quality of life (QoL) in patients with ankylosing spondylitis (AS).Methods: Cross-sectional, observational study conducted at six nationwide, univer-sity-based hospitals of Korea. AS patients treated with NSAIDs for at least 2 weeks were included between March and September 2016. Demographic and clinical data were gathered through a medical chart review and patient survey. GI risk was esti-mated using Standardized Calculator of Risk for Events (SCORE). NSAIDs adherence was investigated with Morisky Medication Adherence Scale-8 (MMAS-8). Disease activity and QoL were examined with Bath Ankylosing Spondylitis Disease Activity Index (BASDAI) and EuroQol-3L (EQ-5D, EQ-visual analog scale [EQ-VAS]), respec-tively. Path analysis was implemented to estimate pathways of GI risk, GI symptoms and NSAIDs adherence to QoL.Results: A total of 596 patients (age: 38.9 ± 12.6 years, male: 82.1%) participated in the study, of which 33.2% experienced GI symptoms during NSAID treatment, and 34.2% of them showed ongoing GI symptoms upon enrollment. According to SCORE, 37.1% of patients showed moderate to very high GI risk. No patient showed high ad-herence according to MMAS-8, so 55.3% of patients with moderate adherence were considered adherent. BASDAI and QoL of the total patients were 3.5 ± 2.0, 0.6 ± 0.3 (EQ-5D), and 67.4 ± 19.8 (EQ-VAS), respectively. From path analyses, higher GI risk significantly lowered QoL.Conclusion: This study suggests timely therapeutic strategies should be implemented to manage GI risk during NSAID treatment in order to effectively manage AS.
K E Y W O R D S
ankylosing spondylitis, gastrointestinal risk, NSAID, patient-reported outcomes, quality of life
This is an open access article under the terms of the Creative Commons Attribution License, which permits use, distribution and reproduction in any medium, provided the original work is properly cited.© 2019 The Authors. International Journal of Rheumatic Dermatology published by Asia Pacific League of Associations for Rheumatology and John Wiley & Sons Australia, Ltd

| 343LEE Et aL.
1 | INTRODUC TION
Ankylosing spondylitis (AS) is an inflammatory arthritis affecting approximately fewer than 1% of the worldwide population.1{Braun, 1998 #1662} According to the 2016 update of the Assessment in Ankylosing Spondylitis International Society (ASAS) and European League Against Rheumatism (EULAR) management recommenda-tions for AS, non-steroidal anti-inflammatory drugs (NSAIDs) are recommended as a first-line treatment option up to its maximum dose in AS patients with pain and stiffness.2 In addition, NSAIDs were described as the key drugs for the effective management of AS.3 Despite the clinical usefulness of NSAIDs, they should be care-fully selected and prescribed as they often lead to an increase in gastrointestinal (GI) risk that may later lead to the development of GI-related complications.4-6 AS patients commonly suffer from an inflamed GI tract.7 Gastrointestinal side effects have been associ-ated with NSAID use, which may be minor, such as nausea, dyspep-sia, anorexia, and abdominal pain, or life-threatening complications such as GI bleeding and perforation.8 This gastrointestinal risk among NSAID users is known to differ as per demographic and clin-ical characteristics of each individual patient,9 and known factors include long-term use and/or high doses of NSAIDs (≥3 months), old age (≥65 years), heavy smoking, heavy drinking, current health sta-tus, co-morbidity (cardiovascular, renal and liver diseases, diabetes, hypertension), diagnosis of rheumatoid arthritis, aspirin use, antico-agulant use, corticosteroid use, use of selective serotonin reuptake inhibitor, Helicobacter pylori infection, history of GI symptoms, and history of hospitalization due to GI complications.10 Therefore, a systematic treatment approach which considers each patient-spe-cific feature should be implemented to minimize GI risk while on a NSAIDs prescription.
Patients’ behaviors toward NSAIDs intake need to be moni-tored. AS is a chronic disease which requires life-long treatment after onset; however, medication adherence of chronic diseases often decreases over time which could compromise the efficacy of NSAIDs.11 In a systematic review, adherence rate of NSAIDs users was reported between 30% to 65%.12 According to a double-blind and randomized controlled trial including 140 AS patients, 32% of all patients reported missing 2-10 days of taking NSAIDs medication.13 Along with clinical considerations for effective AS management, the assessment of patient-reported outcomes (PROs) such as quality of life (QoL) and functional status is an important aspect that should be taken into account as they impact the daily lives of patients. The 2016 update of ASAS/EULAR guidelines clearly state that the pri-mary objective of AS treatment should focus on the maximization of long-term QoL.2 Previous study findings have demonstrated that the QoL of AS patients was severely impaired and lowered than that of the general population.14-16 In addition, the assessment of disease activity is 1 of the widely used PROs to evaluate functional status. Moreover, several studies have shown that QoL and functional sta-tus are closed related with each other.17-19
According to previous findings, GI risk, NSAID adherence and PROs including disease activity and QoL showed significant
associations with each other. GI-related disorders had negative im-pacts on NSAID adherence and QoL.20,21 However, their complex inter-relationships have been merely studied. Therefore, this study was primarily designed to understand the degree of GI risk and PROs including GI-related symptoms, NSAIDs adherence, disease activity, and QoL, in AS patients. We have further evaluated their inter-rela-tionships by drawing potential paths to QoL.
2 | METHODS
This was a cross-sectional, observational study conducted at six na-tionwide, university-based hospitals of Korea. Data were collected through medical chart review and patients’ self-administered ques-tionnaires between March and September, 2016. An informed writ-ten consent was signed by all patients prior to their enrollment, and all participating hospitals obtained approval from an Institutional Review Board prior to conducting the study. All procedures in this study have been performed in accordance with the ethical standards of the institution and/or national research committee and with the 1964 Declaration of Helsinki and its later amendments or compara-ble ethical standards.
2.1 | Data collection
Patients who were diagnosed with AS according to the 1984 Modified New York criteria,22 and current NSAID users who were treated for at least 2 weeks were considered eligible. Those who were prescribed with NSAIDs as pro re nata, concurrently par-ticipating in other drug-controlled studies, in severe/insecure c linical/mental conditions, or confirmed ineligible by the physi-cians’ discretion, were excluded. Patients who met all inclusion criteria were asked to participate on their regular visit to the participating hospitals. The study consecutively enrolled pa-tients and collected data on demographic and clinical features, treatment patterns, NSAIDs adherence, disease activity, and QoL.
2.2 | Gastrointestinal risk level: Standardized Calculator of Risk for Events (SCORE)
Gastrointestinal risk was calculated using SCORE.23 SCORE was based on six predictors: age, current health status, diagnosis of rheumatoid arthritis (RA) which was confirmed by predominant peripheral joint arthritis in this study, duration of corticosteroid use, GI symptoms such as bleedings or ulcers, and hospitaliza-tion history due to GI-related symptoms or complications such as heartburn, stomach pain, nausea, vomiting while taking NSAIDs. The six predictors consisted of yes/no and multiple-choice ques-tions and patients earned a certain score based on the degree of their response to each predictor. A total of the SCORE value

344 | LEE Et aL.
ranged from 0 (possible minimum SCORE value) to 37 (possible maximum SCORE value) and was calculated for each patient by adding up all points earned from the six predictors. Patients were further stratified into four risk groups according to the total of their SCORE value. A SCORE value of 10 or less indicated that their risk was low; 11-15 points indicated a moderate risk; 16-20 points indicated a high risk; and more than 20 points indicated a very high risk.
2.3 | Medication adherence: Morisky Medication Adherence Scale-8 (MMAS-8) and NSAID intake rate
The MMAS-eight was used to estimate NSAIDs adherence. It con-sists of eight items, with scores ranging from 0 to 8 according to the scoring given to each item.24 The level of adherence was de-termined as: high adherence = 8, moderate adherence = 6-7, low adherence <6. The patients with high or moderate adherence were defined as NSAID adherent, and those showing low adherence were categorized as non-adherent. In addition to MMAS-8, NSAIDs intake rate of each patient was calculated based on the formula below.25
NSAID use by means of the ASAS-NSAID score (0-100): IndexofNSAID intake=NSAIDequivalent score∗
×Days of intake during period of interest∧ × Days per week
Period of interest in days∧
2.4 | Disease activity: Bath Ankylosing Spondylitis Disease Activity Index (BASDAI)
BASDAI is a self-administered questionnaire to assess disease activ-ity using a visual analog scale (VAS). It consists of six questions on fatigue, spinal pain, joint pain/swelling, areas of localized tenderness, and morning stiffness. Scores of each question ranged from 0 (no
problem) to 10 (very severe). Further, the mean of BASDAI scores was calculated as follows:
Further, control level was divided into 2 groups: Optimal control = (BASDAI score < 4), and Sub-optimal control = (BASDAI score ≥ 4).26
2.5 | QoL: EuroQol-3L
QoL was assessed using EQ-5D-3L, which includes 2 parts; EQ-5D and the EQ-VAS.27 EQ-5D consists of the following five domains: mobility, self-care, anxiety/depression, usual activities, and pain/discomfort, with three levels of responses (no problems, some prob-lems, and extreme problems). EQ-5D scores range from −0.229 (possible score of the worst imaginable health status) to 1 (possible score of the best imaginable health status) based on a study by Kang et al.28 EQ-VAS addresses self-rated health on a vertical VAS with scores ranging from 0 (the worst imaginable health status) to 100 (the best imaginable health status). Higher scores of both measure-ments correspond to a better QoL.
2.6 | Statistical analysis
For descriptive statistics, continuous variables are presented with the number of observations, the mean, and the standard deviation; categorical variables are presented with frequency and percentage (100%). Chi-square test, Fisher's exact test and analysis of variance were performed to assess the difference of GI-related symptoms, NSAIDs adherence, disease activity and QoL depending on the de-gree of GI risk.
NSAID equivalent score = current NSAID dose/optimal dose × 100(
If current NSAID dose > optimal NSAID dose, then NSAID equivalent score = 100)
∧Daysof intakeduringperiodof interest =Periodof interest indays
=30days
⎧
⎪
⎨
⎪
⎩
�
Fatigue score�
+�
Spinal pain score�
+�
Joint pain or Swelling score�
+
�
Areas of localized tenderness score�
+�
Morining stiffness score�
⎫
⎪
⎬
⎪
⎭
∕5
F I G U R E 1 Hypothesized paths of potential determinants to quality of life.* This figure describes hypothesized pathway which was drawn based on the time point of each variable collected and a hypothesized inter-related association of each variable. +NSAID adherence according to Morisky Medication Adherence Scale-8 (MMAS-8) was for the last 2 weeks prior to enrollment. §Timeframe of current GI symptoms and QoL were about the same, but current symptoms were set in the path prior to QoL based on previous study findings showing that current symptoms affected QoL. Abbreviations: GI, gastrointestinal; NSAID, non-steroidal anti-inflammatory drug; QoL, quality of life

| 345LEE Et aL.
2.7 | Path analysis model
A hypothetical path model (Figure 1) was drawn based on the specific time point of each variable. The variables included in the hypothetical
path model were assumed to be present and/or have impact on the patients from the time point. Also, the inter-related associations of each variable were considered. The degree of GI risk which took inherent conditions such as age, RA diagnosis, corticosteroid use within 1 year, and history of GI-related complications into calcula-tion, was placed at the beginning of the path model. The history of GI-related symptoms that occurred while on NSAIDs treatment was put in the second place since it was considered as a GI risk-induced factor. The path model was followed by NSAIDs adherence accord-ing to MMAS-8, which was measured during approximately 2 weeks from the study enrollment. Finally, current GI-related symptoms and
TA B L E 1 Baseline characteristics of study subjectsa
Total (N = 591)
Age, y, mean (SD) 38.9 (12.6)
Male 485 (82.1)
Time to diagnosis from AS onset, mo, mean (SD) 60.9 (80.1)
AS disease duration, mo, mean (SD) 51.8 (46. 8)
GI-related symptoms and diseases, multiple answers
95 (16.1)
Diarrhea 10 (1.7)
GI pain 9 (1.5)
GI trouble 13 (2.2)
Upper GI ulcer 16 (2.7)
Gastritis 21 (3.6)
GERD 23 (3.9)
Others 86 (14.6)
Co-morbid diseases,b multiple answers 296 (50.1)
Current health status
Very poor 26 (4.4)
Poor 192 (32.5)
Normal 258 (43.7)
Good 108 (18.3)
Very good 7 (1.2)
Current smoking 193 (32.7)
Current drinking 372 (62.9)
Current use of antiplatelets 22 (3.7)
Current use of anti-coagulants 4 (0.7)
History of Helicobacter pylori infection 55 (9.3)
History of GI symptomc during NSAID intake 196 (33.2)
Current GI symptomsc 67 (11.3)
Hospitalization due to GI-related disease and complications while on NSAID intake
11 (1.9)
BASDAI, mean (SD) 3.5 (2.0)
Optimal control, <4 366 (61.9)
Sub-optimal control, ≥4 225 (38.1)
EQ-5D, mean (SD) 0.6 (0.3)
EQ-VAS, mean (SD) 67.4 (19.8)
Abbreviations: SD, standard deviation; AS, ankylosing spondylitis; GI, gastrointestinal; GERD, gastro-esophageal reflux disease; NSAID, non-steroidal anti-inflammatory drug; BASDAI, Bath Ankylosing Spondylitis Disease Activity Index.aData are N (%) unless indicated otherwise. bCo-morbidities included were hypertension (12.4%), eye disease (11.0%), musculo-skeletal disease (9.3%), infectious disease (5.2%), liver disease (4.6%), skin and subcutaneous diseases (4.6%), genito-urinary diseases (4.2%), diabetes (4.1%), respiratory disease (3.6%). cHeartburn and dyspepsia.
TA B L E 2 Patterns of currently prescribed NSAID and other related AS treatmenta
Total (N = 591)
NSAID type
Non-selective NSAID 431 (72.9)
Selective NSAID 160 (27.1)
Duration of NSAID intake
<3 mo 118 (20.0)
≥3 mo 473 (80.0)
NSAID dose
Low (<usual dosage) 153 (25.9)
Moderate (usual dosage) 438 (74.1)
High (>usual dosage) 0 (0.00)
NSAID equivalent score, mean (SD) 87.1 (21.9)
GI protective agent
H2 receptor antagonist 69 (13.4)
PPI 172 (33.5)
Others 273 (53.1)
Corticosteroid use for the past 1 year
Yes 142 (24.0)
Duration of use
<1 mo 18 (8.9)
1-3 mo 45 (22.2)
4-6 mo 44 (21.7)
7-10 mo 30 (14.8)
11-12 mo 66 (32.5)
Other drugs, multiple answers
Narcotic analgesics 2 (0.4)
Non-opioid analgesics 191 (38.0)
Conventional DMARDs 263 (52.3)
Biologics 188 (37.4)
Selective serotonin reuptake inhibitor
Yes 3 (0.5)
Abbreviations: NSAID, non-steroidal anti-inflammatory drug; AS, ankylosing spondylitis; GI, gastrointestinal; SD, standard deviation; PPI, proton pump inhibitor; DMARDs, disease-modifying anti-rheumatic drugs.aData are N (%) unless indicated otherwise.

346 | LEE Et aL.
QoL were the last factors, but current GI-related symptoms were set in the path prior to QoL based on logical thinking. In addition to di-rect paths drawn between each variable in order, based on literature review, we added 2 more direct paths from GI risk and the history of GI-related symptoms to current GI-related symptoms and QoL. To perform the path analyses, patients were stratified by control level of disease activity according to BASDAI.
The magnitude of each path is presented with standardized co-efficients. Path was considered significant at P < .05. The fitness of the path model was evaluated significant for the following: P > .05 for Chi-square, goodness of fit index (GFI) >0.9, adjusted GFI (AGF) >0.85, comparative fit index (CFI) >0.9, Tucker-Lewis index (TLI) >0.9, root mean square error of approximation (RMSEA) <0.05, and stan-dardized root mean square residual (SRMR) <0.08. The descriptive and path analyses were performed using the SPSS WIN20.0 and AMOS 19.0 Program, respectively.
3 | RESULTS
The study included 591 AS patients with a mean age of 38.9 ± 12.6 years. Mean duration of AS was approximately 4.3 years. Of the total, 16.1% were diagnosed with GI-related dis-eases and about 2% were hospitalized due to GI-related diseases and complications. Of the total, about one-third experienced GI-related symptoms while on NSAIDs treatment and 11.3% showed GI-related symptoms upon enrollment (Table 1). A majority of the patients were currently on non-selective NSAIDs and the dosage of current NSAIDs was predominantly moderate. Approximately, 1 in four patients reported as having taken a corticosteroid within a year (Table 2).
According to the SCORE criteria, 37.1% of patients showed mod-erate to high GI risk while the remaining had a low GI risk (Table 3). None of the patients showed high adherence to NSAIDs as per the MMAS-8. Therefore, 55.3% of patients with moderate adherence were categorized as adherent for further analysis. NSAID intake on an average was 73.0 ± 28.2 (Table 4). BASDAI score was 3.5 ± 2.0 on average, and about 40% of patients showed sub-optimal control of disease activity. Overall, QoL according to EQ-5D and EQ-VAS was 0.6 ± 0.3 and 67.4 ± 19.8, respectively (Table 1).
In the sub-optimal control group of patients, higher GI risk sig-nificantly lowered EQ-5D in both direct and indirect ways. Higher
GI risk directly impaired the EQ-5D (b = −0.14, P = .015), and it also negatively affected the EQ-5D through history of GI-related symp-toms (Figure 2A). For EQ-VAS, GI risk only showed indirect effect on EQ-VAS which was mediated by the history of GI-related symptoms (Figure 2B). Likewise, the optimal control group of patients indicated similar trends as that of the sub-optimal group. Higher GI risk had a direct effect on the decrease in EQ-5D (b = −0.17, P = .014) whereas it was found to have indirect effects on EQ-VAS through GI-related symptoms (Figure 2C,2).
4 | DISCUSSION
We investigated the degree of GI risk and PROs in a large number of AS patients in Korea. The assessment of GI risk among NSAID users has been widely studied using a variety of risk measurement tools in multiple populations. However, only a few studies have enabled the quantification of the degree of GI risk. One cross-sectional study in Korea, which also applied the SCORE criteria to orthopedic outpa-tients on NSAIDs, reported about 80% of patients showed higher than moderate GI risk.10 In comparison, a lower percentage of our study pa-tients indicated having higher than moderate GI risk. However, as per this study's results, the prevalence of GI risk was noticeable among AS patients; importance of thorough monitoring and management of GI risks and symptoms in AS patients taking NSAIDs warrants attention.
The primary goal of AS treatment is to minimize structural de-formity in the spine by preventing joint inflammation and dam-age. Although no complete cure has been developed to inhibit bone-bridging and syndesmophytes in the spine, NSAIDs are recom-mended to relieve symptomatic pain and joint inflammation.2,29,30 A randomized controlled trial demonstrated that the continuous use of NSAIDs over 2 years delayed radiographic progression, which was determined as an Modified Stoke Ankylosing Spondylitis Spinal Score (mSASSS) worsening, in the comparison of on-demand treatment.31
TA B L E 3 Assessment of GI risk using Standardized Calculator of Risk for Events (SCORE)
Total, N = 591 (%)
Low (<10) 372 (62.9)
Moderate (11-15) 158 (26.7)
High (16-20) 53 (9.0)
Very high (>20) 8 (1.4)
Abbreviation: GI, gastrointestinal
TA B L E 4 Medication adherence of NSAID using MMAS-8 and NSAID intake rate
Total (N = 591)
MMAS-8a N 589
Missing 2
Mean (SD) 5.7 (1.3)
Adherent,b n (%) 326 (55.2)
Non-adherent, n (%) 263 (44.5)
NSAID intake rate N 586
Missing 5
Mean (SD) 73.0 (28.2)
Abbreviations: MMAS-8, Morisky Medication Adherence Scale-8; NSAID, non-steroidal anti-inflammatory drug.aMMAS-8: Adherence was defined if patients showed high or moderate adherence. bIn this study, there was no patient indicating high adherence. Therefore only moderately adherent patients were defined as adherent.

| 347LEE Et aL.
F I G U R E 2 Paths analysis results to quality of life.* A, Pathways of EQ-5D among patients showing sub-optimal control on disease activity (BASDAI ≥ 4), N = 225. Goodness of fit: Chi-square = 12.481 (4 df), P = .014, GFI = 0.991, AGFI = 0.936, CFI = 0.933, TLI = 0.664, RMSEA = 0.060 (P = .277), SRMR = 0.0525. B, Pathways of EQ-VAS among patients showing sub-optimal control on disease activity (BASDAI ≥ 4), N = 224. Goodness of fit: Chi-square = 13.923 (4 df), P = .008, GFI = 0.990, AGFI = 0.929, CFI = 0.918, TLI = 0.588, RMSEA = 0.065 (P = .210), SRMR = 0.0597. C, Pathways of EQ-5D among patients showing optimal disease control on disease activity (BASDAI < 4), N = 364. Goodness of fit: Chi-square = 12.481 (4 df), P = .014, GFI = 0.991, AGFI = 0.936, CFI = 0.933, TLI = 0.664, RMSEA = 0.060 (P = .277), SRMR = 0.0908. D, Pathways of EQ-VAS among patients showing optimal disease control on disease activity (BASDAI < 4), N = 364. Goodness of fit: Chi-square = 13.923 (4 df), P = .008, GFI = 0.990, AGFI = 0.929, CFI = 0.918, TLI = 0.588, RMSEA = 0.065 (P = .210), SRMR = 0.0889. *Numbers in figures are standardized coefficient. Bold paths indicate statistical significance at P < .05. Abbreviations: AGFI, adjusted goodness of fit index; BASDAI, Bath Ankylosing Spondylitis Disease Activity Index; CFI, comparative fit index; GFI, goodness of fit index; GI, gastrointestinal; SCORE, Standardized Calculator of Risk for Events; MMAS-8, Morisky Medication Adherence Scale-8; RMSEA, root mean square error of approximation; SRMR, standardized root mean square residual; TLI, Tucker-Lewis index

348 | LEE Et aL.
In addition, Poddubnyy et al observed a dose-response relationship between a higher dose of NSAIDs and lower radiographic spinal progression.32 Based on these findings, continuous NSAIDs intake, preferably high dose unless contraindicated, is crucial for better management of AS. For these reasons, our study results on NSAIDs adherence was somewhat striking because no patient showed high adherence. To the best of our knowledge, this study might be the first approach to investigate NSAIDs adherence in AS patients since 1996 in which an electronic device was utilized to assess NSAIDs adherence.13 Although our results on NSAIDs adherence were merely based on patients’ self-reports, which may have led to over/under-estimation of adherence level, the study findings imply that motivational education should be sought to improve NSAIDs adher-ence which may consequently affect long-term progression of the disease as well as relief of the symptoms.
The BASDAI has long been studied across countries to assess severity of diseases. In a single-center study in China, BASDAI of the Chinese patients was similar to that of our findings,33 whereas another Asian study involving a total of 85 Korean patients with AS reported less severity than our study patients.34 Compared to a pre-vious study of AS patients, our study indicated higher impairment in EQ-5D.35 Although clinical monitoring of AS may be well-managed, as predicted with their regular visits to university-based hospitals in metropolitan areas, patient-perceived disease outcomes might be neglected. Consequently, efforts including the implementation of strategic interventions to enhance QoL need to be introduced from this perspective.
There have been many studies to determine factors associated with QoL in AS patients, with a couple of studies showing that severe disease activity in BASDAI was the key modifiable and a highly asso-ciated variable with impairment in QoL.36,37 Based on these findings, we divided our study patients into 2 groups being optimal disease activity and sub-optimal disease activity, and further analyzed the associations of QoL with its potential determinants, the degree of GI risk, the experience of GI symptoms, and NSAIDs adherence using path analysis. With this advanced technique, namely path analysis, we observed that severe GI risk was related to poor QoL, which was mediated by the experience of GI symptoms. We found both direct and indirect pathways of GI risk linked to poor QoL, although the direct paths linking NSAIDs adherence and QoL were insignificant. Due to the nature of this study where cross-sectional patient survey and retrospective chart review were the primary data sources, it is unclear to infer precise temporal relationships between GI symp-toms and NSAIDs adherence.
Although our study included a large number of AS patients who can be a representative of the whole AS population in Korea, the inter-pretation and utilization of the study results should be carefully done. First, our study utilized both disease-specific functional disability and generic QoL instruments to measure different aspects of PROs, so the results from the generic QoL instrument were not precisely describ-ing disease-specific QoL. Our study population may have had better access to hospital care which may have led to better disease manage-ment. Also, no direct causal inference may be done due to the nature
of the study design. For the assessment of a more accurate and direct causal relationship, more controlled studies should be conducted. Moreover, the study being multi-centric in nature, clustering has not been taken into account. Intra-class correlations have not been es-timated and reviewed for each variable in the analysis. In addition, recall bias may be present since the assessment on the symptoms/complaints during NSAID usage was based on patients’ self-reports. Lastly, the interpretation of GI risk, which was assessed by SCORE, should be cautiously done since SCORE is a disease-specific tool to assess GI risk for arthritis patients, not specific AS patients.
Although our study inherently had several limitations and no di-rect, causal inference can be made in the relationship of GI risk with QoL, the results clearly provide practical evidence to suggest timely therapeutic strategies be implemented in order to manage GI risk during NSAIDs treatment in AS patients. Therefore, GI risk should be monitored and considered as one of the key factors in order to manage QoL in AS patients on NSAID treatment given there was a significant association between GI risk and QoL. In addition, based on our study objectives and results, we justify the need of a pro-spective study.
ACKNOWLEDG EMENTSThis study was sponsored by Pfizer Pharmaceuticals Korea Ltd. The authors would like to acknowledge Nalini Adele Pinto from Pfizer Ltd. India for her editorial support in preparing this manuscript.
CONFLIC T OF INTERE S TAll authors state there is no conflict of interests to disclose.
ORCIDKichul Shin https://orcid.org/0000-0002-6749-7598 Jin-Hye Cha https://orcid.org/0000-0003-0612-5499 Tae-Hwan Kim https://orcid.org/0000-0002-3542-2276
R E FE R E N C E S 1. Braun J, Bollow M, Remlinger G et al. Prevalence of spondylarthrop-
athies in HLA-B27 positive and negative blood donors. Arthritis Rheum. 1998;41(1):58-67.
2. van der Heijde D, Ramiro S, Landewé R et al. 2016 update of the ASAS-EULAR management recommendations for axial spondyloar-thritis. Ann Rheum Dis. 2017;76(6):978-991.
3. Toussirot E, Wendling D. Current guidelines for the drug treatment of ankylosing spondylitis. Drugs. 1998;56(2):225-240.
4. Laine L. Nonsteroidal anti-inflammatory drug gastropathy. Gastrointest Endosc Clin N Am. 1996;6(3):489-504.
5. Lanza F. A review of gastric ulcer and gastroduodenal injury in normal volunteers receiving aspirin and other non-steroidal anti-inflammatory drugs. Scand J Gastroenterol. 1989;163: 24-31.
6. Laine L, Harper S, Simon T et al. A randomized trial comparing the effect of rofecoxib, a cyclooxygenase 2–specific inhibitor, with that of ibuprofen on the gastroduodenal mucosa of patients with osteo-arthritis. Gastroenterology. 1999;117(4):776-783.
7. Lianne L. GI joint - a major in the Spondyloarthritis War Van Nuys, CA: Spondylitis Association of America; 2019 [cited 2019 Jan 15]. Available from: https ://www.spond ylitis.org/About-SAA/Updat es/gastr ointe stinal-infla mmati on-in-ankyl osing-spond ylitis

| 349LEE Et aL.
8. Al-Saeed A. Gastrointestinal and cardiovascular risk of nonsteroidal anti-inflammatory drugs. Oman Med J. 2011;26(6):385-391.
9. Laine L. Approaches to nonsteroidal anti-inflammatory drug use in the high-risk patient. Gastroenterology. 2001;120(3):594-606.
10. Lee S-H, Han C-D, Yang I-H, Ha C-W. Prescription pattern of NSAIDs and the prevalence of NSAID-induced gastrointestinal risk factors of orthopaedic patients in clinical practice in Korea. J Korean Med Sci. 2011;26(4):561-567.
11. Sabaté E. Adherence to long-term therapies: evidence for action.Ge-neva, Switzerland:World Health Organization; 2003.
12. Harrold LR, Andrade SE. Medication adherence of patients with se-lected rheumatic conditions: a systematic review of the literature. Sem Arthritis Rheum. 2009;38(5):396-402.
13. de Klerk E, van der Linden SJ. Compliance monitoring of NSAID drug therapy in ankylosing spondylitis, experiences with an elec-tronic monitoring device. Br J Rheumatol. 1996;35(1):60-65.
14. Bostan EE, Borman P, Bodur H, Barça N. Functional disability and quality of life in patients with ankylosing spondylitis. Rheumatol Int. 2003;23(3):121-126.
15. van Genderen S, Plasqui G, van der Heijde D et al. Social role par-ticipation and satisfaction with life: a study among patients with ankylosing spondylitis and population controls. Arthritis Care Res (Hoboken). 2018;70(4):600-607.
16. Ozgül A, Peker F, Taskaynatan MA, Tan AK, Dinçer K, Kalyon TA. Effect of ankylosing spondylitis on health-related quality of life and different aspects of social life in young patients. Clin Rheumatol. 2006;25(2):168-174.
17. Lee T-J, Park B-H, Kim JW, Shin K, Lee EB, Song Y-W. Cost-of-illness and quality of life in patients with ankylosing spondylitis at a ter-tiary hospital in Korea. J Korean Med Sci. 2014;29(2):190-197.
18. Yılmaz O, Tutoğlu A, Garip Y, Ozcan E, Bodur H. Health-related quality of life in Turkish patients with ankylosing spondylitis: im-pact of peripheral involvement on quality of life in terms of disease activity, functional status, severity of pain, and social and emotional functioning. Rheumatol Int. 2013;33(5):1159-1163.
19. Fallahi S, Jamshidi AR, Bidad K, Qorbani M, Mahmoudi M. Evaluating the reliability of Persian version of ankylosing spondylitis quality of life (ASQoL) questionnaire and related clinical and demographic parameters in patients with ankylosing spondylitis. Rheumatol Int. 2014;34(6):803-809.
20. Lanas A, Polo-Tomás M, Roncales P, Gonzalez MA, Zapardiel J. Prescription of and adherence to non-steroidal anti-inflammatory drugs and gastroprotective agents in at-risk gastrointestinal pa-tients. Am J Gastroenterol. 2012;107(5):707-714.
21. Koloski NA, Talley NJ, Boyce PM. The impact of functional gas-trointestinal disorders on quality of life. Am J Gastroenterol. 2000;95(1):67-71.
22. van der Linden S, Valkenburg HA, Cats A. Evaluation of di-agnostic criteria for ankylosing spondylitis. Arthritis Rheum. 1984;27(4):361-368.
23. Singh G, Ramey D, Triadafilopoulus G, Brown B, Balise R. GI SCORE: a simple self-assessment instrument to quantify the risk of serious NSAID-related GI complications in RA and OA. Arthritis Rheum. 1998;41(9):S75.
24. Morisky DE, Ang A, Krousel-Wood M, Ward HJ. Predictive validity of a medication adherence measure in an outpatient setting. J Clin Hypertens (Greenwich). 2008;10(5):348-354.
25. Dougados M, Simon P, Braun J et al. ASAS recommendations for collecting, analysing and reporting NSAID intake in clinical trials/
epidemiological studies in axial spondyloarthritis. Annals Rheum Dis. 2011;70(2):249-251.
26. Cohen JD, Cunin P, Farrenq V et al. Estimation of the bath anky-losing spondylitis disease activity index cutoff for perceived symp-tom relief in patients with Spondyloarthropathies. J Rheumatol. 2006;33(1):79-81.
27. Kim MH, Cho YS, Uhm WS, Kim S, Bae SC. Cross-cultural adapta-tion and validation of the Korean version of the EQ-5D in patients with rheumatic diseases. Qual Life Res. 2005;14(5):1401-1406.
28. Kang EJ, Ko SK. A catalogue of EQ-5D utility weights for chronic diseases among noninstitutionalized community residents in Korea. Value Health. 2009;12(Suppl 3):S114-S117.
29. Ward MM, Deodhar A, Akl EA et al. American College of Rheumatology/Spondylitis Association of America/Spondyloarthritis Research and Treatment Network 2015 rec-ommendations for the treatment of ankylosing spondylitis and nonradiographic axial spondyloarthritis. Arthritis Rheumatol. 2016;68(2):282-298.
30. Shen B, Shi ZJ, Lv HS et al. Consensus of Chinese orthopaedic ex-perts on diagnosis and treatment of ankylosing spondylitis. Orthop Surg. 2013;5(1):1-5.
31. Wanders A, Dv H, Landewé R et al. Nonsteroidal antiinflamma-tory drugs reduce radiographic progression in patients with an-kylosing spondylitis: a randomized clinical trial. Arthritis Rheum. 2005;52(6):1756-1765.
32. Poddubnyy D, Rudwaleit M, Haibel H et al. Effect of non-ste-roidal anti-inflammatory drugs on radiographic spinal progres-sion in patients with axial spondyloarthritis: results from the German Spondyloarthritis Inception Cohort. Annals Rheum Dis. 2012;71(10):1616-1622.
33. Au YL, Wong WS, Mok MY, Chung HY, Chan E, Lau CS. Disease activity assessment in ankylosing spondylitis in a Chinese cohort: BASDAI or ASDAS? Clin Rheumatol. 2014;33(8):1127-1134.
34. Park SH, Choe JY, Kim SK, Lee H, Castrejón I, Pincus T. Routine Assessment of Patient Index Data (RAPID3) and Bath Ankylosing Spondylitis Disease Activity Index (BASDAI) scores yield similar in-formation in 85 Korean patients with ankylosing spondylitis seen in usual clinical care. J Clin Rheumatol. 2015;21(6):300-304.
35. Boonen A, Patel V, Traina S, Chiou CF, Maetzel A, Tsuji W. Rapid and sustained improvement in health-related quality of life and util-ity for 72 weeks in patients with ankylosing spondylitis receiving etanercept. J Rheumatol. 2008;35(4):662-667.
36. Dean LE, Macfarlane GJ, Jones GT. Five potentially modifiable fac-tors predict poor quality of life in ankylosing spondylitis: results from the Scotland Registry For Ankylosing Spondylitis. J Rheumatol. 2018;45(1):62-69.
37. Bodur H, Ataman S, Rezvani A et al. Quality of life and related variables in patients with ankylosing spondylitis. Qual Life Res. 2011;20(4):543-549.
How to cite this article: Lee S-H, Park Y, Choe J-Y, et al. Gastrointestinal risk factors and patient-reported outcomes of ankylosing spondylitis in Korea. Int J Rheum Dis. 2020;23:342–349. https ://doi.org/10.1111/1756-185X.13758

350 | wileyonlinelibrary.com/journal/apl Int J Rheum Dis. 2020;23:350–357.© 2019 Asia Pacific League of Associations for Rheumatology and John Wiley & Sons Australia, Ltd
1 | INTRODUC TION
Ankylosing spondylitis (AS) is a complex rheumatic disease mainly char-acterized by the involvement of the axial skeleton including sacroiliac
joint, alongside involvement of the peripheral joints.1 Although, the environment has a role in the pathogenesis of AS, studies show that genetic factors provide up to 90% of the susceptibility to the disease; half of them are attributable to major histocompatibility complex
Received: 14 August 2019 | Revised: 2 December 2019 | Accepted: 6 December 2019
DOI: 10.1111/1756-185X.13783
O R I G I N A L A R T I C L E
P2 receptors mRNA expression profiles in macrophages from ankylosing spondylitis patients and healthy individuals
Maryam Akhtari1,2 | Seyed Jalal Zargar1 | Mahdi Vojdanian2 | Amir Ashraf-Ganjouei2 | Ali Javinani2 | Elham Hamzeh2 | Alireza Rezaiemanesh3 | Ahmadreza Jamshidi2,4 | Mahdi Mahmoudi2,4
1Department of Cell & Molecular Biology, School of Biology, College of Science, University of Tehran, Tehran, Iran2Rheumatology Research Center, Tehran University of Medical Sciences, Tehran, Iran3Department of Immunology, School of Medicine, Kermanshah University of Medical Sciences, Kermanshah, Iran4Inflammation Research Center, Tehran University of Medical Sciences, Tehran, Iran
CorrespondenceMahdi Mahmoudi, Rheumatology Research Center, Tehran University of Medical Sciences, Shariati Hospital, Kargar Ave., Tehran, Iran.Email: [email protected].
Seyed Jalal Zargar, School of Biology, College of Science, University of Tehran, P.O. Box: 141556455, Tehran, Iran.Email: [email protected].
Funding informationDeputy of Research, Tehran University of Medical Sciences, Grant/Award Number: 94-02-41-28991
AbstractBackground: Ankylosing spondylitis (AS) is a multifactorial rheumatic disease which mainly involves the axial skeleton. Macrophages and extracellular nucleotides have been shown to contribute to the inflammation process in autoimmune diseases. Membrane-bound purinergic P2 receptors might be involved in the modulation of immune cells in AS. Therefore, we aimed to analyze the messenger RNA (mRNA) expression of P2 receptors in the macrophages of AS patients and healthy controls.Methods: Twenty-three AS patients and 23 age- and sex-matched healthy individuals were included in our study. Whole blood-separated monocytes of study participants were stimulated by macrophage colony-stimulating factor for 7 days and differenti-ated to macrophages. Monocyte and macrophage markers were analyzed by flow cytometry. SYBR green real-time polymerase chain reaction was used to measure the relative expression levels of P2RX1, P2RX2, P2RX3, P2RX4, P2RX5, P2RX6, P2RX7, P2RY1, P2RY2, P2RY4, P2RY6, P2RY11, P2RY12, P2RY13, P2RY14, and PANX1 genes.Results: P2RY13 and P2RY6 genes had the highest expression levels in mac-rophages among P2RY genes. P2RY1 mRNA expression was significantly down-regulated (−1.75 fold) and P2RY14 was up-regulated (2.6 fold) in macrophages of AS patients compared to healthy individuals. P2RX4 gene had the highest expression in monocyte-derived macrophages, followed by P2RX7 and P2RX1 genes. There was no significant difference in P2X receptor mRNA expression level between macrophages of AS patients and healthy individuals.Conclusions: Our results indicate that AS patients show altered expression levels of P2 receptor genes. Moreover, these changes might be associated with disease activ-ity and patients’ status.
K E Y W O R D S
ankylosing spondylitis, extracellular nucleotides, macrophages, P2 receptors

| 351AKHTARI eT Al.
genes such as HLA-B27.2 Several studies have focused on the adaptive immune response in AS,3 but due to the polygenic auto-inflammatory nature of the disease, innate immunity has been proposed to play a significant role as well.4
Macrophages are one of the main cells taking part in the innate immune response and have several tasks such as antigen presenta-tion, phagocytosis, cytokine production, and so on. Based on their microenvironment, macrophages can be transformed into either M1 or M2 subtypes.5 In the presence of pro-inflammatory cytokines such as interferon (IFN)-γ or tumor necrosis factor (TNF)-α, M1 phenotype has emerged. Macrophage colony-stimulating factor (M-CSF), interleukin (IL)-4 and IL-13 promote the development of M2 macrophages.5 M2 macrophages and M2-type polarized monocytes have been shown to be predominant in synovial membrane and pe-ripheral blood of AS patients, respectively. Moreover, the M2/M1 ratio is correlated with inflammatory biomarkers and disease activity scores.6,7 Studies have demonstrated that macrophages are one of the main cells contributing to the inflammation process in AS, es-pecially in joints.8 Therefore, investigating the macrophage function and gene expression in patients with AS would be valuable.
While adenosine triphosphate (ATP) is mostly known for its central role in energy metabolism, extracellular ATP can affect several biolog-ical processes such as activation and migration of immune cells.9 ATP is released to the extracellular space through Pannexin 1 (Panx1) pores that is induced by P2X7 purinergic receptor activation.10 Extracellular ATP and related nucleotides act through membrane-bound purinergic P2 receptors.11 P2 receptors include G-protein coupled P2Y recep-tors and ligand-gated ion channel P2X receptors. Macrophages have been shown to be affected by P2 receptors and rapidly change their function.12 The P2X7 was the first member of this family discovered. It affects intracellular calcium concentration in both human and mu-rine macrophages.13,14 It is demonstrated that alveolar macrophages have all subtypes of P2 receptors except P2Y12, P2X2, P2X3 and P2X6. However, only P2X7, P2Y1, P2Y2 and P2Y11 could increase the intracel-lular calcium level.15 ATP can also affect the production of inflamma-tory cytokines such as TNF-α by macrophages,16 which is proven to have a prominent role in AS. Therefore, P2 receptors could contribute to the altered balance of the immune system in AS patients.
As was mentioned, P2 receptors are involved in the inflamma-tory processes. However, their role in AS disease pathogenesis is not clear yet. Therefore, we aimed to investigate the mRNA expression of P2 receptors and Panx1 hemi-channel in the macrophages of AS patients and healthy controls. Moreover, we have explored the cor-relation between P2R family mRNA expression and clinical features of the disease.
2 | MATERIAL S AND METHODS
2.1 | Patients and controls
Twenty-three AS patients (4 female and 19 male) who fulfilled the modified New York classification criteria17 and 23 age- and
sex-matched healthy individuals without any familial history of rheu-matic diseases were included in our study. The included patients had Bath Ankylosing Spondylitis Disease Activity Index (BASDAI) ≥4. Mean ages for patient and control groups were 32 ± 10 and 35 ± 11 years, re-spectively. Clinical characteristics of AS patients were collected at the time of sample collection. The ethics committee of Tehran University of Medical Sciences approved the study and we obtained written in-formed consents from patients and healthy individuals.
2.2 | Monocyte separation and macrophage derivation
Using ethylenediaminetetraacetic acid (EDTA) tubes, 20 mL of pe-ripheral blood was collected from each individual. All samples were processed within the first 5 hours. Adding phosphate-buffered saline (PBS; GIBCO Invitrogen); samples were diluted with a ratio of 1:2 at pH 7.2. Subsequently, peripheral blood mononuclear cells were ex-tracted using Ficoll (Lymphodex, Inno-Train) density gradient centrifu-gation. PBS was used to wash mononuclear cells, and then they were incubated with magnetic beads. Monocytes were isolated based on being positive for CD14, using magnetic-activated cell sorter (MACS) columns and MACS CD14 microbeads (Miltenyi Biotec). Isolated cells were stained by phycoerythrin (PE)-conjugated anti-CD14 antibody (BD Bioscience). Flow cytometry analysis revealed that isolated cells have 92%-95% purity.18 Using 24-well plates, monocytes were cul-tured at 500 000 cells per well for 7 days in complete Roswell Park Memorial Institute media containing 2 mmol/L L-glutamine (Biosera), 100 U/mL penicillin, 10% fetal bovine serum (Gibco BRL), 50 ng/mL recombinant human macrophage colony stimulating factor (M-CSF; eBioscience) and 100 μg/mL streptomycin (Sigma).
2.3 | Flow cytometry analysis of macrophage surface markers
After 7 days of stimulation with M-CSF, monocyte-derived mac-rophages (2 × 10⁵) were stained with fluorochrome-labeled anti-bodies. Subsequently, cells were incubated for 30 minutes with PE-conjugated anti-human CD206, fluorescein isothiocyanate (FITC)-conjugated anti-human CD163 (both from BD Bioscience) and suitable isotype-matched antibodies, avoiding light exposure. Macrophages were analyzed using a CyFlow ML flow cytometer (Partec, GmbH) and the data were analyzed by FlowJo software (Tree Star). Cells were 97% and 95% positive for CD163 and CD206 macrophage markers, respectively.18
2.4 | Analysis of gene expression using real-time quantitative polymerase chain reaction (PCR)
The High Pure RNA Isolation Kit (Roche) was used to extract total RNA from macrophages after 7 days of stimulation with M-CSF.

352 | AKHTARI eT Al.
Complementary DNA (cDNA) synthesis from the equivalent quantity of the total RNA was done using the Transcriptor First Strand synthesis kit (Roche). StepOnePlus™ Real-Time PCR sys-tem (Applied Biosystems) and SYBR green master mix (Ampliqon) were used to analyze the relative expression level of P2RX1, P2RX2, P2RX3, P2RX4, P2RX5, P2RX6, P2RX7, P2RY1, P2RY2, P2RY4, P2RY6, P2RY11, P2RY12, P2RY13, P2RY14 and PANX1 genes. Glyceraldehyde-3-phosphate dehydrogenase (GAPDH) gene was used as the en-dogenous control. The primer sequences are depicted in Table 1. Comparative CT method (2−ΔCT) was used to compare the relative expression of the mentioned genes between patients and healthy individuals.
2.5 | Statistical analysis
All statistical analyses were done using IBM SPSS Statistics for Windows, version 22 (IBM Corp.). Graphs were created using
GraphPad Prism 6 for Windows (GraphPad Software). Compliance of variables with normal distribution was tested with Shapiro-Wilk test and probability graphics. Pearson's Chi-square or Fisher's exact test was used to assess nominal variables across groups. Independent-sample t test (for variables with normal distribution) and Mann-Whitney U test (for variables without normal distribution) was used to assess differences between groups. A simple regression model was used to assess the correlation between gene expression and clinical indices. P values less than .05 were considered statisti-cally significant.
3 | RESULTS
3.1 | Demographic and clinical features
Demographic data of AS patients and healthy individuals are de-picted in Table 2.
Gene name Sequence Size (bp)
GAPDH F: 5′-GAGTCAACGGATTTGGTCGT-3′R: 5′-GACAAGCTTCCCGTTCTCAG-3′
185
P2RY1 F: 5′-AATGCGATCTGTATCAGCGTG-3′R: 5′-TGGTGTCGTAACAGGTGATGG-3′
118
P2RY2 F: 5′-CCGCTTCAACGAGGACTTCAA-3′R: 5′-GCGGGCGTAGTAATAGACCA-3′
211
P2RY4 F: 5′-GGAGCTGGACTGTTGGTTTGA-3′R: 5′-CATAGGGTTGGGGCGTTAAGG-3′
105
P2RY6 F: 5′-GTGTCTACCGCGAGAACTTCA-3′R: 5′-CCAGAGCAAGGTTTAGGGTGTA-3′
159
P2RY11 F: 5′-AGCTCCTATGTGCCCTACCA-3′R: 5′-GCGGCCATGTAGAGTAGAGG-3′
197
P2RY12 F: 5′-GTCATCTGGGCATTCATGTTCT-3′R: 5′-ACCTACACCCCTCGTTCTTAC-3′
243
P2RY13 F: 5′-ATCGTGCTGTTAGGGCTCATA-3′R: 5′-CAAGATCGTATTTGGCAGGGAG-3′
153
P2RY14 F: 5′-TCTCACCAACCAGAGTGTTAGG-3′R: 5′-GCGGCTAGATTTCTTTTTGACCG-3′
226
P2RX1 F: 5′-ATGGTGCTGGTGCGTAATAAG-3′R: 5′-GGAAGACGTAGTCAGCCACA 3′
217
P2RX2 F: 5′-AGCTGGGCTTTATCGTGGAGA-3′R: 5′-TTGGGGTTGCACTCCGATG-3′
127
P2RX3 F: 5′-TTCTTGCACGAGAAGGCTTAC-3′R: 5′-CCATGACTCTGTTGGCGTAGA-3′
100
P2RX4 F: 5′-TGGCGGATTATGTGATACCAGC-3′R: 5′-GTCGCATCTGGAATCTCGGG-3′
112
P2RX5 F: 5′-CTGTCGCTGTTCGACTACAAG-3′R: 5′-CCCATACGACCAGGTACGC-3′
112
P2RX6 F: 5′-TCAACTTCTCTAAGTCCAATGCC-3′R: 5′-CAGTAGGGGCTGAATTGTGGT-3′
88
P2RX7 F: 5′-TATGAGACGAACAAAGTCACTCG-3′R: 5′-GCAAAGCAAACGTAGGAAAAGAT-3′
95
PANX1 F: 5′-CCACGGAGTACGTGTTCTCG-3′R: 5′-CCGCCCAGCAATATGAATCC-3′
240
TA B L E 1 Primer sequences and product size of the selected genes

| 353AKHTARI eT Al.
3.2 | mRNA expression of P2Y genes in monocyte-derived macrophages
Our results indicated that the expression ratio of P2RY1:P2RY2:P2RY4:P2RY6:P2RY11:P2RY12:P2RY13:P2RY14 genes in healthy mac-rophages, was approximately 1.8:1:0.05:3.5:0.9:0.03:5.6:0.03, where P2RY12 and P2RY14 had the lowest and P2RY13 had the highest expression levels (Figure 1). When we analyzed the ex-pression of P2Y genes between macrophages from AS patients and healthy controls, P2RY1 mRNA expression was significantly down-regulated (−1.75 fold with a P value of <.01) and P2RY14 was up-regulated (2.6 fold with a P value of <.05) in macrophages of AS patients compared to healthy individuals (Figure 2). There was no significant difference in gene expression of other P2Y genes between patients and controls.
Moreover, the association of the clinical characteristic features of AS patients including erythrocyte sedimentation rate (ESR), BASDAI, bath ankylosing spondylitis metrology index (BASMI), bath ankylosing spondylitis functional index (BASFI), bath ankylosing spondylitis global score (BAS-G) and patient's disease global assess-ment (PDGA) indices with purinergic receptor mRNA expressions was also investigated. Among all mentioned indices only BASMI index was positively correlated with P2RY1 relative mRNA expres-sion in AS macrophages (Figure 3).
3.3 | mRNA expression of P2X and PANX1 genes in monocyte-derived macrophages
To investigate the role of P2X receptor family in AS macrophages, we have assessed the relative mRNA expression of P2RX1, P2RX2, P2RX3, P2RX4, P2RX5, P2RX6 and P2RX7 genes in monocyte-de-rived macrophages of AS patients and healthy individuals using quantitative PCR. Our results indicated that P2RX3 and P2RX6 were not expressed in human macrophages. The expression ratio of P2RX1:P2RX2:P2RX4:P2RX5:P2RX7 in healthy macrophages, was approximately 1:0.0025:20.9:0.035:11.7, where P2RX2 had the lowest and P2RX4 had the highest expression levels (Figure 4). Moreover, there was no significant difference in P2X receptor mRNA expression levels between macrophages of AS patients and healthy individuals. Finally, considering the role of Panx1 semi-canal on the withdrawal of ATP from immune cells and its effect on P2X receptor pathway activity, the expression of PANX1 gene was also studied in monocyte-generated macrophages of patients and healthy subjects. The results showed that the expression of this gene did not have any significant difference between the monocyte-derived macrophages of the patient group and healthy individuals (Figure 5).
4 | DISCUSSION
In this study, to investigate the role of P2 receptors in AS patho-genesis, we have explored the gene expression of this family in
TA B L E 2 Clinical features of patients and controls
Characteristic AS patients (n = 23)Healthy controls (n = 23)
Male/female 19 (82%)/4 (18%) 19 (82%)/4 (18%)
Age, y 32 ± 10 35 ± 11
ESR, mm/h 35 ± 27 NA
HLA-B27 positivity, no. (%)
17 (74%) NA
Disease duration, y 9 ± 8 NA
BASMI score 3.5 ± 1.7 NA
BASFI score 5.2 ± 1.5 NA
BASDAI score 5.7 ± 2.0 NA
BAS-G score 7.3 ± 1.6 NA
PDGA score 6.8 ± 2.6 NA
Biological agents 0 (0%) NA
Abbreviations: AS, ankylosing spondylitis; BASDAI, bath ankylosing spondylitis disease activity index; BASFI, bath ankylosing spondylitis functional index; BAS-G, bath ankylosing spondylitis global score; BASMI, bath ankylosing spondylitis metrology index; ESR, erythrocyte sedimentation rate; HLA-B27, human leukocyte antigen (subtypes B*2701-2759); NA, not applicable; PDGA, patient's disease global assessment.
F I G U R E 1 P2RY family relative messenger RNA (mRNA) expression in monocyte-derived macrophages. The receptor mRNA was determined by real-time polymerase chain reaction and normalized to glyceraldehyde-3-phosphate dehydrogenase (GAPDH). The data are presented as the mean ± SD

354 | AKHTARI eT Al.
monocyte-derived macrophages of AS patients and healthy indi-viduals. To the best of our knowledge, this is the first study in-vestigating the role of P2 receptors in the pathogenesis of AS. According to our results, P2RY13 and P2RY6 genes had the high-est expression levels in monocyte-derived macrophages from the control group, and the P2RY12 and P2RY14 genes had the lowest expression levels in these cells. Our results are approximately in agreement with previous studies. In a study investigating the
expression of these receptors in dendritic cells (DC), it was found that P2Y6 and P2Y12 had the highest expression levels, respec-tively.19 In another study by Myrtek et al the expression level of P2 receptors has been analyzed by reverse-transcription PCR on pulmonary macrophages. It was indicated that these macrophages express P2RY1, P2RY2, P2RY4, P2RY6, P2RY11, P2RY13, and P2RY14 genes, but not P2RY12.15 Eventually, the variances could be the re-sult of using different methods and the different role and function of the mentioned cells in various contexts.
We have also compared the expression of P2RY genes in mac-rophages of AS patients with control subjects. It was observed that a patient's macrophages expressed a lower level of P2RY1 and a higher level of P2RY14 genes comparing to healthy individuals. The P2Y1 receptor acts on calcium channels and increases intra-cellular calcium in macrophages.20,21 Previous studies on mouse leukocytes have shown that P2Y1 receptor plays an important role in triggering the inflammation process and also secretion of TNF-α by these cells.22,23 It is also involved in osteoblastogenesis and the differentiation of osteoblasts.24 Regarding the effect of P2Y1 receptor on the function of osteoblasts, as well as the role of this receptor in the process of inflammation, it is proposed that the expression of P2RY1 gene is probably down-regulated in AS patients’ macrophages to act as a negative feedback mechanism in order to suppress the harmful inflammation. As it was shown in our subsequent analyses, increased expression of this receptor gene is associated with an increase in the BASMI index in patients, indicating that the higher levels of the P2Y1 receptor is correlated with the limitation in joint movements.
The P2Y14 receptor is expressed primarily in neutrophils and can be activated by uridine diphosphate (UDP) and its metabo-lites.25,26 Although its function is not fully understood yet, studies have shown that P2Y14 receptor activity in B cells is responsible
F I G U R E 2 P2RY1 and P2RY14 messenger RNA (mRNA) expression in healthy individuals and ankylosing spondylitis (AS) patients. A, P2RY1 mRNA expression in monocyte-derived macrophages from AS patients was significantly decreased by −1.75-fold as compared to healthy controls. B, P2RY14 mRNA expression in monocyte-derived macrophages from AS patients was significantly increased by 2.6-fold as compared to healthy controls. The data are presented as the mean ± SD
F I G U R E 3 Correlation between bath ankylosing spondylitis metrology index (BASMI) score and P2RY1 relative messenger RNA (mRNA) expression. Simple linear regression analysis between BASMI score and the P2RY1 relative mRNA expression in monocyte-derived macrophages from 21 ankylosing spondylitis (AS) patients

| 355AKHTARI eT Al.
for the secretion of the IL-8 pro-inflammatory cytokine.27 It also has a role in mature dendritic cells28 and appears to be effective in regulating immune responses. In the meta-analysis study on spon-dyloarthritis (SpA)/AS patients, P2RY13 and P2RY14 genes were found to have a higher expression level in patients’ whole blood compared to control subjects.29 Regarding the results of our study, the P2Y14 receptor might be involved in macrophage inflammatory responses in AS.
In this study, the expression of P2RX genes in monocyte-derived macrophages was investigated as well. Our results indicated that the P2RX4 gene has the highest expression in monocyte-generated mac-rophages from healthy individuals, followed by P2RX7 and P2RX1 genes. Moreover, P2RX2 and P2RX5 genes had the least expression, and P2RX3 and P2RX6 genes did not express in macrophages. These results are in line with the results of previous studies. In a study by Gicquel and colleagues on human macrophages, the P2RX4 gene had the highest expression, followed by P2RX7, P2RX1 and P2RX5 genes. Furthermore, their results showed that the expression of P2RX2, P2RX3 and P2RX6 genes were undetectable.30 In a study by Myrtek et al, pulmonary macrophages expressed P2RX7, P2RX1, P2RX4 and P2RX5 genes and did not express P2RX2 and P2RX3 genes.15 Another study on human monocytes showed that P2RX4 gene expression was the high-est among the P2RX family, followed by P2RX7 and P2RX1 genes.31
Due to the role and function of P2X receptors (especially P2X7) in macrophages,11 it was expected to observe different mRNA levels of these genes in macrophages of AS patients and healthy individuals. However, our result indicated there was no significant difference in the expression of these genes between AS patients and control groups. A meta-analysis investigating the results of 4 microarray studies on SpA/AS showed that the expression of P2RX1 and P2RX7 genes were in-creased in the whole blood sample of patients compared to healthy in-dividuals.29 There is not enough evidence considering the role of these genes in AS patients and further studies would be of great value.
Moreover, there are controversies regarding the role of P2X receptors in other rheumatic disorders as well. Cervantes and col-leagues studied the expression and function of the P2RX7 gene in monocytes and B lymphocytes of rheumatoid arthritis (RA) and systemic lupus erythematosus (SLE) patients.32 They have indicated
that there was no significant difference in the expression of the P2X7 receptor in lymphocytes and monocytes of SLE patients. However, monocytes of patients with RA expressed a lower level of P2X7 re-ceptor and lymphocytes of these patients showed a higher expres-sion level of this receptor.32 Nevertheless, another study by Chen et al revealed that lymphocytes of SLE patients express a greater level of P2X7 receptor.33
In addition to the investigation of purine receptors gene expres-sions, the mRNA expression of the Panx1 that is associated with ATP removal from the cell was explored as well. Studies have shown that the function of this channel is necessary for the P2X7 receptor activity.34 Most studies on this channel have been performed in neural cells and so far, the association of this channel with diseases such as Alzheimer's, diabetes and Crohn's has been investigated.35 Studies have shown that
F I G U R E 4 P2RX family relative messenger RNA (mRNA) expression in monocyte-derived macrophages. The receptor mRNA was determined by real-time polymerase chain reaction and normalized to glyceraldehyde-3-phosphate dehydrogenase (GAPDH). The data are presented as the mean ± SD
F I G U R E 5 PANX1 messenger RNA (mRNA) expression in healthy individuals and ankylosing spondylitis (AS) patients. The mRNA expression of PANX1 did not have any significant difference between the monocyte-derived macrophages of the patient group and healthy individuals. The data are presented as the mean ± SD

356 | AKHTARI eT Al.
inhibition of this channel in microglia cells in mouse models can reduce neuronal pain in arteritis.36 In another study by Diezmos et al, the ex-pression rate of this channel was reduced in the tissues of patients with inflammatory bowel disease.37 However, the results obtained in this study demonstrate that the expression of PANX1 gene was not signifi-cantly different between patients and healthy individuals.
To the best of our knowledge, this is the first study regarding the role of P2X and P2Y receptors in AS. Alongside with the mRNA expression level of P2 receptor genes, the current research also has shown that altered expression of the P2RY1 gene in macrophages of AS patients is associated with clinical features of the disease. Therefore, investigating the role of purinergic signaling molecules would be valuable and shed light on AS pathogenesis.
ACKNOWLEDG EMENTThis study was supported by a grant from Deputy of Research, Tehran University of Medical Sciences (Grant No. 94-02-41-28991).
CONFLIC T OF INTERE S TThe authors declare that they have no conflict of interest.
ORCIDMahdi Mahmoudi https://orcid.org/0000-0002-8164-8831
R E FE R E N C E S 1. Braun J, Sieper J. Ankylosing spondylitis. Lancet.
2007;369(9570):1379-1390. 2. Reveille JD. The genetic basis of ankylosing spondylitis. Curr Opin
Rheumatol. 2006;18(4):332-341. 3. Kenna TJ, Brown MA. Immunopathogenesis of ankylosing spondyli-
tis. Int J Clin Rheumatol. 2013;8(2):265. 4. Vanaki N, Aslani S, Jamshidi A, Mahmoudi M. Role of innate im-
mune system in the pathogenesis of ankylosing spondylitis. Biomed Pharmacother. 2018;105:130-143.
5. Martinez FO, Gordon S. The M1 and M2 paradigm of macrophage activation: time for reassessment. F1000Prime Rep. 2014;6:13.
6. Zhao J, Yuan W, Tao C, Sun P, Yang Z, Xu W. M2 polarization of monocytes in ankylosing spondylitis and relationship with inflam-mation and structural damage. APMIS. 2017;125(12):1070-1075.
7. Baeten D, Demetter P, Cuvelier CA, et al. Macrophages expressing the scavenger receptor CD163: a link between immune alterations of the gut and synovial inflammation in spondyloarthropathy. J Pathol. 2002;196(3):343-350.
8. Bollow M, Fischer T, Reisshauer H, et al. Quantitative analyses of sacroiliac biopsies in spondyloarthropathies: T cells and mac-rophages predominate in early and active sacroiliitis- cellularity correlates with the degree of enhancement detected by magnetic resonance imaging. Ann Rheum Dis. 2000;59(2):135-140.
9. Di Virgilio F, Chiozzi P, Ferrari D, et al. Nucleotide receptors: an emerging family of regulatory molecules in blood cells. Blood. 2001;97(3):587-600.
10. Iglesias R, Locovei S, Roque A, et al. P2X7 receptor-Pannexin1 complex: pharmacology and signaling. Am J Physiol Cell Physiol. 2008;295(3):C752-C760.
11. Ferrari D, Pizzirani C, Adinolfi E, et al. The P2X7 receptor: a key player in IL-1 processing and release. J Immunol. 2006;176(7):3877-3883.
12. Murray PJ, Wynn TA. Protective and pathogenic functions of mac-rophage subsets. Nat Rev Immunol. 2011;11(11):723-737.
13. Falzoni S, Munerati M, Ferrari D, Spisani S, Moretti S, Di Virgilio F. The purinergic P2Z receptor of human macrophage cells. Characterization and possible physiological role. J Clin Investig. 1995;95(3):1207-1216.
14. Hickman SE, el Khoury J, Greenberg S, Schieren I, Silverstein SC. P2Z adenosine triphosphate receptor activity in cultured human monocyte-derived macrophages. Blood. 1994;84(8):2452-2456.
15. Myrtek D, Muller T, Geyer V, et al. Activation of human alveolar macrophages via P2 receptors: coupling to intracellular Ca2+ in-creases and cytokine secretion. J Immunol. 2008;181(3):2181-2188.
16. Tonetti M, Sturla L, Giovine M, Benatti U, De Flora A. Extracellular ATP enhances mRNA levels of nitric oxide synthase and TNF-alpha in lipopolysaccharide-treated RAW 264.7 murine macrophages. Biochem Biophys Res Commun. 1995;214(1):125-130.
17. van der Linden S, Valkenburg HA, Cats A. Evaluation of diagnostic criteria for ankylosing spondylitis. A proposal for modification of the New York criteria. Arthritis Rheum. 1984;27(4):361-368.
18. Akhtari M, Zargar SJ, Mahmoudi M, Vojdanian M, Rezaeimanesh A, Jamshidi A. Ankylosing spondylitis monocyte-derived macro-phages express increased level of A2A adenosine receptor and decreased level of ectonucleoside triphosphate diphosphohydro-lase-1 (CD39), A1 and A2B adenosine receptors. Clin Rheumatol. 2018;37(6):1589-1595.
19. Shin A, Toy T, Rothenfusser S, et al. P2Y receptor signaling regulates phenotype and IFN-alpha secretion of human plasmacytoid den-dritic cells. Blood. 2008;111(6):3062-3069.
20. Abbracchio MP, Burnstock G, Boeynaems J-M, et al. International Union of Pharmacology LVIII: update on the P2Y G protein-coupled nucleotide receptors: from molecular mechanisms and pathophysi-ology to therapy. Pharmacol Rev. 2006;58(3):281-341.
21. Bowler JW, Bailey RJ, North RA, Surprenant A. P2X4, P2Y1 and P2Y2 receptors on rat alveolar macrophages. Br J Pharmacol. 2003;140(3):567-575.
22. Cardoso TC, Pompeu TE, Silva CLM. The P2Y1 receptor-mediated leukocyte adhesion to endothelial cells is inhibited by melatonin. Purinergic Signal. 2017;13(3):331-338.
23. Amison RT, Momi S, Morris A, et al. RhoA signaling through platelet P2Y(1) receptor controls leukocyte recruitment in allergic mice. J Allergy Clin Immunol. 2015;135(2):528-538.
24. Alvarenga EC, Rodrigues R, Caricati-Neto A, Silva-Filho FC, Paredes-Gamero EJ, Ferreira AT. Low-intensity pulsed ultra-sound-dependent osteoblast proliferation occurs by via acti-vation of the P2Y receptor: role of the P2Y1 receptor. Bone. 2010;46(2):355-362.
25. Scrivens M, Dickenson JM. Functional expression of the P2Y14 receptor in human neutrophils. Eur J Pharmacol. 2006;543(1–3):166-173.
26. Jacobson KA, Balasubramanian R, Deflorian F, Gao ZG. G pro-tein-coupled adenosine (P1) and P2Y receptors: ligand design and receptor interactions. Purinergic Signal. 2012;8(3):419-436.
27. Müller T, Bayer H, Myrtek D, et al. The P2Y14 receptor of airway epithelial cells: coupling to intracellular Ca2+ and IL-8 secretion. Am J Respir Cell Mol Biol. 2005;33(6):601-609.
28. Skelton L, Cooper M, Murphy M, Platt A. Human immature mono-cyte-derived dendritic cells express the G protein-coupled recep-tor GPR105 (KIAA0001, P2Y14) and increase intracellular calcium in response to its agonist, uridine diphosphoglucose. J Immunol. 2003;171(4):1941-1949.
29. Park R, Kim T-H, Ji JD. Gene expression profile in patients with axial spondyloarthritis: meta-analysis of publicly accessible microarray datasets. J Rheum Dis. 2016;23(6):363-372.
30. Gicquel T, Robert S, Loyer P, et al. IL-1beta production is dependent on the activation of purinergic receptors and NLRP3 pathway in human macrophages. FASEB J. 2015;29(10):4162-4173.

| 357AKHTARI eT Al.
31. Wang L, Jacobsen SE, Bengtsson A, Erlinge D. P2 receptor mRNA expression profiles in human lymphocytes, monocytes and CD34+ stem and progenitor cells. BMC Immunol. 2004;5:16.
32. Portales-Cervantes L, Niño-Moreno P, Doníz-Padilla L, et al. Expression and function of the P2X(7) purinergic receptor in pa-tients with systemic lupus erythematosus and rheumatoid arthritis. Hum Immunol. 2010;71(8):818-825.
33. Chen G-M, Feng C-C, Ye Q-L, et al. Association of P2X7R gene polymorphisms with systemic lupus erythematosus in a Chinese population. Mutagenesis. 2013;28(3):351-355.
34. Adamson SE, Leitinger N. The role of pannexin1 in the induction and resolution of inflammation. FEBS Lett. 2014;588(8):1416-1422.
35. Penuela S, Harland L, Simek J, Laird DW. Pannexin channels and their links to human disease. Biochem J. 2014;461(3):371-381.
36. Mousseau M, Burma NE, Lee KY, et al. Microglial pannexin-1 channel activation is a spinal determinant of joint. Pain. 2018;4(8):eaas9846.
37. Diezmos EF, Sandow SL, Markus I, et al. Expression and localization of pannexin-1 hemichannels in human colon in health and disease. Neurogastroenterol Motil. 2013;25(6):e395-e405.
How to cite this article: Akhtari M, Zargar SJ, Vojdanian M, et al. P2 receptors mRNA expression profiles in macrophages from ankylosing spondylitis patients and healthy individuals. Int J Rheum Dis. 2020;23:350–357. https ://doi.org/10.1111/1756-185X.13783

358 | wileyonlinelibrary.com/journal/apl Int J Rheum Dis. 2020;23:358–366.© 2020 Asia Pacific League of Associations for Rheumatology and John Wiley & Sons Australia, Ltd
1 | INTRODUC TION
Axial spondyloarthropathy (axSpA) is a chronic inflammatory arthritis, predominantly affecting the sacroiliac joints and spine. The Assessment in SpondyloArthritis International Society (ASAS)-COMOSPA study demonstrated a high prevalence of comorbidity in patients with axSpA,1 noting osteoporosis as the most prevalent, affecting 13% of the surveyed population. Other investigators have similarly reported a
high prevalence of low bone mineral density (BMD), although figures vary widely, ranging from 4% to greater than 50%.2-5
Vertebral fracture prevalence is also increased in patients with axSpA,6-8 with mortality and potential for devastating neurological outcomes higher than the general population.9,10 The reason for the excess vertebral fracture risk is unclear, with the relationship be-tween osteoporosis and vertebral fractures not as clearly defined as in the general population.11-14 The risk factors for low BMD are
Received: 4 September 2019 | Revised: 15 November 2019 | Accepted: 16 November 2019
DOI: 10.1111/1756-185X.13765
O R I G I N A L A R T I C L E
Measuring bone density in axial spondyloarthropathy: Time to turn things on their side?
Gillian Fitzgerald1,2 | Tochukwu Anachebe2 | Kevin McCarroll3 | Finbar O’Shea1,2
1School of Medicine, Trinity College Dublin, The University of Dublin, Dublin, Ireland2Department of Rheumatology, St. James’s Hospital, Dublin, Ireland3Department of Medicine for the Elderly, St. James’s Hospital, Dublin, Ireland
CorrespondenceGillian Fitzgerald, Department of Rheumatology, St. James’s Hospital, Dublin 8, Ireland.Email: [email protected]
Funding informationAbbVie
AbstractAim: Osteoporosis in axial spondyloarthropathy (axSpA) is difficult to accurately di-agnose due to osteoproliferation of the spine interfering with conventional (anter-oposterior, AP) dual-energy X-ray absorptiometry (DXA). This study compares AP and lateral projections of DXA when assessing bone mineral density (BMD) of the spine and investigates the impact of osteoproliferation on AP DXA.Method: In this cross-sectional study, structured standardized assessments collected demographic, clinical, laboratory and radiographic data. DXA assessed BMD of the spine using PA and lateral projections. Hip BMD was assessed in the usual man-ner. World Health Organization (WHO) criteria assessed prevalence of low BMD. Incorporating lateral DXA in the bone health assessment of axSpA was investigated. SPSS was used for statistical analysis.Results: A total of 100 patients had paired AP and lateral DXA studies: 78% were male, mean (SD) age 52 (12) years. BMD of the spine measured by AP projection was significantly higher than BMD measured by lateral projection (mean difference 0.34 g/cm2, 95% CI 0.30-0.37). More patients had low BMD with lateral compared to AP projection (47% vs 16%, P = .01). At the hip, 34% of patients had low BMD. Disease duration, body mass index and radiographic severity independently pre-dicted a difference between AP and lateral measurements of the spine.Conclusion: Lateral DXA of the spine is unaffected by osteoproliferation of the spine in axSpA and detects significantly more cases of low BMD than conventional AP DXA. Lateral DXA should be included in BMD assessment of patients with axSpA.
K E Y W O R D S
ankylosing spondylitis, bone mineral density, dual-energy X-ray absorptiometry, osteoporosis, spondyloarthropathy

| 359FITZGERALD ET AL.
also less studied in the axSpA population,5 and there are limited data available to recommend treatment strategies to maintain or improve BMD,15,16 in contrast to strategies that are well delineated in the general population.17
Much of the difficulty with estimating BMD of the spine in axSpA is related to the inherent pathophysiology of axSpA, a process which remains incompletely understood.18 It is thought that inflammation of the vertebrae over time can result in erosion and osteoprolifera-tion at the attachment sites of spinal ligaments into the vertebrae, termed syndesmophytes, with complete ankylosis as its most ex-treme form.19,20 Conventional dual-energy X-ray absorptiometry (DXA) of the lumbar spine assesses BMD in an anteroposterior (AP) direction.21 In axSpA, conventional DXA is unable to distinguish between BMD of the vertebral body and osteoproliferation. BMD of the spine can thus be over-estimated when conventional DXA is used, producing an illusion of reassuringly normal BMD, when signif-icant bone loss may have occurred.22
A technique where assessment of the spine is unaffected by os-teoproliferation is needed to better understand the epidemiology, and ultimately consequences, of low BMD in axSpA patients. Lateral DXA scanning examines the vertebral body from the side, almost exclusively measuring trabecular bone and avoiding much of the osteoprolifera-tion that interferes with BMD assessment of the spine when using conventional DXA.23 Modern DXA scanners allow lateral scans of the lumbar spine to be performed in the supine position and have similar precision to AP scans.24 Lateral DXA of the spine in axSpA has been shown in a small number of studies to detect more cases of low BMD than conventional DXA.13,25,26 The International Society of Clinical Densitometry (ISCD) recommend that a diagnosis of osteoporosis is made if the T score of the lumbar spine, total hip or femoral neck is −2.5 or less, when compared to the reference standard of a White female aged 20-29 years from the National Health and Nutrition Examination Survey (NHANES) III database.21 Previous studies investigating the use of lateral DXA in axSpA have been limited by lack of reference data-bases for lateral lumbar spine BMD, prohibiting calculation of T scores. Therefore, the utility of incorporating lateral DXA in the bone health assessment of individuals with axSpA is unknown.
The aims of this study were to:
1. Compare lateral and conventional projections of DXA in their assessment of BMD of the lumbar spine in adults with axSpA
2. Determine variables that affect the accuracy of conventional DXA
3. Assess if incorporating lateral DXA in bone health assessment af-fects the prevalence of low BMD.
2 | METHODS
2.1 | Study design and setting
This was an observational, cross-sectional, twin-center study. Participants were consecutively recruited between April 2017 and
January 2018. The study was approved by the joint Tallaght University Hospital/St. James's Hospital Research Ethics Committee, in Dublin, Ireland. The ‘Strengthening the Reporting of Observational Studies in Epidemiology’ (STROBE) guidelines for observational studies were followed for the reporting of this study.27
2.2 | Population
Participants were consecutively recruited from dedicated spondy-litis and general rheumatology clinics in St. James's Hospital and Tallaght University Hospital, Dublin, Ireland. Additionally, patients were identified from the axSpA database and contacted over tel-ephone using a script to invite participation. Participants were eli-gible if they were adults (≥18 years of age) and fulfilled the ASAS criteria for axSpA.28 Patients were excluded if they were pregnant, actively trying to conceive, breast-feeding, under 18 or had a his-tory of cognitive impairment which precluded informed consent. All data collection was performed in St. James's Hospital, Dublin. Written informed consent was obtained from each participating subject.
2.3 | Demographic and disease-related data
Data collection included the following:
• demographics: gender, age, ethnicity, smoking status (never, past, current), employment status, alcohol consumption, employment status, post-menopausal status for women
• disease characteristics: symptom duration, age at diagnosis, ex-tra-articular manifestations (uveitis, inflammatory bowel disease, psoriasis), SpA features (enthesitis, dactylitis, peripheral arthritis), physician-diagnosed history of comorbidities, axSpA treatment history (biologics, conventional synthetic disease-modifying an-ti-rheumatic drugs [DMARDs], non-steroidal anti-inflammatory drugs [NSAIDs])
• osteoporosis history: prior physician-diagnosed osteoporosis (yes/no), prior DXA assessment (yes/no), treatment history (cal-cium and vitamin D supplements, definitive osteoporosis treat-ment), osteoporosis risk factors (history of parental hip fracture, early menopause, history of steroid use for greater than 3 months, daily alcohol, type 1 diabetes mellitus, osteogenesis imperfecta, uncontrolled hyperthyroidism, hypogonadism, malabsorption, chronic liver disease, eating disorder, history of transplant, hyper-parathyroidism, end-stage kidney disease), fracture history (any lifetime fracture, fragility fracture)
• physical examination: tragus-to-wall, cervical rotation, modified Schober's test, lateral flexion, intermalleolar distance, chest ex-pansion – performed according to a standardized technique29; height was measured to the nearest 0.1 cm, weight in kg; body mass index (BMI), expressed in kg/m2, was defined as body weight divided by square of body height

360 | FITZGERALD ET AL.
• laboratory measurements: routine bloods (full blood count, renal profile, bone profile, liver profile, erythrocyte sedimentation rate [ESR], C-reactive protein [CRP], parathyroid hormone [PTH], vi-tamin D) were collected on the same day of assessment and an-alyzed using standard laboratory techniques. Human leucocyte antigen (HLA) B-27 antigen was reported as positive or negative. Bone turnover markers and testosterone (males only) were col-lected for a separate analysis.
2.4 | Outcome measures
The following validated patient-reported outcome measures were collected:
• Bath AS Disease Activity Index (BASDAI)30
• Bath AS Functional Index (BASFI)31
• AS Quality of Life (ASQoL)32
• Bath AS Patient Global score (BAS-G)33
• Health Assessment Questionnaire (HAQ).34
Ankylosing Spondylitis Disease Activity Score (ASDAS)-CRP and -ESR were calculated.35 Bath AS Metrology Index (BASMI) was calcu-lated using the measurements taken by a trained investigator during the physical assessment.29 The modified Stoke Ankylosing Spondylitis Spine Score (mSASSS) was calculated using lateral lumbar and cervical spine X-rays, assessing radiographic damage from a scale of 0-72.36 Antero-posterior pelvic X-rays were performed to grade sacroiliitis ac-cording to the modified New York criteria.37
2.5 | BMD
BMD was assessed using a Hologic Horizon A DXA scanner. All BMD assessments were performed by one radiographer in St. James's Hospital, on the same machine. A standard protocol to obtain the measurements was strictly adhered to. Quality control and calibra-tion were performed in accordance with international recommenda-tions.21 Lumbar spine BMD was measured in AP (L1-4) and lateral (L2-4) projections. BMD at the total hip and femoral neck were measured. Participants remained in the same position for AP and lateral scans: supine on the table, knees supported to adopt a flexed 90° position and arms above the head. Following analysis of the AP images, the C-arm was rotated through 90° to obtain the lateral view of the spine. Participants remained supine for the hip measurements. BMD was expressed as g/cm2. The NHANES III data was used as reference for hip T scores. The manufacturer's database was used as the reference standard for the lumbar spine, in line with ISCD po-sitions.38 Separate reference databases were available for both AP and lateral lumbar spine. Z scores were not available for lateral spine DXA for male patients.
Osteoporosis was defined according to the World Health Organization (WHO) for post-menopausal women and men over the
age of 50 years as normal if T score ≥−1, osteopenia if between −1 and −2.5 and osteoporosis if ≤−2.5.39 For pre-menopausal women and men under the age of 50 years, a Z score of <−2 was considered to represent low BMD. When calculating prevalence of osteoporosis and osteopenia, only post-menopausal women and men over the age of 50 were included, in accordance with the ISCD positions.21
2.6 | Bias
Selection bias was minimized by using clinic and database recruitment, to ensure a representative study sample. Potential participants were phoned on two separate occasions at different times/d to minimize non-response bias. Volunteer bias was minimized by keeping the data collection time short and offering flexible appointment times.
2.7 | Statistical methods
Descriptive statistics are presented as frequencies with percentages for categorical variables, and mean with standard deviation (SD) or median with 25th and 75th percentiles as appropriate for continu-ous variables. Differences between AP and lateral BMD of the spine were assessed using a 2-tailed paired T-test. Relationships between continuous variables were assessed using Pearson's correlation co-efficients (r) or Spearman's correlation coefficients (rho) as appropri-ate. Independent 2-tailed T-tests were used to explore differences in continuous data between two groups and analysis of variance (ANOVA) for three or more groups. Mann-Whitney U (two groups) or Kruskall-Wallis (three or more groups) tests were used to compare continuous non-parametric variables. Chi-square tests were used to compare categorical variables.
The difference between AP and lateral BMD was calculated using the formula “AP minus lateral BMD” and expressed as a new variable in g/cm2. We developed a model to investigate the associa-tion between independent variables and the difference between AP and lateral BMD (dependent variable). Univariable analysis was per-formed to identify variables associated with the dependent variable and tested in simple linear regression. All variables with a P value of <.1 in crude analysis were entered into the regression model, along with clinically relevant variables. Normality of residuals and multicol-linearity were assessed. IBM SPSS version 24 was used for statistical analysis. A P value of <.05 was considered statistically significant.
3 | RESULTS
3.1 | Baseline characteristics
A total of 110 individuals were recruited between May 2017 and January 2018 (see Figure 1 for flow chart). Ten participants were unable to have DXA imaging of the spine, thus 100 participants with paired AP and lateral DXA of the lumbar spine were included.

| 361FITZGERALD ET AL.
Participant baseline characteristics are outlined in Table 1. Briefly, 78% (n = 78) were male, 98% (n = 98) Caucasian, mean (SD) age was 51.6 (11.6) years and median (25th, 75th) disease duration was 23.6 (14.4, 34.9) years, with a median delay to diagnosis of 7 (2, 13.5) years. The median (25th, 75th) mSASSS was 10 (interquartile range 4-37.3). Eight percent (n = 8) of participants had no osteoprolifera-tion on imaging (mSASSS = 0) and 8% (n = 8) had a “bamboo spine” (mSASSS = 72).
Forty percent (n = 40) of the cohort had previously had a DXA assessment of their BMD. Seven percent (n = 7) of participants re-ported a prior diagnosis of osteoporosis. Although 44% (n = 44) of participants reported a history of any fracture in their lifetime, fragil-ity fracture prevalence was low in the cohort (3%, n = 3). One-third of the cohort (n = 33, 33%) had at least 1 risk factor for osteoporosis: exposure to steroids for greater than 3 months was the most com-mon risk factor (n = 14), followed by a history of parental hip fracture (n = 8). Five patients had a history of current or past definitive oste-oporosis treatment.
3.2 | Measured BMD of spine (AP and lateral projections of DXA) and hip
Mean BMD of spine and hip are outlined in Table 1. All measured sites of BMD correlated positively with each other. BMD of the spine measured by AP (conventional) projection correlated posi-tively with age, mSASSS and BASMI, indicating that AP BMD of the spine increased in older patients and patients with higher mSASSS and BASMI scores (Table 2). In contrast, BMD of the spine meas-ured by lateral projection showed no correlation with mSASSS or BASMI, and a non-significant inverse correlation with age; similar patterns were found at the hip. Men had higher BMD than women at the spine (both projections) and the hip; smoking status, exposure to
biologic treatment, HLA-B27 positivity or presence of osteoporosis risk factors had no impact on BMD (Table S1).
3.3 | Comparison of lumbar spine BMD using AP and lateral DXA
BMD of the lumbar spine measured by AP projection was signifi-cantly higher than when BMD is measured by lateral projection (mean difference 0.34 g/cm2, 95% CI 0.30-0.37), as demonstrated in Figure 2. The difference between AP and lateral measurements of lumbar spine BMD (AP minus lateral BMD) correlated with age, mSASSS, BASMI, BMI and BASFI (see Table 2). This indicated that the older the patient or the more severe the disease, the bigger the difference between the AP (conventional) and the lateral BMD measurement. The difference between AP and lateral BMD of the spine was similar in men and women (mean difference between gen-ders was 0.04 g/cm2, 95% CI −0.04 to 0.12). Additionally, there was no correlation between AP and lateral BMD difference and inflam-matory markers or vitamin D (P > .05).
3.4 | Assessment of variables associated with difference between AP and lateral BMD
We developed a model to investigate variables associated with the difference between AP and lateral BMD, as outlined in the meth-ods section. We additionally controlled for gender and exposure to treatment with biologics, as clinically relevant variables. After correcting for multicollinearity, the R2 of the final model was 0.4 (Table 3). Disease duration, BMI and mSASSS remained indepen-dently associated with the difference between AP and lateral BMD of the spine.
F I G U R E 1 Summary of recruitment process of participants. AP, anteroposterior; DXA, dual-energy X-ray absorptiometry
Screened for eligibility (n = 124)
Excluded (n = 2) Unable to give informed consent (n = 1)
Planning pregnancy (n = 1)
Eligible participants (n = 122)
Underwent assessments (n = 110)
Declined to participate (n = 12)
Completed study (n = 100)
Paired lateral and AP DXA studies not available (n = 10)

362 | FITZGERALD ET AL.
3.5 | Prevalence of low BMD
Fifty-seven patients fulfilled criteria for classification of BMD using T scores (ie men ≥ 50 years and post-menopausal women). Of this cohort, 16% had low BMD of the spine when measured by AP DXA, compared to 47% when measured by lateral DXA (Chi-square 7.4, P = .01, odds ratio 12.2, 95% CI 1.4-106), as outlined in Figure 3. At the hip, 34% (n = 19) had low BMD at either femoral neck or total hip.
As per the WHO definition,37 hip and spine data were combined to assess for low BMD at any site. When AP spine BMD was com-bined with hip BMD, 35% (n = 20) of patients had low BMD at a minimum of one site. However, when lateral spine BMD was com-bined with hip BMD, 56% (n = 32) of patients had low BMD, a sta-tistically significant difference (Chi-square 18.9, degree of freedom 1, P < .001).
Including both AP and lateral spine in combination with hip data, 58% (n = 33) of the cohort had low BMD and 18% (n = 10) had oste-oporosis at a minimum of one site.
Z scores for lateral lumbar spine BMD are not available in men, therefore similar data cannot be presented for the remainder of the population.
4 | DISCUSSION
Osteoporosis is widely accepted to occur at an increased prevalence in axSpA compared to age- and sex-matched controls. However, ac-curately assessing BMD of the spine is challenging in axSpA patients due to the overestimation that occurs from calcification and osteo-proliferation.40 Therefore, the primary aim of this study was to com-pare AP and lateral DXA in their ability to measure BMD of the spine and assess the impact of osteoproliferation.
In this study of 100 axSpA patients, we demonstrated that when directly compared, raw BMD of the spine expressed in g/cm2 was sig-nificantly lower when measured by lateral projection of DXA than by conventional AP DXA, confirming findings by other researchers.25,41 We then explored the association of a number of participants and disease-related variables with AP and lateral DXA, in an attempt to explain the difference between the two methods. We demonstrated that AP BMD of the spine increased with age, in contrast to the ex-pected decline in BMD that occurs with age in the general popula-tion. AP BMD also increased as mSASSS and BASMI increased, both indicators of structural severity. These associations were not seen when BMD of the spine was measured by lateral DXA, or with hip BMD. Therefore, longer disease duration and more severe disease affected AP DXA assessment of the spine, but not lateral DXA.
We also demonstrated that the difference in BMD between AP and lateral DXA increased with longer disease duration and higher mSASSS. After controlling for BMI due to its effect on measurement of BMD from soft tissue interference,42,43 mSASSS and disease duration remained independent predictors of the difference between AP and lateral DXA of the spine. This important finding signifies that structural damage in the form of osteoproliferation is interfering with the accu-racy of what is currently our “gold standard” technique to assess BMD
TA B L E 1 Baseline demographic and clinical characteristics of the axSpA cohort
Variable
Whole population (N = 100)
Males; n (%) 78 (78)Age, y, mean (SD) 51.6 (11.6)Caucasian; n (%) 98 (98)Disease duration, y, mean (SD) 25.7 (12.9)Delay to diagnosis, y, mean (SD) 8.9 (8.6)Employment status; n (%)
Employed 54 (54)Disability due to axSpA 15 (15)
Smoking status; n (%)Current 25 (25)Past 47 (47)Never 28 (28)
Post-menopausal women,a n (%) 13 (59)HLA-B27 positive,b n (%) 83 (84.7)BMI, kg/m2, mean (SD) 28.1 (5.5)Modified New York criteria, n (%) 85 (85)Extra-articular manifestations, n (%)
Uveitis 29 (29)Psoriasis 16 (16)IBD 16 (16)
Treatment; n (%)NSAIDs 43 (43)Steroids use > 3 mo 14 (14)Biologic exposure 70 (70)Calcium supplement 17 (17)Vitamin D supplement 26 (26)
Disease severity; median (25th, 75th percentile)ASDAS-CRP 2.2 (1.6, 3.0)ASDAS-ESR 2.0 (1.3, 2.9)BASDAI 3.9 (2.1, 5.6)BASFI 4.0 (1.4, 5.7)BASMI 4.2 (2.8, 6)HAQ 0.63 (0.13,
1.00)ASQoL 6 (2, 11)mSASSS 10 (4, 37.3)
Self-reported fragility fracture, n (%) 3 (3)Osteoporosis risk factor, any, n (%) 33 (33)Bone mineral density, g/cm2, mean (SD)
PA lumbar spine 1.08 (0.19)Lateral lumbar spine 0.74 (0.14)Femoral neck 0.80 (0.11)Total hip 0.96 (0.12)
Abbreviations: ASQoL, Ankylosing Spondylitis Quality of Life; ASDAS, Ankylosing Spondylitis Disease Activity Score; BASDAI, Bath AS Disease Activity Index; BASFI, Bath AS Functional Index; BASMI, Bath AS Metrology Index; BMI, body mass index; CRP, C-reactive protein; ESR, erythrocyte sedimentation rate; HAQ, Health Assessment Questionnaire; HLA, human leucocyte antigen; IBD, inflammatory bowel disease; mSASSS, modified Stoke Ankylosing Spondylitis Spinal Score; NSAIDS, non-steroidal anti-inflammatory drugs; PA, postero-anterior; PTH, parathyroid hormone.aCalculated as % of women (n = 22) in study. bHLA-B27 status unknown in n = 2.

| 363FITZGERALD ET AL.
in axSpA patients.21 Therefore, continuing to rely solely on AP DXA to evaluate BMD of the spine in axSpA is no longer acceptable.
The clinical significance of BMD is not in the raw BMD ex-pressed in g/cm2, but in its WHO classification as normal or low BMD using T scores, as it is this which is clearly associated with
morbidity and mortality in the general population.44,45 Previously, the ability of lateral spine DXA to detect low BMD in axSpA was limited by lack of adequate reference databases in other studies to compute T scores for lateral lumbar spine.25,26 In our study, a manufacturer-compiled reference database for lateral lumbar spine BMD allowed us to compute specific T scores (but unfortunately not Z scores) for both men and women for lateral lumbar spine, to our knowledge the first study to do so in axSpA. Therefore, we compared the ability of lateral and AP DXA to measure BMD and found that lateral DXA detected significantly more cases of low BMD (47%) than did AP DXA (16%).
In practice, a diagnosis of low BMD is made if a patient fulfills WHO criteria for either osteopenia or osteoporosis of at least 1 site of spine or hip.39,46 In this study, using lateral DXA in place of AP DXA im-proved our diagnosis of low BMD significantly from 35% to 56%. Using both AP and lateral spine DXA results, along with hip data, increased the diagnosis of low BMD to 58%. Had we relied on hip data alone, as advocated by some clinicians,26 only 34% of patients would have received a diagnosis of low BMD. Thus, using lateral DXA in addition to AP DXA to assess BMD improves our ability to detect low BMD in axSpA. In the general population, lateral DXA has been shown to iden-tify more cases of low BMD than conventional DXA.23,47 However, to our knowledge, this is the first study in axSpA to show this.
It has been the subject of much debate as to whether osteoporosis in axSpA is localized to the spine or is a more systemic process.41,48-50 We demonstrated a higher prevalence of low BMD at the spine com-pared to the hip, suggesting the spine is affected to a more significant degree than are the hips. Therefore, it is important that we have a method to accurately assess BMD of the spine, which is not affected by the severity of disease. We note the interesting results of a recent study published26 which was the first to examine lateral measurements
TA B L E 2 Correlation between variables and (a) each measured BMD site (b) difference between AP and lateral BMD
(a)Lateral spine BMDa FN BMDa TH BMDa Agea BMIa mSASSSb BASMIa
AP spine BMD 0.55** 0.48** 0.52** 0.23* 0.43** 0.41** 0.48**
Lateral spine BMD … 0.43** 0.55** -0.12 0.21* 0.07 0.02
FN BMD … … 0.82** -0.19 0.18 0.00 0.02
TH BMD … … … -0.15 0.34** -0.03 -0.06
Age … … … … 0.13 0.55** 0.58
BMI … … … … … 0.28** 0.30**
mSASSS … … … … … … 0.77**
(b) Agea BASDAIa BASMIa mSASSSb BASFIa CRPa BMIa
AP – lateral BMD 0.38** 0.01 0.54** 0.51** 0.32** 0.03 0.32**
Note: … denotes duplicate cell, left blank for clarity of presentation.Abbreviations: AP, anteroposterior; BASDAI, Bath AS disease activity index; BASFI, Bath AS functional index; BASMI, Bath AS metrology index; BMD, bone mineral density; BMI, body mass index; CRP, C-reactive protein; ESR, erythrocyte sedimentation rate; FN, femoral neck; mSASSS, modified Stokes Ankylosing Spondylitis Score; TH, total hip.aCorrelation coefficient is Pearson's r. bCorrelation coefficient is Spearman correlation coefficient, rho. *P < .05. **P < .01.
F I G U R E 2 Scatter plot demonstrating difference between BMD of the spine as measured by AP and lateral DXA, stratified by gender. Dashed line represents reference for no difference between AP and lateral BMD. AP, anteroposterior; BMD, bone mineral density; DXA, dual-energy X-ray absorptiometry

364 | FITZGERALD ET AL.
of the spine longitudinally and unexpectedly found that both lateral and AP BMD increased over time. However, there were no reference values available for lateral BMD measurements in the men, so the au-thors urge caution with interpretation of this finding.
We would like to acknowledge some limitations. This is a cross-sectional study, which prohibits comment on causality – we can merely comment on associations. The population is almost ex-clusively Caucasian, thus caution must be applied when extrapolat-ing results to other ethnicities. Reference values to calculate Z scores for lateral spine BMD were unavailable, thus we cannot comment on prevalence of low BMD in men under 50 years and pre-menopausal women. As this sub-group represented a large portion of our cohort, the strength of our results would have increased had this been avail-able, therefore this represents a limitation. However, the differences between raw BMD values are valid in the entire population. Finally, the clinical significance of osteoporosis is in its associated fracture risk; however, the prevalence of fragility fractures was low in this study. This prevented any definitive conclusions regarding the asso-ciation between BMD and vertebral fractures. The clinical outcomes
of vertebral fractures in patients with axSpA are worse than other populations,9 so it is crucial to understand the role BMD plays in this increased susceptibility. Therefore, future research needs to deter-mine whether there is a correlation between BMD as measured by lateral DXA and vertebral fracture risk.
This study has many strengths. The patients are well-character-ized, with an extensive data set collected. It is a homogenous pop-ulation, allowing easy extrapolation of the results. All efforts were made to limit sources of bias, thus ensuring our population is repre-sentative of the axSpA population.
In summary, BMD of the lumbar was significantly lower when measured by lateral DXA than AP DXA. The difference between lateral and AP DXA increased with higher mSASSS. Including lat-eral DXA in the bone health assessment significantly increased the prevalence of low BMD in this population. Lateral DXA should be routinely added to the BMD assessment of individuals with axSpA.
ACKNOWLEDG EMENTSWe thank all the patients who so willingly participated in the study. We would like to also thank Professors David Kane and Ronan Mullan of Tallaght University Hospital for their enthusiastic contribution in providing patients for this study. Additionally, we would like to ex-press our deep gratitude to all the nursing and administrative staff of the Bone Clinic in St. James's Hospital; without their extensive assistance and guidance, this project would never have succeeded.
AUTHORS CONTRIBUTIONSGF was involved in the conception and design of the study, acquisi-tion of data, statistical analysis, interpretation of data and drafting of the manuscript. KMcC and FOS were involved in the conception and design of the study, statistical analysis, interpretation of data and criti-cally revising the manuscript. TA participated in design of the study and data acquisition, statistical analysis and drafting of the manuscript. All authors read and approved the final version of the manuscript.
TA B L E 3 Multiple regression model, variables associated with difference between AP and lateral BMD of the spine
Variable β 95% CI P value
Gendera −0.028 −0.093 to 0.037 .40
Disease duration 0.003 0.001 to 0.005 .01
Biologic exposureb 0.015 −0.043 to 0.072 .60
BMI 0.009 0.003 to 0.014 <.01
mSASSS 0.002 0.001 to 0.004 <.01
Abbreviations: AP, anteroposterior; BMI, body mass index; CI, confidence interval; mSASSS, modified Stokes Ankylosing Spondylitis Spinal Score.aReference group (0) is male. bReference group (0) is no biologic exposure.
F I G U R E 3 Prevalence of normal BMD, osteopenia and osteoporosis at each measured site, in men ≥ 50 years and post-menopausal women (n = 57). AP, anteroposterior; BMD, bone mineral density
83%
67%
53%
85%
18%
33%
30%
14%
0%
0%
28%
2%
0% 10% 20% 30% 40% 50% 60% 70% 80% 90% 100%
Total hip
Femoral neck
Lateral spine
PA spine
Osteoporosis
Osteopenia
Normal BMD

| 365FITZGERALD ET AL.
ORCIDGillian Fitzgerald https://orcid.org/0000-0001-5930-3928
R E FE R E N C E S 1. Moltó A, Etcheto A, van der Heijde D, et al. Prevalence of comorbid-
ities and evaluation of their screening in spondyloarthritis: results of the international cross-sectional ASAS-COMOSPA study. Ann Rheum Dis. 2016;75(6):1016-1023.
2. Akgol G, Kamanli A, Ozgocmen S. Evidence for inflammation-in-duced bone loss in non-radiographic axial spondyloarthritis. Rheumatology (Oxford). 2014;53(3):497-501.
3. Nigil Haroon N, Szabo E, Raboud JM, et al. Alterations of bone min-eral density, bone microarchitecture and strength in patients with ankylosing spondylitis: a cross-sectional study using high-resolu-tion peripheral quantitative computerized tomography and finite element analysis. Arthritis Res Ther. 2015;17:377.
4. Forien M, Molto A, Etcheto A, Dougados M, Roux C, Briot K. Bone mineral density in patients with symptoms suggestive of spondy-loarthritis. Osteoporos Int. 2015;26(5):1647-1653.
5. Ramirez J, Nieto-Gonzalez JC, Curbelo Rodriguez R, Castaneda S, Carmona L. Prevalence and risk factors for osteoporosis and frac-tures in axial spondyloarthritis: a systematic review and meta-anal-ysis. Semin Arthritis Rheum. 2018;48(1):44-52.
6. Vosse D, Landewé R, van der Heijde D, van der Linden S, van Staa T-P, Geusens P. Ankylosing spondylitis and the risk of fracture: re-sults from a large primary care-based nested case-control study. Ann Rheum Dis. 2009;68(12):1839-1842.
7. Robinson Y, Sanden B, Olerud C. Increased occurrence of spinal fractures related to ankylosing spondylitis: a prospective 22-year cohort study in 17,764 patients from a national registry in Sweden. Patient Saf Surg. 2013;7(1):2.
8. Montala N, Juanola X, Collantes E, et al. Prevalence of vertebral fractures by semiautomated morphometry in patients with anky-losing spondylitis. J Rheumatol. 2011;38(5):893-897.
9. Westerveld LA, Verlaan JJ, Oner FC. Spinal fractures in patients with ankylosing spinal disorders: a systematic review of the litera-ture on treatment, neurological status and complications. Eur Spine J. 2009;18(2):145-156.
10. Westerveld LA, van Bemmel JC, Dhert WJ, Oner FC, Verlaan JJ. Clinical outcome after traumatic spinal fractures in patients with ankylosing spinal disorders compared with control patients. Spine J. 2014;14(5):729-740.
11. Geusens P, De Winter L, Quaden D, et al. The prevalence of ver-tebral fractures in spondyloarthritis: relation to disease character-istics, bone mineral density, syndesmophytes and history of back pain and trauma. Arthritis Res Ther. 2015;17(1):294.
12. Klingberg E, Geijer M, Göthlin J, et al. Vertebral fractures in an-kylosing spondylitis are associated with lower bone mineral density in both central and peripheral skeleton. J Rheumatol. 2012;39(10):1987-1995.
13. Ulu MA, Cevik R, Dilek B. Comparison of PA spine, lateral spine, and femoral BMD measurements to determine bone loss in ankylosing spondylitis. Rheumatol Int. 2013;33(7):1705-1711.
14. Donnelly S, Doyle DV, Denton A, Rolfe I, McCloskey EV, Spector TD. Bone mineral density and vertebral compression fracture rates in ankylosing spondylitis. Ann Rheum Dis. 1994;53(2):117-121.
15. Braun J, van den Berg R, Baraliakos X, et al. 2010 update of the ASAS/EULAR recommendations for the management of ankylosing spondylitis. Ann Rheum Dis. 2011;70(6):896-904.
16. van der Heijde D, Ramiro S, Landewé R, et al. 2016 update of the ASAS-EULAR management recommendations for axial spondyloar-thritis. Ann Rheum Dis. 2017;76(6):978-991.
17. Black DM, Rosen CJ. Clinical Practice. Postmenopausal osteoporo-sis. N Engl J Med. 2016;374(3):254-262.
18. Haroon N. Ankylosis in ankylosing spondylitis: current concepts. Clin Rheumatol. 2015;34(6):1003-1007.
19. Magrey MN, Khan MA. The paradox of bone formation and bone loss in ankylosing spondylitis: evolving new concepts of bone formation and future trends in management. Curr Rheumatol Rep. 2017;19(4):17.
20. Van Mechelen M, Gulino GR, de Vlam K, Lories R. Bone disease in axial spondyloarthritis. Calcif Tissue Int. 2018;102(5):547-558.
21. Schousboe JT, Shepherd JA, Bilezikian JP, Baim S. Executive sum-mary of the 2013 international society for clinical densitometry po-sition development conference on bone densitometry. J Clin Densit. 2013;16(4):455-466.
22. Carter S, Lories RJ. Osteoporosis: a paradox in ankylosing spondy-litis. Curr Osteoporos Rep. 2011;9(3):112-115.
23. Finkelstein JS, Cleary RL, Butler JP, et al. A comparison of lateral versus anterior-posterior spine dual energy x-ray absorptiom-etry for the diagnosis of osteopenia. J Clin Endocrinol Metabol. 1994;78(3):724-730.
24. Blake GM, Jagathesan T, Herd RJ, Fogelman I. Dual X-ray absorp-tiometry of the lumbar spine: the precision of paired anteroposte-rior/lateral studies. Br J Radiol. 1994;67(799):624-630.
25. Malochet-Guinamand S, Pereira B, Tatar Z, et al. Prevalence and risk factors of low bone mineral density in spondyloarthritis and prevalence of vertebral fractures. BMC Musculoskelet Disord. 2017;18(1):357.
26. Deminger A, Klingberg E, Lorentzon M, et al. Which measuring site in ankylosing spondylitis is best to detect bone loss and what pre-dicts the decline: results from a 5-year prospective study. Arthritis Res Ther. 2017;19(1):273.
27. von Elm E, Altman DG, Egger M, Pocock SJ, Gotzsche PC, Vandenbroucke JP. The Strengthening the Reporting of Observational Studies in Epidemiology (STROBE) statement: guidelines for reporting observational studies. Ann Intern Med. 2007;147(8):573-577.
28. Rudwaleit M, Landewe R, van der Heijde D, et al. The development of Assessment of SpondyloArthritis international Society classifi-cation criteria for axial spondyloarthritis (part I): classification of paper patients by expert opinion including uncertainty appraisal. Ann Rheum Dis. 2009;68(6):770-776.
29. Jenkinson TR, Mallorie PA, Whitelock HC, Kennedy LG, Garrett SL, Calin A. Defining spinal mobility in ankylosing spondylitis (AS). The Bath AS Metrology Index. J Rheumatol. 1994;21(9):1694-1698.
30. Garrett S, Jenkinson T, Kennedy LG, Whitelock H, Gaisford P, Calin A. A new approach to defining disease status in ankylosing spon-dylitis: the Bath Ankylosing Spondylitis Disease Activity Index. J Rheumatol. 1994;21(12):2286-2291.
31. Calin A, Garrett S, Whitelock H, et al. A new approach to defin-ing functional ability in ankylosing spondylitis: the development of the Bath Ankylosing Spondylitis Functional Index. J Rheumatol. 1994;21(12):2281-2285.
32. Doward LC, Spoorenberg A, Cook SA, et al. Development of the ASQoL: a quality of life instrument specific to ankylosing spondyli-tis. Ann Rheum Dis. 2003;62(1):20-26.
33. Jones SD, Steiner A, Garrett SL, Calin A. The Bath Ankylosing Spondylitis Patient Global Score (BAS-G). Br J Rheumatol. 1996;35(1):66-71.
34. Pincus T, Summey JA, Soraci SA Jr, Wallston KA, Hummon NP. Assessment of patient satisfaction in activities of daily living using a modified Stanford Health Assessment Questionnaire. Arthritis Rheum. 1983;26(11):1346-1353.
35. Lukas C, Landewé R, Sieper J, et al. Development of an ASAS-endorsed disease activity score (ASDAS) in patients with ankylos-ing spondylitis. Ann Rheum Dis. 2009;68(1):18-24.
36. Creemers MC, Franssen MJ, van't Hof MA, Gribnau FW, van de Putte LB, van Riel PL. Assessment of outcome in ankylosing

366 | FITZGERALD ET AL.
spondylitis: an extended radiographic scoring system. Ann Rheum Dis. 2005;64(1):127-129.
37. van der Linden S, Valkenburg HA, Cats A. Evaluation of diagnostic criteria for ankylosing spondylitis. A proposal for modification of the New York criteria. Arthritis Rheum. 1984;27(4):361-368.
38. Shepherd JA, Schousboe JT, Broy SB, Engelke K, Leslie WD. Executive summary of the 2015 ISCD Position Development Conference on Advanced Measures From DXA and QCT: fracture prediction beyond BMD. J Clin Densit. 2015;18(3):274-286.
39. Consensus development conference: diagnosis, prophylaxis, and treatment of osteoporosis. Am J Med. 1993;94(6):646-650.
40. Fitzgerald GE, O’Shea FD. The fascinating paradox of osteoporosis in axial spondyloarthropathy. J Rheumatol. 2017;44(12):1767-1776.
41. Klingberg E, Lorentzon M, Mellstrom D, et al. Osteoporosis in anky-losing spondylitis - prevalence, risk factors and methods of assess-ment. Arthritis Res Ther. 2012;14(3):R108.
42. Rajamanohara R, Robinson J, Rymer J, Patel R, Fogelman I, Blake GM. The effect of weight and weight change on the long-term precision of spine and hip DXA measurements. Osteoporos Int. 2011;22(5):1503-1512.
43. Patel R, Blake GM, Rymer J, Fogelman I. Long-term precision of DXA scanning assessed over seven years in forty postmenopausal women. Osteoporos Int. 2000;11(1):68-75.
44. Kanis JA. Diagnosis of osteoporosis and assessment of fracture risk. Lancet. 2002;359(9321):1929-1936.
45. Qu X, Huang X, Jin F, et al. Bone mineral density and all-cause, car-diovascular and stroke mortality: a meta-analysis of prospective cohort studies. Int J Cardiol. 2013;166(2):385-393.
46. Assessment of fracture risk and its application to screening for postmenopausal osteoporosis. Report of a WHO Study Group. World Health Organ Tech Rep Ser. 1994;843:1-129.
47. Zmuda JM, Cauley JA, Glynn NW, Finkelstein JS. Posterior-anterior and lateral dual-energy x-ray absorptiometry for the assessment of vertebral osteoporosis and bone loss among older men. J Bone Miner Res. 2000;15(7):1417-1424.
48. Karberg K, Zochling J, Sieper J, Felsenberg D, Braun J. Bone loss is detected more frequently in patients with ankylosing spondylitis with syndesmophytes. J Rheumatol. 2005;32(7):1290-1298.
49. Toussirot E, Michel F, Wendling D. Bone density, ultrasound mea-surements and body composition in early ankylosing spondylitis. Rheumatology (Oxford). 2001;40(8):882-888.
50. Sarikaya S, Basaran A, Tekin Y, Ozdolap S, Ortancil O. Is osteoporo-sis generalized or localized to central skeleton in ankylosing spon-dylitis? J Clin Rheumatol. 2007;13(1):20-24.
SUPPORTING INFORMATIONAdditional supporting information may be found online in the Supporting Information section.
How to cite this article: Fitzgerald G, Anachebe T, McCarroll K, O’Shea F. Measuring bone density in axial spondyloarthropathy: Time to turn things on their side?. Int J Rheum Dis. 2020;23:358–366. https ://doi.org/10.1111/1756-185X.13765

Int J Rheum Dis. 2020;23:367–373. wileyonlinelibrary.com/journal/apl | 367© 2019 Asia Pacific League of Associations for Rheumatology and John Wiley & Sons Australia, Ltd
1 | INTRODUC TION
Primary Sjögren's syndrome (pSS) is a systemic autoimmune disease mainly characterized by involvement of the exocrine glands, leading
to dry mouth or sicca syndrome with a global prevalence of about 0.04% to 4.8%, and mostly affecting women between the fourth and fifth decades of life.1 Even though sicca symptoms are the most frequent features of the disease, the inflammatory process can ex-tend to several other organs and tissues and constitutional symp-toms, including fatigue, and widespread pain, may impair quality of
Received:20October2017 | Revised:18June2019 | Accepted:18July2019DOI: 10.1111/1756-185X.13678
O R I G I N A L A R T I C L E
Prevalence, correlates, and impact of sleep disturbance in Chinese patients with primary Sjögren’s syndrome
Yafei Cui1,2 | Jing Li1 | Lin Li1,2 | Qian Zhao1,2 | Shengnan Chen1,2 | Ling Xia1 | Ting Fu1 | Juan Ji1 | Zhifeng Gu1
YafeiCuiandJingLicontributedequallytothiswork.
1DepartmentofRheumatology,AffiliatedHospital of Nantong University, Nantong, China2School of Nursing, Nantong University, Nantong, China
CorrespondenceZhifeng Gu, Department of Rheumatology, AffiliatedHospitalofNantongUniversity,20th Xisi Road, 226001, China.Email: [email protected]
Funding informationThis study was supported by Grants from the Chinese National Natural Science Foundation (Grant no. 81671616, and 81471603);JiangsuProvincialCommissionof Health and Family Planning Foundation (Grant no. H201317 and H201623); Science Foundation of Nantong City (Grant no. MS32015021, MS2201564, MS22016028 andMS22016019);ScienceandTechnologyFoundation of Nantong City (Grant no. HS2014071 and HS2016003).
AbstractAim: Sleep disturbances are common in primary Sjögren's syndrome (pSS) patients and may lead to disease aggravation and decreased health-related quality of life (HRQoL).Therearecurrentlynoknownreportedstudiesrelatedtotheprevalence,correlates, and impact of sleep disturbance in pSS patients from China. Therefore, this study aims to assess the sleep quality in Chinese pSS patients and evaluate its relationship with the disease activity, quality of life and mood disorders.Methods: Aself‐reportsurveywasadministeredto221pSSpatientsand198healthyindividuals using the Pittsburgh Sleep Quality Index (PSQI) for sleep quality. Disease activityanddamagewereevaluatedwiththeEuropeanLeagueAgainstRheumatismSjögren's syndrome disease activity index (ESSDAI). Independent samples t tests, Chi-square analysis, logistic regression were used to analyze these data.Results: Ourresultsfoundthattheprevalenceofpoorsleep(PSQI≥6)was57.5%andthemeanglobalscoreofPSQIwas6.57(SD3.19)inpatients,whichweresig-nificantlyhigherthanthecontrols (32.3%and4.93[SD2.86], respectively).Whentrying to fall asleep, patients with pSS had some sleep disturbances, reduced sleep efficiency, increased number of awakenings than controls. Therewere significantcorrelationsamongdryness,ocular surfacedisease,HRQoL,pain,diseaseactivity,anxiety/depression and sleep quality in pSS patients. Meanwhile, logistic regression models identified depression and Short Form-36 mental composite score as predic-tors of poor sleep quality.Conclusions: Sleep disturbances are commonly reported in pSS patients and sleep quality is lower in pSS patients than in healthy controls. The data suggested the need for holistic assessment and management of pSS patients.
K E Y W O R D S
disease activity, primary Sjögren's syndrome, sleep quality

368 | CUI et al.
life.2 Patients with pSS also report frequent sleep disturbances and excessive daytime sleepiness.3 In addition, obstructive sleep apnea syndrome has been also reported with a higher prevalence in pSS patients.2 However, the factors impairing sleep in pSS patients have not been well described, and it is not clear whether sleep distur-bances in pSS may be related to disease activity or mood disorders.
Sleep as one of the influencing factors of quality of life, has at-tracted much recent attention from rheumatologists. People spend one-third of their lifetime sleeping. Satisfying sleep quality is a requisite for a fine health status and vice versa a physical or men-tal disease may influence overall sleep quality. In the general pop-ulation, impaired sleep is associated with adverse health outcomes including weight gain, depression, pain, impaired immune function, impaired functional performance, increased riskof earlymortalityandcognitivesymptomssuchasincreasederrorsandincreasedriskof accidents.4What ismore serious is that individuals with sleepdeprivation have irregular sleep schedules, resulting in circadian mis-alignment,whichmayaggravatetheriskofcardiovascular,coronaryheart diseases and other chronic disorders.5,6 Sleep deprivation may alsocauseemotionalproblems,impairedsocial,workperformance,sleepiness and so on7
Emerging evidence suggests that sleep disturbances promote weight gain through an effect on glucose metabolism and might be afactorinincreasingriskfordiabetes.8 Notwithstanding, the qual-ity of sleep is generally neglected by both healthcare professionals, who do not routinely assess it in clinical practice, and patients them-selves. Although current recommendations are that adults shouldregularlyhavebetween7‐9hoursofsleepconsistentlypernight,4 and considering the importance of sleep disturbances in pSS pa-tients, only a limited number of studies have been conducted up to now, and studies focusing on the relationship between sleep quality anddiseaseactivityinpSSpatientsarelacking,especiallyinChina.Considering the lackofdata, in this studyweaimed todeterminesleep quality and evaluate its relationship with disease activity, qual-ity of life and mood disorders.
2 | PATIENTS AND METHODS
2.1 | Participants
Werecruited221patientsfromtheDepartmentofRheumatology,AffiliatedHospitalofNantongUniversity,Nantong,China,fromJuly2016 to September 2017. During the study period, 282 consecutive patients were seen, as either inpatients or outpatients, for evalua-tion of pSS; none of these patients had other connective tissue dis-orders.AllwerediagnosedwithpSSandfulfilledthe2012criteriaoftheAmericanAcademyofRheumatology.9 The exclusion criteria are: (a) any other systemic autoimmune diseases; (b) severe infection, malignant tumor, severe organ dysfunction, or any other life-threat-ening conditions; (c) inability to cooperate in the study, and incapa-bility to understand and answer the questions.We also recruited198healthycontrolsfromthehealthexaminationcenterofthesamehospital, who were age and sex matched. The study was approved by
theEthicsCommitteeofAffiliatedHospitalofNantongUniversity(approval number 2017‐K003). All participants in this study hadbeen informed and signed consent for participation in this study.
2.2 | Clinical and laboratory data
Demographic data regarding age, education, marital status and past medical history were collected. All patients underwent extensiveclinical medical examinations and serological evaluations, including disease duration, C-reactive protein (CRP) and erythrocyte sedimen-tation rate (ESR). ESR andCRPwere assessedby theWestergrenmethod(mm/h)andthenephelometricmethod(mg/L),respectively.
2.3 | Assessment of self‐reported sleep quality
The Pittsburgh Sleep Quality Index (PSQI) is the most commonly used retrospective self-report questionnaire which measures sleep qualityoverthepreviousmonth.Itconsistsof19questionsgroupedin seven components (subjective sleep quality, sleep latency, sleep duration, habitual sleep efficiency, sleep disorders, use of sleep-ing medications, and daytime dysfunction), each weighted on a 0-3 scale, that are summed in a global PSQI score that ranges from 0 to 21withahigherscoreindicatingworsesleepquality.Aresultequalto six or above is considered indicative of poor sleep quality.10
2.4 | Other measurement tool
Painwasmeasured by a visual analog scale (VAS) to characterizeclinicalpainseverity.Patientswereaskedtoratetheirexperienceofpainduringthelastweek,eachonaVASof0‐10,withahigherscoreindicating more severe pain.11 Psychological status was measured usingtheHospitalAnxietyandDepressionScale (HADS),which isdividedintoHADS‐AandHADS‐D.12 Participants’ health status was assessed using the Short Form-36 health survey (SF-36) in the past 4weeks.13 Ocular surface disease was assessed using the Ocular Surface Disease Index (OSDI). Fatigue was assessed using Fatigue Severity Scale (FSS), and sicca symptoms were assessed according tothedrynessdomainoftheEuropeanLeagueAgainstRheumatism(EULAR)Sjögren'sSyndromePatient‐ReportedIndex(ESSPRI);14 dis-easeactivitywasassessedusingEULARSjögren'sSyndromeDiseaseActivityIndex(ESSDAI).15
2.5 | Statistical analysis
Data analyses were performed using SPSS 21.0 for Windows.Missing values were replaced with participant mean substitution. Thedistributionof numerical datawas evaluatedbyShapiro‐Wilktest. Numerical data with normal distribution were expressed as the mean ± standard deviation and differences between 2 groups were analyzed by independent t test. Numerical datawith skewed dis-tribution were expressed as median (P25, P75) and differences be-tween2groupswereanalyzedbyMann‐Whitneytest.Rankeddatawere expressed as percentage and differences between 2 groups

| 369CUI et al.
were analyzed by Chi-square test. Correlations between variables weredeterminedbySpearman'scorrelationcoefficient.Alogisticre-gression analysis was conducted to explore the impact of predictors of sleep quality. Variables were entered into the regression model using the forward conditional method, to allow identification of the variables that contribute most to the model. The results were re-garded as significant when the P value was less than .05.
3 | RESULTS
3.1 | Patient characteristics
Of the 282 eligible pSS patients recruited, six declined to participate, 26 were excluded due to other systemic autoimmune diseases, 12 could not fill out the self-administered study questionnaire mostly because of having not enough time at the appointment, and so on. Of the remaining 224, 3 cases were excluded from the analysis due tomanymissingvalues.Asummaryoftheprocessofcaseinclusionis shown in Figure 1. Demographic, clinical, and laboratory features ofpSSpatientsandhealthycontrolsareshowninTable1.Asevidentfrom the data presented in Table 1, pSS patients and controls were matched regarding age, gender, the level of education, the rate of employment and income/person/y. However, there were significant differences between healthy controls and pSS patients regarding maritalstatus.AsthreepSSpatientsandfivehealthyindividualsdidnot complete the questionnaires, 221 pSS patients (13 male and 208 female)and198healthy individuals (8maleand190 female)wereenrolled in the current study. Cases had a mean age of 50.14 years (SD=12.31);64(29%)and74(33.5%)ofthepatientshadanxietyand depressive disorders, respectively.
3.2 | Sleep quality
The PSQI global score for the pSS patients was 6.57 ± 3.19,with 127 patients (57.47%) classified as “poor sleepers” (global PSQI≥6). Table2 summarizes the global score and the compo-nent scale scores for the PSQI for our sample in comparison with controls. Comparisons showed that pSS patients have significantly higher scores on global sleep quality (P < .001), subjective sleep quality (P < .001), sleep latency (P < .001), sleep disorders (P < .001) and daytime dysfunction (P < .001). Differences regarding sleep
F I G U R E 1 Flow chart showing selection of participants for inclusion in this study
TA B L E 1 Summary of the demographic and clinical characteristics of the participants in the study
Clinical characteristics pSS (N = 221)
Controls (N = 198) P
Age,mean±SD,y 50.14 ± 12.31 49.79±11.17 .757
Gender, female, no. (%)
208(94.1) 190(96) .388
Marital status, no. (%)
Married 204(92.3) 193(97.5) .018
Single/divorced/bereaved
17 (7.7) 5 (2.5)
Education, y 12.23 ± 4.58 12.51 ± 4.85 .545
Employment status, no. (%)
Employed 96(43.4) 91(46) .604
Unemployed 125 (56.6) 107 (54)
Income/person/y, yuan, no. (%)
<15 000 yuan 56 (25.3) 52 (26.3) .555
15 000-33 000 yuan
68 (30.8) 66 (33.3)
≥33000yuan 97(43.9) 80 (40.4)
Type of medical insurance, n (%)
Withbasicmedi-cal insurance
204(92.3) 190(96.5) .251
Self-pay 1 (0.5) 1 (0.5)
Other 16 (7.2) 7 (3.5)
HADS‐A,mean±SD 6.10±3.90 3.26 ± 2.81 .000
HADS‐D,mean±SD 6.36 ± 4.12 3.99±2.89 .000
Disease duration, mean ± SD y
4.10±4.94 - -
Comorbid condi-tions, yes, n (%)
128(57.9) - -
ESSDAI 7.91±7.07 - -
ESSPRI 3.97±1.89 - -
CRP, mean ± SD (mg/L)
6.95±13.44 - -
ESR, mean ± SD (mm/h)
28.32 ± 24.25 - -
Abbreviations:CRP,C‐reactiveprotein;ESR,erythrocytesedimenta-tionrate;ESSDAI,EuropeanLeagueAgainstRheumatismSjögren'sSyndromeDiseaseActivityIndex;ESSPRI,EuropeanLeagueAgainstRheumatismPatient‐ReportedIndex;HADS‐A,HospitalAnxietyScale;HADS‐D,HospitalDepressionScale;pSS,primarySjögren'ssyndrome.
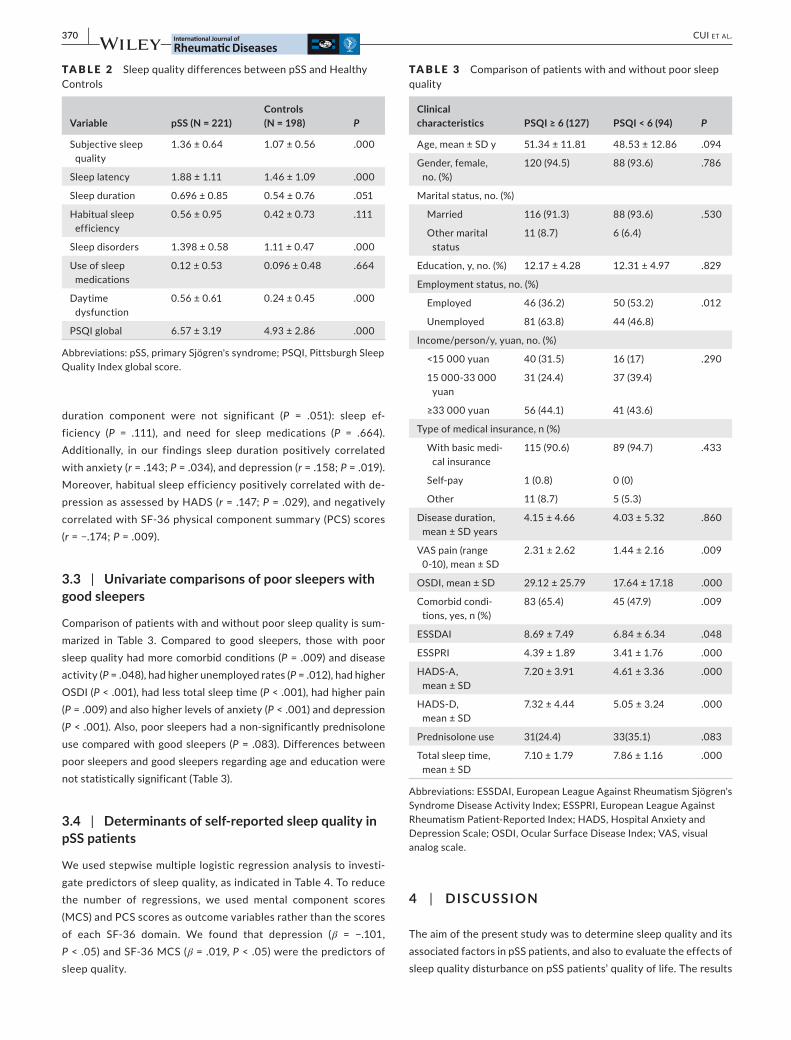
370 | CUI et al.
duration component were not significant (P = .051): sleep ef-ficiency (P = .111), and need for sleep medications (P = .664). Additionally, in our findings sleep duration positively correlatedwith anxiety (r = .143; P = .034), and depression (r = .158; P=.019).Moreover, habitual sleep efficiency positively correlated with de-pressionasassessedbyHADS(r = .147; P=.029),andnegativelycorrelated with SF-36 physical component summary (PCS) scores (r=−.174;P=.009).
3.3 | Univariate comparisons of poor sleepers with good sleepers
Comparison of patients with and without poor sleep quality is sum-marized in Table 3. Compared to good sleepers, those with poor sleep quality had more comorbid conditions (P=.009)anddiseaseactivity (P = .048), had higher unemployed rates (P = .012), had higher OSDI (P < .001), had less total sleep time (P < .001), had higher pain (P=.009)andalsohigherlevelsofanxiety(P < .001) and depression (P<.001).Also,poorsleepershadanon‐significantlyprednisoloneuse compared with good sleepers (P = .083). Differences between poor sleepers and good sleepers regarding age and education were not statistically significant (Table 3).
3.4 | Determinants of self‐reported sleep quality in pSS patients
Weusedstepwisemultiplelogisticregressionanalysistoinvesti-gate predictors of sleep quality, as indicated in Table 4. To reduce the number of regressions, we used mental component scores (MCS) and PCS scores as outcome variables rather than the scores of each SF‐36 domain. We found that depression (β = −.101,P < .05) and SF-36 MCS (β=.019,P < .05) were the predictors of sleep quality.
4 | DISCUSSION
The aim of the present study was to determine sleep quality and its associated factors in pSS patients, and also to evaluate the effects of sleep quality disturbance on pSS patients’ quality of life. The results
TA B L E 2 Sleep quality differences between pSS and Healthy Controls
Variable pSS (N = 221)Controls (N = 198) P
Subjective sleep quality
1.36 ± 0.64 1.07 ± 0.56 .000
Sleep latency 1.88 ± 1.11 1.46±1.09 .000
Sleep duration 0.696±0.85 0.54 ± 0.76 .051
Habitual sleep efficiency
0.56±0.95 0.42 ± 0.73 .111
Sleep disorders 1.398±0.58 1.11 ± 0.47 .000
Use of sleep medications
0.12 ± 0.53 0.096±0.48 .664
Daytime dysfunction
0.56 ± 0.61 0.24 ± 0.45 .000
PSQI global 6.57±3.19 4.93±2.86 .000
Abbreviations:pSS,primarySjögren'ssyndrome;PSQI,PittsburghSleepQuality Index global score.
TA B L E 3 Comparison of patients with and without poor sleep quality
Clinical characteristics PSQI ≥ 6 (127) PSQI < 6 (94) P
Age,mean±SDy 51.34 ± 11.81 48.53 ± 12.86 .094
Gender, female, no. (%)
120(94.5) 88(93.6) .786
Marital status, no. (%)
Married 116(91.3) 88(93.6) .530
Other marital status
11 (8.7) 6 (6.4)
Education, y, no. (%) 12.17 ± 4.28 12.31±4.97 .829
Employment status, no. (%)
Employed 46 (36.2) 50 (53.2) .012
Unemployed 81 (63.8) 44 (46.8)
Income/person/y, yuan, no. (%)
<15 000 yuan 40 (31.5) 16 (17) .290
15 000-33 000 yuan
31 (24.4) 37(39.4)
≥33000yuan 56 (44.1) 41 (43.6)
Type of medical insurance, n (%)
Withbasicmedi-cal insurance
115(90.6) 89(94.7) .433
Self-pay 1 (0.8) 0 (0)
Other 11 (8.7) 5 (5.3)
Disease duration, mean ± SD years
4.15 ± 4.66 4.03 ± 5.32 .860
VASpain(range0-10), mean ± SD
2.31 ± 2.62 1.44 ± 2.16 .009
OSDI, mean ± SD 29.12±25.79 17.64 ± 17.18 .000
Comorbid condi-tions, yes, n (%)
83 (65.4) 45(47.9) .009
ESSDAI 8.69±7.49 6.84 ± 6.34 .048
ESSPRI 4.39±1.89 3.41 ± 1.76 .000
HADS‐A,mean ± SD
7.20±3.91 4.61 ± 3.36 .000
HADS‐D,mean ± SD
7.32 ± 4.44 5.05 ± 3.24 .000
Prednisolone use 31(24.4) 33(35.1) .083
Total sleep time, mean ± SD
7.10±1.79 7.86 ± 1.16 .000
Abbreviations:ESSDAI,EuropeanLeagueAgainstRheumatismSjögren'sSyndromeDiseaseActivityIndex;ESSPRI,EuropeanLeagueAgainstRheumatismPatient‐ReportedIndex;HADS,HospitalAnxietyandDepressionScale;OSDI,OcularSurfaceDiseaseIndex;VAS,visualanalog scale.

| 371CUI et al.
of the current study reveal a significant impairment in all aspects of sleep among pSS patients, including daytime somnolence, subjective sleep disturbances (including disturbance due to dryness symptoms) and increased occurrence of night awakenings), when comparedwith healthy controls. In an Israeli survey of 65 pSS patients, 75% of patients with pSS complained of moderate or severe sleep dis-turbances.16 Our results are in agreement with recent studies which have reported that patients with pSS present a higher probability of sleep troubles with respect to matched controls.17Wealsofoundanassociation between sleep and anxiety/depression among pSS pa-tients. However, in another study conducted on this subject from Italy,no significant correlationbetweenanxiety/depressionHADSand PSQI global score was found.2 Furthermore, we observed that poor sleep has a direct impact on both mental and physical status in this patient group.
Overall, in our study factors influencing sleep quality, such as oral sicca, pain and depression, may have a negative effect on HRQoL. Patients typically experience difficulty in falling asleep,earlymorningwakening,andfragmentedsleepwithfrequentnoc-turnalawakeningsrelativetocontrols,whichissimilartotheresultsfrom rheumatoid arthritis.18Frequentawakeningsduringthenightwere noted by pSS patients and this was associated with various symptoms, such as pain, headache, shortness of breath, palpitations and sweating. Patients with pSS more often reported they did not feel rested after sleep and felt sleepy during the day. Patients with pSStooknapsduringthedaymorefrequentlythanthecontrolsandthemostcommonreasons for takinganap included tiredness/ex-haustion, feeling unwell, to catch up from the previous night's poor sleep, due to headache and pain. In addition, being employed was related to shorter reported time to fall asleep.
Only a limited number of studies have focused on the relation-ship between sleep quality and disease activity in pSS patients. Our results showed that sleep quality in patients with pSS is associated with disease activity. Nevertheless, Priori found that sleep quality in 29pSSwomenwasassociatedwithareducedqualityoflifebutnotwith disease activity.2 Importantly, pain was positively correlated with the PSQI global score in our study. Different levels of pain were self-reported by our study participants compared with those in Westernstudies(mildtomoderatevsmoderatetosevere).19 Many Chinese people may believe that pain is caused by an imbalance of “Yin” and “Yang” and tend to treat their pain by traditional methods, such as the use of Chinese medicine or acupuncture. Others pre-fer to perform religious ceremonies to eliminate pain before they
contact a medical doctor.20 In addition, the largest group of patients with pSS in this study was farmers, the largest population in China, and many of them had delayed diagnosis and treatment that led to disease severity requiring in-hospital treatment. Most patients with pSS tried to ignore or tolerate their pain, even though it interfered with their sleeping.
Sleeprestriction inpSScouldberelatedtoawakeningtodrinkwater to relievedrymouth,nocturiaornocturnalmusculoskeletalpain.21 Furthermore, a systematic review from the UK found that 20% of pSS participants reported experiencing nocturnal sweating.22 In agreement with these findings, our study also showed that dry-nessandtheconsequentnecessitytofrequentlyawaketosipwateris another possible reason for sleep deprivation and daytime fatigue. Sicca symptoms did disturb sleep in one study from Sweden17 and potential interventions to reduce these symptoms. Nocturnal hu-midification and artificial saliva sprays may ease nocturnal sicca symptoms and decrease sleep disturbances in pSS patients.
The relationship between sleep and depression seems to be bidi-rectional; in fact, poor sleep can predict depression and, on the other side, a depressed mood may be a predictor of a disrupted sleep. The underlying mechanisms for this are not fully understood. Depression is a highly prevalent problem in pSS and contributes to disability, bad adherence to treatment, poor social functioning, impaired con-centration and insomnia. There is evidence to sustain that there is abidirectionalconnectionbetweenthesetwovariables.Accordingtosomestudies,sleepdisorderisalsoamajorriskfactorforfutureonset and for recurrence of depressive episodes.23,24 Longitudinaldata are needed to assess the relationship between sleep and de-pression. Also depression and anxiety medications aggravate thesicca symptoms which is a vicious cycle.
Moreover, host defense mechanisms and immune function are altered with sleep deprivation. Brain levels of interleukin‐1 andtumor necrosis factor are linked with sleep deprivation.25 Sleep deprivation is an important issue in patients with chronic disease, but this issue is not clearly established. Moderate to severe sleep im-pairment correlated with prednisone usage in 56 out of 100 women with systemic lupus erythematosus26 and prednisone use is reported to be associated with daytime somnolence,2 which are different from our results. Insufficient sleep was more commonly reported by patients with pSS compared to healthy subjects. Total sleep time was significantly shorter for pSS patients with poor sleep quality at 7.1±1.8hourscomparedto7.9±1.2hoursforpSSpatientswithoutsleep impairment in this survey. Sleep duration that was either too shortortoolongwasassociatedwithhigherriskofall‐causemortal-ityandcardiovascularevents,withthelowestriskforsleepdurationof≈7hoursperday.6Aneedclearlyexistsforfuturestudiestoad-dresstheseissues,includingcircadianrhythm,thelevelofcytokines,medications, and so on.
4.1 | Strengths and limitations
The large sample size available for this analysis was a major strength of this study. With a large number of participants,
TA B L E 4 Results of logistic regression model predicting poor sleep quality
Predictors β SE P B (95%CI)
Depression −0.101 0.046 .028 0.904(0.826,0.989)
MCS 0.019 0.008 .021 1.019(1.003,1.036)
Abbreviation:MCS,mentalcompositescore.

372 | CUI et al.
systematic biases away from the null can be prevented and thus ourresultswerelesslikelytooverestimateassociationsbetweendependent and independent variables.27 However, there still are some limitations to our study. First, since we recruited pSS pa-tients from a single rheumatology clinic, findings of this study can-not be generalized to all pSS patients in our society. Second, we only used a self-reported measure of sleep quality and did not spe-cifically evaluate sleep disorders. Therefore, more studies using objective sleep measures are warranted. Third, the cross-sectional design of our study does not allow examining causal relationships between variables. In this regard, prospective studies are needed to find those factors that must be modified in order to improve sleep quality in pSS patients.
5 | CONCLUSION
In summary, we found an increased prevalence of sleep disturbances in pSS patients compared with controls. It is possible that symp-toms of sleep disturbance may be attributed to pSS disease activ-ity and affect disease management decisions. Therefore, studying sleep and identifying factors contributing to sleep disturbances in pSS patients is of great importance. Healthcare professionals need to pay attention to patients who express these concerns. Our find-ing also suggests that symptom management is critical for improv-ing sleep quality. These findings have important policy or practical implications.
ACKNOWLEDG EMENTS
Wewould liketothankZhimingLu,JingLi,YunfeiXiaandGenkaiGao for their assistance with this study.
ORCID
Zhifeng Gu https://orcid.org/0000-0001-8612-1003
R E FE R E N C E S
1. Ambrosio LM, Rovai ES, Franca BN, et al. Effects of periodontaltreatment on primary sjogren's syndrome symptoms. Braz Oral Res. 2017;31:e8.
2. PrioriR,MinnitiA,AntonazzoB,FusconiM,ValesiniG,CurcioG.Sleep quality in patients with primary Sjogren's syndrome. Clin Exp Rheumatol.2016;34:373‐379.
3. Usmani ZA, Hlavac M, Rischmueller M, et al. Sleep disorderedbreathing in patients with primary Sjögren’s syndrome: A groupcontrolled study. Sleep Med. 2012;13:1066-1070.
4. WatsonNF,BadrMS,BelenkyG,etal.Recommendedamountofsleep for a healthy adult: a joint consensus statement of the amer-ican academy of sleep medicine and sleep research society. Sleep. 2015;38:843-844.
5. Hoevenaar‐Blom MP, Spijkerman A, Kromhout D, van den BergJF,VerschurenW.Sleepduration and sleepquality in relation to
12-year cardiovascular disease incidence: The MORGEN study. Sleep.2011;34:1487‐1492.
6. YinJ, JinX,ShanZ,etal.Relationshipofsleepdurationwithall‐cause mortality and cardiovascular events: a systematic review and dose-response meta-analysis of prospective cohort studies. J Am Heart Assoc.2017;6:e5947.
7. Marques DR, Meia‐Via A, Da Silva CF, Gomes AA. Associationsbetween sleep quality and domains of quality of life in a non-clin-ical sample: results from higher education students. Sleep Health. 2017;3:348-356.
8. Ayas NT, White DP, Al‐DelaimyWK, et al. A prospective studyof self-reported sleep duration and incident diabetes in women. Diabetes Care. 2003;26:380-384.
9. ShiboskiS.Americancollegeofrheumatologyclassificationcriteriafor Sjögren ’ s Syndrome: a data-driven, expert consensus approach intheSICCAcohort.Arthrit Care Res. 2003;64:475-487.
10. LiuX.ReliabilityandvalidityofthePittsburghsleepqualityindex.Chin J Psychiatry.1996;29:103‐107.
11. SokkaT,KankainenA,HannonenP.Scoresforfunctionaldisabilityin patients with rheumatoid arthritis are correlated at higher lev-els with pain scores than with radiographic scores. Arthritis Rheum. 2000;43:386‐389.
12. Bjelland I,DahlAA,HaugTT,NeckelmannD.Thevalidityof theHospitalAnxietyandDepressionScale.Anupdated literature re-view. J Psychosom res.2002;52:69‐77.
13. Lam C, Tse E, Gandek B, Fong D. The SF‐36 summary scaleswere valid, reliable, and equivalent in a Chinese population. J Clin Epidemiol. 2005;58:815-822.
14. Cho HJ, Yoo JJ, Yun CY, et al. The EULAR Sjogren's syndromepatient reported index as an independent determinant of health-related quality of life in primary Sjogren's syndrome patients: in comparison with non-Sjogren's sicca patients. Rheumatology. 2013;52:2208-2217.
15. Seror R, Bowman SJ, Brito‐Zeron P, et al. EULAR Sjogren's syn-drome disease activity index (ESSDAI): a user guide.RMD Open. 2015;1:e22.
16. AbadVC,SarinasP,GuilleminaultC.Sleepandrheumatologicdisor-ders. Sleep Med Rev. 2008;12:211-228.
17. Theander L, Strombeck B, Mandl T, Theander E. Sleepiness orfatigue? Can we detect treatable causes of tiredness in primary Sjogren's syndrome? Rheumatology.2010;49:1177‐1183.
18. GoesA,ReisL,SilvaM,KahlowBS,SkareTL.Rheumatoidarthritisand sleep quality. Rev Bras Reumatol.2017;57:294‐298.
19. SegalBM,PogatchnikB,RhodusN,SivilsKM,McElvainG,SolidCA.Pain in primary Sjögren’s syndrome: the role of catastrophizing and negative illness perceptions. Scand J Rheumatol. 2013;43:234-241.
20. ChenL,MiaskowskiC,DoddM,PantilatS.Conceptswithinthechi-nese culture that influence the cancer pain experience. Cancer Nurs. 2008;31:103-108.
21. WalkerJ,GordonT,LesterS,etal.Increasedseverityofloweruri-nary tract symptoms and daytime somnolence in primary Sjogren's syndrome. J Rheumatol. 2003;30:2406-2412.
22. Hackett KL, Gotts ZM, Ellis J, et al. An investigation into theprevalence of sleep disturbances in primary Sjögren’s syndrome: a systematic review of the literature. Rheumatology w443. 2016;56(4):570-580
23. FranzenPL,BuysseDJ.Sleepdisturbancesanddepression:riskre-lationships for subsequent depression and therapeutic implications. Dialogues Clin Neurosci. 2008;10:473-481.
24. PerlisML,SmithLJ,LynessJM,etal.Insomniaasariskfactorforonset of depression in the elderly. Behav Sleep Med. 2006;4:104-113.
25. Krueger JM,Obal FJ, Fang J, Kubota T, Taishi P. The role of cy-tokines in physiological sleep regulation. Ann N Y Acad Sci. 2001;933:211‐221.

| 373CUI et al.
26. CostaDD,BernatskyS,DritsaM,etal.Determinantsofsleepqual-ity in women with systemic lupus erythematosus. Arthritis Rheum. 2005;53:272-278.
27. NemesS, Jonasson JM,GenellA, SteineckG.Bias inodds ratiosby logistic regression modelling and sample size. Bmc Med Res Methodol.2009;9:56.
How to cite this article:CuiY,LiJ,LiL,etal.Prevalence,correlates, and impact of sleep disturbance in Chinese patients with primary Sjögren’s syndrome. Int J Rheum Dis. 2020;23:367–373. https ://doi.org/10.1111/1756-185X.13678

374 | wileyonlinelibrary.com/journal/apl Int J Rheum Dis. 2020;23:374–380.© 2019 Asia Pacific League of Associations for Rheumatology and John Wiley & Sons Australia, Ltd
1 | INTRODUC TION
Primary Sjögren's syndrome (pSS) is a chronic, progressive and sys-temic autoimmune disease, characterized by xerostomia, xeroph-thalmia and involvement of multiple organs. The pathogenesis of pSS has been described to be multifactorial, with accumulating evidence suggesting that both genetic and environmental factors contribute to the process of autoimmune disorder in the disease.1
Chronic lymphocytic infiltration of exocrine glands with overex-pression of inflammatory cytokines2,3 and B cell hyperactivation4 are vital immunological features of the disease. In laboratory tests, patients with Sjögren's syndrome often have abnormalities of blood cell reduction, high titers of autoantibodies, elevated in-flammatory and immunological indicators. In addition to target-ing lacrimal and salivary glands, the disease also attacks the lung, which often causes interstitial lung disease (ILD), consequently
Received: 16 March 2019 | Revised: 3 August 2019 | Accepted: 25 November 2019
DOI: 10.1111/1756-185X.13773
O R I G I N A L A R T I C L E
Serum levels of interleukin-34 and clinical correlation in patients with primary Sjögren's syndrome
Yanmei Liu1,2 | Bei Zhang1 | Yimeng Lei1 | Liping Xia1 | Jing Lu1 | Hui Shen1
1Department of Rheumatology, The 1st Affiliated Hospital of China Medical University, Shenyang, Liaoning, China2Department of Critical Care Medicine, The 2nd People's Hospital of Chengdu, Chengdu, Sichuan, China
CorrespondenceHui Shen, Department of Rheumatology, the 1st Affiliated Hospital of China Medical University, 155 Nanjing North Street, Heping District, Shenyang, Liaoning 110001, China.Email: [email protected]
Funding informationthe National Natural Science Foundation of China; the Department of Education of Liaoning Province, Grant/Award Number: 81373219 and [JC2019009]
AbstractObjectives: To measure the levels of serum interleukin (IL)-34 in patients with pri-mary Sjögren's syndrome (pSS) and evaluate the cytokine's clinical association with the disease.Methods: Serum samples were obtained from 66 pSS patients and 32 healthy con-trols (HCs) and measured by enzyme-linked immunosorbent assay for IL-34 levels. The clinical parameters, including autoantibodies, immunoglobulins (Igs), comple-ments (Cs), inflammatory indicators, involvement of the blood system, lung and ar-thritis, were collected simultaneously. Two-sample t test was applied for comparison between 2 groups, and Pearson's correlation coefficient was used to assess the as-sociations between IL-34 levels and laboratory parameters.Results: Serum IL-34 levels were significantly elevated in pSS patients compared with HCs. Patients with anti-Ro/SSA antibody positivity showed higher serum IL-34 levels than those who were negative, as did the anti-La/SSB antibody-positive patients. Serum IL-34 levels were positively associated with the levels of rheumatoid factor, IgG and gamma-globulin, but not associated with IgA, IgM, C3, C4, erythrocyte sedi-mentation rate or C-reactive protein. For the pSS subgroups with and without leu-copenia, thrombocytopenia, anemia or interstitial lung disease (ILD), there was no significant difference in serum IL-34 levels. Interestingly, the pSS patients with arthri-tis had higher levels of IL-34 compared with the no-arthritis patients.Conclusions: IL-34 may be involved in B cell activation and production of antibodies in pSS.
K E Y W O R D S
autoantibody, clinical correlation, immunoglobulin, interleukin-34, primary Sjögren's syndrome

| 375LIU et aL.
affecting the quality of life of patients, even threatening their lives.5
Interleukin (IL)-34 is a novel cytokine discovered by Lin and others through functional screening analysis of the extracellular proteome.6 Although neither protein sequence similarity nor con-sensus structural domain between IL-34 and colony-stimulating factor-1 (CSF-1) were detected, both of them share the same re-ceptor, CSF-1 receptor (CSF-1R). In addition, IL-34 can also bind to the other 2 receptors, receptor-type protein-tyrosine phospha-tase-ζ (PTP-ζ) and syndecan-1.7,8 Functionally, IL-34 is recently considered as a potent activator of mononuclear phagocytic lin-eage cells, not only promoting the proliferation, differentiation and migration of mononuclear phagocytic lineage cells, but also inducing production of a variety of pro-inflammatory cytokines and chemokines such as IL-17 and interferon (IFN)-γ, and also reg-ulating angiogenesis, thus playing an important role in the patho-genesis of autoimmune diseases.9-11
Some studies concerning IL-34 in connective tissue diseases (CTDs) have been reported. It has been shown that serum IL-34 levels were elevated in patients with rheumatoid arthritis (RA), sys-temic lupus erythematosus (SLE), as well as systemic sclerosis (SSc), and were associated with disease activity to varying degrees.12-16 As a member of the CTDs, pSS was also revealed to be associated with IL-34, and it was shown that IL-34 messenger RNA (mRNA) was significantly up-regulated in the inflamed salivary glands of patients with pSS and associated with local expansion of pro-inflammatory CD14brightCD16+ monocytes.10 However, the role of IL-34 in the pe-ripheral blood of patients with pSS and how it might correlate with clinical parameters are still unknown.
In view of the limited understanding about the role of IL-34 in the pathogenesis of pSS, the current study aimed to measure the serum IL-34 levels in patients with pSS and to analyze its correlation with some clinical and laboratory indicators.
2 | SUBJEC TS AND METHODS
2.1 | Subjects
Sixty-six pSS patients, from the Department of Rheumatology, the 1st Affiliated Hospital of China Medical University, were consecutively re-cruited from November 2017 to May 2018. These patients were in line with the classification criteria for pSS established by the American-European Consensus Group (AECG) in 2002,17 and they were not under treatment or had stopped treatment for 3 months when en-rolled. Those patients who had other potential systemic autoimmune diseases, head and neck radiation treatment history, hepatitis C infec-tion, human immunodeficiency virus infection, pre-existing lymphoma, sarcoidosis, graft versus host disease or use of anticholinergic drugs were excluded. At the same time, 32 age- and gender-matched healthy persons from the physical examination center were enrolled as healthy controls (HCs). There were no significant differences in view of gen-der and age between pSS and healthy subjects (P > .05, respectively,
Table 1). The research was approved by the Ethics Committee of the 1st Affiliated Hospital of China Medical University, and written in-formed consent was obtained from each participant.
2.2 | Methods
2.2.1 | Measurement of serum IL-34 levels
About 3 mL of peripheral venous blood of each subject was col-lected, and centrifuged for 10 minutes at 1500g after sitting for 30 minutes at room temperature. The serum samples were thus ab-stracted and the aliquot was stored at −20℃ until analysis. Serum IL-34 levels were measured using a specific enzyme-linked immu-nosorbent assay kit (R&D Systems) according to the manufacturer's protocol. Each sample was measured in duplicate.
2.2.2 | Collection of clinical data of pSS patients
The laboratory indicators, including rheumatoid factor (RF), immuno-globulin G (IgG), IgA, IgM, gamma-globulin (γ-G), complement 3 (C3), C4, erythrocyte sedimentation rate (ESR), C-reactive protein (CRP), white blood cell (WBC) and platelet (PLT) counts and hemoglobin (Hb) levels, were measured by standard methods simultaneously. Anti-Ro/SSA and anti-La/SSB antibodies were detected by immunoblotting.
Whether patients were complicated with ILD was identified by high-resolution computed tomography. Patients were then divided into subgroups based on the presence or absence of anti-SSA an-tibody, anti-SSB antibody, leucopenia, thrombocytopenia, anemia, ILD and arthritis.
2.3 | Statistical analysis
Data are presented as mean ± standard deviation (SD). Comparison of the serum IL-34 levels between 2 groups was carried out by two-sample t test, and Pearson's correlation coefficient was used to assess the association between IL-34 levels and various clinical parameters. A multivariable linear regression analysis was further performed to assess the association of IL-34 with other clinical pa-rameters and showed the independent predictive value of IL-34 in the pSS patients. All analyses were performed using SPSS 23.0 (IBM) and GraphPad Prism 6 (GraphPad) software, and P < .05 was consid-ered statistically significant.
3 | RESULTS
3.1 | Clinical characteristics of pSS patients
The clinical characteristics of these pSS patients and HCs are sum-marized in Table 1.

376 | LIU et aL.
3.2 | Serum levels of IL-34 in patients with pSS
As shown in Figure 1, the serum levels of IL-34 in pSS patients were 199.95 ± 27.39 pg/mL, while in HCs the levels were 83.26 ± 15.92 pg/mL. The serum IL-34 levels in patients with pSS were significantly higher than the levels in HCs (P = .0054).
3.3 | Associations between serum IL-34 levels and clinical indicators in pSS patients
3.3.1 | Correlations between IL-34 levels and autoantibodies in sera of pSS patients
The correlations between IL-34 levels and the autoantibodies, in-cluding anti-Ro/SSA and anti-La/SSB antibodies and RF, in sera of pSS patients were analyzed. For the pSS subgroups, patients with anti-Ro/SSA antibody positivity had higher concentration of serum IL-34 than those who were negative (228.24 ± 32.99 vs 94.86 ± 27.24 pg/mL, P = .0034) (Figure 2A). A similar result was found in anti-La/SSB antibody subgroups (276.72 ± 56.59 vs 156.08 ± 26.71 pg/mL, P = .0330) (Figure 2A). What is more, the levels of serum IL-34 in patients with pSS were observed to be positively correlated with serum RF levels (r = 0.526, P < .0001) (Figure 2B).
3.3.2 | Correlations between the levels of IL-34 and immunoglobulins and complements in pSS patients
The associations between serum levels of IL-34 and immunoglobu-lins (including IgG, IgA, IgM and γ-G) as well as complements (in-cluding C3 and C4) were also evaluated. As shown in Figure 3A, the levels of serum IL-34 in pSS patients were positively associated with serum IgG and γ-G levels (r = 0.377, P = .0018; r = 0.346, P = .0063;
pSS (N = 66) HCs (N = 32) P value
Gender, female/male 63/3 30/2 .660
Age, y 53.9 ± 12.5 51.7 ± 13.9 .443
Disease duration, mo, M(P25 ~ P75) 54 (22 ~ 82) NA
Anti-Ro/SSA antibody, n (%) 52 (78.8) NA
Anti-La/SSB antibody, n (%) 24 (36.4) NA
RF, 0-15 IU/mL 70.57 ± 62.24 NA
IgG, 7-17 g/L 17.10 ± 6.62 NA
IgA, 0.7-3.8 g/L 3.49 ± 2.30 NA
IgM, 0.6-2.5 g/L 1.24 ± 0.88 NA
γ-G, 9.8%-19.8% 23.60 ± 6.99 NA
C3, 0.6-1.5 g/L 0.98 ± 1.87 NA
C4, 0.12-0.36 g/L 0.17 ± 0.06 NA
ESR, 0-20 mm/h 33.84 ± 24.84 NA
CRP, 0-5 mg/L 5.04 ± 10.41 NA
Leucopenia, n (%) 13 (19.7) NA
Thrombocytopenia, n (%) 18 (27.3) NA
AIHA, n (%) 6 (9.1) NA
With ILD, n (%) 31 (47.0) NA
With arthritis, n (%) 17(25.7) NA
Abbreviations: AIHA, autoimmune hemolytic anemia; C3, complement 3; C4, complement 4; CRP, C-reactive protein; ESR, erythrocyte sedimentation rate; HCs, healthy controls; Ig, immunoglobulin; ILD, interstitial lung disease; pSS, primary Sjögren's syndrome; RF, rheumatoid factor; γ-G, gamma-globulin.
TA B L E 1 Clinical features of pSS patients and HCs
F I G U R E 1 Serum IL-34 levels in patients with pSS were elevated compared with HCs

| 377LIU et aL.
F I G U R E 2 Relationships between serum IL-34 levels and autoantibodies in patients with pSS. A, As for the positive/negative subgroups of anti-SSA or anti-SSB antibody, the serum IL-34 levels in pSS patients were higher in the antibody-positive subgroups than the negative subgroups. B, Serum levels of IL-34 were significantly positively linked with RF levels
F I G U R E 3 Correlations between serum IL-34 levels and immunoglobulins and complements. A, IL-34 levels were positively associated with IgG and γ-G levels respectively. B and C, No significant association was observed between IL-34 levels and IgA, IgM, C3 or C4

378 | LIU et aL.
respectively). However, no correlation was observed between serum IL-34 levels and IgA, IgM, C3 or C4 (Figure 3B, 3).
According to a multivariate linear regression analysis, IgG was independently correlated with the serum levels of IL-34 in the pSS patients (ß = 0.308, P = .009).
3.3.3 | Correlations between IL-34 levels and inflammatory indicators in pSS patients
The relationships between IL-34 levels and ESR and CRP, were ana-lyzed in this study. However, no statistical significance was found in any group in correlation analysis (P > .05) (Figure 4).
3.3.4 | Correlations between serum levels of IL-34 and hematologic abnormal/ILD/arthritis involvements in pSS patients
Considering the characteristic of systemic involvement in pSS, which usually causes hematocytopenia in the blood system and ILD in the respiratory system, we estimated the relationships of serum IL-34 levels with them. Patients were divided into subgroups with/with-out leucopenia (<3.5 × 10⁹/L), thrombocytopenia (<125 × 109/L), autoimmune hemolytic anemia (AIHA) or ILD, and the number of patients in each group is shown in Table 1. The serum levels of IL-34 in pSS patients with leucopenia were lower than in patients without (101.1 ± 14.30 vs 224.2 ± 33.15 pg/mL), but it was not statistically significant (P = .0736) (Figure 5A). The differences in serum IL-34 levels between the thrombocytopenia group and the non-throm-bocytopenia group, the AIHA group and the non-AIHA group were compared in the same way, yet there was no statistically significant difference (P > .05, respectively) (Figure 5A).
In addition, patients with ILD had slightly higher IL-34 levels (218.51 ± 39.93 vs 183.51 ± 37.96 pg/mL) compared with pSS pa-tients without ILD, but the difference was not statistically significant (P > .05) (Figure 5B). Furthermore, we compared the IL-34 levels in pSS patients with and without arthritis. Interestingly, the pSS pa-tients with arthritis have higher levels of IL-34 compared with no-ar-thritis patients (326.5 ± 66.12 vs 156.0 ± 26.58 pg/mL, P = .0056) (Figure 5C).
4 | DISCUSSION
Although IL-34 mRNA has been demonstrated as overexpressed in the inflamed salivary glands of pSS patients, serum levels in the circulation of patients remain unknown. In our research, the serum levels of IL-34 were observed as significantly elevated in patients with pSS in contrast to the HCs. In addition, the anti-Ro/SSA posi-tive group of patients had higher IL-34 levels than the anti-Ro/SSA negative group; so did the anti-La/SSB positive group compared with negative group. What is more, the serum IL-34 levels were
associated with serum levels of RF, IgG and γ-G. These findings suggest that IL-34 may play a role in systemic immunoregulation mechanisms of pSS and may be involved in B cell activation and antibody production.
To our knowledge, IL-34 can promote the survival, prolifera-tion and differentiation of mononuclear phagocytic lineage cells, including monocytes, macrophages, dendritic cells, Langerhans cells, osteoclasts, Kupffer cells, and microglia, providing crucial foundation for the role of IL-34 in the process of immunoregu-lation in various disorders, including autoimmune diseases, in-flammation, cancers and so on.18 Our previous studies have demonstrated that serum IL-34 levels were significantly elevated in patients with RA as well as SLE, and the levels were associated with disease activity.12,15 In addition, a recent study showed that serum IL-34 levels in patients with SSc were significantly higher than in healthy subjects.16 In the current study, we found eleva-tion of serum IL-34 levels in pSS patients. In our study, IL-34 levels were significantly elevated in the sera of pSS patients, suggesting that IL-34 may play a role in the pathogenesis of pSS, and may not be limited to local inflammation in pSS.
As one of the vital immunological features of pSS, B cell hy-peractivity usually leads to production of several autoantibodies and hypergammaglobulinemia or high IgG levels.19 As relatively common autoantibodies in pSS, anti-Ro/SSA and anti-La/SSB an-tibodies and RF are a diagnostic criteria for the disease.17,20,21 It is shown that the pSS patients with anti-Ro/SSA antibody posi-tivity have lower salivary flow rate than those with anti-Ro/SSA antibody negativity, which may be due to the deposition of au-toantibodies in the salivary glands, mediating glandular damage together with some pro-inflammatory factors such as IL-1α.22 Anti-Ro/SSA and anti-La/SSB antibodies may also be associated with extra-glandular manifestations (splenomegaly, lymphade-nopathy, vasculitis, and Raynaud's phenomenon) in patients with pSS.23 Thus, both anti-Ro/SSA and anti-La/SSB antibodies play important roles in pSS. In addition, elevated RF levels and hyper-immunoglobulinemia are also common in serological examinations of pSS patients.5,23
In this research, we found that pSS patients with positivity of anti-Ro/SSA and anti-La/SSB antibody had higher serum levels of IL-34 than those who were anti-Ro/SSA and anti-La/SSB negative. Further, serum IL-34 levels were positively correlated with RF, IgG levels and the frequencies of γ-G. These results indicate IL-34 may be involved in the process of B cell activation in pSS, playing an im-portant role in production of antibodies in sera of patients. However, patients with pSS also often have abnormalities such as decreased complements and elevated inflammatory markers, this study did not find any correlation between these indicators (C3, C4, ESR, and CRP) and serum IL-34 levels in pSS.
Due to systemic involvement of pSS, patients can present with comprehensive manifestations. In the blood system, it may exhibit as leucopenia, thrombocytopenia or anemia, and in the respiratory system, ILD and pulmonary hypertension may occur. Studies have shown that IL-34 can promote the differentiation of monocytes

| 379LIU et aL.
into profibrotic macrophages,24 while profibrotic macrophages participate in the development of SSc-ILD.25 Kuzumi et al16 also showed a close relationship between IL-34 levels and incidence of SSc-ILD.
In this study, we analyzed the relationship between serum IL-34 levels and blood system involvement in patients with pSS, according to patients’ WBC count, PLT count and Hb concentration. However, differences in IL-34 levels between the 2 groups were not statisti-cally meaningful. Further, our results also did not show the correla-tion of IL-34 levels with ILD in pSS.
All in all, our results indicate that IL-34 may be involved in sys-temic immunoregulation of pSS, playing an important role in hyper-activation of B cells and production of multiple antibodies. Further studies may be needed to illustrate the specific mechanism of IL-34 on pSS.
ACKNOWLEDG EMENTSThis study was supported by funding from the National Natural Science Foundation of China (No. 81373219).
CONFLIC T OF INTERE S TAll authors have declared there exist no conflicts of interest.
AUTHOR CONTRIBUTIONSYanmei Liu designed the study and drafted the manuscript; Liping Xia, Jing Lu, and Hui Shen provided the research idea, gave key guid-ance and revised the manuscript; Yanmei Liu, Bei Zhang and Yimeng Lei collected samples and carried out the experiments; and Yanmei Liu and Hui Shen collected and analyzed the data. All authors read and approved the manuscript.
ORCIDYanmei Liu https://orcid.org/0000-0003-3071-906X Jing Lu https://orcid.org/0000-0003-3501-1749
R E FE R E N C E S 1. Voulgarelis M, Tzioufas AG. Pathogenetic mechanisms in the initi-
ation and perpetuation of Sjögren's syndrome. Nat Rev Rheumatol. 2010;6(9):529-537.
F I G U R E 4 Correlations between serum IL-34 levels and inflammatory indicators (ESR and CRP). Neither of them was statistical associated with the serum IL-34 levels
F I G U R E 5 Relationships between serum IL-34 levels and systemic involvements in pSS. A, Comparison of serum IL-34 levels in pSS patients with and without leucopenia, thrombocytopenia or AIHA. B, Comparison of serum IL-34 levels in pSS patients with and without ILD. C, Comparison of serum IL-34 levels in pSS patients with and without arthritis

380 | LIU et aL.
2. Rodrigues AR, Soares R. Inflammation in Sjögren's syndrome: Cause or consequence? Autoimmunity. 2017;50(3):141-150.
3. Jin JO, Yu Q. T cell-associated cytokines in the pathogenesis of Sjögren's syndrome. J Clin Cell Immunol. 2013;S!(9):11742.
4. Youinou P, Devauchelle-Pensec V, Pers JO. Significance of B cells and B cell clonality in Sjögren's syndrome. Arthritis Rheum. 2010;62(9):2605-2610.
5. Seror R, Ravaud P, Bowman SJ, et al. EULAR Sjögren's syndrome disease activity index: development of a consensus systemic dis-ease activity index for primary Sjögren's syndrome. Ann Rheum Dis. 2010;69(6):1103-1109.
6. Lin H, Lee E, Hestir K, et al. Discovery of a cytokine and its recep-tor by functional screening of the extracellular proteome. Science. 2008;320(5877):807-811.
7. Nandi S, Cioce M, Yeung YG, et al. Receptor-type protein-tyrosine phosphatase ζ is a functional receptor for interleukin-34. J Biol Chem. 2013;288(30):21972-21986.
8. Segaliny AI, Brion R, Mortier E, et al. Syndecan-1 regulates the biological activities of interleukin-34. Biochim Biophys Acta. 2015;1853(5):1010-1021.
9. Foucher ED, Blanchard S, Preisser L, et al. IL-34 induces the dif-ferentiation of human monocytes into immunosuppressive mac-rophages. antagonistic effects of GM-CSF and IFN. Antagonistic effects of GM-CSF and IFNgamma. PLoS ONE. 2013;8(2):e56045.
10. Ciccia F, Alessandro R, Rodolico V, et al. IL-34 is overexpressed in the inflamed salivary glands of patients with Sjogren's syn-drome and is associated with the local expansion of pro-in-flammatory CD14(bright)CD16+ monocytes. Rheumatology. 2013;52(6):1009-1017.
11. Guillonneau C, Bézie S, Anegon I. Immunoregulatory properties of the cytokine IL-34. Cell Mol Life Sci. 2017;74(14):2569-2586.
12. Tian Y, Shen H, Xia L, et al. Elevated serum and synovial fluid lev-els of interleukin-34 in rheumatoid arthritis: possible association with disease progression via interleukin-17 production. J Interferon Cytokine Res. 2013;33(7):398-401.
13. Moon SJ, Hong YS, Ju JH, et al. Increased levels of interleukin 34 in serum and synovial fluid are associated with rheumatoid factor and anticyclic citrullinated peptide antibody titers in patients with rheumatoid arthritis. J Rheumatol. 2013;40(11):1842-1849.
14. Wang H, Cao J, Lai X. Serum interleukin-34 levels are ele-vated in patients with systemic lupus erythematosus. Molecules. 2016;22(1):E35.
15. Xie HH, Shen H, Zhang L, et al. Elevated serum interleukin-34 level in patients with systemic lupus erythematosus is associated with disease activity. Sci Rep. 2018;8(1):3462.
16. Kuzumi A, Yoshizaki A, Toyama S, et al. Serum interleukin-34 levels in patients with systemic sclerosis: clinical association with intersti-tial lung disease. J Dermatol. 2018;45(10):1216-1220.
17. Vitali C, Bombardieri S, Jonsson R, et al. Classification criteria for Sjögren's syndrome: a revised version of the European criteria pro-posed by the American-European Consensus Group. Ann Rheum Dis. 2002;61(6):554-558.
18. Baghdadi M, Umeyama Y, Hama N, et al. Interleukin-34, a compre-hensive review. J Leukoc Biol. 2018;104(5):931-951.
19. Kroese FG, Abdulahad WH, Haacke E, et al. B-cell hyperac-tivity in primary Sjögren's syndrome. Expert Rev Clin Immunol. 2014;10(4):483-499.
20. Shiboski SC, Shiboski CH, Criswell LA, et al. American College of Rheumatology classification criteria for Sjögren's syndrome: a da-ta-driven, expert consensus approach in the Sjögren's International Collaborative Clinical Alliance cohort. Arthritis Care & Res. 2012;64(4):475-487.
21. Shiboski CH, Shiboski SC, Seror R, et al. 2016 American College of Rheumatology/European League Against Rheumatism classi-fication criteria for primary Sjögren's syndrome: a consensus and data-driven methodology involving three international patient co-horts. Ann Rheum Dis. 2017;76(1):9-16.
22. Wei P, Li C, Qiang L, et al. Role of salivary anti-SSA/B antibodies for diagnosing primary Sjögren's syndrome. Med Oral Patol Oral Cir Bucal. 2015;20(2):e156-e160.
23. Shen L, Suresh L. Autoantibodies, detection methods and panels for diagnosis of Sjögren's syndrome. Clin Immunol. 2017;182:24-29.
24. Preisser L, Miot C, Le Guillou-Guillemette H, et al. IL-34 and macrophage colony-stimulating factor are overexpressed in hep-atitis C virus fibrosis and induce profibrotic macrophages that promote collagen synthesis by hepatic stellate cells. Hepatology. 2014;60(6):1879-1890.
25. Prasse A, Pechkovsky DV, Toews GB, et al. CCL18 as an indicator of pulmonary fibrotic activity in idiopathic interstitial pneumonias and systemic sclerosis. Arthritis Rheum. 2007;56(5):1685-1693.
How to cite this article: Liu Y, Zhang B, Lei Y, Xia L, Lu J, Shen H. Serum levels of interleukin-34 and clinical correlation in patients with primary Sjögren's syndrome. Int J Rheum Dis. 2020;23:374–380. https ://doi.org/10.1111/1756-185X.13773

Int J Rheum Dis. 2020;23:381–391. wileyonlinelibrary.com/journal/apl | 381© 2019 Asia Pacific League of Associations for Rheumatology and John Wiley & Sons Australia, Ltd
Received: 1 June 2019 | Revised: 30 October 2019 | Accepted: 30 November 2019
DOI: 10.1111/1756-185X.13779
O R I G I N A L A R T I C L E
Quantitative analysis for modified Schall's classification by stimulation test with dynamic scintigraphy in Sjögren's syndrome
Guang-wen Zhu1 | Zhou Gao2 | Hong-bo Feng1 | Juan-juan Qiu3
Zhu and Gao are Co-first authors, contributed to this work equally.
1Department of Nuclear Medicine, The First Affiliated Hospital of Dalian Medical University, Dalian, China2Department of Nuclear Medicine, Peking University Shen Zhen Hospital, Shen Zhen, China3Central Laboratory, The First Affiliated Hospital of Dalian Medical University, Dalian, China
CorrespondenceGuang-wen Zhu, Department of Nuclear Medicine, The First Affiliated Hospital of Dalian Medical University, 222, Zhong Shan Road, Dalian, China.Email: [email protected]
AbstractObjectives: To update Schall's classification for Sjögren's syndrome (SS) by the new quantitative stimulation test with dynamic salivary glands scintigraphy (qsDSGS) and to standardize quantitative salivary gland scintigraphy.Methods: The histopathology, oral, ocular, serological examination and qsDSGS of 268 consecutive patients with suggestive SS were evaluated in this retrospective cohort study. The serological examination included 15 autoantibodies, antinuclear antibodies (ANA) and so on. The diagnostic thresholds of the functional parameters were set by the quantitative method, and the modified Schall's classification is well established and verified.Results: Based on the quantitative analysis of qsDSGS, the peak uptake level (PUL) and stimulation excretion fraction (sEF) of each parotid gland were determined as the key imaging features, which had good diagnostic performance for SS. By the modi-fied Schall's classification, all patients were classified into: Class 1 (normal; n = 44), Class 2 (mild to moderate involvement; n = 130), Class 3 (severe involvement; n = 56) and Class 4 (very severe involvement, non-function; n = 38). Using the threshold PUL ≤ 10 counts per sec/pixel as positivity, the modified Schall's classification could provide better diagnostic performance with 88.4% specificity, 71.3% sensitivity, 96.14% positive predictive value and 43.20% negative predictive value for SS (likeli-hood ratio 6.15). The trends of serologically positive frequencies against SSA/Ro, anti-SSB/La and ANA were significantly increased with the new classification.Conclusion: The modified Schall's classification by the new stimulation test with dy-namic scintigraphy is eligible to standardize quantitative salivary gland scintigraphy for SS, and may be more convenient and suitable in daily practice for clinical research and management of SS.
K E Y W O R D S
anti-SSA/Ro, anti-SSB/La, classification criteria, dynamic scintigraphy, quantitative, Sjögren's syndrome

382 | ZHU et al.
1 | INTRODUC TION
Sjögren's syndrome (SS) is one of the more common inflammatory autoimmune rheumatic diseases, characterized by lymphocytic in-filtration of the exocrine glands and epithelia cells at multiple sites, resulting in varying degrees of impairment of exocrine function and possible systemic multi-organ manifestations.1 SS can occur alone (primary SS, pSS) or in association with other autoimmune rheu-matic diseases (secondary SS, sSS). The global prevalence of pSS is 61 per 100 000 people, and the highest prevalence is in Europe; SS affects approximately 2-4 million individuals in the USA.2,3
In general, SS is associated with a high disease burden, in-creased healthcare costs, and a reduced quality of life through various manifestations of the disease. The main non-specific com-plaints of SS include fatigue and diffuse pain, which is the most painful symptom affecting a patient's quality of life and work adaptability.4,5
The involvement of lacrimal and salivary glands leads to typical features of xerophthalmia and xerostomia in SS. However, the sicca symptom is nonspecific, and as most other rheumatic diseases, there is no gold standard diagnostic test for SS. Therefore, the diagnosis of SS usually requires a multidisciplinary approach.
Over the last decades, the different classification criteria sets for SS have been suggested. To date, there are at least 14 classification/ diagnostic criteria sets for SS that have been en-dorsed by the European League Against Rheumatism (EULAR), American–European Consensus Group (AECG), American College of Rheumatology (ACR) or Japanese Ministry of Health, and pub-lished from 1965 to 2017.6-19
Although salivary scintigraphy has been noted as having low specificity for diagnosis of SS,18,20 the abnormal results of salivary scintigraphy were accepted by the 2002 AECG criteria, Japanese criteria (1999) or former versions as a criteria item for the diagno-sis of SS. However, it was no longer considered as a criteria item in the2012 ACR and recent 2016 ACR/EULAR criteria. All of the criteria accepted salivary scintigraphy as a criteria item for SS, and the positivity of salivary scintigraphy should be defined as delayed uptake, reduced concentration and/or delayed excretion of tracer, which is generally considered a standard interpretation proposed by Schall in 1971.21
The value and feasibility of the Schall's classification have been accepted.22,23 However, it is worth noting there were some short-comings of Schall's categorical classification, for example, qualitative and observer-dependent visually evaluated classification, sequential static image, non-stimulation study, old-style gamma γ camera sys-tem, and so on. Therefore, in this study, our goal was to develop a modified Schall's classification through a stimulation test with dy-namic scintigraphy, which can better identify and grade the salivary glands dysfunction by quantitative method with modern single pho-ton emission computed tomography (SPECT) or SPECT/CT systems for SS.
Meanwhile, we carefully verified whether there is correla-tion between the modified Schall's classification and the clinical
characteristics of SS patients, and comprehensively reviewed and analyzed the value of functional parameters of salivary scintigraphy for SS in the literature.
2 | METHODS
2.1 | Patient characteristics
In this retrospective cohort study, 268 consecutive patients (male/female ratio 28/240, mean age 56 years, standard deviation [SD] 13, range 23-86) with suggestive SS were enrolled between November 2015 and June 2017, referred to a single medical center (the First Affiliated Hospital of Dalian Medical University). The most common clinical symptom is xerostomia, and the criteria for diagnosis and ex-clusion of SS are based on the history, physical examinations, and 2016 ACR/EULAR criteria by the rheumatologist. Patients who have received immunosuppressive agents or other medical drugs in the past year that may result in reduced secretion of saliva and tears were excluded.
Finally, 126 patients with pSS, 89 patients with sSS, and 53 with non-SS were enrolled in this study. This study was approved by the ethics committee of the First Affiliated Hospital of Dalian Medical University. All subjects gave informed consent; and writ-ten informed consent for quantitative stimulation test with dy-namic salivary glands scintigraphy (qsDSGS) was obtained from all the patients. Fifteen autoantibodies, antinuclear antibodies (ANA), rheumatoid factor, anticyclic citrullinated peptide antibod-ies (anti-CCPs), minor salivary gland biopsy, Schirmer test, ocular staining, and so on were routinely examined for diagnosis (data not shown).
2.2 | qsDSGS
qsDSGS was performed by SPECT/CT (GE STARCAM 3200 or SIEMENS Symbia Intevo) with a 128 × 128 matrix, supine body position, and the patient's head was about 5 cm from the detector. A 30-min anterior sequential dynamic salivary gland study with 60 seconds per frame was carried out immediately after admin-istering 370 MBq intravenous pertechnetate; 20 minutes after injection, vitamin C tablets (400 mg) were administered orally as buccal tablet for stimulation (maintained in the mouth, not chew-ing). The patient could swallow saliva normally, and the patient's head position needed to remain stationary during the scintigraphic scan.
2.3 | Imaging analysis
After the examination was completed, regions of interest (ROI) were drawn manually around each of the parotid glands with 1 oval background ROI located over the chin for quantitative analysis. By

| 383ZHU et al.
computer assistance, time-activity curves (TAC) with background and decay correction over the parotid glands were automatically generated. The TAC of each parotid gland consists of two parts, the accumulation phase and the excretion phase. The following quanti-tative functional parameters for each parotid gland were calculated: peak uptake level (PUL) and stimulated excretion fraction (sEF) of each parotid gland.
Peak uptake level was defined as counts per s/pixel/MBq (cps/pixel) of each parotid gland at the peak of TAC; and sEF as the per-centage of reduction in concentration of each parotid gland after stimulation (maximum parotid count before stimulation − minimum parotid count after stimulation)/(maximum parotid count before stimulation − background count) × 100%. The reasons for using these two functional parameters for analysis are detailed in the dis-cussion section.
2.4 | Statistical analysis
To evaluate the qsDSGS diagnostic performance for SS, we assessed the specificity and sensitivity of the test using receiver operating characteristic (ROC) curve analysis. Statistical analysis was per-formed with MedCalc (version 11.4.2.0) to determine the optimal cut-off threshold of PUL and sEF for grading function impairment. Typically, on the ROC curve, the optimal cut-off value is the point nearest the upper left end of the curve. The Statistical Package for the Social Sciences version 21 (SPSS, version 21) was implemented for the remaining statistical procedures. Quantitative variables are described as mean (SD) and qualitative variables are described as
quantity (%). The linear-by-linear association analysis of Chi-square tests for Cochran-Armitage trend was employed for comparison between dichotomous variables and the scintigraphy class vari-able. The Pearson Chi-square test or one-way analysis of variance (ANOVA) test was used for the analysis of difference between vari-ous variables. A 2-sided P value less than .05 was considered to be statistically significant.
3 | RESULTS
3.1 | Quantitative analysis of salivary function
One hundred and ninety-one patients with sEF = 100% underwent a PUL ROC curve study for SS (Figure 1A). Our results showed that the optimal cut-off threshold > 17 cps/pixel was close to the optimal threshold with 90.2% sensitivity, 75.4% specificity, 93.69% positive predictive value (PPV) and 65.51% negative predictive value (NPV) (likelihood ratio [LR] 3.66) for the diagnosis of SS.
According to Schall's classification, the threshold points of cut-off value for Classes 1-4 were found to be determined at the PUL of 0, 10, 24 cps/pixel and sEF of 54%.
Using the threshold > 24 cps/pixel (Figure 1A point Y) as the cut-off value of Class 1, 97.5% sensitivity, 52.2% specificity, 89.23% PPV and 83.75% NPV (LR 2.04) were found; this means that 52.2% of actual non-SS are correctly identified. Thus, the value of PUL greater than 24 was acceptable as a normal result.
Using the threshold ≤ 10 cps/pixel (Figure 1A point X) as the cut-off value of positivity of Class 3, the test gained 71.3% sensitivity,
F I G U R E 1 The receiver operating characteristic (ROC) curve of peak uptake level (PUL). A, point X, the cut-off threshold = 10 counts per s (cps)/pixel; point Y, the cut-off threshold = 24 cps/pixel (this group included 191 patients, male/female ratio 20/171; mean age 56 years, SD 13, range 23-86; 91 primary Sjögren's syndrome [pSS], 67 secondary SS [sSS], 33 non-SS) (area under the curve [AUC] 0.891, 95% CI: 0.838-0.931) The ROC curve of stimulated excretion fraction (sEF). B, point Z, the optimal cut-off threshold = 54% (this group included 77 patients, male/female ratio 8/69,mean age 57 years, SD 13, range 25-83, 35 pSS, 22 sSS, 20 non-SS) (AUC 0.880, 95% CI: 0.786-0.943)

384 | ZHU et al.
88.4% specificity, 96.14% PPV and 43.20% NPV (LR 6.15). Using the threshold 0 cps/pixel as the cut-off value of Class 4, 29.5% sensitiv-ity, 97.1% specificity, 97.63% PPV and 25.38% NPV (LR 10.18) were found.
The sEF ROC curve for SS was performed in 77 patients with abnormal excretion function. The optimal cut-off threshold < 54% (Figure 1B point Z) was close to the optimal threshold with 86.5% sensitivity, 82.5% specificity, 93.37% PPV and 68.19% NPV (LR 4.94) for the diagnosis of SS.
3.2 | Modified SCHALL'S classification and grading salivary gland function by qsDSGS
Based on the functional pattern of pertechnetate uptake, concentra-tion, and excretion after stimulation, all the suggestive SS patients were grouped into 1 of 4 modified Schall's classification by qsDSGS results (Figures 2-4).
Class 1: normal results, with rapid uptake of pertechnetate by salivary glands, the radioactivity in the glands prompted excretion into the oral cavity after stimulation; results were PUL > 24 cps/pixel, the sEF ≥ 54%, with 97.5% sensitivity, 52.2% specificity, 89.23% PPV and 83.75% NPV (Figure 2A).
Class 2: mild to moderate involvement, with reduced level of concentration: PUL > 10 but ≤ 24 cps/pixel (Figure 2B); or the PUL > 24 cps/pixel, but in the non-excretion phase, the sEF curve showed a continuous upward pattern or sEF < 54%, with 86.5% sensitivity, 82.5% specificity, 93.37% PPV and 68.19% NPV (Figure 3A,B).
Class 3: severe involvement, with markedly diminished concen-tration, with or without excretion phase; PUL ≤ 10 cps/pixel, with 71.3% sensitivity, 88.4% specificity, 96.14% PPV and 43.20% NPV for SS (Figure 4A).
Class 4: non-function, complete absence of radioactive concen-tration, glandular activity was no more than the background, no re-sponse to stimulation, the sEF curve was a straight line, with 29.5% sensitivity, 97.1% specificity, 97.63% PPV and 25.38% NPV for SS (Figure 4B).
3.3 | Differences and trends between qsDSGS classification and the clinical characteristics
The differences and trends between the clinical characteristic and qsDSGS classification are summarized in Table 1. C1 consisted of Class 1; C2 consisted of Class 2. Due to using Class 3 of modified Schall's classification as the positive cut-off, Class 3 merged with Class 4 into C3 for data analysis.
In this paper, anti-SSA stands for anti-Ro60. We found that some patients with only positive anti-Ro52 or anti-SSB were also asso-ciated with damage to salivary gland function, so we also selected patient groups with independent positive anti-Ro52 or anti-SSB for analysis. The linear-by-linear association test was used to verify
the existence of the related trends between qsDSGS classification and the clinical characteristic. In the C1-C3 groups, the trends of serologically positive frequencies against anti-SSA/Ro (36.4% vs 44.6% vs 72.3%; P < .01), anti-SSB/La (9.1% vs 13.1% vs 39.4%; P < .01), anti-Ro-52/Ro (56.8% vs 63.1% vs 81.9%; P < .01), ANA (52.3% vs 70.8% vs 94.7%; P < .01) were significantly increased with the qsDSGS classification; and the same trend also occurred in the percentage of women and the incidence of sicca symptoms among groups. Furthermore, the results of Pearson Chi-square test con-firmed that there were significant differences in the above indicators in the C1-C3 groups (P < .01).
There was no difference in age distribution between each of the C1-C3 groups (P = .366); however, there was a significant difference in symptom duration (P < .01) by one-way ANOVA.
4 | DISCUSSION
Sjögren's syndrome is a chronic autoimmune exocrine gland disease, in particular invading salivary and lacrimal glands marked by diffuse lymphocytic infiltration.24 The objective evidence of salivary gland involvement is defined by a positive result for labial salivary gland bi-opsies, scintigraphy or contrast sialography. Thereinto, salivary scin-tigraphy is the only noninvasive method, and its diagnostic role in SS patients has been studied for years; several approaches have been proposed.23 However, among a variety of proposed scintigraphic parameters, there is little consensus about which one is the most reliable and suitable for SS diagnosis.
The published papers so far on the correlation between different scintigraphic parameters and the severity of SS are listed in Table 2.
In addition to four representative papers that rely on visual analysis, other 9 papers on quantitative or semi-quantitative sali-vary gland scintigraphy are interpreted in this table. The usual in-dicator for semi-quantitative analysis is the target-to-background ratio from the ROI counts in sequential static images; while in quantitative salivary scintigraphy, the TAC for each major salivary gland can provide both the accumulation parameters and the se-cretion parameters for functional analysis. Among them, there are several aspects that need attention and consideration regarding the selection of methods and analysis of results for quantitative saliva scintillation scanning.
The quantitative parameters proposed by Umehara et al25 were published and had an impact on subsequent research. Unfortunately, we found that the shoulders of our cases in the formula for “Maximum accumulation” were unclear, and the value of “a” was zero at 1 min-ute in clinical practice; Dugonjić et al modified the vascular perfusion peak at 4 minutes.26
The quantitative oral activity index proposed by Aung et al to-gether with certain gland parameters was sufficiently sensitive to distinguish the severity of SS disease.27 However, the spontaneous secretion and swallowing of the saliva during the acquisition period of 40-50 minutes due to individual differences had an unpredictable effect on the results.

| 385ZHU et al.
Due to non-specificity, the results of SGS may be abnormal in all diseases that can cause impaired salivary gland function. A very spe-cial non-SS control group was adopted by Nadal et al including radia-tion-induced xerostomia, sarcoidosis, and so on, which did not meet the ACR/EULAR exclusion criteria in SS, and ultimately confirmed
that the accuracy of functional scintigraphic indices for the diagnosis of SS among patients with xerostomia was low.28
Since asymmetric impairment of bilateral symmetrical organs in-cluding the brain, eyes, ears, thyroid, salivary glands, lungs and kid-neys can occur in autoimmune diseases, that is, autoimmune inner
F I G U R E 2 A 30-min anterior sequential dynamic salivary glands scintigraphy with stimulation test. The modified Schall's classification by quantitative stimulation test with dynamic salivary glands scintigraphy (qsDSGS). Class 1: each parotid gland with rapid uptake of pertechnetate, the peak uptake level (PUL) >24 counts per s (cps)/pixel, the of stimulated excretion fraction (sEF) was 100% (A). (This group included 44 patients, male/female ratio 8/36; mean age 59 years, SD 20, range 23-79). Class 2: each parotid gland with slightly reduced level of concentration, the PUL was 15 cps/pixel; the sEF was 100% (B). (This group included 53 patients, male/female ratio 8/45; mean age 57 years, SD 14, range 25-86)

386 | ZHU et al.
ear disease with bilateral, asymmetric, progressive hearing loss; multiple sclerosis with asymmetric abnormal MRI signal in the spinal cord29 and asymmetric hand atrophy; it was unacceptable that the data were analyzed using the mean of bilateral salivary glands for ac-curacy purposes, and the unilateral preferential involvement of sali-vary glands was more sensitive to the diagnosis of SS as a conclusion in some papers. However, these results also indicated that both the
uptake and secretory function of the bilateral salivary glands were involved.30
In addition, the parotid gland is recognized as the most im-portant SS target organ, and parotid gland contrast parotidogra-phy is considered as the gold standard for the diagnosis of SS. It may be of little significance that submandibulars are prefer-entially involved above the parotid. In this study, we found that
F I G U R E 3 Class 2: the peak uptake level (PUL) of each parotid gland was normal, but without excretion phase, the curve showed continuous upward pattern, the stimulated excretion fraction (sEF) was 0% (A); or with excretion phase, but the sEF was only 42% (B). (This sEF abnormal group included 77 patients, male/female ratio 8/69; mean age 57 years, SD 13, range 25-83)

| 387ZHU et al.
the results were parallel between the submandibular and parotid glands (data not listed).
Based on the above analysis, in SS, accumulation and secretion parameters were abnormal in most published papers. In the uptake phase, corresponding to the accumulation of the tracer by the glan-dular parenchyma, and in the excretion phase, corresponding to the
tracer elimination after stimulus, provides information on the overall functional integrity of the salivary system. Thus, only the PUL and sEF of each parotid gland were enrolled in our research for func-tional analysis. Moreover, the PUL and sEF were generated automat-ically with background and decay correction by modern SPECT/CT systems; the results were reliable and reproducible to support sound
F I G U R E 4 Class 3: each parotid gland with markedly diminished concentration, the peak uptake level (PUL) ≤10 counts per s (cps)/pixel (A). (This group included 56 patients, male/female ratio 3/53; mean age 54 years, SD 13, range 25-83). Class 4: each parotid gland with complete absence of radioactive concentration, no response to stimulus (B). (This group included 38 patients, male/ female ratio 1/37; mean age 59 years, SD 11, range 33-79)

388 | ZHU et al.
physician decision-making and provided convenience information in clinical practice.
It took about 60-80 minutes to complete the SGS with Schall's method,21 so we modified the examination procedures: we short-ened the examination time to 30 minutes; we used vitamin C tablets as stimulus at 20 minutes. Vitamin C tablets can provide longer last-ing stimulation than lemon juice or orange juice.
For imaging analysis, each parotid gland was classified separately, and only the minimum gland value was finally taken into account. First, according to Schall's categorical classification, the results of qsDSGS were graded from Class 1 to Class 4, and the representative images are shown in Figures 2-4. The images and curves were sim-ilar to all our results in Classes 1-4, especially the curve patterns of “continuous upward” and “straight line” as we have proposed, can be found in previous articles.31-33
Second, the ROC analysis showed that the ROC curve area under the curve for PUL and sEF was 0.891 and 0.880, respectively. This result indicated that these two indicators were the key imaging characteristics with good diagnostic performance for SS in qsDSGS.
Furthermore, the results of Classes 1-4 of Schall's classification were quantitatively analyzed. Using Schall's classification grade 3 as the cut-off of positivity, the PUL threshold was ≤ 10 cps/pixel, and with 71.3% sensitivity, 88.4% specificity, 96.14% PPV and 43.20% NPV for SS (LR 6.15). This diagnostic performance of qsDSGS is higher than ultrasound (75.3% sensitivity and 83.5% specificity, LR 4.58) in detecting SS.34
In this study, the highest specificity of 97.1% (29.5% sensitivity, 97.63% PPV 25.38% NPV) for SS was found in Class 4; the thresh-old of PUL = 0, the sEF curve was a straight line, and the gland ac-tivity was no more than the background level, with no response to stimulation, accounted for 14.2% of cases (38/268). It is notewor-thy that the Schall's Class 4 group with complete absence of active concentration was not included in the 2002 American–European classification criteria as a positive standard. The Class 2 patients with mild to moderate involvement, who cannot meet 2016 ACR/ EULAR criteria, may be in preclinical status of SS. However, the diagnosis of SS cannot rely solely on the result of qsDSGS, but ACR/EULAR criteria.
Finally, we verified that the trends of serologically positive fre-quencies against SSA/Ro, anti-SSB/La and ANA were significantly increased with the new modified Schall's classification. In the com-bined group of Class 3 and Class 4, the frequency of any 1 positivity in anti-SSA/Ro, anti-Ro-52/Ro, anti-SSB/La was up to 90.4%. Since the seropositivity for anti-Ro and anti-La is associated with greater severity and longer duration of disease, and play an imperative role in the pathogenesis of SS,35 the classification of salivary gland func-tion by our qsDSGS was also consistent with the characteristics of SS as an autoimmune disease. Therefore, from another perspective, the positivity of anti-SSA/Ro, anti-Ro-52/Ro or anti-SSB/La is a highly sensitive diagnostic indicator in SS. In brief, the trends with a change of sensitivity and specificity for SS by qsDSGS classification maybe helpful for daily practice.
VariableOverall(N = 268)
C1(n = 44)
C2(n = 130)
C3(n = 94) PC PT
Age, mean (SD), y
56 (12.8) 54 (13.0) 57 (12.9) 56 (12.2) .366* —
Female, n (%) 241 (89.9) 36 (81.8) 114 (87.7) 91 (96.8) .012 .003
Symptom dura-tion, y
4.0 (6.0) 1.7 (3.2) 3.4 (5.6) 5.9 (7.0) .000* —
Sicca symptoms, n (%)
233 (86.9) 28 (63.6) 101 (77.7) 84 (89.4) .002 .000
Anti-SSA posi-tivity, n (%)
142 (53.0) 16 (36.4) 58 (44.6) 68 (72.3) .000 .000
Anti-SSB posi-tivity, n (%)
60 (22.4) 4 (9.1) 17 (13.1) 39 (39.4) .000 .000
Anti-Ro-52 positivity, n (%)
184 (68.7) 25 (56.8) 82 (63.1) 77 (81.9) .002 .001
SSA, SSB, Ro-52,a n (%)
203 (75.7) 27 (61.4) 91 (70.0) 85 (90.4) .000 .000
ANA ≥ 1:320, n (%)
204 (76.1) 23 (52.3) 92 (70.8) 89 (94.7) .000 .000
Abbreviations: C1, qsDSGS Class 1; C2, qsDSGS Class2; C3, qsDSGS Classes 3-4; PC, the P value of Chi-square test; PT, the P value of trend tests; qsDSGS, quantitative stimulation test with dynamic salivary glands scintigraphy.aAnti-SSA, SSB, Ro-52 refers to any one positivity; the Linear-by-Linear Association analysis for trend tests; the Pearson Chi-square test for difference analysis in qualitative variables; the one-way analysis of variance test for quantitative variables analysis. *P value of one-way analysis of variance.
TA B L E 1 Differences and trends between the clinical characteristic and qsDSGS classification
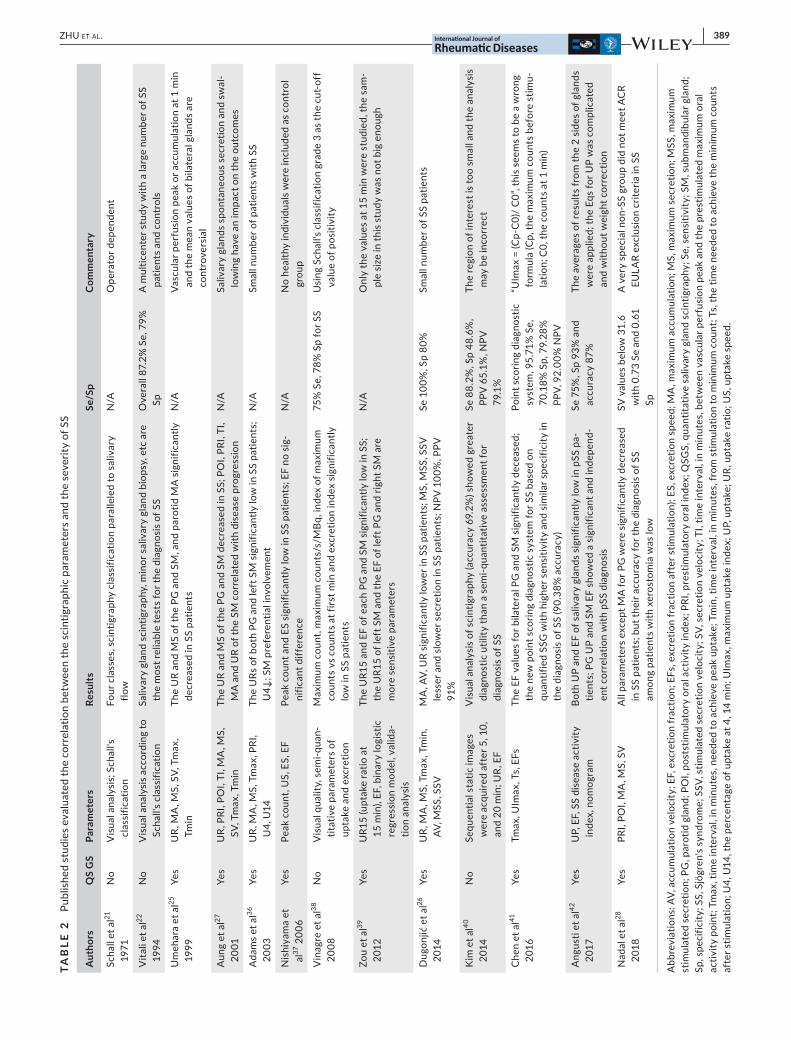
| 389ZHU et al.
TAB
LE 2
Pu
blis
hed
stud
ies
eval
uate
d th
e co
rrel
atio
n be
twee
n th
e sc
intig
raph
ic p
aram
eter
s an
d th
e se
verit
y of
SS
Aut
hors
QS
GS
Para
met
ers
Resu
ltsSe
/Sp
Com
men
tary
Scha
ll et
al21
19
71N
oV
isua
l ana
lysi
s; S
chal
l's
clas
sific
atio
nFo
ur c
lass
es, s
cint
igra
phy
clas
sific
atio
n pa
ralle
led
to s
aliv
ary
flow
N/A
Ope
rato
r dep
ende
nt
Vita
li et
al22
19
94N
oV
isua
l ana
lysi
s ac
cord
ing
to
Scha
ll's
clas
sific
atio
nSa
livar
y gl
and
scin
tigra
phy,
min
or s
aliv
ary
glan
d bi
opsy
, etc
are
th
e m
ost r
elia
ble
test
s fo
r the
dia
gnos
is o
f SS
Ove
rall
87.2
% S
e, 7
9%
SpA
mul
ticen
ter s
tudy
with
a la
rge
num
ber o
f SS
patie
nts
and
cont
rols
Um
ehar
a et
al25
19
99Ye
sU
R, M
A, M
S, S
V, T
max
, Tm
inTh
e U
R an
d M
S of
the
PG a
nd S
M, a
nd p
arot
id M
A s
igni
fican
tly
decr
ease
d in
SS
patie
nts
N/A
Vasc
ular
per
fusi
on p
eak
or a
ccum
ulat
ion
at 1
min
an
d th
e m
ean
valu
es o
f bila
tera
l gla
nds
are
cont
rove
rsia
l
Aun
g et
al27
20
01Ye
sU
R, P
RI, P
OI,
TI, M
A, M
S,
SV, T
max
, Tm
inTh
e U
R an
d M
S of
the
PG a
nd S
M d
ecre
ased
in S
S; P
OI,
PRI,
TI,
MA
and
UR
of th
e SM
cor
rela
ted
with
dis
ease
pro
gres
sion
N/A
Saliv
ary
glan
ds s
pont
aneo
us s
ecre
tion
and
swal
-lo
win
g ha
ve a
n im
pact
on
the
outc
omes
Ada
ms
et a
l36
2003
Yes
UR,
MA
, MS,
Tm
ax, P
RI,
U4,
U14
The
URs
of b
oth
PG a
nd le
ft S
M s
igni
fican
tly lo
w in
SS
patie
nts;
U
4↓; S
M p
refe
rent
ial i
nvol
vem
ent
N/A
Smal
l num
ber o
f pat
ient
s w
ith S
S
Nis
hiya
ma
et
al37
200
6Ye
sPe
ak c
ount
, US,
ES,
EF
Peak
cou
nt a
nd E
S si
gnifi
cant
ly lo
w in
SS
patie
nts;
EF
no s
ig-
nific
ant d
iffer
ence
N/A
No
heal
thy
indi
vidu
als
wer
e in
clud
ed a
s co
ntro
l gr
oup
Vin
agre
et a
l38
2008
No
Vis
ual q
ualit
y, s
emi-q
uan-
titat
ive
para
met
ers
of
upta
ke a
nd e
xcre
tion
Max
imum
cou
nt, m
axim
um c
ount
s/s/
MBq
, ind
ex o
f max
imum
co
unts
vs
coun
ts a
t firs
t min
and
exc
retio
n in
dex
sign
ifica
ntly
lo
w in
SS
patie
nts
75%
Se,
78%
Sp
for S
SU
sing
Sch
all's
cla
ssifi
catio
n gr
ade
3 as
the
cut-
off
valu
e of
pos
itivi
ty
Zou
et a
l39
2012
Yes
UR1
5 (u
ptak
e ra
tio a
t 15
min
), EF
, bin
ary
logi
stic
re
gres
sion
mod
el, v
alid
a-tio
n an
alys
is
The
UR1
5 an
d EF
of e
ach
PG a
nd S
M s
igni
fican
tly lo
w in
SS;
th
e U
R15
of le
ft S
M a
nd th
e EF
of l
eft P
G a
nd ri
ght S
M a
re
mor
e se
nsiti
ve p
aram
eter
s
N/A
Onl
y th
e va
lues
at 1
5 m
in w
ere
stud
ied,
the
sam
-pl
e si
ze in
this
stu
dy w
as n
ot b
ig e
noug
h
Dug
onjić
et a
l26
2014
Yes
UR,
MA
, MS,
Tm
ax, T
min
, AV
, MSS
, SSV
MA
, AV,
UR
sign
ifica
ntly
low
er in
SS
patie
nts;
MS,
MSS
, SSV
le
sser
and
slo
wer
sec
retio
n in
SS
patie
nts;
NPV
100
%, P
PV
91%
Se 1
00%
, Sp
80%
Smal
l num
ber o
f SS
patie
nts
Kim
et a
l40
2014
No
Sequ
entia
l sta
tic im
ages
w
ere
acqu
ired
afte
r 5, 1
0,
and
20 m
in; U
R, E
F
Vis
ual a
naly
sis
of s
cint
igra
phy
(acc
urac
y 69
.2%
) sho
wed
gre
ater
di
agno
stic
util
ity th
an a
sem
i-qua
ntita
tive
asse
ssm
ent f
or
diag
nosi
s of
SS
Se 8
8.2%
, Sp
48.6
%,
PPV
65.
1%, N
PV
79.1
%
The
regi
on o
f int
eres
t is
too
smal
l and
the
anal
ysis
m
ay b
e in
corr
ect
Che
n et
al41
20
16Ye
sTm
ax, U
Imax
, Ts,
EFs
The
EF v
alue
s fo
r bila
tera
l PG
and
SM
sig
nific
antly
dec
ease
d;
the
new
poi
nt s
corin
g di
agno
stic
sys
tem
for S
S ba
sed
on
quan
tifie
d SS
G w
ith h
ighe
r sen
sitiv
ity a
nd s
imila
r spe
cific
ity in
th
e di
agno
sis
of S
S (9
0.38
% a
ccur
acy)
Poin
t sco
ring
diag
nost
ic
syst
em, 9
5.71
% S
e,
70.1
8% S
p, 7
9.28
%
PPV,
92.
00%
NPV
“UIm
ax =
(Cp-
C0)
/ C
0”, t
his
seem
s to
be
a w
rong
fo
rmul
a (C
p, th
e m
axim
um c
ount
s be
fore
stim
u-la
tion;
C0,
the
coun
ts a
t 1 m
in)
Ang
usti
et a
l42
2017
Yes
UP,
EF,
SS
dise
ase
activ
ity
inde
x, n
omog
ram
Both
UP
and
EF o
f sal
ivar
y gl
ands
sig
nific
antly
low
in p
SS p
a-tie
nts;
PG
UP
and
SM E
F sh
owed
a s
igni
fican
t and
inde
pend
-en
t cor
rela
tion
with
pSS
dia
gnos
is
Se 7
5%, S
p 93
% a
nd
accu
racy
87%
The
aver
ages
of r
esul
ts fr
om th
e 2
side
s of
gla
nds
wer
e ap
plie
d; th
e Eq
s fo
r UP
was
com
plic
ated
an
d w
ithou
t wei
ght c
orre
ctio
n
Nad
al e
t al28
20
18Ye
sPR
I, PO
I, M
A, M
S, S
VA
ll pa
ram
eter
s ex
cept
MA
for P
G w
ere
sign
ifica
ntly
dec
reas
ed
in S
S pa
tient
s; b
ut th
eir a
ccur
acy
for t
he d
iagn
osis
of S
S am
ong
patie
nts
with
xer
osto
mia
was
low
SV v
alue
s be
low
31.
6 w
ith 0
.73
Se a
nd 0
.61
Sp
A v
ery
spec
ial n
on-S
S gr
oup
did
not m
eet A
CR
EULA
R ex
clus
ion
crite
ria in
SS
Abb
revi
atio
ns: A
V, a
ccum
ulat
ion
velo
city
; EF,
exc
retio
n fr
actio
n; E
Fs, e
xcre
tion
frac
tion
afte
r stim
ulat
ion)
; ES,
exc
retio
n sp
eed;
MA
, max
imum
acc
umul
atio
n; M
S, m
axim
um s
ecre
tion;
MSS
, max
imum
st
imul
ated
sec
retio
n; P
G, p
arot
id g
land
; PO
I, po
stst
imul
ator
y or
al a
ctiv
ity in
dex;
PRI
, pre
stim
ulat
ory
oral
inde
x; Q
SGS,
qua
ntita
tive
saliv
ary
glan
d sc
intig
raph
y; S
e, s
ensi
tivity
; SM
, sub
man
dibu
lar g
land
; Sp
, spe
cific
ity; S
S, S
jögr
en's
synd
rom
e; S
SV, s
timul
ated
sec
retio
n ve
loci
ty; S
V, s
ecre
tion
velo
city
; TI,
time
inte
rval
, in
min
utes
, bet
wee
n va
scul
ar p
erfu
sion
pea
k an
d th
e pr
estim
ulat
ed m
axim
um o
ral
activ
ity p
oint
; Tm
ax, t
ime
inte
rval
, in
min
utes
, nee
ded
to a
chie
ve p
eak
upta
ke; T
min
, tim
e in
terv
al, i
n m
inut
es, f
rom
stim
ulat
ion
to m
inim
um c
ount
; Ts,
the
time
need
ed to
ach
ieve
the
min
imum
cou
nts
afte
r stim
ulat
ion;
U4,
U14
, the
per
cent
age
of u
ptak
e at
4, 1
4 m
in; U
Imax
, max
imum
upt
ake
inde
x; U
P, u
ptak
e; U
R, u
ptak
e ra
tio; U
S, u
ptak
e sp
eed.

390 | ZHU et al.
The qsDSGS dynamic imaging with only 370 MBq pertechne-tate by modern SPECT or SPECT/CT systems is convenient, non-invasive, radiation dose safe, not expensive and eligible for daily practice in management of SS. Although the qsDSGS system with eligibility for objective assessment salivary gland function is full of controversy to be involved in future AECG or ACR/EULAR criteria, future work may address the contribution of the qsDSGS system toward classification criteria for SS. Up to now, to our knowledge, this is the first article on the quantitative analysis for modified Schall's classification by stimulation test with dynamic scintigra-phy in SS.
4.1 | Limitations
The limitations of this study included single-center data, the lack of a normal control group for determining the normal boundary values and non-absolute quantification, and so on. Although images and curves similar to all our results for Classes 1-4 can be found in previ-ous articles, the clinical value of the curves pattern of “continuous upward” and “straight line” we proposed, needs to be further clari-fied. The sample size should be increased to reduce the selection bias in further studies.
5 | CONCLUSION
The modified Schall's classification by the new stimulation test with dynamic scintigraphy is eligible to standardize quantitative salivary gland scintigraphy for diagnosing SS, and may be more convenient and suitable in daily practice for clinical research and management of SS.
ACKNOWLEDG EMENTSThe authors thank the team of the Department of Rheumatology, the First Affiliated Hospital of Dalian Medical University for their excellent expertise and care of the patients.
CONFLIC TS OF INTERE S TNone to declare.
AUTHORS' CONTRIBUTIONSDr Guang-wen Zhu (PhD) contributed to designing, undertaking experiments, analyzing results and writing of the manuscript; Dr Zhou Gao (MD) contributed to designing, analyzing results and revision of the manuscript. We are indebted to Ms Juan-juan Qiu (PhD) for assistance with the statistical analysis; to Mr Hong-bo Feng (MD) for data acquisition and processing and assistance with data collection.
ORCIDGuang-wen Zhu https://orcid.org/0000-0003-1338-0367
R E FE R E N C E S 1. Price EJ, Rauz S, Tappuni AR, et al. The British Society for
Rheumatology guideline for the management of adults with primary Sjögren's Syndrome. Rheumatology (Oxford). 2017;56:1643-1647.
2. Qin B, Wang J, Yang Z, et al. Epidemiology of primary Sjögren's syndrome: a systematic review and meta-analysis. Ann Rheum Dis. 2015;74:1983-1989.
3. Fox PC. Autoimmune diseases and Sjögren's syndrome: an autoim-mune exocrineopathy. Ann NY Acad Sci. 2007;1098:15-21.
4. Vivino FB, Carsons SE, Foulks G, et al. New treatment guidelines for Sjögren's Disease. Rheum Dis Clin North Am. 2016;42:531-551.
5. Westhoff G, Dörner T, Zink A. Fatigue and depression predict phy-sician visits and work disability in women with primary Sjögren's syndrome: results from a cohort study. Rheumatology (Oxford). 2012;51:262-269.
6. Bloch KJ, Buchanan WW, Wohl MJ, Bunim JJ. Sjögren's syndrome: a clinical, pathological, and serological study of sixty-two cases. Medicine (Baltimore). 1965;44:187-231.
7. Sheam MA. Sjögren's syndrome. In: Smith LH Jr, eds. Major Problems in Internal Medicine, vol. 2. Philadelphia: WB Saunders Company; 1971.
8. Daniels TE, Silverman S Jr, Michalski JP, Greenspan JS, Sylvester RA, Talal N. The oral component of Sjögren's syndrome. Oral Surg Oral Med Oral Pathol. 1975;39:875-885.
9. Ohfuji T. Review on research reports. Annual report of the ministry of Health and Welfare: Sjögren's disease Research Committee, Japan; 1977.
10. Manthorpe R, Frost-Larsen K, Isager H, Prause JU. Sjögren's syn-drome: a review with emphasis on immunological features. Allergy. 1981;36:139-153.
11. Manthorpe R, Oxholm P, Prause JU, Schiödt M. The Copenhagen criteria for Sjögren's syndrome. Scand J Rheumatol Suppl. 1986;61:19-21.
12. Homma M, Tojo T, Akizuki M, Yamagata H. Criteria for Sjögren's syndrome in Japan. Scand J Rheumatol Suppl. 1986;61:26-27.
13. Skopouli FN, Drosos AA, Papaioannou T, Moutsopoulos HM. Preliminary diagnostic criteria for Sjögren's syndrome. Scand J Rheumatol Suppl. 1986;61:22-25.
14. Fox RI, Robinson CA, Curd JG, Kozin F, Howell FV. Sjögren's syndrome: proposed criteria for classification. Arthritis Rheum. 1986;29:577-585.
15. Vitali C, Bombardieri S, Moutsopoulos HM, et al. Preliminary cri-teria for the classification of Sjögren's syndrome: results of a pro-spective concerted action supported by the European Community. Arthritis Rheum. 1993;36:340-347.
16. Fujibayashi T, Sugai S, Miyasaka N, Hayashi Y, Tsubota K. Revised Japanese criteria for Sjögren's syndrome (1999): availability and va-lidity. Mod Rheumatol. 2004;14:425-434.
17. Vitali C, Bombardieri S, Jonsson R, et al. Classification criteria for Sjögren's syndrome: a revised version of the European criteria pro-posed by the American-European Consensus Group. Ann Rheum Dis. 2002;61:554-558.
18. Shiboski SC, Shiboski CH, Criswell LA, et al. American College of Rheumatology classification criteria for Sjögren's syndrome: a da-ta-driven, expert consensus approach in the Sjögren's International Collaborative Clinical Alliance cohort. Arthritis Care Res (Hoboken). 2012;64:475-487.
19. Shiboski CH, Shiboski SC, Seror R, et al. 2016 American College of Rheumatology/European League Against Rheumatism Classification Criteria for Primary Sjögren's Syndrome: A Consensus and Data-Driven Methodology Involving Three International Patient Cohorts. Arthritis Rheumatol. 2017;69:35-45.
20. Bootsma H, Spijkervet FK, Kroese FG, Vissink A. Toward new classifi-cation criteria for Sjögren's syndrome? Arthritis Rheum. 2013;65:21-23.

| 391ZHU et al.
21. Schall GL, Anderson LG, Wolf RO, et al. Xerostomia in Sjögren's syndrome: evaluation by sequential scintigraphy. JAMA. 1971;216: 2109-2116.
22. Vitali C, Moutsopoulos H, Bombardieri S. The European Community Study Group on diagnostic criteria for Sjögren's syndrome: sen-sitivity and specificity of tests for ocular and oral involvement in Sjögren's syndrome. Ann Rheum Dis. 1994;53:637-647.
23. Vinagre F, Santos MJ, Prata A, da Silva JC, Santos AI. Assessment of salivary gland function in Sjögren's syndrome: the role of salivary gland scintigraphy. Autoimmun Rev. 2009;8:672-676.
24. Gao H, Zou Y, Zhang X, et al. Interstitial lung disease in non-sicca onset primary Sjögren's syndrome: a large-scale case-control study. Int J Rheum Dis. 2018;21:1423-1429.
25. Umehara I, Yamada I, Murata Y, Takahashi Y, Okada N, Shibuya H. Quantitative evaluation of salivary gland scintigraphy in Sjörgen's syndrome. J Nucl Med. 1999;40:64-69.
26. Dugonjić S, Stefanović D, Ethurović B, Spasić-Jokić V, Ajdinović B. Evaluation of diagnostic parameters from parotid and submandibu-lar dynamic salivary glands scintigraphy and unstimulated sialome-try in Sjögren's syndrome. Hell J Nucl Med. 2014;17:116-122.
27. Aung W, Murata Y, Ishida R, Takahashi Y, Okada N, Shibuya H. Study of quantitative oral radioactivity in salivary gland scintigra-phy and determination of the clinical stage of Sjögren's syndrome. J Nucl Med. 2001;42:38-43.
28. Nadal M, Levy M, Bakhsh A, et al. Salivary scintigraphy for Sjögren's syndrome in patients with xerostomia: a retrospective study. Oral Dis. 2018;24:552-560.
29. von Meyenburg J, Wilm BJ, Weck A, et al. Spinal cord diffu-sion-tensor imaging and motor-evoked potentials in multiple scle-rosis patients: microstructural and functional asymmetry. Radiology. 2013;267:869-879.
30. Günel SE, Ylmaz S, Karalezli A, Aktas A. Quantitative and visual evaluation of salivary and thyroid glands in patients with primary Sjogren's syndrome using salivary gland scintigraphy: relationship with clinicopathological features of salivary, lacrimal and thyroid glands. Nucl Med Commun. 2010;31:666-672.
31. Nakada K, Ishibashi T, Takei T, et al. Does lemon candy decrease salivary gland damage after radioiodine therapy for thyroid cancer? J Nucl Med. 2005;46:261-266.
32. Klutmann S, Bohuslavizki KH, Kröger S, et al. Quantitative salivary gland scintigraphy. J Nucl Med Technol. 1999;27:20-26.
33. Aksoy T, Kiratli PO, Erbas B. Correlations between histopathologic and scintigraphic parameters of salivary glands in patients with Sjögren's syndrome. Clin Rheumatol. 2012;31:1365-1370.
34. Salaffi F, Carotti M, Iagnocco A, et al. Ultrasonography of salivary glands in primary Sjögren's syndrome: a comparison with contrast sia-lography and scintigraphy. Rheumatology (Oxford). 2008;47:1244-1249.
35. Fei HM, Kang H, Scharf S, Erlich H, Peebles C, Fox R. Specific HLA-DQA and HLA-DRB1 alleles confer susceptibility to Sjögren's syndrome and autoantibody production. J Clin Lab Anal. 1991;5:382-391.
36. Adams BK, Al Attia HM, Parkar S. Salivary gland scintigraphy in Sjögren's syndrome: are quantitative indices the answer? Nucl Med Commun. 2003;24:1011-1016.
37. Nishiyama S, Miyawaki S, Yoshinaga Y. A study to standardize quan-titative evaluation of parotid gland scintigraphy in patients with Sjögren's syndrome. J Rheumatol. 2006;33:2470-2474.
38. Vinagre F, Santos AI, Santos MJ, Prata A, Oliveira A, Silva JC. Salivary gland scintigraphy in the evaluation of patients with sicca complaints. Acta Reumatol Port. 2008;33:422-428.
39. Zou Q, Jiao JU, Zou M-H, et al. Semi-quantitative evaluation of salivary gland function in Sjögren's syndrome using salivary gland scintigraphy. Clin Rheumatol. 2012;31:1699-1705.
40. Kim H-A, Yoon S-H, Yoon J-K, et al. Salivary gland scintigraphy in Sjögren's syndrome. Comparison of the diagnostic performance of vi-sual and semiquantita- tive analysis. Nuklearmedizin. 2014;53:139-145.
41. Chen J, Zhao X, Liu H, et al. A point-scoring system for the clinical diagnosis of sjögren's syndrome based on quantified SPECT imaging of salivary gland. PLoS ONE. 2016;11(5):e0155666.
42. Angusti T, Pilati E, Parente A, et al. Semi-quantitative analysis of salivary gland scintigraphy in Sjögren's syndrome diagnosis: a first-line tool. Clin Oral Investig. 2017;21:2389-2395.
How to cite this article: Zhu G-w, Gao Z, Feng H-b, Qiu J-j. Quantitative analysis for modified Schall's classification by stimulation test with dynamic scintigraphy in Sjögren's syndrome. Int J Rheum Dis. 2020;23:381–391. https ://doi.org/10.1111/1756-185X.13779
392 | wileyonlinelibrary.com/journal/apl Int J Rheum Dis. 2020;23:392–396.© 2019 Asia Pacific League of Associations for Rheumatology and John Wiley & Sons Australia, Ltd
1 | INTRODUC TION
Juvenile dermatomyositis (JDM) is a rare childhood inflam-matory muscle disorder that can result in severe disability or death.1,2 Prior to the era of glucocorticoids, about one-third of children with JDM died, one-third achieved spontaneous remis-sion and one-third had chronic courses.3 With current treatment
modalities, remission is achieved in the majority but survivors may develop long-term complications. There have been few studies on long-term outcomes in children with JDM.4,5 These studies have employed different tools for assessment, which makes compar-ison of results difficult. Against this background, we undertook this study to assess the long-term outcomes of JDM using vali-dated measures of outcome.
Received: 16 May 2019 | Revised: 30 October 2019 | Accepted: 8 November 2019
DOI: 10.1111/1756-185X.13759
O R I G I N A L A R T I C L E
Long-term outcome in children with juvenile dermatomyositis: A single-center study from north India
Avinash Sharma | Anju Gupta | Amit Rawat | Deepti Suri | Surjit Singh
Department of Pediatrics, Advanced Pediatrics Centre, Postgraduate Institute of Medical Education and Research, Chandigarh, India
CorrespondenceAnju Gupta, Department of Pediatrics, Advanced Pediatrics Centre, Postgraduate Institute of Medical Education and Research, Chandigarh, India.Email: [email protected]
AbstractIntroduction: Juvenile dermatomyositis (JDM) is the commonest childhood inflam-matory myopathy. Outcome of children with JDM has improved significantly with current treatment protocols. We undertook this study to evaluate long-term out-come of these children using validated outcome measures.Methods: All children diagnosed as JDM and on follow-up for more than 2 years were eligible for enrolment. Cross-sectional examination was performed to assess signs of disease activity, damage, physical function and complications by using multiple vali-dated outcome measures/tools.Results: Thirty-seven patients were enrolled, 19 were male. Median duration of dis-ease at time of enrolment was 73 months (range 24-219 months) and median duration of follow-up was 60 months (range 24-218 months). Disease course was monocyclic in two-thirds of patients. Eight children were still on therapy at the time of enrol-ment. On Manual Muscle Testing 8, 3 and 7 children had severe weakness and mild to moderate weakness, respectively. Neck flexors were the most commonly affected muscle group. On abbreviated Cutaneous Assessment Tool, 14 children had evidence of cutaneous activity. More than 50% had at least 1 sign of cutaneous damage, most common signs being calcinosis and lipodystrophy. Nearly two-thirds of patients had damage in at least 1 organ using Myositis Damage Index. Nine children had physical dysfunction when assessed by Child Health Assessment Questionnaire.Conclusions: Skin disease continued to be active in a significant proportion of pa-tients. Features of damage, namely calcinosis and lipodystrophy, were seen in more than half. Muscle disease normalized in a large proportion of patients.
K E Y W O R D S
aCAT, calcinosis, CMAS, lipodystrophy, MMT8, Myositis Disease Activity Assessment Tool (MDAAT)

| 393SHARMA et Al.
2 | METHODS
This was a cross-sectional observational study conducted at Advanced Pediatrics Centre, Postgraduate Institute of Medical Education and Research, Chandigarh, India between January 1, 2015 and June 30, 2016. The study was approved by the Institute Ethics Committee (vide INT/IEC/2015/13). Written, informed consent was obtained from patients or one of their parents.
All children registered at the Pediatric Rheumatology Clinic as JDM from April 1998 till June 30 2014, and on follow-up for a min-imum period of 2 years were eligible for inclusion. Addresses and phone numbers of all patients were retrieved from clinic files and we tried to contact every patient with registered addresses and phone numbers.
Diagnosis of JDM was based on characteristic cutaneous find-ings (Gottron papules, or heliotrope rash over eyelids with perior-bital edema), symmetric weakness of proximal musculature, elevated muscle enzymes (creatine kinase, lactate dehydrogenase, aldolase or aspartate aminotransferase) and typical magnetic resonance imag-ing (MRI) changes. Findings of muscle biopsy and/or electromyogra-phy (EMG), wherever done, were also recorded.
Baseline information, including clinical features at diagnosis, in-vestigations and treatment,: was recorded from clinic files on a pre-designed study proforma. No changes in therapy were made by the investigators. Course of disease was classified as: monocyclic if the patient had achieved complete remission without any relapses and all medications could be stopped within 2 years of diagnosis; polycy-clic if the patient had relapse after achieving remission; and chronic continuous if disease was active or the child was on medication be-yond 2 years after onset.
Cross-sectional assessment of patients was done for presence of signs of disease activity, damage, physical function and complica-tions by a single observer using validated outcome measures. Muscle strength was evaluated using Childhood Myositis Assessment Scale (CMAS) and Manual Muscle Testing 8 (MMT8). Disease activity was assessed using Myositis Disease Activity Assessment Tool (MDAAT). Cutaneous damage was assessed with abbreviated Cutaneous Assessment Tool (aCAT), binary version and assessment of the cu-mulative damage was done using Myositis Damage Index (MDI). Child Health Assessment Questionnaire (CHAQ) was used to eval-uate physical functioning.
3 | RESULTS
A total of 88 patients with JDM were registered at the Pediatric Rheumatology Clinic of Advanced Pediatrics Centre, Postgraduate Institute of Medical Education and Research, Chandigarh till June 30, 2014. Twenty children were on regular follow-up and were en-rolled during their routine visits. Letters were written to 23 fami-lies and only one patient was brought in for enrolment. Thirty-six families were called by telephone; 16 were enrolled. Fifty-one chil-dren could not be enrolled (death during hospital stay or at home
5, amyopathic JDM 1, non-availability of address and/or phone number 5, wrong address and/or phone number 22, patients con-tacted but were not brought for assessment 18). Three deaths dur-ing hospital stay were attributed to aspiration pneumonia needing ventilation (n = 2) and gastrointestinal bleeding (n = 1) and all these deaths occurred in acute stages. Cause of 2 deaths at home could not be ascertained.
Thirty-seven patients (19 males) were included in the study (Table S1). Mean age at enrolment was 13.1 years (range 4-28 years). Median age at diagnosis was 6 years (range 1.5-14 years). Eleven (29.7%) children had disease onset before 5 years and 7 (18.9%) had onset before 3 years of age. Median interval between onset of symp-toms and diagnosis was 5.0 months (range 0-36 months). Median duration of disease at the time of enrolment was 73 months (range 24-219 months) and median duration of follow-up was 60 months (range 24-218 months). Disease duration of ≤5 years, 5-10 years and >10 years was seen in 17, 11 and 9 patients, respectively.
All patients had symmetrical proximal muscle weakness and cutaneous manifestations at the time of diagnosis. Heliotrope and Gottron papules were seen in 32 (86.4%) and 30 (81.1%) patients respectively. Other cutaneous manifestations like malar rash, V sign, and Shawl sign were present in 22 (59.4%) children each at the time of diagnosis. Arthritis/arthralgia was observed in 4. Calcinosis was present in 4 (10.8%) at the time of diagnosis. Increased muscle en-zymes were seen in 35 children.
Muscle biopsy was performed on five children. In one of them, the sample was not representative and in the rest, pathology was suggestive of inflammatory myopathy. Electromyography was per-formed in 14 (37.8%) patients. It was suggestive of myopathy in 13 (92.9%) and normal in 1. MRI was performed on 30 (81.1%) patients, which was suggestive of inflammatory myopathy in 22. Focal areas of calcification with inflammatory changes were present in 1 and 7 patients had normal MRI. According to Bohan and Peter criteria, cri-teria for definite and probable disease were fulfilled in 17 and 10 patients, respectively.
All children were treated with glucocorticoids. Methotrexate was given to all but 1. In addition, mycophenolate mofetil, azathio-prine and intravenous immunoglobulins (IVIg) were used in 2, 3 and 1 patients, respectively. None of the patients received biologicals.
Disease course was monocyclic in 26 (70.3%) patients, polycy-clic in 8 (21.6%) and 3 (8.1%) had chronic continuous course. Eight (21.6%) children were on therapy at the time of enrolment after a mean follow-up duration of 49.25 ± 22.35 months.
3.1 | Long-term outcome
Muscle power/strength: 27 (73%) patients had normal muscle strength with MMT8 score of 80 (Table 1). MMT8 scores between 64 and 79 suggest mild to moderate muscle weakness and below 64 suggest severe muscle weakness and were seen in 7 and 3 patients, respec-tively. All patients who had muscle weakness had disease duration of <10 years (Table 1). Mean MMT8 score was 76.81 ± 7.93 and minimum

394 | SHARMA et Al.
was 45. The most commonly affected muscle group was neck flexors, which was involved in 10 (27%) children. On CMAS, 27 children had scores of 52 which represents normal muscle strength/endurance. CMAS scores between 35 and 51 suggesting mild to moderate mus-cle weakness and <35 suggesting severe muscle weakness were seen in 6 and 4 patients, respectively. Mean CMAS score was 47.89 ± 9.12 and a minimum of 18. All patients with disease duration of more than 10 years had normal muscle strength on MMT8.
Cutaneous disease: on aCAT, 14 (37.8%) children had a score of ≥1 suggesting some form of cutaneous activity. Scores of 6 and 7 were seen in 1 child each. Most common signs of activity were heliotrope, malar rash and Gottron papules seen in 7, 7 and 6 patients, respec-tively. Cutaneous activity was seen in 7, 6 and 1 patients with disease durations of ≤5 years, 5-10 years and >10 years, respectively (Table 1).
Overall disease activity: the MDAAT consists of MYOACT (Myositis Disease Activity Assessment Visual Analog Scale) and MITAX (Myositis Intention to Treat Activities Index). MYOACT scores of ≥0.2 (suggesting some disease activity) and >2.5 (sug-gesting moderate disease activity) were seen in 11 and 3 patients, respectively. The cutaneous system was the commonest organ system involved in 10 (27%) followed by muscles in 8 (21.6%) sub-jects. Constitutional disease activity, muscle disease activity and cutaneous disease activity were categorized as sufficiently ac-tive to require disease-modifying treatment in 3 (8.1%) children each. The maximum MITAX score was 0.44; observed in 2 (5.4%) children.
3.2 | Assessment of damage
Cutaneous damage: 21 (56.8%) subjects had at least 1 sign of cu-taneous damage (aCAT damage score ≥ 1) (Table 1). There was no
significant difference in the proportion of patients with cutaneous damage when stratified to disease duration. Calcinosis and lipodys-trophy were seen in 12 and 8 patients, respectively.
Cumulative damage: total MDI score was ≥1 in 24 (64.9%) sub-jects suggesting damage in at least 1 organ system. Cutaneous, endocrine and muscle damage were seen in 21 (56.8%), 12 (32.4%) and 9 (24.3%) patients, respectively. Maximum damage was also ob-served in the cutaneous system with a mean MDI score of 0.7, fol-lowed by endocrine (mean MDI = 0.46) and muscular systems (mean MDI = 0.32). None of the subjects had skeletal, peripheral vascular system or ocular damage or any malignancy.
Physical functioning: nine subjects had a CHAQ score above 0, depicting some physical dysfunction. Mean CHAQ score was 0.26. Most commonly affected activities were dressing and grooming, arising, and hygiene and reach, being affected in seven patients each.
4 | DISCUSSION
We looked at long-term outcomes of children with JDM using vali-dated outcome measures. Our JDM patients had similar baseline variables like mean age at diagnosis, clinical features and laboratory investigations as described in the literature.6-8 There was slight male preponderance in our group in contrast to female predominance re-ported in multiple studies from the developed world.7-11 However, studies from India, Saudi Arabia and Japan have reported slight male preponderance.2,11-15 Median time-interval between onset of symp-toms and diagnosis in our study is higher than reported by McCann et al and Huber et al6,15 because of different health-seeking behav-iors of our population. Calcinosis was present in 4 (10.81%) children at the time of diagnosis. Median interval between disease onset and calcinosis has been reported as 3.4 years.1 In a recent study by Sun
Outcome measure Score value
Disease duration
≤5 years 5-10 years >10 years
MMT8 <64 3 0 0
64-79 3 4 0
80 11 7 9
CMAS <35 3 1 0
35-51 3 2 1
52 11 8 8
aCAT activity ≥1 7 6 1
aCAT damage ≥1 8 7 6
MYOACT <0.2 9 9 8
0.2-2.5 5 2 1
>2.5 3 0 0
MDI ≥1 12 7 5
CHAQ >0 4 3 2
Abbreviations: aCAT, abbreviated Cutaneous Assessment Tool; CHAQ, Child Health Assessment Questionnaire; CMAS, Childhood Myositis Assessment Scale; MDI, Myositis Damage Index; MMT, Manual Muscle Testing; MYOACT, Myositis Disease Activity Assessment Visual Analog Scale.
TA B L E 1 Outcome measures in the study population

| 395SHARMA et Al.
et al, calcinosis was seen in 2.6% of patients at the time of pres-entation.16 All patients in our cohort received immunosuppressive therapy with glucocorticoids with or without additional immunosup-pression. None of the patients were given biologicals even though many of them were still active after a long follow-up period.
Disease course was monocyclic in the majority. Monocyclic course has been reported in almost 73% of children in another study from India.12 In 2 large follow-up studies, monocyclic course was re-ported in 37%15 and 41.3%5 of patients, whereas a previous study from the Postgraduate Institute of Medical Education and Research reported a monocyclic course in 72.7% of children.2
There are only a handful of studies which have evaluated the long-term outcomes in this chronic childhood condition using objec-tive outcome measures.5,6,15 However, objective outcome measures have not been utilized to assess outcomes in children with JDM in studies from India.2,12,13,17
Ravelli et al reported 58.8% of subjects as having an MMT score of 80 after mean disease duration of 7.7 years.5 In our study, higher numbers of patients had normal muscle strength at the time of cross-sectional evaluation. Severe involvement defined as MMT8 score below 64 was seen in 8.1% of children as against 6.9% in the study by Ravelli et al5 This may reflect a trend in which only those pa-tients were coming for follow-up/evaluation who either had severe disease activity or were asymptomatic. The most common group of muscles involved were neck flexors (24%), hip extensors (22%) and hip abductors (19%). This pattern is similar to that observed by Ravelli et al5
CMAS has been used by Ravelli et al5 and McCann et al6 to assess muscle disease. Different workers have used different cut-off scores to define mild, moderate and severe muscle disease activity.18,19 The score below 35 was used as an indicator of severe muscle disease activity by Ravelli et al5 Four subjects in our study had severe mus-cle disease activity by this definition. In the study by Ravelli et al, more children were detected as having weakness using CMAS than MMT8 (52.8% and 41.2% respectively). This may be due to the fact that CMAS has many maneuvers which young children are not able to complete and MMT8 maneuvers are relatively easy. When com-paring severe disease activity, CMAS resulted in more children with severe muscle disease activity than MMT8 (8.3% vs 6.9%).5 In our study, severe muscle weakness was found in 8.1% and 10.8% using MMT8 and CMAS, respectively.
On evaluation of cutaneous activity using aCAT, 14 (37.8%) chil-dren had a score of ≥1, suggesting disease activity.20 Interestingly, signs of cutaneous disease activity were more common at the time of assessment than signs of muscle disease activity (37.8% vs 27%).
Overall disease activity was evaluated using MDAAT. Based on MYOACT, 29.7% of children had evidence of disease activity. In the study by Ravelli et al, 41.2% of children had disease activity both by MMT8 and MYOACT.5 MMT8 measures disease activity only in the muscular system, whereas MYOACT is a comprehensive tool which assesses activity in different organ systems including the muscular system. It therefore seems logical that more subjects will have ab-normal MYOACT scores than abnormal MMT8 scores. In our study,
skin was the commonest organ system involved in 27% of subjects followed by muscles in 21.6% of subjects and constitutional dis-ease activity was detected in 10.8% of patients. Ravelli et al have reported cutaneous, muscle and constitutional disease activity in 37.5%, 26.4% and 15.5%, respectively.5 We also report MITAX scores in our study and 3 children had a score of “A” in domains of constitutional disease activity, muscle disease activity and cutane-ous disease activity, suggesting severe disease activity in these 3 domains. None of the previously conducted studies have reported MITAX scores.
Damage was assessed using aCAT and MDI. In our study, 21 (56.8%) subjects had evidence of cutaneous damage: calcinosis and lipodystrophy in 12 (32.4%) and 8 (21.6%) children, respectively. Cumulative damage was assessed by using MDI which measures damage across 11 organ systems. Twenty-four (64.9%) subjects had a score of ≥1 suggesting damage in at least 1 organ system. In a study by Sanner et al, 90% of the enrolled subjects had a score of ≥1 after a median disease duration of 16.8 years. The study by Sanner et al included patients diagnosed from 1970 to 2006, when treatment modalities were different from the ones used today. In fact, the au-thors have reported that the subgroup diagnosed earlier had a higher mean MDI score.9
Most commonly affected organs in our study were cutaneous, endocrine and muscles in 21 (56.8%), 12 (32.4%) and 9 (24.3%) sub-jects, respectively. The most common organ system affected in the study by Sanner et al was also cutaneous in 77%.9 Ravelli et al did not used MDI in their study. However, they reported specific damage items, and cutaneous scarring/atrophy was the commonest damage item present in 44% of subjects.5
Nine (24.3%) subjects in our study had some form of a physical dysfunction suggested by a CHAQ score above 0 which is similar to the study by Huber et al in which 27.7% of children had CHAQ > 0 after a median follow-up duration of 7.2 years.14 Ravelli et al re-ported 40.7% of children had reduced functional ability. In our study, 3 (8.1%) children had a score of 1.5, suggesting moderate to severe impairment in physical function. Huber et al and Ravelli et al had sim-ilar findings with 6.25% and 6.5% of children in their cohorts having moderate to severe impairment in physical function.5,14 Similar to our observations, Ravelli et al5 reported most affected categories as reach, dressing and hygiene.
Using validated outcome measures to assess long-term outcome in survivors of a rare disease like JDM is the biggest strength of this study. However, we could enroll only 42% of all JDM patients in this study. This could have affected outcomes. Moreover, we did not use measures recommended by the International Myositis Assessment and Clinical Studies Group (IMACS) and the Paediatric Rheumatology International Trials Organization (PRINTO). Nor were long-term educational and vocational achievements assessed. Since the baseline data were collected retrospectively from clinic records, investigations like EMG, MRI, muscle biopsy and myositis-specific autoantibodies were not available for all patients.
In conclusion, after mean disease duration of 73 months, one-third of subjects had evidence of disease activity with almost

396 | SHARMA et Al.
one-tenth having moderate to severe activity. About two-thirds had damage in at least 1 organ system. Skin was the most common organ affected by activity as well as damaged. About one-fourth had reduced physical functioning. Multi-centric studies using validated outcome measures are required to throw more light on long-term outcomes of JDM in the present era.
CONFLIC T OF INTERE S TNone.
ORCIDAvinash Sharma https://orcid.org/0000-0003-4433-4355 Anju Gupta https://orcid.org/0000-0003-3567-7209 Surjit Singh https://orcid.org/0000-0002-6716-1883
R E FE R E N C E S 1. Feldman BM, Rider LG, Reed AM, Pachman LM. Juvenile derma-
tomyositis and other idiopathic inflammatory myopathies of child-hood. Lancet. 2008;371:2201-2212.
2. Singh S, Bansal A. Twelve years experience of juvenile dermatomy-ositis in North India. Rheumatol Int. 2006;26:510-515.
3. Bitnum S, Daeschner CW, Travis LB, Dodge WF, Hopps HC. Dermatomyositis. J Pediatr. 1964;64:101-131.
4. Mendez EP, Lipton R, Ramsey-Goldman R, et al. US incidence of juvenile dermatomyositis, 1995–1998: results from the National Institute of Arthritis and Musculoskeletal and Skin Diseases Registry. Arthritis Rheum. 2003;49:300-305.
5. Ravelli A, Trail L, Ferrari C, et al. Long-term outcome and prognos-tic factors of juvenile dermatomyositis: a multinational, multicenter study of 490 patients. Arthritis Care Res. 2010;62:63-72.
6. McCann LJ, Juggins AD, Maillard SM, et al. The Juvenile Dermatomyositis National Registry and Repository (UK and Ireland)–clinical characteristics of children recruited within the first 5 yr. Rheumatol Oxf Engl. 2006;45:1255-1260.
7. Symmons DP, Sills JA, Davis SM. The incidence of juvenile der-matomyositis: results from a nation-wide study. Br J Rheumatol. 1995;34:732-736.
8. Ramanan AV, Feldman BM. Clinical features and outcomes of ju-venile dermatomyositis and other childhood onset myositis syn-dromes. Rheum Dis Clin North Am. 2002;28:833-857.
9. Sanner H, Gran JT, Sjaastad I, Flatø B. Cumulative organ damage and prognostic factors in juvenile dermatomyositis: a cross-sec-tional study median 16.8 years after symptom onset. Rheumatol Oxf Engl. 2009;48:1541-1547.
10. Sanner H, Kirkhus E, Merckoll E, et al. Long-term muscular outcome and predisposing and prognostic factors in juvenile dermatomyosi-tis: a case-control study. Arthritis Care Res. 2010;62:1103-1111.
11. Shehata R, al-Mayouf S, al-Dalaan A, al-Mazaid A, al-Balaa S, Bahabri S. Juvenile dermatomyositis: clinical profile and disease course in 25 patients. Clin Exp Rheumatol. 1999;17:115-118.
12. Chickermane PR, Mankad D, Khubchandani RP. Disease patterns of juvenile dermatomyositis from Western India. Indian Pediatr. 2013;50:961-963.
13. Chowdhary V, Wakhlu A, Agarwal A, Misra R. Outcome in juvenile dermatomyositis. Indian Pediatr. 2002;39:931-935.
14. Hiketa T, Matsumoto Y, Ohashi M, Sasaki R. Juvenile dermatomy-ositis: a statistical study of 114 patients with dermatomyositis. J Dermatol. 1992;19:470-476.
15. Huber AM, Lang B, LeBlanc CM, et al. Medium- and long-term func-tional outcomes in a multicenter cohort of children with juvenile dermatomyositis. Arthritis Rheum. 2000;43:541-549.
16. Sun C, Lee JH, Yang YH, et al. Juvenile dermatomyositis: A 20-year retrospective analysis of treatment and clinical outcomes. Pediatr Neonatol. 2014;56(1):31-39.
17. Singh S, Kumar L, Shankar KR. Juvenile dermatomyositis in north India. Indian Pediatr. 1997;34:193-198.
18. Huber AM, Feldman BM, Rennebohm RM, et al. Validation and clin-ical significance of the Childhood Myositis Assessment Scale for as-sessment of muscle function in the juvenile idiopathic inflammatory myopathies. Arthritis Rheum. 2004;50:1595-1603.
19. Rennebohm RM, Jones K, Huber AM, et al. Normal scores for nine maneuvers of the Childhood Myositis Assessment Scale. Arthritis Rheum. 2004;51:365-370.
20. Huber AM, Dugan EM, Lachenbruch PA, et al. Preliminary valida-tion and clinical meaning of the Cutaneous Assessment Tool in ju-venile dermatomyositis. Arthritis Rheum. 2008;59:214-221.
SUPPORTING INFORMATIONAdditional supporting information may be found online in the Supporting Information section.
How to cite this article: Sharma A, Gupta A, Rawat A, Suri D, Singh S. Long-term outcome in children with juvenile dermatomyositis: A single-center study from north India. Int J Rheum Dis. 2020;23:392–396. https ://doi.org/10.1111/1756-185X.13759

Int J Rheum Dis. 2020;23:397–405. wileyonlinelibrary.com/journal/apl | 397© 2019 Asia Pacific League of Associations for Rheumatology and John Wiley & Sons Australia, Ltd
1 | INTRODUC TION
Idiopathic inflammatory myopathy (IIM) is an autoimmune disease predominantly accompanied with skeletal muscle injury and is often complicated with multi-system involvements such as skin, lungs and
esophagus. It is widely accepted that multi-pathways including adap-tive and innate immune systems involve the pathogenesis of IIM.1 Serum auto-antibodies including myositis-specific antibodies (MSA) and myositis-associated antibodies (MAA) are detected in more than 80% of patients with IIM.2
Received: 7 September 2019 | Revised: 20 November 2019 | Accepted: 6 December 2019
DOI: 10.1111/1756-185X.13782
O R I G I N A L A R T I C L E
Aberrant expansion of circulating CD4+CXCR5+CCR7loPD1hi Tfh precursor cells in idiopathic inflammatory myopathy
Lu Zhang1 | Wenli Li1 | Ying Cai2 | Xia Liu1 | Qinglin Peng1 | Lin Liang1
1Department of Rheumatology, China-Japan Friendship Hospital, Beijing, China2BD Biosciences, Becton, Dickinson and Company, Beijing, China
CorrespondenceLu Zhang, Department of Rheumatology, China-Japan Friendship Hospital, YinHua East Road, ChaoYang District, Beijing, 10029 China.Email: [email protected]
Funding informationNational Natural Science Foundation of China, Grant/Award Number: 81601425 and 81601833
AbstractObjective: To determine circulating follicular T helper (Tfh) cell precursor and its rela-tionship with clinical characteristics in idiopathic inflammatory myopathy (IIM).Methods: The study population included 47 patients with IIM and 30 healthy con-trols. Circulating CD4+CXCR5+CCR7loPD-1hi T cells and intracellular interleukin (IL)-21 were assessed by flow cytometry. Serum IL-21 levels were measured by en-zyme-linked immunosorbent assay. The disease activity was evaluated using myositis disease activity assessment visual analog scales (VAS) as well as muscle and physician global assessment (PGA).Results: The percentage of the CCR7loPD-1hi subset cells within CD4+CXCR5+ T cells was significantly increased in patients with IIM compared to that in healthy controls (14.3 ± 6.5 vs 11.4 ± 2.6, P = .009). Patients with higher percentages of CCR7loPD-1hi subsets presented with higher PGA VAS (P = .000), muscle VAS (P = .000), as well as serum creatinine kinase (CK) levels (P = .000) than those with lower per-centages of CCR7loPD-1hi subsets. IL-21 expression significantly increased in CD4+CXCR5+CCR7loPD-1hi T cells in patients with IIM compared to that in healthy controls (26.07 ± 7.38 vs 19.25 ± 5.67, P = .001). Meanwhile, both the CCR7loPD-1hi subset and intracellular IL-21 expression in IIM patients showed significantly positive correlation with PGA VAS, muscle VAS and serum CK levels. Circulating CD4+CXCR5+CCR7loPD-1hi T cells and intracellular IL-21 decreased significantly when disease was improved (P = .018; P = .028).Conclusion: The percentage of circulating CCR7loPD-1hi subset among total CD4+CXCR5+ T cells and intracellular IL-21 expression expanded and showed sig-nificant correlation with disease activity in IIM. The circulating follicular helper T cell precursor may be involved in the pathogenesis, especially muscle injury in IIM.
K E Y W O R D S
follicular helper T cell, idiopathic inflammatory myopathy, interleukin-21

398 | ZHANG et Al.
Follicular T helper (Tfh) cells, as a distinct subset of CD4+ T, is generated from peripheral naive CD4+ T cells in the T cell zone of lymphoid organs and play a critical role in B cell function and an-tibody production in the germinal centers (GCs) of secondary lym-phoid organs.3 However, dysregulated Tfh cells can also result in the loss of immune tolerance and abnormal production of high levels of auto-antibodies, which can contribute to the development of auto-immune responses.4 Previous studies observed that there were fol-licle-like structures in muscle from juvenile dermatomyositis (JDM) with more severe disease activity.5
Peripheral blood is the most accessible sample for analyses of healthy controls and patients with autoimmune diseases. Some surface markers such as CXC chemokine receptor 5 (CXCR5), pro-grammed death-1 (PD-1) and inducible T-cell co-stimulator (ICOS) on circulating CD4+ T cells were used as phenotypes to reflect of Tfh cells in secondary lymphoid tissues. Therefore, previous studies quantified the circulating Tfh-like cells with CXCR5, PD-1 and ICOS in autoimmune diseases such as systemic lupus erythematosus (SLE), primary Sjögren's syndrome or IIM.6-10 However, the actual Tfh cells are located in the lymphoid follicles of GC. There is controversy over the existence of bona fide Tfh cells circulating in blood. The nascent Tfh cells downregulate C-C chemokine receptor type 7 (CCR7) and migrate to the T-cell-B cell border in the lymphoid follicle.11,12 In vitro, circulating CXCR5+ cells downregulate CCR7 suggesting that they have the capacity to become Tfh cells after re-entry into sec-ondary lymphoid organs.13,14 Recently, strong evidence showed that circulating CD4+CXCR5+CCR7loPD-1hi T cells indicate Tfh cell activ-ity.15 The population of circulating CD4+CXCR5+CCR7loPD-1hi T cells increased and had correlated with elevated autoantibody profiles and severe disease activity in SLE and rheumatoid arthritis patients.
Serum auto-antibodies and follicle-like structures in muscle from JDM indicated that Tfh cells may be involved in the pathogene-sis of IIM. Moreover, IL-21 is the most closely cytokine associated with Tfh cells. It is required for the formation of extrafollicular an-tibody-producing cells and directs germinal center B cells to main-tain proliferation. The aim of this study was to profile circulating CD4+CXCR5+CCR7loPD-1hi T cells and intracellular IL-21 expression in IIM.
2 | MATERIAL S AND METHODS
2.1 | Study population
A total of 47 hospitalized IIM patients from the Department of Rheumatology in China-Japan Friendship Hospital between October 2017 and December 2018 were enrolled in this study. A clinical diag-nosis of IIM was based on European Neuromuscular Center (ENMC) 2003 criteria.16 Among them, 25 patients underwent muscle biopsy which reinforced the clinical diagnosis. Patients who presented with accompanying malignancy or overlap syndromes were excluded. Pregnant and lactating women were excluded. Sporadic inclu-sion body myositis (sIBM) was not included because of its very low
incidence in China. Patients were matched to 30 healthy control sub-jects on the basis of age and sex. The study protocol was approved by the Ethics Committee of China-Japan Friendship Hospital, and writ-ten informed consent was obtained from each participant. The study was conducted according to the Declaration of Helsinki (2000).
2.2 | Assessment of the disease activity
The disease activity of the studied participants was assessed by two physicians (LZ and XL) independently at the time of enrollment. For the subsequent follow-up visits longitudinal study, the disease activ-ity in each subject was estimated by the same physician (LZ or XL). All these measurements were made blinded to flow cytometry analysis. The disease activity of patients with IIM was evaluated using myosi-tis disease activity assessment visual analog scales (MYOACT) which globally scores 6 extramuscular organ systems (constitutional, cuta-neous, joint, gastrointestinal, pulmonary, and cardiac), as well as mus-cle and physician global assessment (PGA) using a continuous 10-cm visual analog scale (VAS).17,18 Serum creatine kinase (CK) and immu-noglobulin G (IgG) levels were included for analysis at the clinic visit closest to the time of blood sampling for flow cytometry analysis.
2.3 | Flow cytometry analysis
Peripheral blood samples for phenotypic measures of CD4+CXCR5+CCR7loPD-1hi T cells were collected in heparin so-dium anticoagulant and stored at room temperature until ready for staining and lysing. Fresh human whole blood is incubated with surface antibodies for 20 minutes in the dark at room tem-perature. Isotype control antibodies were used to separate posi-tive and negative cells. 1X fluorescent-activated cell sorter (FACS) lysing solution was added for 10 minutes at room temperature to hemolysis of the red blood cells. The leukocytes were centri-fuged and washed in phosphate-buffered saline (PBS), and then suspended in 500 μL of PBS for flow cytometry analysis. For in-tracellular cytokine staining, fresh blood samples were stimulated by 2 μL cocktail reagent (Leukocyte Activation Cocktail, with BD GolgiPlug, 550 583) in a 37°C humidified CO2 incubator for 4 hours. After activation, samples are stained with an appropriate volume of surface antibody, and incubated for 15 minutes in dark at room temperature followed by lysing red blood cells with lys-ing solution. The leukocytes were centrifuged and washed in PBS twice. Then the cell fixation and permeabilized treatment was done with BD Cytofix/Cytoperm Fixation/Permeabilization solution kit (554 714). For intracellular staining, cells were further stained with PE-labeled monoclonal anti-IL-21 for 20 minutes in the dark at room temperature. All samples were analyzed by FACSCanto II within 4 hours post-staining. Then anti-human monoclonal anti-bodies were used for circulating CD4+CXCR5+CCR7loPD-1hi cell detection: BB515 Mouse Anti-human PD-1 (564 494), PE-Cy 7 Rat Anti-human CCR7 (557 648), Alexa Fluor 647 Rat Anti-human

| 399ZHANG et Al.
CXCR5 (558 113), BV421 Mouse Anti-Human CD4 (562 425), PE Mouse Anti-human IL-21 (562 042). Antibodies were purchased from BD Biosciences.
2.4 | Serum IL-21 analysis
Sera were collected at time of flow cytometry and stored at −80°C until analysis. Serum IL-21 levels were measured by enzyme-linked immunosorbent assay (ELISA) using the human IL-21 ELISA kit (Human IL-21 Platinum ELISA, eBiosciences, BMS2043) according to the manufacturer's instructions.
2.5 | MSA and MAA detection
We detected MSA and MAA by immunoblotting with a diagnos-tic kit from EUROIMMUN. The MSA and MAA included anti-Mi-2, anti-TIF1γ, anti-MDA5, anti-NXP2, anti-SAE1, Anti-HMGCR, Anti-SRP, antisynthetase (anti-Jo-1, anti-PL-7, anti-PL12, anti-EJ, anti-OJ), anti-Ku, anti-Ro52, anti-PM-Scl100 and anti-PM-Scl75 antibodies.
2.6 | Statistical analysis
The analysis was performed using PASW statistics 18. The com-parisons between groups were performed using independent tests for continuous variables and the Pearson Chi-square test for cat-egorical variables. Mann-Whitney U tests were applied for data of abnormal distribution. Wilcoxon signed ranks test was applied in the follow-up study. The Pearson or Spearman correlation analysis was applied for continuous variable or ranked data respectively. Continuous variables were presented as mean ± SD unless other-wise stated. A 2-sided P value less than 0.05 was considered for significant differences.
3 | RESULTS
3.1 | Baseline characteristics
The age of the patients ranged from 19 to 68 years, with a mean of 47.0 (±15.8) years. The average disease duration was 14.4 months (±23.5; range 1-132 months). The patients were matched to 30 healthy control subjects on the basis of age and sex. The age of the control subjects ranged from 24 to 57 years, and the mean was 40.1 years (±10.6). A total of 39 patients were positive fol-lowing testing with MSA. These subjects included 15 patients with positive anti-MDA5, eight patients for anti-aminoacyl-tRNA-synthetase (anti-ARS) antibodies (including three with anti-Jo-1, three with anti-PL-7, one with anti-PL-12 and one with anti-EJ an-tibodies), seven patients for anti-NXP2, three patient for anti-TIFγ,
three patients for anti-SRP, two patients for anti-HMGCR and one patient for anti-Mi2. The remaining eight patients were MSA-negative including two patients for anti-PM/SCL and one patient for anti-Ku. Detail information including classification, disease duration, MSA and treatment were porvided in Supplementary Table 1.
3.2 | Expansion of circulating CD4+CXCR5+CCR7loPD-1hi T cells in patients with IIM
The frequency of CXCR5+ cells within CD4+ T cells did not show significant differences between patients with myositis and healthy controls (12.5 ± 4.3 vs 10.6 ± 3.7, P = .083), whereas the CCR7loPD-1hi subset among total CD4+CXCR5+ T cells was significantly increased in patients with myositis compared to that in healthy controls (14.3 ± 6.5 vs 11.4 ± 2.6, P = .009; Figure 1A). In patients, the CCR7loPD-1hi subset among total CD4+CXCR5+ T cells varied widely which ranged from 5.1% to 30.6%. Therefore, patients were divided into two groups based on the mean + 3 SD of healthy controls (high group > 19.2%; low group ≤ 19.2%). The distribu-tion of CCR7loPD-1hi subsets in patients with different MSAs is shown in Figure 1B. As a result, 71.4% (5/7) of patients with anti-NXP2 antibodies and 37.5% (3/8) of patients with MSA presented high CCR7loPD-1hi subsets. In contrast, all patients with anti-TIFγ and anti-HMGCR were in the low CCR7loPD-1hi subsets group. In addition, patients in the high group presented with higher PGA VAS (P = .000), muscle VAS (P = .000), as well as serum CK levels (P = .000) than patients in the low group. As for extramuscular organ systems, gastrointestinal (P = .000) and cardiac MYOACT scores (P = .004) of the high group were significantly higher than that of the low group (Table 1).
Meanwhile, the percentage of CCR7loPD-1hi cells in IIM patients showed significantly positive correlation with PGA VAS (rs = .600, P = .000; Figure 1C), serum CK levels (r = .629, P = .000; Figure 1D), muscle VAS (rs = .471, P = .000; Figure 1E) as well as gastrointestinal (rs = .651, P = .000) and cardiac (rs = .426, P = .003) MYOACT scores (Figure S1).
3.3 | IL-21 expression significantly increased in CD4+CXCR5+CCR7loPD-1hi T cells in patients with IIM
IL-21 is a key cytokine secreted by Tfh cells to regulate B cell pro-liferation and class-switch in the germinal center. We examined the intracellular IL-21 expression in CCR7loPD-1hi subsets of peripheral blood samples from 28 IIM patients and 20 healthy controls. As a re-sult, the percentages of CD4+CXCR5+CCR7loPD-1hi T cells with posi-tive intracellular IL-21 were significantly higher in IIM patients than in healthy controls (26.07 ± 7.38 vs 19.25 ± 5.67, P = .001; Figure 2A). The ratio of IL-21 positive subsets significantly increased in patients in the high group of CCR7loPD-1hi cells compared to the low group (P = .023; Figure 2B). The percentages of CD4+ CXCR5+CCR7loPD-1hi

400 | ZHANG et Al.
T cells with positive intracellular IL-21 were parallel to the PGA VAS (rs = .589, P = .001) and muscle VAS (rs = .550, P = .002; Figure 2C). Meanwhile, the percentage of IL-21+ subsets showed significantly positive correlation with serum CK levels (r = .468, P = .001) and IgG (r = .547, P = .003; Figure 2D). However, the relationship between IL-21+ subsets and serum IL-21 did not show significant correlation (r = .364, P = .057; Figure 2E).
3.4 | Circulating CD4+CXCR5+CCR7loPD-1hi T cells and intracellular IL-21 decreased significantly when disease was improved
A total of seven treatment-naïve patients (including two with NXP2, one with MDA5, one with JO-1, one with SRP antibodies and two without MSAs) in the high percentage of CCR7loPD-1hi
F I G U R E 1 Increased percentages of circulating CCR7loPD-1hi cells among CD4+CXCR5+ T cells in patients with idiopathic inflammatory myopathy (IIM). A, The percentages of circulating CCR7loPD-1hi T cells among CD4+CXCR5+ T cells in patients with IIM increased significantly compared with that of the healthy control subjects. Representative graphs are shown. B, The disposition of CCR7loPD-1hi subsets in IIM patients with different myositis-specific antibodies (MSAs). C, The correlation between the physician global assessment visual analog scale (PGA VAS) and the percentages of CCR7loPD-1hi cells was examined (right panel) and the classifications based on low or high CCR7loPD-1hi percentages as defined in A (left panel). D, The correlation between serum creatine kinase (CK) level and the percentages of CCR7loPD-1hi cells was examined (right panel) and the classifications based on low or high CCR7loPD-1hi percentages as defined in A (left panel). E, The correlation between muscle VAS and the percentages of CCR7loPD-1hi cells was examined (right panel) and the classifications based on low or high CCR7loPD-1hi percentages as defined in A (left panel)

| 401ZHANG et Al.
subset group were followed up after 6 months of therapy. All pa-tients received systemic corticosteroids (0.5-1.0 mg/kg) with sub-sequent dose tapering (Table 2). PGA VAS and serum CK levels showed significant improvements (P = .017; P = .018) after treat-ment (Figure 3A). Further, circulating CD4+CXCR5+CCR7loPD-1hi T cells and intracellular IL-21 decreased significantly (P = .018; P = .028; Figure 3B).
4 | DISCUSSION
IIMs are characterized by muscle weakness, skin disease and inter-nal organ involvement which are associated with extensive autoanti-body production. MSAs including anti-TIF1, anti-NXP2, anti-MDA5, anti-SAE, anti-HMGCR are important tools to support the diagnosis of myositis.19,20 The serum levels of MSAs are usually positively cor-related with disease activity.21,22 The association between IIM and serum auto-antibodies indicate that the maturation and differentia-tion of B cells are involved in the pathogenesis of IIM.
GCs are specialized structures found within the B cell follicle of secondary lymphoid tissues where high-affinity antibodies are generated to protect against many lethal infections. However, im-munity operates on the edge of autoimmunity. The inappropriate innate immunity and adaptive immunity may induce an autoim-mune response. Tfh cells are crucial for the generation of most iso-type-switched and affinity-matured antibodies in GCs of lymphoid
tissue. In secondary lymphoid tissues, the procedure of CCR7 downregulation is favoring repositioning in close proximity to the B cell follicle, where they are optimally located to support B cell expansion and differentiation.13,23 Although actual Tfh cells are located in the lymphoid follicle of GC, peripheral blood has been the most widely utilized to study circulating Tfh-like T cell with some surface molecules such as CXCR5, ICOS and PD-1. We found no significant differences in frequency of CD4+CXCR5+ T cells be-tween patients and healthy controls. Similarly, the study by Morita also indicated the frequency of CD4+ CXCR5+ T cells was not sub-stantially different between patients with juvenile dermatomy-ositis and healthy controls,24 whereas Espinosa found increased percentages of CD4+CXCR5+ T cells in IIM patients.8 The discrep-ant result may be due to the difference in study populations, dis-ease states and treatment. However, recent findings, showed that the CD4+CXCR5+CCR7loPD-1hi subset in blood could represent Tfh cell precursors that can gain Tfh cell functionality. Furthermore, the circulating CCR7loPD-1hi subset could be used as a marker for active Tfh differentiation in secondary lymphoid organs.15
To the best of our knowledge, the present study represents the first report indicating the aberrant expansion of CD4+CXCR5+CCR7loPD-1hi T cells in some patients with IIM. Because of the heterogeneity of the disease, the percentages of CCR7loPD-1hi cells in individual patients are different, from 6.3% to 30.6%. Figure 1B display the distribution of CCR7loPD-1hi subsets in patients with different MSAs. However, we cannot compare the difference of CCR7loPD-1hi
Characteristics
Circulating CCR7loPD-1hi subset
P valueLow (n = 36) High (n = 11)
CCR7loPD-1hi,a % 11.3 ± 3.8 24.4 ± 2.6 -
Age in ya 47.5 ± 14.8 44.5 ± 20.4 .591
Gender, male/female 14/22 3/8 .327
Duration in mob 6.5 (3, 20.25) 4.0 (2.0, 6.0) .226
PGA VASb 6.0 (4.25, 6.0) 7.0 (6.0, 8.0) .000*
Muscle VASb 3.0 (0, 4.75) 7.0 (6.0, 8.0) .000*
MYOACT
Constitutionalb 2.0 (1.0, 2.0) 3.0 (1.0, 4.0) .108
Cutaneousb 4.0 (0.25, 5.75) 4.0 (0, 5.0) .654
Jointb 0 (0, 0.75) 0 (0, 2.0) .513
Gastrointestinalb 0 (0, 0) 4.0 (2.0, 7.0) .000*
Pulmonaryb 1.5 (0, 4.0) 2.0 (0, 4.0) .756
Cardiacb 0 (0, 0) 1.0 (0, 1.0) .004*
Serum CK level,b IU/L 104.0 (43.75, 751.3) 5920 (1612.0, 8229.0) .000*
Serum IgG level,a mg/dL 1388.7 ± 491.5 1701.9 ± 631.1 .108
Serum IL-21 level,b pg/mL 234.7 (218.8, 276.5) 222.6 (198.2-474.0) .333
Abbreviation: CK, creatine kinase; IL, interleukin; MYOACT, myositis disease activity assessment visual analog scales; PGA, physician global assessment; VAS, visual analog scaleaData expressed as mean (SD). bData expressed as median (Q1-Q3). *P < .05.
TA B L E 1 Correlation between clinical characteristics and CCR7loPD-1hi percentages in patients with idiopathic inflammatory myopathy

402 | ZHANG et Al.
subsets among various MSAs because of small cases. The percent-age of CCR7loPD-1hi cells was parallel to PGA VAS. Specifically, there was significantly positive correlation between CCR7loPD-1hi subsets and serum CK levels as well as muscle VAS. As shown in Figure 1D, 85.7% (6/7) of patients with remarkably high serum CK levels (>5000 IU/L) presented significant expansion of circulating CD4+CXCR5+CCR7loPD-1hi T cells (>20%). Also previous pathological
findings showed permissive environments for B cell maturation in adult myositis muscle and follicle-like structures in JDM muscles.5,25 Therefore, dysregulation of Tfh cells may be involved in the patho-genesis of muscle damage in IIM subsets.
IL-21, a cardinal cytokine produced by Tfh cells and Th17 cells, is in-dispensable for Tfh cell development and Ab affinity maturation.26,27 In the present work, we found that the production of IL-21 of CCR7loPD-1hi
F I G U R E 2 The interleukin (IL)-21 expression in follicular T helper (Tfh) cell precursor significantly increased in patients with idiopathic inflammatory myopathy (IIM). A, The IL-21 expression significantly increased in CD4+CXCR5+CCR7loPD-1hi T cells in patients with IIM compared with that of the healthy control subjects. Representative graphs are shown. B, Patients in the group with high CCR7loPD-1hi percentages (defined in Figure 1A) presented significantly higher intracellular IL-21 than that of the group with low CCR7loPD-1hi percentages. C-D, The percentage of IL-21+ expression showed significantly positive correlation with physician global assessment visual analog scale (PGA VAS), muscle VAS, serum creatine kinase (CK) level and IgG. E, The percentage of IL-21+ expression did not show significant correlation with serum IL-21 levels

| 403ZHANG et Al.
cells increased in IIM compared to those of healthy controls. Patients with high percentages of CCR7loPD-1hi cells also presented with high ratios of intracellular IL-21. In addition, the ratio of IL-21 positive subsets
also paralleled serum CK levels as well as muscle VAS. A total of 7 pa-tients were followed up after 6 months of therapy. All patients were more or less improved notably with regard to rash, symptoms and
TA B L E 2 Demographic characteristics and initial treatment of the seven follow-up patients
No. Gender Age (y) Duration (mo) MSA Initial treatment
1 Male 57 6 NXP2 Pred 50 mg/d TAC 2 mg/d
2 Male 43 2 MDA5 Pred 50 mg/d CsA150 mg/d
3 Male 72 6 - Pred 40 mg/d CsA 150 mg/d
4 Female 65 4 - Pred 30 mg/d CsA 150 mg/d
5 Female 40 7 Jo-1 Pred 45 mg/d CTX 800 mg/m
6 Female 31 1 SRP Pred 30 mg/d AZA 150 mg/d
7 Female 53 1 NXP2 Pred 60 mg/d MMF 150 mg/d
Abbreviations: MSA, myositis-specific antibodies; Pred, prednisone; TAC, tacrolimus; MMF, mycophenolate mofetil; AZA, azathioprine; CTX, cyclophosphamide; CsA, cyclosporin A
F I G U R E 3 The percentages of circulating follicular T helper (Tfh) cell precursors and intracellular interleukin (IL)-21 decreased significantly in follow-up study. A, Physician global assessment visual analog scale (PGA VAS) and serum creatine kinase (CK) levels were significant improved after treatment. B, The percentages of CCR7loPD-1hi T cells among CD4+CXCR5+and IL-21 expression in CD4+CXCR5+CCR7loPD-1hi cells decreased significantly after treatment. C, Representative graphs are shown
404 | ZHANG et Al.
muscle strength. We observed that circulating CD4+CXCR5+CCR7loPD-1hi T cells and intracellular IL-21 decreased significantly accompanying clinical remission. Intracellular IL-21 in a patient (NXP2+) decreased from 32.6% to 14.2% after treatment with prednisone and FK506. It is difficult to compare the difference among various immunosuppres-sants because of the small number of cases. These results suggested CCR7loPD-1hi subsets may participate in pathogenesis of IIM muscle by the IL-21 pathway. We did not find significant correlation between percentage of intracellular IL-21 and serum IL-21 levels. Serum IL-21 is mainly expressed by Tfh and Th17 cells. Previous studies indicated Th17 cell involved in the pathogenesis of IIM.28 The CD4+CXCR5+CCR7loPD-1hi T cells, as Tfh cell precursors, is a stage of Tfh cell differentiation. There is difference among the cytokine production by Tfh cells in the different differentiation stages.29 Therefore, serum IL-21 level is not only influenced by intracellular IL-21 in CD4+CXCR5+CCR7loPD-1hi T cells, but also influenced by other factors.
We acknowledge the limitation of this study. First, most pa-tients had received the glucocorticoid and immunosuppressant therapy which may have had an effect on immune cells. The influ-ence of glucocorticoids and immunosuppressants on circulating CD4+ CXCR5+CCR7loPD-1hi T cells was not be covered in our study. In addition, the impacts of circulating CD4+CXCR5+CCR7loPD-1hi T cells on B cell proliferation, apoptosis and differentiation in IIM were not considered in our study. Finally, our study indicated the positive correlation between the aberrant expansion of circulating CD4+CXCR5+CCR7loPD-1hi T cells and muscle VAS. However, the pathogenesis of muscle injury induced by circulating follicular helper T cells requires further investigation.
In summary, our study clarified the aberrant expansion of cir-culating CD4+ CXCR5+CCR7loPD-1hi T cells and intracellular IL-21 in IIM. Both the percentages of CCR7loPD-1hi subset among total CD4+CXCR5+ T cells and intracellular IL-21 expression had signif-icant correlation with PGA VAS and muscle VAS in IIM patients. Therefore, circulating follicular helper T cell precursors may be in-volved in the pathogenesis, especially muscle injury, in IIM.
ACKNOWLEDG EMENTSThis study was supported by the National Natural Science Foundation of China (81601425, 81601833). We would like to thank Guochun Wang and Xin Lu who took the time to provide us with advice regarding study design.
AUTHOR ' S CONTRIBUTIONLZ contributed to study design, assessment of the disease activity, data analysis and drafting and revising the manuscript. W.L and Y.C participated in specimens preparation and flow cytometry analysis. X.L recruited the patients and carried out assessment of disease. Q.P helped in data interpretation and revised the manuscript. All authors read and approved the final manuscript.
ORCIDLu Zhang https://orcid.org/0000-0001-5621-185X Qinglin Peng https://orcid.org/0000-0002-1271-1729
R E FE R E N C E S 1. Venalis P, Lundberg IE. Immune mechanisms in polymyositis and
dermatomyositis and potential targets for therapy. Rheumatology (Oxford). 2014;53(3):397-405.
2. Tieu J, Lundberg IE, Limaye V. Idiopathic inflammatory myositis. Best Pract Res Clin Rheumatol. 2016;30(1):149-168.
3. Vinuesa CG, Linterman MA, Yu D, MacLennan IC. Follicular Helper T Cells. Annu Rev Immunol. 2016;34:335-368.
4. Zhu Y, Zou L, Liu YC. T follicular helper cells, T follicular regulatory cells and autoimmunity. Int Immunol. 2016;28(4):173-179.
5. López De Padilla CM, Vallejo AN, Lacomis D, McNallan K, Reed AM. Extranodal lymphoid microstructures in inflamed muscle and disease severity of new-onset juvenile dermatomyositis. Arthritis Rheum. 2009;60(4):1160-1172.
6. Choi J-Y, Ho J-E, Pasoto SG, et al. Circulating follicular helper-like T cells in systemic lupus erythematosus: association with disease activity. Arthritis Rheumatol. 2015;67(4):988-999.
7. Szabó K, Papp G, Szántó A, Tarr T, Zeher M. A comprehensive inves-tigation on the distribution of circulating follicular T helper cells and B cell subsets in primary Sjögren's syndrome and systemic lupus erythematosus. Clin Exp Immunol. 2016;183(1):76-89.
8. Espinosa-Ortega F, Gómez-Martin D, Santana-De AK, Romo-Tena J, Villaseñor-Ovies P, Alcocer-Varela J. Quantitative T cell subsets profile in peripheral blood from patients with idiopathic inflamma-tory myopathies: tilting the balance towards proinflammatory and pro-apoptotic subsets. Clin Exp Immunol. 2015;179(3):520-528.
9. Simpson N, Gatenby PA, Wilson A, et al. Expansion of circulating T cells resembling follicular helper T cells is a fixed phenotype that identifies a subset of severe systemic lupus erythematosus. Arthritis Rheum. 2010;62(1):234-244.
10. Le CC, Joublin A, Pasquali JL, Korganow AS, Dumortier H, Monneaux F. Circulating TFH subset distribution is strongly affected in lupus patients with an active disease. PLoS ONE. 2013;8(9):e75319.
11. Crotty S. Follicular helper CD4 T cells (TFH). Annu Rev Immunol. 2011;29:621-663.
12. Crotty S. T follicular helper cell differentiation, function, and roles in disease. Immunity. 2014;41(4):529-542.
13. Haynes NM, Allen CD, Lesley R, Ansel KM, Killeen N, Cyster JG. Role of CXCR5 and CCR7 in follicular Th cell positioning and ap-pearance of a programmed cell death gene-1high germinal cen-ter-associated subpopulation. J Immunol. 2007;179(8):5099-5108.
14. Craft JE. Follicular helper T cells in immunity and systemic autoim-munity. Nat Rev Rheumatol. 2012;8(6):337-347.
15. He J, Tsai L, Leong Y, et al. Circulating precursor CCR7(lo)PD-1(hi) CXCR5⁺ CD4⁺ T cells indicate Tfh cell activity and promote antibody responses upon antigen reexposure. Immunity. 2013;39(4):770-781.
16. Hoogendijk JE, Amato AA, Lecky BR, et al. 119th ENMC international workshop: trial design in adult idiopathic inflammatory myopathies, with the exception of inclusion body myositis, 10–12 October 2003, Naarden, The Netherlands. Neuromuscul Disord. 2004;14(5):337-345.
17. Sultan SM, Allen E, Oddis CV, et al. Reliability and validity of the myositis disease activity assessment tool. Arthritis Rheum. 2008;58(11):3593-3599.
18. Isenberg DA, Allen E, Farewell V, et al. International consensus out-come measures for patients with idiopathic inflammatory myopa-thies. Development and initial validation of myositis activity and damage indices in patients with adult onset disease. Rheumatology (Oxford). 2004;43(1):49-54.
19. Betteridge Z, McHugh N. Myositis-specific autoantibodies: an important tool to support diagnosis of myositis. J Intern Med. 2016;280(1):8-23.
20. Satoh M, Tanaka S, Ceribelli A, Calise SJ, Chan EK. A Comprehensive overview on myositis-specific antibodies: new and old biomarkers in idiopathic inflammatory myopathy. Clin Rev Allergy Immunol. 2017;52(1):1-19.

| 405ZHANG et Al.
21. Yang H, Lu X, Peng Q, et al. Differential clinical associations of anti-nuclear matrix protein 2 autoantibodies in patients with idiopathic inflammatory myopathies. Arthritis Rheumatol. 2018;70(8):1288-1297.
22. Aggarwal R, Oddis CV, Goudeau D, et al. Anti-signal recognition particle autoantibody ELISA validation and clinical associations. Rheumatology. 2015;54(7):1194-1199.
23. Hardtke S, Ohl L, Förster R. Balanced expression of CXCR5 and CCR7 on follicular T helper cells determines their transient posi-tioning to lymph node follicles and is essential for efficient B-cell help. Blood. 2005;106(6):1924-1931.
24. Morita R, Schmitt N, Bentebibel S-E, et al. Human blood CXCR5(+)CD4(+) T cells are counterparts of T follicular cells and contain specific subsets that differentially support antibody secretion. Immunity. 2011;34:108-121.
25. Salajegheh M, Pinkus JL, Amato AA, et al. Permissive environment for B-cell maturation in myositis muscle in the absence of B-cell fol-licles. Muscle Nerve. 2010;42(4):576-583.
26. Ettinger R, Sims GP, Fairhurst A-M, et al. IL-21 induces differenti-ation of human naive and memory B cells into antibody-secreting plasma cells. J Immunol. 2005;175(12):7867-7879.
27. Kuchen S, Robbins R, Sims GP, et al. Essential role of IL-21 in B cell activation, expansion, and plasma cell generation during CD4+ T cell-B cell collaboration. J Immunol. 2007;179(9):5886-5896.
28. Haq SA, Tournadre A. Idiopathic inflammatory myopathies: from immunopathogenesis to new therapeutic targets. Int J Rheum Dis. 2015;18:818-825.
29. Cannons JL, Lu KT, Schwartzberg PL. T follicular helper cell diver-sity and plasticity. Trends Immunol. 2013;34:200-207.
SUPPORTING INFORMATIONAdditional supporting information may be found online in the Supporting Information section.
How to cite this article: Zhang L, Li W, Cai Y, Liu X, Peng Q, Liang L. Aberrant expansion of circulating CD4+CXCR5+CCR7loPD1hi Tfh precursor cells in idiopathic inflammatory myopathy. Int J Rheum Dis. 2020;23:397–405. https ://doi.org/10.1111/1756-185X.13782

406 | wileyonlinelibrary.com/journal/apl Int J Rheum Dis. 2020;23:406–419.© 2019 Asia Pacific League of Associations for Rheumatology and John Wiley & Sons Australia, Ltd
Received: 13 March 2019 | Revised: 15 October 2019 | Accepted: 17 October 2019
DOI: 10.1111/1756-185X.13769
O R I G I N A L A R T I C L E
Effects of thalidomide on Th17, Treg cells and TGF-β1/Smad3 pathway in a mouse model of systemic sclerosis
Yi Lu1 | Cheng Zhao1 | Ling Lei1 | Zhiqing Tao1 | Leting Zheng1 | Jing Wen1 | Xi Li2
1Department of Rheumatology and Clinical Immunology, The First Affiliated Hospital of Guangxi Medical University, Guangxi, China2Clinical Laboratory, The First Affiliated Hospital of Guangxi Medical University, Guangxi, China
CorrespondenceCheng Zhao, The First Affiliated Hospital of Guangxi Medical University, No. 6 Shuangyong Road, Qingxiu District, Nanning, Guangxi, China.Email: [email protected]
Funding informationNatural Science Foundation of Guangxi Province, Grant/Award Number: 2016GXNSFAA380175; National Natural Science Foundation of China, Grant/Award Number: 81760295
AbstractObjective: To evaluate the immune regulatory and anti-fibrosis function of thalido-mide (Thal) in systemic sclerosis (SSc), we investigated the effects of Thal on: (a) Th17 and Treg cell production; (b) related factors expression; and (c) transforming growth factor (TGF)-β1/Smad3 pathway, using a mouse model of SSc.Methods: Forty female BALB/c mice were randomly divided into a normal control (NC) group, SSc group (bleomycin [BLM]-induced experimental SSc), BLM + Thal (10 mg/kg/day) group, BLM + Thal (20) group, and BLM + Thal (30) group. Thal was administered a day after BLM. At the end of the animal experiments, mouse tissues were collected for detection of pathological changes and hydroxyproline content. Flow cytometry, real-time polymerase chain reaction, enzyme-linked immunosorb-ent assay, immunohistochemistry, Western blot and other methods were used to measure Th17, Treg cell population and their related factors, as well as TGF-β1/Smad3 pathway expression.Results: Thal treatment: (a) reduced skin, and pulmonary tissue fibrosis, inflamma-tion score, and hydroxyproline content (P < .001) in BLM-induced SSc mice; (b) re-duced the percentages of Th17 cells and associated interleukin (IL)-17A expression (both P < .05) but increased the percentages of Treg cells and its transcription factor Foxp3 expression (both P < .05); (c) correlation analysis found positive correlations between Th17/Treg ratio, the inflammatory score of the skin and pulmonary tissues, hydroxyproline content, and type I collagen messenger RNA expression (r = .8546, .8656, .6902, .6807, .8118, and .8424, respectively, P < .01); (d) Thal inhibited TGF-β1 expression and Smad3 phosphorylation (both P < .05); (e) TGF-β1 was positively cor-related with the IL-17A and Th17/Treg ratio (r = .5856, P = .005; r = .6684, P = .0107, respectively).Conclusion: Thal can effectively prevent skin and pulmonary tissue fibrosis in a mouse model of SSc through the TGF-β1/Smad3 signaling pathway and can rectify the distortion of the Th17/Treg balance in SSc by potentially regulating Th17 and Treg cell production, as well as their related factors expression.
K E Y W O R D S
SSc, TGF-β1, Th17, Thal, Treg
| 407LU et aL.
1 | INTRODUC TION
Systemic sclerosis (SSc) is a diffuse connective tissue disease that is characterized by fibrosis of the skin and internal organs, immune abnormalities and vascular lesions. SSc is considered to be an au-toimmune disease because in this disease the autoimmunity and vasculopathy characteristically precede fibrosis. Although immu-nomodulatory drugs are extensively used for SSc treatment, no ef-fective therapy has been able to completely control or reverse SSc fibrosis.
Regulatory T cells (Tregs) play a key role in maintaining immune self-tolerance and modulating immune responses. Autoimmune and allergic diseases are often associated with a reduced num-ber of Treg cells.1 Moreover, impaired balance between Tregs and Th17 cells has been recently implicated in various autoimmune dis-orders, including SSc.2 Increasing evidence supports that a distor-tion of Th17/Treg balance toward the pro-inflammatory Th17 side is related to the pathogenesis of autoimmune disorders. Emerging evidence has confirmed that the levels of Th17 expression and its cytokine interleukin (IL)17 are significantly increased in peripheral blood, skin and pulmonary tissues of SSc patients.3 The associa-tion between the increased Th17 cells and the decreased Tregs in SSc patients suggests that an imbalance of the Th17/Treg cell ratio is closely related to the pathogenesis of SSc.4,5 Therefore, ther-apeutic strategies aimed at manipulating Th17/Treg balance are now considered as the most promising approach for preventing autoimmune diseases.
Notably, transforming growth factor (TGF)-β1 is also considered a key factor for the development of SSc because of its pivotal role in fibroblast activation and tissue fibrosis.6 There are two signaling pathways of TGF-β, the Smad and non-Smad pathways. The sus-tained activation of the TGF-β1/Smad3 pathway has been found in both SSc animal models and SSc patients. Furthermore, the interac-tion between TGF-β1 and different cytokines may also be an import-ant cause of the imbalance in Th17/Treg.
Thalidomide (Thal), also known as reaction kiosk, is a glutamic acid derivative, which was initially used as an anti-inflammatory drug for the treatment of leprosy. Subsequent studies found that Thal has immunomodulatory, anti-fibrotic, anti-angiogenic and anti-inflammatory effects, and the clinical effectiveness of Thal has been confirmed in the treatment of rheumatoid arthritis, sys-temic lupus erythematosus skin lesions, Behçet's disease, multi-ple myeloma, acquired immune deficiency syndrome, and various cancers.7-10
Since Thal is a promising therapeutic agent with immune modulation and anti-fibrosis activity, this study sought to clarify whether Thal can rectify the impaired Th17/Treg balance in SSc by examining the effects of Thal on Th17 and Treg cell produc-tion and their related cytokines using a mouse model of SSc. In addition, Thal effect on the fibrosis-related TGF-β1/Smad3 path-way was also investigated. The present study provides a reliable theoretical basis for the application of Thal as a novel therapeutic agent in the clinic for SSc patients.
2 | MATERIAL S AND METHODS
2.1 | Animal experiments
Forty female BALB/c mice (specific-pathogen-free grade, aged 6-8 weeks, weighing approximately 25 g) were provided by Hunan SJA Laboratory Animal Co., Ltd. Experimental mice were housed in Guangxi Medical University Laboratory Animal Center (Nanning, China). In this study, the mice were randomly divided into 5 groups (8 mice/group), including a control group (NC group), model group (SSc group), bleomycin (BLM)+Thal group (10 mg/kg/day), BLM + Thal group (20), and BLM + Thal group (30). Prior to treatment, 2.0 * 2.0 cm of the hair was removed from the center of the mouse's back with 10% sodium sulfide solution. The mice of the NC group were treated by subcutaneously injecting 0.1 mL of phosphate-buffered saline (PBS) into the central region of the back of the mouse with a 4.5-gauge sterile injection needle. The mice in the other groups were injected with 0.1 mg of 1 mg/mL BLM solu-tion (subcutaneous daily for 3 weeks) in the same area of the back. On the second day after BLM injection, the mice in the 3 Thal treat-ment groups (BLM + Thal [10] BLM + Thal [20] and BLM + Thal [30]) were administrated 10, 20 and 30 mg/kg/day Thal, respectively. The mice in the NC and BLM groups were given the same volume of dis-tilled water as a control. On the 28th day of gavage, the tissues of the skin, pulmonary tissue and spleen as well as peripheral blood were collected for examination.
2.2 | Histopathological and immunohistochemical assessment
The skin and pulmonary tissue collected from the sacrificed mice were fixed in 4% paraformaldehyde, dehydrated, embedded in paraffin and finally sectioned into 4-μm slices. The sections were lined with hematoxylin and eosin (HE) staining and Masson stain-ing. The severity of inflammation in the skin and pulmonary tis-sues was evaluated using a semi-quantitative scoring method as previously described, including four categories (0, none; 1, little; 2, mild; 3, moderate; and 4, severe).11,12 The severity of pulmo-nary fibrosis was also semi-quantitatively assessed by the degree of pulmonary tissue fibrosis in the left middle lobe. A total of five fields (200× magnification) were randomly selected and observed to determine the degree of pulmonary tissue fibrosis from 0 (nor-mal pulmonary tissue) to 8 (total fibrous obliteration of fields).13 All of the sections were scored independently by two investiga-tors in a blinded manner.
For immunohistochemistry staining (IHC), the sections were deparaffinized to water with gradient xylene and ethanol, fol-lowed by antigen retrieval (boiled into 0.01 mol/L citrate buffer for 5 minutes) and blocking of endogenous peroxidase with 3% H2O2 for 10 minutes. Then, the sections were incubated with goat serum for 30 minutes at room temperature to block the non-spe-cific blinding and incubated overnight at 4℃. On the next day,

408 | LU et aL.
after washing with TBST (Tris-buffered saline with Tween-20), the sections were incubated with horseradish peroxidase (HRP)-conjugated secondary antibody for 15 minutes at room tem-perature and then developed with DAB (3,3-diaminobenzidine) substrate and counterstained with hematoxylin for visualization. The staining agents included rabbit anti-mouse monoclonal an-ti-IL-17A (diluted at 1:5000, R&D Systems), rabbit anti-mouse monoclonal anti-TGF-β1 (1:1000, Abcam) and rabbit anti-mouse monoclonal anti-p-Smad3 (1:500, Abcam), rabbit anti-mouse monoclonal anti-I collagen (1:2500, Abcam).
2.3 | Measurement of hydroxyproline contents in tissue samples
The hydroxyproline contents in the tissue samples were measured following the manufacturer's instructions (Jiancheng). To accu-rately weigh 50 mg of skin and pulmonary tissue they were put in a test tube, followed by incubation with 1 mL of hydrolyzate in 95°C water bath for 20 minutes. Then to adjust the pH to 6~6.8, appropriate amounts of activated carbon were added. The mix-ture was centrifuged and 1 mL of supernatant was taken for the measurement of the hydroxyproline (HYP) contents in the tissue samples. The optical density (OD) value at a wavelength of 550 nm is converted to the HYP content (mg/g), according to the following calculation formula:
2.4 | Cytokine measurement by enzyme-linked immunosorbent assay (ELISA)
The concentrations of serum IL-17A, TGF-β1, and interferon (IFN)-γ by ELISA was performed using specific kits (Cloud-Clone Corp) ac-cording to the manufacturer's protocols.
2.5 | Flow cytometric analysis assay for cytokines
To prepare the cell sample for flow cytometry analysis, the fresh spleen tissue was ground by a needle-plug section grinding method.14 The pellet was resuspended in 0.01 mol/L PBS at a cell density of 0.5-1.0 million per tube. For the antibody labeling, the cell suspen-sion (0.5-1.0 million cells in 1 mL of RPMI-1640 medium contain-ing 10% [volume fraction] fetal bovine serum) was first incubated with stimulation blocker (BD Biosciences) at a 37°C for 5 hours. Cells were stained with fluorescein isothiocyanate (FITC)-anti-CD4, then fixed and permeabilized and finally stained with PE-anti-IL-17A, PerCP-Cy5.5-anti-IL-4 and APC-anti-IFN-γ (BD Biosciences). For an-other dual immunostaining, cells were stained with FITC-anti-CD4, APC-anti-CD25, then fixed and permeabilized and finally stained
with PE-anti-Foxp3 (BD Biosciences). Flow cytometry data were analyzed using FlowJo software.
2.6 | Quantitative real-time polymerase chain reaction (qPCR)
Total RNA of the skin and pulmonary tissue tissues was extracted using TRIzol reagent (Invitrogen). RNA samples were reverse-tran-scribed into complementary DNA using a reverse transcription sys-tem with Oligo (dT) (Thermo). qPCR (absolute quantification using the standard curve method) was performed using SYBR Premix Ex Taq™ II kit (TaKaRa), and β-actin was used as an internal reference. DNA fragments purified with the plastic recycling method were used to establish a standard curve for qPCR. The relative expres-sion of messenger RNA (mRNA) was calculated using the standard curve method. The ratio of the relative expression of each cytokine to β-actin mRNA is the normalized mRNA expression level. Each sample has 3 duplicates in PCR.
2.7 | Western blot analysis
Fifty milligrams of the skin tissue was lysed for 30 minutes with RIPA lysis buffer containing phenylmethanesulfonyl fluoride and phos-
phatase inhibitor and then homogenized (Enhanced BCA Protein Assay Kit, Beyotime Biotechnology). The supernatant was collected after centrifugation at 9.5 g for 10 minutes at 4℃. An equal amount of protein was loaded on 10% sodium dodecyl sulfide-polyacrylamide gels, resolved by electrophoresis and then transferred to polyvi-nylidene difluoride membranes. After blocking with 5% bovine serum albumin for 1 hour at 25℃ to reduce non-specific binding, the mem-branes were incubated with primary antibodies overnight at 4℃. After washing three times with TBST for 10 minutes each, the membranes were incubated with secondary antibody for 1 hour. Finally, the re-sults were visualized using the enhanced chemiluminescence system. The intensity of the bands was quantified using Image-QuantTL soft-ware (General Electric Company). The staining agents included rabbit anti-mouse monoclonal anti-TGF-β1 (diluted at 1:5000, Abcam), rab-bit anti-mouse monoclonal anti-p-Smad3 (1:2500, Abcam), donkey anti-rabbit immunoglobulin G H&L (1:1000, Abcam).
2.8 | Statistical analysis
The analysis results are expressed as the mean ± SD. The significance of the difference between groups was tested using analysis of variance
HYPcontent(
�g∕mL tissue sample)
= [testOD−blankOD∕StandardOD−blankOD] ∗ Standard content (5�g∕mL) ∗ the volumeof themixture (10mL)∕weight of tissue sample

| 409LU et aL.
and the Pearson correlation method with SPSS statistical software v. 16 (SPSS). A P value of <.05 was considered statistically significant.
3 | RESULTS
3.1 | Pathological manifestations
To evaluate the pathological manifestations of the skin and pulmonary tissue in a mouse SSc model with Thal treatment, the sections were
stained with HE and Masson's trichrome. As shown in Figure 1A and B, A significant increase in dermal thickness, collagen deposition (stained in blue color, suggesting the presence of fibrosis) and many inflamma-tory infiltrates in the skin and pulmonary tissue were observed in the SSc (model) group but not in the NC group. However, after treatment with Thal in different doses, pathological manifestations of the skin and pulmonary tissue induced by BLM were alleviated, such as less dermal thickness, less frequent infiltrations of inflammatory cells and attenu-ated fibrotic features. The expression level of type I collagen mRNA in the skin and pulmonary tissue in the SSc group was significantly higher
F I G U R E 1 Effect of Thal on pathological manifestations of the skin and pulmonary tissue in a mouse model of SSc. At the end of the treatment, the skin and pulmonary tissue were taken for HE & Masson staining to evaluate the content of HYP and type I collagen. Data are representative result of HE & Masson staining, PCR and the content of HYP , mean ± SD (each group n = 8). A, HE staining (original magnification ×200); B, Masson staining (original magnification ×200); C, Skin thickness, Skin inflammation score, Pulmonary tissue fibrosis Ashcroft and Pulmonary inflammation score; D, Relative level of type I collagen mRNA expression in the skin and pulmonary tissue; E, Immunohistochemistry (IHC) analysis of type I collagen (original magnification ×400). F, Skin, pulmonary tissue hydroxyproline content. The ratio of the brown area vs the total area in each group was determined and compared with that of the SSc group, *P > .05, **P < .05, ***P < .01
(A1) (A2) (A3) (A4) (A5)
(A6) (A7) (A8) (A9) (A10)
(B1) (B2) (B3) (B4) (B5)
(B6)
(C1) (C2) (C3) (C4)
(B7) (B8) (B9) (B10)

410 | LU et aL.
than that in the NC group. After Thal treatment, its mRNA level in the pulmonary tissue was decreased in a dose-dependent manner, but that level in the skin was diminished only by treatment at a dose of 20 or 30 mg/kg/day (Figure 1D, P < .01). IHC results showed that Thal treat-ment could down-regulate the protein expression level of type I col-lagen in the skin and pulmonary tissue in a dose-dependent manner (only at 20 or 30 mg/kg/day; Figure 1E, P < .05). The content of HYP was used to evaluate the effectiveness of Thal treatment. The results showed that Thal can significantly reduce HYP in the skin and pulmo-nary tissue in a mouse SSc model. The degree of reduction by Thal treatment is proportional to the treatment dose (Figure 1F, P < .05).
3.2 | Th17, Treg, IL-17A and Foxp3
In this study, we found that compared to the NC group, the propor-tion of Th17 cells in the spleens of mice in the SSc group was in-creased significantly but that Treg cells were significantly decreased in the SSc group. However, after Thal treatment, the number of
Th17 cells was decreased in a dose-dependent manner (Figure 2A; P < .05). In the BLM + Thal (30) group, the proportion of Th17 cells in the spleen was decreased to the level of NC. Meanwhile, Treg cells were increased by Thal treatment in a dose-dependent manner (Figure 2B; P < .05). Therefore, the ratio of Th17/Treg was downreg-ulated by Thal treatment in a dose-dependent manner (Figure 2C; P < .001).
To confirm the effect of Thal on Th17 and Treg, we examined the mRNA levels of both IL-17A and Foxp3 in the treatment groups. The mRNA level of IL-17A in the skin and pulmonary tissue was de-creased by Thal treatment in a dose-dependent manner (Figure 2D; P < .05), whereas the mRNA level of Foxp3 in the pulmonary tissue was up-regulated by Thal treatment in a dose-dependent manner. However, only a dose of 20 or 30 mg/kg/day Thal increased Foxp3 mRNA expression in the skin (Figure 2E; both P < .05). The IHC re-sults also showed that in a mouse model of SSc, Thal treatment in-hibited IL-17A protein expression in the skin and pulmonary tissues in a dose-dependent manner. In the BLM + Thal (30) group, the IL-17A level of the pulmonary tissue was similar to that of the NC group
(D1) (D2)
(F1) (F2)
(E1) (E2) (E3) (E4) (E5)
(E6) (E7) (E8) (E9) (E10)
F I G U R E 1 (Continued)

| 411LU et aL.
(A1) (A2) (A3)
(A4) (A5) (A6)
(B1) (B2) (B3)
(B4) (B5) (B6)

412 | LU et aL.
(Figure 2F; P < .05). Correlation analysis revealed that the ratio of Th17/Treg was positively correlated with pathological manifesta-tions in a mouse model of SSc, such as an increased inflammation score of the skin or pulmonary tissue, higher hydroxyproline content and up-regulated type I collagen mRNA expression (Figure 2G; r val-ues were .8546, .8656, .6902, .6807, .8118 and .8424 respectively, P < .01).
3.3 | Th1 and Th2 cells
To evaluate the effect of Thal on the proportion of Th1 and Th2 cells in a mouse model of SSc, the proportion of Th1 and Th2 cells of the spleen was examined by flow cytometry analysis. In the SSc group, the percentage of Th1 (CD4+IFN-γ+) was decreased but that of Th2 cells (CD4+IL-4+) was increased. After Thal treatment, compared to the SSc group, the proportion of Th1 cells was increased, but that of Th2 cells was decreased in a dose-dependent manner (Figure 3A; both P < .05). In addition, qPCR data also showed that Thal treat-ment up-regulated the mRNA expression of IFN-γ in the skin, which is a Th17-unrelated cytokine (Figure 3B). This effect was in a dose-dependent manner (P < .05). The level of IFN-γ in the serum was also increased by Thal treatment in a dose-dependent manner, which was confirmed by ELISA (Figure 3C; P = .011).
3.4 | IL-23R and retinoic acid-related orphan receptor γ t (RORγt)
An increase in IL-23R on the surface of Th17 cells helps the mainte-nance, expansion and functions of Th17 cells, whereas RORγt has been identified as the master transcription factor required for the differentiation, maintenance, and pro-inflammatory functions of Th17 cells. To better understand the effect of Thal on the disruption of the Th17/Treg balance in SSc, the effect of Thal on the expression of both IL-23R and RORγt in a mouse model of SSc was examined. Real-time PCR results showed that in the SSc group, the mRNA ex-pressions of IL-23R in both the skin and pulmonary tissues and that of RORγt in the skin were significantly increased compared to the NC group (Figure 4A-C). After Thal treatment, the mRNA levels of both IL-23R and RORγt were decreased in a dose-dependent man-ner. Correlation analysis showed that the proportion of Th17 cells in the spleen was positively correlated with the mRNA level of IL-23R
and RORγt in the skin and that of RORγt in the pulmonary tissue (r = .9502, .5664, and .7564, respectively, P < .01).
3.5 | TGF-β1/Smad3 pathway
Activation of TGF-β1/Smad3 signaling pathway in SSc is one of the important causes for SSc fibrosis.15 In our study, the results of Western blot and immunohistochemistry demonstrated that the lev-els of TGF-β1 expression and p-Smad3 in the skin and pulmonary tissue in a mouse model of SSc were reduced by Thal in a dose-de-pendent manner (Figure 5A,B; P < .05). PCR data also showed the inhibitory effect of Thal on the mRNA level of TGF-β1 mRNA in both skin and pulmonary tissue in a dose-dependent manner (Figure 5C; P < .05).
3.6 | Correlation
TGF-β1 plays a key role in regulating the differentiation from primary T cells into Th17 and Treg cells as well as the secretion of related cytokines. Therefore, we investigated the correlation between IL-17A, TGF-β1 and Foxp3 in SSc. Analysis data re-vealed that IL-17A mRNA expression in the skin and pulmonary tissue were positively correlated with that of TGF-β1 (Figure 6A; r = .73115, .6662, both P < .001); however, the Foxp3 mRNA level in the pulmonary tissue was negatively correlated with that of TGF-β1 (r = −0.5208, P = .014) in a mouse model of SSc (Figure 6B). Similarly, in a mouse model of SSc, the protein levels of IL-17A in the skin and pulmonary tissue were also positively correlated with those of TGF-β1 (r = .8753 and .7870, both P < .01; Figure 6C). Elevated serum TGF-β1 and IL-17A were detected in a mouse SSc model. After Thal treatment, the level of TGF-β1 and IL-17A in mouse serum were decreased in a dose-dependent manner (P < .05) with a positive correlation between serum TGF-β1 and IL-17A (r = .5856, P = .005; Figure 6D). Furthermore, the level of serum TGF-β1 was positively correlated with the Th17/Treg ratio (r = .6684, P = .0107; Figure 6E). Taken together, TGF-β1 may play an important role in regulating the balance between Th17 and Treg cells as well as the secretion of related cytokines in the develop-ment of SSc. Thal treatment can reduce TGF-β expression and the expression of its associated IL-17A, IL-23R and RORγt, thereby rectifying the distortion of the Th17/Treg balance in SSc.
F I G U R E 2 Effect of Thal on Th17, Treg cell production and the expression of IL-17 and Foxp3 in a mouse model of SSc. At the end of the treatment, the percentage of Th17 and Treg cells in the spleen was measured by flow cytometry (FACS), CD4+IL-17A represents Th17 cells and CD4+CD25+FOXP3 represents Treg cells. The expression of IL-17 and Foxp3 was determined using PCR and immunohistochemistry. Data are representative results of FACS and immunohistochemistry, mean ± SD (each group n = 8). A, Representative FACS graph of Th17 cells with quantitative analysis of cell percentage. B, Representative FACS graph of Treg cells with quantitative analysis of cell percentage; C, The ratio of Th17/Treg cells; D, Relative mRNA level of IL-17 in the skin and pulmonary tissue; E, Relative mRNA level of Foxp3 in the skin and pulmonary tissue; F, Immunohistochemistry staining of IL-17 (original magnification x400) with quantitative analysis, the ratio of the brown area vs the total area was determined; G, Correlation between Th17/Treg ratio, hydroxyproline content in the skin, and pulmonary tissue, inflammation score, and mRNA level of type I collagen.*P > .05, **P < .05, ***P < .01

| 413LU et aL.
(C) (D1) (D2)
(E1) (E2)
(F1) (F2) (F3) (F4) (F5)
(F6)
(F11)
(G1) (G2) (G3)
(F12)
(F7) (F8) (F9) (F10)
F I G U R E 2 (Continued)

414 | LU et aL.
(A1)
TH1-1 TH1-2 TH1-3
TH1-4 TH1-5
TH2-1 TH2-2 TH2-3
TH2-4 TH2-5
(A2) (B) (C)

| 415LU et aL.
4 | DISCUSSION
SSc is an inflammatory fibrotic connective tissue disease. Currently, the drugs used to treat SSc mainly include vasoactive drugs, non-steroidal anti-inflammatory drugs, hormones and immunosuppres-sive agents, and anti-fibrotic drugs. Most of them are used to treat symptoms, and there are no ideal drugs that can completely control and reverse the fibrotic lesions of SSc. It is necessary to develop novel therapies for SSc treatment.
To this end, we employed a BALB/c mouse BLM model of SSc to investigate the mechanism underlying Thal treatment of SSc in this study, focusing on the effect of Thal on Th17 and Treg cells as well as the TGF-β1/Smad3 pathway. In this model, we observed a sig-nificant increase in dermal thickness, collagen deposition, inflamma-tory infiltrates, and HYP content in the skin and pulmonary tissues. All of these manifestations closely mimic the pathogenic features of human SSc, indicating that this animal model may be useful for studying the pathogenesis of human SSc.16
Immune disorder is an important factor associated with the pathogenesis of SSc, in particular, the impaired balance between Tregs and Th17 cells has recently been implicated in various au-toimmune disorders, including SSc.17,18 Some reports previously showed that Treg cells are significantly increased in all SSc phe-notypes; however, other studies revealed an increase in Th17 cells but a decrease in Treg cells in SSc with an elevated Th17/Treg ratio.2,3,5,19 Consistent with the latter findings, we found that Th17 cells were increased but Treg cells were decreased in a mouse BLM model of SSc, leading to an increased Th17/Treg ratio. Furthermore, Thal treatment can rectify the impaired Th17/Treg balance in this mouse model.
IL-17A is a major inflammatory factor secreted by Th17,20,21 and Foxp3 is a Treg-associated transcription factor that may determine the development and function of Treg. Therefore, decreased Treg cells and downregulated Foxp3 expression will promote the devel-opment of autoimmune diseases.22,23 Our study found the up-regu-lated mRNA expression of IL-17A in the skin and pulmonary tissue of SSc model mice, which can be blocked by Thal treatment. Notably, high doses of Thal treatment up-regulated Foxp3 mRNA expres-sion. Additionally, the Th17/Treg ratio was found to be positively correlated with the inflammation score of the skin, as well as the pulmonary tissue. This ratio was also positively correlated with the hydroxyproline content and the mRNA expression of type I colla-gen in a mouse model of SSc with or without Thal treatment. Thus, we speculated that Th17 and Treg cells or their secreted factors are involved in the formation of fibrosis. Our data from a mouse model of SSc were consistent with previous observations that the IL17A expression level in peripheral blood, skin and pulmonary fibrosis le-sions was increased in SSc patients, by which the expression of en-dothelial cell adhesion molecules and IL-1 as well as the proliferation of fibroblastic cells are enhanced.24,25 Therefore, the anti-fibrosis effect of Thal might occur through the regulation of the Th17/ Treg ratio and the control of the secreted cytokines associated with Th17 or Treg cells.
TGF-β1 signaling pathway plays a dichotomous role in the balance of Th17 and Treg and acts as a link between Th17 and Foxp3 + Treg cells.26,27 Under physiological conditions, TGF-β1 up-regulates the expression of both Foxp3 (transcription fac-tor for Treg cells) and RORγt (Th17 cell transcription factor) in natural CD4+ T cells. It also promotes Foxp3 binding to RORγt, thereby inhibiting the development of Th17 cells and facilitating
F I G U R E 4 Effect of Thal on the mRNA expression of IL-23R and RORγt in a mouse model of SSc. At the end of the treatment, the relative mRNA expression of IL23R and RORγt in the skin and pulmonary tissue tissues was determined by qRT-PCR. Data are representative result of PCR, mean ± SD (each group n = 8). A, The mRNA expression of RORγt in the skin; B, The mRNA expression of RORγt in the pulmonary tissue; C, The mRNA expression of IL-23R in the skin. *P > .05, **P < .05, ***P < .01
F I G U R E 3 Up-regulation of Th1 but down-regulation of Th2 cells with an increased IFN-γin BLM-induced SSc mice with Thal treatment. At the end of the treatment, the percentage of Th1 and Th2 cells in the spleen was measured by flow cytometry. The expression of IFN-γmRNA and protein was examined by PCR and ELISA. Data are representative result of FACS, PCR and ELISA, mean ± SD (each group n = 8). A, Quantitative analysis of the percentages of Th1and Th2 cells; B, Relative mRNA level of IFN-γin the skin; C, Relative level of IFN-γin serum. *P > .05, **P < .05, ***P < .01

416 | LU et aL.
the development of Treg cells. However, in the presence of pro-in-flammatory factors, the inhibitory effect of Foxp3 on RORγt can be abolished by TGF-β1, thereby promoting the differentiation of initial T cells toward Th17 cells; however, some studies showed that TGF-β1 can inhibit IL-17 production in human cells.28-30 The mechanism of the TGF-β1-mediated regulation of the Th17/Treg balance is not fully understood. In our study, we found that Thal treatment reduced the mRNA expression of IL-23R and RORγt in
skin and pulmonary tissues in a mouse model of SSc. Furthermore, the proportion of Th17 cells in the spleen positively correlated with the mRNA level of IL-23R in the skin and that in both the skin and pulmonary tissue. We also found that TGF-β1 in the serum of SSc mice was decreased by Thal treatment in a dose-depen-dent manner. The level of serum TGF-β1 positively correlated with Th17/Treg ratio and serum IL-17A level in a mouse model of SSc. A previous study demonstrated the shift of mice Treg cells
F I G U R E 5 Effect of Thal on TGF-β1 expression and Smad3 phosphorylation in a mouse model of SSc. At the end of the treatment, the skin and pulmonary tissue were taken for analysis using Western blot, immunohistochemistry and PCR. Data are representative western blot and immunohistochemistry, mean ± SD (each group n = 8). A: The expression level of TGF-β1 and phosphorylation level of Smad3 with quantitative analysis; B, Immunohistochemistry staining of TGF-β1 and p-Smad3 (original magnification ×400) with quantitative analysis. The ratio of the brown area vs the total area was determined; C, Relative mRNA level of TGF-β1. *P > .05, **P < .05, ***P < .01
(A1)(A) (A2)
PSMAD3
TGF-β1
β-actin
(B1) (B2) (B3) (B4) (B5)
(B6)
(B11)
(C1) (C2)
(B12) (B13) (B14)
(B7) (B8) (B9) (B10)

| 417LU et aL.
to Th17 cells through the activation of bone marrow-derived dendritic cells with IL-6 and lipopolysaccharide in an in vitro sys-tem.31 Therefore, we speculated that after treatment with Thal, the increased Foxp3 might bind to RORγt, thereby inhibiting the proliferation and function of Th17 cells and increasing the num-ber of Treg cells. Meanwhile, in the presence of pro-inflammatory factors, TGF-β1 also inhibited the transformation of T cells into Th17 cells. Therefore, the Thal-mediated inhibition of both TGF-β1 expression and production of either Th17 cells or IL-17A reflects the immune regulating function of Thal in SSc treatment.
TGF-β also plays an important role in SSc fibrotic lesions though the TGF-β/Smad signaling pathway, which is involved in multiple cellular processes associated with extracellular matrix components, including collagen, fibronectin and elastin as well as the pathogenesis of fibrosis.32-34 Our study demonstrated that Thal treatment inhibited TGF-β1 expression and Smad3 phosphor-ylation in a mouse model of SSc, implicating that the anti-fibrotic effect of Thal may be mediated by the TGF-β1/Smad3 signaling pathway.
In another study using the collagen-induced arthritis mouse model, Smad3 was found to restrain signal transducer and activator of tran-scription 3-induced Th17 differentiation through novel direct signal-ing networks.35 In addition, Smad3 interacts with RORγt to inhibit its transcriptional activity.36 Although the phosphorylation of Smad3 was increased in our mouse SSc model, Th17 expression was not impaired. Based on this finding, we hypothesize that the increased Th17 expres-sion in a mouse model of SSc is mainly regulated by the combination of TGF-β1 and pro-inflammatory factors, while the TGF-β1/Smad3 path-way plays a major role in the fibrosis of SSc. The increased p-Smad3, which is not able to decrease Th17 cells, fails to counteract the positive regulation of TGF-β1 on Th17. Therefore, TGF-β1 has dual functions in SSs development: fibrosis and immune disorders characterized by the distortion of Th17/Treg balance.
We also found that Th1 cells were decreased but Th2 cells were increased in SSc mice. Our findings are consistent with a pre-vious report in which the level of Th2 and Th17 cells was increased but that of Th1 cells was decreased in SSc patients, leading to a reduced ratio of Th1/Th2 and an increased ratio of Th17/Tregs.37
F I G U R E 6 Relationship between TGF-β1, Th17, Treg cells and related cytokines in BLM-induced SSc mice with Thal treatment. Data were analyzed by Pearson correlation (each group n = 8). A, Positive correlation of IL-17A mRNA with TGF-β1 mRNA level in the skin and pulmonary tissue; B, Negative correlation of Foxp3 mRNA with TGF-β1mRNA level in the pulmonary tissue; C, Positive correlation of IL-17 with TGF-β1 protein level in the skin and pulmonary tissue; D, Positive correlation of serum IL-17A level with TGF-β1; E, Positive correlation of serum TGF-β1 level with Th17/Treg ratio

418 | LU et aL.
Our study also revealed that Thal treatment can increase the pro-portion of Th1 cells but reduce that of Th2 cells with an increased mRNA expression of IFN-γ in the skin. Our results confirmed Oliver's conclusion that treatment of the peripheral blood cells of SSc patients with Thal can induce Th1-type cellular immune re-sponses and increase IFN-γ production.38 However, we could not find the reduction of serum IL-4 and decreased proportion of Th2 cells after Thal treatment, indicating that the immunomodulatory effects of Thal are primarily through the regulation of Th1 cells and related factors. It has been reported that when incubated with antibodies of IFN-γ, most of the initial T cells will differentiate into Th17 cells because IFN-γ can block TGF-β1-induced Th17 differ-entiation. Therefore, we speculated that Thal up-regulated IFN-γ expression might be associated with the inhibition of Th17 cell differentiation.
Taken together, our study revealed that: (a) Thal treatment may inhibit the activation of the TGF-β1/Smad3 signaling pathway to prevent fibrotic lesions; (b) in the presence of pro-inflammatory factors, Thal treatment can reduce TGF-β1 expression to attenuate the differentiation of primary T cells into Th17 cells; (c) Thal treat-ment can up-regulate Foxp3 expression to promote its binding to RORγt, thereby inhibiting the proliferation and function of Th17 cells; (d) Thal treatment can enhance Treg cell production; and (e) Thal treatment can increase levels of Th1 cells, but reduce that of Th2 cells, leading to increased IFN-γ expression and decreased Th17 cell production.
ACKNOWLEDG EMENTSWork on this manuscript was supported by National Natural Science Foundation of China (81760295). This manuscript has been edited and proofread by Medjaden Bioscience Limited.
CONFLIC T OF INTERE S TNo potential conflict of interest was reported by the authors.
ORCIDYi Lu https://orcid.org/0000-0002-5141-265X
R E FE R E N C E S 1. Bacchetta R, Gambineri E, Roncarolo MG. Role of regulatory
T cells and FOXP3 in human diseases. J Allergy Clin Immunol. 2007;120(2):227-235.
2. Krasimirova E, Velikova T, Ivanova-Todorova E, et al. Treg/Th17 cell balance and phytohaeagglutinin activation of T lymphocytes in peripheral blood of systemic sclerosis patients. World J Exp Med. 2017;7(3):84-96.
3. Zhou Y, Hou W, Xu KE, et al. The elevated expression of Th17-related cytokines and receptors is associated with skin lesion se-verity in early systemic sclerosis. Hum Immunol. 2015;76(1):22-29.
4. Almanzar G, Klein M, Schmalzing M, et al. Disease manifestation and inflammatory activity as modulators of Th17/Treg balance and RORC/FoxP3 methylation in systemic sclerosis. Int Arch Allergy Immunol. 2016;171(2):141-154.
5. Fenoglio D, Battaglia F, Parodi A, et al. Alteration of Th17 and Treg cell subpopulations co-exist in patients affected with systemic scle-rosis. Clin Immunol. 2011;139(3):246-257.
6. Ayers NB, Sun CM, Chen SY. Transforming growth factor-β signal-ing in systemic sclerosis. J Biomed Res. 2018;32(1):3-12.
7. Haslett P, Roche P, Butlin C, et al. Effective treatment of erythema nodosum leprosum with thalidomide is associated with immune stimulation. J Infect Dis. 2015;192(2):2045-2053.
8. Singhal S, Mehta J, Desikan R, et al. Antitumor activity of thalidomide in refractory multiple myeloma. N Engl J Med. 1999;341(21):1565-1571.
9. Jacobson JM, Greenspan JS, Spritzler J, et al. Thalidomide for the treatment of oral aphthous ulcers in patients with human immuno-deficiency virus infection. N Engl J Med. 1997;336(21):1487-1493.
10. Bartlett JB, Dredge K, Dalgleish AG. The evolution of thalidomide and its IMiD derivatives as anticancer agents. Nat Rev Cancer. 2004;4(4):314-322.
11. Yamamoto T, Takagawa S, Nishioka K, Katayama I, Mizushima Y. Effect of superoxide dismutase on bleomycin-induced dermal scle-rosis: implications for the treatment of systemic sclerosis. J Invest Dermatol. 1999;113(5):843-847.
12. Fineschi S, Bongiovanni M, Donati Y, et al. In vivo investigations on anti-fibrotic potential of proteasome inhibition in pulmonary tissue and skin fibrosis. Am J Respir Cell Mol Biol. 2008;39(4):458-465.
13. Ashcroft T, Simpson JM, Timbrell V. Simple method of estimating severity of pulmonary fibrosis on a numerical scale. J Clin Pathol. 1988;41(4):467-470.
14. Li Y, Ou-Yang YH, Fan EZ, et al. Effects of different separation methods on the expression characteristics of spleen regulatory T cells in mice (in Chinese). China Arch Otolaryngol Head Neck Surg. 2011;18:509-511.
15. Mallano T, Palumbo-Zerr K, Zerr P, et al. Activating transcription factor 3 regulates canonical TGFβ signalling in systemic sclerosis. Ann Rheum Dis. 2016;75(3):586-592.
16. Yamamoto T. The bleomycin-induced scleroderma model: what have we learnd for scleroderma pathogenesis? Arch Dermatol Res. 2006;297(8):333-344.
17. Lochner M, Wang Z, Sparwasser T. The special relationship in the development and function of T helper 17 and regulatory T cells. Prog Mol Biol Transl Sci. 2015;136:99-129.
18. Giovannetti A, Rosato E, Renzi C, et al. Analyses of T cell phenotype and function reveal an altered T cell homeostasis in systemic scle-rosis correlation with disease severity and phentypes. Clin Immunol. 2010;137(1):122-133.
19. Yang X, Yang JI, Xing X, Wan L, Li M. Increased frequency of Th17 cells in systemic sclerosis is related to disease activity and collagen overproduction. Arthritis Res Ther. 2014;16(1):1-11.
20. Khattri R, Cox T, Yasayko S-A, Ramsdell F. An essential role for scurfin in CD4+CD25+T regulatory cells. Nat Immunol. 2003;4(1):337-342.
21. Hori S, Nomura T, Sakaguchi S. Control of regulatory T cell development by the transcription factor Foxp3. Science. 2003;299(5609):1057-1061.
22. Fontenot JD, Gavin MA, Rudensky AY. Foxp3 programs the de-velopment and function of CD4+CD25+ regulatory T cells. Nat Immunol. 2003;4(4):330-336.
23. Kurasawa K, Hirose K, Sano H, et al. Increased interleukin-17 production in patients with systemic sclerosis. Arthritis Rheum. 2000;43(11):2455-2463.
24. Yang X, Yang JI, Xing X, Wan L, Li M. Increased frequency of Th17 cells in systemic sclerosis is related to disease activity and collagen overproduction. Arthritis Res Ther. 2014;16(1):1-11.
25. Massagué J. TGFβ signalling in context. Nat Rev Mol Cell Biol. 2012;13(10):616-630.
26. Mucida D, Park Y, Kim G, et al. Reciprocal Th17 regula-tory T cell differentiation mediated by retinoic acid. Science. 2007;317(5835):256-260.
27. Knochelmann HM, Dwyer CJ, Bailey SR, et al. When worlds col-lide:Th17 and Treg cells in cancer and autoimmunity. Cell Mol Immunol. 2018;15(5):458-469.

| 419LU et aL.
28. Korn T, Anderson AC, Bettelli E, Oukka M. The dynamics of ef-fector T cells and Foxp3 regulatory T cells in the promotion and regulation of autoimmune encephalomyelitis. J Neuroimmunol. 2007;191(1–2):51-60.
29. Chen Z, Tato CM, Muul L, et al. Distinst regulation of inter-leukin-17 in human T helper lymphocytes. Arthritis Rheum. 2007;56(9):2936-2946.
30. Wilson NJ, Boniface K, Chan JR, et al. cytokine profile and func-tion of human interleukin 17-producing helper T cells. Nat Immunol. 2007;8(9):950-957.
31. Acosta-Rodriguez EV, Napolitani G, Lanzavecchia A, et al. Interleukins 1β and 6 but not transforming growth factor-β are seeential for the differentiation of interleukin 17-producing human T helper cells. Nat Immunol. 2007;8(9):942-949.
32. Hu HH, Chen DQ, Wang YN, et al. New insights into TGF-β/Smad signaling in tissue fibrosis. Chem Biol Interact. 2018;292(25):76-83.
33. Aggarwal S, Ghilardi N, Xie MH, et al. Interleukin-23 promotes a distinst CD4 T cell activation state characterized by the production of interleukin-17. J Biol Chem. 2003;278(3):1910-1914.
34. Weaver CT, Hatton RD, Mangan PR, Harrington LE. IL-17 family cytokines and the expanding diversity of effector T cell Lineages. Annu Rev Immunol. 2007;25:821-852.
35. Yoon JH, Sudo K, Kuroda M, et al. Phosphorlation status deter-mines the opposing functions of Smad2/Smad3 as STAT3 cofactors in Th17 differentiation. Nature Commun. 2015;6:1-14.
36. Martinez GJ, Zhang Z, Chung Y, et al. Smad3 differentially regulates the induction of regulatory and inflammatory T cell differentiation. J Bio Chem. 2009;284(51):35283-35286.
37. Tang J, Lei L, Pan J, Zhao C, Wen J. Higher levels of serum interleu-kin-35 are associated with the severity of pulmonary fibrosis and Th2 responses in patients with systemic sclerosis. Rheumatol Int. 2018;38(8):1511-1519.
38. Oliver SJ, Moreira A, Kaplan G. Immune stimulation in sclero-derma patients treated with thalidomide. Clin Immunol. 2000;97(2): 109-120.
How to cite this article: Lu Y, Zhao C, Lei L, et al. Effects of thalidomide on Th17, Treg cells and TGF-β1/Smad3 pathway in a mouse model of systemic sclerosis. Int J Rheum Dis. 2020;23:406–419. https ://doi.org/10.1111/1756-185X.13769

420 | wileyonlinelibrary.com/journal/apl Int J Rheum Dis. 2020;23:420–427.© 2019 Asia Pacific League of Associations for Rheumatology and John Wiley & Sons Australia, Ltd
1 | INTRODUC TION
Uric acid has antioxidant properties and is related to type 2 immune responses; however, an imbalance between uric acid production in the liver and its excretion in the kidney and intestinal tract can cause elevated serum uric acid levels, and ultimately gout.1 Gout is associated not only with arthritis, but also with a variety of diseases,
including cardiovascular and renal diseases.2 Various genetic and environmental factors have been shown to affect serum uric acid levels. A variety of diets have been associated with uric acid level alterations, and alcohol is not recommended for the treatment and management of gout as it increases serum uric acid levels.3
Coffee is one of the most consumed beverages in the world, and Koreans drink approximately 12 cups of coffee weekly.4 It is
Received: 16 September 2019 | Revised: 14 October 2019 | Accepted: 29 October 2019
DOI: 10.1111/1756-185X.13753
O R I G I N A L A R T I C L E
Relationship between coffee consumption and serum uric acid level in the general Korean population: A nationwide cross-sectional study
Jae Hyun Jung1,2 | Hongdeok Seok3 | Sung Jae Choi1,2 | Cholhee Kim4 | Cho Hee Bang5 | Gwan Gyu Song1,6
1Korea University College of Medicine, Seoul, Korea2Division of Rheumatology, Department of Internal Medicine, Korea University Ansan Hospital, Ansan-si, Korea3Department of Occupational and Environmental Medicine, Busan Adventist Hospital, Sahmyook Medical Centre, Busan, Korea4Department of Physical Education, Graduate School of Incheon National University, Incheon, Korea5Ewha Womans University College of Nursing, Seoul, Korea6Division of Rheumatology, Department of Internal Medicine, Korea University Guro Hospital, Seoul, Korea
CorrespondenceGwan Gyu Song, Division of Rheumatology, Department of Internal Medicine, Korea University Guro Hospital, 148, Gurodong-ro, Guro-gu, Seoul 08308, Korea.Email: [email protected]
AbstractObjective: Coffee is one of the world's most consumed beverages, and its consump-tion is increasing. Serum uric acid levels are affected by dietary factors, and increased levels can cause a variety of diseases, including gout. This study aimed to investigate the relationship between coffee consumption and serum uric acid levels in the gen-eral Korean population.Methods: A nationwide cross-sectional study was conducted using data from the Korean National Health and Nutrition Examination Survey in 2016. A total of 3005 participants who checked serum uric acid levels and a completed coffee consumption survey were included (1146 men and 1859 women). The amount of coffee consump-tion was examined via self-reporting and categorized as none, <1 cup, 1-2 cups, 2-5 cups, and ≥5 cups of coffee consumed daily.Results: The mean serum uric acid level of the men was 5.91 ± 1.24 mg/dL and that of women was 4.29 ± 0.97 mg/dL. In the multiple linear regression analysis, there were no significant differences in the serum uric acid levels between the non-coffee-drinking group and the coffee-drinking group (<1 cup, 1-2 cups, 2-5 cups, and ≥5 cups of coffee) in both men and women (P = .569, .258, .466, and .751, respectively, in men; .185, .520, .116, and .302, respectively, in women).Conclusions: There was no significant relationship between coffee consumption and serum uric acid levels in the general Korean population.
K E Y W O R D S
coffee, cross-sectional, Korea, relationship, uric acid

| 421JUNG et al.
composed of more than a 100 substances, including caffeine, and is known to be associated with various diseases. Coffee can prevent cardiovascular disease, type 2 diabetes mellitus (DM), and inflamma-tory bowel disease but has also been shown to increase the risk of rheumatoid arthritis, osteoarthritis, and osteoporosis.4,5 However, the mechanisms underlying these relationships remain unknown. Previous studies have been conducted on the relationship between coffee consumption and hyperuricemia and gout; however, this re-lationship remains controversial. A meta-analysis found that coffee consumption reduced the risk of gout, but was not associated with the risk of hyperuricemia,6 while another meta-analysis reported that coffee consumption lowered serum uric acid levels.7 In a re-cent meta-analysis of diets and serum uric acid levels, coffee has been shown to significantly increase these levels.3 In a cohort study conducted in Korea, there was no correlation between coffee con-sumption and serum uric acid levels; however, there were limitations in the age-related and geographical factors of participants.8 Thus, we investigated the relationship between coffee consumption and serum uric acid levels in the general Korean population using data from the Korean National Health and Nutrition Examination Survey (KNHANES).
2 | MATERIAL S AND METHODS
This study was a cross-sectional study that used data from the 7th KNHANES in 2016. KNHANES is a nationwide survey conducted by the Korea Centers for Disease Control and Prevention and is considered to provide a nationally representative sample among Koreans, including individuals aged ≥1 year and using stratified multi-stage clustered probability sampling.9 The survey was con-ducted without obtaining approval from the Institutional Review Board, which corresponds to the guidelines for research conducted in the country for direct public welfare. This study was conducted based on the Strengthening the Reporting of Observational Studies in Epidemiology (STROBE) guidelines.
Serum uric acid levels were checked at ages ≥10 years, and cof-fee consumption questionnaires were administered to participants aged 19 to 64 years. Participants whose serum uric acid levels were tested and who completed the coffee-related questionnaires were included in the study; among these individuals, those with missing data on any of the variables analyzed in the study were excluded. Coffee consumption was examined on the basis of the participants’ self-reports in the questionnaires. The number of times of coffee consumption per month, week, and day was examined, and the amount of coffee consumed at one time was measured in teaspoons. A cup of coffee contained two teaspoons of coffee, and the aver-age caffeine contents in a cup of coffee of the 10 most frequently consumed coffee brands in Korea were 48.96 ± 7.41 mg.4 According to the amount of coffee consumption per day, we divided the par-ticipants into five groups as follows: (a) non-coffee drinkers; (b) <1 cup drinkers; (c) 1-2 cup drinkers; (d) 2-5 cup drinkers; and (e) ≥5
cup drinkers. The serum uric acid level was measured using Hitachi Automatic Analyzer 7600-210 (Hitachi) via the colorimetric method using uricase in the participants aged ≥10 years.
The participants were stratified by sex, and age, body mass index (BMI), waist circumference (WC), estimated glomerular filtration rate (eGFR) hypertension (HTN), DM, dyslipidemia, cream, sugar, and alcohol consumption, smoking status, household income, and educational level considered as potential confounding factors in-fluencing coffee consumption and serum uric acid levels. The eGFR was calculated using the Modification of Diet in Renal Disease Equation.10 HTN was defined as an average systolic/diastolic blood pressure of ≥140/90 mm Hg or the use of antihypertensive medi-cations, and pre-HTN was defined as not having HTN and a blood pressure of ≥120/80 mm Hg. DM was defined as a fasting plasma glucose (FPG) level of ≥126 mg/dL, diagnosis of DM by a clinician, or use of an oral hypoglycemic agent or injected insulin. Impaired fasting glucose was defined as not having DM and having an FPG level of 100-126 mg/dL. Dyslipidemia was defined on the basis of the following: total cholesterol level of ≥240 mg/dL, triglyceride level of ≥200 mg/dL, low-density lipoprotein cholesterol level of ≥160 mg/dL, high-density lipoprotein cholesterol level of <40 mg/dL in men and <50 mg/dL in women, or use of lipid-lowering drugs. The consumption of cream and sugar when drinking coffee was quantified as the number of teaspoons of cream or sugar consumed per day. Less than one teaspoon of cream or sugar per month was considered as no consumption. Participants classified as consum-ing cream or sugar were divided as follows: <1 teaspoon, 1-3 tea-spoons, and >3 teaspoons. Alcohol consumption was defined by the amount consumed per week. Those who consumed an average of ≥7 units of alcohol (men) and ≥5 units of alcohol (women) per week were considered heavy drinkers; ≥1 unit of alcohol per month over the past year, moderate drinkers; and no or <1 unit of alcohol per month over the past year, non-drinkers. One unit contains approxi-mately 10 mL of alcohol. Smoking status was categorized as current smokers, former smokers, and non-smokers. With respect to the current smokers, participants who smoked <10 cigarettes/d were defined as light smokers, those who smoked 10-20 cigarettes/d as moderate smokers, and those who smoked >20 cigarettes/d as heavy smokers. Household income level was divided into quartiles based on monthly income: lowest (USD < 918.3), medium-lowest (USD 918.3-1836.5), medium-highest (USD 1826.6-3213.9), and highest (USD > 3213.9). The educational levels were classified as primary school or lower, middle school, high school, and university or higher.
The participants were divided into five groups by the amount of coffee consumption. Continuous variables were expressed as means ± standard deviations and categorical variables as total numbers and percentages. For continuous variables, normality was tested using analysis of variance and the t test was used for those with a normal distribution. Categorical variables with a normal dis-tribution were subjected to the Chi-square test. The differences in the serum uric acid levels between the non-coffee-drinking and

422 | JUNG et al.
coffee-drinking groups were analyzed using four different multiple linear regression models. Each model sequentially adjusted for phys-ical information, renal function, comorbidities, consumption pattern of preference, and socioeconomic status. Model I was adjusted for age, BMI, WC, and eGFR. Model II was adjusted for age, BMI WC, eGFR, and the presence of HTN, DM, and dyslipidemia. Model III was adjusted for age, BMI, WC, eGFR, the presence of HTN, DM, and dyslipidemia, cream, sugar, and alcohol consumption, and smoking status. Model IV was adjusted for age, BMI, WC, eGFR, the presence of HTN, DM, and dyslipidemia, cream, sugar, and, alcohol consump-tion, smoking status, household income, and educational level. For all difference estimates, we calculated 95% confidence intervals, and P < .05 was considered statistically significant. All analyses were per-formed using the SPSS version 23.0 (IBM).
3 | RESULTS
3.1 | Baseline characteristics of participants
Of the 8150 participants from the 7th KNHANES, 5145 were ex-cluded for the following reasons: unchecked serum uric acid lev-els (n = 1604), no survey data on health and coffee consumption (n = 3365), and missing information regarding the variables in this study (n = 176). Finally, a total of 3005 participants were included in the study (1146 men and 1859 women).
The age of the male participants was 42.86 ± 12.50 years, and that of the female participants was 43.24 ± 12.22 years; their serum uric acid levels were 5.91 ± 1.24 mg/dL and 4.29 ± 0.97 mg/dL, respectively. In the male participants, there were significant differences in the demographic characteristics other than BMI, presence of HTN, and cream, sugar, and alcohol consumption; and in the female participants, there were significant differences in all characteristics, except for the presence of DM (Table 1). With re-spect to both male and female participants, those who did not drink coffee were younger and had a smaller WC than those who did. Sugar and cream consumption also differed significantly accord-ing to the amount of coffee consumption in both male and female participants.
3.2 | Relationship between coffee consumption and serum uric acid levels
In the male participants, there were no significant differences in the serum uric acid levels between the non-coffee-drinking group and coffee-drinking groups in all models. Among the female partici-pants, those who drank more than two cups of coffee had higher serum uric acid levels than those who did not drink coffee in model I (≥5 cups, P = .049; 2-5 cups, P = .010) and II (≥5 cups, P = .033; 2-5 cups, P = .005); however, there were no significant differences in the serum uric acid levels in models III and IV (Table 2).
4 | DISCUSSION
The serum uric acid levels of the male participants were approxi-mately higher by 1.6 mg/dL than those of the female participants in the general Korean populations; most of the former drank 1-2 cups of coffee, while most of the latter drank <1 cup of coffee. There were no significant associations between coffee consumption and serum uric acid levels in both the male and female participants. Although not statistically significant, the coffee drinkers had higher serum uric acid levels than the non-coffee drinkers.
In the crude model and in Models I and II, female participants who drank more than two cups of coffee a day had significantly higher serum uric acid levels than those who did not drink cof-fee. However, after adjusting for sugar, cream, and alcohol con-sumption and smoking status, there was no significant difference in serum uric acid levels between female participants who con-sumed coffee and those who did not. Alcohol is known to increase serum uric acid levels; ethanol enhances the degradation of ade-nine nucleotides and increases the serum lactic acid level, causing hyperuricemia.11 Conversely, smoking is known to decrease serum uric acid levels; the cyanide present in cigarettes is thought to in-hibit the production of uric acid by inhibiting xanthine oxidase.12 In addition, sugar has been shown to increase serum uric acid lev-els and cream has been shown to decrease serum uric acid levels.3 Therefore, in this study, significant differences in sugar, cream, alcohol and tobacco consumption of individuals may have influ-enced the relationship between coffee consumption and serum uric acid levels. It is also possible that additional lifestyle factors associated with drinking and smoking influenced serum uric acid levels.
The relationship of coffee consumption with serum uric acid levels is still controversial in a number of studies. Coffee has been shown to improve the function of the pancreatic β cells, causing insulin levels and sensitivity to increase.13,14 A previous cross-sec-tional study also reported that coffee consumption was inversely correlated with metabolic syndrome, which is closely related to hyperuricemia and gout.15 However, methylxanthine derived from coffee increases the production of uric acid in the liver via de-methylation. An increased serum uric acid level is associated with increased insulin resistance and blood pressure and affects lipid metabolism leading to hypertriglyceridemia.16,17 In addition, insu-lin has the ability to suppress excretion of uric acid, and coffee in-creases the serum uric acid levels by raising the insulin levels.14 As such, coffee affects serum uric acid levels via a variety of mecha-nisms. In addition, the coffee's effect on serum uric acid levels may differ according to the type of coffee bean, types of coffee, and amount of coffee consumption.
Depending on the type of coffee beans, the components of cof-fee including methylxanthine, phenolic acid ester, and diketopiper-azine class differ.18 There is a difference depending on the use of caffeinated or decaffeinated coffee, and the composition of sac-charides and proteins changes depending on the roasting method

| 423JUNG et al.
(Continues)
TA B L E 1 Demographic characteristics of the (A) male and (B) female study subjects according to coffee consumption
(A)
Male participants
Coffee consumption
PTotal(n = 1146)
≥5 cups(n = 27)
2-5 cups(n = 274)
1-2 cups(n = 397)
<1 cup(n = 327)
None(n = 121)
Age, y 40.70 ± 7.97 41.77 ± 11.89 45.68 ± 10.86 42.28 ± 14.04 38.16 ± 13.32 .000 42.86 ± 12.50
BMI, kg/m2 24.79 ± 2.87 25.04 ± 3.46 24.99 ± 3.60 24.59 ± 3.67 24.04 ± 3.35 .063 24.78 ± 3.55
WC, cm 86.87 ± 8.15 87.34 ± 9.15 87.18 ± 9.25 85.90 ± 9.87 83.68 ± 8.85 .002 86.48 ± 9.40
eGFR, mL/min/1.73 m2 99.66 ± 16.22 94.66 ± 16.13 92.74 ± 13.97 95.74 ± 17.29 96.83 ± 19.30 .019 94.65 ± 16.20
Hypertension .942
Normal 12 (44.5) 106 (38.7) 148 (37.3) 128 (39.1) 50 (41.3) 444 (38.7)
Prehypertension 9 (33.3) 91 (33.2) 140 (35.3) 104 (31.8) 43 (35.5) 387 (33.8)
Hypertension 6 (22.2) 77 (28.1) 109 (27.4) 95 (29.1) 28 (23.2) 315 (27.5)
Diabetes mellitus .020
Normal 18 (66.7) 185 (67.5) 227 (57.2) 201 (61.5) 89 (73.5) 720 (62.8)
Impaired fasting glucose
8 (29.6) 63 (23.0) 133 (33.5) 95 (29.0) 21 (17.4) 320 (27.9)
Diabetes mellitus 1 (3.7) 26 (9.5) 37 (9.3) 31 (9.5) 11 (9.1) 106 (9.3)
Dyslipidemia .019
Normal 17 (63.0) 128 (46.7) 202 (50.9) 185 (56.6) 75 (62.0) 607 (53.0)
Dyslipidemia 10 (37.0) 146 (53.3) 195 (49.1) 142 (43.4) 46 (38.0) 539 (47.0)
Cream consumption .000
None 10 (37.0) 114 (41.6) 50 (12.6) 83 (25.4) 121 (100.0) 378 (33.0)
<1 teaspoon 6 (22.3) 68 (24.8) 61 (15.4) 244 (74.6) 0 (0.0) 379 (33.1)
1-3 teaspoons 10 (37.0) 73 (26.7) 286 (72.0) 0 (0.0) 0 (0.0) 369 (32.2)
>3 teaspoons 1 (3.7) 19 (6.9) 0 (0.0) 0 (0.0) 0 (0.0) 20 (1.7)
Sugar consumption .000
None 8 (29.6) 110 (40.1) 44 (11.1) 73 (22.3) 121 (100.0) 356 (31.1)
<1 teaspoon 5 (18.5) 60 (21.9) 49 (12.3) 253 (77.4) 0 (0.0) 367 (32.0)
1-3 teaspoons 11 (40.8) 83 (30.3) 303 (76.3) 1 (0.3) 0 (0.0) 398 (34.7)
>3 teaspoons 3 (11.1) 21 (7.7) 1 (0.3) 0 (0.0) 0 (0.0) 25 (2.2)
Alcohol drinking status .142
Non-drinker 16 (59.3) 124 (45.3) 180 (45.4) 123 (37.6) 45 (37.2) 488 (42.6)
Moderate drinker 8 (29.6) 124 (45.3) 174 (43.8) 169 (51.7) 58 (47.9) 533 (46.5)
Heavy drinker 3 (11.1) 26 (9.4) 43 (10.8) 35 (10.7) 18 (14.9) 125 (10.9)
Smoking status .000
Non-smoker 5 (18.5) 59 (21.5) 66 (16.6) 104 (31.8) 57 (47.0) 291 (25.4)
Former smoker 7 (25.9) 89 (32.5) 149 (37.5) 129 (39.5) 36 (29.8) 410 (35.8)
Light smoker 0 (0.0) 15 (5.5) 33 (8.3) 30 (9.2) 6 (5.0) 84 (7.3)
Moderate smoker 5 (18.5) 60 (21.9) 96 (24.2) 40 (12.2) 16 (13.2) 217 (18.9)
Heavy smoker 10 (37.1) 51 (18.6) 53 (13.4) 24 (7.3) 6 (5.0) 144 (12.6)
Household income .011
Lowest 0 (0.0) 17 (6.2) 26 (6.5) 32 (9.8) 15 (12.4) 90 (7.9)
Lower middle 8 (29.6) 53 (19.3) 102 (25.7) 69 (21.1) 33 (27.3) 265 (23.1)
Upper middle 9 (33.3) 86 (31.4) 130 (32.7) 118 (36.1) 24 (19.8) 367 (32.0)
Highest 10 (37.1) 118 (43.1) 139 (35.0) 108 (33.0) 49 (40.5) 424 (37.0)

424 | JUNG et al.
(A)
Male participants
Coffee consumption
PTotal(n = 1146)
≥5 cups(n = 27)
2-5 cups(n = 274)
1-2 cups(n = 397)
<1 cup(n = 327)
None(n = 121)
Educational level .019
Primary school or lower
1 (3.7) 12 (4.4) 29 (7.3) 20 (6.1) 3 (2.5) 65 (5.7)
Middle school 3 (11.1) 19 (6.9) 29 (7.3) 25 (7.7) 4 (3.3) 80 (7.0)
High school 9 (33.3) 74 (27.0) 140 (35.3) 124 (37.9) 55 (45.4) 402 (35.1)
University or higher 14 (51.9) 169 (61.7) 199 (50.1) 158 (48.3) 59 (48.8) 599 (52.2)
Uric acid level, mg/dL 5.87 ± 1.08 5.97 ± 1.30 5.92 ± 1.29 5.90 ± 1.17 5.74 ± 1.19 .562 5.91 ± 1.24
(B)
Female participants
Coffee consumption
PTotal(n = 1859)
≥5 cups(n = 30)
2-5 cups(n = 363)
1-2 cups(n = 570)
<1 cup(n = 640)
None(n = 256)
Age, y 39.27 ± 8.27 41.16 ± 10.05 45.91 ± 10.66 43.65 ± 13.15 39.67 ± 14.59 .000 43.24 ± 12.22
BMI, kg/m2 22.78 ± 4.45 23.23 ± 3.48 23.66 ± 3.63 23.16 ± 3.56 22.52 ± 3.47 .001 23.23 ± 3.59
WC, cm 77.2 ± 12.205 77.93 ± 9.41 79.37 ± 9.51 78.27 ± 9.62 76.55 ± 9.69 .002 78.29 ± 9.63
eGFR, mL/min/1.73 m2 102.80 ± 18.46 100.05 ± 17.87 97.88 ± 17.69 101.11 ± 18.59 104.81 ± 20.08 .000 100.45 ± 18.51
Hypertension .006
Normal 23 (76.7) 243 (66.9) 334 (58.6) 413 (64.5) 184 (71.9) 1197 (64.4)
Prehypertension 4 (13.3) 74 (20.4) 122 (21.4) 117 (18.3) 41 (16.0) 358 (19.3)
Hypertension 3 (10.0) 46 (12.7) 114 (20.0) 110 (17.2) 31 (12.1) 304 (16.4)
Diabetes mellitus .436
Normal 25 (83.3) 294 (81.0) 428 (75.1) 485 (75.8) 200 (78.1) 1432 (77.0)
Impaired fasting glucose
3 (10.0) 53 (14.6) 105 (18.4) 114 (17.8) 37 (14.5) 312 (16.8)
Diabetes mellitus 2 (6.7) 16 (4.4) 37 (6.5) 41 (6.4) 19 (7.4) 115 (6.2)
Dyslipidemia .017
Normal 17 (56.7) 210 (57.9) 265 (46.5) 329 (51.4) 128 (50.0) 949 (51.0)
Dyslipidemia 13 (43.3) 153 (42.1) 305 (53.5) 311 (48.6) 128 (50.0) 910 (49.0)
Cream consumption .000
None 15 (50.0) 166 (45.7) 130 (22.8) 228 (35.6) 256 (100.0) 795 (42.7)
<1 teaspoon 8 (26.7) 126 (34.7) 151 (26.5) 412 (64.4) 0 (0.0) 697 (37.5)
1-3 teaspoons 3 (10.0) 46 (12.7) 287 (50.3) 0 (0.0) 0 (0.0) 336 (18.1)
>3 teaspoons 4 (13.3) 25 (6.9) 2 (0.4) 0 (0.0) 0 (0.0) 31 (1.7)
Sugar consumption .000
None 17 (56.7) 181 (49.9) 126 (22.1) 217 (33.9) 256 (100.0) 797 (42.9)
<1 teaspoon 7 (23.3) 112 (30.8) 133 (23.3) 422 (65.9) 0 (0.0) 674 (36.2)
1-3 teaspoons 2 (6.7) 48 (13.2) 306 (53.7) 1 (0.2) 0 (0.0) 357 (19.2)
>3 teaspoons 4 (13.3) 22 (6.1) 5 (0.9) 0 (0.0) 0 (0.0) 31 (1.7)
Alcohol drinking status .000
Non-drinker 4 (13.3) 66 (18.2) 150 (26.3) 172 (26.9) 105 (41.0) 497 (26.7)
Moderate drinker 19 (63.4) 234 (64.5) 324 (56.9) 385 (60.1) 117 (45.7) 1079 (58.1)
Heavy drinker 7 (23.3) 63 (17.3) 96 (16.8) 83 (13.0) 34 (13.3) 283 (15.2)
Smoking status .000
Non-smoker 21 (70.0) 295 (81.3) 504 (88.4) 594 (92.8) 232 (90.6) 1646 (88.6)
(Continues)
TA B L E 1 (Continued)

| 425JUNG et al.
(eg, light, medium, or dark degree) of the coffee.19 In the process of roasting coffee, the thermal reaction forms melanoidins through the Maillard reaction. In addition, depending on the taste of coffee, the
additions in the coffee differ. Skimmed milk lowers serum uric acid levels, while sugar increases such.3 The most common type of coffee consumed in Korea is premixed sugar and cream,20 which is high in
(B)
Female participants
Coffee consumption
PTotal(n = 1859)
≥5 cups(n = 30)
2-5 cups(n = 363)
1-2 cups(n = 570)
<1 cup(n = 640)
None(n = 256)
Former smoker 4 (13.4) 34 (9.4) 31 (5.4) 31 (4.8) 14 (5.5) 114 (6.1)
Light smoker 1 (3.3) 19 (5.2) 16 (2.8) 10 (1.6) 3 (1.1) 49 (2.6)
Moderate smoker 3 (10.0) 12 (3.3) 16 (2.8) 4 (0.6) 5 (2.0) 40 (2.2)
Heavy smoker 1 (3.3) 3 (0.8) 3 (0.8) 1 (0.2) 2 (0.8) 10 (0.5)
Household income .002
Lowest 1 (3.3) 24 (6.6) 57 (10.0) 57 (8.9) 23 (9.0) 162 (8.7)
Lower middle 6 (20.0) 76 (20.9) 124 (21.8) 154 (24.1) 83 (32.4) 443 (23.8)
Upper middle 11 (36.7) 104 (28.7) 186 (32.6) 217 (33.9) 84 (32.8) 602 (32.4)
Highest 12 (40.0) 159 (43.8) 203 (35.6) 212 (33.1) 66 (25.8) 652 (35.1)
Educational level .000
Primary school or lower
0 (0.0) 11 (3.0) 65 (11.4) 80 (12.5) 23 (9.0) 179 (9.6)
Middle school 2 (6.7) 17 (4.7) 57 (10.0) 47 (7.3) 27 (10.5) 150 (8.1)
High school 9 (30.0) 111 (30.6) 230 (40.4) 243 (38.0) 111 (43.4) 704 (37.9)
University or higher 19 (63.3) 224 (61.7) 218 (38.2) 270 (42.2) 95 (37.1) 826 (44.4)
Uric acid level, mg/dL 4.61 ± 0.96 4.49 ± 0.97 4.25 ± 1.03 4.26 ± 0.90 4.20 ± 0.99 .000 4.29 ± 0.97
Note: Values are presented as means ± standard deviations or numbers (%).Abbreviations: BMI, body mass index; WC, waist circumference; eGFR, estimated glomerular filtration rate.
TA B L E 1 (Continued)
TA B L E 2 Unstandardized coefficients (B) and P values of differences in serum uric acid level according to coffee consumption of (A) male and (B) female subjects
(A)
Male participants ≥5 cups (n = 27)
P
2-5 cups (n = 274)
P
1-2 cups (n = 397)
P
<1 cup (n = 327)
PModel B B B B
Crude .032 .609 .076 .100 .093 .159 .158 .208
I .023 .690 .061 .169 .107 .094 .158 .194
II .027 .649 .061 .166 .107 .095 .173 .148
III .031 .736 .051 .329 .118 .225 .082 .622
IV .030 .751 .039 .466 .110 .258 .095 .569
(B)
Female participants ≥5 cups (n = 30)
P
2-5 cups (n = 363)
P
1-2 cups (n = 570)
P
<1 cup (n = 640)
PModel B B B B
Crude .102 .034 .097 .000 .024 .536 .054 .430
I .088 .049 .064 .010 −.025 .502 .018 .784
II .095 .033 .069 .005 −.017 .653 .030 .638
III .051 .369 .049 .087 .029 .554 .099 .223
IV .060 .302 .047 .116 .032 .520 .109 .185

426 | JUNG et al.
calories and can increase serum uric acid levels. Coffee drinkers in Korea had lower levels of vitamin or fiber intake than non-coffee drinkers,20 and vitamin C and fiber intake were suggested to be asso-ciated with lower serum uric acid levels.21,22 Therefore, the associa-tion between coffee consumption and serum uric acid levels reflects the overall life style, including the social and cultural backgrounds, of coffee drinkers, rather than the idea that certain components of coffee affect serum uric acid levels.
This study was a nationwide study providing data that can rep-resent the serum uric acid levels and coffee consumption patterns in the general Korean population. This study included individuals aged ≥10 years from both urban and rural areas; thus, the results are representative because of the absence of age and geographi-cal limitations. In addition, both male and female participants were analyzed separately to minimize the effect of sex, and various con-founding factors were adjusted. Most of the uric acid was excreted through the kidneys, and renal function was crucial for regulating serum uric acid levels; thus, the eGFR and the amount of alcohol consumption, which is one of the major risk factors of hyperurice-mia and gout, were adjusted. Cream and sugar added when drink-ing coffee can increase serum uric acid levels, which were adjusted for the amount of sugar and cream consumed. In addition, factors related to metabolic syndrome, such as WC, BMI, and presence of DM, HTN, and dyslipidemia were considered, and the socioeco-nomic status, which could affect coffee drinking and other dietary habits, was also considered. Another strength of this study was that one protocol was used; the same machines were used for the laboratory test; and the same questionnaire was used to reduce measurement errors.
Despite the several strengths, this study had some limitations. First, because this study was a cross-sectional study, causal relation-ships cannot be determined. Although coffee consumption gener-ally can affect serum uric acid levels, it is conceivable that serum uric acid levels are determined by the amount of coffee consumed. Second, coffee consumption was estimated using the questionnaire findings, which may be erroneous depending on the memory of the participant. Third, no surveys on the kinds of coffee beans and the type of coffee used and investigations on food taken other than cof-fee and alcohol were conducted. Finally, there were no data on the use of drugs, including antihypertensives, that affect uric acid levels, such as diuretics or losartan.23
In conclusion, there was no significant relationship between coffee consumption and serum uric acid levels in both the male and female participants among the general Korean population. Although possible confounding factors were considered, there were limita-tions to the interpretation of this result, as various factors influ-ence coffee consumption and serum uric acid levels. Nevertheless, the study findings reflect the actual state of serum uric acid levels among coffee drinkers in the Korean population.
CONFLIC T OF INTERE S TThe authors report no conflicts of interest.
ORCIDJae Hyun Jung https://orcid.org/0000-0002-3835-3587 Hongdeok Seok https://orcid.org/0000-0002-4202-2617 Sung Jae Choi https://orcid.org/0000-0002-0717-1203 Cholhee Kim https://orcid.org/0000-0001-7158-7302 Cho Hee Bang https://orcid.org/0000-0002-8347-8776 Gwan Gyu Song https://orcid.org/0000-0002-6522-2240
R E FE R E N C E S 1. El Ridi R, Tallima H. Physiological functions and pathogenic poten-
tial of uric acid: a review. J Adv Res. 2017;8:487-493. 2. Bardin T, Richette P. Impact of comorbidities on gout and hyperuri-
caemia: an update on prevalence and treatment options. BMC Med. 2017;15:123.
3. Major TJ, Topless RK, Dalbeth N, Merriman TR. Evaluation of the diet wide contribution to serum urate levels: meta-analysis of pop-ulation based cohorts. BMJ. 2018;363:k3951.
4. Bang CH, Kim C, Kim JH, Choi SJ, Song GG, Jung JH. Is knee os-teoarthritis related to coffee drinking? A nationwide cross-sectional observational study. Clin Rheumatol. 2018;38:817-825.
5. Higdon JV, Frei B. Coffee and health: a review of recent human re-search. Crit Rev Food Sci Nutr. 2006;46:101-123.
6. Zhang Y, Yang T, Zeng C, et al. Is coffee consumption associated with a lower risk of hyperuricaemia or gout? A systematic review and meta-analysis. BMJ Open. 2016;6:e009809.
7. Park KY, Kim HJ, Ahn HS, et al. Effects of coffee consumption on serum uric acid: systematic review and meta-analysis. Semin Arthritis Rheum. 2016;45:580-586.
8. Bae J, Park PS, Chun BY, et al. The effect of coffee, tea, and caf-feine consumption on serum uric acid and the risk of hyperuri-cemia in Korean multi-rural communities cohort. Rheumatol Int. 2015;35:327-336.
9. Kweon S, Kim Y, Jang MJ, et al. Data resource profile: the Korea National Health and Nutrition Examination Survey (KNHANES). Int J Epidemiol. 2014;43:69-77.
10. Levey AS, Bosch JP, Lewis JB, Greene T, Rogers N, Roth D. A more accurate method to estimate glomerular filtration rate from serum creatinine: a new prediction equation. Modification of diet in renal disease study group. Ann Int Med. 1999;130:461-470.
11. Yamamoto T, Moriwaki Y, Takahashi S. Effect of ethanol on metab-olism of purine bases (hypoxanthine, xanthine, and uric acid). Clin Chim Acta. 2005;356:35-57.
12. Fanning N, Merriman TR, Dalbeth N, Stamp LK. An association of smoking with serum urate and gout: a health paradox. Sem Arthritis Rheum. 2018;47:825-842.
13. Gao F, Zhang Y, Ge S, et al. Coffee consumption is positively re-lated to insulin secretion in the Shanghai High-Risk Diabetic Screen (SHiDS) study. Nutr Netab (Lond). 2018;15:84.
14. Arnlov J, Vessby B, Riserus U. Coffee consumption and insulin sen-sitivity. JAMA. 2004;291:1199-1201.
15. Kim Y, Je Y. Moderate coffee consumption is inversely associated with the metabolic syndrome in the Korean adult population. Br J Nutr. 2018;120:1279-1287.
16. Lima WG, Martins-Santos ME, Chaves VE. Uric acid as a modulator of glucose and lipid metabolism. Biochimie. 2015;116:17-23.
17. Wang H, Zhang H, Sun L, Guo W. Roles of hyperuricemia in meta-bolic syndrome and cardiac-kidney-vascular system diseases. Am J Transl Res. 2018;10:2749-2763.
18. Rothwell J, Loftfield E, Wedekind R, Freedman N, Kambanis C, Scalbert A. A metabolomic study of the variability of the chemi-cal composition of commonly consumed coffee brews. Metabolites. 2019;9.

| 427JUNG et al.
19. Kucera L, Papousek R, Kurka O, Bartak P, Bednar P. Study of com-position of espresso coffee prepared from various roast degrees of coffea arabica L. coffee beans. Food Chem. 2016;199:727-735.
20. Kim H, Han SN, Song K, Lee H. Lifestyle, dietary habits and con-sumption pattern of male university students according to the frequency of commercial beverage consumptions. Nutr Res Pract. 2011;5:124-131.
21. Kakutani-Hatayama M, Kadoya M, Okazaki H, et al. Nonpharmacological management of gout and hyperuricemia: hints for better lifestyle. Am J Lifestyle Med. 2017;11:321-329.
22. Li YP, Wang ZY, Yang HM, et al. Effects of dietary fiber on growth per-formance, slaughter performance, serum biochemical para meters, and nutrient utilization in geese. Poult Sci. 2017;96:1250-1256.
23. Jung JH, Song GG, Lee YH, Kim JH, Hyun MH, Choi SJ. Serum uric acid levels and hormone therapy type: a retrospective cohort study of postmenopausal women. Menopause. 2018;25:77-81.
How to cite this article: Jung JH, Seok H, Choi SJ, Kim C, Bang CH, Song GG. Relationship between coffee consumption and serum uric acid level in the general Korean population: A nationwide cross-sectional study. Int J Rheum Dis. 2020;23:420–427. https ://doi.org/10.1111/1756-185X.13753

428 | wileyonlinelibrary.com/journal/apl Int J Rheum Dis. 2020;23:428–434.© 2020 Asia Pacific League of Associations for Rheumatology and John Wiley & Sons Australia, Ltd
1 | INTRODUC TION
Systemic lupus erythematosus (SLE) is an autoimmune disease affect-ing multiple systems, organs and tissues.1,2 Globally, approximately 20-50 in every 100 000 people suffer from SLE,3 while in China, the prevalence of SLE is as high as 70 per 100 000, significantly higher than in Japan or other countries in East Asia.4 The sex ratio of SLE is approximately 9:1 (female-to-male), with a greater number of juvenile
and middle-aged women suffering this condition. Consequently, SLE has become a major public health concern.5 However, only recently has evidence for the possible association of SLE with environmental fac-tors, gene expression, innate immunity, acquired immunity or specific organ injury been discovered, although its complex pathogenesis has not yet been elucidated, or the pathogens involved.6,7 Thus, a greater number of in-depth studies are required to clarify the pathogenesis of SLE and search for an efficient treatment strategy.
Received: 28 June 2019 | Revised: 17 October 2019 | Accepted: 17 December 2019
DOI: 10.1111/1756-185X.13786
O R I G I N A L A R T I C L E
Clinical significance of reduced expression of lncRNA TUG1 in the peripheral blood of systemic lupus erythematosus patients
Hai-Yu Cao1 | Dong Li2 | Yun-Peng Wang3 | Hui-Xiu Lu1 | Jing Sun1 | Hai-Bin Li3
Hai-Yu Cao and Dong Li have equal contributions as the co-First Authors.
1Department of Dermatology, The First Hospital of Shijiazhuang City, Shijiazhuang, China2Department of Dermatology, Affiliated Union Hospital, Tongji Medical College, Huazhong University of Science and Technology, Wuhan, China3Department of General Medicine, The Third Affiliated Hospital of Hebei Medical University, Shijiazhuang, China
CorrespondenceHai-Bin Li, Department of General Medicine, the Third Affiliated Hospital of Hebei Medical University, No. 139, Ziqiang Road, Shijiazhuang 050051, Hebei Province, China.Email: [email protected]
AbstractObjective: To investigate the expression and clinical significance of long non-coding RNA taurine up-regulated gene 1 (lncRNA TUG1) in the peripheral blood of systemic lupus erythematosus (SLE) patients.Methods: With the peripheral blood mononuclear cells (PBMCs: T-cells, B-cells and monocytes) collected from SLE patients and healthy controls, TUG1 expression was determined to identify the correlation with the clinicopathological features of SLE patients. Thereby, the diagnostic value of TUG1 expression in diagnosis of SLE was evaluated by receiver operating characteristic (ROC) curve analysis.Results: As compared to healthy controls, SLE patients manifested a lower expres-sion of TUG1 in PBMCs, which was further decreased in SLE patients with lupus ne-phritis (P < .05). The lowest level of TUG1 was found in monocytes, rather than T-cells or B-cells (P < .05). Negative correlations were identified between TUG1 levels and SLE Disease Activity Index score (r = −.904, P < .001), erythrocyte sedimentation rate (r = −.779, P < .001), disease duration (r = −.503, P < .001) and 24-hour urinary protein (r = −.807, P < .001). Complement C3 levels were positively associated with TUG1 ex-pression (r = .817, P < .001). In addition, the area under the ROC curve of diagnostic efficiency for SLE based on TUG1 was 0.982, and 0.930 for SLE with lupus nephritis.Conclusions: The levels of lncRNA TUG1 was markedly lower in the SLE patients, which was more obvious in SLE patients with lupus nephritis, and thus, it could be a promising clinical diagnostic tool for SLE patients or SLE patients with lupus nephritis.
K E Y W O R D S
lncRNA, lupus nephritis, monocytes, systemic lupus erythematosus, TUG1

| 429CAO et Al.
Long non-coding RNAs (lncRNAs) are a group of RNAs in length of longer than 200 nt, and do not encode any proteins.8 In addition to having key roles in acquired and innate immunity, lncRNAs are also im-plicated in the differentiation and activation of immune cells and in the regulation of the development of SLE.9,10 Taurine up-regulated gene 1 (TUG1) has a length of approximately 7.1 kb and is located on human chromosome 22q12.2.11 Its abnormal expression was found in multiple malignancies, as reported recently, which was closely correlated with tumor progression.12,13 Further, TUG1 alters the autonomous immune system, suggesting the potential involvement of TUG1 in the appear-ance and progression of autoimmune diseases.14 Coincidently, a mi-croarray analysis conducted by Song et al demonstrated the differential expression of many lncRNAs between rheumatoid arthritis patients and healthy controls, including MEG9, SNHG4, TUG1 and NEAT1.15 Xu et al reported that TUG1 can protect renal tubules from lipopolysaccharide (LPS)-induced inflammatory injuries through regulation of miR-223, thereby avoiding lupus nephritis.16 Hence, we hypothesize that TUG1 might be also involved in SLE.
Therefore, this study aimed to explore the expression and clin-ical significance of TUG1 in the peripheral blood mononuclear cells (PBMCs) of SLE patients, looking forward to providing novel insights, methods and strategies for the prevention, diagnosis and treatment of SLE.
2 | MATERIAL S AND METHODS
2.1 | Ethical statements
This study was given approval by the Ethics Committee of The First Hospital of Shijiazhuang City. All participants provided signed in-formed consent after receiving the study protocol.
2.2 | Subjects
A total of 85 patients with SLE who had been hospitalized for treat-ment in the Department of Rheumatology and Immunology at this hospital between December 2017 and December 2018 were
enrolled in the study, including 12 males and 73 females, with a mean age of 36.51 ± 9.72 years. The duration of disease ranged from 1 to 12 years with a mean of 6.42 ± 3.58 years. Diagnosis of SLE was made as per the diagnostic criteria of American College of Rheumatology in 2011.17 The activity score of SLE patients was evaluated using the SLE Disease Activity Index (SLEDAI) at the time of the blood draw.18 Forty-eight SLE patients were diagnosed with lupus nephritis confirmed by renal biopsy. Since drugs may affect the TUG1 levels, the blood samples were collected from SLE pa-tients who had not taken corticosteroids or immunosuppressive drugs for at least 3 months before enrollment in the study. Blood tests, including assays to determine C-reactive protein (CRP), com-plements (C3 and C4), immunoglobulin (Ig)G, anti-double-stranded DNA (anti-dsDNA) antibody, anti-Sjögren's syndrome A (SSA) an-tibody, anti-Sjögren's syndrome B (SSB) antibody, anti-Smith (Sm) antibody and anti-nuclear ribonucleoprotein (RNP) antibody and erythrocyte sedimentation rate (ESR) were performed using stand-ard methods. The 24-hour urine protein was also routinely tested. The specific clinical manifestations referred to manifestations at the time of study. A total of 95 age-matched subjects who had attended physical examinations in the hospital were selected as healthy controls, comprising 14 males and 81 females with a mean age of 38.25 ± 10.31 years.
2.3 | Blood collection and isolation of PBMCs (monocytes, T-cells and B-cells)
At the time of TUG1 detection, 4 mL of peripheral blood was col-lected into heparin sodium anti-coagulation tubes for centrifugation at 1680 g for 5 minutes, after which the plasma (supernatant) was discarded. The blood cell pellet was then resuspended in the same volume of phosphate-buffered saline, and the resultant suspension slowly layered onto lymphocyte separation medium (Ficoll) within a centrifuge tube, followed by centrifugation at 800 g for 30 min-utes. PBMCs within the white layer were collected into a 1.5 mL Eppendorf tube for centrifugation at 6720 g for 5 minutes, the super-natant being discarded. The pellet was preserved at −70°C. Subsets of PBMCs, defined using CD3, CD14 and CD19 markers, were sorted
F I G U R E 1 Expression of long non-coding RNA taurine up-regulated gene 1 (lncRNA TUG1) in the peripheral blood of systemic lupus erythematosus (SLE) patients. A, Expression of lncRNA TUG1 in SLE patients and healthy controls. B, Expression of TUG1 in T-cells, monocytes and B-cells in SLE patients. C, Comparison of TUG1 expression in the monocytes of SLE patients and healthy controls

430 | CAO et Al.
using a BD FACSAria III following incubation of the PBMCs at 4°C for 15 minutes with the corresponding antibodies provided by BD Biosciences.
2.4 | Quantitative real-time polymerase chain reaction (qPCR)
Total RNA was extracted from cells using Trizol. RNA concentra-tion was ascertained using a UV spectrometer, with RNA tran-scribed using a PrimeScript RT kit (RR014A, TaKaRa) in order to prepare complementary DNA (cDNA). PCR was conducted using appropriate volumes of cDNA as a template, with prim-ers designed in Primer 5.0 software, which were synthesized by Nanjing GeneScript Co., Ltd. The primer sequences for TUG1 and GAPDH were: TUG1 forward: 5 -́CTGAAGAAAGGCAACATC-3 ;́ reverse: 5 -́GTAGGCTACTACAGGATTTG-3 ;́ GAPDH forward: 5 -́GTGTCTGAGCGATGTGGCT-3 ;́ reverse 5 -́GGATTTGGTCGTATT GGGC-3 .́ qPCR was performed under the instructions of the SYBR PrimeScript RT-PCR kit (TaKaRa, Ohtsu), TUG1 expression quantified using the 2−△△Ct method, where △Ct = Cttarget gene−Ctinternal reference and △△Ct = △Ctexperiment−△Ctcontrol.
2.5 | Statistics
All data were analyzed using SPSS 21.0 software (IBM). For meas-urement data, comparisons between two groups were calculated using t test. The enumeration data were expressed as frequency and compared between two groups using Chi-square test. To ascertain correlations of TUG1 expression with clinical indices, Pearson cor-relation analysis was adopted, while the diagnostic value of TUG1 expression for SLE was evaluated through analysis of a receiver op-erating characteristic (ROC) curve. Differences where P < .05 were considered statistically significant.
3 | RESULTS
3.1 | lncRNA TUG1 expression in SLE patients
As shown in Figure 1A, SLE patients exhibited lower TUG1 ex-pression in PBMCs than those from healthy controls (P < .05). To
TA B L E 1 Association of TUG1 expression in monocytes with the clinicopathological features of systemic lupus erythematous patients
Characteristics n i P
Female
Yes 73 0.450 ± 0.080 .904
No 12 0.447 ± 0.074
Oral ulcer
Yes 16 0.430 ± 0.065 .299
No 69 0.452 ± 0.078
Alopecia
Yes 11 0.432 ± 0.066 .422
No 74 0.452 ± 0.078
Arthritis
Yes 42 0.450 ± 0.080 .906
No 43 0.452 ± 0.075
Malar rash
Yes 24 0.440 ± 0.072 .516
No 61 0.452 ± 0.078
Leukopenia
Yes 22 0.450 ± 0.080 .958
No 63 0.449 ± 0.076
Lymphopenia
Yes 18 0.448 ± 0.078 .847
No 67 0.452 ± 0.078
Thrombocytopenia
Yes 9 0.442 ± 0.073 .658
No 76 0.454 ± 0.077
Neurologic disorder
Yes 4 0.397 ± 0.048 .148
No 81 0.454 ± 0.077
Serositis
Yes 5 0.429 ± 0.064 .521
No 80 0.452 ± 0.078
Lupus nephritis
Yes 48 0.403 ± 0.050 <.001
No 37 0.482 ± 0.063
Lupus anticoagulant
Yes 14 0.446 ± 0.076 .792
No 71 0.452 ± 0.078
Anti-Sjögren's syndrome A antibody
Positive 35 0.450 ± 0.080 .989
Negative 50 0.449 ± 0.076
Anti-Sjögren's syndrome B antibody
Positive 17 0.446 ± 0.076 .760
Negative 68 0.452 ± 0.078
Anti-Smith antibody
(Continues)
Characteristics n i P
Positive 23 0.427 ± 0.063 .110
Negative 62 0.456 ± 0.076
Anti-ribonuclear protein antibody
Positive 22 0.440 ± 0.072 .525
Negative 63 0.452 ± 0.078
Abbreviation: TUG1, taurine up-regulated gene 1.
TA B L E 1 (Continued)

| 431CAO et Al.
further clarify the specificity of TUG1 expression, we further ex-amined its expression in PBMC subsets (including T-cells, mono-cytes and B-cells). TUG1 was down-regulated in monocytes, when comparing to that in T-cells and B-cells in SLE patients (P < .05; Figure 1B). The expression of TUG1 in the monocytes of SLE patients was lower than that in healthy controls (P < .05; Figure 1C).
3.2 | TUG1 expression in monocytes and clinicopathological features of SLE patients
The analysis of the correlation of TUG1 expression with the clin-icopathological features of SLE patients is presented in Table 1. Consequently, TUG1 was clearly down-regulated in SLE patients with lupus nephritis, as compared to those patients without lupus nephritis (P < .05). Thus, TUG1 is possibly involved in SLE, in par-ticular SLE with lupus nephritis, there being no evident association between TUG1 expression and other features (all P > .05).
3.3 | Correlation between TUG1 expression in monocytes and clinical indices of SLE patients
TUG1 expression in the monocytes of SLE patients was nega-tively related to SLEDAI score (r = −.904, P < .001), ESR (r = −.779, P < .001), disease duration (r = −.503, P < .001) and 24-hour uri-nary protein (r = −.807, P < .001), but was positively correlated with the complement C3 (r = .817, P < .001; Figure 2). No clear correlation was identified between TUG1 expression in mono-cytes and anti-dsDNA antibody, complement C4, CRP or IgG (all P > .05).
3.4 | ROC analysis of TUG1 expression in monocytes in relation to the diagnosis of SLE
The area under the curve of the ROC curve of the expression of lncRNA TUG1 in monocytes in relation to SLE diagnosis was 0.982 (Figure 3A), while for the diagnosis of SLE with lupus nephritis it was
F I G U R E 2 Correlation analysis of taurine up-regulated gene 1 (TUG1) expression in monocytes and clinical indexes of systemic lupus erythematosus (SLE) patients. (A-H) Correlation analysis of TUG1 expression in the monocytes of SLE patients with: A, SLE Disease Activity Index (SLEDAI) score; B, complement C3; C, erythrocyte sedimentation rate (ESR); D, 24-h urinary protein; E, complement C4; F, C-reactive protein (CRP); G, anti-double-stranded DNA (anti-dsDNA) antibody; H, immunoglobulin (Ig)G; and I, disease duration, as calculated by Pearson correlation analysis

432 | CAO et Al.
0.930 (Figure 3B), suggesting that TUG1 may be a promising bio-marker for both SLE and lupus nephritis diagnosis.
4 | DISCUSSION
In this study, PBMCs isolated from SLE patients exhibited lower TUG1 expression than did those from healthy controls. Similarly, reduced expression of TUG1 has also been found in patients with diabetic nephropathy, with TUG1 being able to ameliorate the bioenergetics of the mitochondria of Sertoli cells in diabetic mice.19 Furthermore, TUG1 was down-regulated in LPS-induced injury of myocardial cells, whereas overexpression of TUG1 could be able to mitigate that in-jury, increasing cell viability and suppressing the expression of in-flammatory cytokines.20 PBMC subpopulations, including T-cells, B-cells and neutrophils, are involved in the pathogenesis of SLE, with cytokines, signaling molecules and pattern-recognition recep-tors expressed on a considerable scale as the pathological process of SLE progresses.21,22 Thus, we further isolated the PBMC subsets and found that expression of TUG1 was lower in the monocytes of SLE patients than in the T- or B-cells. Conversely, lncRNA MALAT-1 was increased in the monocytes of SLE patients, which could regu-late the levels of inflammatory cytokines in monocytes,23 while con-centrations of NEAT1 are positively correlated with disease severity and the up-regulation of inflammatory cytokines and chemotactic factors in monocytes in SLE patients.24 Increasing evidence has in-dicated that monocytes play a critical role in both innate and ac-quired immune response.25 Clear variations in the phenotypes of monocytes and lineage flexibility have been demonstrated in SLE
patients.26 Principally, TUG1 is expressed in monocytes, which in-dicates the potential involvement of TUG1 in SLE by modulating the function of monocytes.
In addition, correlation between TUG1 expression and clinico-pathological features of SLE patients was also probed. We demon-strated that TUG1 was down-regulated in SLE patients with lupus nephritis when compared with those patients with SLE alone. It has been reported that lupus nephritis is the most common and severe complication of SLE, manifesting in 40%-70% of patients. The pathogenesis of lupus nephritis is related to the generation and accumulation of autoantibodies against renal immune complexes causing inflammation of the glomeruli, with concomitant leuko-cyte infiltration and activation and proliferation of renal cells.27,28 More importantly, Xu et al reported that activation with LPS results in the down-regulation of TUG1 in renal tubule epithelial cells, but TUG1 overexpression could mitigate an LPS-induced inflammatory response through regulation of miR-223, thereby preventing lupus nephritis.16 Su et al found that TUG1 expression in liver tissues un-derwent clear down-regulation when exposed to cold environments, while TUG1 overexpression was able to alleviate cell apoptosis, ox-idative stress and inflammation, thereby protecting the liver cells from cold-induced injury.29 Evidence also demonstrates that TUG1 can suppress the expression of pro-inflammatory cytokines in an LPS-induced osteogenic arthritis model, in addition to reducing cell apoptosis.30 Thus, TUG1 may be involved in the modulation of inflam-mation, thereby altering the development and progression of lupus nephritis in SLE, but the underlying mechanism remains unclear.
Moreover, the expression of TUG1 was found to be negatively correlated with disease duration and SLEDAI score in our study,
F I G U R E 3 Receiver operating characteristic (ROC) curve analysis of taurine up-regulated gene 1 (TUG1) expression as the serum indicator of: A, systemic lupus erythematosus (SLE) and B, lupus nephritis
| 433CAO et Al.
whereas Yilun Wang et al observed the expression of other ln-cRNAs, like ENST00000604411.1 and ENST00000501122.2, were positively correlated with the SLEDAI score, showing the potential value for the assessment of disease activity in SLE.31 In contrast, the expression of TUG1 turned out to be positively cor-related with the levels of C3. Previous studies showed decreased serum C3 level in SLE patients, particularly in those SLE patients with an active disease status.32-34 Guo-Cui Wu et al also revealed a negative correlation between linc0597 and C3 levels, indicating the overexpressed linc0597 level demonstrated a positive correla-tion with disease activity.35 These findings suggested that TUG1 level might be associated with the disease activity and severity in SLE. Furthermore, the correlation between the expression of TUG1 and inflammatory markers was analyzed, and the results showed that TUG1 expression was inversely related to ESR and 24-hour urinary protein. Zhang et al found that TUG1 could in-hibit apoptosis and inflammatory injury in LPS-treated H9c2 cells by down-regulation of miR-29b.20 Liang Z et al also reported that up-regulation of TUG1 attenuated the apoptosis and inflammation induced by LPS in ATDC5 cells.30 All these studies indicated that TUG1 might be associated with inflammation and renal injury in SLE pathogenesis. In light of the association of TUG1 expression with the deterioration in health of SLE patients, it can be regarded as an indicator of disease progression. Hence, ROC curve analysis was conducted to evaluate the diagnostic potential of TUG1 ex-pression.35 TUG1 expression in monocytes was found to demon-strate excellent performance regarding diagnosis of SLE and lupus nephritis, to be a potential clinical marker for distinguishing lupus nephritis from SLE. One limitation of this study was that a func-tional study for TUG1 was not performed. Further study on the exact role of TUG1 in SLE pathogenesis is needed.
Through this study we conclude that the expression of the ln-cRNA TUG1 is substantially down-regulated in SLE patients and fur-ther decreased in those with lupus nephritis. In addition, TUG1 is a biological marker for the diagnosis of SLE and the complication of lupus nephritis. Thus, these results provide new insights and theo-retical evidence for the diagnosis and prevention of SLE.
ACKNOWLEDG EMENTSWe would like to give our sincere appreciation to the reviewers for their helpful comments on this article.
CONFLIC TS OF INTERE S TNone.
ORCIDHai-Bin Li https://orcid.org/0000-0003-0613-5347
R E FE R E N C E S 1. Elkon KB, Stone VV. Type I interferon and systemic lupus erythe-
matosus. J Interferon Cytokine Res. 2011;31(11):803-812. 2. Kim BS, Jung JY, Jeon JY, Kim HA, Suh CH. Circulating hsa-
miR-30e-5p, hsa-miR-92a-3p, and hsa-miR-223-3p may be
novel biomarkers in systemic lupus erythematosus. HLA. 2016;88(4):187-193.
3. Tsokos GC. Systemic lupus erythematosus. N Engl J Med. 2011;365(22):2110-2121.
4. Osio-Salido E, Manapat-Reyes H. Epidemiology of systemic lupus erythematosus in Asia. Lupus. 2010;19(12):1365-1373.
5. Fan H, Zhao G, Ren D, Liu F, Dong G, Hou Y. Gender differences of B cell signature related to estrogen-induced IFI44L/BAFF in systemic lupus erythematosus. Immunol Lett. 2017;181:71-78.
6. La Paglia GMC, Leone MC, Lepri G, et al. One year in review 2017: sys-temic lupus erythematosus. Clin Exp Rheumatol. 2017;35(4):551-561.
7. Novick D, Elbirt D, Miller G, Dinarello CA, Rubinstein M, Sthoeger ZM. High circulating levels of free interleukin-18 in patients with active SLE in the presence of elevated levels of interleukin-18 bind-ing protein. J Autoimmun. 2010;34(2):121-126.
8. Xiao H, Zhang F, Zou Y, Li J, Liu Y, Huang W. The Function and Mechanism of Long Non-coding RNA-ATB in Cancers. Front Physiol. 2018;9:321.
9. Johnsson P, Lipovich L, Grander D, Morris KV. Evolutionary con-servation of long non-coding RNAs; sequence, structure, function. Biochim Biophys Acta. 2014;1840(3):1063-1071.
10. Wu GC, Pan HF, Leng RX, et al. Emerging role of long noncoding RNAs in autoimmune diseases. Autoimmun Rev. 2015;14(9):798-805.
11. Niu Y, Ma F, Huang W, et al. Long non-coding RNA TUG1 is involved in cell growth and chemoresistance of small cell lung cancer by reg-ulating LIMK2b via EZH2. Mol Cancer. 2017;16(1):5.
12. Ji TT, Huang X, Jin J, Pan SH, Zhuge XJ. Inhibition of long non-cod-ing RNA TUG1 on gastric cancer cell transference and invasion through regulating and controlling the expression of miR-144/c-Met axis. Asian Pac J Trop Med. 2016;9(5):508-512.
13. Li Z, Shen J, Chan MT, Wu WK. TUG1: a pivotal oncogenic long non-coding RNA of human cancers. Cell Prolif. 2016;49(4):471-475.
14. Li J, Zhang M, An G, Ma Q. LncRNA TUG1 acts as a tumor sup-pressor in human glioma by promoting cell apoptosis. Exp Biol Med (Maywood). 2016;241(6):644-649.
15. Song J, Kim D, Han J, Kim Y, Lee M, Jin EJ. PBMC and exosome-de-rived Hotair is a critical regulator and potent marker for rheumatoid arthritis. Clin Exp Med. 2015;15(1):121-126.
16. Xu Y, Deng W, Zhang W. Long non-coding RNA TUG1 protects renal tubular epithelial cells against injury induced by lipopolysaccharide via regulating microRNA-223. Biomed Pharmacother. 2018;104:509-519.
17. Yu J, Shi B, Ma L, et al. Case report for recurrent and new-on-set SLE patients treated by high-dose glucocorticoid therapy: Characteristics of peripheral TCR beta chain CDR3 repertoires. Medicine (Baltimore). 2017;96(49):e9022.
18. Jarpa E, Babul M, Calderon J, et al. Common mental disorders and psychological distress in systemic lupus erythematosus are not as-sociated with disease activity. Lupus. 2011;20(1):58-66.
19. Long J, Badal SS, Ye Z, et al. Long noncoding RNA Tug1 regulates mitochondrial bioenergetics in diabetic nephropathy. J Clin Invest. 2016;126(11):4205-4218.
20. Zhang H, Li H, Ge A, Guo E, Liu S, Zhang L. Long non-coding RNA TUG1 inhibits apoptosis and inflammatory response in LPS-treated H9c2 cells by down-regulation of miR-29b. Biomed Pharmacother. 2018;101:663-669.
21. Yu SL, Kuan WP, Wong CK, Li EK, Tam LS. Immunopathological roles of cytokines, chemokines, signaling molecules, and pattern-recog-nition receptors in systemic lupus erythematosus. Clin Dev Immunol. 2012;2012:715190.
22. Su DL, Lu ZM, Shen MN, Li X, Sun LY. Roles of pro- and anti-inflam-matory cytokines in the pathogenesis of SLE. J Biomed Biotechnol. 2012;2012:347141.
23. Yang H, Liang N, Wang M, et al. Long noncoding RNA MALAT-1 is a novel inflammatory regulator in human systemic lupus erythemato-sus. Oncotarget. 2017;8(44):77400-77406.

434 | CAO et Al.
24. Zhang F, Wu L, Qian J, et al. Identification of the long noncoding RNA NEAT1 as a novel inflammatory regulator acting through MAPK pathway in human lupus. J Autoimmun. 2016;75:96-104.
25. Spiering MJ. Primer on the Immune System. Alcohol Res. 2015;37(2):171-175.
26. Steinbach F, Henke F, Krause B, Thiele B, Burmester GR, Hiepe F. Monocytes from systemic lupus erythematous patients are se-verely altered in phenotype and lineage flexibility. Ann Rheum Dis. 2000;59(4):283-288.
27. Clark MR, Trotter K, Chang A. The Pathogenesis and Therapeutic Implications of Tubulointerstitial Inflammation in Human Lupus Nephritis. Semin Nephrol. 2015;35(5):455-464.
28. Yung S, Chan TM. Anti-DNA antibodies in the pathogenesis of lupus nephritis–the emerging mechanisms. Autoimmun Rev. 2008;7(4):317-321.
29. Su S, Liu J, He K, et al. Overexpression of the long noncoding RNA TUG1 protects against cold-induced injury of mouse livers by inhib-iting apoptosis and inflammation. FEBS J. 2016;283(7):1261-1274.
30. Liang Z, Ren C. Emodin attenuates apoptosis and inflammation in-duced by LPS through up-regulating lncRNA TUG1 in murine chon-drogenic ATDC5 cells. Biomed Pharmacother. 2018;103:897-902.
31. Wang Y, Chen S, Chen S, et al. Long noncoding RNA expression profile and association with SLEDAI score in monocyte-derived dendritic cells from patients with systematic lupus erythematosus. Arthritis Res Ther. 2018;20(1):138.
32. Narayanan K, Marwaha V, Shanmuganandan K, Shankar S. Correlation between Systemic Lupus Erythematosus Disease Activity Index, C3, C4 and Anti-dsDNA Antibodies. Med J Armed Forces India. 2010;66(2):102-107.
33. Moller-Kristensen M, Thiel S, Hansen AG, Jensenius JC. On the site of C4 deposition upon complement activation via the mannan-bind-ing lectin pathway or the classical pathway. Scand J Immunol. 2003;57(6):556-561.
34. Selander B, Martensson U, Weintraub A, et al. Mannan-binding lec-tin activates C3 and the alternative complement pathway without involvement of C2. J Clin Invest. 2006;116(5):1425-1434.
35. Wu GC, Li J, Leng RX, et al. Identification of long non-coding RNAs GAS5, linc0597 and lnc-DC in plasma as novel biomarkers for sys-temic lupus erythematosus. Oncotarget. 2017;8(14):23650-23663.
How to cite this article: Cao H-Y, Li D, Wang Y-P, Lu H-X, Sun J, Li H-B. Clinical significance of reduced expression of lncRNA TUG1 in the peripheral blood of systemic lupus erythematosus patients. Int J Rheum Dis. 2020;23:428–434. https ://doi.org/10.1111/1756-185X.13786

Int J Rheum Dis. 2020;23:435–442. wileyonlinelibrary.com/journal/apl | 435© 2020 Asia Pacific League of Associations for Rheumatology and John Wiley & Sons Australia, Ltd
Received: 3 April 2019 | Revised: 14 August 2019 | Accepted: 20 August 2019
DOI: 10.1111/1756-185X.13787
O R I G I N A L A R T I C L E
Associations of serum citrate levels with knee structural changes and cartilage enzymes in patients with knee osteoarthritis
Fuqin Bian1 | Guangfeng Ruan1 | Jianhua Xu1 | Kang Wang1 | Juan Wu1 | Jiale Ren1 | Bingru Chang1 | Changhai Ding1,2,3
1Department of Rheumatology and Immunology, Arthritis Research Institute, The First Affiliated Hospital of Anhui Medical University, Hefei, China2Menzies Institute for Medical Research, University of Tasmania, Hobart, TAS, Australia3Clinical Research Centre, Zhujiang Hospital, Southern Medical University, Guangzhou, China
CorrespondenceChanghai Ding, Menzies Institute for Medical Research, University of Tasmania, Private Bag 23, Hobart, Tasmania 7000, Australia.Email: [email protected]
Funding informationNational Natural Science Foundation of China, Grant/Award Number: 81172865
AbstractObjective: The aim of this study was to investigate cross-sectional associations be-tween serum levels of citrate and knee structural changes and cartilage enzymes in patients with knee osteoarthritis (OA).Method: A total of 137 subjects with symptomatic knee OA (mean age 55.0 years, range 34-74, 84% female) were included. Knee radiography was used to assess knee osteophytes, joint space narrowing (JSN) and radiographic OA assessed by Kellgren-Lawrence (K-L) grading system. T2-weighted fat-suppressed fast spin echo mag-netic resonance imaging (MRI) was used to determine knee cartilage defects, bone marrow lesions (BMLs) and infrapatellar fat pad (IPFP) signal intensity alternations. Colorimetric fluorescence was used to measure the serum levels of citrate. Enzyme-linked immunosorbent assay was used to measure the serum cartilage enzymes in-cluding matrix metalloproteinase (MMP)-3 and MMP-13.Results: After adjustment for potential confounders (age, sex, body mass index), serum citrate was negatively associated with knee osteophytes at the femoral site, cartilage defects at medial femoral site, total cartilage defects, and total BMLs (odds ratio [OR] 0.17-0.30, all P < .05). Meanwhile, serum citrate was negatively associ-ated with IPFP signal intensity alteration (OR 0.30, P = .05) in multivariable analyses. Serum citrate was significantly and negatively associated with MMP-13 (β −3106.37, P < .05) after adjustment for potential confounders. However, citrate was not signifi-cantly associated with MMP-3 in patients with knee OA.Conclusion: Serum citrate was negatively associated with knee structural changes including femoral osteophytes, cartilage defects, and BMLs and also serum MMP-13 in patients with knee OA, suggesting that low serum citrate may be a potential indica-tor for advanced knee OA.
K E Y W O R D S
citrate, enzyme, magnetic resonance imaging, osteoarthritis

436 | BIAN et Al.
1 | INTRODUC TION
Osteoarthritis (OA) is a common joint disease with multiple patho-genetic mechanisms, affecting the whole joint, characterized by gradual loss of articular cartilage, formation of osteophytes, synovial inflammation, and is most common in the knee.1,2 It is one of the most prevalent causes of disability in the aging population and has enormous economic and social consequences.3 Chondrocyte apop-tosis and cartilage degradation are linked to the process of OA dis-ease.4 However, there are no effective disease-modifying drugs to inhibit the progression of cartilage degradation.1,3
Citrate is metabolized within the mitochondria as part of the citric acid cycle which is the most important metabolic pathway for energy supply.5 A recent study on immune cells suggested that citrate could regulate pro-inflammatory cytokine production via modulation of in-flammatory gene transactivation beyond simply energy production.6 In addition, citrate has shown to have an effect on solubility of calcium crystals depending on its concentration.7 The deposition of calcium crystals in human OA articular cartilage is a widespread phenomenon.8 These crystals can stimulate secretion of matrix metalloproteinase (MMP) protein by articular chondrocytes,9 and also elicit inflamma-tory responses and cartilage degradation in the knee joints of mice, suggesting that calcium crystals have a direct pathogenic role in OA.10 Therefore, citrate may be involved in the pathogenesis of OA; however, the relationship between OA and citrate is not yet fully understood.
In this study, we aimed to investigate whether serum levels of ci-trate were associated with changes in knee joint structure, including joint radiographic changes, cartilage defects, bone marrow lesions (BMLs) and infrapatellar fat pad (IPFP) signal intensity alternation and cartilage enzymes in knee OA patients.
2 | MATERIAL S AND METHODS
2.1 | Subjects
This study was part of the Anhui Osteoarthritis (AHOA) Study, a clin-ical study of 205 patients aged 34-74 years, aimed to identify the en-vironmental and biochemical factors associated with the progression of knee OA. Patients with symptomatic knee OA, diagnosed using American College of Rheumatology criteria,11 were consecutively recruited from the Department of Rheumatology and Immunology in the First Affiliated Hospital of Anhui Medical University, from January 2012 to November 2013. We excluded institutionalized persons, patients with rheumatoid arthritis or other inflammatory diseases, patients with severe knee OA who were planning to have knee arthroplasty in 2 years (this study was ongoing with 2 years of follow-up), and patients with contraindications for magnetic reso-nance imaging (MRI) (including metal sutures, presence of shrapnel, iron filings in the eye, and claustrophobia). Sixty-eight subjects were excluded from this study due to the lack of citrate data, leaving 137 subjects in the current study. The study was approved by the First Affiliated Hospital of Anhui Medical University Ethics Committee
(number: H1000589), and all participants signed informed consent forms.
2.2 | Anthropometrics
Weight was measured to the nearest 0.1 kg (with shoes, socks, and bulky clothing removed) using a single pair of electronic scales (RGZ-120) that were calibrated using a known weight at the beginning of each clinic. Height was measured to the nearest 0.1 cm (with shoes, socks and headgear removed) by using a stadiometer. Body mass index (BMI) (weight [kg]/ height [m]2) was calculated.
2.3 | Knee radiographic assessment
All patients underwent knee radiographic examination. The 15-de-gree flexion, standing, anteroposterior view image was taken in the symptomatic knees (the severer one if both knees were affected; the right one if both knees were equally painful). Radiographs were assessed for osteophytes and joint space narrowing (JSN) on a scale of 0 to 3 using the Osteoarthritis Research Society International atlas developed by Altman as follows: grade 0, normal; grade 1, mild change; grade 2, moderate change; grade 3, severe change.12 Regional subdivision of the articular surfaces, femur and tibia, are divided into medial and lateral sites. The highest osteophytes score at a subregion of each region was used to represent the score of this region. Total osteophyte scores were obtained by summing the scores of tibial and femoral sites. Total JSN scores were obtained by summing the scores of medial and lateral JSN. Radiographic severity assessment of OA was performed by using the Kellgren-Lawrence (K-L) grading system (grades 0-4). The K-L grading system was graded as follows: grade 0, normal; grade 1, no JSN, suspicious oste-ophytes; grade 2, suspicious JSN, mild osteophytes; grade 3, definite JSN, moderate osteophytes, and/or subchondral bone sclerosis; and grade 4, marked JSN, large osteophytes, and/or severe subchondral bone sclerosis.13 Radiographic OA (ROA) was defined as a K-L grade of ≥2.
2.4 | MRI assessment
MRI of the selected knee was performed with a 3.0-T whole-body MRI unit (Signa HDxT 3.0T; GE Healthcare), using a commercial transmit/receive extremity coil. The following sequence and param-eters were used: a T2-weighted fat saturation 2-dimensional fast spin echo, flip angle 90 degrees, repetition time 3067 ms, echo time 112 ms, field of view 16 cm, 15 partitions, 256 × 256 pixel matrix. Sagittal images were obtained at a slice thickness of 4 mm with an interslice gap of 1.0 mm. Images were checked for image noise and structural abnormalities interfering with segmentation. Knee carti-lage defects, BMLs and IPFP signal intensity alteration were inde-pendently measured.

| 437BIAN et Al.
Regional subdivision of the articular surfaces, femur and tibia, are divided into medial and lateral sites, with the trochlear groove of the femur considered as a part of the medial site. The femoral and tibial surfaces are further subdivided into anterior (A), central (C) and posterior (P) subregions. Region A of the femur corresponds to the patellofemoral articulation; region C the weight-bearing surface; and region P the posterior convexity that articulates only in extreme flexion.14
Cartilage defects on a 0-4 scale were assessed at each region of the medial and lateral tibial, medial and lateral femoral and patellar sites using T2-weighted images as follows: grade 0, normal cartilage; grade 1, focal blistering and intracartilaginous high-signal intensity area with an intact surface and bottom; grade 2, irregularity on the surface or bottom and loss of thickness of <50%; grade 3, deep ul-ceration with loss of thickness >50%; grade 4, full-thickness chon-dral wear with exposure of subchondral bone. The highest score at a subregion of each region was used to represent the score of this region. Total cartilage defects scores were obtained by summing the scores of medial and lateral tibial, medial and lateral femoral and pa-tellar sites. Two observers estimated cartilage defects at all sites. Intraclass correlation coefficient (ICC) in our hands were 0.89-0.94 for intraobserver reliability and 0.85-0.93 for interobserver reliabil-ity, respectively.15
Subchondral BMLs were defined as discrete areas of increased signal adjacent to subcortical bone at the tibia and femur on T2-weight MRI using a semiquantitative (0-3) scoring system:14 grade 0, normal; grade 1, <25% of the region; grade 2, 25%-50% of the region; grade 3, ≥50% of the region. The highest score at a subregion of each region was used to represent the score of this region. Total BML scores were obtained by summing the scores of medial and lat-eral tibial, medial and lateral femoral and patellar sites. One observer assessed BMLs. The intraobserver reliabilities ranged between 0.89 and 1.00, as described previously.16
IPFP signal intensity alteration on T2-weighted MRI was recorded if hyperintense signal alterations were observed within the IPFP. Signal intensity alteration, defined as discrete areas of increased signal within the IPFP, was graded as follows: grade 0, none; grade 1, <10% of the region; grade 2, 10%-20% of the region; and grade 3, >20% of the region.17 Two observers graded the IPFP signal in-tensity alteration. Intraobserver and interobserver reliabilities were assessed in 30 subjects with an ICC of 0.95 and 0.94, respectively.
2.5 | Measurements of serum citrate and cartilage enzymes
Fasting blood samples were collected from patients in the morn-ing. Serum was separated, aliquoted into plastic storage tubes, and stored at −80°C until analysis. Serum levels of citrate were measured by using colorimetric assay kit (Abcam) according to the manufactur-er's instructions. Serum levels of matrix metalloproteinase (MMP)-3 and 13 were measured by using enzyme-linked immunosorbent assay kits (Elabscience) according to the manufacturer's instructions.
2.6 | Statistical analysis
Student's t test, χ2 test, and Mann-Whitney U test were used to compare means, proportions, and medians, respectively. Univariable and multivariable ordinal logistic regression analyses were used to examine the associations between citrate (the independent variable) and K-L grading, osteophytes, JSN, cartilage defects, BMLs and IPFP signal intensity alteration before and after adjustment for age, gen-der and BMI. The residuals for linear regression models of cartilage degradation enzymes with serum citrate were not normally distrib-uted, so the Box-Cox transformations for these enzymes were per-formed. The calculated λ values were 0 and 1.5, and we did natural log transformation when λ values was 0. Linear regression analyses were used to examine the associations between serum citrate (the independent variable) and transformed MMP-3 and MMP-13 before and after adjustment for age, gender and BMI. Standard diagnos-tic checks of model fit and residuals were routinely done, and data points with large residuals and/or high influence were investigated for data errors. A P value < .05 (two-tailed) or 95% confidence in-terval (CI) not including the “1” point (for ordinal regression) was regarded as statistically significant. All statistical analyses were per-formed using SPSS 17.0 for Windows (SPSS Inc).
3 | RESULTS
A total of 137 subjects (84% female) aged between 34 and 74 years (mean 55.0 years) were included in the analyses. The median citrate level was 0.067 mmol/L. There were no significant differences in demographic factors (age, gender and BMI) between these subjects included and excluded (data not shown). Characteristics of the par-ticipants are presented in Table 1. Subjects with higher and lower levels of citrate (split at the median level) were similar in age, gender, height, weight, BMI, K-L grades, prevalence of JSN and knee ROA, total BMLs score, and levels of MMP-3 and MMP-13. However, pa-tients with higher levels of citrate had a lower prevalence of osteo-phytes, lower cartilage defects score, and lower proportions of IPFP signal intensity alteration of ≥2.
Serum levels of citrate were significantly and negatively asso-ciated with the osteophytes at femoral site before and after ad-justment for age, gender and BMI. Serum citrate had a negatively significant association with total grade of osteophytes in univariable analyses, but the association became non-significance in multi-variable analyses (Table 2). We did not find significant associations between serum citrate and osteophytes at the tibial site, JSN, K-L grade in univariable and multivariable analyses (Table 2).
Serum citrate had a negatively significant association with total cartilage defects score after adjustment for age, gender and BMI (Table 3, Figure 1). Serum citrate was significantly associated with cartilage defects at medial femoral site, but not with cartilage de-fects at lateral femoral, lateral tibial, medial tibial and patellar sites in univariable and multivariable analyses (Table 3). As for BMLs, we also found significant associations between serum citrate and total

438 | BIAN et Al.
BMLs score in multivariable analyses (Table 3). Moreover, serum citrate was significantly and negatively associated with IPFP signal intensity alteration in univariable analysis, but after adjustment for age, gender and BMI, the association became of borderline signifi-cance (Table 3).
Associations between serum citrate and cartilage enzymes are shown in Table 4. Serum citrate was significantly and negatively as-sociated with MMP-13 before and after adjustment for age, gender and BMI (Table 4). We did not find significant associations between
serum citrate and MMP-3 before or after adjustment for potential confounders.
4 | DISCUSSION
To our knowledge, this was the first clinical study to illustrate the relationship between serum levels of citrate and knee joint struc-tural changes and cartilage enzymes in patients with knee OA. After
Citrate < median (N = 68)
Citrate ≥ median (N = 69) P values
Agea 54.69 (7.90) 55.22 (8.04) .699
Female, %b 82.4 85.5 .547
Height, cma 159.67 (6.51) 159.11 (7.75) .655
Weight, kga 65.72 (11.37) 65.15 (9.92) .761
BMI (kg/m2)a 25.78 (4.39) 25.69 (3.11) .889
Total osteophytes, %b 92.2 74.1 .001
Total JSN, %b 98.4 98.3 .689
K-L grade, %b
1 21.9 31.0 .059
2 48.4 46.6
3 28.1 20.7
4 1.6 1.7
Knee ROA, %b 78.1 69.0 .149
Total cartilage defects scorea 23.04 (7.12) 20.52 (5.05) .034
Total BMLs scorea 5.68 (3.72) 4.67 (3.68) .166
IPFP signal intensity alteration ≥2, %b 47.6 32.2 .021
MMP-3, ng/mLc 0.56 (0.36, 0.80) 0.49 (0.31, 0.68) .061
MMP-13, μg/mLc 0.12 (0.07, 0.13) 0.10 (0.06, 0.12) .065
Note: Citrate median level 0.067 mmol/L (interquartile range 0.049-0.095).Abbreviations: BMI, body mass index; BMLs, bone marrow lesions; IPFP, infrapatellar fat pad; JSN, joint space narrowing; K-L, Kellgren-Lawrence; MMP, matrix metalloproteinase; ROA, radiographic osteoarthritis.at tests were used for means (standard deviations). bχ2 tests were used for the proportions. cMann-Whitney U tests were used for median (interquartile range). Data in bold denote statistically significant results.
TA B L E 1 Characteristics of participants (split by median level of citrate)
UnivariableOR (95% CI) P value
Multivariablea
OR (95% CI) P value
K-L grade 0.36 (0.12-1.13) .080 0.36 (0.11-1.16) .086
Total osteophytes 0.34 (0.12-0.98) .045 0.36 (0.12-1.08) .069
Femoral osteophytes 0.31 (0.10-0.97) .044 0.30 (0.09-0.99) .048
Tibial osteophytes 0.50 (0.16-1.62) .249 0.70 (0.21-2.35) .566
Total JSN 0.78 (0.26-2.37) .656 0.73 (0.23-2.31) .594
Note: Dependent variables: K-L grade, osteophytes in the respective site and total knee, total JSN.Independent variable: citrate.Data in bold denote statistically significant results.Abbreviations: JSN, joint space narrowing; K-L, Kellgren-Lawrence; OR, odds ratio.aAdjusted for age, gender and body mass index.
TA B L E 2 Association between citrate and K-L grade, osteophytes and JSN

| 439BIAN et Al.
adjustment for age, gender and BMI, we found that serum levels of citrate were negatively associated with osteophytes at the femoral site, cartilage defects, BMLs and serum MMP-13, and also had a trend of negative association with IPFP signal intensity alteration.
A recent study suggests that calcium crystals are commonly found in OA and are associated with cartilage destruction.10 Phosphocitrate (PC) formed by cytosolic phosphorylation of citrate in vivo18 is known as a powerful calcification inhibitor.19 PC can prevent formation and deposition of calcium crystals,19,20 inhibit crystal-induced expression of MMPs,21 and reduce the severity of cartilage degeneration in a Hartley guinea pig model of crystal-as-sociated OA.22 Although a previous study showed that citrate
concentrations in the synovial fluid (SF) of patients with calcium py-rophosphate dihydrate (CPPD) crystals and/or apatite-like material were not significantly lower than those without crystals, thus failing to show that lower amounts of citrate in SF favor the presence of crystals.23 There are studies demonstrating that citrate could also adsorb crystals and inhibit the crystallization of calcium phosphates, although this might not a very strong inhibitor.24,25
An osteophyte is “a fibrocartilage-capped bony outgrowth”, aris-ing in the periosteum overlying the bone at the junction between cartilage and bone.26 Osteophyte formation is a useful feature to determine the onset and progression of OA.27 A significant correla-tion between medial tibial osteophytes and knee joint pain has been
UnivariableOR (95% CI) P value
Multivariablea
OR (95% CI) P value
Total cartilage defects score 0.34 (0.11-1.02) .053 0.29 (0.09-0.90) .032
Lateral femoral 0.47 (0.14-1.58) .224 0.51 (0.15-1.75) .286
Lateral tibial 0.75 (0.24-2.40) .632 0.51 (0.15-1.75) .298
Medial femoral 0.15 (0.04-0.55) .004 0.17 (0.05-0.65) .009
Medial tibial 0.76 (0.24-2.45) .648 0.79 (0.24-2.62) .703
Patellar 0.41 (0.13-1.27) .121 0.38 (0.12-1.24) .109
Total BMLs score 0.33 (0.10-1.04) .058 0.30 (0.09-0.97) .045
IPFP signal intensity alteration
0.29 (0.09-0.92) .036 0.30 (0.09-1.01) .052
Note: Dependent variables: cartilage defects scores in the respective site and total knee, total BMLs, IPFP signal intensity alteration.Independent variable: citrate.Data in bold denote statistically significant results.Abbreviations: BML, bone marrow lesions; IPFP, infrapatellar fat pad; OR, odds ratio.aAdjusted for age, gender and body mass index.
TA B L E 3 Association between citrate and cartilage defects, BMLs and IPFP signal intensity alteration
F I G U R E 1 Scatter plot showing association between serum citrate and total cartilage defects

440 | BIAN et Al.
described in patients with knee OA.28 In primary knee OA, removal of marginal osteophytes significantly increased joint motion, indi-cating that osteophytes limit the movability of OA knees.29 In our study, we demonstrated that serum citrate was negatively associ-ated with knee osteophytes at the femoral site. These suggest that citrate might have a link with osteophytes in knee OA. Hada found that osteophytes in the medial tibial and/or femoral sites were pres-ent in 98% of patients with knee OA (49/50 cases).30 Although the molecular mechanisms of osteophyte formation remain unknown, experimental studies using animal models have shown that osteo-phytes develop as a result of repeated mechanical stresses or solu-ble growth factors.31,32 The causal relationship and the underlying mechanisms need to be examined by future longitudinal studies and experimental researches.
Cartilage defects are common articular abnormalities and are associated with disease severity in people with knee OA,33 and are closely associated with osteophytes and cartilage volume loss.15 Ding et al reported that knee cartilage defects severity was positively associated with urinary levels of C-terminal crosslink-ing telopeptide of type II collagen (U-CTX-II) levels, suggesting cartilage defects are associated with increased type II collagen breakdown.15 In addition, calcium crystals could deposit in the articular cartilage of patients with OA and then induce cartilage calcification and degradation.8,10 In previous studies, researchers discovered citrate could inhibit formation and growth of calcium crystals.34,35 On the other hand, researchers demonstrated that PC exerts its OA disease-modifying effect, in part, by upregulat-ing the expression of many genes classified in type II collagen and ossification, beside its effect of calcification inhibition.1,36 In the present study, we demonstrated that the serum citrate was asso-ciated with reduced knee cartilage defect score, indicating that serum citrate may have a protective effect against OA cartilage defects.
BMLs in the knee in subjects with severe OA undergoing total knee replacement consisted of several abnormalities including bone marrow necrosis, abnormal trabeculae, bone marrow fibrosis, bone marrow bleeding, and bone marrow edema.37 There is already evi-dence that BMLs are strongly related to OA. Recent studies demon-strated that decrease of BML size was associated with resolution of
knee pain.16,38 Baseline BMLs also predicted the occurrence of total knee replacement.39 A prospective study in older adults demon-strated BMLs can predict site-specific cartilage defect development and volume loss over 2.7 years.40 In this study, we found that the serum citrate was associated with decreased BMLs, suggesting ci-trate may play a protective role in subchondral bone abnormalities of OA.
IPFP is situated in the knee under the patella, between the patellar tendon, femoral condyle and tibial plateau,41 and is structurally similar to subcutaneous adipose tissue.42 Up to now, several studies consistently suggested that IPFP signal intensity alteration was detrimental for knee OA: a nested case control study demonstrated that synovitis measured using IPFP signal intensity change (Hoffa's synovitis) was associated with the de-velopment of radiographic knee OA;43 a cross-sectional study reported that the severity of inflammation in IPFP measured by dynamic contrast-enhanced MRI was associated with the sever-ity of pain in knee OA;44 and a study with both cross-sectional and longitudinal analyses reported that the signal intensity changes in IPFP were positively associated with the knee struc-tures and clinical symptoms, including the prevalence and/or in-cidence of knee cartilage defects, BMLs, ROA, and knee pain in older adults.45 In our study, we found a trend of negative associ-ation between serum citrate and IPFP signal intensity alteration, indicating citrate may have a protective effect on IPFP changes in knee OA.
MMPs are a proteinase family. MMP-13 is a member of the col-lagenase sub-family of MMPs, expressed by joint chondrocytes and synovial cells,46 and degrades type II collagen and proteoglycan in the cartilage matrix.47 Clinical study showed that OA patients with articular cartilage damage had high MMP-13 expression in chon-drocytes.48 Animal studies also revealed that excessive MMP-13 expression of transgenic mice resulted in an OA-like degradation of articular cartilage, and knock down of Mmp13 gene delayed cartilage degradation in a surgically induced OA model.49,50 In the present study, we found that serum citrate was negatively associated with MMP-13, suggesting citrate may inhibit cartilage degradation by re-ducing the expression of MMP-13 in knee OA.
There are several potential limitations in this study. First, some patients were excluded due to the lack of citrate data, which may result in selection bias. However, the age, gender, and BMI of the excluded patients were not statistically different from the in-cluded patients. Second, it was a cross-sectional study designed to generate hypotheses, and the causal relationship cannot be in-terpreted. These need to be determined by further cohort studies. Third, the participants were consecutively recruited from a clinic rather than being selected randomly from the community, so the results may not be generalizable to community-based knee OA pa-tients. Fifth, the sample size was relatively small, and it is possible that with a larger sample size more significant associations can be detected. Fourth, the signal intensity alteration of IPFP was as-sessed by unenhanced MRI, which was nonspecific, and its pathol-ogy was largely unclear.51 Last, the levels of citrate and cartilage
TA B L E 4 Association between citrate and cartilage enzymes
Univariableβ (95% CI) P values
Multivariablea
β (95% CI) P values
MMP-3 −2.16 (−6.01 to 1.68)
.268 −2.06 (−6.01 to 1.88)
.303
MMP-13 −3.18 (−6.16 to −0.21)
.036 −3.11(−6.20 to −0.02)
.049
Note: Data in bold denote statistically significant results.Dependent variables: MMP-3 and MMP-13 (after Box-Cox transformation). Independent variable: citrate.Abbreviations: MMP, matrix metalloproteinase.aAdjusted for age, gender and body mass index.

| 441BIAN et Al.
enzymes were measured in serum rather than in SF, so their local effects were unknown.
5 | CONCLUSION
Serum levels of citrate were negatively associated with knee struc-tural changes including femoral osteophytes, cartilage defects, and BMLs and also serum levels of MMP-13 in patients with knee OA, suggesting that low serum citrate may be a potential indicator for advanced knee OA.
ACKNOWLEDG EMENTSThe authors gratefully acknowledge the subjects who made this study possible, and thank the staff and volunteers who collected the data. This study was supported by the National Natural Science Foundation of China (81172865).
CONFLIC TS OF INTERE S TNone.
AUTHOR CONTRIBUTIONSFuqin Bian and Guangfeng Ruan contributed equally to this work and should be considered co-first authors. Study conception and design: CD and JX. Acquisition of data: KW, JW, GR and FB. Analysis and interpretation of data: all authors. Drafting of the article: FB,GR and CD. Revising and final approval of the article: all authors.
ORCIDFuqin Bian https://orcid.org/0000-0001-7077-7868 Guangfeng Ruan https://orcid.org/0000-0002-1471-7358 Juan Wu https://orcid.org/0000-0001-6973-4641
R E FE R E N C E S 1. Sun Y, Franklin AM, Mauerhan DR, Hanley EN. Biological Effects
of Phosphocitrate on Osteoarthritic Articular Chondrocytes. Open Rheumatol J. 2017;11:62-74.
2. Wang K, Xu J, Cai J, et al. Serum levels of interleukin-17 and adi-ponectin are associated with infrapatellar fat pad volume and signal intensity alteration in patients with knee osteoarthritis. Arthritis Res Ther. 2016;18:193.
3. Sun Y, Roberts A, Mauerhan DR, Sun AR, Norton HJ, Hanley EN. Biological activities of phosphocitrate: a potential meniscal protec-tive agent. Biomed Res Int. 2013;2013:726581.
4. Hashimoto S, Ochs RL, Komiya S, Lotz M. Linkage of chondro-cyte apoptosis and cartilage degradation in human osteoarthritis. Arthritis Rheum. 1998;41:1632-1638.
5. Akram M. Citric Acid Cycle and Role of its Intermediates in Metabolism. Cell Biochem Biophys. 2014;68:475-478.
6. Ashbrook MJ, McDonough KL, Pituch JJ, et al. Citrate modulates li-popolysaccharide-induced monocyte inflammatory responses. Clin Exp Immunol. 2015;180:520-530.
7. Bennett RM, Lehr JR, McCarty DJ. Factors affecting the solu-bility of calcium pyrophosphate dihydrate crystals. J Clin Invest. 1975;56:1571-1579.
8. Nguyen C, Bazin D, Daudon M, et al. Revisiting spatial distri-bution and biochemical composition of calcium-containing
crystals in human osteoarthritic articular cartilage. Arthritis Res Ther. 2013;15:R103.
9. McCarthy GM, Westfall PR, Masuda I, Christopherson PA, Cheung HS, Mitchell PG. Basic calcium phosphate crystals activate human osteoarthritic synovial fibroblasts and induce matrix metallopro-teinase-13 (collagenase-3) in adult porcine articular chondrocytes. Ann Rheum Dis. 2001;60:399-406.
10. Ea HK, Chobaz V, Nguyen C, et al. Pathogenic role of basic cal-cium phosphate crystals in destructive arthropathies. PLoS ONE. 2013;8:e57352.
11. Kawasaki T, Inoue K, Ushiyama T, Fukuda S. Assessment of the American College of Rheumatology criteria for the classification and reporting of osteoarthritis of the knee. Ryumachi. 1998;38:2-5.
12. Altman RD, Hochberg M, Murphy WA, Wolfe F, Lequesne M. (1995) Atlas of individual radiographic features in osteoarthritis. Osteoarthritis Cartilage. 3(Suppl A):3-70.
13. Kellgren JH, Lawrence JS. Radiological assessment of osteo-arthro-sis. Ann Rheum Dis. 1957;16:494-502.
14. Peterfy CG, Guermazi A, Zaim S, et al. Whole-Organ Magnetic Resonance Imaging Score (WORMS) of the knee in osteoarthritis. Osteoarthritis Cartilage. 2004;12:177-190.
15. Ding C, Garnero P, Cicuttini F, Scott F, Cooley H, Jones G. Knee cartilage defects: association with early radiographic osteoarthritis, decreased cartilage volume, increased joint surface area and type II collagen breakdown. Osteoarthritis Cartilage. 2005;13:198-205.
16. Zhai G, Blizzard L, Srikanth V, et al. Correlates of knee pain in older adults: Tasmanian Older Adult Cohort Study. Arthritis Rheum. 2006;55:264-271.
17. Hunter DJ, Guermazi A, Lo GH, et al. Evolution of semi-quantitative whole joint assessment of knee OA: MOAKS (MRI Osteoarthritis Knee Score). Osteoarthritis Cartilage. 2011;19:990-1002.
18. Romanello M, Michalsky M, Stagni N, Moro L, Favretto D, Traldi P. High-performance liquid chromatographic and mass spectrometric identification of phosphocitrate synthesized by human kidney ho-mogenate. J Chromatogr. 1993;616:167-173.
19. Sallis JD, Cheung HS. Inhibitors of articular calcium crystal forma-tion. Curr Opin Rheumatol. 2003;15:321-325.
20. Sun Y, Mauerhan DR, Franklin AM, et al. Fibroblast-like synov-iocytes induce calcium mineral formation and deposition. Arthritis. 2014;2014:812678.
21. Cheung HS, Sallis JD, Struve JA. Specific inhibition of basic calcium phosphate and calcium pyrophosphate crystal-induction of metal-loproteinase synthesis by phosphocitrate. Biochim Biophys Acta. 1996;1315:105-111.
22. Cheung HS, Sallis JD, Demadis KD, Wierzbicki A. Phosphocitrate blocks calcification-induced articular joint degeneration in a guinea pig model. Arthritis Rheum. 2006;54:2452-2461.
23. Van Linthoudt D, Salani I, Zender R, Locatelli P. Citrate in syno-vial fluid and its relation to inflammation and crystal presence. J Rheumatol. 1996;23:502-505.
24. LeGeros RZ, Kijkowska R, LeGeros JP. Formation and transforma-tion of octacalcium phosphate, OCP: a preliminary report. Scan Electron Microsc. 1984;(pt 4):1771-1777.
25. Johnsson M, Richardson CF, Sallis JD, Nancollas GH. Adsorption and mineralization effects of citrate and phosphocitrate on hy-droxyapatite. Calcif Tissue Int. 1991;49:134-137.
26. van der Kraan PM, van den Berg WB. Osteophytes: relevance and biology. Osteoarthritis Cartilage. 2007;15:237-244.
27. Komatsu D, Hasegawa Y, Kojima T, Seki T, Higuchi Y, Ishiguro N. Absence of a relationship between joint space narrowing and os-teophyte formation in early knee osteoarthritis among Japanese community-dwelling elderly individuals: A cross-sectional study. Mod Rheumatol. 2017;27:675-682.
28. Boegård T, Rudling O, Petersson IF, Jonsson K. Correlation between radiographically diagnosed osteophytes and magnetic resonance

442 | BIAN et Al.
detected cartilage defects in the patellofemoral joint. Ann Rheum Dis. 1998;57:395-400.
29. Pottenger LA, Phillips FM, Draganich LF. The effect of marginal os-teophytes on reduction of varus-valgus instability in osteoarthritic knees. Arthritis Rheum. 1990;33:853-858.
30. Hada S, Ishijima M, Kaneko H, et al. Association of medial menis-cal extrusion with medial tibial osteophyte distance detected by T2 mapping MRI in patients with early-stage knee osteoarthritis. Arthritis Res Ther. 2017;19:201.
31. Kawaguchi H. Endochondral ossification signals in cartilage deg-radation during osteoarthritis progression in experimental mouse models. Mol Cells. 2008;25:1-6.
32. Blaney Davidson EN, Vitters EL, van der Kraan PM, van den Berg WB. Expression of transforming growth factor-beta (TGFbeta) and the TGFbeta signalling molecule SMAD-2P in spontaneous and instability-induced osteoarthritis: role in cartilage degrada-tion, chondrogenesis and osteophyte formation. Ann Rheum Dis. 2006;65:1414-1421.
33. Wluka AE, Ding C, Jones G, Cicuttini FM. The clinical correlates of articular cartilage defects in symptomatic knee osteoarthritis: a prospective study. Rheumatology (Oxford). 2005;44:1311-1316.
34. Wierzbicki A, Sikes CS, Sallis JD, Madura JD, Stevens ED, Martin KL. Scanning electron microscopy and molecular modeling of inhi-bition of calcium oxalate monohydrate crystal growth by citrate and phosphocitrate. Calcif Tissue Int. 1995;56:297-304.
35. Hallson PC, Kasidas GP, Samuell CT. The inhibitory activity of some citrate analogues upon calcium crystalluria: observations using an improved urine evaporation technique. Urol Int. 1996;57:43-47.
36. Sun Y, Mauerhan DR, Steuerwald NM, Ingram J, Kneisl JS, Hanley EN. Expression of phosphocitrate-targeted genes in osteoarthritis menisci. Biomed Res Int. 2014;2014:210469.
37. Zanetti M, Bruder E, Romero J, Hodler J. Bone marrow edema pat-tern in osteoarthritic knees: correlation between MR imaging and histologic findings. Radiology. 2000;215:835-840.
38. Zhang Y, Nevitt M, Niu J, et al. Fluctuation of knee pain and changes in bone marrow lesions, effusions, and synovitis on magnetic reso-nance imaging. Arthritis Rheum. 2011;63:691-699.
39. Dore D, Quinn S, Ding C, et al. Natural history and clinical signifi-cance of MRI-detected bone marrow lesions at the knee: a prospec-tive study in community dwelling older adults. Arthritis Res Ther. 2010;12:R223.
40. Dore D, Martens A, Quinn S, et al. Bone marrow lesions predict site-specific cartilage defect development and volume loss: a pro-spective study in older adults. Arthritis Res Ther. 2010;12:R222.
41. Clockaerts S, Bastiaansen-Jenniskens YM, Runhaar J, et al. The infrapatellar fat pad should be considered as an active osteo-arthritic joint tissue: a narrative review. Osteoarthritis Cartilage. 2010;18:876-882.
42. Vahlensieck M, Linneborn G, Schild H, Schmidt HM. Hoffa's recess: incidence, morphology and differential diagnosis of the globu-lar-shaped cleft in the infrapatellar fat pad of the knee on MRI and cadaver dissections. Eur Radio. 2002;l12:90-93.
43. Roemer FW, Kwoh CK, Hannon MJ, et al. What comes first? Multitissue involvement leading to radiographic osteoarthri-tis: magnetic resonance imaging-based trajectory analysis over four years in the osteoarthritis initiative. Arthritis Rheumatol. 2015;67:2085-2096.
44. Ballegaard C, Riis RG, Bliddal H, et al. Knee pain and inflammation in the infrapatellar fat pad estimated by conventional and dynamic contrast-enhanced magnetic resonance imaging in obese patients with osteoarthritis: a cross-sectional study. Osteoarthritis Cartilage. 2014;22:933-940.
45. Han W, Aitken D, Zhu Z, et al. Signal intensity alteration in the infrapatellar fat pad at baseline for the prediction of knee symp-toms and structure in older adults: a cohort study. Ann Rheum Dis. 2016;75:1783-1788.
46. Takaishi H, Kimura T, Dalal S, Okada Y, D'Armiento J. Joint diseases and matrix metalloproteinases: a role for MMP-13. Curr Pharm Biotechnol. 2008;9:47-54.
47. Wang M, Sampson ER, Jin H, et al. MMP13 is a critical target gene during the progression of osteoarthritis. Arthritis Res Ther. 2013;15:R5.
48. Roach HI, Yamada N, Cheung KS, et al. Association between the abnormal expression of matrix-degrading enzymes by human os-teoarthritic chondrocytes and demethylation of specific CpG sites in the promoter regions. Arthritis Rheum. 2005;52:3110-3124.
49. Neuhold LA, Killar L, Zhao W, et al. Postnatal expression in hyaline cartilage of constitutively active human collagenase-3 (MMP-13) induces osteoarthritis in mice. J Clin Invest. 2001;107:35-44.
50. Akagi R, Sasho T, Saito M, et al. Effective knock down of matrix metalloproteinase-13 by an intra-articular injection of small inter-fering RNA (siRNA) in a murine surgically-induced osteoarthritis model. J Orthop Res. 2014;32:1175-1180.
51. Roemer FW, Guermazi A, Zhang Y, et al. Hoffa's Fat Pad: Evaluation on Unenhanced MR Images as a Measure of Patellofemoral Synovitis in Osteoarthritis. AJR Am J Roentgenol. 2009;192:1696-1700.
How to cite this article: Bian F, Ruan G, Xu J, et al. Associations of serum citrate levels with knee structural changes and cartilage enzymes in patients with knee osteoarthritis. Int J Rheum Dis. 2020;23:435–442. https ://doi.org/10.1111/1756-185X.13787
Int J Rheum Dis. 2020;23:443–447. wileyonlinelibrary.com/journal/apl | 443© 2020 Asia Pacific League of Associations for Rheumatology and John Wiley & Sons Australia, Ltd
Received: 17 September 2019 | Revised: 27 December 2019 | Accepted: 29 December 2019
DOI: 10.1111/1756-185X.13793
E X P E R T C O M M E N T S
Rheumatology workforce issues in South Asia: Challenges and solutions
Amita Aggarwal1 | Syed Atiqul Haq2
1Department of Clinical Immunology and Rheumatology, Sanjay Gandhi Postgraduate Institute of Medical Sciences, Lucknow, India2Department of Rheumatology, Bangabandhu Sheikh Mujib Medical University (BSMMU), Dhaka, Bangladesh
Correspondence: Amita Aggarwal, Professor and Head of Department, Department of Clinical Immunology and Rheumatology, Sanjay Gandhi Postgraduate Institute of Medical Sciences, Lucknow 226014, India.Email: [email protected]
South Asia, which includes India, Bangladesh, Bhutan, Pakistan, Afghanistan, Sri Lanka, Maldives and Nepal is the most densely populated region of the world. Although occupying only 3.5% of the world's land surface area, it hosts approximately 25% of the world's population.1 Among the South Asian countries, India has the larg-est landmass with 1.37 billion residents. India is also the most di-verse nation in respect of religion, culture, languages and education. Over 100 languages are spoken in India and income levels are vari-able with almost 25% of population below the poverty line. Further, 25.96% of the population has no formal education2 and 26.16% of the Indian population is below 15 years of age (Table 1).3 Provision of good health care to such a population is therefore a great challenge.
Over the years, the burden of non-communicable diseases (NCDs) has increased in South Asia. In India itself, during 25 years from 1990 to 2016, the share of NCDs to total disease burden has increased from 37.9% to 61.8%.4 With the increase in NCDs, the bur-den of rheumatic diseases has also increased. Musculoskeletal (MSK) diseases are the second most important cause of years lived with disability (YLD) across the world.5 The proportion of disability-ad-justed life years (DALY) due to MSK diseases is variable across South Asia. More affluent countries like the Maldives have high % DALY whereas the less affluent ones like Afghanistan have low % DALY due to MSK diseases6 (Figure 1).
A survey done in India of 55 000 persons at 12 sites estimated the prevalence of osteoarthritis (OA) as 3.34%, soft tissue rheu-matism as 1.39%, rheumatoid arthritis (RA) as 0.34%, spondyloar-thropathy (SpA) as 0.23% and other rheumatic diseases as 1.22%, suggesting that 7% of the population has one or other rheumatic dis-ease.7-9 Similar data are available from Pakistan.10 In another survey of nearly 5000 school children in India, arthritis lasting for more than 1 week was present in 7.6%, back pain in 3.1% and heel pain in 3%.11
Delay in diagnosis poses a major challenge in management of rheumatic diseases, with patients presenting with high disease ac-tivity as well as significant damage. It is related to both socio-cultural practices like stigma attached to illness, easy availability of drugs
without prescription leading to self-medication and faith in alterna-tive systems of medicine. As rheumatic diseases are more prevalent in women, and the social status of most South Asian women is not equal to men, these patients find it difficult to access health care.
It has been noted that the distance to healthcare facilities, avail-ability of transport and cost of health care are the major individual barriers to healthcare access.12 Moreover, an absence of a proper referral system results in further delay in diagnosis.12 In Pakistan, over two-thirds of patients with disabilities are dependent on family members for their care due to lack of social security.13
Public-funded healthcare systems that provide good-quality healthcare services are virtually non-existent in most South Asian countries. Although most countries have a network of primary health centers to provide preventive and maternal and child health services, treatment for rheumatic disease is available only in tertiary care hospitals. In South Asia, only about 5% of gross domestic prod-uct is spent on health care as compared to over 12% in Organization for Economic Co-operation and Development countries.14 Although some South Asian countries like Bhutan, Sri Lanka and Maldives have universal health coverage, most of the health care is provided by the private sector. Stand-alone private clinics are the major providers of out-patient care. Out-of-pocket health expenditure in South Asia is nearly 90%, which leads to families being pushed below the pov-erty line due to illness.15 In view of this, attempts are being made to strengthen public funding for health in this region. In 2018, India started an ambitious National Health Protection scheme for the poor to bridge the inequalities in accessing health care.16,17
Most drugs needed to treat rheumatic diseases, like methotrexate, leflunomide and biologicals are readily available. The generic synthetic DMARDs (disease modifying anti-rheumatic drugs) are cheap and eas-ily affordable in countries like India and Bangladesh.18 Biologicals, even with a large presence of biosimilars in South Asia, are beyond the reach of most patients. Similarly, lab tests for monitoring therapy add addi-tional burden on patients and to cut cost most physicians have them performed less frequently. Even after diagnosis, there is reluctance to

444 | AGGARWAL And HAQ
take drugs as it is believed that ‘allopathic’ drugs are associated with many side effects and are expensive.15 This results in poor compliance and inability to achieve therapeutic targets. It has also been observed that many RA patients reduce the dose of methotrexate on their own when they have fair control of the disease.
1 | WORKFORCE ISSUES
With fewer physicians per capita, South Asia has a limited workforce. The availability of nurses is also much less than the world average (Table 2). Further, no data is available on the number of rheumatolo-gists. In Europe and the USA, there are approximately 1.7 rheumatolo-gists per 100 000 citizens.19,20 In a survey conducted in the Asia-Pacific League Against Rheumatism (APLAR) region, 20 of the 30 countries responded and they were divided into three clusters according to per capita income:>$20 000 (n = 7), $2500-10 000 (n = 9) and <$2000 (n = 4). The high-income countries had 1 rheumatologist per 72 393, middle income ones had 1 per 1 208 100 and the low-income ones had 1 per 3 618 600 citizens. Most rheumatologists worked in academic
settings and the average number of patients seen by a rheumatologist in an hour ranged from 3-15 depending on the load of patients.21
India has approximately 500 rheumatologists. Even if we count internists who do part-time rheumatology, the number of rheumatol-ogists is <1 per million. Among the medical schools, approximately 10 have a chair of rheumatology. Further, there is an unequal distribution of doctors, with rural areas being underserved. For example, Delhi has 60-70 rheumatologists whereas there is no rheumatologist present in a 200 km radius in some parts of the country. Thus the “inverse care law” (those in greatest need of health care also have greatest difficulty in ac-cessing it) is highly applicable for South Asia.22 In addition, awareness of rheumatology as a specialty is poor among the public. Very com-monly, an orthopedic surgeon becomes the first point of contact since s/he is perceived to be a physician dealing with bones and joints.23 Even internists often do not have enough competence to examine or manage patients with rheumatic diseases.24
Optimum care of a patient with rheumatic disease requires a multidisciplinary approach with a team comprising of a rheumatol-ogist, local general practitioner (GP), rheumatology nurse, physio-therapist, occupational therapist, psychologist and patient partner.
TA B L E 1 Demography of the countries in South Asia1
Country Population (2019)Age group, 0-14 y, % of population
Age group >65 y, % of population
GDP per capita, 2017, in US$
India 1 366 417 754 26.16 6.57 1987
Pakistan 216 565 318 34.82 4.35 1467
Bangladesh 163 046 161 26.75 5.23 1564
Afghanistan 38 041 754 41.82 2.65 NA
Nepal 28 608 710 28.81 5.83 900
Sri Lanka 21 323 733 23.68 11.23 4135
Bhutan 763 092 24.89 6.20 3391
Maldives 533 458 19.60 3.59 9802
F I G U R E 1 Proportion of disability-adjusted life years (DALY) contributed by musculoskeletal diseases in each country of South Asia region based on global disease burden data of 2017. For comparison US data are also included
0
1
2
3
4
5
6
7
8
USA Maldives Bangladesh Bhutan SriLanka Nepal India Pakistan Afghanistan
% D
isab
ility
adj
uste
d lif
e ye
ars

| 445AGGARWAL And HAQ
In the UK, according to National Institute for Health and Clinical Excellence guidelines, the multidisciplinary team for RA should consist of a rheumatologist, specialist nurse, physiotherapist, occu-pational therapist and podiatrist.25 In north European countries, a psychologist, nutritionist and social worker are also included in the team.26 In the USA, rheumatologists, nurse practitioners and physi-cian assistants are the active rheumatology service providers.20 In most of South Asia, support personnel like rheumatology nurses, physiotherapists, occupational therapists and psychologists are almost non-existent in the team for rheumatic care. In the APLAR survey, high-income countries had a team of at least 3 persons while in low-income countries it was either only a rheumatologist or one more person (nurse/physiotherapist).21 Although there are training opportunities for physiotherapists and occupational therapists in most South Asian countries, the numbers are small and very few are in rheumatology units. Thus, there is a huge shortage of manpower to manage rheumatic diseases in South Asia and the gap between demand and supply will further increase as the large young popu-lation ages.
2 | SOLUTIONS
There are no easy solutions to improve the current situation. It needs political will to increase funding for health care, bet-ter health infrastructure and social awareness. To cater to such a large population a bottom-up approach is needed. At the pri-mary care level, we need ways to improve quality of care available and also develop proper referral pathways to align with hospi-tals in the vicinity. As the majority of health care in South Asia is provided by the private sector, the private practitioner near the homes of the patients needs to be involved in the care of the patient. Along with this, we need to remove inequalities in healthcare access by having adequate numbers of health workers and allocating enough budget for health so that patients have ac-cess to basic drugs.
2.1 | Training
An informed physician is more likely to provide better patient care, therefore knowledge about rheumatic diseases needs to be im-parted to healthcare professionals from undergraduate training onwards. In medical schools, the present curriculum is deficient in rheumatology training and needs to change.27,28 A white paper by the “World forum on rheumatic musculoskeletal diseases” has highlighted clinicians' lack of confidence in diagnosing patients presenting with MSK symptoms. It has also highlighted the pro-gress made since “Bone and Joint decade” in having a core cur-riculum for undergraduate training encompassing accurate and thorough history-taking and physical examination, emergency and red flag conditions and common problems that any physician might encounter.29 Inclusion of a module on rheumatology based on these guidelines in undergraduate teaching will go a long way in having informed GPs.
TA B L E 2 Availability of doctors and nurses in South Asia3
CountryDoctor per 1000 population
Nurse per 1000 population
World 1.50 3.42
India 0.8 2.1
Pakistan 1.0 0.5
Bangladesh 0.5 0.3
Afghanistan 0.3 0.3
Nepal 0.7 2.7
Sri Lanka 1.0 2.1
Bhutan 0.4 1.5
Maldives 1.0 4.0
aThe bold values are signifies the world figures as reference.
F I G U R E 2 Possible solutions to improving the rheumatology workforce in South Asia. MSK, musculoskeletal; LBA, low backache; OA, osteoarthritis; CME, continuing medical education; SpA, spondyloarthropathy; CTD, connective tissue disease; MDT, multidisciplinary team; ARISE, Asia-Pacific Rheumatology Intensive Scientific Education
Increase manpower trained in managing rheumatic diseases
Undergraduate curriculumScreening for MSK diseasesBasic Knowledge aboutLBA, OA, Gout
Better primary careEarly referralGeneral practitioner
CME on common diseases like LBA, OA, GoutHow to recognize CTDsWhen to refer Connect with them using technology
Medicine/Pediatric trainingAdvanced MSK examDx and Rx of LBA, OA, Gout, RA, SpA, How to recognize CTDsWhen to refer?
Subspeciality trainingIncreasing training slots3-6 months training for young faculty in Medicine
Care of common diseasesEarly referral
Care of rheumatic diseasesTraining of more rheumatologists
Rheumatology NurseOnline modules like ARISETraining one nurse in every unit of rheumatology
Better patient care Reduced work load of Rheumatologists
Physio/occupational therapistHaving one in every unit of rheumatology
Help provide MDTImprove patient outcomes
Lobby with politiciansand health managersto do these changes
Harness technology to achieve these goals

446 | AGGARWAL And HAQ
Similarly, during internal medicine and pediatric residency, ex-posure to rheumatology needs to increase with introduction of a 24-hour module having both clinical exposure to common rheumatic diseases and lectures on rheumatic diseases. This will not only im-prove care for patients but may also stimulate an interest in rheu-matology and may lead to more physicians choosing rheumatology as a career option. To achieve this, each medical school needs to have at least 1 faculty position in rheumatology. For this, fellowship positions in rheumatology also need to increase. This can be done by engaging with all stakeholders, that is patients, public, medical coun-cils and the government. In this endeavor, the national rheumatology societies can also play a major role.
The shortage of allied health professionals in rheumatology also needs to be addressed. National societies need to engage with allied health professionals by letting them join their associations, holding combined meetings and doing continuing medical education pro-grams for them. Similar to the increase in residency programs, pro-grams for training of nurses and social workers in rheumatology are needed. A recent review on nurse-led care revealed that patients find it acceptable and accessible and it is also effective. However, the data on it being cost effective are still scant. In some studies, nurse-led care resulted in more cross-referrals which may increase the cost.30 One option could be to use nurse-led care only for patients with low disease activity so that treatment changes are expected to be minimal.
Since training manpower by the usual way will take a long time, along with many sub-specialties vying for limited resources for training, we need to think of novel and cheaper ways. In this re-spect, the use of technology can be a game changer. Fortunately in South Asia the penetration of phone and internet is reasonably good. Using telemedicine to educate and provide health care can make it available in remote areas. Telemedicine can also be used to educate GPs and internists.31 Using massive open online courses (MOOC), we can design curricula for rheumatology which can be delivered to medical schools which do not have a rheumatologist. APLAR has recently started an APLAR – European League Against Rheumatism school of rheumatology to support online training in rheumatology, the costs for which are partly offset by APLAR.32 In addition, the Asia-Pacific Rheumatology Intensive Scientific Education (ARISE) program is geared toward increasing skills of nurses in rheumatology.33
2.2 | Improving primary care using technology
Availability of good primary care can help in early diagnosis and appropriate follow-up leading to good outcomes for patients with rheumatic diseases. Many novel ideas using technology are being tried to achieve this goal.
A recent study34 done in Canada used the rapid Access to Consultative Expertise program where the primary care provider had a hotline to consult a specialist. It was found that 60% of these calls prevented a specialist visit and 32% of calls prevented a visit to
the emergency department. This led to reduction in cost, better pa-tient care, capacity building as well as better patient experience. This can be easily adopted in South Asia where patients have to travel long distances and there is shortage of specialists.
Extension for community health care outcomes (ECHO) program connects local GPs with specialists at a medical school over weekly teleclinics, grand rounds and so on. Later these GPs can consult the specialist team if they have any complicated problem. It has been successfully run for treatment of rheumatic diseases in under-re-sourced areas in Mexico and can be tailored for South Asia.35
Village resource centers (VRC) developed by the Indian space re-search organization of the Government of India in rural areas have facilities for tele-education, telemedicine and online decision sup-port.36 These can be harnessed to teach community health workers on how to recognize symptoms of rheumatic diseases and how to follow patients with osteoarthritis and gout, the two common prob-lems in community besides soft tissue rheumatism. In a review of telemedicine facilities in Bangladesh it was found that it reduced time as well as cost by about 20-fold to the patient. In addition, two-thirds of persons using telemedicine facilities were satisfied, sug-gesting that harnessing telemedicine can go a long way in reducing disparities in healthcare access.37
A systematic review on tele-rheumatology published in 2017 concluded that it is very good for the follow-up of patients diag-nosed with RA.38 Comparison of teleconferencing with a remote center with in-person consultation led to similar control of disease activity. However, it was felt that patient preference should be taken into account when offering these services as there was a significant dropout in both arms.39
Mobile apps are also being utilized by healthcare professionals to connect with patients. These apps can help a patient report his/her disease-related outcomes, receive health education, behav-ioral feedback and support. In RA, it has the potential to improve adherence to therapy leading to better control of disease activity and fewer hospital visits. However, areas which lack rheumatologists such as rural and underserved areas also have logistic challenges like stable internet connection, familiarity with apps due to lower educa-tional standards, and so on.40
To conclude, improving training at all levels of health care would go a long way in improving outcomes of rheumatic diseases in South Asia (Figure 2). The use of out-of-the-box ideas using technology can reduce the time required for having optimum health care. Finally, we need to get all stakeholders on board for improving the current gap in the workforce for rheumatology and in this the national societies and APLAR can play a big role.
ORCIDAmita Aggarwal https://orcid.org/0000-0002-2187-5186 Syed Atiqul Haq https://orcid.org/0000-0003-4154-7283
R E FE R E N C E S 1. https ://www.world omete rs.info/world-popul ation . Accessed on
October 4, 2019.

| 447AGGARWAL And HAQ
2. http://censu sindia.gov.in/Census_And_You/liter acy_and_level_of_educa tion.aspx. Accessed on September 1, 2019.
3. https ://data.world bank.org/indic ator/SH.MED.PHYS.ZS. Accessed on December 16, 2019.
4. Jain V. Medical research in India and the rise of non-communicable disease. BMJ. 2016;353:i3371.
5. Collaborators. GDaIIaP. Global, regional, and national incidence, prevalence, and years lived with disability for 354 diseases and injuries for 195 countries and territories, 1990-2017: a system-atic analysis for the Global Burden of Disease Study 2017. Lancet. 2018;392:1789-1858.
6. Sebbag E, Felten R, Sagez F, Sibilia J, Devilliers H, Arnaud L. The world-wide burden of musculoskeletal diseases: a systematic analy-sis of the World Health Organization Burden of Diseases Database. Ann Rheum Dis. 2019;78:844-848.
7. Chopra A. Disease burden of rheumatic diseases in India: COPCORD perspective. Indian J Rheumatol. 2015;10:70-77.
8. Akhter E, Bilal S, Kiani A, Haque U. Prevalence of arthritis in India and Pakistan: a review. Rheumatol Int. 2011;31:849-855.
9. Paul BJ, Rahim AA, Bina T, Thekkekara RJ. Prevalence and factors related to rheumatic musculoskeletal disorders in rural south India: WHO-ILAR-COPCORD-BJD India Calicut study. Int J Rheum Dis. 2013;16:392-397.
10. Farooqi A, Gibson T. Prevalence of the major rheumatic disor-ders in the adult population of north Pakistan. Br J Rheumatol. 1998;37:491-495.
11. Abujam B, Misra R, Aggarwal A. Prevalence of musculoskeletal com-plaints and juvenile idiopathic arthritis in children from a developing country: a school based study. Int J Rheum Dis. 2014;17:256-260.
12. Gudlavalleti VSM. Challenges in accessing health care for people with disability in the south Asian context: a review. Int J Environ Res Public Health. 2018;15:E2366.
13. Ahmad M. Health care access and barriers for the physically dis-abled in rural Punjab, Pakistan. Int J Sociol Soc Pol. 2013;33:246-260.
14. Rahman MM, Khanam R, Rahman M. Health care expenditure and health outcomenexus: new evidence from the SAARC-ASEAN re-gion. Global Health. 2018;14:113.
15. Mody GM, Cardiel MH. Challenges in the management of rheuma-toid arthritis in developing countries. Best Pract Res Clin Rheumatol. 2008;22:621-641.
16. Zaidi S, Saligram P, Ahmed S, Sonderp E, Sheikh K. Expanding ac-cess to healthcare in South Asia. BMJ. 2017;357:j1645.
17. Chatterjee P. National health protection scheme revealed in India. Lancet. 2018;391:523-524.
18. Gupta P, Khan M. Generics and biosimilars; a step towards sustain-able and low cost health care. J Assoc Physicians India. 2019;67:66-67.
19. http://www.eumusc.net/workp ackag es_wp4.cfm. Accessed on September 1, 2019.
20. Battafarano DF, Ditmyer M, Bolster MB, et al. American College of Rheumatology Workforce Study: supply and demand projections of adult rheumatology workforce, 2015–2030. Arthritis Care Res (Hoboken). 2015;70:617-626.
21. https ://www.acrda ilyne wslive.org/ilar-sessi on-to-explo re-de-vel opment-of-global-patie nt-educa tion-strat egies/ . Accessed on September 1, 2019.
22. Tudor Hart J. Commentary: three decades of the inverse care law. BMJ. 2000;320:18-19.
23. Handa R. Rheumatology in India–quo vadis? Nat Rev Rheumatol. 2015;11:183-188.
24. Misra DP, Ravindran V, Sharma A, et al. Physicians perception of rheumatology practice and training in India. J Assoc Phys India. 2019;69:38-43.
25. https ://www.nice.org.uk/guida nce/ng100/ chapt er/Recom menda tions #refer ral-diagn osis-and-inves tigat ions. Accessed on September 1, 2019.
26. Grotle M, Klokkerud M, Kjeken I, et al. What's in the black box of arthritis rehabilitation? A comparison of rehabilitation practice for patients with inflammatory arthritis in northern Europe. J Rehabil Med. 2013;45:458-466.
27. Handa R. Rheumatology in Postgraduate curriculum. Ind J Rheumatol. 2014;9:127-130.
28. Naik S. Medical education in India: problems and solutions. Ind J Rheumatol. 2014;9:19-22.
29. Al Maini M, Al Weshahi Y, Foster HE, et al. A global perspective on the challenges and opportunities in learning about rheumatic and musculoskeletal diseases in undergraduate medical education: white paper by the World Forum on Rheumatic and Musculoskeletal Diseases (WFRMD). Clin Rheumatol. 2019. https ://doi.org/10.1007/s10067-019-04544-y. [Epub ahead of print].
30. Garner S, Lopatina E, Rankin JA, Marshall DA. Nurse-led Care for Patients with Rheumatoid Arthritis: a systematic review of the ef-fect on quality of care. J Rheumatol. 2017;44:757-765.
31. Gurung MS, Dorji G, Khetrapal S, Ra S, Babu GR, Krishnamurthy RS. Transforming health care through Bhutan's digital health strategy: progress to date. WHO South East Asia J Public Health. 2019;8:77-82.
32. http://www.aplar.org/aplar_eular/ esor/. Accessed on September 1, 2019.
33. http://www.aplar.org/educa tion_page/aspir e/. Accessed on Septem ber 1, 2019.
34. Wilson M, Mazowita G, Ignaszewski A, et al. Family physician ac-cess to specialist advice by telephone: reduction in unnecessary specialist consultations and emergency department visits. Can Fam Physician. 2016;62:e668-e676.
35. Bankhurst A, Olivas C, Larson JH, et al. Rheumatology care in un-der-resourced areas utilizing the ECHO model. Arthritis Care Res (Hoboken). 2019. https ://doi.org/10.1002/acr.23889 . [Epub ahead of print].
36. https ://www.isro.gov.in/appli catio ns/villa ge-resou rce-centre. Accessed on December 19, 2019.
37. Sorwar G, Rahamn MM, Uddin R, Hoque MR. Cost and time ef-fectiveness analysis of a telemedicine service in Bangladesh. Stud Health Technol Inform. 2016;231:127-134.
38. McDougall JA, Ferucci ED, Glover J, Fraenkel L. Telerheumatology: a systematic review. Arthritis Care Res (Hoboken). 2017;69:1546-1557.
39. Taylor-Gjevre R, Nair B, Bath B, et al. Addressing rural and remote access disparities for patients with inflammatory arthritis through video-conferencing and innovative inter-professional care models. Musculoskeletal Care. 2018;16:90-95.
40. Mollard E, Michaud K. Mobile apps for rheumatoid arthritis: oppor-tunities and challenges. Rheum Dis Clin North Am. 2019;45:197-209.
How to cite this article: Aggarwal A, Haq SA. Rheumatology workforce issues in South Asia: Challenges and solutions. Int J Rheum Dis. 2020;23:443–447. https ://doi.org/10.1111/1756-185X.13793
https://www.nice.org.uk/guidance/ng100/chapter/Recommendations#referral-diagnosis-and-investigations

448 | wileyonlinelibrary.com/journal/apl Int J Rheum Dis. 2020;23:448–453.© 2019 Asia Pacific League of Associations for Rheumatology and John Wiley & Sons Australia, Ltd
Received: 7 May 2019 | Revised: 5 October 2019 | Accepted: 28 November 2019
DOI: 10.1111/1756-185X.13775
A P L A R G R A N D R O U N D C A S E
Common variable immunodeficiency presenting as sarcoidosis in a 9-year-old child
Ilaria Maccora1 | Edoardo Marrani1 | Silvia Ricci2,3 | Chiara Azzari2,3 | Gabriele Simonini1,4 | Rolando Cimaz5 | Teresa Giani1,6
I. Maccora and E. Marrani are contributed equally to this work
1Rheumatology Unit, Anna Meyer Children's Hospital, Florence, Italy2Department of Sciences for Health of Women and Child, University of Florence, Florence, Italy3Immunology Unit, Azienda Ospedaliero Universitaria Ospedale Pediatrico Meyer, Florence, Italy4Department of Neurosciences, Psychology, Drug Research and Child Health, University of Florence, Florence, Italy5Department of Clinical Sciences and Community Health, University of Milano, Milan, Italy6Department of Medical Biotechnology, University of Siena, Siena, Italy
CorrespondenceEdoardo Marrani, Anna Meyer Children's University Hospital, University of Florence, Viale Pieraccini 24, 50139, Florence, Italy.Email: [email protected]
AbstractBackground: Granulomatous diseases are a heterogeneous group of conditions char-acterized by an inflammatory infiltrate with a core of macrophages, epithelioid, giant cells and a corona of fibroblasts and lymphocytes. They are associated with a wide range of disorders such as mycobacterial and fungal infections, neoplasms, immuno-deficiencies and systemic inflammatory disorders as sarcoidosis.Case report: We report the case of a previously healthy 9-year-old male child who presented with persistent cough, diffuse lymphadenopathy, enlargement of liver and spleen and protracted fever. Anemia, lymphopenia and reduced platelet count was reported, with an increase of inflammatory markers. High levels of Angiotensin-converting enzyme and chitotriosidases were noted. A PET-CT scan showed increased uptake of 18F-FDG glucose in multiple lymph nodes in thorax and abdomen and in the spleen. Biopsy of inguinal and bronchial nodes showed nodal granulomatous inflam-mation. The child was diagnosed with sarcoidosis and treated with corticosteroids with only transient efficacy. Further tests reported panhypogammaglobulinaemia and a reduced pool of B-memory lymphocytes. Thus, the diagnosis was revised to common variable immunodeficiency (CVID).Conclusion: Common variable immunodeficiency is a heterogeneous condition with a highly variable clinical phenotype and a strong association with autoimmune dis-orders. The presence of noncaseating granuloma and pulmonary lesions, along with extrapulmonary features required a step by step approach to differentiate between CVID and sarcoidosis. This enables early introduction of immunoglobulin replace-ment therapy and decreases the morbidity and mortality of CVID.
K E Y W O R D S
common variable immunodeficiency, granulomatous diseases, granulomatous-lymphocytic interstitial lung disease, hypogammaglobulinemia, sarcoidosis

| 449MACCORA et Al.
1 | INTRODUC TION
Granulomatous diseases are a heterogeneous group of conditions characterized by an inflammatory infiltrate with a core of macrophages, epithelioid, giant cells and a corona of fibroblasts and lymphocytes. Granulomas are found in several disorders, such as mycobacteriosis, fungal infections, neoplasms, immunodeficiencies and systemic inflam-matory disorders like sarcoidosis.1 Sarcoidosis is a chronic multisystem granulomatous disease of unknown etiology, potentially involving dif-ferent tissues like the reticuloendothelial system, skin, kidneys or the central nervous system (CNS).2-4 Although sarcoidosis most commonly affects young adults, it may be diagnosed, rarely, in the pediatric age, with an estimated incidence of 29 per 10 000 000 children. Affected children often present non-specific signs and symptoms in combina-tion with lymphadenopathy, splenomegaly and lung involvement.5-9 No pathognomonic clinical signs are visible, and laboratory diagnostic tests are unavailable. A thorough work-up is required to rule out other granulomatous diseases.10,11
We report a case of a child who received a presumptive di-agnosis of sarcoidosis and was later correctly recognized with common variable immunodeficiency (CVID) with a granulomatous expression.
2 | C A SE REPORT
A 9-year-old Caucasian boy was admitted to our hospital because of a 1-month history of persistent fever, nonproductive cough, as-thenia, diffuse lymphadenopathy and hepatosplenomegaly. Past medical history showed good health except for acute mononu-cleosis at the age of 5 years. The family reported no consanguin-ity, family history of autoimmunity or immunodeficiency, recent travels or insect bites. Most notably, cases of sarcoidosis, chronic granulomatous disease or Crohn's diseases in the relatives were denied. Immunization status was up-to-date according to Italian guidelines.
Clinical examination revealed multiple inguinal and cervical lymphadenopathies and hepatosplenomegaly. Examination of the other systems showed nothing remarkable.
Laboratory investigations indicated anemia (hemoglobin 9.5 g/dL, hemocrit 30%, mean corpuscular volume 65.7 fL), a mild reduc-tion in white cell count 3610 cells/mm3 (normal 4100-12 000 cells/mm3) neutrophils 1460 cells/mm3 (normal > 1500 cells/mm3) lymphocytes 1390 cells/mm3 (normal > 1000 cells/mm3), and an increase of C-reactive protein (2.28 mg/dL, normal < 0.5), γ-glutamyl-transferase (93 UI/L), amylase (202 UI/L), lactate dehydrogenase (435 UI/L), and serum amyloid A (89.7 U/L, nor-mal < 6.4 mg/L). A negative direct Coombs test and normal levels of haptoglobin suggested anemia of inflammation or hypersplen-ism. Erythrocyte sedimentation rate, bilirubin, ferritin and trans-aminase levels were in the normal range. Immunoglobulin (Ig) levels were slightly reduced: IgG 630 mg/dL (normal 650-1500 mg/dL), IgA 45 mg/dL (normal 50-240 mg/dL), IgM 72 mg/dL (normal
40-140 mg/dL). An extensive infectious work-up for viral, bacterial, and fungal diseases (human immunodeficiency virus, Epstein-Barr virus, cytomegalovirus, toxoplasma, Mycobacterium tuberculosis, borrelia, bartonella, Toxocara canis, leishmania, candida, aspergil-lus, Cryptococcus neoformans, Histoplasma capsulatum, Coccidioides immitis) resulted negative. A chest X-ray showed patchy opacities in the right lower lung lobe.
Since abdominal ultrasonography visualized hepatosplenomeg-aly and multiple enlarged lymph nodes, a positron emission tomog-raphy—computed tomography scan was conducted. This revealed a moderate increase in uptake of 18fluorodeoxyglucose (maximum standard uptake variable 5.7) in the spleen and multiple lymph nodes in the thorax and abdomen (Figure 1).
The patient underwent an empirical broad-spectrum antibi-otic treatment without any improvement. Blood and bone marrow smears presented a reactive pattern without malignant cells or bac-teria. Suspecting sarcoidosis, a transbronchial lung biopsy and biopsy of inguinal and bronchial lymph nodes were performed, revealing multiple non-caseating epithelioid granuloma. In the bronchoalve-olar lavage (BAL) a lymphocytic predominance with an increased ratio of CD4/CD8 lymphocytes was observed (3.7, normal 1.4-2.7), without evidence of bacterial, mycobacterial or fungal infections on histologic stains or tissue culture. Granulomatous chronic dis-ease was ruled out performing DHR test (dihydrorhodamine test); a normal fecal calprotectin and the absence of anti-Saccharomyces cerevisiae antibodies ruled out Crohn disease. High serum level of angiotensin-converting enzyme (ACE: 416 IU/L) and chitotriosidases (1423 nmole/mL/h) were documented.
Once infections and neoplasms were excluded, the diagnosis of sarcoidosis was strengthened by clinical, histological and labo-ratory (increased levels of ACE, chitotriosidases, increased CD4/CD8 ratio) data. A treatment with steroids (prednisone 25 mg/d) was initiated resulting in rapid resolution of symptoms within a week. However, 6 months later, in concomitance with a slow taper-ing of corticosteroids, a new onset of fever, cough, and arthralgia appeared. Laboratory tests showed a persistence of lymphope-nia (lymphocytes 890 cells/mm3) and a further reduction in IgG and IgA (IgG 559 mg/dL, IgA 38 mg/dL), with IgM of 98 mg/dL. Deficiencies of IgG2 and IgG4 (IgG1 512 mg/dL, IgG2 40 mg/dL, IgG3 50 mg/dL and absent IgG4) were documented. Antibody titers for tetanus toxoid, diphtheria and hepatitis B resulted nonprotec-tive. Normal numbers of B-lymphocytes (733 cells/μL) were de-scribed by flow cytometry, with phenotypically immature cells as demonstrated by a reduced number of circulating CD27+ memory B-cells (as low as 5% of total lymphocytes) and by a low number of switched B-cells (IgD-CD19+, CD27+: 1% of B-cells).12 To evaluate the evolution of the disease, a total body magnetic resonance im-aging was performed. This showed hepatosplenomegaly, diffuse lymphadenopathies with thoracic, abdominal and lung involve-ment and evidence of nodular lesions in the upper zones of both lungs (Figure 2).
The diagnosis was revised to CVID. Immunoglobulin replace-ment was started in association with subcutaneous methotrexate

450 | MACCORA et Al.
(15 mg/m2 weekly), and hydrocloroquine (3 mg/kg/d) with complete remission.
After 6 months, the child was still asymptomatic and in good clin-ical condition. A substitutive therapy with intravenous Ig (IVIG) at a dosage of 400 mg/kg every 4 weeks was well tolerated.
3 | DISCUSSION
Common variable immunodeficiency is a heterogeneous antibody deficiency syndrome characterized by remarkable hypogamma-globulinemia (IgG and/or IgA or IgM) and impaired peripheral B-cell differentiation in patients older than 4 years of age.13 The incidence is estimated to be 1/25 000 in the general population.14 Recurrent bacterial respiratory and gastrointestinal infections are evocative of CVID, as well as impaired response to vaccination.13,14 However, in a subgroup of patients, clinical phenotype is characterized by au-toimmune manifestations, lymphoproliferation or granulomatous
inflammation. In the latter phenotype, non-caseating granulomas might potentially involve any organ and tissue, mimicking sarcoido-sis.15-19 This event is reported in 8%-22% of patients with CVID, but it appears to be extremely rare in the pediatric age.17 Granulomatous CVID and sarcoidosis share clinical, laboratory and radiological fea-tures, although they may have a different prognosis and require dif-ferent treatments (Table 1).20
Granulomas preferentially affect liver and spleen in CVID. In contrast, they typically involve lungs in sarcoidosis (95% of cases vs CVID 51%) where micronodular lesions show a prominent dis-tribution in the upper zones in association with hilar lymphade-nopathies.5,6,18-21 Lung involvement in CVID is characterized by large nodules randomly distributed, preferentially localized in the lower lung zone, in presence of air bronchograms and smooth mar-gins surrounded by ground-glass opacities (halo sign) and bron-chiectasis.17,20,22,23 The expression granulomatous-lymphocytic interstitial lung disease (GLILD) has been coined to define such non-infectious, diffuse pulmonary complications that can occur in
F I G U R E 1 (A) Positron emission tomography—computed tomography (CT) scan: moderate increased uptake of 18fluorodeoxyglucose (maximum standard uptake variable 5.7) in spleen and multiple lymph nodes in thorax and abdomen (arrowhead). (B and C) Thoracic CT: large nodules randomly distributed, preferentially localized in the lower lung zone, surrounded by ground-glass opacities (arrowhead)
(A) (B)
(C)

| 451MACCORA et Al.
CVID patients. From the histological point of view, they can show granulomatous and or lymphoproliferative patterns, comprising lymphocytic interstitial pneumonia, follicular bronchiolitis, and lymphoid hyperplasia.22
Both CVID and sarcoidosis may show an increased CD4/CD8 ratio at bronchoalveolar lavage cytology. However, the ratio is more pronounced in sarcoidosis where 3.5 and 4.0 are considered as cut-off points.3,20,24
Sarcoidosis is usually associated with increased levels of Ig, ACE, chitotriosidase, vitamin D and calcium. On the other hand, CVID shows decreased levels of Ig, vitamin D, calcium, switched B-memory, although raised levels of ACE may be documented.2,3,6,7,14,17,20,25
Immune dysregulation with autoreactive Ig synthesis, can be present in CVID with autoimmune cytopenia such as hemolytic anemia, thrombocytopenia, and neutropenia (normal > 1500 cells/mm3).16,26
Conflicting data about prognosis are reported in these two dis-eases. Some spontaneous remissions have been reported in sar-coidosis, although the young age and CNS and heart involvement may have a more severe course.2,5-7,20 CVID has a worse progno-sis than sarcoidosis due to recurrence of severe infections, pul-monary complications, autoimmune phenomena and the risk of lymphoma.14,17-20,25,26
CVID treatment is challenging. It requires periodic Ig replacement to prevent recurrent infections and possibly to reduce autoimmune manifestations, together with immunosuppressive medications like corticosteroids or steroid-sparing agents like methotrexate, cyclosporine, rituximab, hydroxychloroquine and cyclophospha-mide.14,17-20,27 Recently, anti-tumor necrosis factor-α antibodies, such as infliximab, have been successfully used in some cases with granulomatous expression.19,20,28
Sarcoidosis management depends on disease expression. Corticosteroids play a central role in the treatment even though in case of failure, an attempt with azathioprine, cyclosporine, metho-trexate or hydroxychloroquine may be tried.2,5-7,20
In our pediatric patient, the clinical presentation (fever, cough, asthenia, hepatosplenomegaly, adenopathy), together with labora-tory (anemia and leukopenia for age, increased levels of ACE and chitotriosidase, increased CD4/CD8 ratio in BAL) and histological data initially directed the diagnosis to sarcoidosis. The unremarkable previous history and a modest immunological alteration induced a delay in hypothesizing CVID. The diagnosis of CVID was finally con-sidered only when the Ig levels remained low (<2 SD for age) and an impaired vaccination response was documented. Moreover, the complete B-cell immunophenotyping revealed a severe defect of B-cell differentiation. Low switched B-memory cells is consistent
F I G U R E 2 (A) Coronal diffusion-weighted image of the total body: evidence of hepatosplenomegaly (arrowhead), diffuse lymphadenopathies with thoracic, abdominal and lung involvement. (B) Coronal T2 thoracic: evidence of nodular lesion in the upper left lung zone (arrowhead)
(A) (B)

452 | MACCORA et Al.
with a defective germinal center development and have been found to be associated with splenomegaly, granulomatous disease, possi-bly chronic lung disease, and autoimmunity.29
In conclusion, in presence of a non-caseating granulomatous con-dition, it is mandatory to assess the immune system response, even when history does not immediately suggest an immunodeficiency. Since identification of non-caseating granulomas may mislead the cor-rect diagnosis of CVID, repeat immunological testing may be required.
CONFLIC T OF INTERE S TNone.
AUTHOR CONTRIBUTIONSIM, EM, GB, SR and TG were in charge of the patient. IM and EM wrote the manuscript with support from GS, RC, TG. RC and CA supervised the project. All authors provided critical feedback and helped shape the manuscript.
ORCIDIlaria Maccora https://orcid.org/0000-0001-6418-3254 Edoardo Marrani https://orcid.org/0000-0002-0346-3268
R E FE R E N C E S 1. Rose CD, Neven B, Wouters C. Granulomatous inflammation: the
overlap of immune deficiency and inflammation. Best Pract Res Clin Rheumatol. 2014;28(2):191-212. Review. Erratum. In: Best Pract Res Clin Rheumatol. 2014;28(3):533.
2. Valeyre D, Prasse A, Nunes H, Uzunhan Y, Brillet PY, Müller-Quernheim J. Sarcoidosis. Lancet. 2014;383(9923):1155-1167.
3. Wessendorf TE, Bonella F, Costabel U. Diagnosis of sarcoidosis. Clin Rev Allergy Immunol. 2015;49(1):54-62.
4. Spagnolo P. Sarcoidosis: a critical review of history and milestones. Clin Rev Allergy Immunol. 2015;49(1):1-5.
5. Fauroux B, Clément A. Paediatric sarcoidosis. Paediatr Respir Rev. 2005;6(2):128-133.
6. Nathan N, Marcelo P, Houdouin V, et al. Lung sarcoidosis in chil-dren: update on disease expression and management. Thorax. 2015;70(6):537-542.
7. Gedalia A, Khan TA, Shetty AK, Dimitriades VR, Espinoza LR. Childhood sarcoidosis: Louisiana experience. Clin Rheumatol. 2016;35(7):1879-1884.
8. Deverrière G, Flamans-Klein A, Firmin D, Azouzi O, Courville P, Le Roux P. Early onset pediatric sarcoidosis, diagnostic problems. Arch Pediatr. 2012;19(7):707-710.
9. Sherief LM, Amer OT, Mokhtar WA, Kamal NM, Ibrahim HM. Pediatric sarcoidosis presenting as huge splenomegaly. Pediatr Int. 2017;59(3):366-367.
10. Heinle R, Chang C. Diagnostic criteria for sarcoidosis. Autoimmun Rev. 2014;13(4–5):383-387.
11. Valeyre D, Bernaudin JF, Uzunhan Y, et al. Clinical presentation of sarcoidosis and diagnostic work-up. Semin Respir Crit Care Med. 2014;35(3):336-351.
12. Morbach H, Eichhorn EM, Liese JG, Girschick HJ. Reference val-ues for B cell subpopulations from infancy to adulthood. Clin Exp Immunol. 2010;162(2):271-279.
13. European Society for Immunodeficiencies [homepage on the Internet], ESID Registry—Working Definitions for Clinical Diagnosis of PID. https ://esid.org/Worki ng-Parti es/Regis try-Worki ng-Party/ Diagn osis-criteria. Accessed January 22, 2019.
14. Ameratunga R, Woon ST, Gillis D, Koopmans W, Steele R. New di-agnostic criteria for common variable immune deficiency (CVID), which may assist with decisions to treat with intravenous or subcu-taneous immunoglobulin. Clin Exp Immunol. 2013;174(2):203-211.
TA B L E 1 Clinical, laboratory and radiologic aspects of CVID vs sarcoidosis
Clinical and laboratory features CVID Sarcoidosis
Recurrent infections ++++(Respiratory, gastrointestinal, intractable sinusitis)
—
Autoimmunity +++(Immune cytopenia)
++(Uveitis and skin involvement)
Lung +(Lymphocytic interstitial pneumonia, follicular bron-
chiolitis, granulomas)
+++(Non-caseating granulomas, follicular bronchi-
olitis and lymphocytic interstitial pneumonia)
Hepatosplenomegaly ++++(Nodular regenerative hyperplasia)
++(Granulomatous hepatitis)
Lymphadenopathy +++(High risk of lymphoma)
+++
Immunoglobulins Hypogammaglobulinemia (Decreased IgG and IgA ± IgM)
Hypergammaglobulinemia
Specific antibodies in response to immunization
− − ++
B-memory switched Reduced Normal
ACE ++ +++
Vitamin D and Ca Normal/reduced Increased
Corticosteroid response + +
Spontaneous remission +/− ++
Abbreviations: ACE, angiotensin-converting enzyme; Ca, calcium; CVID, common variable immunodeficiency.

| 453MACCORA et Al.
15. Artac H, Bozkurt B, Talim B, Reisli I. Sarcoid-like granulomas in com-mon variable immunodeficiency. Rheumatol Int. 2009;30(1):109-112.
16. Xiao X, Miao Q, Chang C, Gershwin ME, Ma X. Common variable immunodeficiency and autoimmunity–an inconvenient truth. Autoimmun Rev. 2014;13(8):858-864.
17. Bouvry D, Mouthon L, Brillet PY, et al. Granulomatosis-associated common variable immunodeficiency disorder: a case-control study versus sarcoidosis. Eur Respir J. 2013;41(1):115-122.
18. Malphettes M, Oksenhendler E, Galicier L, Fieschi C. Granulomatous disease in common variable immunodeficiency. Rev Med Interne. 2008;29(1):28-32.
19. Boursiquot JN, Gérard L, Malphettes M, et al. DEFI study group. Granulomatous disease in CVID: retrospective analysis of clinical characteristics and treatment efficacy in a cohort of 59 patients. J Clin Immunol. 2013;33(1):84-95.
20. Verbsky JW, Routes JM. Sarcoidosis and common variable immuno-deficiency: similarities and differences. Semin Respir Crit Care Med. 2014;35(3):330-335.
21. Silva M, Nunes H, Valeyre D, Sverzellati N. Imaging of Sarcoidosis. Clin Rev Allergy Immunol. 2015;49(1):45-53.
22. Park JH, Levinson AI. Granulomatous-lymphocytic interstitial lung disease (GLILD) in common variable immunodeficiency (CVID). Clin Immunol. 2010;134(2):97-103.
23. Arnold DF, Wiggins J, Cunningham-Rundles C, Misbah SA, Chapel HM. Granulomatous disease: distinguishing primary antibody dis-ease from sarcoidosis. Clin Immunol. 2008;128(1):18-22.
24. Kollert F, Venhoff N, Goldacker S, et al. Bronchoalveolar lavage cy-tology resembles sarcoidosis in a subgroup of granulomatous CVID. Eur Respir J. 2014;43(3):922-924.
25. Shanks AM, Alluri R, Herriot R, Dempsey O. Misdiagnosis of common variable immune deficiency. BMJ Case Rep. 2014;2014:bcr2013202806.
26. Azizi G, Abolhassani H, Asgardoon MH, et al. Autoimmunity in com-mon variable immunodeficiency: epidemiology, pathophysiology and management. Expert Rev Clin Immunol. 2017;13(2):101-115.
27. Chase NM, Verbsky JW, Hintermeyer MK, et al. Use of combination chemotherapy for treatment of granulomatous and lymphocytic interstitial lung disease (GLILD) in patients with common variable immunodeficiency (CVID). J Clin Immunol. 2013;33(1):30-39.
28. Franxman TJ, Howe LE, Baker JR Jr. Infliximab for treatment of granulomatous disease in patients with common variable immuno-deficiency. J Clin Immunol. 2014;34(7):820-827.
29. Bonilla FA, Barlan I, Chapel H, et al. International Consensus Document (ICON): common variable immunodeficiency disorders. J Allergy Clin Immunol Pract. 2016;4(1):38-59.
How to cite this article: Maccora I, Marrani E, Ricci S, et al. Common variable immunodeficiency presenting as sarcoidosis in a 9-year-old child. Int J Rheum Dis. 2020;23:448–453. https ://doi.org/10.1111/1756-185X.13775

454 | wileyonlinelibrary.com/journal/apl Int J Rheum Dis. 2020;23:454–456.© 2020 Asia Pacific League of Associations for Rheumatology and John Wiley & Sons Australia, Ltd
Received: 10 November 2019 | Revised: 20 December 2019 | Accepted: 24 December 2019
DOI: 10.1111/1756-185X.13791
C O R R E S P O N D E N C E
Secukinumab can treat psoriasis induced by anti-TNF-alpha therapy in patients with ankylosing spondylitis: Case series
1 | INTRODUC TION
Ankylosing spondylitis (AS) is a chronic disease characterized by in-flammation and new bone formation in the axial skeleton.1,2 Tumor necrosis factor (TNF)-alpha inhibitor treatment is recommended for patients with persistent disease activity despite conventional treat-ment/3 However, in some patients the treatment fails to achieve ad-equate disease control or has unacceptable side effects.
TNF-alpha inhibitor treatment has been used for many years. The treatment spectrum is expanding day by day and the drugs are used in many autoimmune diseases, especially rheumatoid arthri-tis (RA), AS, psoriasis, psoriatic arthritis (PsA), juvenile idiopathic arthritis and Crohn's disease. In addition to its benefits, the drugs may cause serious side effects, especially infections.4,5 TNF-alpha inhibitors, which are also used in the treatment of psoriasis and PsA, can paradoxically cause psoriasis. Secukinumab is a fully human an-ti-interleukin (IL)-17A monoclonal antibody with proven efficacy in psoriasis, PsA and AS.6-8
In this case series, we reviewed the treatment of psoriasis in-duced by TNF-alpha inhibitors with secukinumab in two patients with AS. Paradoxic psoriasis and disease activity after TNF-alpha inhibitors in two patients with AS was treated with secukinumab.
2 | C A SE REPORT 1
A 60-year-old woman presented with low back, wrist, knee and ankle pain. In her history, she had been followed for AS for 2 years and she did not benefit from nonsteroidal anti-inflammatory drugs or sulfasalazine. The patient had generalized pain and morning stiff-ness lasting about an hour and relieved by movement. There was also night pain. There was no fever, sweating or weight loss. When admitted, she was using sulfasalazine tablets (500 mg) 2 g/d and ibu-profen tablets 1600 mg/d. She had previously received methotrex-ate and meloxicam which were not effective.
In her past history, hypertension was present. The modified Schober test was 6 cm and the occiput wall distance was 5 cm. Proximal interphalangeal joints and metacarpophalangeal joints of the patient were painful and Faber-Patrick test was bilaterally posi-tive. The patient's Bath Ankylosing Spondylitis Disease Activity Index (BASDAI) score was 6.2 points and her Bath Ankylosing Spondylitis Metrology Index (BASMI) score was 2.5 points. In laboratory exam-ination, complete blood count and biochemistry parameters were
normal: erythrocyte sedimentation rate (ESR), 40 mm/h (0-20); C-reactive protein (CRP), 15 mg/dL (0-5); human leukocyte antigen (HLA)-B27 negative; Brucella negative. Sacroiliac magnetic reso-nance imaging showed bilateral sacroiliitis. The patient underwent tuberculin skin test (0 mm) and quantiferon test was negative.
TNF-alpha inhibitor golimumab 50 mg/0.5 mL was administered subcutaneously once a month. After the third application, erythem-atous squamous rashes were found on the knee, elbow extensors, palms and soles of the patient. The patient's skin biopsy revealed a multilayer squamous epithelium showing hyperkeratosis, parakera-tosis and acanthosis, and a pathology consistent with psoriasis with mononuclear cells in the dermis (Figure 1A). Four weeks after the last dose of golimumab, secukinumab 300 mg was administered to the patient as loading dose at 0, 1, 2, 3 and 4 weeks, and subcutane-ously to maintenance dose once a month. After 6 months of treat-ment with secukinumab, the patient's BASDAI score was reduced from 6.2 to 2 points, and after 6 months of treatment, the lesions regressed substantially (Figure 1B).
3 | C A SE REPORT 2
A 55-year-old female patient had been followed up with AS for 10 years. She was using etanercept 50 mg subcutaneously once a week. The patient's low back pain recently increased and morning stiffness over 2 hours was added. She had night pain which was par-tially relieved by movement. The patient had no fever and no night sweats. She also used asemetacin 90 mg/d. She also had primary biliary cirrhosis. In the systemic examination of the patient, thoracic kyphosis was increased and anthalgic gait in mild ante-flexion pos-ture was observed. Lumbar joint movements were painful and lim-ited in all directions. Straight leg raise test and Laseque test were negative. Faber-Patrick tests were bilaterally positive and slightly limited. Occiput wall distance was 10 cm, hand-ground floor dis-tance was 18 cm, cervical rotations were 70° on the right and 75° on the left. BASDAI score was 7.1 points and BASMI score was 6 points. In the laboratory examination, the hemogram was within normal range, ESR 45 mm/h (0-20), CRP 22 mg/dL (0-5), HLA-B27 positive, Brucella negative. Sacroiliac joint radiography showed bilat-eral New York grade 3 sacroiliitis. Due to psoriasis-like skin lesions, etanercept was changed to adalimumab treatment. Lesions per-sisted in the soles of the feet after application of 6 months of adali-mumab (Figure 2A). Skin biopsy revealed palmoplantar psoriasis.

| 455CORRESPONDENCE
Adalimumab was discontinued. Four weeks after the last dose of adalimumab, secukinumab 300 mg was administered to the patient as loading at 0, 1, 2, 3 and 4 weeks, and subcutaneously to main-tenance once a month. After 9 months of use of secukinumab, the BASDAI score decreased to 1.8 points and the skin lesions almost completely resolved (Figure 2B).
4 | DISCUSSION
The Assessment of SpondyloArthritis International Society (ASAS), the European League Against Rheumatism (EULAR) and the American College of Rheumatology (ACR)/Spondylitis Association of American and Spondyloarthritis Research and Treatment Network (SPARTAN) all recommend NSAIDs as first-line treatment for AS. Biological treatments are used in patients who do not respond to NSAIDs. These are TNF inhibitors and the anti-IL-17A monoclonal antibody secukinumab, and have been shown to be effective in the treatment of AS.9-16
A number of undesirable side effects can be observed, partic-ularly infections due to these biological agents. Anti-TNF agents are widely used in the treatment of various inflammatory disorders including inflammatory bowel disease, RA and AS. Some clinical ob-servations have identified the paradoxical incidence or exacerbation of psoriasis in patients treated with anti-TNF agents. These drugs used in the treatment of psoriasis paradoxically can cause psoria-sis.17 The unexpected activation of the interferon-α pathway after TNF neutralization has been proposed as a possible mechanism.
The first signs of a link between anti-TNF treatment and in-creased type interferon (IFN)-α expression came from the observa-tion that anti-TNF treatment leads to IFN-α signature in the blood of young arthritis patients.18 Likewise, anti-TNF therapies promote the formation of anti-nuclear antibodies19 associated with increased
IFN-α levels in systemic lupus erythematosus patients.20 Also, an-ti-TNFs can stimulate or aggravate lupus, a type I IFN-mediated au-toimmune disease.21,22 Indeed, an increase in IFN levels has been shown in lesional skin of patients with paradoxical psoriasis caused by anti-TNF.23
Secukinumab, a human monoclonal antibody that directly inhib-its IL-17A, has shown significant and continuous efficacy in the treat-ment of AS.24-27 Secukinumab may be an alternative in patients with AS when TNF-alpha inhibitors cannot be used.
Cortese et al reported the clinical cases of two patients affected by a central nervous system demyelinating disease and AS who were successfully treated with secukinumab, providing additional evi-dence of the feasibility of this therapeutic option when the use of TNF inhibitors is discouraged by challenging co-morbidities.28
In conclusion, paradoxical psoriasis may develop due to anti-TNF drugs used in the treatment of in AS and some other inflammatory rheumatologic conditions. The treatment of paradoxical psoriasis caused by TNF-alpha inhibitors is not clear. We believe that secuk-inumab may be a choice in the treatment of this type of psoriasis induced by anti-TNF-alpha inhibitors in patients with AS.
FUNDING INFORMATIONThe author(s) declared no potential conflicts of interest with respect to the research, authorship, and/or publication of this article. The author(s) received no financial support for the research, authorship, and/or publication of this article.
KE Y WORDSankylosing spondylitis, psoriasis, secukinumab, TNF-alpha
Hakan ApaydinIsmail Dogan Associate professor
Şükran Erten Professor
F I G U R E 1 Psoriasis after anti-TNF-alpha treatment (A), after Secukinumab treatment (B)
(A) (B)
F I G U R E 2 Planter psoriasis after Adalimumab (A), After Secukinumab (B)
(A) (B)

456 | CORRESPONDENCE
Department of Rheumatology, Ministry of Health Ankara City Hospital, Ankara, Turkey
CorrespondenceHakan Apaydin, Department of Rheumatology, Ministry of
Health Ankara City Hospital, Ankara, Turkey.Email: [email protected]
ORCIDHakan Apaydin https://orcid.org/0000-0001-7219-1457 Ismail Dogan https://orcid.org/0000-0002-7603-9484 Şükran Erten https://orcid.org/0000-0003-0717-8365
R E FE R E N C E S 1. Braun J, Sieper J. Ankylosing spondylitis. Lancet.
2007;369:1379-1390. 2. Gao X, Wendling D, Botteman MF, Carter JA, Rao S, Cifaldi M.
Clinical and economic burden of extra-articular manifestations in ankylosing spondylitis patients treated with anti-tumor necrosis factor agents. J Med Econ. 2012;15:1054-1063.
3. Wallis RS, Broder MS, Wong JY, Hanson ME, Beenhouwer DO. Granulomatous infectious diseases associated with tumor necrosis factor antagonists. Clin Infect Dis. 2004;38(9):1261-1265.
4. Solovic I, Sester M, Gomez-Reino JJ, et al. The risk of tuberculosis related to tumour necrosis factor antagonist therapies: a TBNET consensus statement. Eur Respir J. 2010;36(5):1185-1206.
5. Ramiro S, Sepriano A, Chatzidionysiou K, et al. Safety of synthetic and biological DMARDs: a systematic literature review informing the 2016 update of the EULAR recommendations for management of rheumatoid arthritis. Ann Rheum Dis. 2017;76:1093-1101.
6. Schadler ED, Ortel B, Mehlis SL. Biologics for the primary care phy-sician: review and treatment of psoriasis.
7. Strand V, Mease P, Gossec L, et al. Secukinumab improves pa-tient-reported outcomes in subjects with active psoriatic arthritis: results from a randomised phase III trial (FUTURE 1). Ann Rheum Dis. 2017;76:203-207.
8. Baeten D, Sieper J, Braun J, et al. Secukinumab, an inter-leukin-17A inhibitor, in ankylosing spondylitis. N Engl J Med. 2015;373:2534-2548.
9. Maxwell LJ, Zochling J, Boonen A, et al. TNF-alpha inhibi-tors for ankylosing spondylitis. Cochrane Database Syst Rev. 2015;4:CD005468.
10. Davis JC Jr, Van Der Heijde D, Braun J, et al. Recombinant human tumor necrosis factor receptor (etanercept) for treating ankylos-ing spondylitis: a randomized, controlled trial. Arthritis Rheum. 2003;48(11):3230-3236.
11. Braun J, Brandt J, Listing J, et al. Treatment of active ankylosing spondylitis with infliximab: a randomised controlled multicentre trial. Lancet. 2002;359(9313):1187-1193.
12. Landewe R, Braun J, Deodhar A, et al. Efficacy of certolizumab pegol on signs and symptoms of axial spondyloarthritis including ankylos-ing spondylitis: 24-week results of a double-blind randomised pla-cebo-controlled Phase 3 study. Ann Rheum Dis. 2014;73(1):39-47.
13. Van der Heijde D, Kivitz A, Schiff MH, et al. Efficacy and safety of adalimumab in patients with ankylosing spondylitis: results of a multicenter, randomized, double-blind, placebo-controlled trial. Arthritis Rheum. 2006;54(7):2136-2146.
14. Baeten D, Sieper J, Braun J, et al. Secukinumab, an inter-leukin-17a inhibitor, in ankylosing spondylitis. N Engl J Med. 2015;373(26):2534-2548.
15. Inman RD, Davis JC Jr, Heijde D, et al. Efficacy and safety of go-limumab in patients with ankylosing spondylitis: Results of a ran-domized, double-blind, placebo-controlled, phase III trial. Arthritis Rheum. 2008;58(11):3402-3412.
16. Sepriano A, Regel A, van der Heijde D, et al. update of the ASAS/EULAR recommendations for the management of axial spondyloar-thritis. RMD Open. 2017;3(1):e000396.
17. Ko JM, Gottlieb AB, Kerbleski JF. Induction and exacerbation of psoriasis with TNF-blockade therapy: a review and analysis of 127 cases. J Dermatolog Treat. 2009;20:100-108.
18. Palucka AK, Blanck JP, Bennett L, Pascual V, Banchereau J. Cross-regulation of TNF and IFNa in autoimmune diseases. Proc Natl Acad Sci USA. 2005;102:3372-3377.
19. Ivashkiv LB. Type I interferon modulation of cellular responses to cytokines and infectious pathogens: potential role in SLE pathogen-esis. Autoimmunity. 2003;36:473-479.
20. Ytterberg SR, Schnitzer TJ. Serum interferon levels in patients with systemic lupus erythematosous. Arthritis Rheum. 1982;25:401-407.
21. Bengtsson AA, Sturfelt G, Truedsson L, et al. Activation of type I interferon system in systemic lupus erythematosus correlates with disease activity but not with antiretroviral antibodies. Lupus. 2000;9:664-671.
22. Blanco P, Palucka AK, Gill M, Pascual V, Banchereau J. Induction of dendritic cell differentiation by IFN-alpha in systemic lupus erythe-matosus. Science. 2001;294:1540-1543.
23. Seneschal J, Milpied B, Vergier B, Lepreux S, Schaeverbeke T, Taïeb A. Cytokine imbalance with increased production of interferon-al-pha in psoriasiform eruptions associated with antitumour necrosis factor-alpha treatments. Br J Dermatol. 2009;161:1081-1088.
24. Baraliakos X, Kivitz AJ, Deodhar AA, et al. Long-term effects of interleukin-17A inhibition with secukinumab in active ankylosing spondylitis: 3-year efficacy and safety results from an extension of the Phase 3 MEASURE 1 trial. Clin Exp Rheumatol. 2018;36(1):50-55.
25. Braun J, Baraliakos X, Deodhar A, et al. Effect of secukinumab on clinical and radiographic outcomes in ankylosing spondylitis: 2-year results from the randomised phase III MEASURE 1 study. Ann Rheum Dis. 2017;76(6):1070-1077.
26. Deodhar AA, Dougados M, Baeten DL, et al. Effect of secukinumab on patient-reported outcomes in patients with active ankylosing spondylitis: A phase III randomized trial (MEASURE 1). Arthritis Rheumatol. 2016;68(12):2901-2910.
27. Marzo Ortega H, Sieper J, Kivitz A, et al. Secukinumab and sus-tained improvement in signs and symptoms of patients with active ankylosing spondylitis through 2 years: Results from a Phase III study. Arthritis Care Res. 2017;69(7):1020-1029.
28. Cortese A, Lucchetti R, Altobelli A, et al. Secukinumab may be a valid treatment option in patients with CNS demyelination and con-current ankylosing spondylitis: Report of two clinical cases. Mult Scler Relat Disord. 2019;35:193-195.

The 2020 congress will be held on 31 August – 3 September in Kyoto Interna onal Conference Center, Japan. Please do look out for updates by visi ng the website.
APLAR aims to improve standards of clinical prac ce, teaching, and research in rheumatology across Asia Pacifi c. We are recognising the long-term eff orts and dedica on of centers in the region with a similar goal for excellence in the fi eld. The cer fi ca on programme we have ini ated will award leading centers in Asia Pacifi c as Centers of Excellence based on three pillars (research, clinical prac ce, academia), pre-defi ned by a list of criteria set by APLAR.

We hope the centers in the region with an excellent track record in any of these pillars will par cipate in this programme as our goal is to establish reference centers that are best in class models for prac ce, teaching, and research in rheumatology. We believe this will enhance and enrich the ‘best in class’ experience for our trainees involved in the APLAR Fellowship programme. Further, this will also help us build a strong network of reference centers for collabora ons and consulta on within and among countries in the region.
APLAR awarded Centers of Excellence have been updated and informa on about these centers can be found on the website. Center of Excellence 2020 applica on will begin in March next year. Applica on informa on will be made available through the Member Na onal Organisa ons of APLAR.
APLAR FELLOWSHIP GRANT
The Asia Pacifi c League of Associa ons for Rheumatology (APLAR) had awarded 2 applicants for the Fellowship Grant of 2019. They are embarking on their fellowship programme in the coming months. Successful candidates must have a long-term commitment to con nue research or clinical work in his/her own country at the conclusion of the Fellowship. The grant is awarded to cover accommoda on and subsistence costs. We congratulate the awardees and wish them a frui ul journey in their career paths.
APLAR RESEARCH GRANT
The Asia Pacifi c League of Associa ons for Rheumatology (APLAR) had awarded 2 applicants for the Research Grant of 2019. The grants are to assist the undertaking of research in either adult or paediatric rheumatology. The aims of the grant are to give the researcher an opportunity to start and do research within their own country of residence. In addi on, we hope to promote and support basic and clinical research directed to the causes, preven on, and treatment of rheuma c diseases in the APLAR member society countries. This grant is to be used for consumables required for the research and not for salaries or fi xed costs. It is expected that the research will be completed within one (1) year of the onset. The awarded candidates are encouraged to publish their work in the APLAR offi cial journal – Interna onal Journal of Rheuma c Disease (IJRD) as part of their contribu on.
APLAR-COPCORD GRANT
The Asia Pacifi c League of Associa ons for Rheumatology (APLAR) did not have any applicant for COPCORD grant 2019. We encourage interested candidates to send in their applica on during the applica on period for COPCORD grant 2020. The aims of the grant are to give the researcher an opportunity to study rheuma c disease in the community of their own country of residence. This grant is to be used for consumables required for the research and not for salaries or fi xed costs. It is expected that the research will be completed within one (1) year of the onset.
All APLAR Grants are currently open for applica on. The closing date will be on 21 February 2020. APLAR Grants informa on on eligibility, criteria and applica on requirement can be found on the website.