The Impact of State Laws Limiting Malpractice Damage Awards on Health Care Expenditures
7
American Journal of Public Health | August 2006, Vol 96, No. 8 6 | Government, Politics, and Law | Peer Reviewed | Hellinger and Encinosa GOVERNMENT, POLITICS, AND LAW The Impact of State Laws Limiting Malpractice Damage Awards on Health Care Expenditures | Fred J. Hellinger, PhD, and William E. Encinosa, PhD Twenty-eight states have laws that limit payments in malprac- tice cases, and several studies indicate that these laws reduce the frequency and severity of malpractice claims and lower premiums. Moreover, propo- nents believe that such laws reduce health care expenditures by reducing the practice of defensive medicine. However, there is a dearth of empirical ev- idence about the impact of these laws on the cost of health care. We used multivariate mod- els and relatively recent data to estimate the impact of state tort reform laws that directly limit malpractice damage pay- ments on health care expendi- tures. Estimates from these models suggest that laws lim- iting malpractice payments lower state health care expen- ditures by between 3% and 4%. (Am J Public Health. 2006;96: XXX–XXX. doi:10.2105/AJPH. 2005.077883) THE 2 KEY FUNCTIONS OF OUR medical malpractice system are to compensate victims of negligent care and to provide ap- propriate incentives for health care professionals to supply safe and efficient care. 1,2 Yet our medical malpractice system rarely compensates individuals who suffer injuries through med- ical negligence, and it often com- pensates those who suffer in- juries unrelated to medical negligence. A landmark Harvard University study of malpractice claims in New York State found that only 2% of negligent in- juries resulted in a claim and that only 17% of claims involved a negligent injury. 3,4 Moreover, there is concern that the most damaging attribute of our medical malpractice sys- tem is not that it fails to compen- sate victims or to deter poor per- formance but that it promotes the practice of “defensive medi- cine.” In its 1994 report on med- ical malpractice and the practice of defensive medicine, the Office of Technology Assessment wrote, “For more than two decades many physicians, researchers, and government officials have claimed that the most damaging and costly result of the medical http://www.ajph.org/cgi/doi/10.2105/AJPH.2005.077883 The latest version is at Published Ahead of Print on June 29, 2006, as 10.2105/AJPH.2005.077883
-
Upload
independent -
Category
Documents
-
view
0 -
download
0
Transcript of The Impact of State Laws Limiting Malpractice Damage Awards on Health Care Expenditures
American Journal of Public Health | August 2006, Vol 96, No. 86 | Government, Politics, and Law | Peer Reviewed | Hellinger and Encinosa
GOVERNMENT, POLITICS, AND LAW
23. Angell M. The Truth About DrugCompanies. New York, NY: RandomHouse; 2004.
24. McChesney RW, Nichols J. OurMedia, Not Theirs: The Democratic Strug-gle Against Corporate Media. New York,NY: Seven Stories Press; 2002.
25. Krimsky S. Science in the PrivateInterest: Has the Lure of Profits CorruptedBiomedical Research? Lanham, Md:Rowman & Littlefield; 2003.
26. Giroux HA. Academic entrepre-neurs: the corporate takeover of highereducation. Tikkun. 2005;20:18–23.
27. Rifkin I. Spiritual Perspectives onGlobalization: Making Sense of Economicand Cultural Upheaval. Woodstock, Vt:Skylight Paths; 2003.
28. International Forum on Globaliza-tion. Alternatives to Economic Globaliza-tion: A Better World Is Possible. SanFrancisco, Calif: Berrett-Kehler; 2002.
29. Collins C, Hartman C, Kraut K,Mota G. Shifty Tax Cuts: How They
Move the Tax Burden Off the Rich andOnto Everyone Else. 2004. Availableat: http://www.faireconomy.org/press/2004/2004TaxDayReport.pdf. Ac-cessed May 30, 2005.
30. Wasow B (2004). The New Amer-ican Economy: A Rising Tide That LiftsOnly Yahts. Available at: http://www.tcf.org/Publications/EconomicsInequality/wasow_yachtrc.pdf. Accessed February17, 2006.
31. Shaffer E, Brenner J. Trade andhealth care: corporatizing vital humanservices. In: Fort M, Mercer MA, Gish O,eds. Sickness and Wealth: The Corpo-rate Assault on Global Health. Cam-bridge, Mass: South End Press; 2004:79–89.
32. Mander J. The Rules of CorporateBehavior. In: Mander J, Goldsmith E,eds. The Case Against the Global Econ-omy and For a Turn Toward the Local.San Francisco, Calif: Sierra Club Books;1996:309–334.
33. World Social Forum. Available at:
http://www.forumsocialmundial.org.br/index.php?cd_language=2&id_menu=.Accessed April 5, 2005.
34. Program on Corporations, Law &Democracy Web page. Available athttp://www.poclad.org. Accessed April5, 2005.
35. CorpWatch: Holding CorporationsAccountable Web page. Available at:http://www.corpwatch.org. AccessedApril 5, 2005.
36. The Yes Men [DVD]. Los Angeles,Calif: United Artists; 2004.
37. Bartley T. Certifying forests andfactories: states, social movements, andthe rise of private regulation in the ap-parel and forest products fields. PolitSoc. 2003;31:433–464.
38. Kreuter MW. Commentary on pub-lic health advocacy to change corporatepractices. Health Educ Behav. 2005;32:355–362.
39. ASPH Education Committee Core
Masters in Public Health CompetencyDevelopment Project Version 1 October2004–May 2005. May 2005. Availableat: http://www.asph.org/UserFiles/Main%2022.pdf. Accessed May 30, 2005.
40. Schuftan C. Poverty and inequityin the era of globalization: our need tochange and reconceptualize. Int J EquityHealth. 2003;2:4.
41. Kickbusch I. The end of publichealth as we know it: constructing globalhealth in the 21st century. Presented at:the World Federation of Public HealthAssociations 10th International Congresson Public Health. Sustaining PublicHealth in a Changing World: Vision toAction; April 19–22, 2004; TheBrighton Centre, Brighton, UK. Availableat: http://www.apha.org/wfpha/pdf/Transcript%20of%20Leavell%20Lecture1.pdf. Accessed May 14, 2004.
42. Kickbusch I. From charity to rights:proposal for five action areas for globalhealth. J Epidemiol Community Health.2004;58:630–631.
The Impact of State Laws Limiting Malpractice Damage Awards on Health Care Expenditures| Fred J. Hellinger, PhD, and William E. Encinosa, PhD
Twenty-eight states have lawsthat limit payments in malprac-tice cases, and several studiesindicate that these laws reducethe frequency and severity ofmalpractice claims and lowerpremiums. Moreover, propo-nents believe that such lawsreduce health care expendituresby reducing the practice ofdefensive medicine. However,there is a dearth of empirical ev-idence about the impact of theselaws on the cost of health care.
We used multivariate mod-els and relatively recent data toestimate the impact of state
tort reform laws that directlylimit malpractice damage pay-ments on health care expendi-tures. Estimates from thesemodels suggest that laws lim-iting malpractice paymentslower state health care expen-ditures by between 3% and 4%.(Am J Public Health. 2006;96:XXX–XXX. doi:10.2105/AJPH.2005.077883)
THE 2 KEY FUNCTIONS OFOUR medical malpractice systemare to compensate victims ofnegligent care and to provide ap-
propriate incentives for healthcare professionals to supply safeand efficient care.1,2 Yet ourmedical malpractice systemrarely compensates individualswho suffer injuries through med-ical negligence, and it often com-pensates those who suffer in-juries unrelated to medicalnegligence. A landmark HarvardUniversity study of malpracticeclaims in New York State foundthat only 2% of negligent in-juries resulted in a claim andthat only 17% of claims involveda negligent injury.3,4
Moreover, there is concernthat the most damaging attributeof our medical malpractice sys-tem is not that it fails to compen-sate victims or to deter poor per-formance but that it promotesthe practice of “defensive medi-cine.” In its 1994 report on med-ical malpractice and the practiceof defensive medicine, the Officeof Technology Assessment wrote,“For more than two decadesmany physicians, researchers,and government officials haveclaimed that the most damagingand costly result of the medical
http://www.ajph.org/cgi/doi/10.2105/AJPH.2005.077883The latest version is at Published Ahead of Print on June 29, 2006, as 10.2105/AJPH.2005.077883
August 2006, Vol 96, No. 8 | American Journal of Public Health Hellinger and Encinosa | Peer Reviewed | Government, Politics, and Law | 7
GOVERNMENT, POLITICS, AND LAW
TABLE 1—States WithCaps on MalpracticeAwards for NoneconomicDamages: United States,1975–2005
Years With Any Cap
Alabama 1987–1991Alaska 1986–California 1975–Colorado 1986–Florida 1988–1991,
2003–Georgia 2005–Hawaii 1986–Idaho 1990–Illinois 1995–1997,
2005–Indianaa 1975–Kansas 1988–Louisianaa 1975–Maryland 1986–Massachusetts 1986–Michigan 1986–Mississippi 2002–Missouri 1986–Montana 1995–Nevada 2002–New Hampshire 1977–1980New Mexicoa 1976–North Dakota 1995–Ohio 1975–1994,
1997–1999,2003–
Oklahoma 2004–Oregon 1987–1999South Carolina 2005–South Dakota 1986–Texas 1977–1988,
2003–Utah 1986–Virginiaa 1976–Washington 1986–1988West Virginia 1986–Wisconsin 1985–2005
Note. Open ranges indicate thecontinued presence of caps.a Cap on total damages; current asof October, 2005.
malpractice system as it hasevolved in the United States isthe practice of defensive medi-cine: the ordering of tests, proce-dures, and visits, or avoidanceof certain procedures for patientsbecause of concern about mal-practice liability risk.”5
In order to reduce the cost ofdefensive medicine and to makemalpractice insurance more af-fordable, many physicians, legis-lators, and others support lawsthat limit damage payments inmedical malpractice cases.6,7 Sup-porters maintain that escalating,multimillion-dollar awards aredriving premium increases andthat restricting malpractice pay-ments will lower health care ex-penditures by reducing the prac-tice of defensive medicine.8
Opponents maintain that rapidlyincreasing malpractice premiumsare in large part a consequenceof insurance companies trying tooffset the costs of ill-advised busi-ness decisions and declining in-vestment income.
Opponents also note that inmost geographic areas there areonly a few malpractice insurers,and they argue that insurers areable to maintain artificially highprices as a result of the limitedcompetition. They also maintainthat underwriting cycles for mal-practice insurance have been toosevere especially because claimspayments have significantly ex-ceeded claims costs for most re-cent time periods.9
Others offer different reasonsfor rapidly escalating malpracticepremiums and for the volatilityin the market for malpractice in-surance.10,11 Some maintain thathigh premiums results from the
risk distribution of malpracticeclaims (i.e., they argue that thereis more uncertainty about thenumber and size of malpracticeclaims than there is in other linesof business) and the long averagetime period for claims settlementperiods (i.e., the long time periodbetween when a claim is fileduntil it is settled).12 Thus, it is rea-soned that insurers must continu-ally increase premiums to main-tain large reserves in an effort tosupport future claim payments.
At present, there are 28 stateswith laws that limit damage pay-ments in malpractice cases(Table 1) (Alaska, California, Col-orado, Florida, Georgia, Hawaii,Idaho, Illinois, Indiana, Kansas,Louisiana, Maryland, Massachu-setts, Michigan, Mississippi, Mis-souri, Montana, Nevada, NewMexico, North Dakota, Ohio,Oklahoma, South Carolina, SouthDakota, Texas, Utah, Virginia,and West Virginia).13–16 In addi-tion, there have been determinedefforts to pass legislation limitingdamage payments in malpracticecases in Pennsylvania, New Jer-sey, and Connecticut.17–19
We estimated the impact ofstate tort reform laws that di-rectly limit malpractice damagepayments on all health care ex-penditures in a state. This is thefirst empirical study of the im-pact of such laws on state healthcare expenditures. Our studycombined 1984, 1988, 1994,and 1998 data on state healthcare expenditures with data on avariety of other state characteris-tics including information aboutstate tort reform law. Multivariateregression analysis was used toestimate equations explaining
health care expenditures per ca-pita where the state was the unitof observation.
Several studies have shownthat state tort reform laws di-rectly limiting payments in med-ical malpractice cases reduce thefrequency and severity of mal-practice claims and lower premi-ums.8 Moreover, proponents be-lieve that the passage of suchlaws reduces health care expendi-tures because the laws reduce thepractice of defensive medicine.
BACKGROUND
The Cost of DefensiveMedicine
Most studies of the cost of de-fensive medicine are based onphysicians’ responses to questionsabout their underlying motivationfor providing certain proceduresand services.20,21 There are afew studies, however, based oncost and utilization data.22–24 Yetthese are dated and they examineonly a few procedures and condi-tions. By and large, both types ofstudies have found evidence sup-porting the existence of defensivemedicine, and some have foundthat the scope and extent of de-fensive medicine is greater inareas with high malpractice claimrates and high premiums.
In the first widely cited studyof the cost of medical malpractice,Reynolds and colleagues25(p2772)
used data from the AmericanMedical Association’s 1984 Socio-economic Monitoring System.This is a telephone survey of anationally representative sampleof nonfederal physicians, and phy-sician respondents to the Socio-economic Monitoring System in
American Journal of Public Health | August 2006, Vol 96, No. 88 | Government, Politics, and Law | Peer Reviewed | Hellinger and Encinosa
GOVERNMENT, POLITICS, AND LAW
1984 indicated that because ofthe threat of malpractice litigation,they prescribed 2.2% more phar-maceuticals, scheduled 2.6%more follow-up visits, spent 2.9%more time with patients, and spent2.4% more than they would havewithout this threat. From thesedata, Reynolds and colleaguescalculated that the cost of thesepractices designed to reduce thelikelihood of being sued for mal-practice was equal to 14.1% ofphysicians’ revenue in 1984.
The Impact of State LawsLimiting Malpractice Awards
Most studies indicate that statetort reform laws directly limitingpayments in medical malpracticecases reduce the frequency andseverity of malpractice claims,and most also indicate that theylower premiums. The GeneralAccounting Office concluded that“limited available data indicatethat rates of growth in malprac-tice premiums and claims pay-ments have been slower on aver-age in states that enacted certaincaps on damages for pain andsuffering—referred to as non-economic damage caps—thanin states with more limited re-forms. . . . For example, from2001 through 2002, averagepremium rates rose approxi-mately 10% in states withnoneconomic damage caps of$250000 compared with ap-proximately 29% in states withmore limited tort reforms.”26(p6)
Confirmatory evidence of theimpact of these laws on malprac-tice premiums is provided in arecent study by Thorpe,12 whoused data from the National As-sociation of Insurance Commis-
sioners for the years 1995through 2001. Thorpe foundthat malpractice premiums instates with laws capping malprac-tice payments were 17.1% lowerthan in states without such laws.
Although there are a numberof studies of the impact of tort re-form laws on the frequency andseverity of claims and on mal-practice premiums,27–29 there isonly 1 study of the impact oflaws that directly limit paymentsin malpractice cases on healthcare expenditures.30 In that study,Kessler and McClellan addressedthe impact of these laws on thecost of hospital care for Medicarepatients with acute myocardial in-farction or ischemic heart diseasein 1984, 1987, and 1990. Theyused data on hospitalizations re-lated to these causes in the yearafter the heart event along withdata on state tort reform legisla-tion to estimate the impact ofthese laws on hospital costs, mor-tality rates, and serious cardiaccomplications. They found thathealth care expenditures forMedicare patients with acute my-ocardial infarction in states witha law directly limiting damagepayments were 5.3% lower thanthose of similar patients in stateswithout such laws. The corre-sponding figure for ischemicheart disease patients was 9.0%.Although the cost of hospital carefor Medicare patients with anacute myocardial infarction or is-chemic heart disease is consider-able, it accounts for only 1% ofnational health expenditures.30
Kessler and McClellan30 alsofound that these laws had noimpact on mortality rates or serious cardiac complications.
They concluded that malpracticeliability reforms that directlylimit awards result in sizablecutbacks in the rate of growthof the cost of treating cardiacillness in the elderly with nonoticeable diminution of healthoutcomes, including morbidityand mortality.30(p388)
METHODS
The empirical analysis in thisstudy was based on the premisethat 1 of the factors affecting thecost of defensive medicine in astate is its legal environment. Itwas hypothesized that physiciansare less likely to order tests, pre-scribe medications, and provideservices in order to reduce thelikelihood of being sued in stateswith a law limiting their exposureto damages.
The key independent variablein this study was whether or nota state had a cap on nonecono-mic damages in a given year(Table 1). In order to adjust forother types of liability reforms,we included variables for collat-eral source reform (which pre-vents payments for damages thathave been compensated fromother sources), for joint and sev-eral liability reform (which placesa party at risk only for the shareof the total settlement that corre-sponds to that party’s level of re-sponsibility), and for punitive dam-age caps (which limit payment topunish a defendant for intentionalor malicious misconduct).
A variety of factors were in-cluded in our model. Physicians’availability was measured by thenumber of active, nonfederalphysicians practicing in each
state per 100000 civilian resi-dents, and it was assumed thatstates with more physicianswould have higher health careexpenditures. States with higherpersonal incomes were assumedto have a greater demand forhealth care services and higherhealth care expenditures. For thisreason, we included personal in-come in our model. Similarly, itwas assumed that states withhigher unemployment rates werelikely to have lower demand forhealth services and that thiswould result in lower health careexpenditures. For this reason, weincluded a state’s unemploymentrate in our model.
We assumed that health careexpenditures in states that weresparsely populated were less thanthose in states that were denselypopulated because physicians andpatients had to travel longer dis-tances to provide or seek care.31
For this reason, we included a vari-able that measured the number ofcitizens (measured in thousands)per square mile for each state.
The proportion of personsworking on farms was assumedto be negatively related to thedemand for health services.32,33
Farm workers are more likely tolack insurance and receive lowwages and thus, were expectedto have little disposable incometo spend on health care services.31
Consequently, a variable measur-ing the percentage of the statedomestic product (i.e., a measureof the value of goods and ser-vices produced within a state)attributable to farm activities wasincluded in the model. We alsoincluded the proportion of resi-dents without health insurance
August 2006, Vol 96, No. 8 | American Journal of Public Health Hellinger and Encinosa | Peer Reviewed | Government, Politics, and Law | 9
GOVERNMENT, POLITICS, AND LAW
and the proportion of residentsenrolled in a health maintenanceorganization. We anticipated thateach of these variables would beinversely related to health careexpenditures per capita.34,35 Inaddition, we included a variablemeasuring the number of deathsper 1000 residents to adjust forthe health and age of the state’spopulation.
At one time, each state was re-quired to have a certificate ofneed (CON) program to curtail theconstruction of unnecessary healthcare facilities and the acquisitionof costly equipment that providedminimal improvements in patients’health. However, the mandatedfederal CON program was re-pealed effective January 1, 1987,and today 36 states have CONlaws.36 We included a variable in-dicating the existence of a stateCON law in our model becauseCON laws may affect health careexpenditures as well as the com-position of health care facilitiesand services available in a state.37
DataInformation about state med-
ical liability laws was obtainedfrom the National Conference ofState Legislatures,38 the Ameri-can Tort Reform Association,39
and publications of a large lawfirm.40 The National Conferenceof State Legislatures provides alisting of all state medical liabilitylaws by state that includes thetype of reform implemented(e.g., limit on economic andnoneconomic damage awards)and the specific legislation thatenacted this reform. In 1994, theAmerican Tort Reform Associa-tion created a publication that
displayed the status of each statelaw on medical liability. Thispublication has been updatedseveral times since that time, andit is currently available on the as-sociation’s Web site40 (http://www.mcandl.com/states.html).McCullough, Campbell & Lane isa large general practice law firmlocated in Chicago with a spe-cialty in insurance law, and thisfirm publishes a compendium ofall legislation relating to medicalmalpractice for each state.40
These data sources were usedto ascertain the date of the legis-lation enacting state laws thatlimit damage awards in medicalmalpractice cases (Table 1). Thevariables “any cap” and “yearssince cap was adopted” were de-rived from this information. Inaddition, these data resourceswere used to construct the 4 var-iables: indicating the existence ofa collateral source rule, prejudg-ment interest reform, joint andseveral liability, and caps onpunitive damages.
Data on personal health careexpenditures were acquired fromthe Centers for Medicare andMedicaid (US Department ofHealth and Human Services),and data on the population ofeach state and the number ofsquare miles in each state wereobtained from the US CensusBureau (US Department of Com-merce). Data on state unemploy-ment rates were obtained fromthe US Department of Labor’sCurrent Population Survey. Dataon mean state per capita incomewere obtained from the US Bureau of Economic Analysis(US Department of Commerce)as published in various issues of
the Survey of Current Business.42
Data on the proportion of thestate domestic product attributa-ble to farm income were ob-tained from reports issued by theNational Agricultural StatisticsService and the Economic Re-search Service of the US Depart-ment of Agriculture. The numberof hospital beds in each state wasobtained from the AmericanHospital Association in variousissues of its publication HospitalStatistics.42–45 The number of ac-tive, nonfederal physicians prac-ticing in each state was obtainedfrom various issues of the Ameri-can Medical Association’s publi-cation Physician Characteristicsand Distribution in the U.S.46–49
Statistical AnalysesThe chief independent vari-
ables in our analyses werewhether or not a state had a capon noneconomic damages in agiven year and the number ofyears since enactment of thislaw. And, because we were con-cerned about the effect of statelaws limiting damage awards onhealth care expenditures, the useof the state as a unit of observa-tion was reasonable. In order toestimate the impact of state lawslimiting damage awards onhealth care expenditures, weused data from a time series ofcross-sectional units (i.e., paneldata), and we collected data oneach of the variables in ouranalyses for 4 points in time(1984, 1988, 1994, and 1998).
We tested our model for cross-sectional heteroscedasticity andautocorrelation.50 We found noevidence of heteroscedasticity.However, we found that the
Durbin–Watson statistic was statis-tically significant in each equation.Consequently, we employed a first-order autoregressive error struc-ture with simultaneous correlationbetween cross sections.51 The co-variance matrix was calculated bya 2-stage procedure that resultedin the estimation of model regres-sion parameters by the generalizedleast squares method.50
We estimated our model withthe absolute value of a state’s percapita health expenditures as thedependent variable and thenused the natural logarithm of astate’s per capita health expendi-tures as the dependent variable.We estimated both specificationsusing a dichotomous cap variablereflecting the existence of a caplaw in a state, and then we esti-mated the model using a vari-able that measured the numberof years that a cap law had beenin place in the state. We usedboth forms of the independentvariable because it was possiblethat the impact of cap laws mightreflect both the existence of thelaw and the number of yearssince its enactment. We includeda time variable because theremight be time-specific factors af-fecting the growth in health careexpenditures.
RESULTS
The means of the variablesin our analyses are reported inTable 2. The coefficients of theestimated equations and theirstandard errors are reported inTables 3 and 4. We found thatthe coefficients of the economiccaps variable were statistically sig-nificant in each of the equations
American Journal of Public Health | August 2006, Vol 96, No. 810 | Government, Politics, and Law | Peer Reviewed | Hellinger and Encinosa
GOVERNMENT, POLITICS, AND LAW
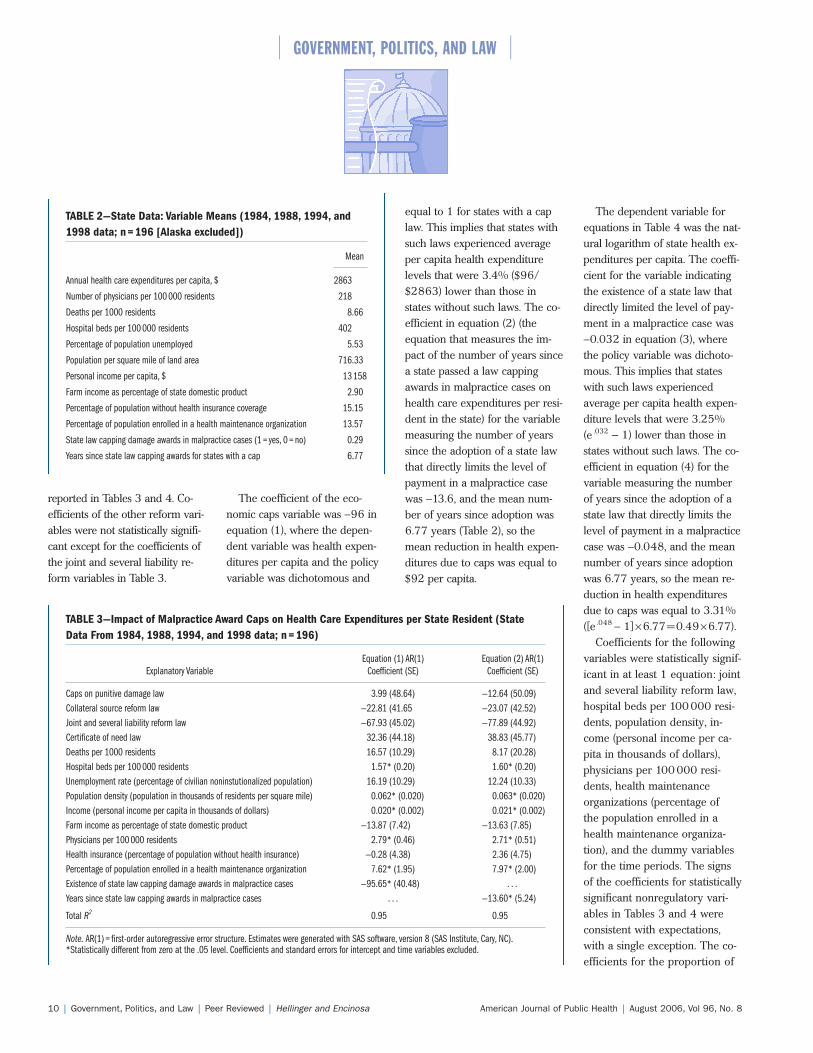
TABLE 2—State Data: Variable Means (1984, 1988, 1994, and1998 data; n=196 [Alaska excluded])
Mean
Annual health care expenditures per capita, $ 2863
Number of physicians per 100 000 residents 218
Deaths per 1000 residents 8.66
Hospital beds per 100 000 residents 402
Percentage of population unemployed 5.53
Population per square mile of land area 716.33
Personal income per capita, $ 13 158
Farm income as percentage of state domestic product 2.90
Percentage of population without health insurance coverage 15.15
Percentage of population enrolled in a health maintenance organization 13.57
State law capping damage awards in malpractice cases (1 = yes, 0 = no) 0.29
Years since state law capping awards for states with a cap 6.77
TABLE 3—Impact of Malpractice Award Caps on Health Care Expenditures per State Resident (StateData From 1984, 1988, 1994, and 1998 data; n=196)
Equation (1) AR(1) Equation (2) AR(1) Explanatory Variable Coefficient (SE) Coefficient (SE)
Caps on punitive damage law 3.99 (48.64) —12.64 (50.09)Collateral source reform law —22.81 (41.65 —23.07 (42.52)Joint and several liability reform law —67.93 (45.02) —77.89 (44.92)Certificate of need law 32.36 (44.18) 38.83 (45.77)Deaths per 1000 residents 16.57 (10.29) 8.17 (20.28)Hospital beds per 100 000 residents 1.57* (0.20) 1.60* (0.20)Unemployment rate (percentage of civilian noninstutionalized population) 16.19 (10.29) 12.24 (10.33)Population density (population in thousands of residents per square mile) 0.062* (0.020) 0.063* (0.020)Income (personal income per capita in thousands of dollars) 0.020* (0.002) 0.021* (0.002)Farm income as percentage of state domestic product —13.87 (7.42) —13.63 (7.85)Physicians per 100 000 residents 2.79* (0.46) 2.71* (0.51)Health insurance (percentage of population without health insurance) —0.28 (4.38) 2.36 (4.75)Percentage of population enrolled in a health maintenance organization 7.62* (1.95) 7.97* (2.00)Existence of state law capping damage awards in malpractice cases —95.65* (40.48) . . .Years since state law capping awards in malpractice cases . . . —13.60* (5.24)
Total R2 0.95 0.95
Note. AR(1) = first-order autoregressive error structure. Estimates were generated with SAS software, version 8 (SAS Institute, Cary, NC).*Statistically different from zero at the .05 level. Coefficients and standard errors for intercept and time variables excluded.
reported in Tables 3 and 4. Co-efficients of the other reform vari-ables were not statistically signifi-cant except for the coefficients ofthe joint and several liability re-form variables in Table 3.
The coefficient of the eco-nomic caps variable was −96 inequation (1), where the depen-dent variable was health expen-ditures per capita and the policyvariable was dichotomous and
equal to 1 for states with a caplaw. This implies that states withsuch laws experienced averageper capita health expenditurelevels that were 3.4% ($96/$2863) lower than those instates without such laws. The co-efficient in equation (2) (theequation that measures the im-pact of the number of years sincea state passed a law cappingawards in malpractice cases onhealth care expenditures per resi-dent in the state) for the variablemeasuring the number of yearssince the adoption of a state lawthat directly limits the level ofpayment in a malpractice casewas −13.6, and the mean num-ber of years since adoption was6.77 years (Table 2), so themean reduction in health expen-ditures due to caps was equal to$92 per capita.
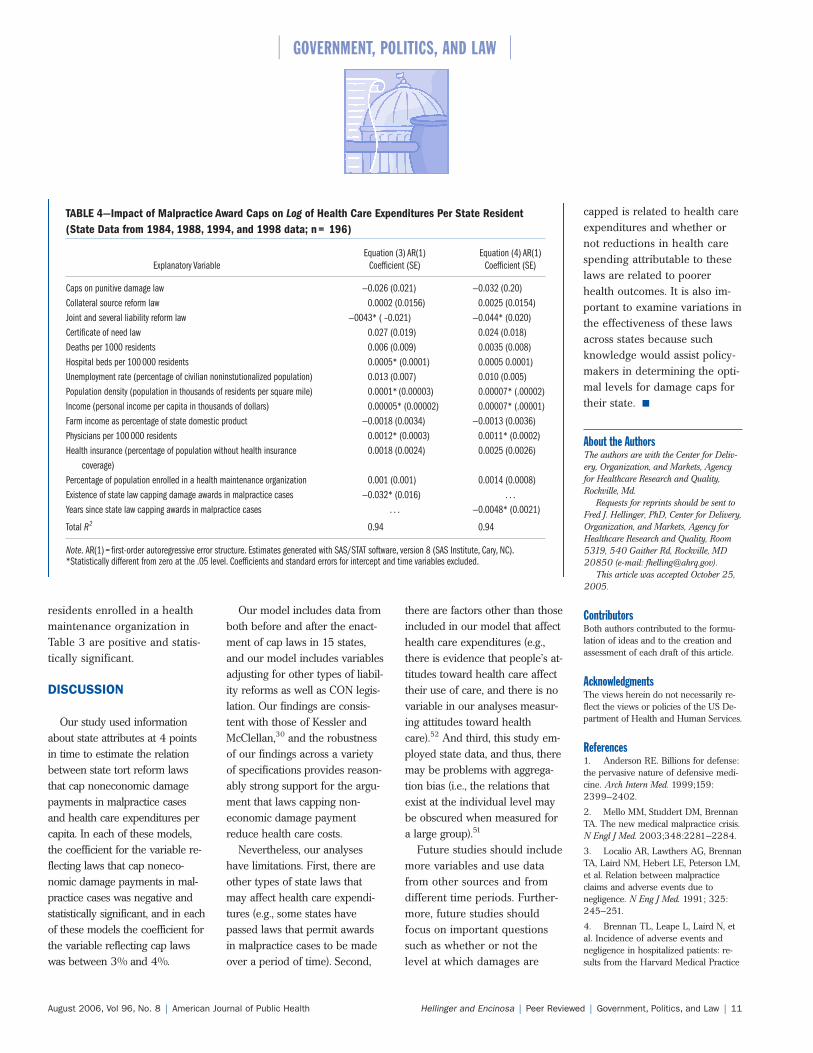
The dependent variable forequations in Table 4 was the nat-ural logarithm of state health ex-penditures per capita. The coeffi-cient for the variable indicatingthe existence of a state law thatdirectly limited the level of pay-ment in a malpractice case was−0.032 in equation (3), wherethe policy variable was dichoto-mous. This implies that stateswith such laws experiencedaverage per capita health expen-diture levels that were 3.25%(e .032 – 1) lower than those instates without such laws. The co-efficient in equation (4) for thevariable measuring the numberof years since the adoption of astate law that directly limits thelevel of payment in a malpracticecase was −0.048, and the meannumber of years since adoptionwas 6.77 years, so the mean re-duction in health expendituresdue to caps was equal to 3.31%([e .048 − 1]×6.77=0.49×6.77).
Coefficients for the followingvariables were statistically signif-icant in at least 1 equation: jointand several liability reform law,hospital beds per 100000 resi-dents, population density, in-come (personal income per ca-pita in thousands of dollars),physicians per 100000 resi-dents, health maintenanceorganizations (percentage ofthe population enrolled in ahealth maintenance organiza-tion), and the dummy variablesfor the time periods. The signsof the coefficients for statisticallysignificant nonregulatory vari-ables in Tables 3 and 4 wereconsistent with expectations,with a single exception. The co-efficients for the proportion of
August 2006, Vol 96, No. 8 | American Journal of Public Health Hellinger and Encinosa | Peer Reviewed | Government, Politics, and Law | 11
GOVERNMENT, POLITICS, AND LAW
TABLE 4—Impact of Malpractice Award Caps on Log of Health Care Expenditures Per State Resident(State Data from 1984, 1988, 1994, and 1998 data; n= 196)
Equation (3) AR(1) Equation (4) AR(1) Explanatory Variable Coefficient (SE) Coefficient (SE)
Caps on punitive damage law —0.026 (0.021) —0.032 (0.20)Collateral source reform law 0.0002 (0.0156) 0.0025 (0.0154)Joint and several liability reform law —0043* ( –0.021) —0.044* (0.020)Certificate of need law 0.027 (0.019) 0.024 (0.018)Deaths per 1000 residents 0.006 (0.009) 0.0035 (0.008)Hospital beds per 100 000 residents 0.0005* (0.0001) 0.0005 0.0001)Unemployment rate (percentage of civilian noninstutionalized population) 0.013 (0.007) 0.010 (0.005)Population density (population in thousands of residents per square mile) 0.0001* (0.00003) 0.00007* (.00002)Income (personal income per capita in thousands of dollars) 0.00005* (0.00002) 0.00007* (.00001)Farm income as percentage of state domestic product —0.0018 (0.0034) —0.0013 (0.0036)Physicians per 100 000 residents 0.0012* (0.0003) 0.0011* (0.0002)Health insurance (percentage of population without health insurance 0.0018 (0.0024) 0.0025 (0.0026)
coverage)Percentage of population enrolled in a health maintenance organization 0.001 (0.001) 0.0014 (0.0008)Existence of state law capping damage awards in malpractice cases —0.032* (0.016) . . .Years since state law capping awards in malpractice cases . . . —0.0048* (0.0021)
Total R2 0.94 0.94
Note. AR(1) = first-order autoregressive error structure. Estimates generated with SAS/STAT software, version 8 (SAS Institute, Cary, NC).*Statistically different from zero at the .05 level. Coefficients and standard errors for intercept and time variables excluded.
residents enrolled in a healthmaintenance organization inTable 3 are positive and statis-tically significant.
DISCUSSION
Our study used informationabout state attributes at 4 pointsin time to estimate the relationbetween state tort reform lawsthat cap noneconomic damagepayments in malpractice casesand health care expenditures percapita. In each of these models,the coefficient for the variable re-flecting laws that cap noneco-nomic damage payments in mal-practice cases was negative andstatistically significant, and in eachof these models the coefficient forthe variable reflecting cap lawswas between 3% and 4%.
Our model includes data fromboth before and after the enact-ment of cap laws in 15 states,and our model includes variablesadjusting for other types of liabil-ity reforms as well as CON legis-lation. Our findings are consis-tent with those of Kessler andMcClellan,30 and the robustnessof our findings across a varietyof specifications provides reason-ably strong support for the argu-ment that laws capping non-economic damage paymentreduce health care costs.
Nevertheless, our analyseshave limitations. First, there areother types of state laws thatmay affect health care expendi-tures (e.g., some states havepassed laws that permit awardsin malpractice cases to be madeover a period of time). Second,
there are factors other than thoseincluded in our model that affecthealth care expenditures (e.g.,there is evidence that people’s at-titudes toward health care affecttheir use of care, and there is novariable in our analyses measur-ing attitudes toward healthcare).52 And third, this study em-ployed state data, and thus, theremay be problems with aggrega-tion bias (i.e., the relations thatexist at the individual level maybe obscured when measured fora large group).51
Future studies should includemore variables and use datafrom other sources and fromdifferent time periods. Further-more, future studies shouldfocus on important questionssuch as whether or not thelevel at which damages are
capped is related to health careexpenditures and whether ornot reductions in health carespending attributable to theselaws are related to poorerhealth outcomes. It is also im-portant to examine variations inthe effectiveness of these lawsacross states because suchknowledge would assist policy-makers in determining the opti-mal levels for damage caps fortheir state.
About the AuthorsThe authors are with the Center for Deliv-ery, Organization, and Markets, Agencyfor Healthcare Research and Quality,Rockville, Md.
Requests for reprints should be sent toFred J. Hellinger, PhD, Center for Delivery,Organization, and Markets, Agency forHealthcare Research and Quality, Room5319, 540 Gaither Rd, Rockville, MD20850 (e-mail: [email protected]).
This article was accepted October 25,2005.
ContributorsBoth authors contributed to the formu-lation of ideas and to the creation andassessment of each draft of this article.
AcknowledgmentsThe views herein do not necessarily re-flect the views or policies of the US De-partment of Health and Human Services.
References1. Anderson RE. Billions for defense:the pervasive nature of defensive medi-cine. Arch Intern Med. 1999;159:2399–2402.
2. Mello MM, Studdert DM, BrennanTA. The new medical malpractice crisis.N Engl J Med. 2003;348:2281–2284.
3. Localio AR, Lawthers AG, BrennanTA, Laird NM, Hebert LE, Peterson LM,et al. Relation between malpracticeclaims and adverse events due tonegligence. N Eng J Med. 1991; 325:245–251.
4. Brennan TL, Leape L, Laird N, etal. Incidence of adverse events andnegligence in hospitalized patients: re-sults from the Harvard Medical Practice
American Journal of Public Health | August 2006, Vol 96, No. 812 | Government, Politics, and Law | Peer Reviewed | Hellinger and Encinosa
GOVERNMENT, POLITICS, AND LAW
study I. N Engl J Med. 1991;321:480–484.
5. Defensive Medicine and MedicalMalpractice. Washington DC: US Con-gress, Office of Technology Assessment;1994. OTA-H-602.
6. Ballard MA. Rush to beat tort lawdeadlines. Natl Law J. 2003;26(6):1–3.
7. Treaster JB. Malpractice insurance:no clear or easy answers. New YorkTimes. March 4, 2003:C1.
8. Medical Malpractice Insurance: Multiple Factors Have Contributed to In-creased Premium Rates. Washington, DC:US General Accounting Office; 2003.Report GAO-03–702.
9. Baker T. Medical malpractice andthe insurance underwriting cycle. De-paul Law Rev. 2005;54:393–438.
10. Viscusi WK, Born PH. Damagescaps, insurability, and the performanceof medical malpractice insurance. J RiskInsurance. 2005;72:23–43.
11. Addressing the New Health Care Cri-sis: Reforming the Medical Litigation Sys-tem to Improve the Quality of Health Care,Washington DC: Office of the AssistantSecretary for Planning and Evaluation,US Department of Health and HumanServices; 2003.
12. Thorpe KE. The medical malprac-tice ‘crisis’: recent trends and the impactof state tort reforms. Health Affairs(Millwood). January–June (suppl Webexclusives), 2004:W4-20–30. Availableat: http://content.healthaffairs.org/cgi/reprint/hlthaff.w4.20v1. Accessed April21, 2006.
13. Haussman T, Brevic SM. State-levelaction Natl Law J. 2003;25:A17-A21.
14. Ullmer K. Voinovich seeking mal-practice legislation. Dayton Daily News.May 4, 2003:1.
15. Jarvis J. Financial pressures arethinning doctors’ ranks. Fort Worth(Texas) Star Telegram. June 16, 2003:1.
16. Haggman M. Medical malpracticelawsuit restrictions clear committee.Broward Daily Business Rev. 2004;45:1–2.
17. Lilienthal C. Legislature is poisedto act on medical malpractice reforms.Pa Law Wkly. 2003;26(37):37–40.
18. Hirschorn J. The doctors’ strike incontext. N J Law J. 2003;171(8)1–2.
19. Scheffey TB. Med-Mal caps likelyto hurt doctors’ patients. Conn Law Tri-bune. 2003;29:1–4.
20. Klingman D, Localio AR, SugarmanJ, et al. Measuring defensive medicineusing clinical scenario surveys. J HealthPolitics Policy Law. 1996;21:185–217.
21. Birbeck GL, Gifford DR, Song J,Belin TR, Mittman BS, Vickrey BG. Domalpractice concerns, payment mecha-nisms, and attitudes influence test-ordering decisions? Neurology. 2004;62:119–121.
22. Baldwin LM, Hart LG, Lloyd M, etal. Malpractice Claims Exposure and Re-source Use in Low Risk Obstetrics. Wash-ington, DC: Office of Technology As-sessment; 1993.
23. Localio AR, Lawthers AG, BengtsonJM, et al. Relationship between malprac-tice claims and caesarean delivery.JAMA. 1993;269:366–373.
24. Grumbach K, Peltzman-Rennie D,Luft HS. Charges for obstetric liabilityinsurance and discontinuation of obstet-ric practice in New York. Washington,DC: Office of Technology Assessment;1993.
25. Reynolds RA, Rizzo JA, GonzalezML. The cost of medical professional li-ability. JAMA. 1987;257:2776–2781.
26. Medical Malpractice: Implications ofRising Premiums on Access to Health Care.Washington, DC: US General Account-ing Office; 2003. Report GAO-03–836.
27. Danzon PM. New evidence on thefrequency and severity of medical mal-practice claims. Santa Monica, Calif:Rand Corp; 1986. Report R-3410–1CJ.
28. Zuckerman S, Bovbjerg RR, SloanF. Effects of tort reforms and other fac-tors on medical malpractice insurancepremiums. Inquiry. 1990;47:167–182.
29. Intriligator MD, Kehrer BH. Aneconometric model of medical malprac-tice. In: Rottenberg S, ed. The Economicsof Medical Malpractice. Washington, DC:American Enterprise Institute for PublicPolicy Research; 1978:110–136.
30. Kessler DP, McClellan MB. Dodoctors practice defensive medicine? Q J Econ. 1996;111:353–390.
31. Dor A, Holahan J. Urban-rural dif-ferences in Medicare physician expendi-tures. Inquiry. 1990;27:307–328.
32. McBride TD, Penrod D, Mueller K.Volatility in Medicare AAPCC rates:1990–1997. Health Aff (Millwood).1997;16:172–180.
33. McAuley WL, Spector WD, Van Nostrand J, Shaffer T. The influenceof rural location on utilization of formal
home care: the role of Medicaid. Geron-tologist. 2004;44:655–664.
34. Batata A. The effect of HMOs onfee-for-service health care expenditures:evidence from Medicare revisited. J Health Econ. 2004;23:951–963.
35. Kirby JB, Machlin SR, JW Cohen.Has the increase in HMO enrollmentwithin the Medicaid population changedthe pattern of health service use and ex-penditures? Med Care. 2003;7(suppl):III24-III34.
36. Romano M. Pros and cons of cer-tificates. Mod Healthc. 2003;33:4–5.
37. Grabowski DC, Ohsfeldt RL, Morrisey MA. The effects of CON re-peal on Medicaid nursing home andlong-term care expenditures. Inquiry.2003;40:146–157.
38. State Medical Liability Laws Table.Washington DC: National Conference ofState Legislatures; 2004.
39. State Laws on Medical Liability:Medical Liability Reform. WashingtonDC: American Tort Reform Association;2004.
40. McCullough, Campbell, & Lane.Summary of Medical Malpractice Law.Available at: http://www.mcandl.com/states.html. Accessed April 15, 2006.
41. US Department of Commerce, Bu-reau of Economic Analysis. InteractiveAccess to Annual State Personal IncomeAccounts Tables. Available at http://www.bea.gov/bea/regional/spi/default/cfm?satable=summary. Accessed June 1,2006.
42. Health Forum. AHA Hospital Sta-tistics. 2001 ed. Chicago, Illinois; 2001.
43. Health Forum. AHA Hospital Sta-tistics. 1997 ed. Chicago, Illinois; 1997.
44. Health Forum. AHA Hospital Sta-tistics. 1991 ed. Chicago, Illinois; 1991.
45. Health Forum. AHA Hospital Sta-tistics. 1987 ed. Chicago, Illinois; 1987.
46. Physician Characteristics and Distri-bution in the U.S. Chicago, Illinois:American Medical Association; 2003.
47. Physician Characteristics and Distri-bution in the U.S. Chicago, Illinois:American Medical Association; 2001.
48. Physician Characteristics and Distri-bution in the U.S. Chicago, Illinois:American Medical Association; 1997.
49. Physician Characteristics and Distri-bution in the U.S. Chicago, Illinois:American Medical Association; 1991.
50. SAS/STAT User’s Guide, Version 8.Cary, NC: SAS Institute, 1999.
51. Green, HAJ. Aggregation in Eco-nomic Analysis: An Introductory Survey,Princeton, NJ: Princeton UniversityPress, 1964.
52. Riley GC, Tudor C, Ingber M.Health status and Medicare enrollees inHMOs and fee-for-service in 1994.Health Care Financing Rev. 1996;17:65–76.