Comparison of factors limiting bacterial growth in different soils
11
Soil Biology & Biochemistry 39 (2007) 2485–2495 Comparison of factors limiting bacterial growth in different soils Fredrik Demoling, Daniela Figueroa, Erland Ba˚a˚th Department of Microbial Ecology, Lund University, Ecology Building, SE-223 62 Lund, Sweden Received 29 November 2006; received in revised form 15 March 2007; accepted 1 May 2007 Available online 30 May 2007 Abstract Lack of carbon has been assumed to be the most common limiting factor for bacterial growth in soil, although there are reports of limitation by other nutrients, e.g. nitrogen and phosphorus. We have studied which nutrient(s) limited instantaneous growth rates of bacteria in 28 Swedish soils using the thymidine or leucine incorporation technique to measure increased growth rate after adding different combinations of organic carbon (glucose), nitrogen and phosphorus. The soils ranged in pH between 3.1 and 8.9, in organic matter content between 1% and 91% and in soil C/N ratio between 10 and 28. We also tested the effect of adding different amounts of carbon on the bacterial change in growth rate for two soils with different organic matter content. We found that bacterial growth in most of the 28 soils was limited by a lack of carbon, indicated by an increased bacterial growth rate 48 h after adding glucose. In some soils, adding carbon together with nitrogen increased the bacterial growth rates even further. In three soils no effects were seen upon adding nutrients separately, but adding carbon and nitrogen together increased bacterial growth rates. Nitrogen addition tended to decrease bacterial growth rates, while phosphorus addition had little effect in most soils. No correlations were found between the soil C/N ratio, ammonium or nitrate content in soil and bacterial growth limitation, indicating that even soils with a C/N ratio of 28 could be carbon limited. Although the interpretation of the effects of a single limiting nutrient was in most cases straightforward, an interaction between the amount of carbon added and the organic matter content of the soil confounded the interpretation of the extent of a second limiting nutrient. r 2007 Elsevier Ltd. All rights reserved. Keywords: Carbon; Nitrogen; Phosphorus; Bacteria; Growth limitation; Thymidine incorporation; Soil 1. Introduction Temperature and water content are well known regula- tors of microbial growth and activity in soil. The effects of these two variables are fairly easy to measure and incorporate into models of carbon and nitrogen dynamics in soil (e.g. Smith et al., 1997; Kirschbaum and Paul, 2002). However, a lack of nutrients will also limit microbial growth, but the extent and importance of limiting factors for microbial growth in soil are more difficult to estimate. Which nutrient that is limiting microbial growth in soil is not trivial. For example, carbon sequestration in arctic sites has partly been explained by the lack of nitrogen limiting microbial growth and activity, and adding nitro- gen was suggested to shift limitation to carbon, thus accelerating decomposition rates and decreasing carbon stocks in deeper soil layers (Mack et al., 2004). Different methods have been used to detect nutrient limitation of soil bacteria, all involving adding nutrients to soil and estimating the increased activity or biomass. Limiting nutrients have commonly been investigated by measuring microbial respiration; the assumption being that microorganisms respire more when the limiting substance is added. An increase in respiration, however, does not necessarily indicate increased growth. Increased respiration can also result from waste metabolism (Schimel and Weintraub, 2003). For this to happen the microorganisms must have carbon in excess but lack some other nutrient. Therefore, to be able to demonstrate nutrient limitation changes in microbial biomass, that is, changes in growth rates, must be measured. When measuring respiration, the measurements must therefore be performed over several days in order to detect a second increase in respiration rate indicative of increased microbial growth. This respiration ARTICLE IN PRESS www.elsevier.com/locate/soilbio 0038-0717/$ - see front matter r 2007 Elsevier Ltd. All rights reserved. doi:10.1016/j.soilbio.2007.05.002 Corresponding author. Tel.: +46 46 222 42 64; fax: +46 46 222 41 58. E-mail address: [email protected] (E. Ba˚a˚th).
-
Upload
independent -
Category
Documents
-
view
1 -
download
0
Transcript of Comparison of factors limiting bacterial growth in different soils
ARTICLE IN PRESS
0038-0717/$ - se
doi:10.1016/j.so
�CorrespondE-mail addr
Soil Biology & Biochemistry 39 (2007) 2485–2495
www.elsevier.com/locate/soilbio
Comparison of factors limiting bacterial growth in different soils
Fredrik Demoling, Daniela Figueroa, Erland Baath�
Department of Microbial Ecology, Lund University, Ecology Building, SE-223 62 Lund, Sweden
Received 29 November 2006; received in revised form 15 March 2007; accepted 1 May 2007
Available online 30 May 2007
Abstract
Lack of carbon has been assumed to be the most common limiting factor for bacterial growth in soil, although there are reports of
limitation by other nutrients, e.g. nitrogen and phosphorus. We have studied which nutrient(s) limited instantaneous growth rates of
bacteria in 28 Swedish soils using the thymidine or leucine incorporation technique to measure increased growth rate after adding
different combinations of organic carbon (glucose), nitrogen and phosphorus. The soils ranged in pH between 3.1 and 8.9, in organic
matter content between 1% and 91% and in soil C/N ratio between 10 and 28. We also tested the effect of adding different amounts of
carbon on the bacterial change in growth rate for two soils with different organic matter content. We found that bacterial growth in most
of the 28 soils was limited by a lack of carbon, indicated by an increased bacterial growth rate 48 h after adding glucose. In some soils,
adding carbon together with nitrogen increased the bacterial growth rates even further. In three soils no effects were seen upon adding
nutrients separately, but adding carbon and nitrogen together increased bacterial growth rates. Nitrogen addition tended to decrease
bacterial growth rates, while phosphorus addition had little effect in most soils. No correlations were found between the soil C/N ratio,
ammonium or nitrate content in soil and bacterial growth limitation, indicating that even soils with a C/N ratio of 28 could be carbon
limited. Although the interpretation of the effects of a single limiting nutrient was in most cases straightforward, an interaction between
the amount of carbon added and the organic matter content of the soil confounded the interpretation of the extent of a second limiting
nutrient.
r 2007 Elsevier Ltd. All rights reserved.
Keywords: Carbon; Nitrogen; Phosphorus; Bacteria; Growth limitation; Thymidine incorporation; Soil
1. Introduction
Temperature and water content are well known regula-tors of microbial growth and activity in soil. The effects ofthese two variables are fairly easy to measure andincorporate into models of carbon and nitrogen dynamicsin soil (e.g. Smith et al., 1997; Kirschbaum and Paul, 2002).However, a lack of nutrients will also limit microbialgrowth, but the extent and importance of limiting factorsfor microbial growth in soil are more difficult to estimate.Which nutrient that is limiting microbial growth in soil isnot trivial. For example, carbon sequestration in arcticsites has partly been explained by the lack of nitrogenlimiting microbial growth and activity, and adding nitro-gen was suggested to shift limitation to carbon, thus
e front matter r 2007 Elsevier Ltd. All rights reserved.
ilbio.2007.05.002
ing author. Tel.: +4646 222 42 64; fax: +46 46 222 41 58.
ess: [email protected] (E. Baath).
accelerating decomposition rates and decreasing carbonstocks in deeper soil layers (Mack et al., 2004).Different methods have been used to detect nutrient
limitation of soil bacteria, all involving adding nutrients tosoil and estimating the increased activity or biomass.Limiting nutrients have commonly been investigated bymeasuring microbial respiration; the assumption being thatmicroorganisms respire more when the limiting substanceis added. An increase in respiration, however, does notnecessarily indicate increased growth. Increased respirationcan also result from waste metabolism (Schimel andWeintraub, 2003). For this to happen the microorganismsmust have carbon in excess but lack some other nutrient.Therefore, to be able to demonstrate nutrient limitationchanges in microbial biomass, that is, changes in growthrates, must be measured. When measuring respiration, themeasurements must therefore be performed over severaldays in order to detect a second increase in respiration rateindicative of increased microbial growth. This respiration
ARTICLE IN PRESSF. Demoling et al. / Soil Biology & Biochemistry 39 (2007) 2485–24952486
technique has been used several times to establish nutrientlimitation in soil (Nordgren, 1992; Scheu, 1990,1993;Christensen et al., 1996; Duah-Yentumi et al., 1998;Demetz and Insam, 1999; Vance and Chapin, 2001).However, the respiration technique is not specific forbacteria, but includes all microorganisms in the soil.
The most straightforward way to detect growth ofbacteria due to added nutrients is by counting bacteriabefore and after additions. However, predation canconfound the interpretation of the results, in that increasedgrowth of bacteria will not necessarily translate intoincreased biomass of bacteria but increased biomass ofpredators (Christensen et al., 1996). This is well known inaquatic studies, where predators are removed by filtrationbefore measuring the effect of adding potential limitingnutrients, if changes in bacterial biomass are used asdetection of bacterial growth (Cotner et al., 1997; Morrisand Lewis, 1992; Gurung and Urabe, 1999; Caron et al.,2000). Removal of predators are, however, not possible insoil. In aquatic habitat the direct estimation of bacterialgrowth rates, using the thymidine or leucine incorporationtechnique, has been shown to give similar results ascounting bacteria, irrespective if predators were removedor not (Cotner et al., 1997) and these methods havetherefore long been used in aquatic systems to detectbacterial growth rate limitations due to a lack of organiccarbon (Vrede et al., 1999; Caron et al., 2000; Pinhassiet al., 2006), nitrogen (Sala et al., 2002) and phosphorus(Rivkin and Andersson, 1997; Tingstad et al., 1998;Gurung and Urabe, 1999; Carlsson and Caron, 2001;Graneli et al., 2004; Pinhassi et al., 2006). Recently, a rapidand easy method of determining bacterial growth limita-tions in soil was therefore described (Alden et al., 2001),based on the incorporation of thymidine or leucine afteradding potentially limiting nutrients.
Carbon has been assumed to be the limiting factor formicrobial growth in soil for many years (Smith and Paul,1990; Nordgren, 1992; Joergensen and Scheu, 1999; Aldenet al., 2001; Ekblad and Nordgren, 2002; Ilstedt and Singh,2005), although there are reports of other nutrients limitingmicrobial growth, e.g. nitrogen (Mack et al., 2004; Nordinet al., 2004; Alden et al., 2001) or phosphorus (Alden et al.,2001; Ilstedt and Singh, 2005). In the present study weinvestigated which nutrient(s) (carbon, nitrogen, phos-phorus) limited bacterial growth in 28 different soils inSweden, representing a range of chemical characteristics(pH, organic matter content and nutrient content). Weespecially studied whether the soil nitrogen status (ammo-nium and nitrate content, and C/N ratio of the soil)affected the nutrient limiting bacterial growth. Assuming50% growth efficiency and a bacterial C/N ratio of 8, onewould expect a switch from lack of carbon to nitrogenlimiting bacterial growth at a soil C/N ratio of around 16.We also studied the effect of adding different amounts ofcarbon to soils with different organic matter content inorder to elucidate the effect of the addition rates on theresults.
2. Materials and methods
2.1. Soils
Twenty-eight different soils were sampled in southernSweden during February and March 2005. The soils weresieved (2.8mm mesh sieve) and thereafter kept in arefrigerator (4 1C) until analysis. Each soil was analysedtwice, within 2 weeks of sampling, except soils 17 and 25,where only one analysis was performed.
2.2. Chemical analyses
Ammonium and nitrate (extracted with 1M BaCl2) andphosphorus (extracted with ammonium acetate, acetic acidand EDTA) analyses were performed by photometry in aflow injection system (FIAstar 5000 Analyzer, Foss,Denmark). Total carbon and nitrogen (from dried soil)were estimated with an element analyser (Vario MACROCN analyzer, Elementar Analysensysteme GmbH,Germany). The pH was measured in water (4–7 g of soildepending on organic matter content and 50ml distilledwater). Organic matter was estimated as loss on ignition(6 h at 600 1C).
2.3. Bacterial growth rates
Bacterial growth rates in soil were estimated bythymidine or leucine incorporation into bacteria (Baath,1992, 1994) using the modifications described by Baathet al. (2001). Briefly, 1.0 g soil was put into 50ml centrifugetubes, 20ml distilled water was added and the tubes werevortexed for 3min. After centrifugation at 1000� g for10min, 1.5ml of the supernatant (the bacterial suspension)was put into 2ml micro-centrifuge tubes. [Methyl-3H]thy-midine (25Cimmol�1; Amersham Biosciences) was thenadded, resulting in a final concentration of 130 nMthymidine, or L-[U–14C] leucine (306mCimmol�1; Amer-sham Biosciences) resulting in a leucine concentration of550 nM. After 2 h incubation, 75 ml 100% trichloroaceticacid (TCA) was added to kill the bacteria. Centrifugationand washing of the bacteria were performed according toBaath et al. (2001), and 1M NaOH was then added tosolubilize macromolecules (1 h at 90 1C). Scintillationcocktail (Ultima Gold, PerkinElmer) was added, and theradioactivity was measured with a liquid scintillationcounter (LS 6500, Beckman Ltd, US).
2.4. Nutrients limiting bacterial growth in soil
Nutrients were added to the soil to determine which ofthem limited bacterial growth according to Alden et al.(2001). Carbon (2mg glucose–C g�1), nitrogen (0.1mgNH4NO3–Ng�1) and phosphorus (0.1mg KH2PO4–Pg
�1)were added to fresh soil in a full factorial design (denotedC, N, P, CN, CP, NP and CNP, and where No indicatesthe treatment with no addition of C, N or P). Nutrients
ARTICLE IN PRESSF. Demoling et al. / Soil Biology & Biochemistry 39 (2007) 2485–2495 2487
were mixed with talcum (as a carrier) before being added(carbon:talcum 4:1, nitrogen:talcum 1:9 and phosphorus:talcum 1:9). Nine mg talcum was added to the no additioncontrol samples. Preliminary results indicated that addingup to 100mg talcumg�1 soil did not affect the bacterialgrowth rates. Wet soil (1 g) was placed in 50ml centrifugetubes, nutrients were mixed into the soil and the tubes weresealed with lids. Soil bacterial growth was estimated afterincubation for 48 h at 20 1C with the thymidine incorpora-tion technique, as described above. An increase in growthin samples to which nutrients were added, compared withthe no addition control samples, indicates that growth waslimited by the nutrient added.
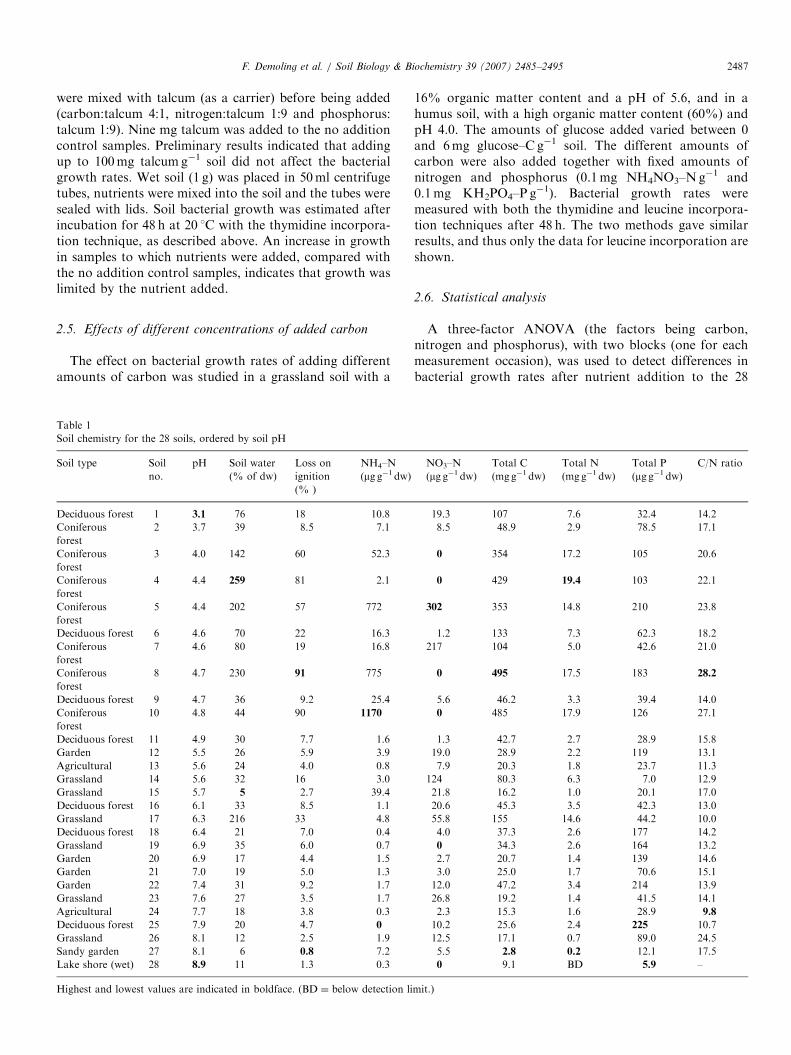
2.5. Effects of different concentrations of added carbon
The effect on bacterial growth rates of adding differentamounts of carbon was studied in a grassland soil with a
Table 1
Soil chemistry for the 28 soils, ordered by soil pH
Soil type Soil
no.
pH Soil water
(% of dw)
Loss on
ignition
(% )
NH4–N
(mg g�1 dw)
Deciduous forest 1 3.1 76 18 10.8
Coniferous
forest
2 3.7 39 8.5 7.1
Coniferous
forest
3 4.0 142 60 52.3
Coniferous
forest
4 4.4 259 81 2.1
Coniferous
forest
5 4.4 202 57 772
Deciduous forest 6 4.6 70 22 16.3
Coniferous
forest
7 4.6 80 19 16.8
Coniferous
forest
8 4.7 230 91 775
Deciduous forest 9 4.7 36 9.2 25.4
Coniferous
forest
10 4.8 44 90 1170
Deciduous forest 11 4.9 30 7.7 1.6
Garden 12 5.5 26 5.9 3.9
Agricultural 13 5.6 24 4.0 0.8
Grassland 14 5.6 32 16 3.0
Grassland 15 5.7 5 2.7 39.4
Deciduous forest 16 6.1 33 8.5 1.1
Grassland 17 6.3 216 33 4.8
Deciduous forest 18 6.4 21 7.0 0.4
Grassland 19 6.9 35 6.0 0.7
Garden 20 6.9 17 4.4 1.5
Garden 21 7.0 19 5.0 1.3
Garden 22 7.4 31 9.2 1.7
Grassland 23 7.6 27 3.5 1.7
Agricultural 24 7.7 18 3.8 0.3
Deciduous forest 25 7.9 20 4.7 0
Grassland 26 8.1 12 2.5 1.9
Sandy garden 27 8.1 6 0.8 7.2
Lake shore (wet) 28 8.9 11 1.3 0.3
Highest and lowest values are indicated in boldface. (BD ¼ below detection li
16% organic matter content and a pH of 5.6, and in ahumus soil, with a high organic matter content (60%) andpH 4.0. The amounts of glucose added varied between 0and 6mg glucose–C g�1 soil. The different amounts ofcarbon were also added together with fixed amounts ofnitrogen and phosphorus (0.1mg NH4NO3–Ng�1 and0.1mg KH2PO4–P g�1). Bacterial growth rates weremeasured with both the thymidine and leucine incorpora-tion techniques after 48 h. The two methods gave similarresults, and thus only the data for leucine incorporation areshown.
2.6. Statistical analysis
A three-factor ANOVA (the factors being carbon,nitrogen and phosphorus), with two blocks (one for eachmeasurement occasion), was used to detect differences inbacterial growth rates after nutrient addition to the 28
NO3–N
(mg g�1 dw)Total C
(mgg�1 dw)
Total N
(mgg�1 dw)
Total P
(mg g�1 dw)C/N ratio
19.3 107 7.6 32.4 14.2
8.5 48.9 2.9 78.5 17.1
0 354 17.2 105 20.6
0 429 19.4 103 22.1
302 353 14.8 210 23.8
1.2 133 7.3 62.3 18.2
217 104 5.0 42.6 21.0
0 495 17.5 183 28.2
5.6 46.2 3.3 39.4 14.0
0 485 17.9 126 27.1
1.3 42.7 2.7 28.9 15.8
19.0 28.9 2.2 119 13.1
7.9 20.3 1.8 23.7 11.3
124 80.3 6.3 7.0 12.9
21.8 16.2 1.0 20.1 17.0
20.6 45.3 3.5 42.3 13.0
55.8 155 14.6 44.2 10.0
4.0 37.3 2.6 177 14.2
0 34.3 2.6 164 13.2
2.7 20.7 1.4 139 14.6
3.0 25.0 1.7 70.6 15.1
12.0 47.2 3.4 214 13.9
26.8 19.2 1.4 41.5 14.1
2.3 15.3 1.6 28.9 9.8
10.2 25.6 2.4 225 10.7
12.5 17.1 0.7 89.0 24.5
5.5 2.8 0.2 12.1 17.5
0 9.1 BD 5.9 –
mit.)
ARTICLE IN PRESSF. Demoling et al. / Soil Biology & Biochemistry 39 (2007) 2485–24952488
different soils. All values were logarithmically transformedbefore analysis. In no case was a 3-way interaction found.Thus, for soils 17 and 25 with only one measurementoccasion, the ANOVA was performed assuming no 3-wayinteraction.
3. Results
3.1. Soil characteristics
The soils used included forest (both coniferous anddeciduous), agricultural and grassland soils (Table 1). ThepH(H2O) ranged from 3.1 to 8.9, the C/N ratio of the soilsranged from �10 to �28 and the organic matter contentfrom �1% to 91% of the dry weight of the soil. NH4–N
0
0.5
1
1.5
2
2.5
3
No C N P CN CP NP CNP
Sta
ndard
ized b
acte
rial gro
wth
C∗
N∗ (-)
0
0.5
1
1.5
2
2.5
3
No C N P
Sta
ndard
ized b
acte
rial gro
wth
C∗∗∗
0
0.5
1
1.5
2
2.5
3
No C N P CN CP NP CNP
Sta
ndard
ized b
acte
rial gro
wth
0
0.5
1
1.5
No C N P
Sta
ndard
ized b
acte
rial gro
wth
C∗∗
0
0.5
1
1.5
2
2.5
3
No C N P CN CP NP CNP
Sta
ndard
ized b
acte
rial gro
wth
C∗∗
0
0.5
1
1.5
2
2.5
3
No C N P
Sta
ndard
ized b
acte
rial gro
wth
C∗∗∗
CxN∗∗ (-)
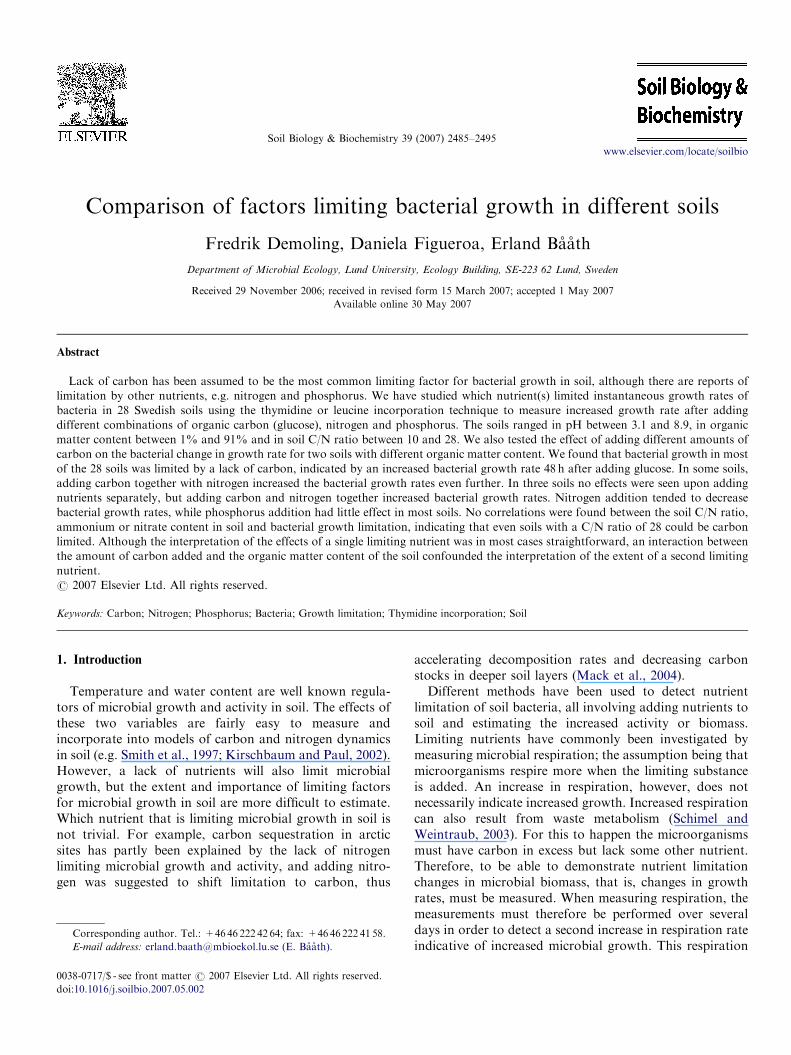
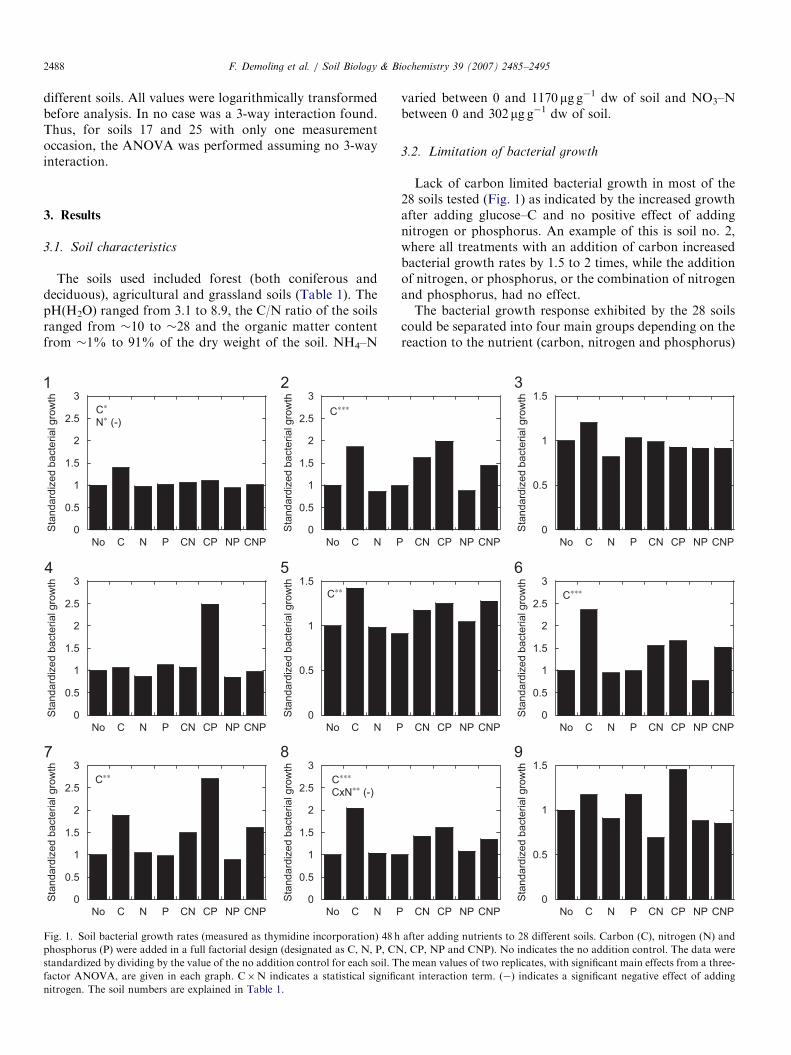
Fig. 1. Soil bacterial growth rates (measured as thymidine incorporation) 48 h
phosphorus (P) were added in a full factorial design (designated as C, N, P, CN
standardized by dividing by the value of the no addition control for each soil. T
factor ANOVA, are given in each graph. C�N indicates a statistical signific
nitrogen. The soil numbers are explained in Table 1.
varied between 0 and 1170 mg g�1 dw of soil and NO3–Nbetween 0 and 302 mg g�1 dw of soil.
3.2. Limitation of bacterial growth
Lack of carbon limited bacterial growth in most of the28 soils tested (Fig. 1) as indicated by the increased growthafter adding glucose–C and no positive effect of addingnitrogen or phosphorus. An example of this is soil no. 2,where all treatments with an addition of carbon increasedbacterial growth rates by 1.5 to 2 times, while the additionof nitrogen, or phosphorus, or the combination of nitrogenand phosphorus, had no effect.The bacterial growth response exhibited by the 28 soils
could be separated into four main groups depending on thereaction to the nutrient (carbon, nitrogen and phosphorus)
CN CP NP CNP
0
0.5
1
1.5
No C N P CN CP NP CNP
Sta
ndard
ized b
acte
rial gro
wth
CN CP NP CNP
0
0.5
1
1.5
2
2.5
3
No C N P CN CP NP CNP
Sta
ndard
ized b
acte
rial gro
wth
C∗∗∗
CN CP NP CNP0
0.5
1
1.5
No C N P CN CP NP CNP
Sta
ndard
ized b
acte
rial gro
wth
after adding nutrients to 28 different soils. Carbon (C), nitrogen (N) and
, CP, NP and CNP). No indicates the no addition control. The data were
he mean values of two replicates, with significant main effects from a three-
ant interaction term. (�) indicates a significant negative effect of adding

ARTICLE IN PRESS
0
0.5
1
1.5
2
2.5
3
No C N P CN CP NP CNP
Sta
nd
ard
ize
d b
acte
ria
l g
row
th
C*
0
0.5
1
1.5
No C N P CN CP NP CNP
Sta
nd
ard
ize
d b
acte
ria
l g
row
th
0
1
2
3
4
5
6
7
No C N P CN CP NP CNP
Sta
nd
ard
ize
d b
acte
ria
l g
row
th
C∗∗∗
0
2
4
6
8
10
12
14
No C N P CN CP NP CNP
Sta
nd
ard
ize
d b
acte
ria
l g
row
th
C∗∗∗
N∗∗∗ (-)CxN∗∗∗
0
0.5
1
1.5
2
2.5
3
No C N P CN CP NP CNP
Sta
nd
ard
ize
d b
acte
ria
l g
row
thC∗∗∗
0
1
2
3
4
5
6
7
No C N P CN CP NP CNP
Sta
nd
ard
ize
d b
acte
ria
l g
row
th
C∗∗∗
0
1
2
3
4
5
6
7
No C N P CN CP NP CNP
Sta
nd
ard
ize
d b
acte
ria
l g
row
th
C∗∗∗
0
0.5
1
1.5
2
2.5
3
3.5
4
No C N P CN CP NP CNP
Sta
nd
ard
ize
d b
acte
ria
l g
row
th
0
0.5
1
1.5
2
2.5
3
No C N P CN CP NP CNP
Sta
nd
ard
ize
d b
acte
ria
l g
row
th
C∗∗∗
N∗∗ (-)CxN∗∗∗
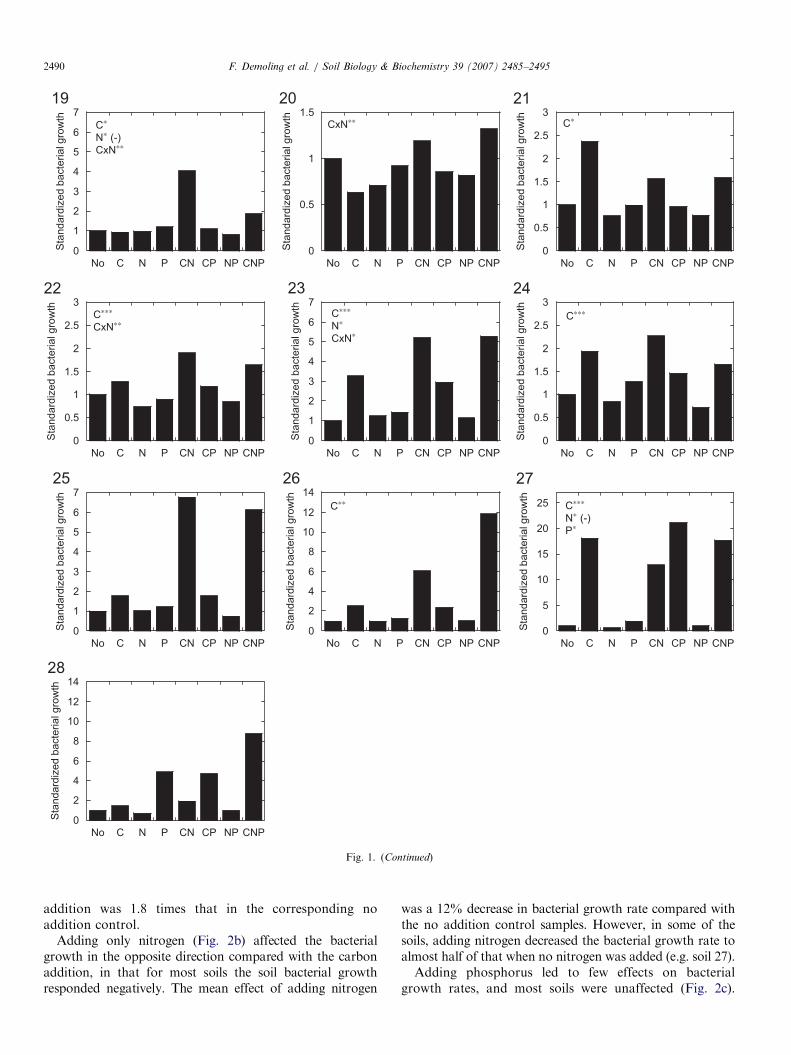
Fig. 1. (Continued)
F. Demoling et al. / Soil Biology & Biochemistry 39 (2007) 2485–2495 2489
additions (Fig. 1). In Group 1, including 13 of the 28 soils,soil bacterial growth rates were positively affected byadding carbon only (significant main effect of C addition,soils 1, 2, 5–8, 10, 12, 14–16, 21 and 24). In the secondgroup, bacterial growth was limited by the lack of carbon,as in Group 1, although in these soils there was anadditional effect when nitrogen was added together withcarbon (indicated by a significant statistical C�N inter-action). This was the case for three soils (13, 22 and 23).This was probably also the case in soil no. 26, althoughcarbon addition only significantly affected bacterial growthrates. In Group 3, the soil bacteria did not respond whencarbon was added alone, but when carbon and nitrogenwere added together, soil bacterial growth rates increased.Three soils showed this pattern (nos. 18–20). Soil 27 wasthe only soil in the fourth group, and showed clear growthlimitation due to a lack of carbon but a positive effect wasalso observed upon adding phosphorus. Seven soils (3, 4, 9,11, 17, 25 and 28) showed no significant limiting nutrientfor bacterial growth. This was partly due to large
variations in the data, but some of the soils could still betentatively grouped visually. For example, soil 11 probablybelonged to Group 1 (only carbon limitation), while soil 25appeared to respond like those in Group 2 (with an extraeffect of adding nitrogen). Soils 17 and 28 were probablylike soil 27 in that they showed an effect upon addingcarbon, but also an effect of adding phosphorus.
3.3. Bacterial response after separate carbon, nitrogen and
phosphorus addition
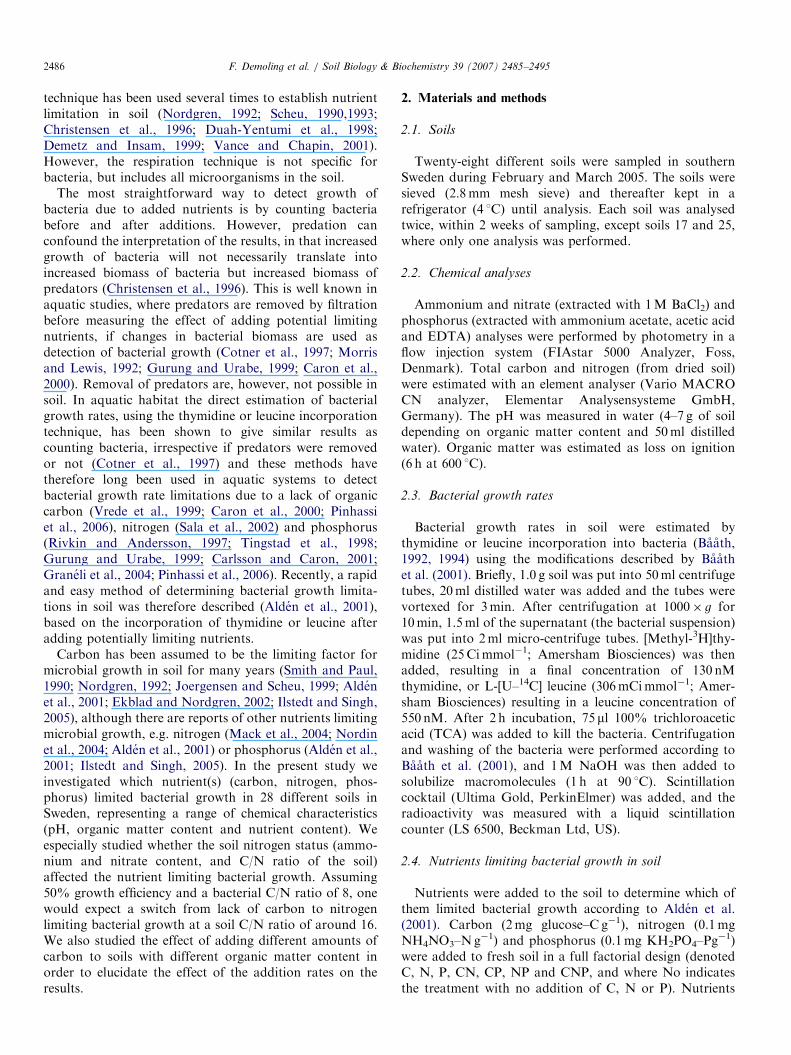
Standardized bacterial growth rates (divided by thebacterial growth rates in the no addition control) afterseparate addition of carbon, nitrogen and phosphorus werenot correlated with the soil C/N ratio for any of the threenutrients added (Fig. 2). After carbon addition bacterialgrowth response was positive in all but three soils (Fig. 2a).These belonged to Group 3 described above (soils 18–20).The mean increase in bacterial growth rate after carbon
ARTICLE IN PRESS
0
1
2
3
4
5
6
7
No C N P CN CP NP CNP
Sta
nd
ard
ize
d b
acte
ria
l g
row
th
C∗
N∗ (-)CxN∗∗
0
0.5
1
1.5
No C N P CN CP NP CNP
Sta
nd
ard
ize
d b
acte
ria
l g
row
th
CxN∗∗
0
0.5
1
1.5
2
2.5
3
No C N P CN CP NP
Sta
nd
ard
ize
d b
acte
ria
l g
row
th
CNP
C∗
0
0.5
1
1.5
2
2.5
3
No C N P CN CP NP CNP
Sta
nd
ard
ize
d b
acte
ria
l g
row
th
C∗∗∗
CxN∗∗
0
1
2
3
4
5
6
7
No C N P CN CP NP CNP
Sta
nd
ard
ize
d b
acte
ria
l g
row
th
C∗∗∗
N∗
CxN∗
0
0.5
1
1.5
2
2.5
3
No C N P CN CP NP CNP
Sta
nd
ard
ize
d b
acte
ria
l g
row
th
C∗∗∗
0
1
2
3
4
5
6
7
No C N P CN CP NP CNP
Sta
nd
ard
ize
d b
acte
ria
l g
row
th
0
2
4
6
8
10
12
14
No C N P CN CP NP CNP
Sta
nd
ard
ize
d b
acte
ria
l g
row
th
C∗∗
0
5
10
15
20
25
No C N P CN CP NP CNP
Sta
nd
ard
ize
d b
acte
ria
l g
row
th
C∗∗∗
N∗ (-)P∗
0
2
4
6
8
10
12
14
No C N P CN CP NP CNP
Sta
nd
ard
ize
d b
acte
ria
l g
row
th
Fig. 1. (Continued)
F. Demoling et al. / Soil Biology & Biochemistry 39 (2007) 2485–24952490
addition was 1.8 times that in the corresponding noaddition control.
Adding only nitrogen (Fig. 2b) affected the bacterialgrowth in the opposite direction compared with the carbonaddition, in that for most soils the soil bacterial growthresponded negatively. The mean effect of adding nitrogen
was a 12% decrease in bacterial growth rate compared withthe no addition control samples. However, in some of thesoils, adding nitrogen decreased the bacterial growth rate toalmost half of that when no nitrogen was added (e.g. soil 27).Adding phosphorus led to few effects on bacterial
growth rates, and most soils were unaffected (Fig. 2c).

ARTICLE IN PRESS
-0.2
0
0.2
0.4
0.6
0.8
1
1.2
1.4
10 15 20 25 30
C
Sta
ndard
ized b
acte
rial gro
wth
Soil C/N ratio
1
2
34
5
6
7 8
9 11
12
13
14
1516
17
1819
20
21
22
23
2425
26
27
10
-0.2
0
0.2
0.4
0.6
0.8
10 15 20 25 30
N
Sta
ndard
ized b
acte
rial gro
wth
Soil C/N ratio
12
34
567 8
911
1213
14
15
16
17 18
19
2021
22
23
24
2526
27
10
-0.2
0
0.2
0.4
0.6
0.8
10 15 20 25 30
P
Sta
ndard
ized b
acte
rial gro
wth
Soil C/N ratio
23
4
56 8
9
11
13 15
17
19
21
23
2425 26
10
27
7
Fig. 2. Standardized bacterial growth rates (measured as thymidine incorporation) 48 h after adding carbon (a), nitrogen (b) or phosphorus (c), plotted
against the soil C/N ratio for the different soils (except soil 28 due to lack of C/N data). The standardized values were obtained by taking the logarithm of
the value of the bacterial growth after nutrition addition divided by the value obtained from the no addition control sample. The horizontal line indicates
the bacterial growth rate in the no addition control. Within the circle in (c) the standardized bacterial growth rates after phosphorus addition for soils 1,
12, 14, 16, 18, 20 and 22 were closely packed. The soil numbers are explained in Table 1.
F. Demoling et al. / Soil Biology & Biochemistry 39 (2007) 2485–2495 2491
Only in soils 17 and 27 did the bacterial growth ratesincrease by more than 50% compared with the no additioncontrol. This was also the case in soil 28 (excluded fromFig. 2 due to a lack of soil C/N data), where the bacterialgrowth rates increased �5 times after adding phosphorus.The mean effect of adding phosphorus to the remainingsoils was an increase in bacterial growth rates of 7%.
3.4. Addition of carbon, nitrogen and phosphorus together
The effect of adding carbon, nitrogen and phosphorustogether was the maximum bacterial growth rate when allnutrient limitations were removed. However, the effect ofadding these substances together was affected by theorganic matter content of the soils (Fig. 3). The bacterialgrowth rates in soils low in organic matter often respondedmore to the nutrient addition than soils high in organicmatter. The largest increase in bacterial growth rates wasfound for soils 13, 26 and 27, which increased more than 10times compared to the no addition control. These were all
soils with low organic matter content (Table 1). In soilshigh in organic matter content little increase in growth ratewas observed after adding all three nutrients.
3.5. Adding different amounts of carbon
Different amounts of glucose–C (with and withoutnitrogen+phosphorus) were added to two soils withdifferent organic matter contents to further investigatethe effect of the interaction between carbon concentrationand the soil organic matter content. Soil bacterial growthrates in the grassland soil increased with increasing carbonaddition, with clear effects even at low addition rates(o0.5mg Cg�1 soil) (Fig. 4a). Bacterial growth ratespeaked between 1.5 and 2mg added glucose–C, followedby a decrease in bacterial growth rate until 3mg glucose–Cwas added. When glucose was added together withnitrogen and phosphorus, bacterial growth rates increasedwith maximum values around 3–4mg added C g�1 soil.Thus, at additions below 1.5mg Cg�1 soil bacterial growth

ARTICLE IN PRESS
-0.2
0
0.2
0.4
0.6
0.8
1
1.2
1.4
0 20 40 60 80 100
Sta
ndard
ized b
acte
rial gro
wth
Organic matter content (%)
1
2
3 4
56
7
8
9
11
12
13
14
15
16
17
18
19
2021
22
23
24
25
26
27
28
10
Fig. 3. Standardized bacterial growth rates (measured as thymidine
incorporation) 48 h after simultaneous addition of carbon, nitrogen and
phosphorus plotted against soil organic matter content. The standardized
values were obtained by taking the logarithm of the value of the bacterial
growth after nutrition addition divided by the value obtained from the no
addition control sample. The horizontal line indicates the bacterial growth
rate in the no addition control. Soil numbers are those explained in Table
1. A logarithmic relationship (R2¼ 0.50) is shown.
5
10
15
20
25
0 4 5 6 7
Re
lative
le
ucin
e in
co
rpo
ratio
n (
DP
M∗ 1
04
ml-1
ba
cte
ria
l su
sp
en
sio
n h
-1)
Glucose added (mg C g-1 soil)
1 2 3
0 4 5 6 7
2
4
6
8
10
12
Re
lative
le
ucin
e in
co
rpo
ratio
n (
DP
M∗ 1
04
ml-1
ba
cte
ria
l su
sp
en
sio
n h
-1)
Glucose added (mg Cg-1 soil)
1 2 3
Fig. 4. Relative bacterial growth rates (measured as leucine incorpora-
tion) 48 h after adding increasing amounts of glucose–C alone (circles,
dashed line) or in combination with nitrogen and phosphorus (squares,
solid line) to a grassland soil (a) and forest humus soil (b). The data were
fitted using a smoothing function.
F. Demoling et al. / Soil Biology & Biochemistry 39 (2007) 2485–24952492
is interpreted as being limited only by a lack of carbon,while at higher glucose–C additions the interpretation islimitation due to lack of carbon with a lack of nitrogen orphosphorus as a second limiting nutrient when the firstlimitation was alleviated.
Bacterial growth response patterns in the humus soilwere similar to the patterns in the grassland soil (Fig. 4b),but there was no or little response in bacterial growth rateup to an addition of about 1.5mg glucose–C g�1 soil. Themaximum bacterial growth rate was found when between2.5 and 3mg glucose–C g�1 soil was added. When addingnitrogen and phosphorus together with glucose, peakvalues of bacterial growth rates around additions of 4mgglucose–C g�1 soil were found. In analogy with theinterpretation above, soil bacteria were only limited by alack of carbon when adding glucose–C up to 3mg g�1 soil,while at higher additions of glucose–C, nitrogen orphosphorus would be considered a secondary limitingnutrient.
4. Discussion
Lack of carbon was the most common limitation in the28 soils studied, with significant carbon limitation in 18soils, probable carbon limitation in another four andsimultaneous limitation of both carbon and nitrogen inthree soils (Figs. 1 and 2a). This was not unexpected, sincein most studies soil microorganisms are reported to belimited by a lack of carbon (Smith and Paul, 1990;
Nordgren, 1992; Joergensen and Scheu, 1999; Aldenet al., 2001; Ekblad and Nordgren, 2002; Ilstedt and Singh,2005). The C/N ratio of the soil had no effect on the extentof carbon limitation in that even at the highest soil C/Nratio (28, soil 8) adding glucose–C caused an increase inbacterial growth (Fig. 2a). Similar results have previouslybeen found even in coniferous forest soils with a C/N ratioup to 39, where adding carbon increased bacterial growthrates, while adding nitrogen or phosphorus had no effect(F. Demoling, L.O. Nilsson and E. Baath, unpublishedresults).

ARTICLE IN PRESSF. Demoling et al. / Soil Biology & Biochemistry 39 (2007) 2485–2495 2493
If one only considers the C/N ratio of the bacterialbiomass (between 4 and 8, according to De Ruiter et al.,1993; Schimel and Weintraub, 2003), one would expect ashift from C limitation to N limitation for the soil bacteriain the lower range of the soil C/N ratios investigated in thepresent study (e.g. a soil C/N ratio of 16 assuming 50%growth efficiency and a bacterial C/N ratio of 8, which alsowas calculated in the model by Schimel and Weintraub,2003). However, there are several reasons why the soil C/Nratio could be high (at least 30) and the soil bacteria still belimited by a lack of carbon. The traditional explanation hasbeen that all the carbon in soil is not available to themicroorganisms, and thus the effective soil C/N ratio islower than that measured. However, Schimel andWeintraub (2003) showed in their theoretical model thatthe extent of recycling of dead microbial biomass alsoaffected the soil C/N ratio above which N limitation wouldoccur, increasing it from 16 without recycling to 40 withcomplete recycling. This is due to carbon being released asCO2 during recycling, decreasing the C/N ratio. Also, thegrowth rate of the soil bacteria could be of importance. Atlow growth rates more of the carbon is used formaintenance, leaving less available for growth and biomassproduction. This will increase the total carbon need for thebacteria without affecting the need for nitrogen, and willthus increase the C/N ratio of the substrate, where a shiftfrom C to N limitation would occur (Egli, 1991). Thus,rapid growth rates of the bacteria would be expected tolead to growth limitation by nutrients other than carbon atlower C-to-nutrient ratios. The faster bacterial growthrates in aquatic systems than in soil (Baath, 1998), and thefact that in water bacteria are usually limited by lack ofnutrients (e.g. phosphorus) and not organic carbon (e.g.Morris and Lewis, 1992; Pinhassi et al., 2006), might be anindication of the importance of the effect of growth rate onthe extent of limitation in natural habitats.
In three of the soils (soils 18–20) the addition of carbondid not increase bacterial growth rates (Fig. 2a), neitherwas any effect seen upon adding only nitrogen orphosphorus (Fig. 1). However, adding carbon and nitrogentogether increased growth rates. The explanation could bethat both carbon and nitrogen were close to limitingbacterial growth. As soon as either carbon or nitrogen isadded the limitation is alleviated but then the othernutrient is lacking and bacterial growth does not increasefurther. A similar situation was found in sub-Arctic soils,where adding carbon, nitrogen or phosphorus separatelyhad little effect, but adding them in combination increasedbacterial growth rates considerably, indicating that allthree nutrients were close to limiting bacterial growth(F. Demoling, R. Rinnan, E. Baath, unpubl.).
Two or more nutrients limiting bacterial growth rates atthe same time should not be confused up with theadditional effect on bacterial growth rates when carbon isadded together with nitrogen in soils showing a positiveeffect when carbon is added alone (e.g. soils 13, 22 and 23belonging to Group 2, Fig. 1). Here bacterial growth is
initially limited by a lack of carbon. When the carbonlimitation is alleviated the second nutrient to be lacking isnitrogen. Therefore, when both nutrients are added there isan additional increase in bacterial growth compared withthe addition of carbon alone. However, this will depend onthe amount of the initially limiting substance added. Thiscan clearly be seen when different concentrations ofglucose–C were added to soil (Fig. 4), where, at lowconcentrations, the interpretation would be carbon limita-tion only, while at higher concentrations, the interpretationwould be carbon limitation with nitrogen or phosphorus asthe secondary limiting substance. Thus, although identify-ing the main limiting substance is usually straightforward,the identification of a second limiting nutrient should beapproached with caution.In some of the soils, bacterial growth was negatively
affected by the addition of nitrogen (Fig. 2b), and the meanbacterial growth rate in all soils after the addition ofnitrogen alone was 12% lower than in the no additioncontrol. Adding nitrogen as ammonium nitrate sometimeslowers soil pH, and bacterial growth can be negativelyaffected by low pH (Baath, 1996). This was also theexplanation of lower bacterial growth rates after addingnitrogen to forest humus (Alden et al., 2001). This negativeeffect of adding nitrogen appeared, however, to betemporary as adding carbon together with nitrogen couldstill induce increased growth of the bacteria, sometimeshigher than when adding only carbon. This is seen, forexample, in soils belonging to Group 2 (soils 13, 22 and 23)and at higher glucose–C additions in the two soils used tostudy the effect of adding different concentrations ofglucose–C (Fig. 4). Thus, if the soil bacteria were limited bya lack of nitrogen, we would expect the growth rate toincrease some time after adding nitrogen, despite any initialslightly negative effect.All soils were incubated for 48 h after nutrient addition
before assessing growth rates. This was considered longenough for bacteria in all the soils to respond to thenutrient additions. However, the response time could varybetween different soils. Alden et al. (2001) found that inone soil, bacteria responded within 24 h after addingcarbon, while in another soil 48 h was required for aresponse. It is thus important to choose an incubation timethat is sufficiently long for the bacteria to respond to thenutrient addition. We also chose to use one incubationtemperature (20 1C) irrespective of the actual soil tempera-ture. This is in contrast to similar studies in aquatichabitats, where in situ temperatures are often used (e.g.Morris and Lewis, 1992; Carlsson and Caron, 2001;Pinhassi et al., 2006). However, the response time will beinfluenced by the incubation temperature after adding thenutrients, and will be much longer at lower temperatures.Using one incubation time, but different incubationtemperatures, could result in no bacterial growth rateresponse at all at low temperatures. This is also often foundin seasonal studies on nutrient limitation for bacterio-plankton where, during the winter, no effects of adding any
ARTICLE IN PRESSF. Demoling et al. / Soil Biology & Biochemistry 39 (2007) 2485–24952494
combination of nutrients could be observed (Morris andLewis, 1992; Carlsson and Caron, 2001). Thus, usingdifferent incubation temperatures could confound theinterpretation of which nutrient is limiting bacterialgrowth.
It is also important not to add too high concentrations ofthe nutrients, as this can have negative effects on the soilbacteria (Fig. 4), due, for example, to osmotic effects or pHeffects (see above), which might decrease bacterial growthrates. The concentration of glucose–C added was 2mgCg�1 soil. This is lower than that normally used forstandard soil microbiological measurements e.g. biomassestimates using substrate induced respiration (usually2–8mg glucose–C g�1 soil) or measurements of communitylevel physiological profiles according to Degens and Harris(1997) (10mg Cg�1 soil added for carbohydrates).
It is of course important to add high enough concentra-tions of the limiting substance to induce increased,measurable growth rates of the microorganisms. However,in some soils with high organic matter content theconcentration of glucose–C added may have been toolow. This is illustrated by the forest humus with a highorganic matter content (Fig. 4b), where concentrationslower than 1.5mg glucose–C g�1 soil were too low toinduce increased bacterial growth rates, even if the soilbacteria were limited by lack of organic carbon.
One way of partly controlling for the lack of inducedincreased bacterial growth rates due to too short incuba-tion times, too low temperatures or too low concentrationsof added substances is to use the combined addition ofcarbon, nitrogen and phosphorus as a positive control.This addition should increase bacterial growth ratescompared to the control if the lack of any of thesenutrients alone or in combination limits bacterial growthrates. Otherwise, additional experiments must be per-formed to investigate whether any of the above-mentionedfactors are confounding the results, before concluding thatthe lack of another nutrient is limiting the growth of soilbacteria. For example, in some of the soils with the highestorganic matter contents used in the present study, toolow concentrations of glucose–C might have been added(Fig. 3).
The present study has shown that soil bacteria can belimited by a lack of carbon over a wide range of soil C/Nratios. We found no evidence that the bacteria weresignificantly limited by nitrogen alone. However, whenenough carbon was added to alleviate the limitation,secondary limitation due to nitrogen or phosphorus couldbe seen. In most cases the method used (measuring changesin bacterial growth rates after adding nutrients) appearedto give conclusive results when possible limiting nutrientswere added separately (Fig. 1). Thus, in most cases it is notnecessary to use a full factorial design combining thedifferent nutrients. However, we have identified a numberof factors affecting the interpretation of the results,especially when no or little increase in growth rate isobserved. To be able to identify such problems, we
recommend that all nutrients should be added together toprovide a positive control.
Acknowledgement
E.B. acknowledges the financial support of the SwedishScience Research Council.
References
Alden, L., Demoling, F., Baath, E., 2001. Rapid method of determining
factors limiting bacterial growth in soil. Applied & Environmental
Microbiology 67, 1830–1838.
Baath, E., 1992. Thymidine incorporation into macromolecules of bacteria
extracted from soil by homogenization–centrifugation. Soil Biology &
Biochemistry 24, 1157–1165.
Baath, E., 1994. Measurement of protein synthesis by soil bacterial
assemblages with the leucine incorporation technique. Biology &
Fertility of Soils 17, 147–153.
Baath, E., 1996. Adaptation of soil bacterial communities to prevailing pH
in different soils. FEMS Microbiology Ecology 19, 227–237.
Baath, E., 1998. Growth rates of bacterial communities in soils at varying
pH: a comparison of the thymidine and leucine incorporation
techniques. Microbial Ecology 36, 316–327.
Baath, E., Pettersson, M., Soderberg, K.H., 2001. Adaptation of a rapid
and economical microcentrifugation method to measure thymidine
and leucine incorporation by soil bacteria. Soil Biology & Biochem-
istry 33, 1571–1574.
Carlsson, P., Caron, D.A., 2001. Seasonal variation of phosphorus
limitation of bacterial growth in a small lake. Limnology &
Oceanography 46, 108–120.
Caron, D.A., Lim, E.L., Sanders, R.W., Dennett, M.R., Berninger, U.-G.,
2000. Response of bacterioplankton and phytoplankton to organic
carbon and inorganic nutrient additions in contrasting oceanic
ecosystems. Aquatic Microbial Ecology 22, 175–184.
Christensen, S., Rønn, R., Ekelund, F., Andersen, B., Daamgard, J.,
Friberg-Jensen, U., Jensen, L., Kiil, H., Larsen, B., Riis, C.,
Thingsgaard, K., Thirup, C., Tom-Petersen, A., Vesterdal, L., 1996.
Soil respiration profiles and protozoan enumeration agree as microbial
growth indicators. Soil Biology & Biochemistry 28, 865–868.
Cotner, J.B., Ammerman, J.W., Peele, E.R., Bentzen, E., 1997.
Phosphorus-limited bacterioplankton growth in the Sargasso Sea.
Aquatic Microbial Ecology 13, 141–149.
Degens, B.P., Harris, J.A., 1997. Development of a physiological
approach to measuring the catabolic diversity of soil microbial
communities. Soil Biology & Biochemistry 29, 1309–1320.
Demetz, M., Insam, H., 1999. Phosphorous availability in a forest soil
determined with a respiratory assay compared to chemical methods.
Geoderma 89, 259–271.
De Ruiter, P.C., Moore, J.C., Zwart, K.B., Bouwman, L.A., Hassink, J.,
Bloem, J., de Vos, J.A., Marinissen, J.C.Y., Didden, W.A.M.,
Lebbink, G., Brussard, L., 1993. Simulation of nitrogen mineralization
in the below-ground food webs of two winter wheat fields. Journal of
Applied Ecology 30, 95–106.
Duah-Yentumi, S., Rønn, R., Christensen, S., 1998. Nutrients limiting
microbial growth in a tropical forest soil of Ghana under different
management. Applied Soil Ecology 8, 19–24.
Egli, T., 1991. On multiple-nutrient-limited growth of microorganisms,
with special references to dual limitation by carbon and nitrogen
substrates. Antonie van Leeuwenhoek 60, 225–234.
Ekblad, A., Nordgren, A., 2002. Is growth of soil microorganisms in
boreal forests limited by carbon or nitrogen availability? Plant & Soil
242, 115–122.
Graneli, W., Bertilsson, S., Philbert, A., 2004. Phosphorus limitation of
bacterial growth in high Arctic lakes and ponds. Aquatic Sciences 66,
430–439.
ARTICLE IN PRESSF. Demoling et al. / Soil Biology & Biochemistry 39 (2007) 2485–2495 2495
Gurung, T.B., Urabe, J., 1999. Temporal and vertical difference in factors
limiting growth rate of heterotrophic bacteria in Lake Biwa. Microbial
Ecology 38, 136–145.
Ilstedt, U., Singh, S., 2005. Nitrogen and phosphorous limitations of
microbial respiration in a tropical phosphorous-fixing acrisol (ultisol)
compared with organic compost. Soil Biology & Biochemistry 37,
1407–1410.
Joergensen, R.G., Scheu, S., 1999. Response of soil microorganisms to the
addition of carbon, nitrogen and phosphorous in a forest Rendzina.
Soil Biology & Biochemistry 31, 859–866.
Kirschbaum, M.U.F., Paul, K.I., 2002. Modelling C and N dynamics in
forest soils with a modified version of the CENTURY model. Soil
Biology & Biochemistry 34, 341–354.
Mack, M.C., Schurr, E.A.G., Bret-Harte, M.S., Shaver, G.R.,
Chapin III, F.S., 2004. Ecosystem carbon storage in arctic tundra
reduced by long-term nutrient fertilization. Nature 431, 440–443.
Morris, D.P., Lewis Jr., W.M., 1992. Nutrient limitation of bacterio-
plankton growth in Lake Dillon, Colorado. Limnology & Oceano-
graphy 37, 1179–1192.
Nordgren, A., 1992. A method for determining microbially available N
and P in an organic soil. Biology & Fertility of Soils 13, 195–199.
Nordin, A., Schmidt, I.K., Shaver, G.R., 2004. Nitrogen uptake by arctic
soil microbes and plants in relation to soil nitrogen supply. Ecology 85,
955–962.
Pinhassi, M., Gomez-Consarnau, L., Alonso-Saez, L., Sala, M.M.,
Vidal, M., Pedros-Alio, C., Gasol, J.M., 2006. Seasonal changes in
bacterioplankton nutrient limitation and their effects on bacterial
community in the NW Mediterranean Sea. Aquatic Microbial Ecology
44, 241–252.
Rivkin, R.B., Andersson, M.R., 1997. Inorganic nutrient limitation of
oceanic bacterioplankton. Limnology & Oceanography 42, 730–740.
Sala, M.M., Peters, F., Gasol, J.M., Pedros-Alio, C., Marrase, C.,
Vaque, D., 2002. Seasonal and spatial variations in the nutrient
limitation of bacterioplankton growth in the north-western Mediter-
ranean. Aquatic Microbial Ecology 27, 47–56.
Scheu, S., 1990. Changes in microbial nutrient status during secondary
succession and its modification by earthworms. Oecologia 84, 351–358.
Scheu, S., 1993. Analysis of the microbial nutrient status in soil
microcompartments: earthworm faeces from a basalt–limestone
gradient. Geoderma 56, 576–586.
Schimel, J.P., Weintraub, M.N., 2003. The implications of exoenzyme
activity on microbial carbon and nitrogen limitation in soil: a
theoretical model. Soil Biology & Biochemistry 35, 549–563.
Smith, J.L., Paul, E.A., 1990. The significance of soil microbial biomass
estimations. In: Soil Biochemistry, vol. 6. Marcel Dekker, New York,
pp. 357–395.
Smith, P., Smith, J.U., Powlson, D.S., McGill, W.B., Arah, J.R.M., Chertov,
O.G., Coleman, K., Franko, U., Frolking, S., Jenkinson, D.S., Jensen,
L.S., Kelly, R.H., Klein-Gunnewiek, H., Komarov, A.S., Li, C., Molina,
J.A.E., Mueller, T., Parton, W.J., Thornley, J.H.M., Whitmore, A.P.,
1997. A comparison of the performance of nine soil organic matter
models using datasets from seven long-term experiments. Geoderma 81,
153–225.
Tingstad, F.T., Zweifel, U.L., Rassoulzadegan, F., 1998. P limitation of
heterotrophic bacteria and phytoplankton in the northwest Mediter-
ranean. Limnology & Oceanography 43, 88–94.
Vance, E.D., Chapin III, F.S., 2001. Substrate limitations to microbial
activity in taiga forest floors. Soil Biology & Biochemistry 33, 173–188.
Vrede, K., Vrede, T., Isaksson, A., Karlsson, A., 1999. Effects of nutrients
(phosphorous, nitrogen and carbon) and zooplankton on bacterio-
plankton and phytoplankton—a seasonal study. Limnology &
Oceanography 44, 1616–1624.