Improved short adjacent repeat identification using three evolutionary Monte Carlo schemes

SOIL MICROBIOLOGY
Bacterial Community Composition in Brazilian Anthrosolsand Adjacent Soils Characterized Using Culturingand Molecular Identification
B. O’Neill & J. Grossman & M. T. Tsai & J. E. Gomes &
J. Lehmann & J. Peterson & E. Neves & J. E. Thies
Received: 23 July 2008 /Accepted: 18 March 2009 /Published online: 21 April 2009# Springer Science + Business Media, LLC 2009
Abstract Microbial community composition was examinedin two soil types, Anthrosols and adjacent soils, sampled fromthree locations in the Brazilian Amazon. The Anthrosols, alsoknown as Amazonian dark earths, are highly fertile soils thatare a legacy of pre-Columbian settlement. Both Anthrosols andadjacent soils are derived from the same parent material andsubject to the same environmental conditions, includingrainfall and temperature; however, the Anthrosols contain highlevels of charcoal-like black carbon from which they derivetheir dark color. The Anthrosols typically have higher cation
exchange capacity, higher pH, and higher phosphorus andcalcium contents. We used culture media prepared from soilextracts to isolate bacteria unique to the two soil types and thensequenced their 16S rRNA genes to determine their phyloge-netic placement. Higher numbers of culturable bacteria, byover two orders of magnitude at the deepest sampling depths,were counted in the Anthrosols. Sequences of bacteria isolatedon soil extract media yielded five possible new bacterialfamilies. Also, a higher number of families in the bacteria wererepresented by isolates from the deeper soil depths in theAnthrosols. Higher bacterial populations and a greater diver-sity of isolates were found in all of the Anthrosols, to a depth ofup to 1 m, compared to adjacent soils located within 50–500 mof their associated Anthrosols. Compared to standard culturemedia, soil extract media revealed diverse soil microbialpopulations adapted to the unique biochemistry and physio-logical ecology of these Anthrosols.
Introduction
Amazonian dark earths (ADE) contain organic amendments,such as charcoal, that were incorporated into them in pre-Columbian times. This has resulted in soils prized for theirsustained fertility. The existence of these Anthrosols in closeproximity to adjacent, nutrient-poor soils formed from the sameparent materials provided an opportunity to study variables,other than their inherent mineralogy, that influence theirbacterial diversity. Cloning and sequencing have revealeddistinctly different bacterial communities in the Anthrosolscompared to adjacent soils [22], but the factors controllingthese differences and the unique roles that microbial commu-nities may have in ADE are not well-understood [41].
The high levels of black carbon (BC) present in ADEhave existed for several hundred to thousands of years since
Microb Ecol (2009) 58:23–35DOI 10.1007/s00248-009-9515-y
The author J. Peterson is already deceased.
B. O’Neill : J. Grossman : J. Lehmann : J. E. ThiesDepartment of Crop and Soil Sciences, Cornell University,235 Emerson Hall,Ithaca, NY 14853, USA
M. T. Tsai : J. E. GomesCentro de Energia Nuclear na Agricultura,Caixa Postal 96, Av. Centenário no. 303,CEP: 13400-970 Piracicaba, São Paolo, Brazil
J. PetersonUniversity of Vermont,Burlington, VT 05405, USA
E. NevesMuseo de Arqueologia e Etnologia, Universidade de São Paulo,São Paulo, SP 05508-900, Brazil
J. E. Thies (*)Department of Crop and Soil Sciences, Cornell University,722 Bradfield Hall,Ithaca, NY 14853, USAe-mail: [email protected]
Present Address:J. GrossmanDepartment of Soil Science, North Carolina State University,PO Box 7619, Raleigh, NC 27695-7619, USA

their incorporation, in spite of intense weathering andconditions highly favorable for microbial decomposition[20]. Soil temperature, moisture, texture, carbon (C)content, nutrient availability, and pH, along with land usehistory, plant species, and seasonality are among the factorsthat have been shown to affect soil microbial communitycomposition [6, 7, 17, 49]. ADE have higher concentrationsof key nutrients, such as phosphorus (P), calcium (Ca), andsoil organic C, but lower respiration rates (carbon dioxideevolution) compared to adjacent soils (Liang, Ph.D. thesis).Understanding the interaction of diverse microbial popula-tions with the many dynamic biogeochemical factors in soilremains a great challenge [18, 21, 45, 49] and is central tomodeling rates of nutrient turnover in soil ecosystems [2].A key question for nutrient cycling in ADE is whether thepool of BC itself is cycling at a greatly reduced rate or if thepresence of BC has altered nutrient and C cycling throughoutthe soil ecosystem. Furthermore, while soil horizon depthdictates the volume in which key microbial processespredominate [3], especially in tropical soils, the increasedfertility at depth in the ADE may greatly expand the extentof microbial activity relevant to modeling nutrient dynamics.
To compare soil microbial communities in Anthrosols andadjacent soils, we used the differences in soil chemicalcomposition as the selective agent to isolate bacteria. Bacterialculturing techniques can be tedious and reveal only a smallproportion of extant organisms in soil, but they are an excellentmethod for examining the physiological and metabolicdiversity of bacteria potentially active in soil ecosystems[23]. Combined with powerful molecular techniques, cultur-ing methods work synergistically to capture and identify adistinct proportion of the microbial diversity in soil and morecompletely describe its community composition [24, 45, 48].
In this study, we examined bacterial population size andcomposition in paired tropical soil types: the Anthrosolscreated during pre-Columbian settlement and adjacent“unmodified” soils from three locations in the BrazilianAmazon. Both soil types at each location were derived fromthe same parent material and were subject to the sameclimate, but differed by the presence/absence of BC and theassociated high P and Ca contents in the Anthrosols. Wecultured and isolated bacteria on a minimal medium and onsoil extract media prepared from each soil sample and usedcolony polymerase chain reaction (PCR) [34] to amplify16S rRNA genes from each isolate [42]. Using restrictionfragment length polymorphisms (RFLP) and direct se-quencing of 16S rRNA, we identified and compared thedominant, culturable bacteria residing in each soil type ateach site at multiple soil depths. We hypothesized that theAnthrosols would contain higher numbers of culturablebacteria in multiple soil horizons and a greater diversity ofbacteria and that the culturable bacterial communitieswould be more similar among the Anthrosols than between
the Anthrosols and the adjacent soils sampled from thesame site. In comparison with adjacent soils, a betterunderstanding of the size and diversity of the bacterialpopulation in ADE should inform future inquiry into thephysiological ecology of BC-rich soils.
Materials and Methods
Site Descriptions and Soil Sampling
Soils were collected from three sites within the AmazonBasin each located within 50 km of the city of Manaus,Brazil (3°08′ S, 59°52′ W, 4–50 m above sea level). Thenatural vegetation is tropical lowland rain forest with amean annual rainfall from 2,000 to 2,400 mm [37]. Thesampled soils were Anthrosols [29] and their adjacent,naturally occurring, nutrient-poor soils, which are derivedfrom tertiary sediments, primarily laterite. Three sites weresampled in this study: Hatahara (Hat), Lago Grande (LG),and Açutuba (Acu). Horizon classification in the Anthro-sols was determined by factors such as density of potterysherds, indicative of human settlement. Sampled Anthrosolsand adjacent soils were 50–500 m apart at each site andwere formed from the same parent material. Anthrosolswere sampled from existing archeological excavations bytaking multiple auger cores within each soil horizon andcompositing the cores. The unexcavated adjacent soils ateach site were sampled by use of a soil auger and separatedby soil horizons. Multiple cores from each horizon weremixed together. Approximately 1.0 kg total sample weightwas taken from each horizon. Samples were stored in sealedplastic bags at room temperature for 1 week and then at 4°Cfor 12 weeks prior to culturing. Soil characteristics of pairedA horizons at each location are presented in Table 1.
Media Preparation and Culturing
Soil extracts were prepared from each soil type, depth, andsite used in the culturing experiments. These extracts wereused to prepare agar-based media according to Burlage etal. [8]. To one part of each soil sample, two parts of double-distilled water were added (w/v) in milk dilution bottles.Soil slurries were sterilized for 1 h and then allowed tosettle and cool to room temperature. Once cooled, the liquidsoil extracts were poured off and frozen at −20°C. The soilextracts were then thawed and vacuum-filtered through a25-μm Whatman® no. 41 filter paper. For each liter of soilextract agar (SEA), 50 mL of soil extract were added to950 mL distilled water. Bacto Agar (1.8%, BD Difco™,Franklin Lakes, NJ, USA) was added and the medium wassterilized at 121°C for 20 min. Liquid soil extract mediawere prepared in the same manner and used to analyze
24 B. O’Neill et al.

ammonium N (NH4+–N) and nitrate (NO3
−–N) contents ona continuous flow autoanalyzer (SEAL Analytical,Mequon, WI, USA). Elemental compositions of the soilextract media were determined by use of inductivelycoupled plasma spectroscopy (ICP, Spectro Ciros CCD,Kleve, Germany) at the Cornell Nutrient Analysis Labora-tory in Ithaca, NY, USA. The pH of the extracts wasmeasured for all soil samples at the diluted concentrationsused for culturing. Solid R2A was prepared using BDDifco™ (Franklin Lakes, NJ, USA) dehydrated R2Amedium (product no. 218261). A modified liquid medium(R2L) was prepared according to Fries et al. [19]. Sterile,molten R2A and SEA were poured into gridded, 150-mmdiameter Petri plates. Aliquots of 10 mL of R2L and SELmedia (five replicates for each of five dilutions per sample)were added to 50 mL screw-top tubes, capped, andautoclaved for 15 min at 121°C. Soil inocula for culturingwere prepared using 10 g soil, extracted for 10 min at roomtemperature with gentle agitation in 90 mL sterile 0.1 Msodium phosphate buffer, pH 6.8. Five, tenfold, serialdilutions from each soil sampled were prepared. Aliquotsfrom each dilution were used to inoculate: (1) Petri platescontaining SEA, (2) Petri plates containing R2A, (3) fivereplicate tubes of R2L, and (4) five replicate tubes of SELfor most probable number (MPN) estimations. Inoculatedliquid and solid media were incubated in the dark at 30°C.For liquid cultures, growth (turbidity) was recordedbiweekly for 120 days, although no additional positivetubes were observed after 42 days. MPN estimates weremade using the MPNES software [46]. Colonies formed onR2A and SEA were counted daily over the first week andbiweekly thereafter, with any new colonies denoted bycolor-coding on the plate. During 4.5 months of incubation(approximately 135 days), approximately 20 coloniesarising on SEA and R2A were selected from plates atmultiple dilutions for each sample (generally three plates outof five dilutions contained colonies at a spacing suitable forsingle-colony isolation). Colony selection was based onmorphological differences and the week in which the colonyfirst appeared after plating, with preference given to slower-forming colonies. Selected colonies were subcultured on thesamemedium on which they were initially cultured and on thealternate medium (i.e., colonies arising on SEAwere tested forgrowth on R2A and those arising on R2Awere tested for theability to grow on SEA for each soil extract) and growth notedafter incubating for up to 120 days at 30°C in the dark.
PCR-Restriction Fragment Length Polymorphism Analysis
Cells from purified colony isolates (verified by microscopy)were used directly for DNA amplification by PCR using theforward primer 27f (5′-AGA GTT TGA TCC TGG CTCAG-3′) and reverse primer 1492r (5′-GGT TAC CTT GTTT
able
1Chemical
andph
ysical
characteristicsof
paired
Aho
rizons
forAnthrosolsandadjacent
soils
Site
Typ
eLandfeature
Age
(years)
pH (1:2.5
H2O)
Sand
(%)
Silt
(%)
Clay
(%)
Organic
C(m
gg−
1)
Na
(mgg−
1)
Pa
(mgg−
1)
Caa
(mgg−
1)
C/N
CEC
(mmol
Chargekg
−1)
Graph
iticBCb
(%)
Hat
Anth
Und
erpasturedense
potshards
600–
1,00
06.4
51.3
21.7
27.0
22.0
1.0
9.1
17.6
23211.3
5.82
Adj
Und
erearlysecond
ary
forest,deep
orange
4.6
60.4
3.8
35.9
21.8
1.6
0.3
0.1
1488
.42.87
LG
Anth
Und
ersecond
ary
forestfew
potshards
900–
1,10
05.9
47.9
29.6
22.6
31.5
1.8
5.0
6.4
1822
2.4
2.32
Adj
Und
ersecond
ary
forestfew
concretio
ns4.2
69.4
3.9
26.7
17.5
1.3
0.3
0.1
1459
.21.88
Acu
Anth
Nearag.fielddark
w/dense
potshards
2,00
0–2,30
05.6
81.9
7.7
10.4
15.7
1.0
0.8
0.3
1656
.35.71
Adj
Und
ersecond
aryforest
yello
wlatosol-lik
e4.7
87.9
3.6
8.5
15.4
0.8
0.2
0.1
2052
.02.41
Abb
reviated
from
Liang
etal.[26]
aTotal
N,P,
andCa
bPercent
graphitic
BC
outof
totalorganicC,determ
ined
bythermal
oxidation
Microbial Communities in Brazilian Anthrosols and Adjacent Soils 25

ACG ACT T-3′) (Integrated DNA Technologies, Coralville,IA, USA), which target the bacterial 16S rRNA genes [28].Isolate DNA was amplified using a PTC 100 thermal cycler(MJ Research, Waltham, MA, USA) and the followingprogram: 5 min at 94°C, followed by 35 cycles of 94°C for45 s, 56°C for 45 s, and 72°C for 1 min, and a final extensionstep at 72°C for 10 min. Final reaction concentrations were:0.05 U µL−1 Taq polymerase (Promega, Madison, WI, USA),1.0x PCR buffer supplied with the enzyme, 2.0 mM MgCl2,0.2 mM dNTPs, 0.1 µg µL−1 bovine serum albumin (BSA),both primers at 0.1 µM, and nuclease-free water (Promega).PCR products were verified by running them on a 0.7%agarose gels, staining the gel with SYBR Green I (CambrexBiosciences, East Rutherford, NJ, USA) and visualizing theproducts using a Fluor-S™ MultiImager (Bio-Rad, Hercules,CA, USA). Isolate amplicons (∼1,450 bp) were then digestedin 20 µL reaction volumes using the restriction enzyme MspI(Promega) at 10 U µL−1 with 1.0x buffer (supplied with theenzyme), 10 µg µL−1 BSA, and nuclease-free water.Restriction digests were carried out in a PTC 100 thermalcycler (MJ Research) held at 37°C for 4.5 h with a final stepat 70°C for 15 min to stop the reaction as specified by themanufacturer. Restriction fragments were separated in 2%agarose gels. Gels were stained with ethidium bromide andthe RFLP patterns visualized using the Fluor-S™ Multi-Imager (Bio-Rad). For bacterial isolate RFLP fingerprintsyielding the same or similar banding patterns using the MspIrestriction enzyme, additional aliquots of the 16S rDNAamplicons were digested using the restriction enzymes RsaIand HhaI (Promega), according to the manufacturer's proto-cols, and the resulting RFLP fingerprints digitized asdescribed above.
Sequencing
After ribotype screening, 16S rDNA amplicons of interestwere cleaned prior to sequencing using ExoSAP-IT® (USB,Cleveland, OH, USA). Reactions were carried out in a PTC100 thermal cycler (MJ Research) held at 37°C for 15 minfollowed by 80°C for 15 min to inactivate the reaction. Allsequencing reactions were performed at the CornellBiotechnology Resource Center in Ithaca, NY, USA, usingan Automated 3730X1 DNA Analyzer (Applied Biosys-tems, Foster City, CA, USA). Sequences were deposited inthe GenBank and assigned the accession numbersEU571115–EU571206.
Data Analysis
A chimera check on the aligned sequences was run usingthe Ribosomal Database Program II, release 8.1 [10].Cluster analysis of RFLP fingerprints was carried out withthe unweighted pair group method with arithmetic linkage
method using band presence/absence in the BioNumericssoftware (Applied Maths©, Sint-Martens-Latem, Belgium).Resulting binary data were further analyzed using JMP 5.1(SAS Institute, Cary, NC, USA). Sequence alignment aswell as phylogenetic and molecular evolutionary analyseswere conducted with MEGA version 3.1 [39], using theJukes–Cantor neighbor-joining algorithm. Distance matri-ces were constructed by the DNADIST program inPHYLIP [14]. Relatedness of clone libraries between pairedsoils and medium types were compared using ∫-LIBSHUFF[35], and rarefaction curves, diversity indices, and lineagethrough time were evaluated using DOTUR [35].
Results
Soil Physical and Chemical Analyses
Paired Anthrosol and adjacent soil samples from each sitediffered markedly in soil color, with Anthrosols having adark, blackish color down to 1 m or deeper, which is dueprimarily to the presence of BC. Graphitic BC is a portionof total BC (Table 1) and, while it does not serve as a proxyfor the highly heterogeneous BC, it is elevated in theAnthrosols [26]. Adjacent soils had a yellowish to deeporange color with a slightly darker surface O horizon.Paired samples listed in Table 1 were chosen based onvisual observation of soil horizons, including factors suchas rooting depth and bioturbation. Adjacent soils at Hatand LG had a higher percentage of sand and clay than theAnthrosols, which contained from two to over six timesmore silt than the adjacent soils. Anthrosols generally hada higher pH, higher cation exchange capacity (CEC), andconsiderably higher total P and Ca contents (the latter to alesser extent in Acu). Organic C and total N were similarbetween the paired soil samples from each site. At the Hatand LG sites, C/N ratios in the Anthrosols weresignificantly higher than those of the adjacent soils(Table 1).
MPN in SEL and R2L
All of the Anthrosols cultured in both SEL and R2L mediahad MPN estimates within the same order of magnitude,regardless of site or sampling depth, except for the lowesthorizons at the Hat and Acu sites, which were below theestimated range of surface soil populations (Fig. 1).Adjacent soils had population estimates within the sameorder of magnitude as their paired Anthrosols in only threeof the seven paired samples (Hat, 0–30 and 40–70 cm; LG,0–10 cm). At all sites, the estimated number of culturableorganisms declined considerably faster with depth in theadjacent soils than in the Anthrosols. In the adjacent soils at
26 B. O’Neill et al.

the Hat and Acu sites, population estimates for the deepestdepths were more than two orders of magnitude lower thansurface populations.
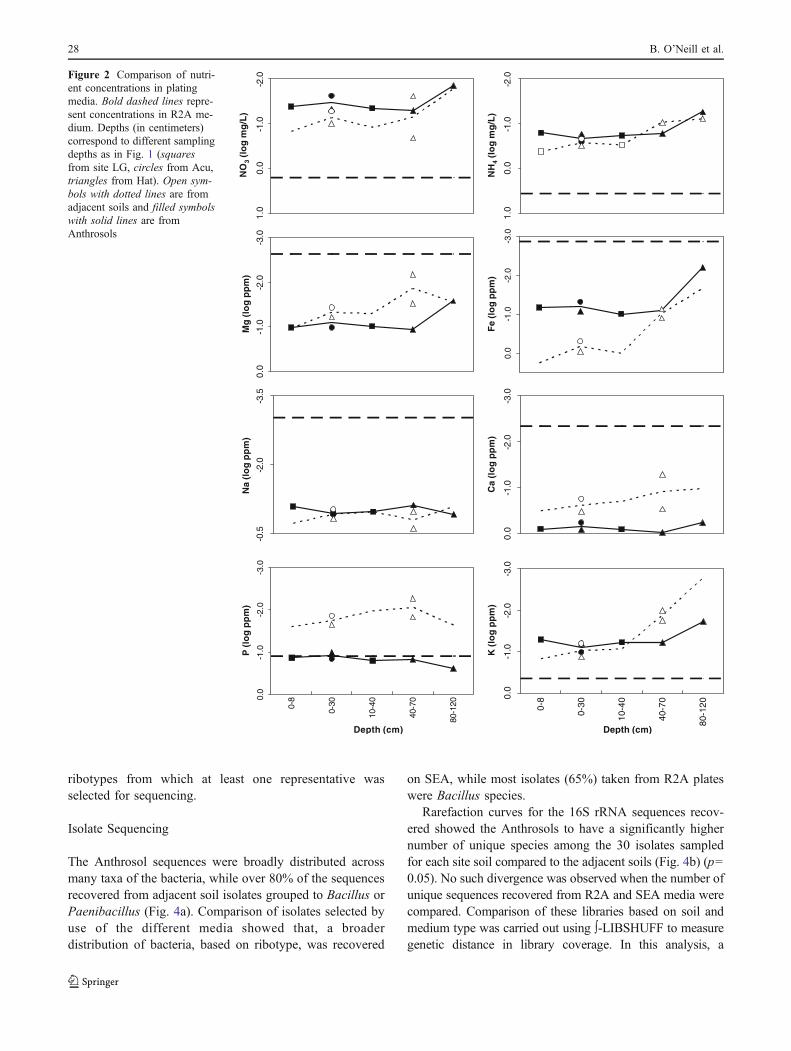
Selective Medium Nutrients
The pH of soil extract media ranged from 7.02 to 7.36 (datanot shown) for all samples and was not considered a majorvariable in these experiments. The ion concentration of saltsin the commercial R2A medium was lower than mostelements extracted from the soil samples used to make thesoil extract media (Fig. 2). Exceptions to this wereconcentrations of potassium (K) and P in adjacent soilextracts. Nitrogen (N) concentrations were lower in SEAcompared to R2A (from the contribution of N saltsalone) by an average of 24.7%, with SEA from theAnthrosols generally more N-deficient than SEA fromadjacent soils. Nitrate nitrogen concentrations werelower in all SEA media by more than an order ofmagnitude compared to NO3
−–N provided in the saltsadded to R2A. Between the paired soil extracts, theAnthrosols generally had lower NH4
+–N and NO3−–N
concentrations than the adjacent soils; however, Nconcentrations in adjacent soil samples decreased morerapidly with soil depth.
Isolate Growth and Screening
Nearly all bacterial colonies formed on R2A platesdeveloped during the first week of incubation for all sites,soil types, and depths, while on SEA, colonies continued toform over weeks to months (Fig. 3). Appearance of newisolate colonies by soil type, depth, site, and medium typeand all interactions across time was fastest on R2A in week1 for the Anthrosols sampled at shallow depths (p=0.0086)and on R2A for adjacent soil surface and subsurfacesamples (p=0.0086 and p=0.0071, respectively). Colonydevelopment on SEA from adjacent soils occurred over alonger period, with a greater proportion of colonies forming2 weeks or more after inoculation. As with the MPN fromliquid cultures, total colony-forming units (CFU) per gramof soil dropped off faster at deeper depths in the adjacentsoils than in the Anthrosols on both R2A and SEA (data notshown). All bacterial isolates grouped into 86 different
0-30 40-70 80-120 0-10 10-40 0-30 50-80
Hat LG Acu
Soil sampling depths (cm) and sites
Lo
g1
0 C
FU
g -1
OD
W s
oil
9
8
7
6
5
4
3
bb b
a aa
a
a
a
d
c
a
d
A SELa
0-30 40-70 80-120 0-10 10-40 0-30 50-80
Hat LG Acu
Soil sampling depths (cm) and sites
Lo
g1
0 C
FU
g -1
OD
W s
oil
9
8
7
6
5
4
3
a aa
a
b
c
a
a
a
bb
b
a
c
B R2L
Figure 1 MPN (log10) of bac-teria CFU per gram ODW soilby site, depth, and soil (blackbar Anthrosol, gray bar adja-cent soil) in a SEL and b R2L.MPNs were calculated using theMPNES software [46]. Lettersover each bar indicate standarderrors (95% confidence interval)within the same or differentrange
Microbial Communities in Brazilian Anthrosols and Adjacent Soils 27
ribotypes from which at least one representative wasselected for sequencing.
Isolate Sequencing
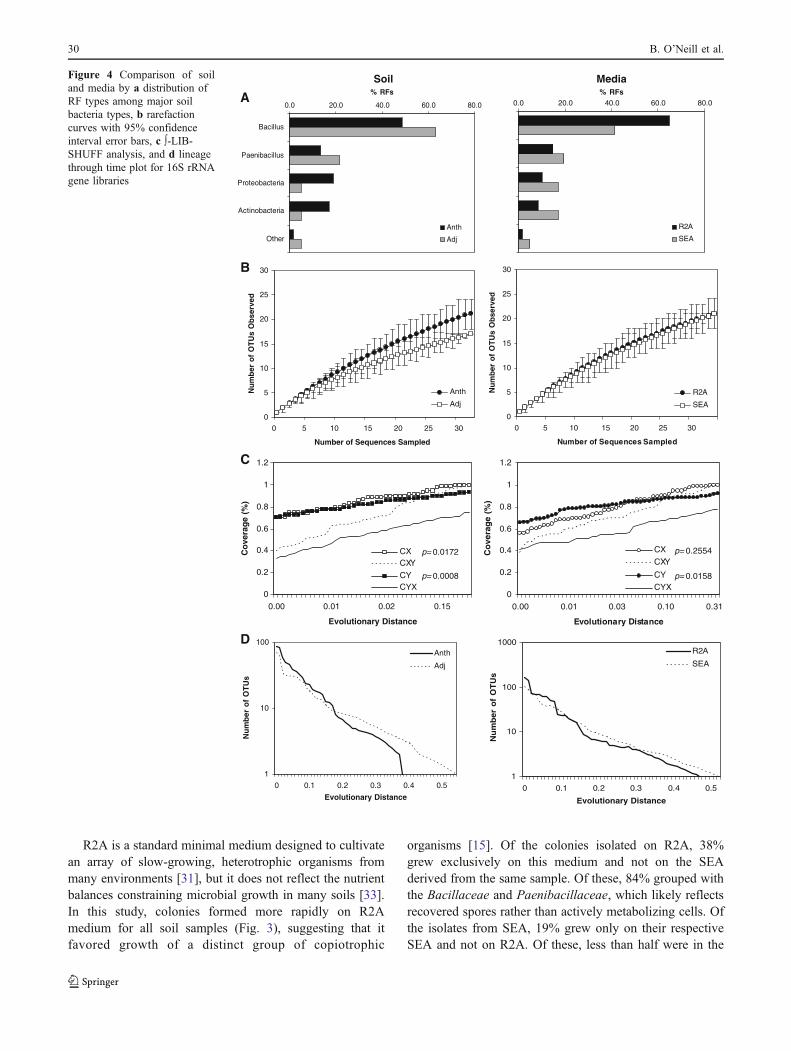
The Anthrosol sequences were broadly distributed acrossmany taxa of the bacteria, while over 80% of the sequencesrecovered from adjacent soil isolates grouped to Bacillus orPaenibacillus (Fig. 4a). Comparison of isolates selected byuse of the different media showed that, a broaderdistribution of bacteria, based on ribotype, was recovered
on SEA, while most isolates (65%) taken from R2A plateswere Bacillus species.
Rarefaction curves for the 16S rRNA sequences recov-ered showed the Anthrosols to have a significantly highernumber of unique species among the 30 isolates sampledfor each site soil compared to the adjacent soils (Fig. 4b) (p=0.05). No such divergence was observed when the number ofunique sequences recovered from R2A and SEA media werecompared. Comparison of these libraries based on soil andmedium type was carried out using ∫-LIBSHUFF to measuregenetic distance in library coverage. In this analysis, a
-2.0
-1.0
0.0
1.0
NO
3 (l
og
mg
/L)
-2.0
-1.0
0.0
1.0
NH
4 (l
og
mg
/L)
-3.0
-2.0
-1.0
0.0
Mg
(lo
g p
pm
)
-3.0
-2.0
-1.0
0.0
Fe
(lo
g p
pm
)
-3.5
-2.0
-0.5
Na
(lo
g p
pm
)
-3.0
-2.0
-1.0
0.0
Ca
(lo
g p
pm
)
-3.0
-2.0
-1.0
0.0
0-8
0-30
10-4
0
40-7
0
80-1
20
P (
log
pp
m)
Depth (cm)
-3.0
-2.0
-1.0
0.0
0-8
0-30
10-4
0
40-7
0
80-1
20
K (
log
pp
m)
Depth (cm)
Figure 2 Comparison of nutri-ent concentrations in platingmedia. Bold dashed lines repre-sent concentrations in R2A me-dium. Depths (in centimeters)correspond to different samplingdepths as in Fig. 1 (squaresfrom site LG, circles from Acu,triangles from Hat). Open sym-bols with dotted lines are fromadjacent soils and filled symbolswith solid lines are fromAnthrosols
28 B. O’Neill et al.

library, CX, is analyzed for singleton sequences across theevolutionary distance contained within the 16S rRNA geneand the change in coverage, CXY, is compared to a pairedlibrary. The reciprocal comparison is then made using theother library, CY, and the coverage change CYX. p valuesderived by comparing the libraries from Anthrosol isolatesand adjacent soil isolates were significantly different acrossthe same genetic distance, showing distinct compositions ofisolates from each soil (Fig. 4c). In comparing isolatesrecovered using different media, the low p value for CYX
(0.0158) and higher p value for CXY (0.2554) indicated thatthe samples from R2A were a subset of those isolated onSEA [36], in spite of the latter having fewer isolates. Finally,in lineage through time plots (Fig. 4d), phylogenies as afunction of time were analyzed to compare divergentlineages between the libraries [4]. The greater concavityobserved in the lineage from adjacent soil isolates indicatedan abundance of closely related species, as suggested bycomparing the libraries derived from adjacent soils culturedon the R2A medium. A comparatively greater convexcurve, as observed for isolates recovered from SEA andfrom the Anthrosols, indicated a higher degree of divergentlineages.
Pairwise comparisons of isolates based on soil andmedium type showed that libraries derived from theAnthrosols did not differ from each other whether theywere cultured on SEA or R2A, while adjacent soil librariesdiffered significantly from each other based on mediumtype (Table 2). Richness estimates calculated using Chao1indicated that the isolates from SEA prepared from adjacentsoil had significantly lower richness, but taken with SEAisolates from the Anthrosols, soil extract media recovered abroader range of bacterial families than did the use of R2Ato culture isolates from either soil (Table 2).
Sequencing and RFLP results suggest that, a broaderrange of taxa, identified to the family level using RDP IIClassifier [10], was cultured on Anthrosol SEA than onSEA from adjacent soils. Sequences obtained from uniqueRFLP types showed 19 bacterial families among theisolates examined, and of these, 15 were represented inisolates from the Anthrosols compared to only eightfamilies represented in the isolates from the adjacent soils,with four families occurring in both soil types. Further-more, of the isolates initially cultured on SEA, representa-tives of 16 families were observed in 49 sequenced 16SrRNA gene amplicons from Anthrosols and only tenfamilies were represented within the 48 sequenced isolatestaken initially from adjacent soil SEA. There was also aclear pattern in the types of organisms predominating ineach soil type. All 14 sequences that clustered with theActinobacteria came from Anthrosols and 11 out of the 14unique sequences of Proteobacteria obtained originatedfrom the Anthrosols (Fig. 3). Of 35 unique RFLP typesfound only from adjacent soil isolates, sequencing revealed30 belonged to the Firmicutes. Furthermore, sequencesfrom 15 families were derived from subsurface soil samplesand, of these, adjacent soils contained representatives fromonly four families, whereas Anthrosols contained represen-tatives from 13 families.
Discussion
Paired Anthrosols and adjacent soils used in this study wereformed from the same parent material and experienced thesame prevailing environmental conditions. However, cul-turing, isolating, ribotyping, and sequencing revealed thatthe Anthrosols had higher populations of culturable bacteriato greater soil depths and contained much higher speciesrichness than the adjacent soils. Out of all distinct RFLPtypes generated, both unique and those occurring more thanonce among the isolates, 53% were derived from Anthrosolisolates, 33% were from adjacent soil isolates, and 14%shared isolates from both soil types (data not shown). Giventhat environmental conditions were controlled for betweensoil types, using soil extract medium as the selective agentrevealed greater family-level diversity among isolates,especially in the Anthrosols, than did a standard minimalmedium (R2A). For six out of seven paired soils acrossthree sites and multiple depths, the ratio of bacterialfamilies represented to the number of isolates recoveredwas greater in the Anthrosols than in the adjacent soils. Tenbacterial families were represented in the isolates recoveredon R2A, while 15 bacterial families were recovered onSEA, despite its lower nutrient contents, slower growthrates suggesting less available C, and greater difficultyisolating and subculturing from the SEA media.
Week0 1 2 3 4
Lo
g C
FU
/g
4.4
4.6
4.8
5.0
5.2
5.4
5.6
5.8
D1-R2A D1-SEA D2-R2A D2-SEA
Figure 3 Growth curves based on colony appearance duringincubation at 30°C on R2A and SEA grouped into weeklyobservations, with means across three sites for upper (D1) and lower(D2) soil depths fitted with exponential growth curves
Microbial Communities in Brazilian Anthrosols and Adjacent Soils 29
R2A is a standard minimal medium designed to cultivatean array of slow-growing, heterotrophic organisms frommany environments [31], but it does not reflect the nutrientbalances constraining microbial growth in many soils [33].In this study, colonies formed more rapidly on R2Amedium for all soil samples (Fig. 3), suggesting that itfavored growth of a distinct group of copiotrophic
organisms [15]. Of the colonies isolated on R2A, 38%grew exclusively on this medium and not on the SEAderived from the same sample. Of these, 84% grouped withthe Bacillaceae and Paenibacillaceae, which likely reflectsrecovered spores rather than actively metabolizing cells. Ofthe isolates from SEA, 19% grew only on their respectiveSEA and not on R2A. Of these, less than half were in the
Soil Media
0.0 20.0 40.0 60.0 80.0
Bacillus
Paenibacillus
Proteobacteria
Actinobacteria
Other
% RFs
Anth
Adj
A 0.0 20.0 40.0 60.0 80.0% RFs
R2A
SEA
0
5
10
15
20
25
30
0 5 10 15 20 25 30
Number of Sequences Sampled
Nu
mb
er o
f O
TU
s O
bse
rved
Anth
Adj
B
0
5
10
15
20
25
30
0 5 10 15 20 25 30
Number of Sequences Sampled
Nu
mb
er o
f O
TU
s O
bse
rved
R2A
SEA
0
0.2
0.4
0.6
0.8
1
1.2
0.00 0.01 0.02 0.15
Evolutionary Distance
Co
vera
ge
(%)
CXCXY
CYCYX
p= 0.0172
p= 0.0008
C
0
0.2
0.4
0.6
0.8
1
1.2
0.00 0.01 0.03 0.10 0.31
Evolutionary Distance
Co
vera
ge
(%)
CX
CXY
CY
CYX
p= 0.2554
p= 0.0158
1
10
100
0 0.1 0.2 0.3 0.4 0.5
Evolutionary Distance
Nu
mb
er o
f O
TU
s
Anth
Adj
D
1
10
100
1000
0 0.1 0.2 0.3 0.4 0.5
Evolutionary Distance
Nu
mb
er o
f O
TU
s
R2A
SEA
Figure 4 Comparison of soiland media by a distribution ofRF types among major soilbacteria types, b rarefactioncurves with 95% confidenceinterval error bars, c ∫-LIB-SHUFF analysis, and d lineagethrough time plot for 16S rRNAgene libraries
30 B. O’Neill et al.
Bacillaceae and Paenibacillaceae. Slower bacterial growthon SEA and its selectivity (Fig. 3) may be due todifferences in C availability, substrate quality, and the lackof key nutrients, particularly P for adjacent soils and N forboth soil types (Fig. 2), and this should reflect constraints tomicrobial growth in situ. Adjacent soil SEA micronutrientsand N content decreased significantly with soil depth andso did bacterial populations in R2L (Fig. 1a) and on R2A(Fig. 3), while higher nutrient contents at deeper depths inthe Anthrosols corresponded with higher numbers ofculturable bacteria on all media (Fig. 1). These resultssuggest that differences in the diversity of bacteriarecovered from the different media are not simply due tothe lower nutrient contents in the soil extract media.
Analysis of PCR-RFLP ribotypes and phylogeny of 16SrRNA gene amplicons showed distinct patterns in librarycomposition based on soil type and the medium on whichcolonies were initially isolated (Fig. 4). Ribotypes ofisolates from the Anthrosols were more evenly distributedbetween bacterial groups than isolates from the adjacentsoils and, similarly, SEA media captured a broaderdistribution of bacteria than R2A (Fig. 4a). Based on 16SrRNA gene sequences, isolate libraries from the differentsoils differed significantly both for species rarity andcoverage (Fig. 4b, c), with a clear phylogenetic divergencebetween isolate libraries from each soil type (Fig. 4d).These trends were less pronounced when libraries werecompared according to medium type, suggesting thatselection bias based on medium was not as strong as theunderlying differences based on soil type. Pairwise com-parisons of soil and medium type across all sites showed asignificant difference between bacteria selected by R2Aversus SEA for adjacent soils, but no similar divergence bymedium for the Anthrosols (Table 2). SEA captured greaterfamily-level diversity, while R2A increased estimatedrichness by strongly favoring growth of unique Firmicutesspecies, particularly for the adjacent soils (Fig. 5; Table 2).
The higher culturable bacterial diversity in the Anthro-sols based on ribotype patterns and family-level sequence
classification and the higher estimated populations over agreater soil depth suggest ecosystem-level differences inthese soil microbial communities. Most Proteobacteriaisolates and all sequenced Actinobacteria isolates wererecovered from the Anthrosols and, of these, most wereinitially isolated on SEA from samples taken from thelower horizons (Fig. 5). As a soil subsystem, the Anthro-sols, with higher mineral nutrient contents as well as BC atlower depths (Figs. 1a, b and 2), have an extended area forroot growth and thus increased rhizosphere interaction withmicrobes, leading to a larger volume for physical andchemical interactions, compared to the shallow zone ofdecomposition and nutrient reabsorption in many tropicalsoils [43]. The abundance of gram-positive Firmicutesrecovered from surface soils, especially in adjacent soils onR2A (Figs. 4a and 5), may represent a more ephemeralecology of organisms adapted to rapid growth whennutrients become available [17] and spore formation whennutrients are scarce or moisture is limited. A greaterdiversity of Actinobacteria in the BC-rich Anthrosolssuggests that these organisms may play an important rolein nutrient dynamics in these soils. The presence of BC hasbeen shown to greatly increase soil CEC [26]. BC particlesalso have an extremely high surface area, a highly aromatic,recalcitrant structure, and their surfaces undergo decompo-sition and oxidation over time [25]. Actinobacteria arephysiologically adapted to degrade carbon-rich, recalcitrantmaterials [1, 27] and their branching morphology mayallow them to permeate the porous structure of BC thusincreasing surface nutrient exchange.
The high number of unique sequences in isolatesrecovered on Anthrosol SEA media may represent organ-isms distinct to this soil type, as opposed to R2A, whichmay select for isolates that co-occur in both soil types or arefunctionally redundant. Based on similarity to databasematches and bootstrap values in constructing multiple trees[12], the screened isolates yielded five new putativebacterial families. Three of the five putative new familieswere recovered from the adjacent soil isolates, two of
Table 2 Pairwise comparisons of RF types across all sites from two soil types, isolated on two media, using ∫-LIBSHUFF, Chao1 richnessestimate, and number of bacterial families per number of isolates
Soil Medium p value, using ∫-LIBSHUFF Estimated richness Chao1(0.05 evolutionary distance)
Bacterial families/isolates
Adj Anth
SEA R2A SEA R2A
Adj SEA – 0.0000a 0.1500 0.3932 12a 6/28
R2A 0.0001a – 0.0010a 0.0184a 24 5/51
Anth SEA 0.1116 0.0000a – 0.9827 31 12/45
R2A 0.0053a 0.0001a 0.4907 – 34 9/66
a Significant difference from other values for respective assay
Microbial Communities in Brazilian Anthrosols and Adjacent Soils 31
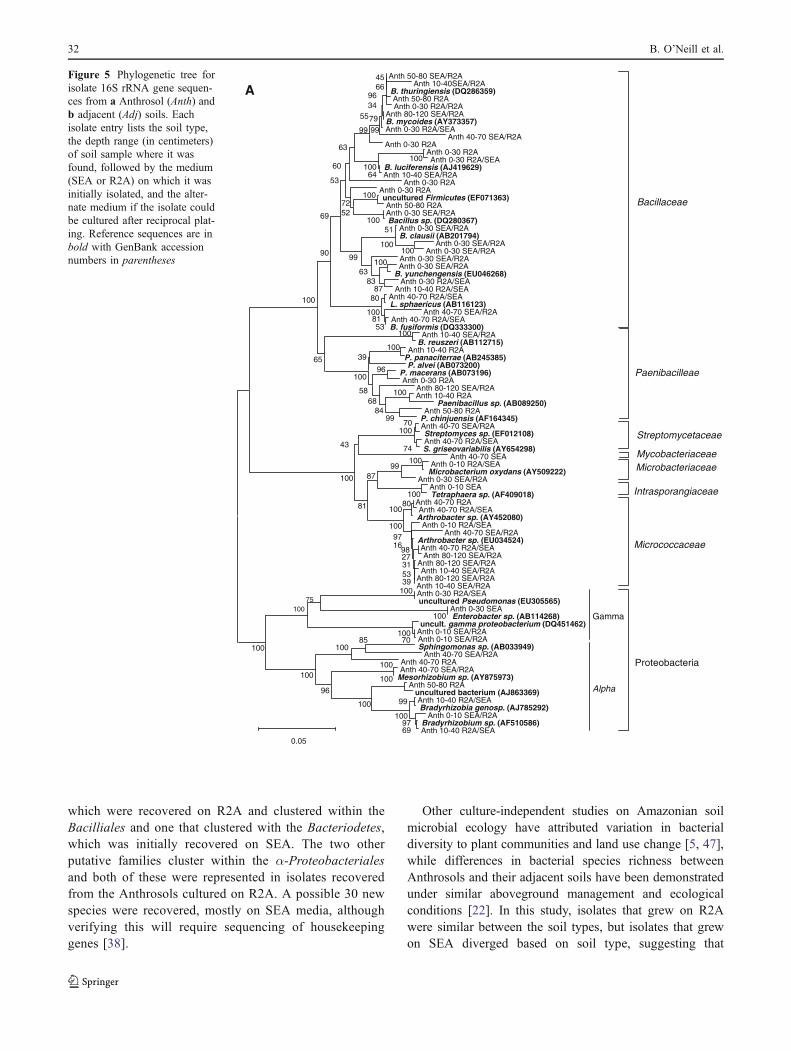
which were recovered on R2A and clustered within theBacilliales and one that clustered with the Bacteriodetes,which was initially recovered on SEA. The two otherputative families cluster within the α-Proteobacterialesand both of these were represented in isolates recoveredfrom the Anthrosols cultured on R2A. A possible 30 newspecies were recovered, mostly on SEA media, althoughverifying this will require sequencing of housekeepinggenes [38].
Other culture-independent studies on Amazonian soilmicrobial ecology have attributed variation in bacterialdiversity to plant communities and land use change [5, 47],while differences in bacterial species richness betweenAnthrosols and their adjacent soils have been demonstratedunder similar aboveground management and ecologicalconditions [22]. In this study, isolates that grew on R2Awere similar between the soil types, but isolates that grewon SEA diverged based on soil type, suggesting that
Anth 50-80 SEA/R2A Anth 10-40SEA/R2A
B. thuringiensis (DQ286359) Anth 50-80 R2A Anth 0-30 R2A/R2A
Anth 80-120 SEA/R2A B. mycoides (AY373357) Anth 0-30 R2A/SEA
Anth 40-70 SEA/R2A Anth 0-30 R2A
Anth 0-30 R2A Anth 0-30 R2A/SEA
B. luciferensis (AJ419629) Anth 10-40 SEA/R2A
Anth 0-30 R2A Anth 0-30 R2A uncultured Firmicutes (EF071363)
Anth 50-80 R2A Anth 0-30 SEA/R2A Bacillus sp. (DQ280367)
Anth 0-30 SEA/R2A B. clausii (AB201794)
Anth 0-30 SEA/R2A Anth 0-30 SEA/R2A
Anth 0-30 SEA/R2A Anth 0-30 SEA/R2A
B. yunchengensis (EU046268) Anth 0-30 R2A/SEA
Anth 10-40 R2A/SEA Anth 40-70 R2A/SEA L. sphaericus (AB116123)
Anth 40-70 SEA/R2A Anth 40-70 R2A/SEA
B. fusiformis (DQ333300) Anth 10-40 SEA/R2A
B. reuszeri (AB112715) Anth 10-40 R2AP. panaciterrae (AB245385) P. alvei (AB073200)
P. macerans (AB073196) Anth 0-30 R2A
Anth 80-120 SEA/R2A Anth 10-40 R2A
Paenibacillus sp. (AB089250) Anth 50-80 R2A
P. chinjuensis (AF164345) Anth 40-70 SEA/R2A Streptomyces sp. (EF012108) Anth 40-70 R2A/SEA
S. griseovariabilis (AY654298) Anth 40-70 SEA
Anth 0-10 R2A/SEA Microbacterium oxydans (AY509222)
Anth 0-30 SEA/R2A Anth 0-10 SEA Tetraphaera sp. (AF409018)
Anth 40-70 R2A Anth 40-70 R2A/SEA
Arthrobacter sp. (AY452080) Anth 0-10 R2A/SEA
Anth 40-70 SEA/R2A Arthrobacter sp. (EU034524)
Anth 40-70 R2A/SEA Anth 80-120 SEA/R2A
Anth 80-120 SEA/R2A Anth 10-40 SEA/R2A
Anth 80-120 SEA/R2A Anth 10-40 SEA/R2A Anth 0-30 R2A/SEA uncultured Pseudomonas (EU305565)
Anth 0-30 SEA Enterobacter sp. (AB114268)
uncult. gamma proteobacterium (DQ451462) Anth 0-10 SEA/R2A Anth 0-10 SEA/R2A
Gamma
Sphingomonas sp. (AB033949) Anth 40-70 SEA/R2A
Anth 40-70 R2A Anth 40-70 SEA/R2A
Mesorhizobium sp. (AY875973) Anth 50-80 R2A
uncultured bacterium (AJ863369) Anth 10-40 R2A/SEA Bradyrhizobia genosp. (AJ785292)
Anth 0-10 SEA/R2A Bradyrhizobium sp. (AF510586) Anth 10-40 R2A/SEA
Alpha
100
100
70100
6997
99
100
100
100
100
85100
100
100
74
70100
96
98
80
39533127
100
1697
100
9987
81
43
100
75
100
100
100
100
100
100
100
99
96
8468
58
39
100
100
53
80
81100
51
100
100
8783
100
100
65
63
100
99
64100
90
5272
69
53
60
63
99 9979553496
4566
0.05
Paenibacilleae
Bacillaceae
Proteobacteria
Micrococcaceae
Intrasporangiaceae
Microbacteriaceae Mycobacteriaceae
A
Streptomycetaceae
Figure 5 Phylogenetic tree forisolate 16S rRNA gene sequen-ces from a Anthrosol (Anth) andb adjacent (Adj) soils. Eachisolate entry lists the soil type,the depth range (in centimeters)of soil sample where it wasfound, followed by the medium(SEA or R2A) on which it wasinitially isolated, and the alter-nate medium if the isolate couldbe cultured after reciprocal plat-ing. Reference sequences are inbold with GenBank accessionnumbers in parentheses
32 B. O’Neill et al.

underlying edaphic factors are affecting microbial commu-nity composition. Both soils were derived from the sameparent material, but modification of the Anthrosols some-time between 600 and 2,300 years BP, that includedincorporation of BC [29], led to greater silt content andreduced sand percentages in these soils (Table 1). Further-more, in spite of the high leaching potential, BC increasedCEC in these Anthrosols [26] and resulted in increased pHand higher concentrations of P and Ca, compared to theadjacent soils (Fig. 2; Table 1). Also, due to its large surfacearea and microporous structure, BC itself may serve as anideal habitat for microbes [30, 40]. Together with differ-ences in soil texture and the resulting effects on soilmoisture, the distinct spatial heterogeneity in the Anthro-sols may alter the microbial community composition [49].The relative abundance of nutrients and the high C/N ratio(Table 1) indicate that N dynamics in the Anthrosols willlikely differ significantly from those in adjacent soils.Indeed, BC introduced into soil has been shown to increasenitrification and biological nitrogen fixation [13, 32]. The
presence of BC and resultant edaphic effects likely changethe factors driving competition in the Anthrosol microbialcommunities [11] and the growth of Proteobacteria andActinobacteria on SEA may indicate that these groups arephysiologically active and important to the functioning ofthe Anthrosol soil community.
Using environmentally derived culturing media, werecovered a high number of genetically distinct organismsand showed clear differences in community compositionbetween the Anthrosols and their adjacent soils. Bacterialpopulations in the Anthrosols were significantly higher andmore diverse, in spite of the same prevailing climate andparent material between the paired samples, particularly inthe subsurface samples. Adjacent soil microbial communi-ties contained an abundance of r-selected bacteria, charac-teristic of rapid C mineralization rates, while the Anthrosolswere rich in K-selected bacteria typical for more stableenvironments, with slower rates of C turnover [16]. Thepresence of recalcitrant BC in the Anthrosols may createchemical conditions that foster stable populations of unique
0.05
B. megaterium(EU221388) Adj 40-70 R2A
Adj 40-70 SEA/R2A
B. flexus (EF157301) Adj 40-70 R2A/SEA
Adj 0-30 R2A/SEA
Adj 0-10 R2A
Adj 0-10 SEA/R2A
B. thuringiensis (DQ286359) Adj 0-10 R2A/SEA
Adj 0-10 R2A/SEA
Adj 0-10 R2A/SEA
Adj 0-10 SEA/R2A
B. licheniformis (EU256500) Adj 0-30 R2A/SEA
Adj HT80-120 R2A
Adj 80-120 R2A
uncultured Firmicutes (EF071363) Adj AC23-9 SEA/R2A
Adj 0-30 SEA/R2A
B. soli (AJ542513) Adj 80-120 SEA/R2A
Bacillus sp. (EU072714) Adj 80-120 R2A/SEA
L. sphaericus (AB116123) Adj 50-80 R2A/SEA
Adj 50-80 R2A/SEA
Bacillaceae
B. reuszeri (AB112715) Adj 0-10 R2A/SEA
Adj 0-30 R2A/SEA
Adj 80-120 R2A
Brevibacillus sp. (DQ350828) Adj 0-30 R2A/SEA
Adj 0-30 SEA
Adj 10-40 R2A/SEA
P. alvei (AB073200) Paenibacillus sp. (AY839866) Adj 80-120 R2A
Paenibacillus sp. (AB089250) Adj 0-10 SEA/R2A
uncultured bacterium (EF203199) Adj 10-40 R2A/SEA
Adj 10-40 R2A
Unknown
Adj 0-30 R2A/SEA
uncultured bacterium (EU133463) Adj 0-30 SEA/R2A
Bradyrhizobium sp. (AF510586)
Alpha
Adj 0-30 SEA/R2A
Burkholdaria cepacia (AY741332)Beta
Proteobacteria
Flexibacter sp. (AY238335) Adj 0-10 SEA/R2A
Flexibacteraceae
Bacteroidetes bacterium (AB362776) Adj 80-120 SEA/R2A
Crenotrichaceae
100
99
100
100
100
100 100
99
100
60
100
100
70
70100
100
64
49
96
51
99
93
100
100
100
26
40
80
100
96
100
59
100
98
100
67
99
84
94
48
42
98
47
94
100
77
Paenibacillaceae
B Figure 5 (continued)
Microbial Communities in Brazilian Anthrosols and Adjacent Soils 33

microbial communities and enhance soil fertility [9, 30, 44].Under conditions of intense weathering, which rapidlydeplete fertility in most tropical soils, the chemicalcomposition of these Anthrosols and their distinct microbialpopulations may in part explain their sustained soil fertility,even centuries after their formation. Replicating the soilbiogeochemical conditions and associated stable microbialpopulations found in the Anthrosols may help to improveagronomic outcomes in tropical soils.
Acknowledgements This project was funded by the Division ofEnvironmental Biology of the National Science Foundation undercontract no. DEB-0425995. The authors acknowledge the support ofthe Conselho Nacional de Desenvolvimento Científico e Tecnológico, theFundação de Amparo à Pesquisa do Estado de São Paulo, and the insightand advice of Daniel Buckley, Cornell University, Ithaca, NY, USA.
References
1. Akasaka H, Izawa T, Ueki K, Ueki A (2003) Phylogeny ofnumerically abundant culturable anaerobic bacteria associatedwith degradation of rice plant residue in Japanese paddy field soil.FEMS Microbiol Ecol 43:149–161
2. Allison SD, Martiny JBH (2008) Resistance, resilience, andredundancy in microbial communities. Proc Natl Acad Sci U S A105:11512–11519
3. Blume E, Bischoff M, Reichert JM, Moorman T, Konopka A,Turco RF (2002) Surface and subsurface microbial biomass,community structure and metabolic activity as a function of soildepth and season. Appl Soil Ecol 20:171–181
4. Bohannan BJM, Hughes J (2003) New approaches to analyzingmicrobial biodiversity data. Curr Opin Microbiol 6:282–287
5. Borneman J, Triplett EW (1997) Molecular microbial diversity insoils from eastern Amazonia: evidence for unusual microorgan-isms and microbial population shifts associated with deforestation.Appl Environ Microbiol 63:2647–2653
6. Buckley DH, Schmidt TM (2003) Diversity and dynamics ofmicrobial communities in soils from agro-ecosystems. EnvironMicrobiol 5:441–452
7. Buckley DH, Schmidt TM (2001) The structure of microbialcommunities in soil and the lasting impact of cultivation. MicrobEcol 42:11–21
8. Burlage RS, Atlas R, Stahl D, Geesey G, Sayler G (eds) (1998)Techniques in microbial ecology. Oxford University Press, NewYork, NY
9. Chidumayo EN (1994) Effects of wood carbonization on soil andinitial development of seedlings in Miombo woodland, Zambia.For Ecol Manag 70:353–357
10. Cole J, Chai B, Marsh T, Farris R, Wang Q, Kulam S, Chandra S,McGarrell D, Schmidt T, Garrity G, Tiedje J (2003) TheRibosomal Database Project (RDP-II): previewing a new autoa-ligner that allows regular updates and the new prokaryotictaxonomy. Nucleic Acids Res 31:442–443
11. Crawford JW, Harris JA, Ritz K, Young IM (2005) Towards anevolutionary ecology of life in soil. Trends Ecol Evol 20:81–87
12. Dalevi D, Hugenholtz P, Blackall LL (2001) A multiple-outgroupapproach to resolving division-level phylogenetic relationshipsusing 16S rDNA data. Int J Syst Evol Microbiol 51:385–391
13. DeLuca TH, MacKenzie MD, Gundale MJ, Holben WE (2006)Wildfire-produced charcoal directly influences nitrogen cycling inPonderosa Pine forests. Soil Sci Soc Am J 70:448–453
14. Felsenstein J (1989) PHYLIP—phylogeny inference package(version 3.2). Cladistics 5:164–166
15. Ferrari BC, Binnerup SJ, Gillings M (2005) Microcolonycultivation on a soil substrate membrane system selects forpreviously uncultured soil bacteria. Appl Environ Microbiol71:8714–8720
16. Fierer N, Bradford MA, Jackson RB (2007) Toward an ecologicalclassification of soil bacteria. Ecology 88:1354–1364
17. Fierer N, Jackson RB (2006) The diversity and biogeography ofsoil bacterial communities. Proc Natl Acad Sci U S A 103:626–631
18. Fitter AH, Gilligan CA, Hollingworth K, Kleczkowski A, TwymanRM, Pitchford JW (2005) Biodiversity and ecosystem function insoil. Funct Ecol 19:369–377
19. Fries M, Zhou J, Cheesanford J, Tiedje J (1994) Isolation,characterization, and distribution of denitrifying toluene degradersfrom a variety of habitats. Appl Environ Microbiol 60:2802–2810
20. Glaser B, Guggenberger G, Zech W, Ruivo M (2003) Soil organicmatter stability in Amazonian dark earths. In: Lehmann J, Kern D,Glaser B, Woods W (eds) Amazonian dark earths: origin,properties, management. Kluwer Academic, The Netherlands, pp141–158
21. Horner-Devine M, Carney K, Bohannan B (2004) An ecologicalperspective on bacterial biodiversity. Proc R Soc Lond B Biol Sci271:113–122
22. Kim J-S, Sparovek G, Longo RM, De Melo WJ, Crowley D(2007) Bacterial diversity of terra preta and pristine forest soilfrom the Western Amazon. Soil Biol Biochem 39:684–690
23. Labeda D (ed) (1990) Isolation of biotechnological organismsfrom nature. McGraw-Hill, New York, NY
24. Leadbetter JR (2003) Cultivation of recalcitrant microbes: cellsare alive, well and revealing their secrets in the 21st centurylaboratory. Curr Opin Microbiol 6:274–281
25. Lehmann J, Liang B, Solomon D, Lerotic M, Luizao F, KinyangiJ, Schafer T, Wirick S, Jacobsen C (2005) Near-edge X-rayabsorptive fine structure (NEXAFS) spectroscopy for mappingnano-scale distributions of organic carbon forms in soil: applica-tion to black carbon particles. Glob Biogeochem Cycles 19:1–12
26. Liang B, Lehmann J, Solomon D, Kinyangi J, Grossman J,O'Neill B, Skjemstad JO, Thies J, Luizao FJ, Petersen J, NevesEG (2006) Black carbon increases cation exchange capacity insoils. Soil Sci Soc Am J 70:1719–1730
27. Metcalfe AC, Krsek M, Gooday GW, Prosser JI, Wellington EMH(2002) Molecular analysis of a bacterial chitinolytic community inan upland pasture. Appl Environ Microbiol 68:5042–5050
28. Moeseneder M, Arrieta J, Gerard M, Christian W, Herndl G(1999) Optimization of terminal-restriction fragment lengthpolymorphism analysis for complex marine bacterioplanktoncommunities and comparison with denaturing gradient gelelectrophoresis. Appl Environ Microbiol 65:3518–3525
29. Neves EG, Petersen J, Bartone R, de Silva C (2003) Historical andsocio-cultural origins of Amazonian dark earths. In: Lehmann J,Kern D, Glaser B, Woods W (eds) Amazonian dark earths: origin,properties, management. Kluwer Academic, The Netherlands, pp29–50
30. Pietikainen J, Kiikkila O, Fritze H (2000) Charcoal as a habitat formicrobes and its effect on the microbial community of theunderlying humus. Oikos 89:231–242
31. Reasoner DJ, Geldreich EE (1985) A new medium for theenumeration and subculture of bacteria from potable water. ApplEnviron Microbiol 49:1–7
32. Rondon M, Lehmann J, Ramírez J, Hurtado M (2007) Biologicalnitrogen fixation by common beans (Phaseolus vulgaris L.)increases with bio-char additions. Biol Fertil Soils 43:699–708
33. Sait M, Hugenholtz P, Janssen PH (2002) Cultivation of globallydistributed soil bacteria from phylogenetic lineages previously
34 B. O’Neill et al.

only detected in cultivation-independent surveys. Environ Micro-biol 4:654–666
34. Sambrook J, Russell D (2001)Molecular cloning: a laboratorymanual.Cold Spring Harbor Laboratory Press, Cold Spring Harbor, NY
35. Schloss PD, Handelsman J (2005) Introducing DOTUR, a computerprogram for defining operational taxonomic units and estimatingspecies richness. Appl Environ Microbiol 71:1501–1506
36. Schloss PD, Larget BR, Handelsman J (2004) Integration ofmicrobial ecology and statistics: a test to compare gene libraries.Appl Environ Microbiol 70:5485–5492
37. Sombroek W, Ruivo ML, Fearnside PM, Glaser B, Lehmann J(2003) Amazonian dark earths as carbon stores and sinks. In:Lehmann J, Kern DC, Glaser B, Woods WI (eds) Amazonian darkearths: origin, properties, management. Kluwer Academic, TheNetherlands, pp 125–140
38. Stackebrandt E, Frederiksen W, Garrity GM, Grimont PAD,Kampfer P, Maiden MCJ, Nesme X, Rossello-Mora R, Swings J,Truper HG, Vauterin L, Ward AC, Whitman WB (2002) Report ofthe ad hoc committee for the re-evaluation of the species definitionin bacteriology. Int J Syst Evol Microbiol 52:1043–1047
39. Sudhir K, Koichiro T, Masatoshi N (2004) MEGA3: integratedsoftware for molecular evolutionary genetics analysis and se-quence alignment. Brief Bioinform 5:150
40. Thies J, Rillig M (2009) Characteristics of biochar: biologicalproperties. In: Lehmann J, Joseph S (eds) Biochar for environ-mental management. Earthscan, Dunstan House, London, UK
41. Thies J, Suzuki K (2003) Amazonian dark earths: biologicalmeasurements. In: Lehmann J, Kern D, Glaser B, Woods W (eds)Amazonian dark earths: origin, properties, management. KluwerAcademic, The Netherlands, pp 287–332
42. Vinuesa P, Rademaker JLW, de Bruijn FJ, Werner D (1998)Genotypic characterization of Bradyrhizobium strains nodulatingendemic woody legumes of the Canary Islands by PCR-restrictionfragment length polymorphism analysis of genes encoding 16SrRNA (16S rDNA) and 16S–23S rDNA intergenic spacers,repetitive extragenic palindromic PCR genomic fingerprinting,and partial 16S rDNA sequencing. Appl Environ Microbiol64:2096–2104
43. Wardle DA (2002) Communities and ecosystems: linking theaboveground and belowground components. Princeton UniversityPress, NJ
44. Wardle DA, Zackrisson O, Nilsson MC (1998) The charcoal effectin boreal forests: mechanisms and ecological consequences.Oecologia 115:419–426
45. Wawrik B, Kerkhof L, Kukor J, Zylstra G (2005) Effect ofdifferent carbon sources on community composition of bacte-rial enrichments from soil. Appl Environ Microbiol 71:6776–6783
46. Woomer P, Bennett J, Yost R (1990) Overcoming the inflexibilityof most-probable-number procedures. Agron J 82:349–353
47. Yin B, Crowley D, Sparovek G, De Melo WJ, Borneman J (2000)Bacterial functional redundancy along a soil reclamation gradient.Appl Environ Microbiol 66:4361–4365
48. Zengler K, Toledo G, Rappe M, Elkins J, Mathur EJ, Short JM,Keller M (2002) Cultivating the uncultured. Proc Natl Acad Sci US A 99:15681–15686
49. Zhou JZ, Xia BC, Treves DS, Wu LY, Marsh TL, O'Neill RV,Palumbo AV, Tiedje JM (2002) Spatial and resource factorsinfluencing high microbial diversity in soil. Appl Environ Micro-biol 68:326–334
Microbial Communities in Brazilian Anthrosols and Adjacent Soils 35
Copyright © 2022 FDOKUMEN