Auditory Cortical Local Subnetworks Are Characterized by Sharply Synchronous Activity
12
Systems/Circuits Auditory Cortical Local Subnetworks Are Characterized by Sharply Synchronous Activity Craig A. Atencio and Christoph E. Schreiner Coleman Memorial Laboratory, Department of Otolaryngology-HNS, The UCSF Center for Integrative Neuroscience, University of California, San Francisco, California 94143-0444 In primary auditory cortex (AI), broadly correlated firing has been commonly observed. In contrast, sharply synchronous firing has rarely been seen and has not been well characterized. Therefore, we examined cat AI local subnetworks using cross-correlation and spectrotemporal receptive field (STRF) analysis for neighboring neurons. Sharply synchronous firing responses were observed predom- inantly for neurons separated by 150 m. This high synchrony was independent of layers and was present between all distinguishable cell types. The sharpest synchrony was seen in supragranular layers and between regular spiking units. Synchronous spikes conveyed more stimulus information than nonsynchronous spikes. Neighboring neurons in all layers had similar best frequencies and similar STRFs, with the highest similarity in supragranular and granular layers. Spectral tuning selectivity and latency were only moderately conserved in these local, high-synchrony AI subnetworks. Overall, sharp synchrony is a specific characteristic of fine-scale networks within the AI and local functional processing is well ordered and similar, but not identical, for neighboring neurons of all cell types. Introduction Across fields and layers, auditory cortical neurons exhibit corre- lated activity of low magnitude (cross-correlation coefficients 0.1) and low temporal precision (correlation widths 15 ms; Brosch and Schreiner, 1999; Eggermont, 2000; Atencio and Schreiner, 2010a). Seldom observed, however, are corticocortical neuron pairs with high synchrony, characterized by tightly coor- dinated firing (correlation widths 3 ms; Eggermont, 2000). This is surprising because high discharge synchrony has been observed in other sensory cortices and primary auditory cortex (AI) shares many structural and functional similarities with these systems (Swadlow et al., 1998; Swadlow, 2003; Douglas and Mar- tin, 2004). Synchrony is supported by multiple aspects of cortical cir- cuitry. Sensory cortices are composed of a dense matrix of inter- connected excitatory and inhibitory neurons (Fino and Yuste, 2011; Packer and Yuste, 2011). Within the matrix, the connectiv- ity between neighboring neurons appears to be indiscriminate (Stepanyants et al., 2008), is greatest at short distances (Hol- mgren et al., 2003; Boucsein et al., 2011; Packer and Yuste, 2011), and is independent of species (Bannister and Thomson, 2007). Further, the many classes of connected excitatory and inhibitory cells allows for a large diversity of connections within a layer (Thomson and Lamy, 2007; Otsuka and Kawaguchi, 2009). Au- ditory cortex also contains these connectivity features and might exhibit high synchrony between local network elements. Different mechanisms underlying high synchrony have been proffered. Thalamocortical networks may provide fast feedfor- ward excitation to layer 4 (Blomquist et al., 2009) and by thalamic neurons that directly target inhibitory interneurons such as parv- albumin (PV) interneurons (Thomson and Lamy, 2007). In turn, PV cells receive fast input from pyramidal cells within the same layer (Thomson and Lamy, 2007). Through these reciprocal con- nections, high synchrony could result. In addition, electrical cou- pling between PV neurons may contribute to synchronous firing (Galarreta and Hestrin, 1999; Gibson et al., 1999). Therefore, an analysis of local synchrony needs to consider layer and cell type identity. Because synchrony is largely a consequence of both the con- nectivity between local cortical neurons and the contribution of tightly aligned common input, it is important to characterize the functional processing within these local circuits. Receptive fields in dense local networks may be diverse (Smith and Ha ¨usser, 2010). For example, in visual cortex, spatial frequency is not clearly clustered within local pools of neurons (Molotchnikoff et al., 2007) and, at least in upper layers of mouse auditory cortex, tonotopy is present at the macroscale, but seems diminished at microscales (Bandyopadhyay et al., 2010; Rothschild et al., 2010). Therefore, at least in rodents, fine-scale networks may contain a diverse range of receptive field characteristics. We characterized functional connectivity and receptive fields of local neighboring neurons in cat AI columns. Constituent neu- rons of local subnetworks were isolated from a single contact in a linear multielectrode array. We related the observed synchrony to Received May 13, 2013; revised Oct. 11, 2013; accepted Oct. 16, 2013. Author contributions: C.A. and C.E.S. designed research; C.A. and C.E.S. performed research; C.A. analyzed data; C.A. and C.E.S. wrote the paper. This work was supported by the National Institutes of Health (Grants DC02260 and DC011874), the Coleman Memorial Fund, and Hearing Research Inc. (San Francisco, CA). We thank Andrew Tan, Marc Heiser, Kazuo Imaizumi, and Benedicte Philibert for experimental assistance and Mark Kvale for the use of his SpikeSort 1.3 Bayesian spike- sorting software. The authors declare no competing financial interests. Correspondence should be addressed to Craig A. Atencio, Coleman Memorial Laboratory, Department of Otolaryngology-HNS, The UCSF Center for Integrative Neuroscience, University of California, 675 Nelson Rising Lane, San Francisco, CA 94143-0444. E-mail: [email protected]. DOI:10.1523/JNEUROSCI.2014-13.2013 Copyright © 2013 the authors 0270-6474/13/3318503-12$15.00/0 The Journal of Neuroscience, November 20, 2013 • 33(47):18503–18514 • 18503
Transcript of Auditory Cortical Local Subnetworks Are Characterized by Sharply Synchronous Activity

Systems/Circuits
Auditory Cortical Local Subnetworks Are Characterized bySharply Synchronous Activity
Craig A. Atencio and Christoph E. SchreinerColeman Memorial Laboratory, Department of Otolaryngology-HNS, The UCSF Center for Integrative Neuroscience, University of California, San Francisco,California 94143-0444
In primary auditory cortex (AI), broadly correlated firing has been commonly observed. In contrast, sharply synchronous firing hasrarely been seen and has not been well characterized. Therefore, we examined cat AI local subnetworks using cross-correlation andspectrotemporal receptive field (STRF) analysis for neighboring neurons. Sharply synchronous firing responses were observed predom-inantly for neurons separated by �150 �m. This high synchrony was independent of layers and was present between all distinguishablecell types. The sharpest synchrony was seen in supragranular layers and between regular spiking units. Synchronous spikes conveyedmore stimulus information than nonsynchronous spikes. Neighboring neurons in all layers had similar best frequencies and similarSTRFs, with the highest similarity in supragranular and granular layers. Spectral tuning selectivity and latency were only moderatelyconserved in these local, high-synchrony AI subnetworks. Overall, sharp synchrony is a specific characteristic of fine-scale networkswithin the AI and local functional processing is well ordered and similar, but not identical, for neighboring neurons of all cell types.
IntroductionAcross fields and layers, auditory cortical neurons exhibit corre-lated activity of low magnitude (cross-correlation coefficients�0.1) and low temporal precision (correlation widths �15 ms;Brosch and Schreiner, 1999; Eggermont, 2000; Atencio andSchreiner, 2010a). Seldom observed, however, are corticocorticalneuron pairs with high synchrony, characterized by tightly coor-dinated firing (correlation widths �3 ms; Eggermont, 2000).This is surprising because high discharge synchrony has beenobserved in other sensory cortices and primary auditory cortex(AI) shares many structural and functional similarities with thesesystems (Swadlow et al., 1998; Swadlow, 2003; Douglas and Mar-tin, 2004).
Synchrony is supported by multiple aspects of cortical cir-cuitry. Sensory cortices are composed of a dense matrix of inter-connected excitatory and inhibitory neurons (Fino and Yuste,2011; Packer and Yuste, 2011). Within the matrix, the connectiv-ity between neighboring neurons appears to be indiscriminate(Stepanyants et al., 2008), is greatest at short distances (Hol-mgren et al., 2003; Boucsein et al., 2011; Packer and Yuste, 2011),and is independent of species (Bannister and Thomson, 2007).
Further, the many classes of connected excitatory and inhibitorycells allows for a large diversity of connections within a layer(Thomson and Lamy, 2007; Otsuka and Kawaguchi, 2009). Au-ditory cortex also contains these connectivity features and mightexhibit high synchrony between local network elements.
Different mechanisms underlying high synchrony have beenproffered. Thalamocortical networks may provide fast feedfor-ward excitation to layer 4 (Blomquist et al., 2009) and by thalamicneurons that directly target inhibitory interneurons such as parv-albumin (PV) interneurons (Thomson and Lamy, 2007). In turn,PV cells receive fast input from pyramidal cells within the samelayer (Thomson and Lamy, 2007). Through these reciprocal con-nections, high synchrony could result. In addition, electrical cou-pling between PV neurons may contribute to synchronous firing(Galarreta and Hestrin, 1999; Gibson et al., 1999). Therefore, ananalysis of local synchrony needs to consider layer and cell typeidentity.
Because synchrony is largely a consequence of both the con-nectivity between local cortical neurons and the contribution oftightly aligned common input, it is important to characterize thefunctional processing within these local circuits. Receptive fieldsin dense local networks may be diverse (Smith and Hausser,2010). For example, in visual cortex, spatial frequency is notclearly clustered within local pools of neurons (Molotchnikoff etal., 2007) and, at least in upper layers of mouse auditory cortex,tonotopy is present at the macroscale, but seems diminished atmicroscales (Bandyopadhyay et al., 2010; Rothschild et al., 2010).Therefore, at least in rodents, fine-scale networks may contain adiverse range of receptive field characteristics.
We characterized functional connectivity and receptive fieldsof local neighboring neurons in cat AI columns. Constituent neu-rons of local subnetworks were isolated from a single contact in alinear multielectrode array. We related the observed synchrony to
Received May 13, 2013; revised Oct. 11, 2013; accepted Oct. 16, 2013.Author contributions: C.A. and C.E.S. designed research; C.A. and C.E.S. performed research; C.A. analyzed data;
C.A. and C.E.S. wrote the paper.This work was supported by the National Institutes of Health (Grants DC02260 and DC011874), the Coleman
Memorial Fund, and Hearing Research Inc. (San Francisco, CA). We thank Andrew Tan, Marc Heiser, Kazuo Imaizumi,and Benedicte Philibert for experimental assistance and Mark Kvale for the use of his SpikeSort 1.3 Bayesian spike-sorting software.
The authors declare no competing financial interests.Correspondence should be addressed to Craig A. Atencio, Coleman Memorial Laboratory, Department of
Otolaryngology-HNS, The UCSF Center for Integrative Neuroscience, University of California, 675 Nelson Rising Lane,San Francisco, CA 94143-0444. E-mail: [email protected].
DOI:10.1523/JNEUROSCI.2014-13.2013Copyright © 2013 the authors 0270-6474/13/3318503-12$15.00/0
The Journal of Neuroscience, November 20, 2013 • 33(47):18503–18514 • 18503
local receptive field diversity and observed high timing precisionthat was limited to neurons in close spatial proximity, suggestingthat synchrony may be a sign for enhanced local integration,encoding fidelity, and the efficient transfer of auditory informa-tion to synaptic targets.
Materials and MethodsSurgical procedures, stimulation, and recording. All experimental proce-dures were approved by the University of California–San FranciscoCommittee for Animal Research under protocol AN086113– 01B. Theexperimental procedures used in this study have been described previ-ously (Atencio and Schreiner, 2010a, 2010b). Briefly, young female (n �8) and male (n � 2) adult cats were given an initial dose of ketamine (22mg/kg) and acepromazine (0.11 mg/kg) and then anesthetized with pen-tobarbital sodium (Nembutal, 15–30 mg/kg) during the surgical proce-dure. The animal’s temperature was maintained with a thermostaticheating pad. Bupivacaine was applied to incisions and pressure points.Surgery consisted of a tracheotomy, reflection of the soft tissues of thescalp, craniotomy over AI, and durotomy. After surgery, to maintain anareflexive state, the animal received a continuous infusion of ketamine/diazepam (2–5 mg/kg/h ketamine, 0.2– 0.5 mg/kg/h diazepam in lactatedRinger’s solution).
With the animal inside a sound-shielded anechoic chamber (IAC),stimuli were delivered via a closed speaker system to the ear contralateralto the exposed cortex (electrostatic diaphragms; Stax). Extracellular re-cordings were made using multichannel silicon recording probes pro-vided by the University of Michigan Center for Neural CommunicationTechnology. The probes contained 16 linearly spaced recording chan-nels, with each channel separated by 150 �m. We only used probes withchannel impedances between 2 and 3 M�, because these impedancesallowed us to resolve single units. Probes were carefully positioned or-thogonally to the cortical surface and lowered to depths between 2300and 2400 �m using a microdrive (David Kopf Instruments).
Neural traces were band-pass filtered between 0.6 and 6 kHz and re-corded to disk with a Neuralynx Cheetah A/D system at sampling ratesbetween 18 and 27 kHz. After each experiment, the traces were sortedoffline with a Bayesian spike-sorting algorithm (Lewicki, 1994, 1998).Only those events in the traces that exceeded the DC baseline by five rootmean square noise levels were used in the spike-sorting procedure(termed spike events). Most channels of the probe yielded 1–2 well iso-lated single units. Bayesian spike sorting allows the proper classificationof spikes even if they overlap with an action potential of another neuron.When a spike event cannot be assigned to a single unit, an overlap de-composition procedure is performed. To resolve a possible overlap, thealgorithm uses the single unit waveforms of the neurons on a channel(n � 2 for a pair). The two waveforms are summed for different temporalrelationships, resulting in a set of summed waveforms. Each sum in theset corresponds to one temporal relationship. This set is then comparedwith the actual overlap event. If there is a significant fit between one of thewaveform sums and the possible overlap, then the spike times of the twounits are recorded. Detailed mathematical explanations of this procedurehave been described previously (Lewicki, 1994). All recording locationswere in AI, as verified through initial multiunit mapping and determinedby the layout of the tonotopic gradient and bandwidth modules on thecrest of the ectosylvian gyrus (Imaizumi and Schreiner, 2007). After spikesorting, the action potential waveforms were classified using establishedmethods (Bruno and Simons, 2002; Atencio and Schreiner, 2008). Theduration of each spike waveform was calculated and neurons with spikedurations �0.6 ms were classified as fast-spiking units (FSUs), whereasthose with durations �0.7 ms were classified as regular spiking units(RSUs). Pairwise analysis was restricted to neurons that were identifiedfrom a single electrode contact and did not appear on neighboring con-tacts (spacing of contacts: 150 �m); therefore, their spatial separationwas likely �150 �m.
Stimulus. For each recording site, pure tones were presented in a ran-dom sequence. The amplitudes and frequencies of the tones spanned0 –70 dB (5 dB steps) and 2.5– 40 kHz (0.1 octave [oct] steps), respec-tively. All neurons were also probed with a broadband (0.5 – 40 kHz)
dynamic moving ripple (DMR) stimulus (Escabi and Schreiner, 2002;Atencio et al., 2008). The maximum spectral modulation frequency ofthe DMR was 4 cycles/oct, and the maximum temporal modulation fre-quency was 40 cycles/s (Escabi and Schreiner, 2002). The maximummodulation depth of the spectrotemporal envelope was 40 dB. Meanintensity was set at 30 –50 dB above the average pure tone threshold.
Connectivity. To analyze the functional connectivity between neurons,we followed standard cross-covariance procedures (Rosenberg et al.,1989; Halliday and Rosenberg, 1999). First, spike trains were obtained bybinning the spike times with 0.5 ms resolution. For a single spike train, A(n),n is the bin number and A(n) is either 1 (spike) or 0 (no spike). For two spiketrains, A(n) and B(n), the mean intensities, PA and PB, for a sample of dura-tion D bins, are estimated as PA � NA/D and PB � NB/D, where NA andNB are the total number of spikes in trains A and B, respectively. For the spiketrains in this study, the stimulus duration was either 15 or 20 min, giving D�1,800,000 or 2,400,000 bins.
The cross-correlation function, or correlogram, for spike trains A(n)and B(n) is then estimated as follows:
CAB�m� � �n�0
D�m
A�n � m� B�n�
From CAB�m�, an unbiased estimate of the second order cross-productdensity, PAB�m�, is calculated as follows:
PAB�m� �CAB�m�
� D
where is the bin size of the spike train in milliseconds. The cross-covariance function, QAB�m�, is then defined as follows:
QAB�m� � PAB�m� � PA � PB
Therefore, the cross-covariance function is a scaled version of the cross-correlation function with the mean background activity removed. Thisallows excitatory and suppressive interactions to be visualized more eas-ily. Cross-covariance values that are approximately zero representchance coincidences between the two spike trains. Deflections from zerorepresent how the activity of one neuron influences the firing of the otherneuron. Note that lim
�m�3QAB(m) � 0. The cross-covariance function
QAB�m� has an asymptotic distribution from which its variance can beestimated (Halliday and Rosenberg, 1999). Under the assumption ofindependent Poisson spike trains, the variance of QAB�m� may be ap-proximated as follows:
Var�QAB�m�� �PA � PB
� D
Therefore, for two spike trains, upper and lower 99% confidence limits(CL) for QAB�m� can be set as follows:
CL � � 3 �PA � PB
� D � 1/ 2
Only cross-covariance functions with two consecutive bins satisfying the99% CLs were analyzed in this study. For some neuron pairs, shift pre-dictors were also estimated (Fig. 1 D, F, gray curves). As noted previously,shift predictors did not approach the magnitude of cross-covariancefunctions, indicating that the observed functional correlation is notmerely due to stimulus synchronization (Atencio and Schreiner, 2010a).
Two quantities were used to estimate the strength and degree of syn-chrony. To estimate the strength of functional connections, we calculateda normalized cross-correlation coefficient (CCC; Agmon, 2012). Foreach correlogram, CAB, the CCC was defined as follows:
CCC � �CAB(PD� �NANB
D]⁄�min�NA, NB� �
NANB
D �where the peak delay (PD) is the time at which the peak in the correlo-gram occurs, CAB(PD), is the number of spikes in the correlogram at the
18504 • J. Neurosci., November 20, 2013 • 33(47):18503–18514 Atencio and Schreiner • Synchronous Subnetworks in AI
peak delay, and min�NA, NB� is the number of spikes in the shorter spiketrain. This form of the CCC is impervious to firing rate differences be-tween the spike trains of the two neurons.
Spectrotemporal receptive fields. Data analysis was performed inMATLAB (MathWorks). For each neuron, the spike-triggered average wasused to estimate the spectrotemporal receptive field (STRF; Escabi andSchreiner, 2002). STRFs were thresholded so that only significant features(p � 0.01) were included in the analysis.
Basic parameters: best frequency, spectral tuning, and latency. The bestfrequency (BF) was extracted by summing the STRF across time and thenidentifying the frequency corresponding to the maximum value. Latencywas obtained in a similar fashion: the STRF was summed across fre-
quency and then the time at which the maximum occurred was calcu-lated. The bandwidth (BW) of each STRF was obtained by first setting allnegative values in the STRF to zero. Then, the main excitatory subfieldfrequency boundaries were estimated as the frequencies at which theSTRF magnitude decreased to 10% of the peak STRF value. Spectraltuning was then defined as the quality factor ( Q), and calculated asfollows: Q � BF/BW.
Bicellular information analysis. The information transmitted by syn-chronous, or bicellular, spikes was estimated using receptive field analy-sis. Bicellular spikes were obtained from the peak in the cross-covariancefunction. To identify the spikes in the peak, the half-width (HW) of thecross-covariance function was estimated, where HW was the width of thefunction at half of the peak amplitude. The window that was used toobtain bicellular spikes extended from 1 HW below the peak delay to 1HW above the peak delay value (window � [PD � HW, PD � HW]). Wethen estimated the STRF for the bicellular spike train, resulting in threeSTRFs, one for each neuron in a pair and one for the bicellular spikes.
We then estimated the information conveyed by each STRF usingprevious methodologies (Atencio et al., 2008). First, each stimulus seg-ment, s, that preceded a spike was correlated with the STRF by projectingit onto the STRF via the inner product z � s � STRF. These projec-tions form the probability distribution P�z�spike�. We then formed theprior probability distribution, P(z), by projecting a large number of ran-domly selected stimulus segments onto the STRF. We next calculated themean and SD of P(z), �, and �. P�z�spike� and P(z) were transformed tounits of SD via x � �z � ��/� to obtain the distributions P�z�spike�and P(x).
The mutual information between projections onto an STRF, v, andsingle spikes was computed according to
I�v� � � dxPv� x � spike� log2�Pv�x � spike�
Pv�x� Information was only estimated if there were at least 200 spikes in the bicel-lular spike train. For the bicellular spikes, all spikes were used. We correctedfor the number of spikes because there were fewer bicellular spikes thanspikes in either of the original spike trains. For each original spike train, asubset of spikes equal to the number of spikes in the bicellular spike train wasrandomly sampled without replacement. Information was estimated for thissubset of spikes. This resampling process was repeated 50 times to obtain amean information value for each original STRF.
Each information value was calculated using different fractions of thedataset for each spike train. To accomplish this, the information valueswere calculated over the first 90, 92.5, 95, 97.5, and 100% of the testdataset. The information calculated from these data fractions was plottedagainst the inverse of the data fraction percentage (1/90, 1/92.5, etc.). Weextrapolated the information values to infinite dataset size by fitting a lineto the data and taking the ordinate intersect as the information value forunlimited data size. Therefore, this procedure resulted in three informa-tion values: one for the bicellular spikes, and one each for the originalspike trains.
Comparisons between neurons. Throughout this study, we comparedfunctional processing for each member in a pair of neurons. To providea principled way in which to plot the values for each pair, the neuron withthe shortest spike waveform had its value plotted on the abscissa, whereasthe neuron with the longer waveform had its value plotted on the ordi-nate. For parameter differences, the absolute value of either the differ-ence or the oct difference was used. The similarity between STRFs wasmeasured using the Pearson correlation coefficient. For laminar analyses,layers were defined as described previously: Supragranular (Supra:0 – 600 �m), Granular (Gran: 700 –1100 �m), and Infragranular (Infra:1200 –2000 �m; Atencio and Schreiner, 2010b). Population statistics arepresented as mean SD unless otherwise noted.
ResultsSynchronous activity is characterized by time-locked spiking be-tween neurons. Tightly locked spiking is present when spikesfrom one neuron occur in close temporal relationship with the
19 20 21 22 23
Time (ms)
A
B
C
Waveforms
Sum of Waveforms
Sum of Waveforms and Data Trace
7 8 9 10 11 12
Time (ms)
−20 −10 0 10 20
0
8
16
Delay (ms)
Cro
ss C
ovar
ianc
e (x
10-4
spk
2 /m
s2 )
−20 −10 0 10 20
0
20
40
Delay (ms)
D E
F G
1 2 2 1
1 2
1 2 2 1
1 2
−20 −10 0 10 20−4
0
8
16
Delay (ms)
1 2 2 1
1 2
−20 −10 0 10 20
0
30
60
Delay (ms)
1 2 2 1
1 2
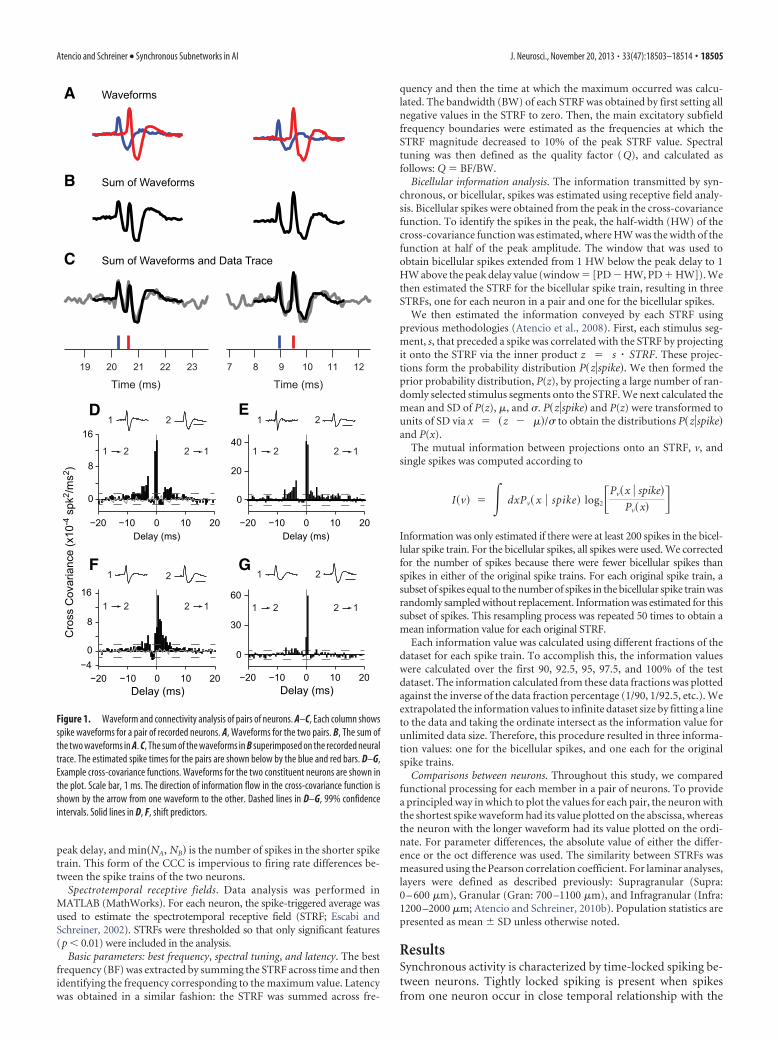
Figure 1. Waveform and connectivity analysis of pairs of neurons. A–C, Each column showsspike waveforms for a pair of recorded neurons. A, Waveforms for the two pairs. B, The sum ofthe two waveforms in A. C, The sum of the waveforms in B superimposed on the recorded neuraltrace. The estimated spike times for the pairs are shown below by the blue and red bars. D–G,Example cross-covariance functions. Waveforms for the two constituent neurons are shown inthe plot. Scale bar, 1 ms. The direction of information flow in the cross-covariance function isshown by the arrow from one waveform to the other. Dashed lines in D–G, 99% confidenceintervals. Solid lines in D, F, shift predictors.
Atencio and Schreiner • Synchronous Subnetworks in AI J. Neurosci., November 20, 2013 • 33(47):18503–18514 • 18505
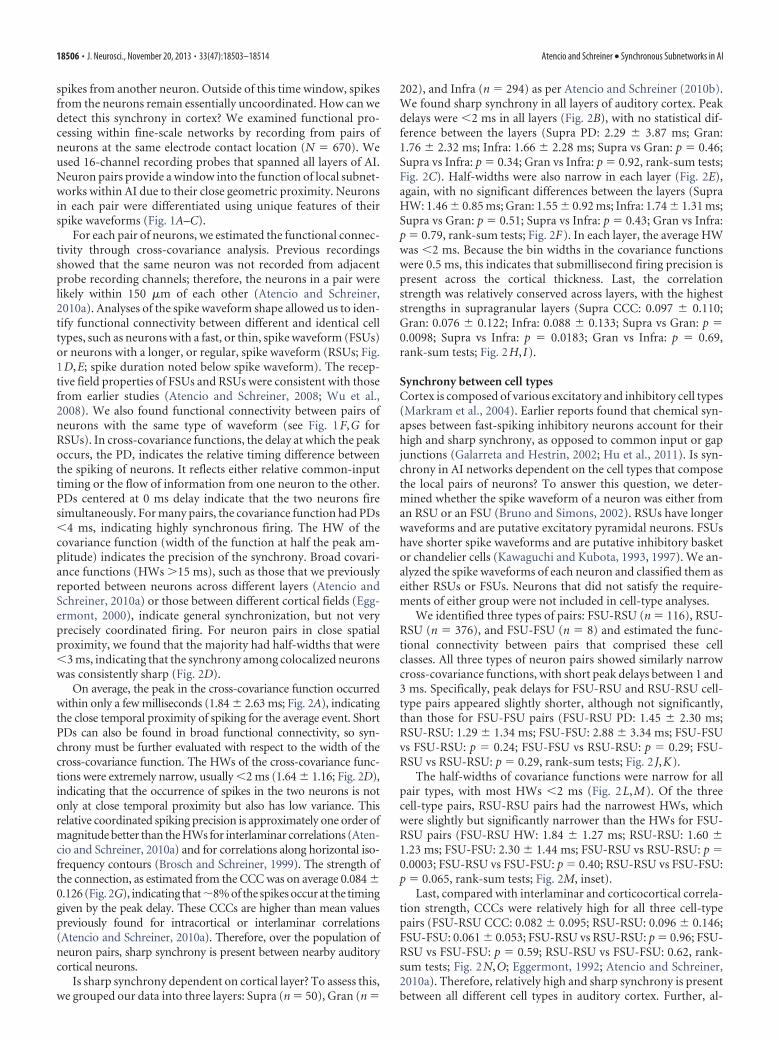
spikes from another neuron. Outside of this time window, spikesfrom the neurons remain essentially uncoordinated. How can wedetect this synchrony in cortex? We examined functional pro-cessing within fine-scale networks by recording from pairs ofneurons at the same electrode contact location (N � 670). Weused 16-channel recording probes that spanned all layers of AI.Neuron pairs provide a window into the function of local subnet-works within AI due to their close geometric proximity. Neuronsin each pair were differentiated using unique features of theirspike waveforms (Fig. 1A–C).
For each pair of neurons, we estimated the functional connec-tivity through cross-covariance analysis. Previous recordingsshowed that the same neuron was not recorded from adjacentprobe recording channels; therefore, the neurons in a pair werelikely within 150 �m of each other (Atencio and Schreiner,2010a). Analyses of the spike waveform shape allowed us to iden-tify functional connectivity between different and identical celltypes, such as neurons with a fast, or thin, spike waveform (FSUs)or neurons with a longer, or regular, spike waveform (RSUs; Fig.1D,E; spike duration noted below spike waveform). The recep-tive field properties of FSUs and RSUs were consistent with thosefrom earlier studies (Atencio and Schreiner, 2008; Wu et al.,2008). We also found functional connectivity between pairs ofneurons with the same type of waveform (see Fig. 1F,G forRSUs). In cross-covariance functions, the delay at which the peakoccurs, the PD, indicates the relative timing difference betweenthe spiking of neurons. It reflects either relative common-inputtiming or the flow of information from one neuron to the other.PDs centered at 0 ms delay indicate that the two neurons firesimultaneously. For many pairs, the covariance function had PDs�4 ms, indicating highly synchronous firing. The HW of thecovariance function (width of the function at half the peak am-plitude) indicates the precision of the synchrony. Broad covari-ance functions (HWs �15 ms), such as those that we previouslyreported between neurons across different layers (Atencio andSchreiner, 2010a) or those between different cortical fields (Egg-ermont, 2000), indicate general synchronization, but not veryprecisely coordinated firing. For neuron pairs in close spatialproximity, we found that the majority had half-widths that were�3 ms, indicating that the synchrony among colocalized neuronswas consistently sharp (Fig. 2D).
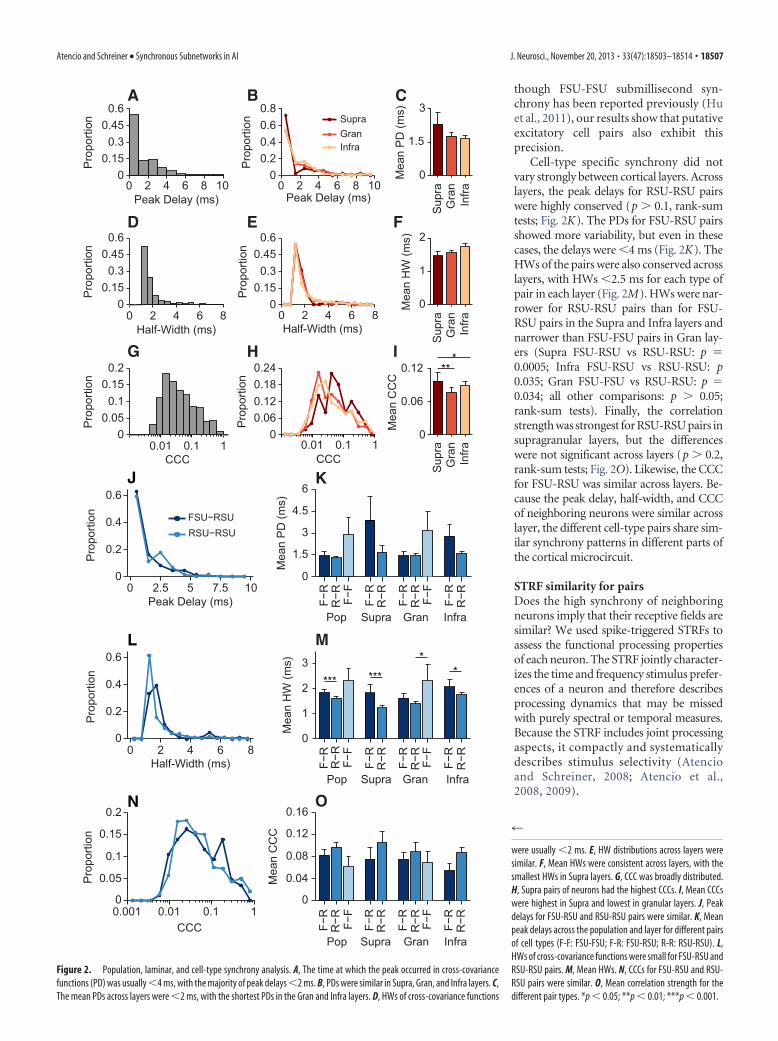
On average, the peak in the cross-covariance function occurredwithin only a few milliseconds (1.84 2.63 ms; Fig. 2A), indicatingthe close temporal proximity of spiking for the average event. ShortPDs can also be found in broad functional connectivity, so syn-chrony must be further evaluated with respect to the width of thecross-covariance function. The HWs of the cross-covariance func-tions were extremely narrow, usually �2 ms (1.64 1.16; Fig. 2D),indicating that the occurrence of spikes in the two neurons is notonly at close temporal proximity but also has low variance. Thisrelative coordinated spiking precision is approximately one order ofmagnitude better than the HWs for interlaminar correlations (Aten-cio and Schreiner, 2010a) and for correlations along horizontal iso-frequency contours (Brosch and Schreiner, 1999). The strength ofthe connection, as estimated from the CCC was on average 0.084 0.126 (Fig. 2G), indicating that�8% of the spikes occur at the timinggiven by the peak delay. These CCCs are higher than mean valuespreviously found for intracortical or interlaminar correlations(Atencio and Schreiner, 2010a). Therefore, over the population ofneuron pairs, sharp synchrony is present between nearby auditorycortical neurons.
Is sharp synchrony dependent on cortical layer? To assess this,we grouped our data into three layers: Supra (n � 50), Gran (n �
202), and Infra (n � 294) as per Atencio and Schreiner (2010b).We found sharp synchrony in all layers of auditory cortex. Peakdelays were �2 ms in all layers (Fig. 2B), with no statistical dif-ference between the layers (Supra PD: 2.29 3.87 ms; Gran:1.76 2.32 ms; Infra: 1.66 2.28 ms; Supra vs Gran: p � 0.46;Supra vs Infra: p � 0.34; Gran vs Infra: p � 0.92, rank-sum tests;Fig. 2C). Half-widths were also narrow in each layer (Fig. 2E),again, with no significant differences between the layers (SupraHW: 1.46 0.85 ms; Gran: 1.55 0.92 ms; Infra: 1.74 1.31 ms;Supra vs Gran: p � 0.51; Supra vs Infra: p � 0.43; Gran vs Infra:p � 0.79, rank-sum tests; Fig. 2F). In each layer, the average HWwas �2 ms. Because the bin widths in the covariance functionswere 0.5 ms, this indicates that submillisecond firing precision ispresent across the cortical thickness. Last, the correlationstrength was relatively conserved across layers, with the higheststrengths in supragranular layers (Supra CCC: 0.097 0.110;Gran: 0.076 0.122; Infra: 0.088 0.133; Supra vs Gran: p �0.0098; Supra vs Infra: p � 0.0183; Gran vs Infra: p � 0.69,rank-sum tests; Fig. 2H, I).
Synchrony between cell typesCortex is composed of various excitatory and inhibitory cell types(Markram et al., 2004). Earlier reports found that chemical syn-apses between fast-spiking inhibitory neurons account for theirhigh and sharp synchrony, as opposed to common input or gapjunctions (Galarreta and Hestrin, 2002; Hu et al., 2011). Is syn-chrony in AI networks dependent on the cell types that composethe local pairs of neurons? To answer this question, we deter-mined whether the spike waveform of a neuron was either froman RSU or an FSU (Bruno and Simons, 2002). RSUs have longerwaveforms and are putative excitatory pyramidal neurons. FSUshave shorter spike waveforms and are putative inhibitory basketor chandelier cells (Kawaguchi and Kubota, 1993, 1997). We an-alyzed the spike waveforms of each neuron and classified them aseither RSUs or FSUs. Neurons that did not satisfy the require-ments of either group were not included in cell-type analyses.
We identified three types of pairs: FSU-RSU (n � 116), RSU-RSU (n � 376), and FSU-FSU (n � 8) and estimated the func-tional connectivity between pairs that comprised these cellclasses. All three types of neuron pairs showed similarly narrowcross-covariance functions, with short peak delays between 1 and3 ms. Specifically, peak delays for FSU-RSU and RSU-RSU cell-type pairs appeared slightly shorter, although not significantly,than those for FSU-FSU pairs (FSU-RSU PD: 1.45 2.30 ms;RSU-RSU: 1.29 1.34 ms; FSU-FSU: 2.88 3.34 ms; FSU-FSUvs FSU-RSU: p � 0.24; FSU-FSU vs RSU-RSU: p � 0.29; FSU-RSU vs RSU-RSU: p � 0.29, rank-sum tests; Fig. 2 J,K).
The half-widths of covariance functions were narrow for allpair types, with most HWs �2 ms (Fig. 2L,M). Of the threecell-type pairs, RSU-RSU pairs had the narrowest HWs, whichwere slightly but significantly narrower than the HWs for FSU-RSU pairs (FSU-RSU HW: 1.84 1.27 ms; RSU-RSU: 1.60 1.23 ms; FSU-FSU: 2.30 1.44 ms; FSU-RSU vs RSU-RSU: p �0.0003; FSU-RSU vs FSU-FSU: p � 0.40; RSU-RSU vs FSU-FSU:p � 0.065, rank-sum tests; Fig. 2M, inset).
Last, compared with interlaminar and corticocortical correla-tion strength, CCCs were relatively high for all three cell-typepairs (FSU-RSU CCC: 0.082 0.095; RSU-RSU: 0.096 0.146;FSU-FSU: 0.061 0.053; FSU-RSU vs RSU-RSU: p � 0.96; FSU-RSU vs FSU-FSU: p � 0.59; RSU-RSU vs FSU-FSU: 0.62, rank-sum tests; Fig. 2N,O; Eggermont, 1992; Atencio and Schreiner,2010a). Therefore, relatively high and sharp synchrony is presentbetween all different cell types in auditory cortex. Further, al-
18506 • J. Neurosci., November 20, 2013 • 33(47):18503–18514 Atencio and Schreiner • Synchronous Subnetworks in AI
though FSU-FSU submillisecond syn-chrony has been reported previously (Huet al., 2011), our results show that putativeexcitatory cell pairs also exhibit thisprecision.
Cell-type specific synchrony did notvary strongly between cortical layers. Acrosslayers, the peak delays for RSU-RSU pairswere highly conserved (p � 0.1, rank-sumtests; Fig. 2K). The PDs for FSU-RSU pairsshowed more variability, but even in thesecases, the delays were �4 ms (Fig. 2K). TheHWs of the pairs were also conserved acrosslayers, with HWs �2.5 ms for each type ofpair in each layer (Fig. 2M). HWs were nar-rower for RSU-RSU pairs than for FSU-RSU pairs in the Supra and Infra layers andnarrower than FSU-FSU pairs in Gran lay-ers (Supra FSU-RSU vs RSU-RSU: p �0.0005; Infra FSU-RSU vs RSU-RSU: p0.035; Gran FSU-FSU vs RSU-RSU: p �0.034; all other comparisons: p � 0.05;rank-sum tests). Finally, the correlationstrength was strongest for RSU-RSU pairs insupragranular layers, but the differenceswere not significant across layers (p � 0.2,rank-sum tests; Fig. 2O). Likewise, the CCCfor FSU-RSU was similar across layers. Be-cause the peak delay, half-width, and CCCof neighboring neurons were similar acrosslayer, the different cell-type pairs share sim-ilar synchrony patterns in different parts ofthe cortical microcircuit.
STRF similarity for pairsDoes the high synchrony of neighboringneurons imply that their receptive fields aresimilar? We used spike-triggered STRFs toassess the functional processing propertiesof each neuron. The STRF jointly character-izes the time and frequency stimulus prefer-ences of a neuron and therefore describesprocessing dynamics that may be missedwith purely spectral or temporal measures.Because the STRF includes joint processingaspects, it compactly and systematicallydescribes stimulus selectivity (Atencioand Schreiner, 2008; Atencio et al.,2008, 2009).
Infra
Infra
Infra
Gra
nG
ran
Gra
nS
upra
Sup
raS
upra
0 2 4 6 8 100
0.150.3
0.450.6
Peak Delay (ms)
Pro
porti
on
0 2 4 6 8 100
0.20.40.60.8
Peak Delay (ms)
Pro
porti
on
SupraGranInfra
0
1.5
3
Mea
n P
D (m
s)
0 2 4 6 80
0.150.3
0.450.6
Half-Width (ms)
Pro
porti
on
0 2 4 6 80
0.150.3
0.450.6
Half-Width (ms)
Pro
porti
on
0
1
2
Mea
n H
W (m
s)
0.01 0.1 10
0.050.1
0.150.2
CCC
Pro
porti
on
0.01 0.1 10
0.060.120.180.24
CCC
Pro
porti
on
0
0.06
0.12
Mea
n C
CC
A B C
E FD
G H I
0
3
6
Mea
n P
D (m
s)
Gran InfraSupra
K
0
2
Mea
n H
W (m
s)
Supra InfraGran
M
0
0.08
0.16
Mea
n C
CC
Supra Gran Infra
O
0 2.5 5 7.5 100
0.2
0.4
0.6
Peak Delay (ms)
Pro
porti
on
0 2 4 6 80
0.2
0.4
0.6
Half-Width (ms)
Pro
porti
on
0.001 0.01 0.1 10
0.05
0.1
0.15
0.2
CCC
Pro
porti
on
J
L
N
FSU−RSURSU−RSU
Pop
F−R
Pop
F−R
Pop
F−R
F−R
F−R
F−R
R−R
R−R
R−R
R−R
R−R
R−R
F−R
F−R
F−R
F−F
F−F
F−F
F−R
F−R
F−R
R−R
R−R
R−RF−
FF−
FF−
FR
−RR
−RR
−R
3
1
0.12
0.04
4.5
1.5
***
***
*
*** *
Figure 2. Population, laminar, and cell-type synchrony analysis. A, The time at which the peak occurred in cross-covariancefunctions (PD) was usually �4 ms, with the majority of peak delays �2 ms. B, PDs were similar in Supra, Gran, and Infra layers. C,The mean PDs across layers were �2 ms, with the shortest PDs in the Gran and Infra layers. D, HWs of cross-covariance functions
4
were usually �2 ms. E, HW distributions across layers weresimilar. F, Mean HWs were consistent across layers, with thesmallest HWs in Supra layers. G, CCC was broadly distributed.H, Supra pairs of neurons had the highest CCCs. I, Mean CCCswere highest in Supra and lowest in granular layers. J, Peakdelays for FSU-RSU and RSU-RSU pairs were similar. K, Meanpeak delays across the population and layer for different pairsof cell types (F-F: FSU-FSU; F-R: FSU-RSU; R-R: RSU-RSU). L,HWs of cross-covariance functions were small for FSU-RSU andRSU-RSU pairs. M, Mean HWs. N, CCCs for FSU-RSU and RSU-RSU pairs were similar. O, Mean correlation strength for thedifferent pair types. *p � 0.05; **p � 0.01; ***p � 0.001.
Atencio and Schreiner • Synchronous Subnetworks in AI J. Neurosci., November 20, 2013 • 33(47):18503–18514 • 18507
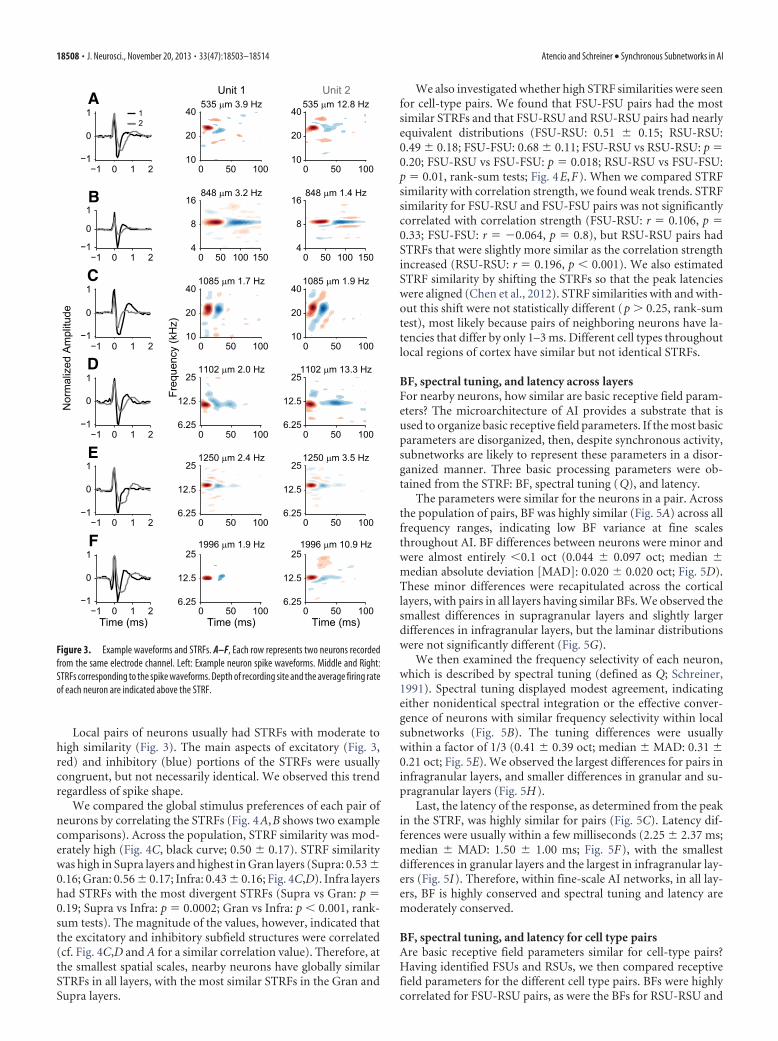
Local pairs of neurons usually had STRFs with moderate tohigh similarity (Fig. 3). The main aspects of excitatory (Fig. 3,red) and inhibitory (blue) portions of the STRFs were usuallycongruent, but not necessarily identical. We observed this trendregardless of spike shape.
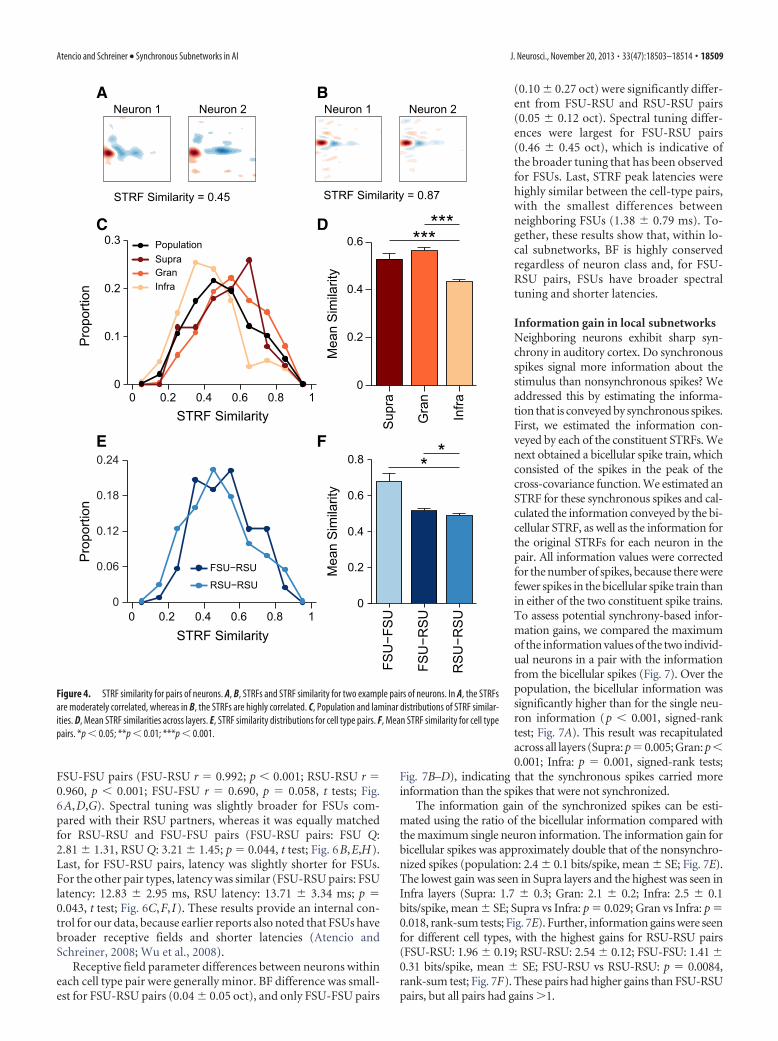
We compared the global stimulus preferences of each pair ofneurons by correlating the STRFs (Fig. 4A,B shows two examplecomparisons). Across the population, STRF similarity was mod-erately high (Fig. 4C, black curve; 0.50 0.17). STRF similaritywas high in Supra layers and highest in Gran layers (Supra: 0.53 0.16; Gran: 0.56 0.17; Infra: 0.43 0.16; Fig. 4C,D). Infra layershad STRFs with the most divergent STRFs (Supra vs Gran: p �0.19; Supra vs Infra: p � 0.0002; Gran vs Infra: p � 0.001, rank-sum tests). The magnitude of the values, however, indicated thatthe excitatory and inhibitory subfield structures were correlated(cf. Fig. 4C,D and A for a similar correlation value). Therefore, atthe smallest spatial scales, nearby neurons have globally similarSTRFs in all layers, with the most similar STRFs in the Gran andSupra layers.
We also investigated whether high STRF similarities were seenfor cell-type pairs. We found that FSU-FSU pairs had the mostsimilar STRFs and that FSU-RSU and RSU-RSU pairs had nearlyequivalent distributions (FSU-RSU: 0.51 0.15; RSU-RSU:0.49 0.18; FSU-FSU: 0.68 0.11; FSU-RSU vs RSU-RSU: p �0.20; FSU-RSU vs FSU-FSU: p � 0.018; RSU-RSU vs FSU-FSU:p � 0.01, rank-sum tests; Fig. 4E,F). When we compared STRFsimilarity with correlation strength, we found weak trends. STRFsimilarity for FSU-RSU and FSU-FSU pairs was not significantlycorrelated with correlation strength (FSU-RSU: r � 0.106, p �0.33; FSU-FSU: r � �0.064, p � 0.8), but RSU-RSU pairs hadSTRFs that were slightly more similar as the correlation strengthincreased (RSU-RSU: r � 0.196, p � 0.001). We also estimatedSTRF similarity by shifting the STRFs so that the peak latencieswere aligned (Chen et al., 2012). STRF similarities with and with-out this shift were not statistically different (p � 0.25, rank-sumtest), most likely because pairs of neighboring neurons have la-tencies that differ by only 1–3 ms. Different cell types throughoutlocal regions of cortex have similar but not identical STRFs.
BF, spectral tuning, and latency across layersFor nearby neurons, how similar are basic receptive field param-eters? The microarchitecture of AI provides a substrate that isused to organize basic receptive field parameters. If the most basicparameters are disorganized, then, despite synchronous activity,subnetworks are likely to represent these parameters in a disor-ganized manner. Three basic processing parameters were ob-tained from the STRF: BF, spectral tuning (Q), and latency.
The parameters were similar for the neurons in a pair. Acrossthe population of pairs, BF was highly similar (Fig. 5A) across allfrequency ranges, indicating low BF variance at fine scalesthroughout AI. BF differences between neurons were minor andwere almost entirely �0.1 oct (0.044 0.097 oct; median median absolute deviation [MAD]: 0.020 0.020 oct; Fig. 5D).These minor differences were recapitulated across the corticallayers, with pairs in all layers having similar BFs. We observed thesmallest differences in supragranular layers and slightly largerdifferences in infragranular layers, but the laminar distributionswere not significantly different (Fig. 5G).
We then examined the frequency selectivity of each neuron,which is described by spectral tuning (defined as Q; Schreiner,1991). Spectral tuning displayed modest agreement, indicatingeither nonidentical spectral integration or the effective conver-gence of neurons with similar frequency selectivity within localsubnetworks (Fig. 5B). The tuning differences were usuallywithin a factor of 1/3 (0.41 0.39 oct; median MAD: 0.31 0.21 oct; Fig. 5E). We observed the largest differences for pairs ininfragranular layers, and smaller differences in granular and su-pragranular layers (Fig. 5H).
Last, the latency of the response, as determined from the peakin the STRF, was highly similar for pairs (Fig. 5C). Latency dif-ferences were usually within a few milliseconds (2.25 2.37 ms;median MAD: 1.50 1.00 ms; Fig. 5F), with the smallestdifferences in granular layers and the largest in infragranular lay-ers (Fig. 5I). Therefore, within fine-scale AI networks, in all lay-ers, BF is highly conserved and spectral tuning and latency aremoderately conserved.
BF, spectral tuning, and latency for cell type pairsAre basic receptive field parameters similar for cell-type pairs?Having identified FSUs and RSUs, we then compared receptivefield parameters for the different cell type pairs. BFs were highlycorrelated for FSU-RSU pairs, as were the BFs for RSU-RSU and
Nor
mal
ized
Am
plitu
de
Unit 1 Unit 2
Time (ms) Time (ms) Time (ms)
−1 0 1 2−1
0
11250 µm 2.4 Hz
0 1006.25
12.5
251250 µm 3.5 Hz
0 10050 50
−1 0 1 2−1
0
11996 µm 1.9 Hz
0 1006.25
12.5
251996 µm 10.9 Hz
0 10050 50
Freq
uenc
y (k
Hz)
−1 0 1 2−1
0
11102 µm 2.0 Hz
0 1006.25
12.5
251102 µm 13.3 Hz
0 10050 50
−1 0 1 2−1
0
11085 µm 1.7 Hz
0 100
20
1085 µm 1.9 Hz
0 10010
40
5050
−1 0 1 2−1
0
1
535 µm 3.9 Hz
0 100
20
535 µm 12.8 Hz
0 100
12
40
1050 50
−1 0 1 2−1
0
1
848 µm 3.2 Hz
0 50 100 150
8
16848 µm 1.4 Hz
0 50 100 150
6.25
12.5
25
6.25
12.5
25
6.25
12.5
25
20
40
10
20
10
40
8
16
44
A
B
C
D
E
F
Figure 3. Example waveforms and STRFs. A–F, Each row represents two neurons recordedfrom the same electrode channel. Left: Example neuron spike waveforms. Middle and Right:STRFs corresponding to the spike waveforms. Depth of recording site and the average firing rateof each neuron are indicated above the STRF.
18508 • J. Neurosci., November 20, 2013 • 33(47):18503–18514 Atencio and Schreiner • Synchronous Subnetworks in AI
FSU-FSU pairs (FSU-RSU r � 0.992; p � 0.001; RSU-RSU r �0.960, p � 0.001; FSU-FSU r � 0.690, p � 0.058, t tests; Fig.6A,D,G). Spectral tuning was slightly broader for FSUs com-pared with their RSU partners, whereas it was equally matchedfor RSU-RSU and FSU-FSU pairs (FSU-RSU pairs: FSU Q:2.81 1.31, RSU Q: 3.21 1.45; p � 0.044, t test; Fig. 6B,E,H).Last, for FSU-RSU pairs, latency was slightly shorter for FSUs.For the other pair types, latency was similar (FSU-RSU pairs: FSUlatency: 12.83 2.95 ms, RSU latency: 13.71 3.34 ms; p �0.043, t test; Fig. 6C,F, I). These results provide an internal con-trol for our data, because earlier reports also noted that FSUs havebroader receptive fields and shorter latencies (Atencio andSchreiner, 2008; Wu et al., 2008).
Receptive field parameter differences between neurons withineach cell type pair were generally minor. BF difference was small-est for FSU-RSU pairs (0.04 0.05 oct), and only FSU-FSU pairs
(0.10 0.27 oct) were significantly differ-ent from FSU-RSU and RSU-RSU pairs(0.05 0.12 oct). Spectral tuning differ-ences were largest for FSU-RSU pairs(0.46 0.45 oct), which is indicative ofthe broader tuning that has been observedfor FSUs. Last, STRF peak latencies werehighly similar between the cell-type pairs,with the smallest differences betweenneighboring FSUs (1.38 0.79 ms). To-gether, these results show that, within lo-cal subnetworks, BF is highly conservedregardless of neuron class and, for FSU-RSU pairs, FSUs have broader spectraltuning and shorter latencies.
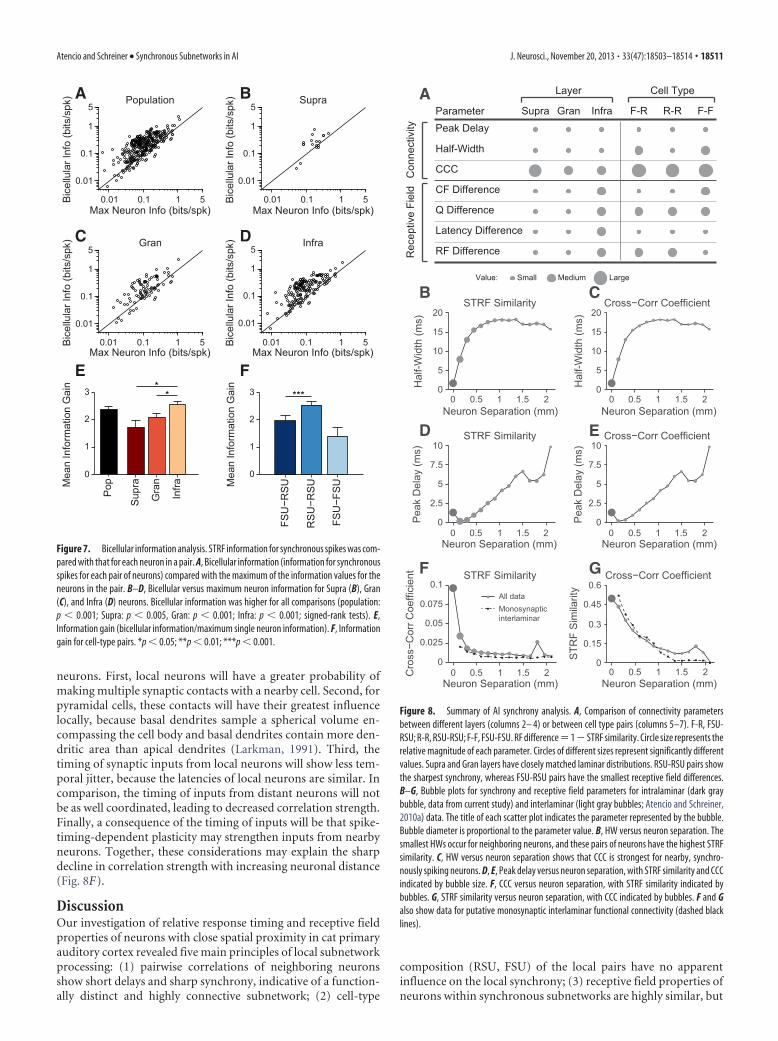
Information gain in local subnetworksNeighboring neurons exhibit sharp syn-chrony in auditory cortex. Do synchronousspikes signal more information about thestimulus than nonsynchronous spikes? Weaddressed this by estimating the informa-tion that is conveyed by synchronous spikes.First, we estimated the information con-veyed by each of the constituent STRFs. Wenext obtained a bicellular spike train, whichconsisted of the spikes in the peak of thecross-covariance function. We estimated anSTRF for these synchronous spikes and cal-culated the information conveyed by the bi-cellular STRF, as well as the information forthe original STRFs for each neuron in thepair. All information values were correctedfor the number of spikes, because there werefewer spikes in the bicellular spike train thanin either of the two constituent spike trains.To assess potential synchrony-based infor-mation gains, we compared the maximumof the information values of the two individ-ual neurons in a pair with the informationfrom the bicellular spikes (Fig. 7). Over thepopulation, the bicellular information wassignificantly higher than for the single neu-ron information (p � 0.001, signed-ranktest; Fig. 7A). This result was recapitulatedacross all layers (Supra: p�0.005; Gran: p�0.001; Infra: p � 0.001, signed-rank tests;
Fig. 7B–D), indicating that the synchronous spikes carried moreinformation than the spikes that were not synchronized.
The information gain of the synchronized spikes can be esti-mated using the ratio of the bicellular information compared withthe maximum single neuron information. The information gain forbicellular spikes was approximately double that of the nonsynchro-nized spikes (population: 2.4 0.1 bits/spike, mean SE; Fig. 7E).The lowest gain was seen in Supra layers and the highest was seen inInfra layers (Supra: 1.7 0.3; Gran: 2.1 0.2; Infra: 2.5 0.1bits/spike, mean SE; Supra vs Infra: p � 0.029; Gran vs Infra: p �0.018, rank-sum tests; Fig. 7E). Further, information gains were seenfor different cell types, with the highest gains for RSU-RSU pairs(FSU-RSU: 1.96 0.19; RSU-RSU: 2.54 0.12; FSU-FSU: 1.41 0.31 bits/spike, mean SE; FSU-RSU vs RSU-RSU: p � 0.0084,rank-sum test; Fig. 7F). These pairs had higher gains than FSU-RSUpairs, but all pairs had gains �1.
0 0.2 0.4 0.6 0.8 10
0.1
0.2
0.3
STRF Similarity
Pro
porti
on
STRF Similarity = 0.45 STRF Similarity = 0.87
Neuron 1 Neuron 2 Neuron 1 Neuron 2A
C
0
0.2
0.4
0.6
Mea
n Si
mila
rity
D
Supr
a
Gra
n
Infra
B
0 0.2 0.4 0.6 0.8 1
FSU−RSU
RSU−RSU
STRF Similarity
E
0
0.2
0.4
0.6
0.8
FSU
−FSU
FSU
−RSU
RSU
−RSU
Mea
n Si
mila
rity
F
0
0.06
0.12
0.18
0.24
Pro
porti
on
SupraGranInfra
Population ******
**
Figure 4. STRF similarity for pairs of neurons. A, B, STRFs and STRF similarity for two example pairs of neurons. In A, the STRFsare moderately correlated, whereas in B, the STRFs are highly correlated. C, Population and laminar distributions of STRF similar-ities. D, Mean STRF similarities across layers. E, STRF similarity distributions for cell type pairs. F, Mean STRF similarity for cell typepairs. *p � 0.05; **p � 0.01; ***p � 0.001.
Atencio and Schreiner • Synchronous Subnetworks in AI J. Neurosci., November 20, 2013 • 33(47):18503–18514 • 18509
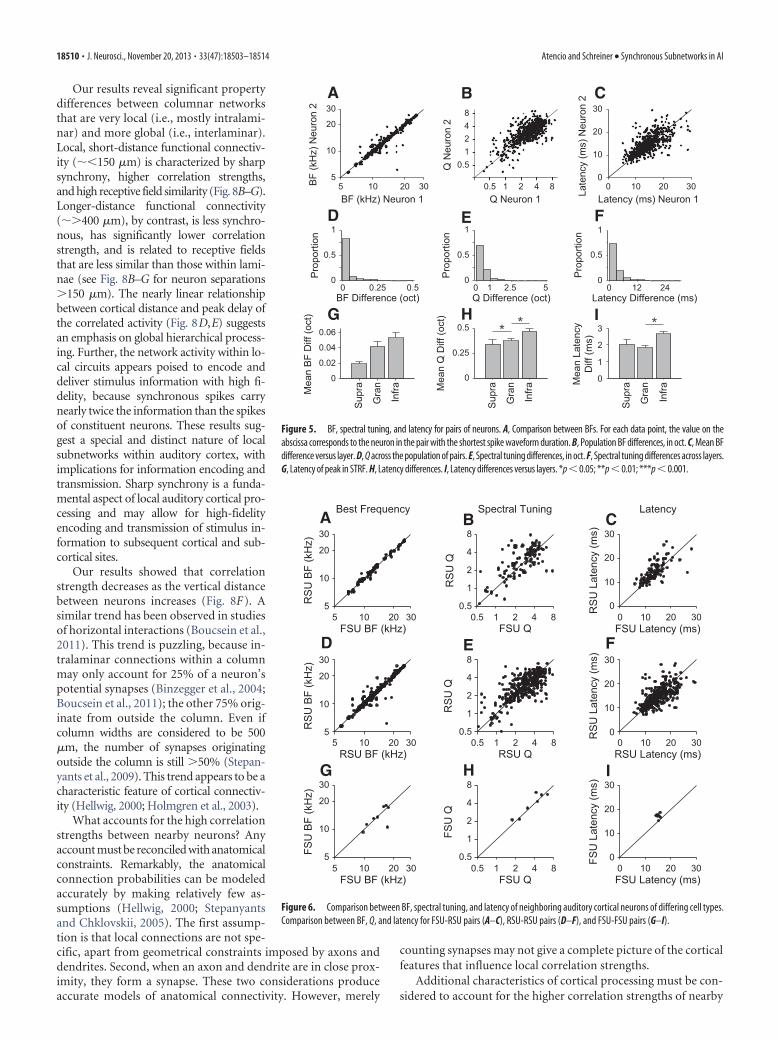
Our results reveal significant propertydifferences between columnar networksthat are very local (i.e., mostly intralami-nar) and more global (i.e., interlaminar).Local, short-distance functional connectiv-ity (��150 �m) is characterized by sharpsynchrony, higher correlation strengths,and high receptive field similarity (Fig. 8B–G).Longer-distance functional connectivity(��400 �m), by contrast, is less synchro-nous, has significantly lower correlationstrength, and is related to receptive fieldsthat are less similar than those within lami-nae (see Fig. 8B–G for neuron separations�150 �m). The nearly linear relationshipbetween cortical distance and peak delay ofthe correlated activity (Fig. 8D,E) suggestsan emphasis on global hierarchical process-ing. Further, the network activity within lo-cal circuits appears poised to encode anddeliver stimulus information with high fi-delity, because synchronous spikes carrynearly twice the information than the spikesof constituent neurons. These results sug-gest a special and distinct nature of localsubnetworks within auditory cortex, withimplications for information encoding andtransmission. Sharp synchrony is a funda-mental aspect of local auditory cortical pro-cessing and may allow for high-fidelityencoding and transmission of stimulus in-formation to subsequent cortical and sub-cortical sites.
Our results showed that correlationstrength decreases as the vertical distancebetween neurons increases (Fig. 8F). Asimilar trend has been observed in studiesof horizontal interactions (Boucsein et al.,2011). This trend is puzzling, because in-tralaminar connections within a columnmay only account for 25% of a neuron’spotential synapses (Binzegger et al., 2004;Boucsein et al., 2011); the other 75% orig-inate from outside the column. Even ifcolumn widths are considered to be 500�m, the number of synapses originatingoutside the column is still �50% (Stepan-yants et al., 2009). This trend appears to be acharacteristic feature of cortical connectiv-ity (Hellwig, 2000; Holmgren et al., 2003).
What accounts for the high correlationstrengths between nearby neurons? Anyaccount must be reconciled with anatomicalconstraints. Remarkably, the anatomicalconnection probabilities can be modeledaccurately by making relatively few as-sumptions (Hellwig, 2000; Stepanyantsand Chklovskii, 2005). The first assump-tion is that local connections are not spe-cific, apart from geometrical constraints imposed by axons anddendrites. Second, when an axon and dendrite are in close prox-imity, they form a synapse. These two considerations produceaccurate models of anatomical connectivity. However, merely
counting synapses may not give a complete picture of the corticalfeatures that influence local correlation strengths.
Additional characteristics of cortical processing must be con-sidered to account for the higher correlation strengths of nearby
0 0.25 0.50
0.5
1
Pro
porti
onBF Difference (oct)
Sup
ra
Gra
n
Infra
0
0.02
0.04
0.06
Mea
n B
F D
iff (o
ct)
0 1 2.5 50
0.5
1
Pro
porti
on
Q Difference (oct)
Sup
ra
Gra
n
Infra
0
0.25
0.5
Mea
n Q
Diff
(oct
)
0 12 240
0.5
1
Pro
porti
on
Latency Difference (ms)
Sup
ra
Gra
n
Infra
0
1
2
3
Mea
n La
tenc
yD
iff (m
s)
D
G
E
H
F
I
5 10 20 305
10
20
30
BF (kHz) Neuron 1
BF
(kH
z) N
euro
n 2
0.5 1 2 4 8
0.51248
Q Neuron 1
Q
Neu
ron
2
0 10 20 300
10
20
30
Latency (ms) Neuron 1 Late
ncy
(ms)
Neu
ron
2 A B C
** *
Figure 5. BF, spectral tuning, and latency for pairs of neurons. A, Comparison between BFs. For each data point, the value on theabscissa corresponds to the neuron in the pair with the shortest spike waveform duration. B, Population BF differences, in oct. C, Mean BFdifference versus layer. D, Q across the population of pairs. E, Spectral tuning differences, in oct. F, Spectral tuning differences across layers.G, Latency of peak in STRF. H, Latency differences. I, Latency differences versus layers. *p � 0.05; **p � 0.01; ***p � 0.001.
D
G
E
H
F
I
A B C
5 10 20 305
10
20
30
FSU BF (kHz)
RS
U B
F (k
Hz)
5 10 20 305
10
20
30
RSU BF (kHz)
RS
U B
F (k
Hz)
5 10 20 305
10
20
30
FSU BF (kHz)
FSU
BF
(kH
z)
0.5 1 2 4 80.5
1
2
4
8
FSU Q
RS
U Q
0.5 1 2 4 80.5
1
2
4
8
RSU Q
RS
U Q
0.5 1 2 4 80.5
1
2
4
8
FSU Q
FSU
Q
0 10 20 300
10
20
30
FSU Latency (ms)
RS
U L
aten
cy (m
s)
0 10 20 300
10
20
30
RSU Latency (ms)
RS
U L
aten
cy (m
s)
0 10 20 300
10
20
30
FSU Latency (ms)
FSU
Lat
ency
(ms)
Best Frequency Spectral Tuning Latency
Figure 6. Comparison between BF, spectral tuning, and latency of neighboring auditory cortical neurons of differing cell types.Comparison between BF, Q, and latency for FSU-RSU pairs (A–C), RSU-RSU pairs (D–F), and FSU-FSU pairs (G–I).
18510 • J. Neurosci., November 20, 2013 • 33(47):18503–18514 Atencio and Schreiner • Synchronous Subnetworks in AI
neurons. First, local neurons will have a greater probability ofmaking multiple synaptic contacts with a nearby cell. Second, forpyramidal cells, these contacts will have their greatest influencelocally, because basal dendrites sample a spherical volume en-compassing the cell body and basal dendrites contain more den-dritic area than apical dendrites (Larkman, 1991). Third, thetiming of synaptic inputs from local neurons will show less tem-poral jitter, because the latencies of local neurons are similar. Incomparison, the timing of inputs from distant neurons will notbe as well coordinated, leading to decreased correlation strength.Finally, a consequence of the timing of inputs will be that spike-timing-dependent plasticity may strengthen inputs from nearbyneurons. Together, these considerations may explain the sharpdecline in correlation strength with increasing neuronal distance(Fig. 8F).
DiscussionOur investigation of relative response timing and receptive fieldproperties of neurons with close spatial proximity in cat primaryauditory cortex revealed five main principles of local subnetworkprocessing: (1) pairwise correlations of neighboring neuronsshow short delays and sharp synchrony, indicative of a function-ally distinct and highly connective subnetwork; (2) cell-type
composition (RSU, FSU) of the local pairs have no apparentinfluence on the local synchrony; (3) receptive field properties ofneurons within synchronous subnetworks are highly similar, but
0.01 0.1 1 5
0.01
0.1
1
5
Bic
ellu
lar I
nfo
(bits
/spk
)
0.01 0.1 1 5
0.01
0.1
1
5
Bic
ellu
lar I
nfo
(bits
/spk
)
0.01 0.1 1 5
0.01
0.1
1
5
Max Neuron Info (bits/spk)
Bic
ellu
lar I
nfo
(bits
/spk
)
0.01 0.1 1 5
0.01
0.1
1
5
Max Neuron Info (bits/spk)
Bic
ellu
lar I
nfo
(bits
/spk
)
0
3
Sup
ra
Gra
n
Infra
0
3
FSU
−RS
U
RS
U−R
SU
FSU
−FS
UMea
n In
form
atio
n G
ain
Population Supra
Gran Infra
A B
C D
E F
Mea
n In
form
atio
n G
ain
Max Neuron Info (bits/spk) Max Neuron Info (bits/spk)
2
1
2
1
Pop
**
***
Figure 7. Bicellular information analysis. STRF information for synchronous spikes was com-pared with that for each neuron in a pair. A, Bicellular information (information for synchronousspikes for each pair of neurons) compared with the maximum of the information values for theneurons in the pair. B–D, Bicellular versus maximum neuron information for Supra (B), Gran(C), and Infra (D) neurons. Bicellular information was higher for all comparisons (population:p � 0.001; Supra: p � 0.005, Gran: p � 0.001; Infra: p � 0.001; signed-rank tests). E,Information gain (bicellular information/maximum single neuron information). F, Informationgain for cell-type pairs. *p � 0.05; **p � 0.01; ***p � 0.001.
0
5
10
15
20
Neuron Separation (mm)H
alf-W
idth
(ms)
STRF Similarity
0
5
10
15
20
Neuron Separation (mm)
Hal
f-Wid
th (m
s)
Cross−Corr Coefficient
0
2.5
5
7.5
10
Neuron Separation (mm)
Pea
k D
elay
(ms)
STRF Similarity
0
2.5
5
7.5
10
Neuron Separation (mm)
Pea
k D
elay
(ms)
Cross−Corr Coefficient
0
0.025
0.05
0.075
0.1
Cro
ss−C
orr C
oeffi
cien
t
Neuron Separation (mm)
STRF Similarity
0
0.15
0.3
0.45
0.6S
TRF
Sim
ilarit
y
Neuron Separation (mm)
Cross−Corr Coefficient
RF Difference
Parameter
Small Medium LargeValue:
Peak DelaySupra Gran Infra
Half-Width
CCC
CF Difference
Q Difference
Latency Difference
Con
nect
ivity
Rec
eptiv
e Fi
eld
F-R R-R F-F
Cell TypeLayerA
B C
D E
F G
All dataMonosynapticinterlaminar
0 0.5 1 1.5 2
0 0.5 1 1.5 2
0 0.5 1 1.5 2
0 0.5 1 1.5 2
0 0.5 1 1.5 20 0.5 1 1.5 2
Figure 8. Summary of AI synchrony analysis. A, Comparison of connectivity parametersbetween different layers (columns 2– 4) or between cell type pairs (columns 5–7). F-R, FSU-RSU; R-R, RSU-RSU; F-F, FSU-FSU. RF difference�1�STRF similarity. Circle size represents therelative magnitude of each parameter. Circles of different sizes represent significantly differentvalues. Supra and Gran layers have closely matched laminar distributions. RSU-RSU pairs showthe sharpest synchrony, whereas FSU-RSU pairs have the smallest receptive field differences.B–G, Bubble plots for synchrony and receptive field parameters for intralaminar (dark graybubble, data from current study) and interlaminar (light gray bubbles; Atencio and Schreiner,2010a) data. The title of each scatter plot indicates the parameter represented by the bubble.Bubble diameter is proportional to the parameter value. B, HW versus neuron separation. Thesmallest HWs occur for neighboring neurons, and these pairs of neurons have the highest STRFsimilarity. C, HW versus neuron separation shows that CCC is strongest for nearby, synchro-nously spiking neurons. D, E, Peak delay versus neuron separation, with STRF similarity and CCCindicated by bubble size. F, CCC versus neuron separation, with STRF similarity indicated bybubbles. G, STRF similarity versus neuron separation, with CCC indicated by bubbles. F and Galso show data for putative monosynaptic interlaminar functional connectivity (dashed blacklines).
Atencio and Schreiner • Synchronous Subnetworks in AI J. Neurosci., November 20, 2013 • 33(47):18503–18514 • 18511
not identical in all aspects, indicating that local neurons can per-form different processing and that joint signaling may provide amore specific and powerful local network output; (4) local, cell-type specific synchrony did not vary from layer to layer, but re-vealed a slightly higher synchrony in supragranular layers, sosharp synchrony is a general and defining characteristic of localcortical subcircuits within layers, in contrast to less synchronousinterlaminar processing; and (5) synchronous spikes carry abouttwice the stimulus information of nonsynchronous spikes, indi-cating enhanced information processing compared with nonsyn-chronized events.
Previous studies in somatosensory cortex have shown thatpairs of inhibitory neurons exhibit sharp firing synchrony (Swad-low et al., 1998; Hu et al., 2011). Whether they are electrically orchemically linked, inhibitory neurons fire in close concert inmany sensory systems (Galarreta and Hestrin, 2002). We haveshown that not only is this a feature of neighboring inhibitoryneurons, but it also occurs for neighboring excitatory neuronsand excitatory/inhibitory pairs in auditory cortex.
Synchrony in auditory cortex was characterized by very tightcovariance functions that had peaks at delays �4 ms indicative ofmonosynaptic functional connectivity or tight, concerted, com-mon input. Although we cannot unambiguously determine ana-tomical connectivity, our results are consistent with findings thatnearby neurons are highly interconnected (Holmgren et al., 2003;Fino and Yuste, 2011). This strong nearby connectivity was re-flected in our data in the correlation strength between neuronswith a cross-correlation coefficient that was on average �0.07.This intralaminar value is higher than the strengths for interlami-nar correlation (Atencio and Schreiner, 2010a). Further, the cor-relation strength estimates are necessarily conservative andtherefore have lower bounds due to the difficulties with unam-biguously identifying action potentials from multiple neurons onthe same electrode channel. Therefore, nearby AI neurons exhibitintralaminar functional connectivity that is markedly strongerthan correlations between layers.
The synchrony we observed was present in layers 2 to 6 ofauditory cortex and for all cell-type pairs, indicating preservedlocal processing principles. Synchrony and receptive field simi-larity of neighboring neurons was greatest in supragranular andgranular layers and less so in infragranular layers. Therefore, su-pragranular layers may be capable of the most precise relativespike timing, enabling a more faithful projection of stimuluscharacteristics through their firing patterns. This may be a func-tional consequence of corticocortical connectivity patterns,which are dominated by remarkably precise and topographic su-pragranular projections (Lee and Winer, 2005). In contrast, in-fragranular pairs showed greater variability in response timingand receptive field properties but also conveyed the most infor-mation per synchronous spike. Layers 5 and 6 have the mostheterogeneous connectivity patterns, projecting to cortical aswell as thalamic, midbrain, and brainstem targets (Prieto andWiner, 1999; Winer and Prieto, 2001). The more diverse syn-chrony in infragranular layers may be a consequence of this di-versity in projection targets (Mitani et al., 1985).
The synchrony for RSU-RSU pairs was higher than for theother cell-type pairs. Previously, it was noted that both electricaland chemical synapses lead to cortical synchrony betweeninhibitory-inhibitory pairs (Galarreta and Hestrin, 2002; Hu etal., 2011). Our results generalize these findings to other pairs ofcell types that are connected through chemical synapses. There-fore, in auditory cortex, proximity is the greatest predictor ofsynchrony; cell type does not appear to be the main determining
factor. Further, synchrony appears as a consequence of wiringpatterns, with neighboring neurons more likely to be wired to-gether, consistent with the view that connectivity is determinedby the structure of local circuits and less so by microinfluencessuch as the composition of channels in a neuron (Hill et al.,2012).
Functional processingSharply synchronous firing of neighboring neurons was also in-dicative of similar receptive field properties. BF of neighboringneurons was highly conserved (BF �0.1 oct). The smallest BFdifferences were in supragranular layers, but overall the meanlayer differences were small. This indicates that in the cat AIcircuit, wiring is prioritized to conserve tonotopy. Other second-ary parameters, such as spectral tuning and latency, were similar,but not to the same extent as BF. Consistent with earlier work incats and guinea pigs, spectral tuning became less sharp in deeperlayers, indicating broader frequency integration (Volkov andGalaziuk, 1989; Wallace and Palmer, 2008).
Extrinsic and intrinsic correlation influencesSynchronous firing may be a consequence of extrinsic and intrin-sic influences. A possible significant extrinsic factor is stimuluscorrelations. When the correlations in the stimulus occur at thesame timescale as those in the covariance function, it is difficult todiscern whether functional connectivity is driven by stimulus oranatomical considerations. The dynamic ripple stimulus that weused had a maximum temporal modulation rate of 40 Hz, or aperiod of 25 ms. Synchronization of firing to the modulations inthe stimulus would be expected to be maximal at the rising phaseof the stimulus (i.e., �6.25 ms at 40 Hz). Because cross-covariance functions had widths that were often �2 ms, stimuluscorrelations were not the main determinant of functional con-nectivity. Therefore, modulations in the stimulus are not ex-pected to be the major determinant of functional connectivity.Furthermore, in this report and previously, we did not find evi-dence of significant stimulus synchronization when we estimatedshift predictors. Finally, tightly aligned common input may alsocontribute functional connectivity, but this input would have tobe more precise than the temporal features of the stimulus. Thefunctional connectivity in the present study is unlikely to be dom-inated by stimulus driven influences (Atencio and Schreiner,2010a).
Fluctuations in local field potentials (LFPs) may also influenceneural spiking. LFP fluctuations occur over large cortical dis-tances and may influence the joint firing of neurons throughephaptic coupling (Anastassiou et al., 2011). In ephaptic cou-pling, spiking probability occurs at specific phases of the LFP.However, ephaptic coupling is unlikely to cause the sharp syn-chrony we report. First, the DMR stimulus that we used desyn-chronizes the thalamocortical circuit (Miller and Schreiner,2000). Second, ephaptic coupling acts over larger cortical dis-tances. However, we found that within the same cortical column,intralaminar synchrony was markedly different from interlami-nar functional connectivity. Third, ephaptic coupling acts overmultiple milliseconds. However, the synchrony we observed isbased on a subset of spikes that occur with submillisecond preci-sion. These considerations make it unlikely that ephaptic cou-pling was a significant causal factor of the observed sharpsynchrony.
Internal and external controls on our correlation analysis sup-port the conclusion that the functional connectivity is related tointrinsic circuit properties. First, in a previous study, we esti-
18512 • J. Neurosci., November 20, 2013 • 33(47):18503–18514 Atencio and Schreiner • Synchronous Subnetworks in AI
mated the relationship of the distance between neurons in a col-umn and the peak delay in cross-covariance functions. Greaterseparations are expected to result in longer peak delays becausean increase in synapse number and conduction distance will cor-respond to an increase in signal travel time. We found that therelationship between distance and peak delay corresponded to apropagation time of 0.22 m/s within a column, which was similarto the propagation time found in slice (0.26 0.05 m/s; Kubotaet al., 1997; Atencio and Schreiner, 2010a). The similarity be-tween the value that we obtained and the value from an indepen-dent and completely different preparation indicate that ourcross-covariance functions are capable of capturing significantaspects of cortical anatomical connectivity. Second, our data andanatomical considerations reveal similar connection probabili-ties. We found that 535 of 670 pairs had significant functionalconnectivity (connection probability of 0.843). This comparesfavorably to estimates of connection probability from anatomicalconsiderations (0.864; Braitenberg and Schuz, 1998). Therefore,the functional connectivity that we measured may be a reasonablereflection of the anatomical connectivity within local AI circuits.
In total, our results show that intralaminar local subnetworkscontain neurons that fire synchronously and these synchronousspikes convey, on average, significantly more information aboutthe stimulus than nonsynchronous spikes, which is indicative oftheir higher encoding fidelity.
ReferencesAgmon A (2012) A novel, jitter-based method for detecting and measuring
spike synchrony and quantifying temporal firing precision. Neural SystCircuits 2:5. CrossRef Medline
Anastassiou CA, Perin R, Markram H, Koch C (2011) Ephaptic coupling ofcortical neurons. Nat Neurosci 14:217–223. CrossRef Medline
Atencio CA, Schreiner CE (2008) Spectrotemporal processing differencesbetween auditory cortical fast-spiking and regular-spiking neurons.J Neurosci 28:3897–3910. CrossRef Medline
Atencio CA, Schreiner CE (2010a) Columnar connectivity and laminar pro-cessing in cat primary auditory cortex. PLoS One 5:e9521. CrossRefMedline
Atencio CA, Schreiner CE (2010b) Laminar diversity of dynamic soundprocessing in cat primary auditory cortex. J Neurophysiol 103:192–205.CrossRef Medline
Atencio CA, Sharpee TO, Schreiner CE (2008) Cooperative nonlinearitiesin auditory cortical neurons. Neuron 58:956 –966. CrossRef Medline
Atencio CA, Sharpee TO, Schreiner CE (2009) Hierarchical computation inthe canonical auditory cortical circuit. Proc Natl Acad Sci U S A 106:21894 –21899. CrossRef Medline
Bandyopadhyay S, Shamma SA, Kanold PO (2010) Dichotomy of func-tional organization in the mouse auditory cortex. Nat Neurosci 13:361–368. CrossRef Medline
Bannister AP, Thomson AM (2007) Dynamic properties of excitatory syn-aptic connections involving layer 4 pyramidal cells in adult rat and catneocortex. Cereb Cortex 17:2190 –2203. CrossRef Medline
Binzegger T, Douglas RJ, Martin KA (2004) A quantitative map of the cir-cuit of cat primary visual cortex. J Neurosci 24:8441– 8453. CrossRefMedline
Blomquist P, Devor A, Indahl UG, Ulbert I, Einevoll GT, Dale AM (2009)Estimation of thalamocortical and intracortical network models fromjoint thalamic single-electrode and cortical laminar-electrode recordingsin the rat barrel system. PLoS Comput Biol 5:e1000328. CrossRef Medline
Boucsein C, Nawrot MP, Schnepel P, Aertsen A (2011) Beyond the corticalcolumn: abundance and physiology of horizontal connections imply astrong role for inputs from the surround. Front Neurosci 5:32. CrossRefMedline
Braitenberg V, Schuz A (1998) Cortex: statistics and geometry of neuronalconnectivity, Ed 2. New York: Springer.
Brosch M, Schreiner CE (1999) Correlations between neural discharges arerelated to receptive field properties in cat primary auditory cortex. EurJ Neurosci 11:3517–3530. CrossRef Medline
Bruno RM, Simons DJ (2002) Feedforward mechanisms of excitatory andinhibitory cortical receptive fields. J Neurosci 22:10966 –10975. Medline
Chen C, Read HL, Escabí MA (2012) Precise feature based time scales andfrequency decorrelation lead to a sparse auditory code. J Neurosci 32:8454 – 8468. CrossRef Medline
Douglas RJ, Martin KA (2004) Neuronal circuits of the neocortex. AnnuRev Neurosci 27:419 – 451. CrossRef Medline
Eggermont JJ (1992) Neural interaction in cat primary auditory cortex. De-pendence on recording depth, electrode separation, and age. J Neuro-physiol 68:1216 –1228. Medline
Eggermont JJ (2000) Sound-induced synchronization of neural activity be-tween and within three auditory cortical areas. J Neurophysiol 83:2708 –2722. Medline
Escabi MA, Schreiner CE (2002) Nonlinear spectrotemporal sound analysisby neurons in the auditory midbrain. J Neurosci 22:4114 – 4131. Medline
Fino E, Yuste R (2011) Dense inhibitory connectivity in neocortex. Neuron69:1188 –1203. CrossRef Medline
Galarreta M, Hestrin S (1999) A network of fast-spiking cells in the neocor-tex connected by electrical synapses. Nature 402:72–75. CrossRef Medline
Galarreta M, Hestrin S (2002) Electrical and chemical synapses among parv-albumin fast-spiking GABAergic interneurons in adult mouse neocortex.Proc Natl Acad Sci U S A 99:12438 –12443. CrossRef Medline
Gibson JR, Beierlein M, Connors BW (1999) Two networks of electricallycoupled inhibitory neurons in neocortex. Nature 402:75–79. CrossRefMedline
Halliday DM, Rosenberg JR (1999) Time and frequency domain analysis ofspike train and time series data. In: Modern techniques in neuroscienceresearch (Windhorst U, Johansson H, eds), pp 503–543. New York:Springer.
Hellwig B (2000) A quantitative analysis of the local connectivity betweenpyramidal neurons in layers 2/3 of the rat visual cortex. Biol Cybern82:111–121. CrossRef Medline
Hill SL, Wang Y, Riachi I, Schurmann F, Markram H (2012) Statistical con-nectivity provides a sufficient foundation for specific functional connec-tivity in neocortical neural microcircuits. Proc Natl Acad Sci U S A 109:E2885–2894. CrossRef Medline
Holmgren C, Harkany T, Svennenfors B, Zilberter Y (2003) Pyramidal cellcommunication within local networks in layer 2/3 of rat neocortex.J Physiol 551:139 –153. CrossRef Medline
Hu H, Ma Y, Agmon A (2011) Submillisecond firing synchrony betweendifferent subtypes of cortical interneurons connected chemically but notelectrically. J Neurosci 31:3351–3361. CrossRef Medline
Imaizumi K, Schreiner CE (2007) Spatial interaction between spectral inte-gration and frequency gradient in primary auditory cortex. J Neuro-physiol 98:2933–2942. CrossRef Medline
Kawaguchi Y, Kubota Y (1993) Correlation of physiological subgroupings ofnonpyramidal cells with parvalbumin- and calbindinD28k-immunoreactiveneurons in layer V of rat frontal cortex. J Neurophysiol 70:387–396. Medline
Kawaguchi Y, Kubota Y (1997) GABAergic cell subtypes and their synapticconnections in rat frontal cortex. Cereb Cortex 7:476 – 486. CrossRefMedline
Kubota M, Sugimoto S, Horikawa J, Nasu M, Taniguchi I (1997) Opticalimaging of dynamic horizontal spread of excitation in rat auditory cortexslices. Neurosci Lett 237:77– 80. CrossRef Medline
Larkman AU (1991) Dendritic morphology of pyramidal neurones of thevisual cortex of the rat: I. Branching patterns. J Comp Neurol 306:307–319. CrossRef Medline
Lee CC, Winer JA (2005) Principles governing auditory cortex connections.Cereb Cortex 15:1804 –1814. CrossRef Medline
Lewicki MS (1994) Bayesian modeling and classification of neural signals.Neural Comput 6:1005–1030. CrossRef
Lewicki MS (1998) A review of methods for spike sorting: the detection andclassification of neural action potentials. Network 9:R53–78. CrossRefMedline
Markram H, Toledo-Rodriguez M, Wang Y, Gupta A, Silberberg G, Wu C(2004) Interneurons of the neocortical inhibitory system. Nat Rev Neu-rosci 5:793– 807. CrossRef Medline
Miller LM, Schreiner CE (2000) Stimulus-based state control in thethalamocortical system. J Neurosci 20:7011–7016. Medline
Mitani A, Shimokouchi M, Itoh K, Nomura S, Kudo M, Mizuno N (1985)Morphology and laminar organization of electrophysiologically identi-
Atencio and Schreiner • Synchronous Subnetworks in AI J. Neurosci., November 20, 2013 • 33(47):18503–18514 • 18513
fied neurons in the primary auditory cortex in the cat. J Comp Neurol235:430 – 447. CrossRef Medline
Molotchnikoff S, Gillet PC, Shumikhina S, Bouchard M (2007) Spatial fre-quency characteristics of nearby neurons in cats’ visual cortex. NeurosciLett 418:242–247. CrossRef Medline
Otsuka T, Kawaguchi Y (2009) Cortical inhibitory cell types differentiallyform intralaminar and interlaminar subnetworks with excitatory neu-rons. J Neurosci 29:10533–10540. CrossRef Medline
Packer AM, Yuste R (2011) Dense, unspecific connectivity of neocorticalparvalbumin-positive interneurons: a canonical microcircuit for inhibi-tion? J Neurosci 31:13260 –13271. CrossRef Medline
Prieto JJ, Winer JA (1999) Layer VI in cat primary auditory cortex: Golgistudy and sublaminar origins of projection neurons. J Comp Neurol 404:332–358. CrossRef Medline
Rosenberg JR, Amjad AM, Breeze P, Brillinger DR, Halliday DM (1989) TheFourier approach to the identification of functional coupling betweenneuronal spike trains. Prog Biophys Mol Biol 53:1–31. CrossRef Medline
Rothschild G, Nelken I, Mizrahi A (2010) Functional organization and pop-ulation dynamics in the mouse primary auditory cortex. Nat Neurosci13:353–360. CrossRef Medline
Schreiner CE (1991) Functional topographies in the primary auditory cor-tex of the cat. Acta Otolaryngol Suppl 491:7–15; discussion 16. Medline
Smith SL, Hausser M (2010) Parallel processing of visual space by neighbor-ing neurons in mouse visual cortex. Nat Neurosci 13:1144 –1149.CrossRef Medline
Stepanyants A, Chklovskii DB (2005) Neurogeometry and potential synap-tic connectivity. Trends Neurosci 28:387–394. CrossRef Medline
Stepanyants A, Hirsch JA, Martinez LM, Kisvarday ZF, Ferecsko AS, Chk-lovskii DB (2008) Local potential connectivity in cat primary visual cor-tex. Cereb Cortex 18:13–28. CrossRef Medline
Stepanyants A, Martinez LM, Ferecsko AS, Kisvarday ZF (2009) The frac-tions of short- and long-range connections in the visual cortex. Proc NatlAcad Sci U S A 106:3555–3560. CrossRef Medline
Swadlow HA (2003) Fast-spike interneurons and feedforward inhibitionin awake sensory neocortex. Cereb Cortex 13:25–32. CrossRef Medline
Swadlow HA, Beloozerova IN, Sirota MG (1998) Sharp, local synchronyamong putative feed-forward inhibitory interneurons of rabbit somato-sensory cortex. J Neurophysiol 79:567–582. Medline
Thomson AM, Lamy C (2007) Functional maps of neocortical local cir-cuitry. Front Neurosci 1:19 – 42. CrossRef Medline
Volkov IO, Galaziuk AV (1989) Reactions of tonic-type neurons in the catauditory cortex to tones of various frequency and intensity. Neurophysi-ology 21:498 –506. Medline
Wallace MN, Palmer AR (2008) Laminar differences in the response prop-erties of cells in the primary auditory cortex. Exp Brain Res 184:179 –191.Medline
Winer JA, Prieto JJ (2001) Layer V in cat primary auditory cortex (AI):cellular architecture and identification of projection neurons. J CompNeurol 434:379 – 412. CrossRef Medline
Wu GK, Arbuckle R, Liu BH, Tao HW, Zhang LI (2008) Lateral sharpeningof cortical frequency tuning by approximately balanced inhibition. Neu-ron 58:132–143. CrossRef Medline
18514 • J. Neurosci., November 20, 2013 • 33(47):18503–18514 Atencio and Schreiner • Synchronous Subnetworks in AI