OPTIMUM SEED PLANTING SIZE AND MESH SIZE OF BOTTOMLESS MESH ENCLOSURES FOR CULTURING THE NORTHERN
Frontiers in Neuroengineering www.frontiersin.org December 2008 | Volume 1 | Article 2 | 1
NEUROENGINEERINGORIGINAL RESEARCH ARTICLE
published: 12 December 2008doi: 10.3389/neuro.16.002.2008
Micropit: a new cell culturing approach for characterization of solitary astrocytes and small networks of these glial cells
William Lee, Erik B. Malarkey, Reno C. Reyes and Vladimir Parpura*
Department of Neurobiology, Center for Glial Biology in Medicine, Atomic Force Microscopy and Nanotechnology Laboratories, Civitan International Research Center, Evelyn F. McKnight Brain Institute, University of Alabama, Birmingham, AL, USA
Astrocytes play an important role in cell–cell signaling in the mammalian central nervous system. The ability of astrocytes to communicate with surrounding cells through gap-junctional coupling or signaling via the release of transmitters makes characterization of these cells diffi cult in vitro and even more so in vivo. To simplify the complexity of common in vitro systems, introduced by intercellular communication between astrocytes, we developed a novel cell culturing method, in which purifi ed rat visual cortical astrocytes were grown in spatially defi ned cell-adhesion wells which we termed micropits. We showed that astrocytes cultured in micropit regions were viable and exhibited similar characteristics of Ca2+ dynamics and astrocytic marker expression to those of cells cultured in non-micropit regions. Examination of intracellular Ca2+ oscillations in solitary astrocytes cultured in micropits revealed less variable oscillations than those of non-micropit grouped astrocytes, which were in contact with their neighbors. Solitary cells in micropit regions can undergo ATP-mediated astrocyte-microglia signaling, demonstrating that this culturing method can also be used to investigate glial–glial interactions in a spatially well-defi ned microenvironment.
Keywords: astrocytes, glial–glial interactions, microglia, Ca2+ oscillations, glutamate release
culture systems (Takano et al., 2002). In this study, we showed that our micropattern cell culturing method using circular micropits can control the growth and localization of cells. Astrocytes cultured by this approach were viable. They exhibited similar characteristics in terms of astrocytic marker expression and Ca2+ dynamics to those of astrocytes grown in groups in a confl uent monolayer, although solitary micropit astrocytes displayed less variability of Ca2+ oscil-lations. The cells cultured in micropits showed a low incidence and degree of intercellular communication with cells in the adjacent micropits. This culturing approach allows for reduced complexity in order to characterize solitary or small networks of astrocytes, and can also be used to study glial–glial interaction to better under-stand the role that astrocytes may play in the mammalian central nervous system.
MATERIALS AND METHODSMOLD FABRICATIONThe master mold was designed using Autodesk Inventor (Autodesk Inc, San Rafael, CA). The mold was fabricated from a polytetrafl uor-oethylene (Tefl on) block using an Ikegai TV-4 computer control-led four-axis milling machine (Ikegai Corporation, Japan) driven by a Faunc 18M controller (Faunc America, Hoffman Estates, Illinois) using Mastercam software (CNC Software, Tolland, CT). The holes corresponding to the micropits (see section below on Micropatterned Coverslip Preparation) were routed with a 50 µm cobalt micro-drill bit (cat# 53570DIN, Titex Precision Cutting Tools, Frankfurt, Germany).
The Tefl on mold served as the master template for casting poly-dimethylsiloxane (PDMS) molds (Figure 1). To make the PDMS mold, 10 parts of silicone elastomer base were mixed with 1 part
INTRODUCTIONAstrocytes, a subtype of glial cells, play an important role in cell–cell signaling in the mammalian brain. Unlike neurons, astrocytes lack electrical excitability and display a form of excitability based on changes in intracellular Ca2+ levels that can be coupled to Ca2+-dependent exocytotic release of neurotransmitter such as gluta-mate and ATP. Evidence from the past decade has revealed that this exocytotic astrocytic communication pathway may play a role in synaptic neurotransmission in both physiological (reviewed in Haydon and Carmignoto, 2006) and pathophysiological (reviewed in Jabs et al., 2008; Rossi et al., 2007) conditions.
Much of our knowledge about the functions of astrocytes comes from studies in cell culture systems and in acute brain slices, while some of the functional roles of astrocytes in vivo have only been recently examined (reviewed in Tian et al., 2006). Although it is important to examine the functions of astrocytes in vivo, one needs to be cautious about the interpretation of data from in vivo studies, where the system is inherently complex. Some of the complexity observed in such studies can be attributed to astrocytic interactions with other cell types such as neurons, microglia and vasculature, and also to the intercellular communication among astrocytes via gap-junctional coupling and/or extracellularly released neu-rotransmitters. Without a clear understanding and characteriza-tion of solitary astrocytes, we might not be able to fully appreciate their functional contribution when working with other cells in vivo. Thus, we designed a new culturing approach to reduce intercellular communication to characterize astrocytes in a simplistic manner.
Striped micropatterned substrates generated with the use of microfabricated-polydimethylsiloxane (PDMS) molds have been used previously to control the growth and localization of cells in cell
Edited by:
Gabriel A. Silva, University of California, San Diego, USA
Reviewed by:
Erik Ullian, University of California, San Francisco, USADavid C. Spray, Albert Einstein College of Medicine, USA
*Correspondence:
Vladimir Parpura, Department of Neurobiology, 1719 6th Avenue South, CIRC 429, University of Alabama, Birmingham, AL 35294, USA. e-mail: [email protected]
Frontiers in Neuroengineering www.frontiersin.org December 2008 | Volume 1 | Article 2 | 2
Lee et al. Astrocytic micropit culture
of silicone elastomer curing agent (Sylgard 182; Dow Corning, Midland, MI). The silicone elastomer mixture was then poured onto the Tefl on master template and was subjected to a degassing procedure by sonication for 60 min to remove gas bubbles trapped in the mixture. The silicone elastomer mixture was allowed to cure at 70°C for 6 h and the fi nished PDMS molds were used to generate micropatterned coverslips.
MICROPATTERNED COVERSLIP PREPARATIONThe micropatterned coverslip preparation scheme is shown in Figure 2. A round borosilicate glass coverslip (diameter = 12 mm; thickness = 130–160 µm; Erie Scientifi c Co. D-262 custom glass purchased through Fisher Scientifi c cat# 12-545-82) pre-coated with polyethyleneimine (PEI, 1 mg/ml) was placed onto the PDMS mold with the PEI-coated side facing the mold (Figures 2A,B). A 40-g weight was placed on top of the PEI-coated coverslip located on the PDMS mold for 5 min; this step is critical since it ensures that the pins of the mold will make good contact with the glass coverslip and prevent the agarose from covering the PEI-coated cell adhesion surface. A droplet of boiling agarose (2% w/v in water; EMD, Gibbstown, NJ) was added to one end of a channel, designed into the mold to aid in this step, while suction was simultaneously applied at the other end with a pipette tip attached to a vacuum line (Figure 2C). This step allowed the agarose to fi ll the void between the PDMS mold and the glass coverslip (Figure 2C). The agarose was allowed to cool down for at least 20 min before coverslips were removed from the mold. These micropatterned coverslips were then used for subsequent cell culturing procedures. In a subset of experiments examining the spatial relationship between the agarose of the micropatterned coverslip and the astrocytes in micropits, we dissolved rhodamine-6G (1.5 µM; Acros Organics, New Jersey) in agarose.
ATOMIC FORCE MICROSCOPY (AFM) IMAGINGA Nanoscope E with a J scanner (132 µm × 132 µm maximum scan-ning area; 5 µm height) (Digital Instruments, Santa Barbara, CA) and Si
3N
4 gold-coated cantilevers with integral tips (Veeco Nano
Probes™ tips, Santa Barbara, CA) were used in contact mode to obtain images of micropits at room temperature (22–26°C). Prior to imaging, micropatterned agarose on coverslips was dehydrated by the addition of increasing concentrations of ethanol (50%, 70% and 95% each for 5 min) and then air dried as previously described (Parpura et al., 1993). The depth of the micropits was determined by monitoring the voltage used to control the piezo (height mode), while surface features were revealed using defl ection mode, where the change in voltage of the photodetector due to cantilever move-ment is monitored. The AFM imaging force was adjusted to <5 nN to avoid damaging of the dehydrated agarose.
CELL CULTURESCells were cultured as described previously (Montana et al., 2004). Briefl y, visual cortices were dissected from 0–2-day-old Sprague Dawley rats and treated with papain (20 I.U./ml; Sigma) in Hank’s Balanced Salt Solution (HBSS) (Invitrogen) for 1 h at 37°C. The tissue was washed with HBSS and incubated with trypsin inhibitor (type II-O, 10 mg/ml, Sigma) in HBSS for 5 min. After an addi-tional wash with HBSS, the tissue was triturated in culture medium
containing α-minimum essential medium (α-MEM, Invitrogen) supplemented with: 10% (v/v) fetal bovine serum (Hyclone), 20 mM glucose, 2 mM L-glutamine, 1 mM sodium pyruvate, 14 mM sodium bicarbonate, penicillin (100 I.U./ml) and streptomycin (100 µg/ml), pH 7.35. The resulting cell suspension was applied to culture fl asks and maintained in culture medium at 37°C in a 5% CO
2/95% air
incubator for 4–7 days in which cells in the fl ask reached ~50–60% confl uence. At that time cultured cells were submitted to an astrocyte purifi cation procedure. Flasks were shaken twice on a horizontal orbital shaker at 260 rpm, fi rst for 1.5 h, and then after two exchanges with culture medium, shaken again for 18 h. Cells that remained adhered at the bottom of the fl ask were detached using trypsin (10,000 Nα-benzoyl-L-arginine ethyl ester hydrochloride units/ml; Sigma-Aldrich, St. Louis, MO) dissolved in HBSS and pelleted by centrifugation at 100 × g for 10 min. The resulting cell pellet was resuspended in culture medium and cells were then plated onto micropatterned coverslips. This culturing procedure yields astro-cytic culture with purity >99% as confi rmed by glial fi brillary acidic protein (GFAP) immunolabeling and accumulation of the dipeptide β-Ala-Lys conjugated to 7-amino-4-methylcoumarin-3-acetic acid (AMCA)(20 µM at 37°C for 2 h) (Montana et al., 2004). The culture was microglia-free as revealed by the lack of labeling with FITC-con-jugated isolectin B
4 (see below) and also neuron-free as confi rmed
by the lack of synaptotagmin I immunoreactivty (Parpura et al., 1994). To examine the viability of astrocytes, we used the vital dye calcein. The micropatterned coverslips containing astrocytes were incubated in culture medium with 5 µg/ml calcein acetoxymethyl (AM) ester at 37°C for 30 min. The dye was allowed to de-esterify for 30 min at room temperature in normal external solution con-taining the cell permeant nuclear stain Hoechst 33342 (5 µg/ml; Invitrogen). These coverslips were rinsed in normal external solution and visualized using a standard FITC (calcein) and DAPI (Hoechst) fi lter sets (Chroma, Rockingham, VT). The normal external solution contained (in mM): 140 NaCl, 5 KCl, 2 CaCl
2, 2 MgCl
2, 5 glucose,
and 10 HEPES (pH 7.4).Microglia were isolated from primary cultures in fl asks
(>2 weeks) by gently tapping the fl ask to dislodge microglia. The resulting cell suspension was pelleted by centrifugation at 100 × g for 10 min. The pellet was then resuspended and used either for purity assessment or fl uo-3 loading (see Ca2+ Imaging section below). The purity of the microglial culture was tested by live-cell labeling with FITC-conjugated isolectin B
4 (Sigma-Aldrich).
After microglia isolation, the resulting cell pellet was resuspended in FITC-conjugated isolectin B
4 (10 µg/ml; 30 min at room tem-
perature). Following incubation with FITC-conjugated isolectin B
4, cells were plated on PEI-coated coverslips, rinsed with external
solution and then visualized using a FITC fi lter set. This isolation procedure yielded microglia cells with purity >99%.
IMMUNOCYTOCHEMISTRYUnless otherwise stated, all solutions used in immunocytochemis-try experiments were made with phosphate buffered saline (PBS) containing (in mM): 137 NaCl, 2.7 KCl, 10 Na
2HPO
4·7H
2O, and 1.8
KH2PO
4 (pH 7.2). Cell cultures on micropatterned coverslips were
fi xed with 4% (w/v) paraformaldehyde at room temperature for 30 min and permeabilized using 0.25% Triton X-100 for 10 min. Cells were then incubated with 10% (v/v) goat serum in PBS, to
Frontiers in Neuroengineering www.frontiersin.org December 2008 | Volume 1 | Article 2 | 3
Lee et al. Astrocytic micropit culture
prevent non-specifi c binding, for 30 min followed by incubation overnight (>12 h) at 4°C with monoclonal primary antibodies to label plasma membrane glutamate aspartate transporter (GLAST) (1:1000 dilution; Millipore, Billerica, MA), GFAP (1:500; MP Biomedicals, Solon, OH), or glutamine synthetase (GS) (1:250; Millipore). After three washes with PBS, cells were incubated with a TRITC-conjugated secondary antibody (1:200; Millipore) at room temperature for 1 h. Cell cultures on micropatterned coverslips were mounted onto a glass microscope slide in glycerol containing 1% (w/v) n-propyl gallate to prevent photobleaching, and visual-ized using a standard TRITC fi lter set (Chroma). Parallel controls were performed in which the primary antibodies were omitted to test for non-specifi c binding of the secondary antibody.
STIMULATION OF ASTROCYTESWe used two methods to evoke increases in intracellular Ca2+ concentration ([Ca2+]
i) in astrocytes: mechanical stimulation via
a glass microelectrode (Charles et al., 1993; Hua et al., 2004) or application of agonist via a puffer pipette (Parpura et al., 1994). Mechanical stimulation of astrocytes was achieved by transient con-tact with the cells, monitored by pipette resistance using −20 mV, 10 ms square pulses at 50 Hz delivered by a patch-clamp amplifi er (PC-ONE; Dagan) equipped with a whole-cell head stage (PC-ONE-30; 1 GΩ). Pipette resistances measured 1.5–2.6 MΩ when pipette tips were fi lled with and immersed in external solution, which increased to 1.8–5.0 MΩ during transient contact with astro-cytes lasting for approximately 1 s. Agonist stimulation of astrocytes was achieved by delivering pharmacological agents including gluta-mate (100 µM; Sigma-Aldrich), adenosine 5’-triphosphate (ATP) (100 µM; Sigma-Aldrich), bradykinin (BK) (1 µM; Sigma-Aldrich), and norepinephrine (NE) (100 µM; Sigma-Aldrich) via a puffer pipette connected to the PicoSpritzer II pressure ejection system (~70 kPa; Parker Instrumentation, Cleveland, OH).
Ca2+ IMAGINGThe intracellular Ca2+ levels in astrocytes were monitored using the Ca2+ indicator, fl uo-3, by modifi cation of a previously described procedure (Parpura et al., 1994). Cells were loaded at room temperature in normal external solution, containing fl uo-3 AM (10 µg/ml; Invitrogen) and pluronic acid (0.025% w/v; Invitrogen), for 30 min. After washing in normal external solu-tion, the Ca2+ indicator was permitted to de-esterify for 30 min at room temperature in external solution containing Hoechst 33342, which allowed visualization of nuclei to select solitary astrocytes (Figures 6–7, 9 and 11) or small networks of these cells (Figure 11) in the micropit culture. Coverslips containing dye-loaded cells were mounted onto a recording chamber and imaged. A FITC fi lter set was used to monitor fl uo-3 fl uorescence and a DAPI fi lter set was used for Hoechst. All experiments were per-formed at room temperature (22–26°C). Data were background subtracted using a fl uorescence image acquired in a region of cov-erslip without cells. Fluo-3 intensity changes of entire astrocytes were expressed as dF/Fo (%), where dF represents the change of fl uorescence after cell stimulation and Fo represents the fl uores-cence of the cell before stimulation. Astrocytes were considered responsive to a stimulus if dF/Fo values in two consecutive images were higher than the Fo + 3SDs.
In a subset of experiments examining the astrocyte-microglia interaction in micropits, we loaded astrocytes plated on micro-patterned coverslips with Fura Red AM (2 µM; Invitrogen) and pluronic acid (0.025% w/v) for 20 min at 37°C. Dye was allowed to de-esterify for 20 min while cells were kept at room tempera-ture in normal external solution. Coverslips containing Fura Red loaded astrocytes were mounted to the imaging chamber and fl uo-3 preloaded microglial cells were added to the imaging chamber. We then waited ~10 min for microglia to settle onto the bottom before we proceeded with the experiment. The pre-loading of microglia in suspension was done at 37°C for 20 min in culture media con-taining fl uo-3 AM (10 µg/ml) and pluronic acid (0.025% w/v), and then cells were pelleted by centrifugation at 100 × g for 10 min. The resulting cell pellet containing fl uo-3 loaded microglia was resuspended in normal external solution and then the dye was permitted to de-esterify for 30 min at room temperature. The fl uo-3 pre-loaded microglia were then used for experiments. The fl uores-cence emissions of the Ca2+ indicators from microglia and astrocytes were simultaneously monitored using a FITC Long pass fi lter set (exciter: 465–495 nm; dichroic: 505 DCLP; emitter: 515 nm long pass) where the fl uo-3 fl uorescence emission shows green (emis-sion max ~526 nm), while Fura Red fl uorescence emission shows red (emission max ~660 nm).
EXTRACELLULAR GLUTAMATE IMAGINGWe used an enzymatic assay that has been previously used to opti-cally monitor the extracellular glutamate dynamics (Hua et al., 2004; Innocenti et al., 2000). This assay is based on monitoring NADH fl uorescence that is produced when glutamate is converted to α-ketoglutarate by the enzyme L-glutamate dehydrogenase (GDH), while nicotinamide adenine dinucleotide (NAD+) is con-comitantly converted to NADH. Given that GDH and NAD+ are added to the solution in which the astrocytes are bathed, glutamate released in the extracellular milieu can be detected as an increase in NADH fl uorescence.
Glutamate imaging was accomplished using a standard DAPI fi lter set. Astrocytes were bathed in an enzymatic assay solution containing (in mM): 140 NaCl, 5 KCl, 2 CaCl
2, 2 MgCl
2, 10 HEPES,
5 glucose, 1 NAD+ (Sigma), and GDH (59 I.U./ml; Sigma), pH 7.35. Every experiment was preceded by a sham run (same exposure time but no mechanical stimulus applied) on cells bathed in solution lacking GDH and NAD+. This was used to correct for photobleach-ing and background subtraction in all imaging data. The reduction of fl uorescence resulting from photobleaching in the sham run exhibited the same time course as in the matching experimental run. Data were expressed as dF/Fo (%), where Fo represents the fl uorescence level before stimulation, whereas dF represents the change in fl uorescence surrounding the astrocytes.
LIGHT MICROSCOPYFor experiments with cultured astrocytes, visualization was done using an inverted microscope (TE 300; Nikon) equipped with differential interference contrast (DIC) and wide-fi eld epifl uores-cence. Immunocytochemistry and Ca2+ imaging experiments were performed using a 60X Plan Apo oil-immersion objective (1.4 NA; Nikon). For extracellular glutamate imaging experiments, we used a 40X SFluor oil-immersion objective (1.3 NA; Nikon). We also used
Frontiers in Neuroengineering www.frontiersin.org December 2008 | Volume 1 | Article 2 | 4
Lee et al. Astrocytic micropit culture
a 20X plan-Fluor (0.5 NA; Nikon) objective: (1) when monitoring the intracellular Ca2+ levels of cells in two micropits simultane-ously, (2) for examining calcein dye loading, (3) for visualization of Hoechst 33342 labeling in astrocytes, and (4) for imaging of cross-sections of the PDMS mold. Images were captured using a CoolSNAP-HQ cooled CCD camera (Roper Scientifi c) driven by V++ imaging software (Digital Optics, Auckland, New Zealand) which was also used for image processing and data analysis.
Spinning disc confocal imaging was performed on an Olympus IX81 microscope equipped with a Disc Scanning Unit (DSU) and a 60X Plan Apo objective (1.4 NA; Olympus). Top view images of the PDMS mold were captured using a color CCD camera (Fisher catalog# 12-563-1; Westover Scientifi c, Woodinville, WA) mounted on a Leica GZ6 stereomicroscope (Bannockburn, IL) and driven by LabView/IMAQ (National Instruments, Austin, TX).
Ca2+ OSCILLATIONS ANALYSISCa2+ transients from background subtracted fl uo-3 emission traces were declared Ca2+ peaks (Table 1) if over two consecutive images their dF values exceeded the fl uorescence emission value of a 9-point moving average +2 standard deviations. The frequency components in intracellular Ca2+ concentration ([Ca2+]
i) oscilla-
tions in astrocytes were determined by spectral analysis written for use in MATLAB (The Mathworks, Natick, MA) as previously described (Aizman et al., 2001; Uhlen, 2004; Uhlen et al., 2000). Briefl y, the ATP-evoked portion of the [Ca2+]
i signal from a single
cell was fi ltered, centered, and trend-corrected by computing Gauss least-squares approximation to subtract the trend component from the original data. The dominant frequency peak was determined by comparing the relative power of the peaks in the power spec-trum. The relative power was calculated by taking the integral of a peak divided by integral of the entire power spectrum. We fur-ther considered only peaks if their power exceeded 5% of total power and if their frequency was above the cut-off frequency of 11 mHz, imposed by the length of agonist application (180 s) and the Nyquist-Shannon sampling theorem.
STATISTICAL ANALYSISThe levels of [Ca2+]
i upon various astrocytic stimulation procedures
and expression levels of astrocytic makers in immunocytochem-istry experiments were compared between astrocytes cultured in micropit and non-micropit area using Student’s t-tests. Glutamate release due to mechanical stimulation was assessed using paired t-tests. The effect of suramin on Ca2+ dynamics was assessed by Student’s t-tests. Statistical signifi cance is defi ned as p < 0.05. Data were expressed as mean ± standard error of mean (SEM).
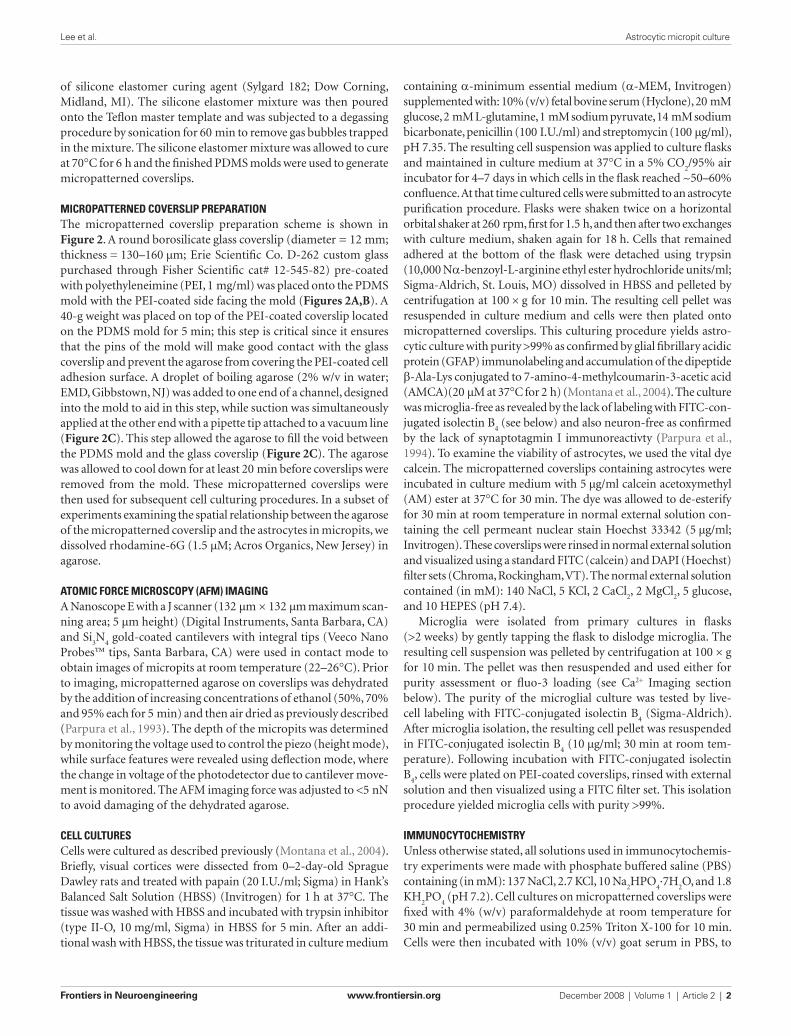
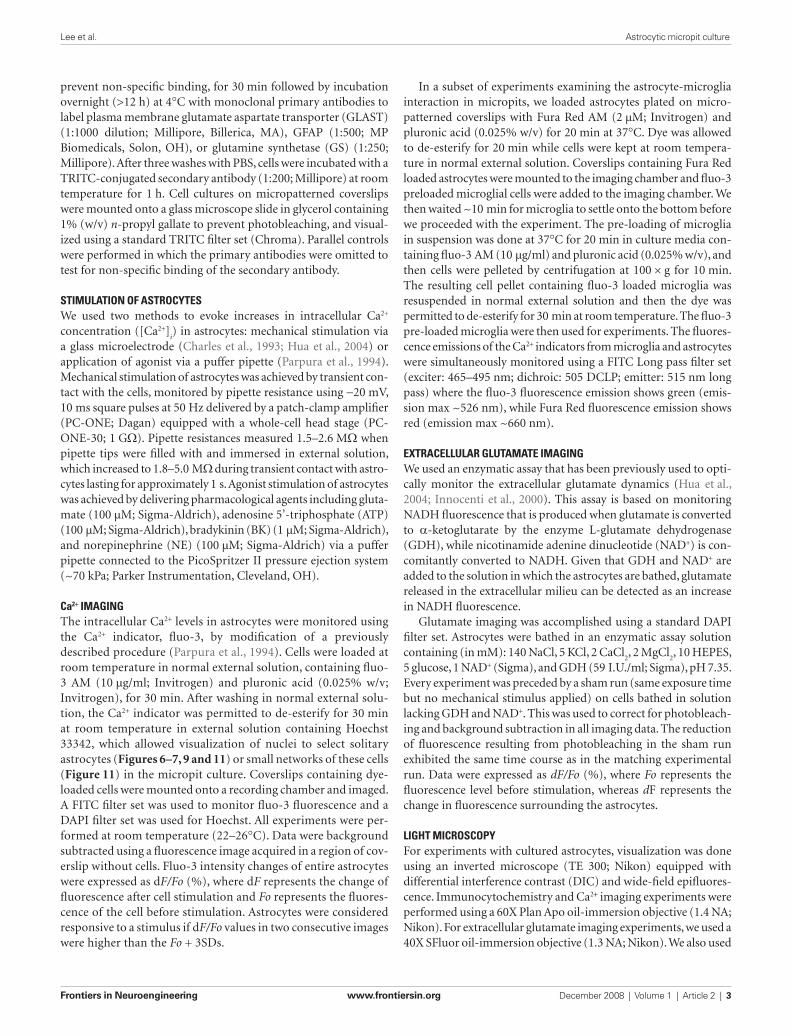
RESULTSPDMS MOLD DESIGN AND MICROPIT CHARACTERIZATIONWe designed a cell culturing approach to limit intercellular com-munication pathways to study and characterize solitary astrocytes or small networks of these cells in culture. The PDMS mold served as the master template to micropattern a non cell-adhesive substrate (agarose) onto glass coverslips pre-coated with a cell-adhesive sub-strate (PEI). The design and specifi cations of the PDMS mold are shown in Figures 1A–C. The PDMS mold consists of two raised bilateral circular segments with an arrangement of pins between
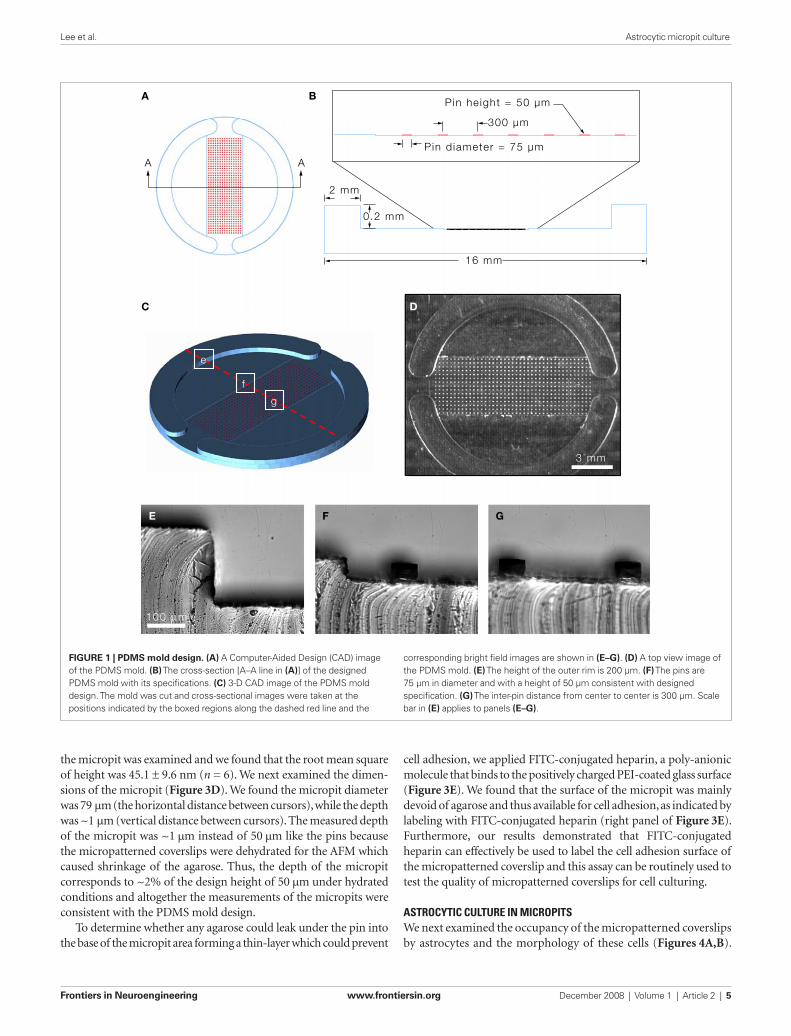
them consisting of a 39 × 15 array fl anked by an 11-pin column on each side (Figure 1D). The segments and pins are 50 µm in height, while the pins are 75 µm in diameter and positioned 300 µm apart from each other from center to center (Figure 1B). The height of the outer rim, from the segment to the top of the rim, is 200 µm (Figure 1E) and this distance is slightly higher than the thickness (130–160 µm) of the glass coverslip to ensure proper positioning of the glass coverslip on the PDMS mold. The specifi cations of the PDMS mold were verifi ed, as shown in the bright fi eld images in Figures 1E–G, and the measurements of the mold were consistent with the designed specifi cations.
The micropatterned coverslips were generated by micropattern-ing agarose on a PEI-coated coverslip (Figure 2). This approach has previously been used to control the localization of cells in defi ned microdomains (Takano et al., 2002). Here we utilized agarose as a cell adhesion inhibitor to generate well-defi ned circular cell adhe-sive surfaces, which we termed micropits, to control the localization and growth of cells in culture as illustrated in the schematic diagram in Figure 2E. Cells plated on these micropatterned coverslips can either grow in the micropit or non-micropit regions (Figure 2D). While other available methods have been used to control the locali-zation and growth of cells in micropatterned cell adhesive domains (Bekkers and Stevens, 1991; Chen et al., 1997; Recknor et al., 2004; Takano et al., 2002), their micropatterning approaches were not designed to limit intercellular communication pathways which is the goal behind our PDMS mold design. We spaced the micropits 300 µm apart and this arrangement was tested for the extent of intercellular communication between the cells in different micro-pits (see Results below). The surface area (SA) of each micropit is 4417 µm2. Since there are 607 micropits per micropatterned cover-slip, the total micropit SA corresponds to ~2.4% of the total SA of a PEI-coated glass coverslip (~113 mm2). The SA in the non-micropit area (two segmental regions of the coverslip) corresponds to ~53% of the SA of the coverslip. Astrocytes grown on permissive sub-strates can divide and grow to reach a confl uent layer of cells since these cells display cell-to-cell contact inhibition, whereas cells in micropits are spatially confi ned by the area of permissive substrate which limits their growth. The rationale behind co-culturing cells on the non-micropit regions is to utilize these cells as support cells for cells cultured in micropits since they can provide glial-trophic factors and also to comparatively study micropit vs. non-micropit cells grown on the same coverslip.
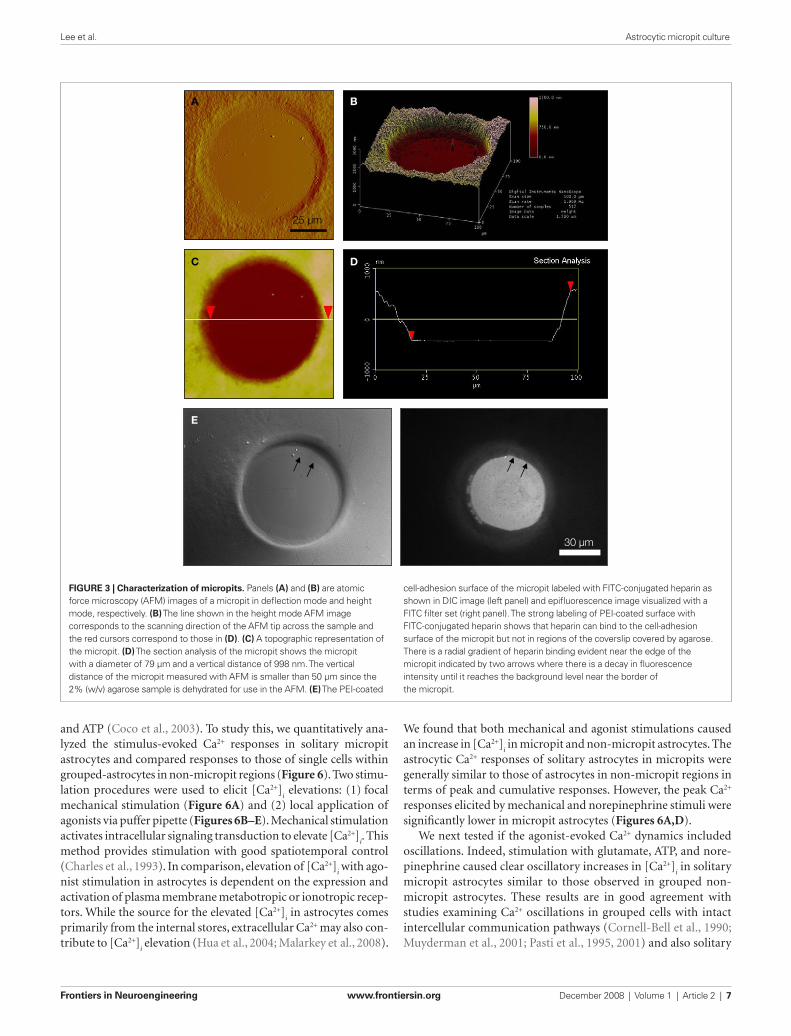
We characterized the micropit domains of the micropatterned coverslips using Atomic Force Microscopy (AFM) (Figure 3). The AFM images of a micropit in defl ection mode (Figure 3A), height mode (Figure 3B), and topographic representation (Figure 3C) showed that the base of the micropit is fl at and mostly devoid of aga-rose. While the AFM allowed us to examine the surface topography of the micropit, it can not disclose the entire pit due to tip convolution (Keller and Franke, 1993). For example, the rim of the micropit as shown in Figure 3C does not appear to be vertical due to the opening angle of the pyramidal tip integrated on a cantilever (see Figure 3D). Here, the opening angle of the AFM tip is ~59°, which is in good agreement with the manufacturer’s specifi cation. It should be noted that the measurable angle of the pit wall along the direction of the scan differs from one side to another owing due to the cantilever tilt in scanning direction. The smoothness of the cell-adhesion surface of
Frontiers in Neuroengineering www.frontiersin.org December 2008 | Volume 1 | Article 2 | 5
Lee et al. Astrocytic micropit culture
the micropit was examined and we found that the root mean square of height was 45.1 ± 9.6 nm (n = 6). We next examined the dimen-sions of the micropit (Figure 3D). We found the micropit diameter was 79 µm (the horizontal distance between cursors), while the depth was ~1 µm (vertical distance between cursors). The measured depth of the micropit was ~1 µm instead of 50 µm like the pins because the micropatterned coverslips were dehydrated for the AFM which caused shrinkage of the agarose. Thus, the depth of the micropit corresponds to ~2% of the design height of 50 µm under hydrated conditions and altogether the measurements of the micropits were consistent with the PDMS mold design.
To determine whether any agarose could leak under the pin into the base of the micropit area forming a thin-layer which could prevent
cell adhesion, we applied FITC-conjugated heparin, a poly-anionic molecule that binds to the positively charged PEI-coated glass surface (Figure 3E). We found that the surface of the micropit was mainly devoid of agarose and thus available for cell adhesion, as indicated by labeling with FITC-conjugated heparin (right panel of Figure 3E). Furthermore, our results demonstrated that FITC-conjugated heparin can effectively be used to label the cell adhesion surface of the micropatterned coverslip and this assay can be routinely used to test the quality of micropatterned coverslips for cell culturing.
ASTROCYTIC CULTURE IN MICROPITSWe next examined the occupancy of the micropatterned coverslips by astrocytes and the morphology of these cells (Figures 4A,B).
G
C
f
e
g
F
16 mm
2 mm
A A
Pin height = 50 µm
300 µm
Pin d iameter = 75 µm
0.2 mm
D
3 mm
E
100 μm
A B
FIGURE 1 | PDMS mold design. (A) A Computer-Aided Design (CAD) image of the PDMS mold. (B) The cross-section [A–A line in (A)] of the designed PDMS mold with its specifi cations. (C) 3-D CAD image of the PDMS mold design. The mold was cut and cross-sectional images were taken at the positions indicated by the boxed regions along the dashed red line and the
corresponding bright fi eld images are shown in (E–G). (D) A top view image of the PDMS mold. (E) The height of the outer rim is 200 µm. (F) The pins are 75 µm in diameter and with a height of 50 µm consistent with designed specifi cation. (G) The inter-pin distance from center to center is 300 µm. Scale bar in (E) applies to panels (E–G).

Frontiers in Neuroengineering www.frontiersin.org December 2008 | Volume 1 | Article 2 | 6
Lee et al. Astrocytic micropit culture
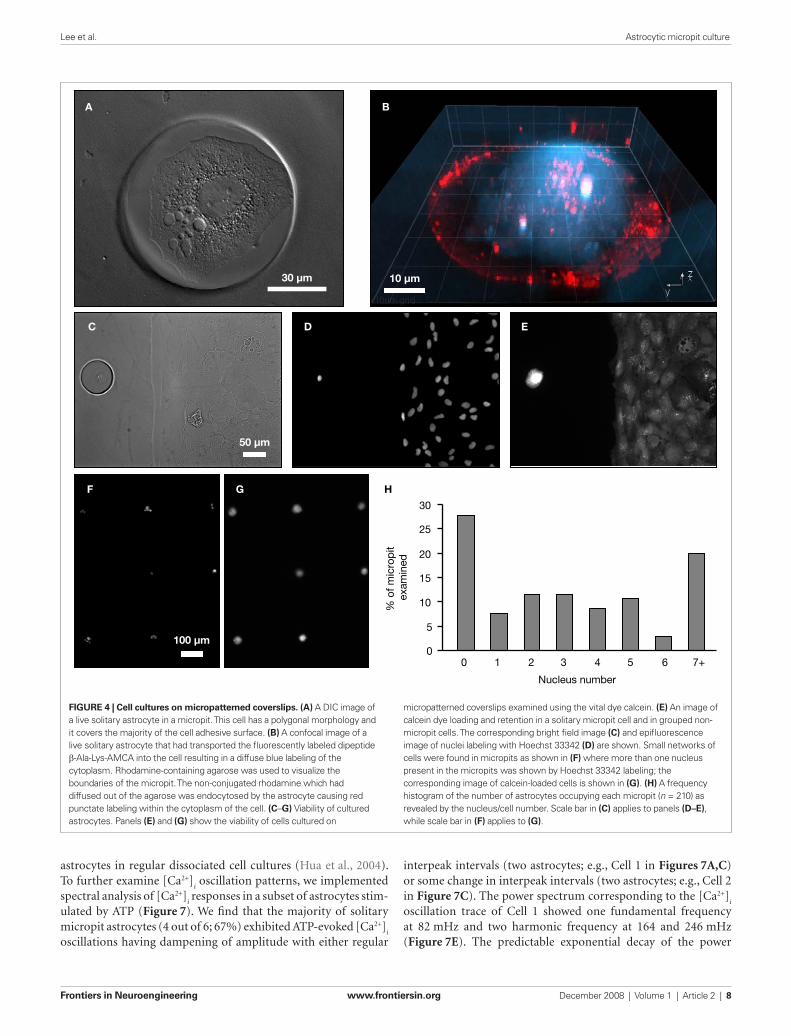
Solitary astrocytes can be cultured in micropits where they expand to cover most of the available cell-adhesion surface of the micropit as shown in the DIC image of a live solitary astrocyte in a micro-pit (Figure 4A). The astrocyte in the micropit assumed a polygo-nal morphology similar to that of cells cultured in non-micropit regions. The spatial relationship of the cell to the micropit was examined using scanning confocal microscopy (Figure 4B). In this experiment, the astrocyte was visualized by incubating it with β-Ala-Lys-N
ε-AMCA peptide (Figure 4B; DAPI channel, blue),
which is selectively taken up by astrocytes via the PepT2 transporter (Dieck et al., 1999). This allowed for examination of the cytoplas-mic volume of the cell. The astrocyte in the micropit was hemi-spherical and it covered the majority of the cell adhesive surface in the micropit. To label the surrounding micropit, the agarose used was doped with unconjugated rhodamine 6G (Figure 4B; TRITC
channel-red). Some of this dye was able to diffuse out of the agarose and, consequently, can be seen within the astrocyte as punctate stain most likely refl ecting its endocytosis by the astrocyte.
To test the viability of astrocytes cultured in micropits, we loaded cells with calcein AM and examined the dye retention in the astrocytes (Figures 4C,E,G). We found that culturing cells in micropits did not alter their viability since accumulation of this vital dye in micropit cells was comparatively similar to that of non-micropit cells (Figures 4E,G). Since we are interested in studying small networks of astrocytes as well as solitary cells using these micropits, we counted the number of astrocytes that resided within each micropit by staining their nuclei with cell permeant Hoechst 33342 (Figures 4C,D,F). Indeed, solitary astrocytes and small networks of astrocytes can be cultured within micropits (Figures 4F,H). At a plating cell density of 1 × 10⁴ cells/ml, we found that ~72% of micropits examined were occupied by cells, while ~28% were not (Figure 4H). In micropits occupied by cells, ~44% of micropits contained small networks of cell with 2–6 astro-cytes, ~8% contained solitary astrocytes, and ~20% contained clus-ters of seven or more cells. Since the area of the micropit dictates the number of cells that can adhere to it, it appears that the area designed could accommodate for a maximum of six cells which were well attached directly to the micropit surface. In micropits that contained clusters of seven or more cells, only small portions of the cells in the cluster were able to adhere to the cell-adhesion surface of the micropit. Such cells could not be selected for further experimentation because we could not differentiate individual cell responses within the cell clusters.
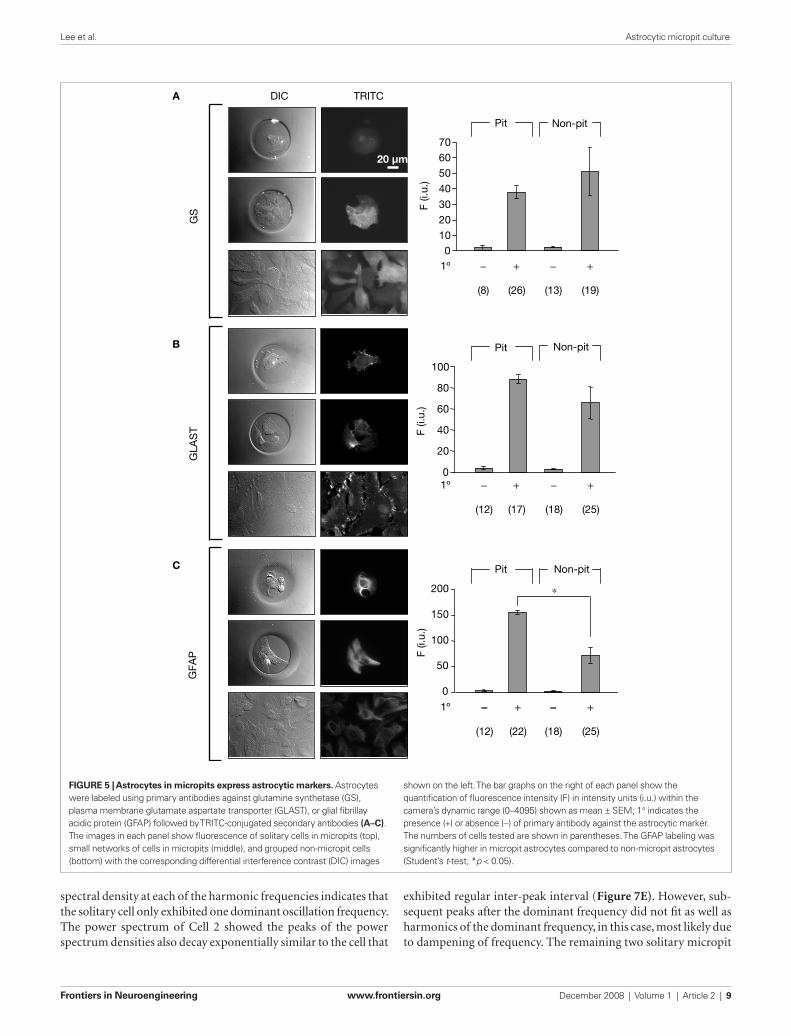
After confi rming that astrocytes cultured in micropits were viable, we then examined whether culturing astrocytes in micropits would alter their typical gene expression profi le. To test this, we performed immunocytochemistry experiments to label for the astrocytic markers: GFAP, GLAST, and glutamine synthetase. We found that astrocytes cultured in micropits expressed all three astrocytic markers examined (Figure 5). Astrocytes cultured in non-micropit regions of the micropatterned coverslip showed heterogeneity in expression of the astrocytic markers within a subpopulation of cells (Figures 5A–C, bottom right panels) and such heterogeneity was also present in small networks of cell within micropits (Figures 5A–C, middle right panels). Quantitative analy-sis of fl uorescence intensity showed that only GFAP fl uorescence displayed a signifi cant difference between micropit and non-micropit cells (Figure 5C, graph). The increase of fl uorescence intensity for GFAP labeling in micropit astrocytes might be due to the difference in thickness of the cells cultured in micropits versus those in non-micropit regions. If a micropit cell is thicker then it would appear to have more labeling for GFAP per unit area. Alternatively, it could be that the increase fl uorescence represents the higher expression of GFAP regularly seen in reactive astrocytes (see Discussion).
INTRACELLULAR Ca2+ DYNAMICS AND Ca2+-DEPENDENT GLUTAMATE RELEASEAstrocytes exhibit a form of excitability based on changes in [Ca2+]
i
upon agonist stimulation (Charles et al., 1991; Cornell-Bell et al., 1990; Jensen and Chiu, 1990). This Ca2+ excitability can be cou-pled to Ca2+-dependent release of glutamate (Parpura et al., 1994)
PDMS moldPEI-coated coverslip
A
B C
D E
suction
agarose
Non-micropit
Micropit
FIGURE 2 | Micropatterned coverslip preparation scheme. (A) A polyethyleneimine (PEI)-coated coverslip was placed on top the PDMS mold with the PEI-coated side facing the PDMS mold as shown in (B). (C) Boiling agarose (2% w/v in water) was added to one of the open ends while gentle suction was applied at the other end to draw agarose into the channel until it was completely fi lled. The agarose was allowed to cool down and then the micropatterned coverslip was removed from the PDMS mold. (D) The micropatterned coverslip consists of a micropit array in the middle portion with non-pit segmental regions on each side. Plating and culturing astrocytes on these micropatterned coverslips yields cells grown in the micropit regions as shown in the schematic diagram in (E) as well as grouped cells in the two non-micropit regions on either side.
Frontiers in Neuroengineering www.frontiersin.org December 2008 | Volume 1 | Article 2 | 7
Lee et al. Astrocytic micropit culture
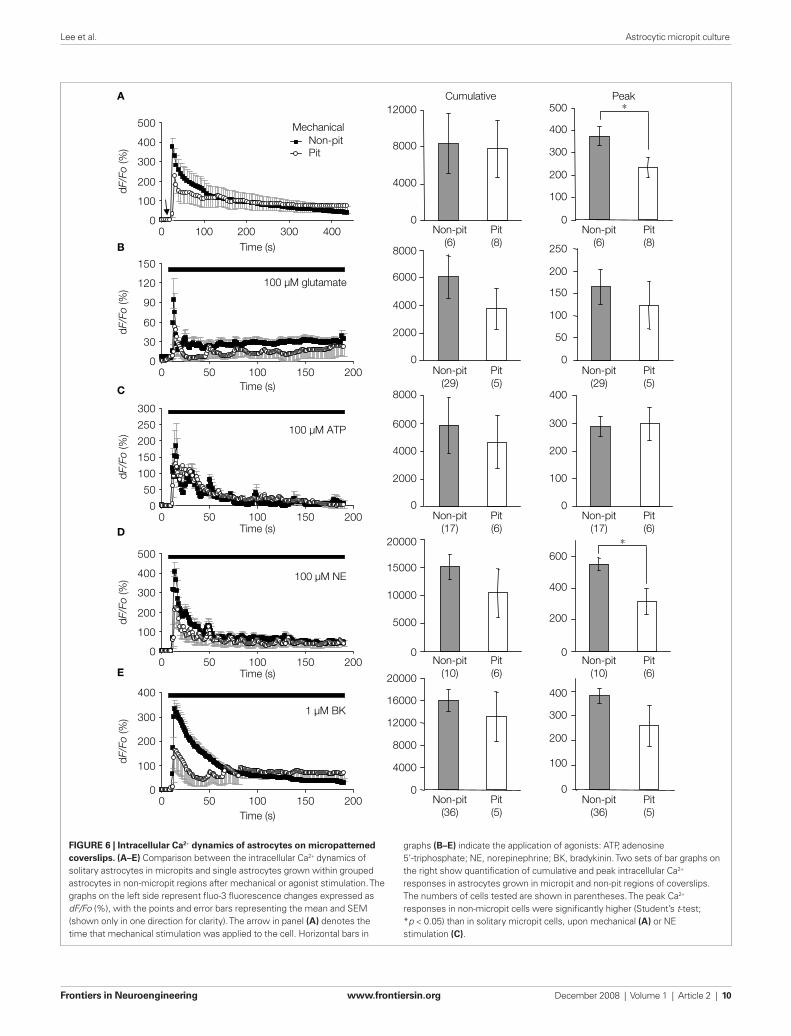
and ATP (Coco et al., 2003). To study this, we quantitatively ana-lyzed the stimulus-evoked Ca2+ responses in solitary micropit astrocytes and compared responses to those of single cells within grouped- astrocytes in non-micropit regions (Figure 6). Two stimu-lation procedures were used to elicit [Ca2+]
i elevations: (1) focal
mechanical stimulation (Figure 6A) and (2) local application of agonists via puffer pipette (Figures 6B–E). Mechanical stimulation activates intracellular signaling transduction to elevate [Ca2+]
i. This
method provides stimulation with good spatiotemporal control (Charles et al., 1993). In comparison, elevation of [Ca2+]
i with ago-
nist stimulation in astrocytes is dependent on the expression and activation of plasma membrane metabotropic or ionotropic recep-tors. While the source for the elevated [Ca2+]
i in astrocytes comes
primarily from the internal stores, extracellular Ca2+ may also con-tribute to [Ca2+]
i elevation (Hua et al., 2004; Malarkey et al., 2008).
We found that both mechanical and agonist stimulations caused an increase in [Ca2+]
i in micropit and non-micropit astrocytes. The
astrocytic Ca2+ responses of solitary astrocytes in micropits were generally similar to those of astrocytes in non-micropit regions in terms of peak and cumulative responses. However, the peak Ca2+ responses elicited by mechanical and norepinephrine stimuli were signifi cantly lower in micropit astrocytes (Figures 6A,D).
We next tested if the agonist-evoked Ca2+ dynamics included oscillations. Indeed, stimulation with glutamate, ATP, and nore-pinephrine caused clear oscillatory increases in [Ca2+]
i in solitary
micropit astrocytes similar to those observed in grouped non-micropit astrocytes. These results are in good agreement with studies examining Ca2+ oscillations in grouped cells with intact intercellular communication pathways (Cornell-Bell et al., 1990; Muyderman et al., 2001; Pasti et al., 1995, 2001) and also solitary
B
E
30 µm
DC
A
25 µm
FIGURE 3 | Characterization of micropits. Panels (A) and (B) are atomic force microscopy (AFM) images of a micropit in defl ection mode and height mode, respectively. (B) The line shown in the height mode AFM image corresponds to the scanning direction of the AFM tip across the sample and the red cursors correspond to those in (D). (C) A topographic representation of the micropit. (D) The section analysis of the micropit shows the micropit with a diameter of 79 µm and a vertical distance of 998 nm. The vertical distance of the micropit measured with AFM is smaller than 50 µm since the 2% (w/v) agarose sample is dehydrated for use in the AFM. (E) The PEI-coated
cell-adhesion surface of the micropit labeled with FITC-conjugated heparin as shown in DIC image (left panel) and epifl uorescence image visualized with a FITC fi lter set (right panel). The strong labeling of PEI-coated surface with FITC-conjugated heparin shows that heparin can bind to the cell-adhesion surface of the micropit but not in regions of the coverslip covered by agarose. There is a radial gradient of heparin binding evident near the edge of the micropit indicated by two arrows where there is a decay in fl uorescence intensity until it reaches the background level near the border of the micropit.
Frontiers in Neuroengineering www.frontiersin.org December 2008 | Volume 1 | Article 2 | 8
Lee et al. Astrocytic micropit culture
A
30 µm
B
10 µm
C
50 µm
D E
Nucleus number
% o
f mic
rop
it ex
amin
ed
HF G
100 µm0
5
10
15
20
25
30
0 1 2 3 4 5 6 7+
FIGURE 4 | Cell cultures on micropatterned coverslips. (A) A DIC image of a live solitary astrocyte in a micropit. This cell has a polygonal morphology and it covers the majority of the cell adhesive surface. (B) A confocal image of a live solitary astrocyte that had transported the fl uorescently labeled dipeptide β-Ala-Lys-AMCA into the cell resulting in a diffuse blue labeling of the cytoplasm. Rhodamine-containing agarose was used to visualize the boundaries of the micropit. The non-conjugated rhodamine which had diffused out of the agarose was endocytosed by the astrocyte causing red punctate labeling within the cytoplasm of the cell. (C–G) Viability of cultured astrocytes. Panels (E) and (G) show the viability of cells cultured on
micropatterned coverslips examined using the vital dye calcein. (E) An image of calcein dye loading and retention in a solitary micropit cell and in grouped non-micropit cells. The corresponding bright fi eld image (C) and epifl uorescence image of nuclei labeling with Hoechst 33342 (D) are shown. Small networks of cells were found in micropits as shown in (F) where more than one nucleus present in the micropits was shown by Hoechst 33342 labeling; the corresponding image of calcein-loaded cells is shown in (G). (H) A frequency histogram of the number of astrocytes occupying each micropit (n = 210) as revealed by the nucleus/cell number. Scale bar in (C) applies to panels (D–E), while scale bar in (F) applies to (G).
astrocytes in regular dissociated cell cultures (Hua et al., 2004). To further examine [Ca2+]
i oscillation patterns, we implemented
spectral analysis of [Ca2+]i responses in a subset of astrocytes stim-
ulated by ATP (Figure 7). We fi nd that the majority of solitary micropit astrocytes (4 out of 6; 67%) exhibited ATP-evoked [Ca2+]
i
oscillations having dampening of amplitude with either regular
interpeak intervals (two astrocytes; e.g., Cell 1 in Figures 7A,C) or some change in interpeak intervals (two astrocytes; e.g., Cell 2 in Figure 7C). The power spectrum corresponding to the [Ca2+]
i
oscillation trace of Cell 1 showed one fundamental frequency at 82 mHz and two harmonic frequency at 164 and 246 mHz (Figure 7E). The predictable exponential decay of the power
Frontiers in Neuroengineering www.frontiersin.org December 2008 | Volume 1 | Article 2 | 9
Lee et al. Astrocytic micropit culture
spectral density at each of the harmonic frequencies indicates that the solitary cell only exhibited one dominant oscillation frequency. The power spectrum of Cell 2 showed the peaks of the power spectrum densities also decay exponentially similar to the cell that
exhibited regular inter-peak interval (Figure 7E). However, sub-sequent peaks after the dominant frequency did not fi t as well as harmonics of the dominant frequency, in this case, most likely due to dampening of frequency. The remaining two solitary micropit
DIC TRITC
GS
A
20 µm
0
50
100
150
200
F (i.
u.)
∗
GFA
P
C
GLA
ST
B
010
2030
40
506070
F (i.
u.)
Pit Non-pit
1º − + − +
(8) (26) (13) (19)
(12) (17) (18) (25)
(12) (22) (18) (25)
0
20
40
60
80
100
F (i.
u.)
1º − + − +
Pit Non-pit
Pit Non-pit
1º −− + −− +
FIGURE 5 | Astrocytes in micropits express astrocytic markers. Astrocytes were labeled using primary antibodies against glutamine synthetase (GS), plasma membrane glutamate aspartate transporter (GLAST), or glial fi brillay acidic protein (GFAP) followed by TRITC-conjugated secondary antibodies (A–C). The images in each panel show fl uorescence of solitary cells in micropits (top), small networks of cells in micropits (middle), and grouped non-micropit cells (bottom) with the corresponding differential interference contrast (DIC) images
shown on the left. The bar graphs on the right of each panel show the quantifi cation of fl uorescence intensity (F) in intensity units (i.u.) within the camera’s dynamic range (0–4095) shown as mean ± SEM; 1° indicates the presence (+) or absence (−) of primary antibody against the astrocytic marker. The numbers of cells tested are shown in parentheses. The GFAP labeling was signifi cantly higher in micropit astrocytes compared to non-micropit astrocytes (Student’s t-test; *p < 0.05).
Frontiers in Neuroengineering www.frontiersin.org December 2008 | Volume 1 | Article 2 | 10
Lee et al. Astrocytic micropit culture
dF/F
o (%
)
A
0
4000
8000
12000
0
100
200
300
400
500 ∗
100 µM glutamate
0
50
100
150
200
250
0
2000
4000
6000
8000
0
100
200
300
400
0
2000
4000
6000
8000
0
100
200
300
400
0
4000
8000
12000
16000
20000
∗
0
200
400
600
0
5000
10000
15000
20000
dF/F
o (%
)dF
/Fo
(%)
B
C
D
E
dF/F
o (%
) 100 µM ATP
100 µM NE
1 µM BK
dF/F
o (%
)
Time (s)
Time (s)
Time (s)
Time (s)
Time (s)
0
30
60
90
120
150
MechanicalNon-pitPit
0
100
200
300
400
500
0
50
100
150
200
250
300
0
100
200
300
400
500
0
100
200
300
400
0
0 50 100 150 200
0 50 100 150 200
0 50 100 150 200
0 50 100 150 200
100 200 300 400
Cumulative
Non-pit(6)
Pit(8)
Non-pit(6)
Pit(8)
Non-pit(29)
Pit(5)
Non-pit(29)
Pit(5)
Non-pit(17)
Pit(6)
Non-pit(17)
Pit(6)
Non-pit(10)
Pit(6)
Non-pit(10)
Pit(6)
Non-pit(36)
Pit(5)
Non-pit(36)
Pit(5)
Peak
FIGURE 6 | Intracellular Ca2+ dynamics of astrocytes on micropatterned
coverslips. (A–E) Comparison between the intracellular Ca2+ dynamics of solitary astrocytes in micropits and single astrocytes grown within grouped astrocytes in non-micropit regions after mechanical or agonist stimulation. The graphs on the left side represent fl uo-3 fl uorescence changes expressed as dF/Fo (%), with the points and error bars representing the mean and SEM (shown only in one direction for clarity). The arrow in panel (A) denotes the time that mechanical stimulation was applied to the cell. Horizontal bars in
graphs (B–E) indicate the application of agonists: ATP, adenosine 5’-triphosphate; NE, norepinephrine; BK, bradykinin. Two sets of bar graphs on the right show quantifi cation of cumulative and peak intracellular Ca2+ responses in astrocytes grown in micropit and non-pit regions of coverslips. The numbers of cells tested are shown in parentheses. The peak Ca2+ responses in non-micropit cells were signifi cantly higher (Student’s t-test; *p < 0.05) than in solitary micropit cells, upon mechanical (A) or NE stimulation (C).
Frontiers in Neuroengineering www.frontiersin.org December 2008 | Volume 1 | Article 2 | 11
Lee et al. Astrocytic micropit culture
astrocytes did not show dampening of peak amplitude/frequency; one of them showed two peaks of equal power, while the other one displayed a complex power spectrum with peaks at variable
frequencies and variable powers, similar to power spectra seen in single cells within a group of astrocytes in non-micropit region. In contrast, the [Ca2+]
i response and power spectrum of a single
–50
50
150
250
350
450
550
0 20 40 60 80 100 120 140 160 180 0 20 40 60 80 100 120 140 160 180
100 μM ATP
dF/F
o (%
)
Time (s)
0
2.0×10³
4.0×10³
6.0×10³
Pow
er s
pect
ral d
ensi
ty (a
.u.)
A
A = 105 mHzB = 90 mHzC = 70 mHzD = 39 mHzE = 27 mHzB
CE D
C
–50
0
50
100
150
200
250100 μM ATP
dF/F
o (%
)
D
F
Cell 1Cell 2
A = 82 mHzB = 164 mHzC = 246 mHz
Pow
er s
pect
ral d
ensi
ty (a
.u.)
E
0
4.0×10³
8.0×10³
1.2×10⁴
1.6×10⁴
2.0×10⁴
0 50 100 150 200 250 300 0 50 100 150 200 250 300
A
B
C
A = 27 mHzB = 47 mHzC = 70 mHzD = 98 mHz
A
BC
D
Cell 1
Cell 2
Frequency (mHz) Frequency (mHz)
Time (s)
1400
112
F (i.
u.)
A B
20 µm
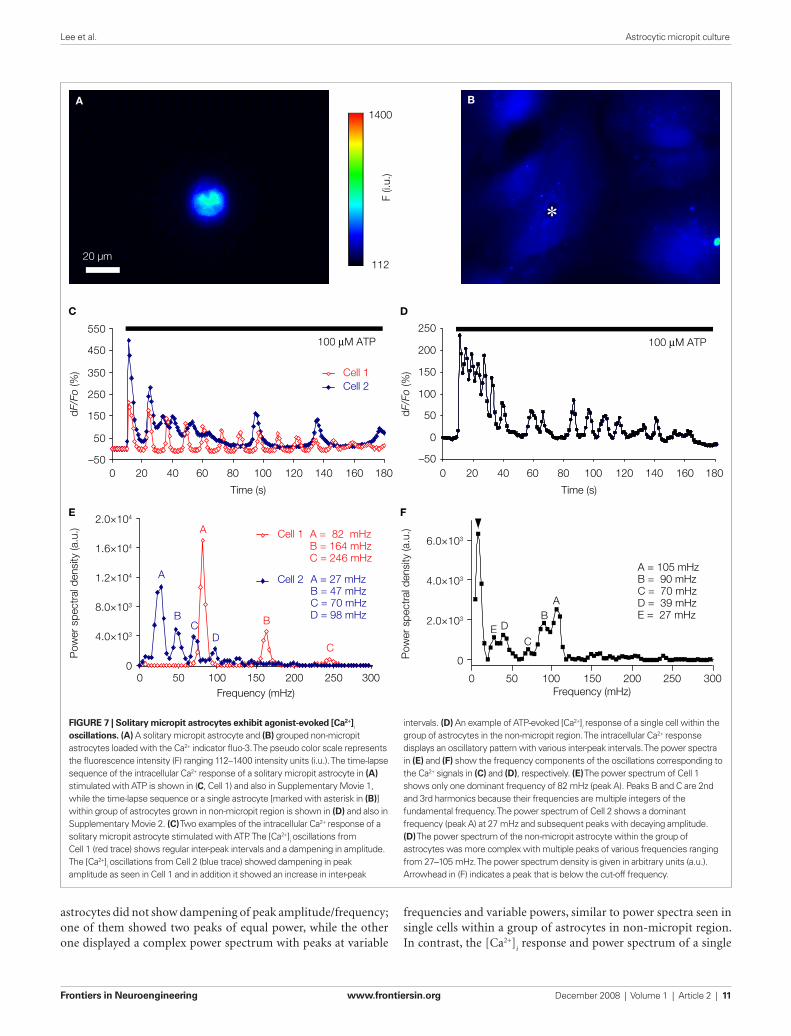
FIGURE 7 | Solitary micropit astrocytes exhibit agonist-evoked [Ca2+]i
oscillations. (A) A solitary micropit astrocyte and (B) grouped non-micropit astrocytes loaded with the Ca2+ indicator fl uo-3. The pseudo color scale represents the fl uorescence intensity (F) ranging 112–1400 intensity units (i.u.). The time-lapse sequence of the intracellular Ca2+ response of a solitary micropit astrocyte in (A) stimulated with ATP is shown in (C, Cell 1) and also in Supplementary Movie 1, while the time-lapse sequence or a single astrocyte [marked with asterisk in (B)] within group of astrocytes grown in non-micropit region is shown in (D) and also in Supplementary Movie 2. (C) Two examples of the intracellular Ca2+ response of a solitary micropit astrocyte stimulated with ATP. The [Ca2+]i oscillations from Cell 1 (red trace) shows regular inter-peak intervals and a dampening in amplitude. The [Ca2+]i oscillations from Cell 2 (blue trace) showed dampening in peak amplitude as seen in Cell 1 and in addition it showed an increase in inter-peak
intervals. (D) An example of ATP-evoked [Ca2+]i response of a single cell within the group of astrocytes in the non-micropit region. The intracellular Ca2+ response displays an oscillatory pattern with various inter-peak intervals. The power spectra in (E) and (F) show the frequency components of the oscillations corresponding to the Ca2+ signals in (C) and (D), respectively. (E) The power spectrum of Cell 1 shows only one dominant frequency of 82 mHz (peak A). Peaks B and C are 2nd and 3rd harmonics because their frequencies are multiple integers of the fundamental frequency. The power spectrum of Cell 2 shows a dominant frequency (peak A) at 27 mHz and subsequent peaks with decaying amplitude. (D) The power spectrum of the non-micropit astrocyte within the group of astrocytes was more complex with multiple peaks of various frequencies ranging from 27–105 mHz. The power spectrum density is given in arbitrary units (a.u.). Arrowhead in (F) indicates a peak that is below the cut-off frequency.
Frontiers in Neuroengineering www.frontiersin.org December 2008 | Volume 1 | Article 2 | 12
Lee et al. Astrocytic micropit culture
cell within a group of astrocytes in non-micropit region exhibited a greater degree of variability which might be due to cross-talk between astrocytes via the intercellular communication pathways that are present in grouped astrocytes as mentioned above. The major category of grouped astrocytes (8 out of 17; 47%) exhibited complex ATP-evoked [Ca2+]
i oscillations (Figures 7B,D) and also
complex power spectrum with peaks at variable frequencies and variable powers (Figure 7F). The remaining grouped astrocytes (53%) could be categorized between three equally represented types (three cells in each category): (1) astrocytes that displayed no signifi cant power spectrum peaks above the cut-off frequency; (2) astrocytes showing only a single power spectrum peak (i.e., Cell 1 type, but lacking harmonics); and (3) astrocytes showing power spectrum peaks with amplitude decay and change in frequency (Cell 2 type). Further comparison of ATP-evoked [Ca2+]
i elevations
between solitary micropit and non-micropit astrocytes (Table 1) indicates that the normalized peak Ca2+ responses in subsequent oscillation peaks were generally higher with longer interpeak intervals in solitary micropit astrocytes when compared to non-micropit astrocytes. Altogether, the astrocytes with intact inter-cellular communication pathways exhibited a more variable Ca2+ response when compared to solitary micropit astrocytes. Thus, the design of our micropattern cell culture approach achieved the goal of reducing the complexity due to intercellular communication among cells in groups.
Astrocytes can undergo Ca2+-dependent release of gliotrans-mitters such as glutamate (Parpura et al., 1994) and ATP (Coco et al., 2003; Pangrsic et al., 2007). Therefore, we tested the ability of solitary micropit astrocytes to undergo Ca2+-dependent release of glutamate induced by mechanical stimulation. The release of ATP from astrocytes was tested using astrocyte-microglia sign-aling (see below). To examine glutamate release from solitary micropit astrocytes, we used an optical approach that has been previously used to visualize mechanical stimulation-evoked glutamate release from astrocytes (Hua et al., 2004; Innocenti et al., 2000; Malarkey et al., 2008). We imaged glutamate release at two different focal planes, and NADH fl uorescence intensity was analyzed in the regions of interest (ROIs) adjacent to the cell (Figure 8A) At focal plane A, which was at the level just above the rim of the micropit, the GDH enzyme in the presence of gluta-mate can convert NAD+ to NADH, which fl uoresces when excited using a DAPI fi lter set. However, at focal plane B, which was at the level of the cell in the micropit just above the cell interface
with the coverslip, the ROIs would fall within the agarose which is less accessible to GDH.
We verifi ed that the ROIs at focal plane B reported on fl uo-rescence changes within the agarose at the glass coverslip-agarose interface, by calculating the depth of fi eld for the 40× objective using the equation:
δ = 2nλ/NA2 (1)
where δ is the depth of fi eld, n is the refractive index of the hydrated agarose (1.38) (Chen-Izu et al., 2006; Hollingworth et al., 2000), λ
Table 1 | Summary of ATP-evoked [Ca2+]i oscillation in solitary micropit and grouped non-micropit astrocytes.
Oscillation peak 1 2 3 4 5 6 7 8 9 10
Solitary micropit astrocytes
Proportion of cells 6/6 6/6 6/6 5/6 5/6 5/6 5/6 5/6 4/6 2/6
Normalized peak amplitude (%) mean 100 67 47 32 19 22 21 14 18 16
Interpeak interval (s) mean N/A 15 14 27 13 21 18 18 22 25
Grouped non-micropit astrocytes
Proportion of cells 17/17 15/17 15/17 15/17 15/17 15/17 15/17 15/17 15/17 14/17
Normalized peak amplitude (%) mean 100 42 31 26 22 17 17 14 10 7
Interpeak interval (s) mean N/A 16 15 10 12 11 12 12 11 12
Side viewTop view
dF/F
o (%
)
Time (s)
focal plane Afocal plane B
A
B focal plane Afocal plane B
–10
0
10
20
30
40
0 40 80 120 140 200
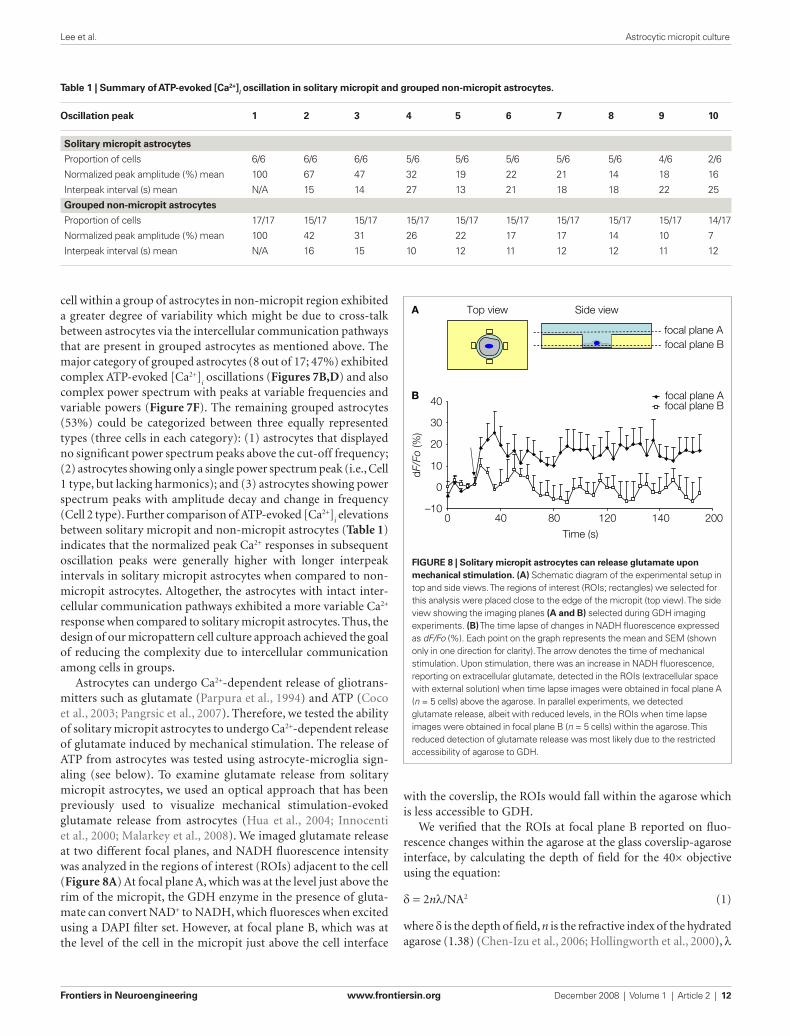
FIGURE 8 | Solitary micropit astrocytes can release glutamate upon
mechanical stimulation. (A) Schematic diagram of the experimental setup in top and side views. The regions of interest (ROIs; rectangles) we selected for this analysis were placed close to the edge of the micropit (top view). The side view showing the imaging planes (A and B) selected during GDH imaging experiments. (B) The time lapse of changes in NADH fl uorescence expressed as dF/Fo (%). Each point on the graph represents the mean and SEM (shown only in one direction for clarity). The arrow denotes the time of mechanical stimulation. Upon stimulation, there was an increase in NADH fl uorescence, reporting on extracellular glutamate, detected in the ROIs (extracellular space with external solution) when time lapse images were obtained in focal plane A (n = 5 cells) above the agarose. In parallel experiments, we detected glutamate release, albeit with reduced levels, in the ROIs when time lapse images were obtained in focal plane B (n = 5 cells) within the agarose. This reduced detection of glutamate release was most likely due to the restricted accessibility of agarose to GDH.
Frontiers in Neuroengineering www.frontiersin.org December 2008 | Volume 1 | Article 2 | 13
Lee et al. Astrocytic micropit culture
is the wavelength of emitted light (0.46 µm), and NA is the numeri-cal aperture of the objective (1.3). The calculated depth of fi eld was 0.75 µm. Owing to the thickness of agarose (50 µm), the ROIs at focal plane B thus reported on fl uorescence changes within the agarose layer at the interface with the glass coverslip. Indeed, upon mechanical stimulation of the solitary micropit astrocytes, we found signifi cant elevation of NADH fl uorescence in the ROIs at both the focal plane A (n = 5; peak dF/Fo = 32 ± 7%; p < 0.05, paired t-test) and the focal plane B (n = 5; peak dF/Fo = 20 ± 5%; p < 0.05, paired t-test), indicating the ability of these cells to release glutamate (Figure 8B). Consistent with the reduced accessibility of agarose gel to GDH, the fl uorescence intensity in focal plane B was 62% of that recorded from focal plane A. Taken together, our data show that astrocytes in micropits exhibit intracellular Ca2+ responses to mechanical and agonist stimulations and that these cells can undergo consequential Ca2+-dependent glutamate release.
ASTROCYTE-MICROGLIA SIGNALINGCommunication from astrocytes to microglia has previously been shown to be ATP-mediated (Verderio and Matteoli, 2001) and this form of signaling is important for the recruitment of microglia to sites of injury in the central nervous system (Davalos et al., 2005; Kurpius et al., 2007). Here, we tested whether this form of heterocellular signaling is intact in solitary micropit astrocytes co-inhabited by microglia (Figures 9A,B). We performed focal mechanical stimulation to a solitary micropit astrocytes to cause Ca2+-dependent ATP release (Coco et al., 2003; Pangrsic et al., 2007) while observing changes in [Ca2+]
i in adjacent microglial
cells within the micropit. The [Ca2+]i in both cell types was moni-
tored simultaneously by loading astrocytes with the Ca2+ indica-tor Fura Red, while fl uo-3 was loaded in microglia. Mechanical stimulation of solitary micropit astrocytes caused a decrease in fl uorescence in the stimulated astrocyte, and an increase in fl uo-rescence in the adjacent microglia; both of these fl uorescence intensity changes indicated an elevation of [Ca2+]
i in these cells
(Figure 9B, left column and Figure 9C, top graph). The peak Ca2+ response in Fura Red loaded astrocytes evoked by mechanical stimulation was −34 ± 5% (Figure 9D). This value is comparable to an astrocytic response of ~200% in fl uo-3 loaded astrocytes (Figure 6A), when the difference in affi nity for Ca2+ of two dyes is taken into account (Thomas et al., 2000). In the microglial cell, after the initial increase of fl uorescence there was a recovery followed by a decrease in fl uorescence to levels below the initial intensity at rest (Figure 9C, top graph). This could be caused by photobleaching of the fl uo-3 or its loss via fusion of secretory vesicles containing fl uo-3 (Bolsover and Silver, 1991).
To determine whether astrocyte-microglia intercellular com-munication is mediated by released ATP, we performed the same experimental procedure as above while blocking ATP recep-tors. Suramin (100 µM), a non-selective P2-receptor antagonist, was applied throughout the experiment and also during a pre- incubation period (5 min). The treatment with suramin com-pletely abolished the astrocyte-microglial signaling (Figure 9B, right column; Figure 9C, bottom graph). When we examined the effect of suramin on the peak Ca2+ responses in stimulated soli-tary micropit astrocytes, suramin application signifi cantly reduced
the peak amplitude, indicating that this rise in astrocytic [Ca2+]i is
mediated by the autocrine action of ATP (Figure 9D). These results are in good agreement with the existence of purinergic astrocyte- microglia signaling (Verderio and Matteoli, 2001) and autocrine effects of ATP released from astrocytes (Shiga et al., 2001).
DIFFUSION OF GLIOTRANSMITTERS BETWEEN MICROPITSIn our design of the micropit mold, we considered intercellular communication between cells residing in neighboring micropits via extracellularly released gliotransmitters. Our goal was to create a mold design allowing for suffi cient cell occupancy in the micro-pits (Figure 4), while minimizing the intercellular communication between cells in neighboring micropits. We therefore modeled the diffusion of glutamate release from a solitary micropit astrocyte to determine the optimal inter-pit distance. In our diffusion model we treated the diffusion of glutamate from a single astrocyte in micropit as a point source of glutamate released into a semi-infi nite volume (Crank, 1975). Here, a general solution of 3D-diffusion equation is given by:
C r tM
Dt
er
Dt( )
( )
, =4
3
2
4
2
π
−
(2)
where M is the initial number of molecules at the point source, D is the diffusion coeffi cient, r is the distance from point source, C is the concentration of transmitter in a hemispherical shell at time t and distance r.
In previous studies that optically examined mechanical stimu-lation-evoked glutamate release from cultured astrocytes, the range of extracellular glutamate surrounding cells was found to be 1–100 µM (Innocenti et al., 2000). Therefore, we chose 100 µM as the initial extracellular glutamate concentration within the hemispherical volume of the micropit, and this corresponds to an M of 6.8 × 10¹¹ molecules at the point source in the simulation model. Although mechanical stimulation causes release of gluta-mate and ATP (Figures 8 and 9), the diffusion of ATP is slower compared to glutamate, so we only modeled diffusion of glutamate (Figure 10). The diffusion coeffi cient at 25°C in solution for ATP is 3.7 × 10⁻⁶ cm2/s (Hubley et al., 1996) and 7.6 × 10⁻⁶ cm2/s for glutamate (Longsworth, 1953).
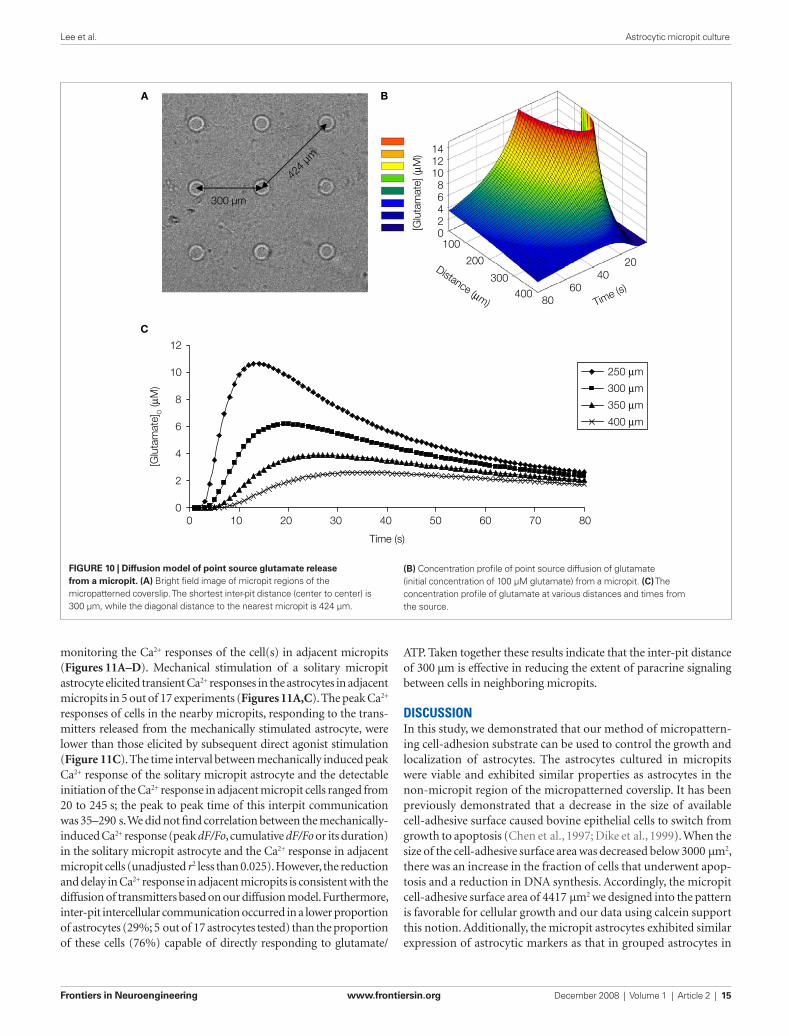
In our diffusion model, at a distance of 300 µm away from the point source, which is comparable to the distance between the micropits (Figure 10A) the peak glutamate concentration calcu-lated is ~6 µM at 20 s after release (Figures 10B,C). This implies that we should record some intercellular communication between astrocytes since they express functional glutamate and/or ATP receptors (Figures 6B,C). Indeed, we confi rmed that astrocytes in micropits respond to a puffer application of glutamate (8 out of 10 astrocytes tested; 100 µM; Figure 11A, right panels) and ATP (5 out of 7 astrocytes tested; 100 µM). Thus, 76% of micropit astrocytes originating form the visual cortex respond to glutamate/ATP. In comparison, glutamate and ATP evoked Ca2+ responses occurred in ~80% and 90% of astrocytes in acute hippocampal slices at 10 and 100 µM of bath applied transmitter, respectively (see Figure 5 in Zur Nieden and Deitmer, 2006). Therefore, the responsiveness of micropit astrocytes to ATP and glutamate are in good agreement with that of astrocytes in acute slices, especially when considered
Frontiers in Neuroengineering www.frontiersin.org December 2008 | Volume 1 | Article 2 | 14
Lee et al. Astrocytic micropit culture
that the puffer application could lead to up to a 10-fold dilution of the transmitter when compared to bath application (Parpura et al., 1994).
To test for intercellular communication between astrocytes in neighboring micropits, we performed mechanical stimulation of a solitary astrocyte in one micropit to evoke transmitter release while
20 μm
dF/F
o (%
)
Time (s)
CA
suramin
20 s
150 1000 150 1300
– +
0 50 100 150 200 250
0 50 100 150 200 250
– +
(5) (7) (6) (8)
0 s 0 s
20 s
30 μm
+−
DIC
DA
PI
FITC
-LP
FITC
-LP
D
B
MicrogliaAstrocyte
–40
–20
0
20
40
60
80
dF/F
o (%
)
Time (s)
100 μM suramin
Suramin
–50
0
50
100
150
200
dF/F
o (%
)
*
*
Microglia
Astrocyte
–40
–20
0
20
40
60
80
F (i.u.) F (i.u.)
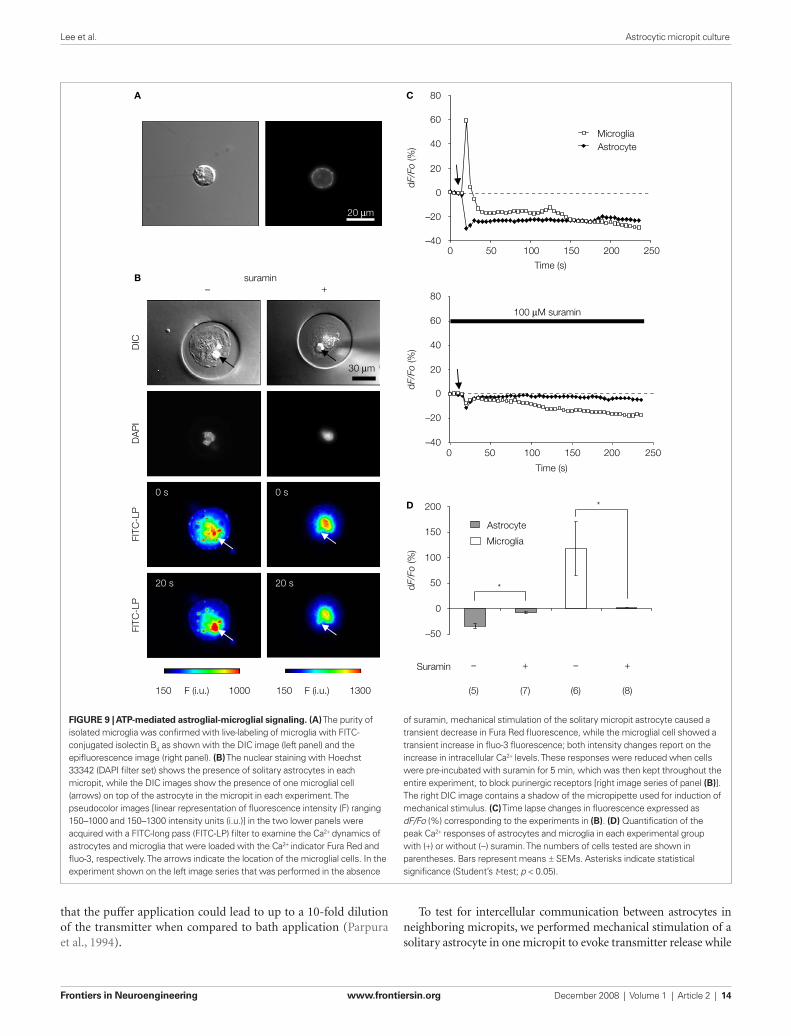
FIGURE 9 | ATP-mediated astroglial-microglial signaling. (A) The purity of isolated microglia was confi rmed with live-labeling of microglia with FITC-conjugated isolectin B4 as shown with the DIC image (left panel) and the epifl uorescence image (right panel). (B) The nuclear staining with Hoechst 33342 (DAPI fi lter set) shows the presence of solitary astrocytes in each micropit, while the DIC images show the presence of one microglial cell (arrows) on top of the astrocyte in the micropit in each experiment. The pseudocolor images [linear representation of fl uorescence intensity (F) ranging 150–1000 and 150–1300 intensity units (i.u.)] in the two lower panels were acquired with a FITC-long pass (FITC-LP) fi lter to examine the Ca2+ dynamics of astrocytes and microglia that were loaded with the Ca2+ indicator Fura Red and fl uo-3, respectively. The arrows indicate the location of the microglial cells. In the experiment shown on the left image series that was performed in the absence
of suramin, mechanical stimulation of the solitary micropit astrocyte caused a transient decrease in Fura Red fl uorescence, while the microglial cell showed a transient increase in fl uo-3 fl uorescence; both intensity changes report on the increase in intracellular Ca2+ levels. These responses were reduced when cells were pre-incubated with suramin for 5 min, which was then kept throughout the entire experiment, to block purinergic receptors [right image series of panel (B)]. The right DIC image contains a shadow of the micropipette used for induction of mechanical stimulus. (C) Time lapse changes in fl uorescence expressed as dF/Fo (%) corresponding to the experiments in (B). (D) Quantifi cation of the peak Ca2+ responses of astrocytes and microglia in each experimental group with (+) or without (−) suramin. The numbers of cells tested are shown in parentheses. Bars represent means ± SEMs. Asterisks indicate statistical signifi cance (Student’s t-test; p < 0.05).
Frontiers in Neuroengineering www.frontiersin.org December 2008 | Volume 1 | Article 2 | 15
Lee et al. Astrocytic micropit culture
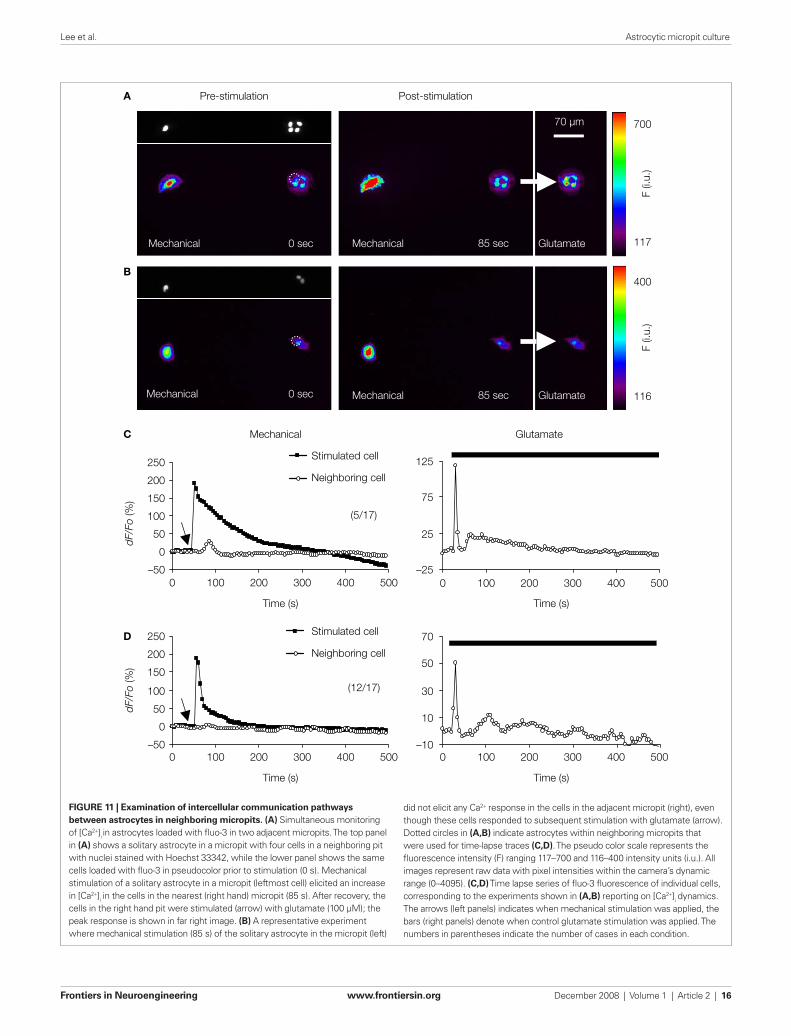
monitoring the Ca2+ responses of the cell(s) in adjacent micropits (Figures 11A–D). Mechanical stimulation of a solitary micropit astrocyte elicited transient Ca2+ responses in the astrocytes in adjacent micropits in 5 out of 17 experiments (Figures 11A,C). The peak Ca2+ responses of cells in the nearby micropits, responding to the trans-mitters released from the mechanically stimulated astrocyte, were lower than those elicited by subsequent direct agonist stimulation (Figure 11C). The time interval between mechanically induced peak Ca2+ response of the solitary micropit astrocyte and the detectable initiation of the Ca2+ response in adjacent micropit cells ranged from 20 to 245 s; the peak to peak time of this interpit communication was 35–290 s. We did not fi nd correlation between the mechanically-induced Ca2+ response (peak dF/Fo, cumulative dF/Fo or its duration) in the solitary micropit astrocyte and the Ca2+ response in adjacent micropit cells (unadjusted r2 less than 0.025). However, the reduction and delay in Ca2+ response in adjacent micropits is consistent with the diffusion of transmitters based on our diffusion model. Furthermore, inter-pit intercellular communication occurred in a lower proportion of astrocytes (29%; 5 out of 17 astrocytes tested) than the proportion of these cells (76%) capable of directly responding to glutamate/
ATP. Taken together these results indicate that the inter-pit distance of 300 µm is effective in reducing the extent of paracrine signaling between cells in neighboring micropits.
DISCUSSIONIn this study, we demonstrated that our method of micropattern-ing cell-adhesion substrate can be used to control the growth and localization of astrocytes. The astrocytes cultured in micropits were viable and exhibited similar properties as astrocytes in the non-micropit region of the micropatterned coverslip. It has been previously demonstrated that a decrease in the size of available cell-adhesive surface caused bovine epithelial cells to switch from growth to apoptosis (Chen et al., 1997; Dike et al., 1999). When the size of the cell-adhesive surface area was decreased below 3000 µm2, there was an increase in the fraction of cells that underwent apop-tosis and a reduction in DNA synthesis. Accordingly, the micropit cell-adhesive surface area of 4417 µm2 we designed into the pattern is favorable for cellular growth and our data using calcein support this notion. Additionally, the micropit astrocytes exhibited similar expression of astrocytic markers as that in grouped astrocytes in
BA
0
2
4
6
8
10
12
0 10 20 30 40 50 60 70 80
Time (s)
[Glu
tam
ate]
O (μ
M)
250 μm
300 μm
350 μm
400 μm
C
300 µm
424
µm
14
[Glu
tam
ate]
(μM
)
1210
86420100
200
300
400
Distance (μm) 8060
4020
Time (s)
FIGURE 10 | Diffusion model of point source glutamate release
from a micropit. (A) Bright fi eld image of micropit regions of the micropatterned coverslip. The shortest inter-pit distance (center to center) is 300 µm, while the diagonal distance to the nearest micropit is 424 µm.
(B) Concentration profi le of point source diffusion of glutamate (initial concentration of 100 µM glutamate) from a micropit. (C) The concentration profi le of glutamate at various distances and times from the source.
Frontiers in Neuroengineering www.frontiersin.org December 2008 | Volume 1 | Article 2 | 16
Lee et al. Astrocytic micropit culture
B
A Pre-stimulation Post-stimulation
Mechanical 85 secMechanical
85 secMechanicalMechanical
700
117Glutamate
400
116
F (i.
u.)
Glutamate
F (i.
u.)
70 µm
0 sec
0 sec
D
C
(5/17)
–50
0
50
100
150
200
250
0 100 200 300 400 500
0 100 200 300 400 500 0 100 200 300 400 500
0 100 200 300 400 500
Stimulated cell
Neighboring cell
Time (s)
Mechanical
dF/F
o (%
)
Glutamate
Time (s)
–25
25
75
125
–10
10
30
50
70
–50
0
50
100
150
200
250
dF/F
o (%
)
Time (s)Time (s)
(12/17)
Stimulated cell
Neighboring cell
FIGURE 11 | Examination of intercellular communication pathways
between astrocytes in neighboring micropits. (A) Simultaneous monitoring of [Ca2+]i
in astrocytes loaded with fl uo-3 in two adjacent micropits. The top panel in (A) shows a solitary astrocyte in a micropit with four cells in a neighboring pit with nuclei stained with Hoechst 33342, while the lower panel shows the same cells loaded with fl uo-3 in pseudocolor prior to stimulation (0 s). Mechanical stimulation of a solitary astrocyte in a micropit (leftmost cell) elicited an increase in [Ca2+]i in the cells in the nearest (right hand) micropit (85 s). After recovery, the cells in the right hand pit were stimulated (arrow) with glutamate (100 µM); the peak response is shown in far right image. (B) A representative experiment where mechanical stimulation (85 s) of the solitary astrocyte in the micropit (left)
did not elicit any Ca2+ response in the cells in the adjacent micropit (right), even though these cells responded to subsequent stimulation with glutamate (arrow). Dotted circles in (A,B) indicate astrocytes within neighboring micropits that were used for time-lapse traces (C,D). The pseudo color scale represents the fl uorescence intensity (F) ranging 117–700 and 116–400 intensity units (i.u.). All images represent raw data with pixel intensities within the camera’s dynamic range (0–4095). (C,D) Time lapse series of fl uo-3 fl uorescence of individual cells, corresponding to the experiments shown in (A,B) reporting on [Ca2+]i dynamics. The arrows (left panels) indicates when mechanical stimulation was applied, the bars (right panels) denote when control glutamate stimulation was applied. The numbers in parentheses indicate the number of cases in each condition.
Frontiers in Neuroengineering www.frontiersin.org December 2008 | Volume 1 | Article 2 | 17
Lee et al. Astrocytic micropit culture
non-micropit regions. The exception was GFAP, which appears to be upregulated in solitary astrocytes within micropits. Since upregulation of GFAP protein expression is a hallmark of reactive astrocytes, the increase in GFAP expression in micropit astrocytes may suggest that they are more reactive than those astrocytes grown in the non-micropit regions.
By designing the micropits to be 300 µm apart from each other, we reduced the extent of paracrine signaling between astrocytes in neighboring micropits. Additionally, by growing solitary astro-cytes within micropits, it appears that the ATP-evoked [Ca2+]
i oscil-
lations in solitary micropit astrocytes become less variable and display more pronounced peaks than those of grouped astrocytes in non- micropit regions (Figure 7). This fi nding may implicate a role for astrocytic connectivity in intracellular Ca2+ oscillations. The follow-up investigations determining the role of connectivity would require a systematic approach to compare Ca2+ dynamics in solitary vs. small networks (i.e., 2–6) of astrocytes grown in micro-pits. Consequently, the repertoire of molecules that may govern differences in Ca2+ oscillations in astrocytes could be investigated using micropit cultures. It is then tempting to speculate that pos-sible correlations between Ca2+ oscillations/dynamics induced by various physiological stimuli and the morphology of the astrocytes, their protein expression, or their connectivity may be used to defi ne functional classes of astrocytes (for review on basic principal of astrocytic classifi cation, see Kimelberg, 2009). Similarly, the isola-tion provided by the micropit system could be used to compare the properties of astrocytes isolated from various regions of the brain, especially that astrocytes have been shown to exhibit brain region-specifi c properties (Kipp et al., 2008; Peters et al., 2005; Zschocke et al., 2005).
Micropit cultures can also be used to characterize glial–glial (astrocyte–microglia) interactions (Figure 9). We showed that mechanical stimulation of astrocytes elicited ATP-mediated astrocytic-microglial signaling and these results were consist-ent with studies of cultured astrocytes with intact intercellular communication pathways (Verderio and Matteoli, 2001). Similar
pre-existing culturing systems using microislands have been used previously to study neuronal-glial bi-directional signaling, where a single neuron was cultured onto small groups of astrocytes (Mennerick and Zorumski, 1994; Parpura and Haydon, 2000). Although we have not systematically investigated the viability of neurons grown in micropits, we have observed live neurons in 8-day old mixed cultures originating from visual cortices (unpub-lished observation). Nonetheless, the advantage of micropit over microisland culture in studying glial-neuronal interactions is that with micropits it is possible to generate the most simplistic scenario to study astrocytic-neuronal signaling, where a single astrocyte interacts with a single neuron. Since single neurons can form synapses to themselves, autapses, and astrocytes can modulate synaptic transmission and plasticity (reviewed in Ni et al., 2007), the use of this one neuron-one astrocyte culturing system could be utilized to better understand the bi-directional information fl ow between the components of the tripartite syn-apse (Araque et al., 1999).
ACKNOWLEDGEMENTSWe thank Daniel Adams from University of California at Riverside Microfabrication Facility for help with construction of master mold, Nathan Reiland PE for his help with CAD images, Dr. Umar Mohideen for lending us a J scanner, Dr. Wei Liu for his discus-sion on diffusion model and Dr. Yingchun Ni for help with the initial glutamate release measurements in micropit cultures. This work is supported by a grant from the National Institute of Mental Health (MH 069791 to VP) and the National Institute of Heath Neuroscience Training Program in Neurobiology of Cognition and Cognitive Disorders at University of Alabama, Birmingham (to RCR).
SUPPLEMENTARY MATERIALSupplementary Movies 1 and 2 can be found on the journal website at the following address: http://www.frontiersin.org/neuroengineering/paper/10.3389/neuro.16/002.2008/.
REFERENCESAizman, O., Uhlen, P., Lal, M., Brismar, H.,
and Aperia, A. (2001). Ouabain, a ster-oid hormone that signals with slow calcium oscillations. Proc. Natl. Acad. Sci. U.S.A. 98, 13420–13424.
Araque, A., Parpura, V., Sanzgiri, R. P., and Haydon, P. G. (1999). Tripartite syn-apses: glia, the unacknowledged part-ner. Trends Neurosci. 22, 208–215.
Bekkers, J. M., and Stevens, C. F. (1991). Excitatory and inhibitory autaptic cur-rents in isolated hippocampal neurons maintained in cell culture. Proc. Natl. Acad. Sci. U.S.A. 88, 7834–7838.
Bolsover, S., and Silver, R. A. (1991). Artifacts in calcium measurement: recognition and remedies. Trends Cell Biol. 1, 71–74.
Charles, A. C., Dirksen, E. R., Merrill, J. E., and Sanderson, M. J. (1993). Mechanisms of intercellular calcium signaling in glial cells studied with
dantrolene and thapsigargin. Glia 7, 134–145.
Charles, A. C., Merrill, J. E., Dirksen, E. R., and Sanderson, M. J. (1991). Intercellular signaling in glial cells: calcium waves and oscillations in response to mechanical stimulation and glutamate. Neuron 6, 983–992.
Chen, C. S., Mrksich, M., Huang, S., Whitesides, G. M., and Ingber, D. E. (1997). Geometric control of cell life and death. Science 276, 1425–1428.
Chen-Izu, Y., McCulle, S. L., Ward, C. W., Soeller, C., Allen, B. M., Rabang, C., Cannell, M. B., Balke, C. W., and Izu, L. T. (2006). Three-dimensional distribution of ryanodine receptor clusters in cardiac myocytes. Biophys. J. 91, 1–13.
Coco, S., Calegari, F., Pravettoni, E., Pozzi, D., Taverna, E., Rosa, P., Matteoli, M., and Verderio, C. (2003). Storage and release of ATP from
astrocytes in culture. J. Biol. Chem. 278, 1354–1362.
Cornell-Bell, A. H., Finkbeiner, S. M., Cooper, M. S., and Smith, S. J. (1990). Glutamate induces calcium waves in cultured astrocytes: long-range glial signaling. Science 247, 470–473.
Crank, J. (1975). The Mathematics of Diffusion. Oxford, Clarendon.
Davalos, D., Grutzendler, J., Yang, G., Kim, J. V., Zuo, Y., Jung, S., Littman, D. R., Dustin, M. L., and Gan, W.-B. (2005). ATP mediates rapid microglial response to local brain injury in vivo. Nat. Neurosci. 8, 752–758.
Dieck, S. T., Heuer, H., Ehrchen, J., Otto, C., and Bauer, K. (1999). The peptide transporter PepT2 is expressed in rat brain and mediates the accumulation of the fl uorescent dipeptide derivative beta-Ala-Lys-Nepsilon-AMCA in astrocytes. Glia 25, 10–20.
Dike, L. E., Chen, C. S., Mrksich, M., Tien, J., Whitesides, G.M., and Ingber, D. E. (1999). Geometric con-trol of switching between growth, apoptosis, and differentiation during angiogenesis using micropatterned substrates. In Vitro Cell. Dev. Biol. Anim. 35, 441–448.
Haydon, P. G., and Carmignoto, G. (2006). Astrocyte control of synaptic trans-mission and neurovascular coupling. Physiol. Rev. 86, 1009–1031.
Hollingworth, S., Soeller, C., Baylor, S. M., and Cannell, M. B. (2000). Sarcomeric Ca2+ gradients during activation of frog skeletal muscle fi bres imaged with confocal and two-photon microscopy. J. Physiol. 526(Pt 3), 551–560.
Hua, X., Malarkey, E. B., Sunjara, V., Rosenwald, S. E., Li, W. H., and Parpura, V. (2004). Ca2+-dependent glutamate release involves two classes of endoplasmic reticulum Ca2+ stores
Frontiers in Neuroengineering www.frontiersin.org December 2008 | Volume 1 | Article 2 | 18
Lee et al. Astrocytic micropit culture
in astrocytes. J. Neurosci. Res. 76, 86–97.
Hubley, M. J., Locke, B. R., and Moerland, T. S. (1996). The effects of temperature, pH, and magnesium on the diffusion coefficient of ATP in solutions of physiological ionic strength. Biochim. Biophys. Acta 1291, 115–121.
Innocenti, B., Parpura, V., and Haydon, P. G. (2000). Imaging extra-cellular waves of glutamate during cal-cium signaling in cultured astrocytes. J. Neurosci. 20, 1800–1808.
Jabs, R., Seifert, G., and Steinhauser, C. (2008). Astrocytic function and its alteration in the epileptic brain, Epilepsia 49(Suppl. 2), 3–12.
Jensen, A. M., and Chiu, S. Y. (1990). Fluorescence measurement of changes in intracellular calcium induced by excitatory amino acids in cultured cortical astrocytes. J. Neurosci. 10, 1165–1175.
Keller, D. J., and Franke, F. S. (1993). Envelope reconstruction of probe microscope images. Surf. Sci. 294, 409–419.
Kimelberg, H. K. (2009). Astrocyte hetero-geneity or homogeneity? In Astrocytes in (Patho)Physiology of the Nervous System, V. Parpura and P. G. Haydon, eds (Boston, MA, Springer).
Kipp, M., Norkute, A., Johann, S., Lorenz, L., Braun, A., Hieble, A., Gingele, S., Pott, F., Richter, J., and Beyer, C. (2008). Brain-region-specifi c astroglial responses in vitro after LPS exposure. J. Mol. Neurosci. 35, 235–243.
Kurpius, D., Nolley, E. P., and Dailey, M. E. (2007). Purines induce directed migra-tion and rapid homing of microglia to injured pyramidal neurons in develop-ing hippocampus. Glia 55, 873–884.
Longsworth, L. G. (1953). Diffusion meas-urements, at 25°, of aqueous solutions of amino acids, peptides and sugars. J. Am. Chem. Soc. 75, 5705–5709.
Malarkey, E. B., Ni, Y., and Parpura, V. (2008). Ca2+ entry through TRPC1
channels contributes to intracellu-lar Ca2+ dynamics and consequent glutamate release from rat astrocytes. Glia 56, 821–835.
Mennerick, S., and Zorumski, C. F. (1994). Glial contributions to excitatory neu-rotransmission in cultured hippocam-pal cells. Nature 368, 59–62.
Montana, V., Ni, Y., Sunjara, V., Hua, X., and Parpura, V. (2004). Vesicular glutamate transporter-dependent glutamate release from astrocytes. J. Neurosci. 24, 2633–2642.
Muyderman, H., Sinclair, J., Jardemark, K., Hansson, E., and Nilsson, M. (2001). Alpha 1-adrenergic modulation of metabotropic glutamate receptor-induced calcium oscillations and glutamate release in astrocytes. J. Biol. Chem. 276, 46504–46514.
Ni, Y., Malarkey, E. B., and Parpura, V. (2007). Vesicular release of gluta-mate mediates bidirectional signal-ing between astrocytes and neurons. J. Neurochem. 103, 1273–1284.
Pangrsic, T., Potokar, M., Stenovec, M., Kreft, M., Fabbretti, E., Nistri, A., Pryazhnikov, E., Khiroug, L., Giniatullin, R., and Zorec, R. (2007). Exocytotic release of ATP from cul-tured astrocytes. J. Biol. Chem. 282, 28749–28758.
Parpura, V., and Haydon, P. G. (2000). Physiological astrocytic calcium levels stimulate glutamate release to modulate adjacent neurons. Proc. Natl. Acad. Sci. U.S.A. 97, 8629–8634.
Parpura, V., Haydon, P. G., and Henderson, E. (1993). Three- dimensional imaging of living neu-rons and glia with the atomic force microscope. J. Cell Sci. 104(Pt 2), 427–432.
Parpura, V., Basarsky, T. A., Liu, F., Jeftinija, S., and Haydon, P. G. (1994). Glutamate-mediated astrocyte- neuron signalling. Nature 369, 744–747.
Pasti, L., Pozzan, T., and Carmignoto, G. (1995). Long-lasting changes of cal-cium oscillations in astrocytes. A new
form of glutamate- mediated plasticity. J. Biol. Chem. 270, 15203–15210.
Pasti, L., Zonta, M., Pozzan, T., Vicini, S., and Carmignoto, G. (2001). Cytosolic calcium oscillations in astrocytes may regulate exocytotic release of glutamate. J. Neurosci. 21, 477–484.
Peters, J. L., Earnest, B. J., Tjalkens, R. B., Cassone, V. M., and Zoran, M. J. (2005). Modulation of intercellular calcium signaling by melatonin in avian and mammalian astrocytes is brain region-specifi c. J. Comp. Neurol. 493, 370–380.
Recknor, J. B., Recknor, J. C., Sakaguchi, D. S., and Mallapragada, S. K. (2004). Oriented astroglial cell growth on micropatterned polystyrene substrates. Biomaterials 25, 2753–2767.
Rossi, D. J., Brady, J. D., and Mohr, C. (2007). Astrocyte metabolism and signaling during brain ischemia. Nat. Neurosci. 10, 1377–1386.
Shiga, H., Tojima, T., and Ito, E. (2001). Ca2+ signaling regulated by an ATP-dependent autocrine mecha-nism in astrocytes. Neuroreport 12, 2619–2622.
Takano, H., Sul, J. Y., Mazzanti, M. L., Doyle, R. T., Haydon, P. G., and Porter, M. D. (2002). Micropatterned substrates: approach to probing inter-cellular communication pathways. Anal. Chem. 74, 4640–4646.
Thomas, D., Tovey, S. C., Collins, T. J., Bootman, M. D., Berridge, M. J., and Lipp, P. (2000). A comparison of fl uo-rescent Ca2+ indicator properties and their use in measuring elementary and global Ca2+ signals. Cell Calcium 28, 213–223.
Tian, G. F., Takano, T., Lin, J. H., Wang, X., Bekar, L., and Nedergaard, M. (2006). Imaging of cortical astrocytes using 2-photon laser scanning microscopy in the intact mouse brain. Adv. Drug Deliv. Rev. 58, 773–787.
Uhlen, P. (2004). Spectral analysis of cal-cium oscillations. Sci. STKE 258, 115.
Uhlén, P., Laestadius, Å., Jahnukainen, T., Söderblom, T., Bäckhed, F., Celsi, G., Brismar, H., Normark, S., Aperia, A., and Richter-Dahlfors, A. (2000). Alpha-haemolysin of uropathogenic E. coli induces Ca2+ oscillations in renal epithelial cells. Nature 405, 694–697.
Verderio, C., and Matteoli, M. (2001). ATP mediates calcium signaling between astrocytes and microglial cells: mod-ulation by IFN-gamma. J. Immunol. 166, 6383–6391.
Zschocke, J., Bayatti, N., Clement, A. M., Witan, H., Figiel, M., Engele, J., and Behl, C. (2005). Differential promo-tion of glutamate transporter expres-sion and function by glucocorticoids in astrocytes from various brain regions. J. Biol. Chem. 280, 34924–34932.
Zur Nieden, R., and Deitmer, J. W. (2006). The role of metabotropic glutamate receptors for the generation of cal-cium oscillations in rat hippocampal astrocytes in situ. Cereb. Cortex 16, 676–687.
Confl ict of Interest Statement: The authors declare that the research was conducted in the absence of any commercial or fi nancial relationships that could be construed as a potential confl ict of interest.
Received: 23 July 2008; paper pend-ing published: 09 September 2008; accepted: 08 November 2008; published: 12 December 2008Citation: Lee W, Malarkey EB, Reyes RC and Parpura V (2008) Micropit: a new cell culturing approach for characterization of solitary astrocytes and small networks of these glial cells. Front. Neuroeng. (2008) 1:2. doi: 10.3389/neuro.16.002.2008Copyright: © 2008 Lee, Malarkey, Reyes and Parpura. This is an open-access arti-cle subject to an exclusive license agreement between the authors and the Frontiers Research Foundation, which permits unre-stricted use, distribution, and reproduc-tion in any medium, provided the original authors and source are credited.
Copyright © 2022 FDOKUMEN