Gliosarcoma Stem Cells Undergo Glial and Mesenchymal Differentiation In Vivo
Upload
independentCategory
view
0download
0
Developmental Biology 296 (2006) 545–560www.elsevier.com/locate/ydbio
Genomes & Developmental Control
Expression profiling of glial genes during Drosophila embryogenesis
Benjamin Altenhein a,1, Angela Becker a,1, Christian Busold b, Boris Beckmann b,Jörg D. Hoheisel b, Gerhard M. Technau a,⁎
a Institute of Genetics, University of Mainz, Germanyb Division of Functional Genome Analysis, Deutsches Krebsforschungszentrum Heidelberg, Germany
Received for publication 22 March 2006; revised 19 April 2006; accepted 21 April 2006Available online 5 May 2006
Abstract
In the central nervous system of Drosophila, the induction of the glial cell fate is dependent on the transcription factor glial cells missing (gcm).Though a considerable number of other genes have been shown to be expressed in all or in subsets of glial cells, the course of glial celldifferentiation and subtype specification is only poorly understood. This prompted us to design a whole genome microarray approach comparinggcm gain-of-function and, for the first time, gcm loss-of-function genetics to wildtype in time course experiments along embryogenesis. Themicroarray data were analyzed with special emphasis on the temporal profile of differential regulation. A comparison of both experiments enabledus to identify more than 300 potential gcm target genes. Validation by in situ hybridization revealed expression in glial cells, macrophages, andtendon cells (all three cell types depend on gcm) for 70 genes, of which more than 50 had been unknown to be under gcm control. Eighteen genesare exclusively expressed in glial cells, and their dependence on gcm was confirmed in situ. Initial considerations regarding the role of the newlydiscovered glial genes are discussed based on gene ontology and the temporal profile and subtype specificity of their expression. This collection ofglial genes provides an important basis for the clarification of the genetic network controlling various aspects of glial development and function.© 2006 Elsevier Inc. All rights reserved.
Keywords: Glial development; gcm; Glial genes; Microarrays; Drosophila embryogenesis
Introduction
The central and peripheral nervous systems (CNS and PNS)comprise two major cell types: neurons, which receive, transmitand integrate information, and glial cells that ensheath theneurons and their axons and fulfil several accessory functions. Inboth vertebrates and invertebrates, these two cell types arederived from multipotent neural stem cells. In Drosophila,neural stem cells delaminate from the neurogenic ectoderm in astereotypic spatial and temporal pattern. Each of these stem cellscan be addressed by its subectodermal position and specific geneexpression (Doe, 1992; Urbach and Technau, 2003) as well as byits characteristic cell lineage (Bossing et al., 1996; Schmidt et al.,1997). According to their progeny, these cells can be divided intoneuroblasts (NB) that give rise only to neurons, neuroglioblasts
⁎ Corresponding author. Fax: +49 6131 392 4584.E-mail addresses: [email protected], [email protected]
(G.M. Technau).1 These authors contributed equally to this work.
0012-1606/$ - see front matter © 2006 Elsevier Inc. All rights reserved.doi:10.1016/j.ydbio.2006.04.460
(NGB) generating both neurons and glial cells and glioblasts(GB) that produce only glia. The decision to acquire particularneuronal or glial cell fates needs precise regulation in order togenerate a functional nervous system. In Drosophila, the glialcell fate is induced by the transcription factor glial cellsmissing/glial cells deficient (gcm/glide) (Hosoya et al., 1995;Jones et al., 1995; Vincent et al., 1996). gcm is transientlyexpressed in all embryonic glial cells, except for themesectoderm-derived midline glia. A second gcm gene,gcm2, is also expressed in all lateral glial cells, but muchweaker than gcm itself (Kammerer and Giangrande, 2001).Both paralogs form a gene complex with shared enhancerelements (Kammerer and Giangrande, 2001; Ragone et al.,2003; Jones et al., 2004; Jones, 2005). The key role for gcm inglial cell development is underlined by the fact that gcm mutantembryos lack nearly all lateral glial cells, whereas ectopicallyexpressed gcm transforms presumptive neurons into glial cells(Hosoya et al., 1995; Jones et al., 1995; Vincent et al., 1996;Akiyama-Oda et al., 1998). Like gcm, gcm2 promotes the glialfate upon ectopic expression, but gcm2 loss-of-function has

546 B. Altenhein et al. / Developmental Biology 296 (2006) 545–560
only a mild effect on glial cells (Kammerer and Giangrande,2001).
Beside their role in early glial cell development, recent stu-dies demonstrated a role forgcm as well as gcm2 in both glial andneuronal differentiation in the optic lobes of third instar larvalstages (Chotard et al., 2005). Hence, the mode of neuronal orglial downstream target gene activation by Gcm appears to becontext-dependent. Furthermore, both genes are expressed incells of the hematopoietic anlage, the prohemocytes, and inducethe differentiation into plasmatocytes and finally into macro-phages (Bernardoni et al., 1997; Alfonso and Jones, 2002;Bataille et al., 2005).
To shed light on the regulation of gliogenesis, the promoterregion of gcm was subject to intense studies. Transcriptionalregulation of gcm as the nodal point of gliogenesis in theembryo is achieved by multi-component upstream pathways(reviewed in Jones, 2005), as well as auto- and cross-regulationwith gcm2 (Miller et al., 1998; Kammerer and Giangrande,2001; Jones et al., 2004). Because of the transient expression ofgcm, it is necessary to activate glial-specific genes, whichaccomplish the differentiation and maintenance of the glial cellfate. To date, only a few downstream target genes of Gcm havebeen well characterized, like reversed polarity (repo), pointed(pnt), and tramtrack (ttk), which are all expressed in lateral glialcells (Klämbt, 1993; Klaes et al., 1994; Xiong et al., 1994;Halter et al., 1995; Giesen et al., 1997). The homeodomainprotein Repo cooperates with Pnt to promote the glial fate, aswell as with Ttk to suppress the neuronal fate (Badenhorst et al.,2002; Yuasa et al., 2003). Synergistic cooperations between thetranscription factors Gcm, Repo, Pnt and Ttk seem to be anadditional way to activate glial-specific genes, like theexpression of locomotion defects (loco) (Granderath et al.,1999, 2000). Both repo and loco are exclusively expressed in alllateral glial cells, while pnt and ttk are also expressed in neuronsand/or the Gcm-independent midline glia. Many other genes,which have been described to be expressed in lateral glial cells,are expressed in subsets of these cells only. The composition ofthese subsets varies in number and identity of the cells and doesnot necessarily reflect the classification of glial subtypes asintroduced by Ito et al. (1995). This classification is based onthe position and the morphology of the cells in the embryonicCNS. Whether a developmental program underlying thissubtype specification exists has not been shown so far. Theclarification of the processes underlying the determination anddifferentiation of glial subtypes and their specific functions inthe developing and mature nervous system requires theidentification of the genetic network acting downstream of orin cooperation with the master regulator Gcm.
Recently, two screens for genes acting downstream of gcmhave been published, which took advantage of the microarraytechnique to compare gene expression in wildtype embryos ver-sus embryos overexpressing gcm throughout the CNS (Egger etal., 2002; Freeman et al., 2003). Using an in silico approach anda public database search in addition to the microarray approach,Freeman et al. (2003) identified about 40 new glial genes. Ne-vertheless, there was only a minor overlap of candidate genesuncovered by the three approaches of Freeman et al. as well as
between the twomicroarray screens (Egger et al., 2002; Freemanet al., 2003). This prompted us to design a new-microarray-based screen for further gcm target genes. We used a whole-genome microarray approach that compares ectopic expressionof gcm to wildtype and, for the first time, gcm loss-of-function tothe wildtype situation. To ectopically express gcm, we used aGal4 driver line, which is exclusively expressed in the CNS atthe same time as the endogenous gcm. The loss-of-function ex-periment was achieved by sorting staged, living gcm mutantembryos by means of different green fluorescent protein (GFP)carrying balancer chromosomes and an embryo sorter (Furlonget al., 2001b). To identify the dynamic changes in gene expres-sion, we generated a time course experiment throughout em-bryogenesis. This antagonistic approach in combination withtime course gene expression profiling, various quality controlsand carefully selected filtering methods enabled us to identifyabout 70 novel gcm target genes, 18 of which exclusively ex-pressed in glial cells.
Materials and methods
Fly strains
Mz1060-Gal4, UAS-gcm (Bloomington stock B-#5446), gcmN7-4 (Bloo-mington stock B-#4104) (Vincent et al., 1996), Kr-GFP (Bloomington stock B-#5194) and Ubi-GFP (Bloomington stock B-#4888) balancer chromosomes(Casso et al., 1999, 2000), wildtype Oregon R.
Embryo collection
Eggs were collected for 1 h at 25°C on standard apple juice plates and shiftedto either 18°C, 25°C or 29°C for further development. Embryos weredechorionated using 7.5% hypochlorite, washed in water and either fixed forantibody staining, snap-frozen in liquid nitrogen for RNA preparation ortransferred to PBT (PBS, 3% Tween-20) and GFP-sorted.
Antibody staining
For each embryo collection, a small fraction was fixed as described(Patel, 1994) and stained for the glial marker protein Repo using a rabbitanti-Repo antibody (Halter et al., 1995) and alkaline-phosphatase-conjugateddonkey anti-rabbit secondary antibodies. In situ hybridizations were counter-stained with rabbit anti-Repo antibodies and biotin-conjugated secondaryantibodies (Dianova, Hamburg, Germany). Immunolabelings were performedwith rabbit anti-Repo and rat anti-Elav antibodies (7E8A10, DSHB Iowa,USA) and donkey anti-rabbit/anti-mouse secondary antibodies conjugatedwith Fitc/Cy5 respectively (Dianova, Hamburg, Germany). Embryos werestaged according to standard morphological markers (Campos-Ortega andHartenstein, 1997).
Sorting
gcmN7-4 mutant flies were balanced with either Kr-GFP (for stages 10 to 13)or Ubi-GFP (for stages 14 to 16) balancer chromosomes. Eggs were collected asdescribed above, transferred into PBT buffer according to Furlong et al. (2001b)and homozygous mutant embryos were automatically sorted with the Copas™Select embryo sorter (Union Biometrica, Somerville, MA, USA) by their lack ofGFP expression. The two different balancer chromosomes used showeddifferent characteristics concerning the ability to distinguish between ho-mozygous and heterozygous embryos at different stages. In Fig. 1, twoexamples of the Copas™ sorter plots are given. An aliquot of sorted embryoswas fixed for antibody staining as described above, and the major portion wassnap-frozen in liquid nitrogen.

Fig. 1. Sorting of homozygous mutant embryos. (A, B) Two different GFP balancer chromosomes were used to balance the gcmN7-4 mutation. Kr-GFP (A) was used tobalance and sort stages 10–12, Ubi-GFP (B) was used for stages 13–16. Sorter plots of the Copas™ embryo sorter (Union Biometrica, Somerville, USA) with greenfluorescent signal (FLU1) plotted against autofluorescence (FLU2) show the three populations of genotypes. The black rectangles indicate the sorted fraction whichlacks GFP signal.
547B. Altenhein et al. / Developmental Biology 296 (2006) 545–560
RNA preparation
Total RNA was prepared from frozen embryos using the RNeasy® kitfollowed by polyA+-RNA extraction with the Oligotex® kit (both Qiagen,Hilden, Germany) according to manufacturer's instructions. One microgram ofpolyA+-RNA was used for each labeling reaction. The quality of polyA+-RNApreparations was checked by Northern blot and RT-PCR under standardizedconditions.
Microarrays
Microarrays were used (Heidelberg FlyArray) that contain PCR products of21,306 Drosophila open reading frames together with 2502 controls, spotted intwo replicates on each array (∼48,000 spots per array) (Hild et al., 2003).
Sample preparation and microarray hybridization
An indirect labeling method was used to reverse-transcribe 1 μg ofdenatured polyA+-RNA with 4.5 μg random primers and 0.75 μg oligo-dTprimers (both from Invitrogen, Karlsruhe, Germany). First-strand cDNAsynthesis, sample preparation and microarray hybridization were performed asdescribed in Hild et al. (2003).
Image analysis
Hybridized arrays were scanned directly after hybridization using theGeneTac™ LS IV scanner (Perkin-Elmer Life Sciences, Wellesley, USA) andthe corresponding software. Fluorescent-labeled spotted controls on the arrayswere used to align laser intensities and photomultiplier settings for bothchannels. Resulting images (16-bit gray-scale TIFF-format) for each channelwere loaded into the GenePix 5.0 software (Axon Instruments, Union City,USA), and data were extracted as GenePix result files (gpr-format) for furtheranalysis.
Replicates
For each developmental stage examined in both experiments, at least fourindependent replicates have been analyzed starting with independent eggcollections. All replicates include balanced dye swaps, except for stage 12 in theGOF and stages 11 and 16 in the LOF, where only one dye swap was done. Onlyarrays with a correlation coefficient above 0.8 were used for further analysis. Forevery replicate, the developmental stage, the quality of the embryo collection andthe accuracy of the sorting were checked by antibody staining.
Normalization, filtering and correspondence analysis
Statistical data analysis was performed with the Multi-ConditionalHybridization Intensity Processing System (M-CHiPS) (Fellenberg et al.,2002). Normalization was performed using linear regression normaliza-tion with the M-CHiPS software package. Genes were filtered out whentheir normalized median transcription intensities remained below a threshold of10,000 pixels in all conditions and/or had a ratio to the control condition of lessthan 1.5-fold. The significance of changes was assessed by a high stringentcriterion. ‘Min–max separation’ is calculated by taking the minimum distancebetween all data points of two conditions (Beissbarth et al., 2000). Genes thatexhibited a min–max value of less than 0.0, 0.2 or 0.5 were discarded fromanalysis in three subsequent filtering steps. Correspondence analysis (CA)(Greenacre, 1984, 1993) is a clustering and projection method, which allows toplot genes and hybridization conditions in the same space. In the resulting plot,the displayed χ2 distance is a measure of association among genes andhybridizations.
In situ hybridization
In vitro transcription and labeling of RNAwith Digoxygenin was performedusing the Dig-RNA labeling mix according to manufacturer's instructions(Roche Diagnostics, Mannheim, Germany). Embryos from overnight collectionswere dechorionated in 7.5% hypochlorite, fixed in PBS/heptane/formaldehyde(35:50:15) and incubated for 1 h in hybridization buffer (50% formamide, 5×SSC, 100 μg/ml ssDNA, 0.1% Tween-20). For fluorescent in situ hybridization,embryos were treated with 0.1% sodium borohydrid solution in 0.1% PBT (PBS,0.1% Tween-20) for 10 min to reduce the autofluorescent background.Hybridization was performed overnight at 55°C using 10 μl of the Dig-labeledRNA probe. The following procedure is described in Tautz and Pfeifle (1989);Jiang et al. (1991); Kosman et al. (1991). For fluorescence detection of Dig-labeled RNA probes, the TSA amplification Kit with either Cy3 or Cy5 (Perkin-Elmer, Norwalk, CT) was used according to manufacturer's instructions.
Results
Microarray analysis and quality control
Prior to array hybridization, we performed several testsconcerning the quality of the prepared RNA (Northern blot andRT-PCR). Furthermore, different post-hybridization qualitycontrols were performed in order to define and reduce the

548 B. Altenhein et al. / Developmental Biology 296 (2006) 545–560
methodical background noise and, thus, to obtain highreproducibility and reliability of our microarray data. We firsthybridized wildtype stage 10 mRNA labeled with Cy3 and Cy5in three replicates to determine background noise withinidentical samples. In order to compare differences in geneexpression between the wildtypic flies used for the ectopicexpression of gcm, we labeled RNA samples of stage 9 embryosfrom Mz1060 with Cy3 and from UAS-gcm with Cy5 and viceversa and hybridized these samples to microarrays. All controlarrays showed correlation coefficients between 0.98 and 0.99.Data were normalized and filtered with the M-CHiPS softwarepackage as described in the Materials and methods section. Weapplied different filter criteria for both reproducibility and ratioof normalized intensities and determined the number of genespassing both criteria. A much higher number of differentiallyexpressed genes above 1.5-fold regulation were obtained whenGal4 and UAS flies were compared than using identical wtsamples. Thus, differences in the genetic background of phe-notypically wildtype fly strains lead to differences in expressionlevels of certain genes and increase background noise. As aconsequence, embryos from both Gal4 and UAS line werecollected separately for control samples in the ectopic expressionexperiment. RNA was extracted and then pooled in equalamounts for sample labeling and hybridization. This mixed‘wildtype control’ was not used for the analysis of homozygousgcm mutant embryos. For this experiment, Oregon R wildtypeembryos were collected and treated as the sorted embryos. Bothcontrol experiments were taken into consideration for the se-lection of filter criteria in M-CHiPS. Hence, filtering data with adifferential regulation above 1.5-fold and a min–max separationbetween 0.0 and 0.5 was chosen and applied to all microarraydata.
Ectopic expression of gcm and comparison with wildtype
It has been shown that ectopic expression of gcm in thedeveloping nervous system can induce the glial-specific tran-scription factor Repo, which is generally used as a marker for alllateral glial cells (Akiyama-Oda et al., 1998). Hence, ectopicgcm is sufficient to induce the glial cell fate at the cost ofpresumptive neurons. Conversely, ectopic expression of gcm inepidermal cells leads to an activation of elav, a postmitoticneuronal marker (Akiyama-Oda et al., 1998). These findingsprompted us to search for a Gal4 line which drives ectopic gcmexpression restricted to the nervous system (and not in theventral neuroectoderm which produces also epidermal cells) in atime window similar to endogenous gcm expression. The Gal4line Mz1060 fitted these criteria. This line shows Gal4expression in nearly 60% of the cells in the ventral nerve cord,beginning at stage 10, increasing to stage 13 and diminishinguntil stage 15. In Fig. 2, the Repo/Elav pattern of both wildtypeembryos and embryos with ectopic expression of gcm (Mz1060::gcm) in stages 12, 14, and 16 is shown.
To analyze the effect of this ectopic activation of gcm onmicroarrays (gain-of-function, GOF), we collected embryosfrom eight different time points (stage 9 to stage 16). Embryosfrom each developmental stage were collected separately for
Mz1060::gcm as well as for both Mz1060 and UAS gcm flies as‘wildtype control’. This was done in five separate experimentsstarting from individual fly crosses and separate egg collectionsfor repeat experiments. Homogeneity of staging and effect ofectopic activation of gcm were checked by anti-Repo antibodystainings. RNAwas extracted, labeled and hybridized to micro-arrays separately. Gene lists of differentially regulated geneswere created for all eight time points (Table 1 and Supplemen-tary Table 1).
Sorting of homozygous gcm mutant embryos and comparisonwith wildtype
In order to analyze differences in gene expression betweengcm mutant embryos (loss-of-function, LOF) and wildtype, wemade use of balancer chromosomes carrying the gene codingfor the green fluorescent protein (GFP) (Casso et al., 1999,2000). We balanced the gcmN7-4 mutation (Vincent et al., 1996)with either Kr-GFP or Ubi-GFP balancer chromosomes.Homozygous mutant embryos can be detected unambiguouslyby their lack of GFP expression. To circumvent the need forRNA amplification, we used the Copas™ Select embryo sorter(Union Biometrica, Somerville, MA, USA) for automatedsorting of living embryos as described in Furlong et al. (2001a,b). Staged egg collections of gcmN7-4/GFP balanced parentalgeneration were sorted in up to six independent collections perdevelopmental stage examined, and homozygous mutantembryos were kept. Wildtype (Oregon R) embryos were stagedand treated accordingly, without sorting for GFP. A fraction ofeach sorting was fixed and stained with an antibody against theglial marker Repo to check both staging and accuracy of thesorting. Stages 10 to 14 and stage 16 were well staged, and thesorting resulted in an accuracy of 98% homozygous mutantembryos lacking Repo staining. Unfortunately, the stage 15 eggcollections turned out to be too heterogeneous with respect totheir developmental stage and, thus, were excluded from furtheranalysis. Two GFP balancer chromosomes were used for sortingof stages 10 to 12 (Kr-GFP) and 13 to 16 (Ubi-GFP), res-pectively, because the discrimination between the three popu-lations of embryos (homozygous gcm mutant embryos withoutGFP, heterozygous embryos and homozygous GFP balancercarrying embryos) was easier with Kr-GFP in younger stagesand with Ubi-GFP in older stages (see Fig. 1). Microarray datawere generated using the same filter criteria as for the ectopicexpression (GOF experiment), and gene lists for six deve-lopmental stages were generated (Table 1 and SupplementaryTable 2).
Processing of microarray data
Filtering for differential expression for every single timepoint provided us with gene lists of up to several hundreddifferentially regulated genes. These lists contain log2-transformed values below the aspired threshold of 1.5-folddifferential regulation (see Supplementary Tables 1 and 2).This accounts for the fact that in M-CHiPS genes pass the foldregulation filter if at least one of the measurements in all
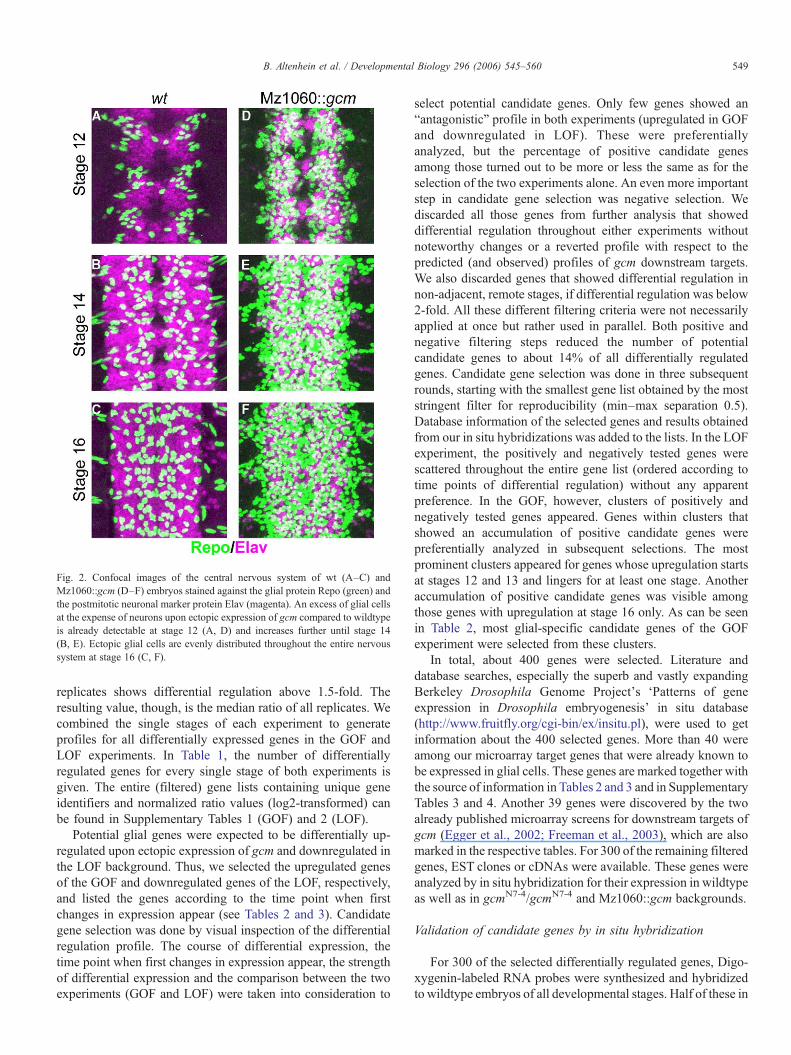
Fig. 2. Confocal images of the central nervous system of wt (A–C) andMz1060::gcm (D–F) embryos stained against the glial protein Repo (green) andthe postmitotic neuronal marker protein Elav (magenta). An excess of glial cellsat the expense of neurons upon ectopic expression of gcm compared to wildtypeis already detectable at stage 12 (A, D) and increases further until stage 14(B, E). Ectopic glial cells are evenly distributed throughout the entire nervoussystem at stage 16 (C, F).
549B. Altenhein et al. / Developmental Biology 296 (2006) 545–560
replicates shows differential regulation above 1.5-fold. Theresulting value, though, is the median ratio of all replicates. Wecombined the single stages of each experiment to generateprofiles for all differentially expressed genes in the GOF andLOF experiments. In Table 1, the number of differentiallyregulated genes for every single stage of both experiments isgiven. The entire (filtered) gene lists containing unique geneidentifiers and normalized ratio values (log2-transformed) canbe found in Supplementary Tables 1 (GOF) and 2 (LOF).
Potential glial genes were expected to be differentially up-regulated upon ectopic expression of gcm and downregulated inthe LOF background. Thus, we selected the upregulated genesof the GOF and downregulated genes of the LOF, respectively,and listed the genes according to the time point when firstchanges in expression appear (see Tables 2 and 3). Candidategene selection was done by visual inspection of the differentialregulation profile. The course of differential expression, thetime point when first changes in expression appear, the strengthof differential expression and the comparison between the twoexperiments (GOF and LOF) were taken into consideration to
select potential candidate genes. Only few genes showed an“antagonistic” profile in both experiments (upregulated in GOFand downregulated in LOF). These were preferentiallyanalyzed, but the percentage of positive candidate genesamong those turned out to be more or less the same as for theselection of the two experiments alone. An even more importantstep in candidate gene selection was negative selection. Wediscarded all those genes from further analysis that showeddifferential regulation throughout either experiments withoutnoteworthy changes or a reverted profile with respect to thepredicted (and observed) profiles of gcm downstream targets.We also discarded genes that showed differential regulation innon-adjacent, remote stages, if differential regulation was below2-fold. All these different filtering criteria were not necessarilyapplied at once but rather used in parallel. Both positive andnegative filtering steps reduced the number of potentialcandidate genes to about 14% of all differentially regulatedgenes. Candidate gene selection was done in three subsequentrounds, starting with the smallest gene list obtained by the moststringent filter for reproducibility (min–max separation 0.5).Database information of the selected genes and results obtainedfrom our in situ hybridizations was added to the lists. In the LOFexperiment, the positively and negatively tested genes werescattered throughout the entire gene list (ordered according totime points of differential regulation) without any apparentpreference. In the GOF, however, clusters of positively andnegatively tested genes appeared. Genes within clusters thatshowed an accumulation of positive candidate genes werepreferentially analyzed in subsequent selections. The mostprominent clusters appeared for genes whose upregulation startsat stages 12 and 13 and lingers for at least one stage. Anotheraccumulation of positive candidate genes was visible amongthose genes with upregulation at stage 16 only. As can be seenin Table 2, most glial-specific candidate genes of the GOFexperiment were selected from these clusters.
In total, about 400 genes were selected. Literature anddatabase searches, especially the superb and vastly expandingBerkeley Drosophila Genome Project's ‘Patterns of geneexpression in Drosophila embryogenesis’ in situ database(http://www.fruitfly.org/cgi-bin/ex/insitu.pl), were used to getinformation about the 400 selected genes. More than 40 wereamong our microarray target genes that were already known tobe expressed in glial cells. These genes are marked together withthe source of information in Tables 2 and 3 and in SupplementaryTables 3 and 4. Another 39 genes were discovered by the twoalready published microarray screens for downstream targets ofgcm (Egger et al., 2002; Freeman et al., 2003), which are alsomarked in the respective tables. For 300 of the remaining filteredgenes, EST clones or cDNAs were available. These genes wereanalyzed by in situ hybridization for their expression in wildtypeas well as in gcmN7-4/gcmN7-4 and Mz1060::gcm backgrounds.
Validation of candidate genes by in situ hybridization
For 300 of the selected differentially regulated genes, Digo-xygenin-labeled RNA probes were synthesized and hybridizedto wildtype embryos of all developmental stages. Half of these in

Table 1Statistical analysis of the two time course microarray experiments
GOF Stage 9 Stage 10 Stage 11 Stage 12 Stage 13 Stage 14 Stage 15 Stage 16 Total no. Min–max-separation
No. of differentially regulated genes (total) 147 167 150 138 96 28 31 34 387 0.5Upregulated genes (>1.5) 116 149 143 137 84 27 31 28 316 0.5Downregulated genes (<−1.5) 31 18 7 1 12 1 0 6 71 0.5No. of differentially regulated genes (total) 596 656 389 346 291 82 80 91 1152 0.2Upregulated genes (>1.5) 285 447 305 331 263 74 79 74 683 0.2Downregulated genes (<−1.5) 311 209 84 15 28 8 1 17 470 0.2No. of differentially regulated genes (total) 877 743 425 395 388 107 107 111 1413 0.0Upregulated genes (>1.5) 399 496 328 372 322 98 106 89 789 0.0Downregulated genes (<−1.5) 478 247 97 23 66 9 1 22 625 0.0
LOF Stage 10 Stage 11 Stage 12 Stage 13 Stage 14 Stage 15 Stage 16 Total no. Min–max-separation
No. of differentially regulated genes (total) 141 135 72 94 44 141 476 0.5Upregulated genes (>1.5) 80 31 31 50 29 124 273 0.5Downregulated genes (<−1.5) 61 104 41 44 15 17 205 0.5No. of differentially regulated genes (total) 414 382 344 319 111 368 1367 0.2Upregulated genes (>1.5) 243 104 114 169 56 274 744 0.2Downregulated genes (<−1.5) 171 278 230 150 55 94 658 0.2No. of differentially regulated genes (total) 598 575 627 632 245 560 2086 0.0Upregulated genes (>1.5) 353 193 180 269 161 386 1056 0.0Downregulated genes (<−1.5) 245 382 447 363 84 174 1080 0.0
All data were filtered in M-CHiPS with a constant threshold for differential regulation of 1.5-fold and three different values for reproducibility (min–max separation0.5, 0.2 and 0.0). Differentially regulated genes were divided into up- and downregulated genes for each stage. The total number of differentially regulated genescombines all developmental stages analyzed. Since many genes are differentially regulated at more than one stage, the total number given is smaller than the sum of allstages. Some genes appear both up- and downregulated during the time course of each experiment, especially in the LOF. Hence, total number of differentiallyregulated genes is smaller than the sum of up- and downregulated genes.
550 B. Altenhein et al. / Developmental Biology 296 (2006) 545–560
situ hybridizations gave no signal at any time during embryo-genesis. Since we cannot rule out that in these cases the methoddid not work, we do not knowwhether these genes are expressedin the embryo and, thus, they remain uncertain candidates, still.The other approximately 140 genes showed detectable stainingand were analyzed in more detail (Tables 2, 3, Figs. 3, 4; GOFand LOF, respectively). In total, 58 genes showed clear expres-sion in the nervous system, of which 18 genes are exclusivelyexpressed in glial cells, another 15 genes are expressed in glialcells together with single neurons, and 22 genes showed a moreubiquitous staining in the CNS and/or PNS. One gene isexpressed in glial cells together with macrophages, and 7 genesare expressed in cells of the hematopoietic lineage and macro-phages alone, which also depend on gcm expression (Bernardoniet al., 1997; Lebestky et al., 2000; Alfonso and Jones, 2002).Another 9 genes are expressed in ventral stripes representingepidermal muscle attachment sites or tendon cells, and one geneshowed expression in glial cells, neurons and tendon cells. gcmis expressed in tendon cells from stage 12 onwards and isrequired for their terminal differentiation (Soustelle et al., 2004).Another 60 genes are expressed in other tissues and were con-sidered as negative results. The aim of our microarray approachwas to identify novel genes involved in glial cell differentiationand to show their dependence on gcm. To test whether theexpression of the newly discovered glial genes is dependent ongcm, we performed in situ hybridizations in wildtype as well asin gcm mutant embryos and in embryos with ectopic gcm. Theresults of our in situ hybridizations for all tested genes areincluded in Supplementary Tables 3 and 4, and all genes that
showed expression in the CNS as well as in tendon cells and cellsof the hematopoietic lineage are given in Tables 2 and 3.
Expression pattern and profile of novel glial genes
The majority of positive candidate genes from the GOFexperiment showed expression in glial cells and neurons ratherthan exclusive expression in glial cells (Table 2). Seven GOFcandidate genes showed expression in glial cells exclusively, ofwhich four are expressed in many if not all glial cells (CG15860,CG2893, CG3168, EG:22E5.11) and three are expressed in glialsubsets only (Figs. 3, 5). These are cell body glia (CBG)(CG6218, CG6783) and peripheral glia (PG) (CG9336). TheGOF resulted in only two genes specifically expressed in tendoncells (CG9796, CG1153), and no gene expressed in macro-phages or cells of the hematopoietic lineage. Glial expression ofsome of our candidate genes was also shown by Egger et al.(2002) and Freeman et al. (2003), and some were incorporatedinto the BDGP in situ database in the meantime. These genes aremarked in Table 2. As can be seen in Supplementary Tables 3and 4, many genes with previously described glial expressionshowed differential regulation in both of our experiments. Thesegenes are not shown here as their expression was already des-cribed elsewhere.
The LOF experiment resulted in a higher number of can-didate genes with expression in certain glial subtypes and onlytwo genes with expression in many if not all glial cells (CG2893,CG3408). Among the glial-subtype-specific expression, wefound genes expressed in cell body glia (CBG) (CG6218,

Table 2GOF filtered and tested candidate genes
Gene identifiers are given as presented in all Supplementary data. The fold regulation for all examined developmental stages represents the log2-transformed ratio Cy5/Cy3 of median fitted intensities. Values wereobtained from filtering with the M-CHiPS software package (red: upregulation above 1.5-fold; blue: downregulation below 1.5-fold). Expression pattern was confirmed by standard in situ hybridization. Expression inglial cells (G), in single neurons (N), ubiquitously in the CNS (CNS), and in tendon cells (T) was observed in stages as indicated. Gene expression in Mz1060::gcm (gcm+) and gcmN7-4/gcmN7-4 (gcm−) backgroundscompared to the wildtypic expression is indicated as increased expression (++), decreased/absent expression (−) or no changes in expression (0). For some of the tested candidate genes, the expression in glial cellswas published during the time of data analysis. The source of information is given in the column titled ‘Lit’. Expression information was either (*B) incorporated into the public in situ database (http://www.fruitfly.org/cgi-bin/ex/insitu.pl) or published by Egger et al. (2002) (*E) or by Freeman et al. (2003) (*F). GO annotations are presented according to the information given in FlyBase. (For interpretation of the referencesto colour in this table legend, the reader is referred to the web version of this article.)
551B.Altenhein
etal.
/Developm
entalBiology
296(2006)
545–560
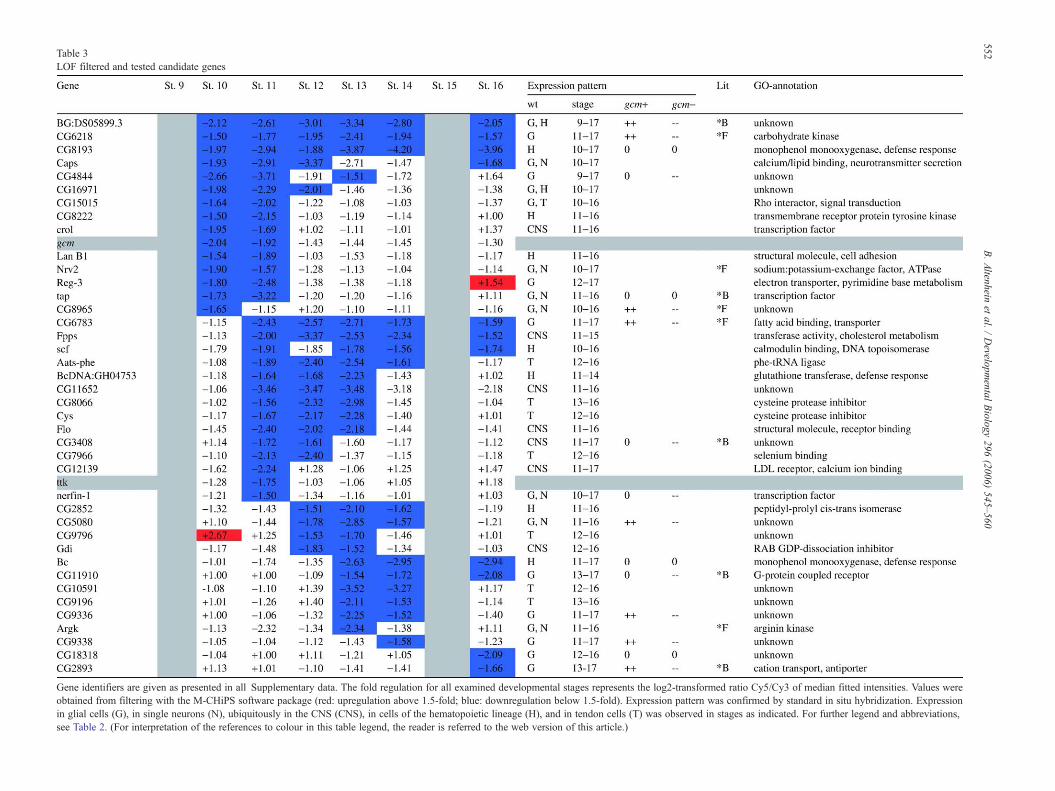
Table 3LOF filtered and tested candidate genes
Gene identifiers are given as presented in all Supplementary data. The fold regulation for all examined developmental stages represents the log2-transformed ratio Cy5/Cy3 of median fitted intensities. Values wereobtained from filtering with the M-CHiPS software package (red: upregulation above 1.5-fold; blue: downregulation below 1.5-fold). Expression pattern was confirmed by standard in situ hybridization. Expressionin glial cells (G), in single neurons (N), ubiquitously in the CNS (CNS), in cells of the hematopoietic lineage (H), and in tendon cells (T) was observed in stages as indicated. For further legend and abbreviations,see Table 2. (For interpretation of the references to colour in this table legend, the reader is referred to the web version of this article.)
552B.Altenhein
etal.
/Developm
entalBiology
296(2006)
545–560

Fig. 3. In situ hybridizations of candidate genes from the GOF experiment in wildtype embryos. Genes and stages are indicated underneath the whole-mount pictures,shown in a ventral view (left) and a lateral view (right), respectively; anterior is up. If required, different focal sections were combined. Genes are sorted in alphabetic/numeric order. Examples are shown for genes expressed ubiquitously in the CNS (A, C, E, J, N, O), in single glial cells and neurons (B, F, G, I, L, M), and exclusivelyin glial cells (D, H, K).
553B. Altenhein et al. / Developmental Biology 296 (2006) 545–560
CG6783), subperineural glia (SPG) (CG5080), longitudinal glia(LG) (CG11910, CG7433) and peripheral glia (PG) (CG9336,CG9338). Four of these glial-specific genes were also selected inthe GOF experiment (CG2893, CG6218, CG6783, CG9336).Seven LOF candidate genes were expressed in tendon cells(Table 3, Fig. 4), and another eight genes showed expression incells of the hematopoietic lineage including macrophages (Table3, Fig. 4). One additional gene was selected which showedsimultaneous expression in glial cells as well as in macrophages(CG16876, Table 3, Fig. 4) and one gene with expression in glialcells and tendon cells (CG15015).
Taken together, 5 genes show expression in nearly all lateralglial cells, whereas 6 genes show staining in only a subset ofglial cells, like CBG or LG. Additionally, we could identify 7genes that are expressed in more than one glial subtype, e.g. inSPG and CBG. Furthermore, 9 genes are expressed in muscletendon cells and 8 genes show expression in cells of the hema-topoietic lineage. In addition, we found one gene simultaneous-ly expressed in glial cells and in the blood cell lineage and onegene expressed in muscle tendon cells and in glia. The temporal
expression profiles for most of our candidate genes in wildtypeas well as in both mutant genetic backgrounds (as revealed by insitu hybridization) resemble the observed differential regulationin both our microarray experiments at least to some extent.
In order to analyze the expression of our candidate genes inglial cells in more detail, we performed in situ hybridizations incombination with anti-Repo antibody stainings. For some of thegenes with exclusive expression in glial cells, the double stain-ings are shown in Fig. 5. The dependence on gcm was tested byin situ hybridization in Mz1060::gcm and in gcm mutant back-grounds. The results are given in Tables 2 and 3. Increasedexpression is marked with ‘++’, a decrease in expression ismarked with ‘−’, and no change in expression is markedwith ‘0’.As expected, all glial-cell-specific genes lack expression in gcmmutant embryos. Yet, not all of these genes show an increase inexpression upon ectopic activation of gcm. Examples are shownin Fig. 6.
The temporal expression profile of the selected candidategenes was determined by in situ hybridization in wildtypeembryos. The results are given in Tables 2 and 3 (expression

Fig. 4. In situ hybridizations of candidate genes from the LOF experiment in wildtype embryos. Genes and stages are indicated underneath the whole-mount picturesshown in a ventral view (left) and a lateral view (right), respectively; anterior is up. If required, different focal sections were combined. Genes are sorted in alphabetic/numeric order. Examples are shown for genes expressed ubiquitously in the CNS (B, L), in single glial cells and neurons (A, C, D, F, M, N, O), exclusively in glial cells(E, G, H, K), as well as in glial cells together with macrophages (J) or tendon cells (I).
554 B. Altenhein et al. / Developmental Biology 296 (2006) 545–560
pattern, stage). The first and the last stages of detectable in situhybridization signal are indicated. For most of the selectedgenes, the expression in wildtype embryos is first detectable atstage 11 and continues until stage 16. For about 25% of thepositively tested genes, expression was first detected at stage12 to 13, and two genes are expressed in later stages only(Tables 2 and 3).
Discussion
Whole genome microarrays have been intensively used overthe last decade. The interpretation of the huge amount of datagenerated by such experiments is still critical, but nonethelesscrucial. Many efforts have been taken to standardize chipdesign, data acquisition and analysis, but recent papersdemonstrate worrying discrepancies between microarray-de-rived data (reviewed by Tan et al. (2003); Jordan (2004).Nevertheless, many papers report on the successful use ofmicroarrays in various biological systems, ranging frombacteria to higher organisms, and from single cells to whole
organs, tissues or individuals. In any way, the DNA chiptechnology is highly sensitive and thus susceptible to manyaspects of technical or experimental error. A straightforwardexperimental design including quality controls as well as thedetermination and reduction of technical (and genetical)background noise in a given approach and system is aprerequisite for correct and precise data interpretation.
Improvements in experimental design and candidate geneselection
The analysis of differential expression along the course ofdevelopment and the comparison between gain- and loss-of-function genetics mark the two major novelties in ourmicroarray screen for downstream targets of gcm and turned outto be extremely helpful in selecting potential candidate genes.The temporal profile of differential expression was used toeither select or discard genes from further analysis. Differentfiltering steps enabled us to select potential target genes (about14% of all differentially regulated genes).

Fig. 5. In situ hybridizations against candidate genes in combination with antibody stainings against the glial protein Repo in wildtype embryos (flat preparations).Anterior to the left; in A, B, G and I, the midline is at the bottom. A–Gwere stained in the cytoplasm with alkaline phosphatase (in situ hybridization, blue) and nuclearDAB (anti-Repo, brown). H–I show single confocal stacks of fluorescent in situ hybridizations (magenta) counterstained with anti-Repo antibodies (green).Expression of genes can be detected in different glial subtypes such as peripheral glia (asterisk), subperineurial glia (arrow head), cell body glia (straight arrow) andlongitudinal glia (bent arrow). CG16876 (BG:DS05899.3) is also expressed in macrophages (black and white dots in panels F and I).
555B. Altenhein et al. / Developmental Biology 296 (2006) 545–560
About 400 potential candidate genes out of 2900 differen-tially regulated genes were selected and 300 of them weretested. After validation of these genes by in situ hybridization,40% were found to be expressed in a gcm-dependent manner,18% were rated as negative results with expression patternsoutside the CNS/hemocytes/tendon cells, and 42% with nosignal at all, being uncertain candidates, still. For neither ofthese we could see any concordance with respect to theregulation profile, the strength of differential regulation or thereproducibility. Compared to the microarray screens publishedby Egger et al. (2002) and Freeman et al. (2003), the percentageof positively tested gcm target genes is rather high. The firstpublished oligonucleotide microarray screen for gcm down-stream targets (Egger et al., 2002) analyzed the effect of gcmmisexpression induced by scabrous (sca)-Gal4 in stage 11 andstage 15/16. In this approach, 400 and 1259 differentiallyregulated genes were discovered in stages 11 and 15/16, res-pectively, of which 93 genes overlapped between the twostages. Taken together, approximately 10% of all genes presenton the oligonucleotide array (with ∼14,000 gene-specific oligo-nucleotides) appeared to be differentially regulated. Though theauthors could not rule out side-effect-induced differential regu-lation due to gross morphological abnormalities observed, theypostulate an involvement of the upregulated genes in gliogen-
esis or neurogenesis. For none of these newly described poten-tial gcm target genes the regulation by gcm and the expression inglial cells was shown in situ. The authors further conceded thepossibility that not all glial genes were necessarily among theupregulated genes and that a gcm loss-of-function analysiswould be needed to fill these gaps. Comparing our microarraydata with the data presented by Egger et al., we find only minoroverlap. Of the genes published by Egger et al., 30 genes aredifferentially expressed in our experiments, too. Half of theseshow an opposite behavior (with regard to up-/downregulation),and only three were selected by our filter criteria and tested(Table 2). These discrepancies might be due to the differentmicroarray systems used. Inconsistent results obtained by diffe-rent microarray systems have been reported (Tan et al., 2003;Jordan, 2004). However, we believe that the experimentaldesign (specific Gal4-line, wildtype control, time course, gain-and loss-of-function) and the resulting possibilities to selectpotential target genes are important improvements in our micro-array approach.
The second published screen for gcm target genes combineda cDNAmicroarray approach with an in silico prediction of gcmtargets by enhancer/promoter analysis and public in situ hybrid-ization data (Freeman et al., 2003). Ectopic expression of gcmwas again driven by sca-Gal4, and only stage 12/13 was

Fig. 6. In situ hybridizations of candidate genes in wildtype embryos in comparison to embryos with ectopic activation of gcm (Mz1060::gcm). Flat preparations;anterior to the left; different focal sections or developmental stages were combined, if required. Longitudinal glial-specific gene expression is not altered upon ectopicactivation of gcm (CG11910 and CG8965, bent arrows in panels A–D), whereas all other glial subtypes can be ectopically induced in Mz1060::gcm (E–L). Shown arecell body glia (straight arrows in E, G, K) and subperineurial glia (arrow heads in G, I, K). Even restricted expression to single glial cells in wildtype (dorsalsubperineurial glia in CG5080, I) is increased upon ectopic gcm (J).
556 B. Altenhein et al. / Developmental Biology 296 (2006) 545–560
compared to wildtype on microarrays containing 4386 uniqueDrosophila genes. The authors tested 153 of the upregulatedgenes (chosen by strength of differential regulation) of which 18were proven to be expressed in glial cells, and their upregulationupon ectopic gcm was confirmed in situ. Though all threedifferent approaches combined by Freeman and colleagues weresuccessful and led to a description of 45 novel gcm target genes,only minor overlap between the three approaches was observed.The microarray approach itself resulted in the identification of18 novel target genes representing 12% of the tested genes. Therather high rate of false positives (88%) was discussed, and theauthors assumed a similar rate for the data presented by Eggerand colleagues. From the 18 microarray-derived gcm targetgenes published by Freeman et al., 8 genes were among ourdifferentially regulated genes. Another 6 candidates of thoseidentified by the in silico screen for gcm binding sites and 6 ofthose found in the in situ database were present in our filteredgene lists. In total about 45% of all genes described by Freemanet al. appeared to be differentially regulated in our screen. Mostof them (15 genes) were downregulated in the LOF or evenantagonistically regulated in both experiments.
Novel glial genes
Subsequent filtering and validation steps enabled us to defineclusters of genes with differential glial expression at specific
time points or with specific regulation profiles in both expe-riments. As can be seen in Tables 2 and 3, most glial-specificgenes in the GOF experiment showed differential regulation instage 16, whereas in the LOF the glial-specific genes can befound throughout all stages. We compared the profiles of diffe-rential regulation with the temporal expression profiles asrevealed by in situ hybridization in wildtype embryos. Bothprofiles do not necessarily match with each other. The regulationprofile in the GOF depends on the Gal4 driver line rather than onendogenous expression. Hence, the profiles in the LOF experi-ment show a better overall accordance. Still, the discrepanciesbetween differential regulation in both experiments and theendogenous in situ expression pattern cannot be explained.Astonishingly few genes showed antagonistic regulation in bothexperiments. Some of these genes (e.g. CG6218, CG6783)showed glial expression exclusively. The dependence on gcmwas tested and nicely fits to the obtained microarray data. Mostof the novel glial genes, however, were differentially regulatedin only one of the two experiments. In situ hybridizations wereperformed in gcm mutant backgrounds as well as in Mz1060::gcm embryos, and expression patterns were compared towildtype and to the obtained microarray data. With only fewexceptions, most of the novel glial genes discovered from eitherexperiment showed expression in the respective mutant back-ground comparable to the observed microarray profiles. Espe-cially those genes that are also expressed in neurons show an

557B. Altenhein et al. / Developmental Biology 296 (2006) 545–560
increase in expression upon ectopic activation of gcm, but nosignificant decrease in gcm mutants. Thus, the lack of glial-specific downregulation in the LOF experiment is masked byneuronal expression. Hence, these genes were only selected byupregulation in the GOF experiment. Conversely, some of theglial-specific downregulated genes in the LOF experiment arenot differentially upregulated in the GOF. CG11910 for exampledoes not show an increase in expression in situ upon ectopicgcm, even though it is expressed exclusively in longitudinal glialcells (Figs. 6A, B), suggesting that this gene requires factors inaddition to Gcm to be activated. Hence, this gene was notpreviously discovered by either of the two gain-of-functionmicroarray screens (Egger et al., 2002; Freeman et al., 2003).The same observations were made when analyzing the ex-pression of CG8965, which is also expressed in longitudinalglial cells (Figs. 6C, D). Apart from these two, all other geneswith expression restricted to glial subtypes can be activatedectopically in Mz1060::gcm (Figs. 6E–L). This might correlatewith the origin of the respective glial subtypes, indicating thatspatial, temporal or even other specific cofactors are required forglial subtype specification. Still, some of the candidate genes ofthe LOF experiment were not differentially regulated onmicroarrays of the GOF experiment, though in situ hybridiza-tions show an increase in expression for these genes uponectopic activation of gcm in the CNS (e.g. CG11652, BG:DS05899.3). We cannot explain these discrepancies. Yet, allthese observations demonstrate how carefully microarray expe-riments need to be designed and analyzed, especially withrespect to the analysis of both gain- and loss-of-function geneticsrather than only one situation.
Functional categories of novel glial genes
We analyzed the composition of the filtered and tested geneswith respect to their gene ontology (GO-annotation) as given inFlyBase. The GO annotation was used to categorize the putativeor known function into eleven functional classes. Fig. 7 showsthe distribution among these functional categories of all potentialcandidate genes (the filtered genes excluding those with nega-tive in situ hybridizations). These ‘functional categories’ do notresemble groups of GO annotations of the same hierarchicallevel within the genealogic tree of GO annotations, and somegenes might have annotated functions which overlap betweenthe different categories. Hence, we do not intend to comparethese categories of our filtered genes with those present in theentire genome, but rather give an overview of the functionalannotations present in our filtered gene lists. For about 25% ofthe genes, no GO annotation was given, so their function isunknown. Signaling-related molecules and proteins involved inposttranslational protein modification as well as nucleic acidmetabolism are equally distributed, representing 10% of allpotential candidate genes each. Genes from these functionalclasses show differential regulation at various developmentalstages examined in either experiments. Among the signaling-related molecules, the majority are assigned to G-protein-coupled receptor signaling or small GTPase function. Eighteentranscription factors (7%) were filtered, whose differential regu-
lation starts in early stages (stages 9–12), which is compatiblewith a possible function in cell fate specification or early diffe-rentiation. Another 6% of the filtered genes encode ion trans-porters, antiporters, symporters or ion channels. Half of theseshow differential regulation at late stages only. This also appearsreasonable as homeostatic control is believed to be one of thefunctions of glial cells. 13% of all filtered genes have putativeenzymatic function and/or are involved in general metabolism.Whether this implies glial-specific or experimentally inducedchanges in metabolism remains unclear. Most of the filteredgenes with negative in situ hybridization results were amongthose with putative metabolic function.
Astonishingly, neither repo nor pnt show differential regu-lation at any of the examined stages in both of our experimentsand ttk appears downregulated only in the LOF at stage 11.Similar observations were described by Egger et al. (2002) andFreeman et al. (2003), where either no upregulation of these gcmtarget genes or even downregulation upon ectopic expression ofgcm occurred. With respect to (no) differential regulation of pntand ttk, this can be explained by the fact that for both genesalternative splice variants are expressed in neurons or other cells.For every gene on our microarray, a single exon was amplifiedand spotted. For pnt and ttk, the spotted exons (exons 7 and 5,respectively) are present in all splice variants. Hence, expressionoutside of glial cells may mask the glial-specific expression andno strong differential regulation is observed. For repo, there is nosuch obvious explanation since repo is expressed in all lateralglial cells exclusively. We extracted the expression values forrepo from all our microarray hybridizations and found a strongexpression of repo throughout the entire time course of bothexperiments without notable changes.Moreover, repo appears tobe expressed on our microarrays earlier and stronger than gcm(already at stage 9), which does not reflect the expression of repoin vivo. We sequenced the spotted PCR product, and the se-quence corresponds to exon 1 of the repo gene (as aspired).Furthermore, we hybridized Northern blots with total RNA fromboth wildtype and Mz1060::gcm embryos of different stageswith a repo antisense probe. An increase in repo-mRNA uponectopic expression of gcm was clearly detectable (data notshown). We conclude an unspecific cross-hybridization ofanother cDNA to the repo spot. This is obviously one of themajor drawbacks of cDNA microarray approaches.
Further steps towards the understanding of glial celldevelopment and diversity
A considerable number of genes have already beenidentified, which are involved in various aspects of glial cellbiology in the Drosophila embryo: early determining factorssuch as gcm, repo and pnt, factors required for terminal glial celldifferentiation and function like loco, EAAT1/2 or moody, andseveral genes expressed at various times in between. Most ofthese genes are expressed in subsets of glial cells only, andmany are also expressed in other cells or tissues. The biggestcollection of such genes was identified in the screen presentedby Freeman et al. (2003). Our microarray experiments enlargethis collection and for the first time incorporate results from a

Fig. 7. Functional classification of candidate genes. All filtered (potential) glial genes (255 genes) were grouped into eleven functional categories according to the GOannotation given in FlyBase. 25% are of unknown function.
558 B. Altenhein et al. / Developmental Biology 296 (2006) 545–560
gcm loss-of-function analysis. Towards a first characterizationof all these factors with respect to glial cell development,subtype specification and function, we can group the candidategenes for example according to (a) time point of expression inwildtype glial cells, (b) expression pattern in glial subtypes or(c) their annotated function. Most of the novel glial genes areexpressed from stage 12/13 onwards, and the vast majority isonly expressed in certain cells or subtypes. The primarydetermination of the glial cell fate in the embryo is achieved byGcm, which is expressed early in development of all lateral glialcells (Hosoya et al., 1995; Jones et al., 1995; Vincent et al.,1996). Further subtype specification obviously requires spatialand/or temporal cofactors. Together, they activate a variety ofother genes, ranging from signaling or transporter molecules toproteins with putative metabolic function. The restriction ofgene expression to particular glial cells includes all combina-tions of glial cell classes. Yet, some correlations can be observedwith respect to the classification of glial cells according tomorphological and positional criteria (Ito et al., 1995). Cellbody glia and peripheral glia for example are best confined bysubtype-specific gene expressions. Whether these subtypesrequire the respective genes for proper development or functionremains to be shown. Apparently, peripheral glial cells, whichmigrate over long distances from their place of origin in theCNS into the periphery, require precise subtype-specificregulation. Many of the genes expressed in more than onesubtype are also expressed in subperineurial glial cells. Recentpublications deal with the function of these cells in blood–brainbarrier formation and demonstrate the involvement of oneparticular gene, moody (Bainton et al., 2005; Schwabe et al.,2005). This gene has already been described by Freeman et al.(CG 4322) and was also found to be differentially regulated inour screen and filtered by our criteria (EG:22E5.11). moody is
predicted to encode a G-protein-coupled receptor molecule.The requirement of proper signaling via heterotrimeric G-protein receptors for glial cell differentiation and formation ofthe blood–brain barrier was already proposed earlier (Grand-erath et al., 1999). One of our newly described glial genes,CG11910, is also predicted to encode a G-protein-coupledreceptor molecule. It is expressed from stage 14 onwards inlongitudinal glia, a glial cell type that is known to enwrap thelongitudinal axonal connectives. Blood–brain barrier forma-tion requires the tight connection of subperineurial glial cellsby septate junctions. Some Drosophila genes are known toregulate the formation of septate junctions, for example,sinuous or neurexin (Baumgartner et al., 1996; Wu et al.,2004). Both genes are differentially regulated on ourmicroarray, too, and the latter is described to be required inblood–brain barrier formation (Baumgartner et al., 1996).This suggests that the entire lists of differentially regulatedgenes of both our microarray experiments (given inSupplementary Tables 1 and 2) comprise more glial-specificcandidates, which may be uncovered by further filtering withrespect to certain functional annotations. Yet, the collection ofglial genes identified so far provides an important basis forthe clarification of the genetic network controlling variousaspects of glial development and function.
Acknowledgments
We are grateful to Florence Besse and Anne Ephrussi forextensive advice and assistance with the sorting and selection ofembryos; to Tobias Rasse and Robert Ventzki for their intro-duction and help with the embryo sorter; to Joachim Urban andGert Pflugfelder for critical comments on the manuscript; toGeorge Dimopoulos for his help during our first experiences

559B. Altenhein et al. / Developmental Biology 296 (2006) 545–560
with microarrays; to Kurt Fellenberg for his help in dataanalysis; to Vladimir Benes, Luis Teixeira, and Britta Koch forcDNA clones, ESTs and amplicons; to Angela Giangrande andthe Bloomington stock center for fly strains; to Barbara Groh-Reichert, Ruth Beckervordersandforth and Irina Hein for theirhelp with in situ hybridizations; and to Olaf Vef for his help withfly work. This work was supported by a grant from the DeutscheForschungsgemeinschaft to B.A. and G.M.T.
Appendix A. Supplementary data
Supplementary data associated with this article can be found,in the online version, at doi:10.1016/j.ydbio.2006.04.460.
References
Akiyama-Oda, Y., Hosoya, T., Hotta, Y., 1998. Alteration of cell fate by ectopicexpression of Drosophila glial cells missing in non-neural cells. Dev. GenesEvol. 208, 578–585.
Alfonso, T.B., Jones, B.W., 2002. gcm2 promotes glial cell differentiation and isrequired with glial cells missing for macrophage development inDrosophila. Dev. Biol. 248, 369–383.
Badenhorst, P., Finch, J.T., Travers, A.A., 2002. Tramtrack co-operates toprevent inappropriate neural development in Drosophila. Mech. Dev. 117,87–101.
Bainton, R.J., Tsai, L.T., Schwabe, T., DeSalvo, M., Gaul, U., Heberlein,U., 2005. moody encodes two GPCRs that regulate cocaine beha-viors and blood–brain barrier permeability in Drosophila. Cell 123,145–156.
Bataille, L., Auge, B., Ferjoux, G., Haenlin, M., Waltzer, L., 2005. Resolvingembryonic blood cell fate choice in Drosophila: interplay of GCM andRUNX factors. Development 132, 4635–4644.
Baumgartner, S., Littleton, J.T., Broadie, K., Bhat, M.A., Harbecke, R., Lengyel,J.A., Chiquet-Ehrismann, R., Prokop, A., Bellen, H.J., 1996. A Drosophilaneurexin is required for septate junction and blood–nerve barrier formationand function. Cell 87, 1059–1068.
Beissbarth, T., Fellenberg, K., Brors, B., Arribas-Prat, R., Boer, J., Hauser, N.C.,Scheideler, M., Hoheisel, J.D., Schutz, G., Poustka, A., Vingron, M., 2000.Processing and quality control of DNA array hybridization data. Bioinfor-matics 16, 1014–1022.
Bernardoni, R., Vivancos, V., Giangrande, A., 1997. glide/gcm is expressed andrequired in the scavenger cell lineage. Dev. Biol. 191, 118–130.
Bossing, T., Udolph, G., Doe, C.Q., Technau, G.M., 1996. The embryoniccentral nervous system lineages of Drosophila melanogaster: I. Neuroblastlineages derived from the ventral half of the neuroectoderm. Dev. Biol. 179,41–64.
Campos-Ortega, J., Hartenstein, V., 1997. The Embryonic Development ofDrosophila melanogaster. Springer Berlin, Heidelberg.
Casso, D., Ramirez-Weber, F.A., Kornberg, T.B., 1999. GFP-tagged balancerchromosomes for Drosophila melanogaster. Mech. Dev. 88, 229–232.
Casso, D., Ramirez-Weber, F., Kornberg, T.B., 2000. GFP-tagged balancerchromosomes for Drosophila melanogaster. Mech. Dev. 91, 451–454.
Chotard, C., Leung, W., Salecker, I., 2005. Glial cells missing and gcm2 cellautonomously regulate both glial and neuronal development in the visualsystem of Drosophila. Neuron 48, 237–251.
Doe, C.Q., 1992. Molecular markers for identified neuroblasts and ganglionmother cells in the Drosophila central nervous system. Development 116,855–863.
Egger, B., Leemans, R., Loop, T., Kammermeier, L., Fan, Y., Radimerski, T.,Strahm, M.C., Certa, U., Reichert, H., 2002. Gliogenesis in Drosophila:genome-wide analysis of downstream genes of glial cells missing in theembryonic nervous system. Development 129, 3295–3309.
Fellenberg, K., Hauser, N.C., Brors, B., Hoheisel, J.D., Vingron, M., 2002.Microarray data warehouse allowing for inclusion of experiment annotationsin statistical analysis. Bioinformatics 18, 423–433.
Freeman, M.R., Delrow, J., Kim, J., Johnson, E., Doe, C.Q., 2003. Unwrapping
glial biology: gcm target genes regulating glial development, diversification,and function. Neuron 38, 567–580.
Furlong, E.E., Andersen, E.C., Null, B., White, K.P., Scott, M.P., 2001a.Patterns of gene expression during Drosophila mesoderm development.Science 293, 1629–1633.
Furlong, E.E., Profitt, D., Scott, M.P., 2001b. Automated sorting of livetransgenic embryos. Nat. Biotechnol. 19, 153–156.
Giesen, K., Hummel, T., Stollewerk, A., Harrison, S., Travers, A., Klämbt, C.,1997. Glial development in the Drosophila CNS requires concomitantactivation of glial and repression of neuronal differentiation genes.Development 124, 2307–2316.
Granderath, S., Stollewerk, A., Greig, S., Goodman, C.S., O'Kane, C.J.,Klämbt, C., 1999. loco encodes an RGS protein required for Drosophilaglial differentiation. Development 126, 1781–1791.
Granderath, S., Bunse, I., Klämbt, C., 2000. gcm and pointed synergisticallycontrol glial transcription of the Drosophila gene loco. Mech. Dev. 91,197–208.
Greenacre, M.J., 1984. Theory and Applications of Correspondence Analysis.Academic Press, London.
Greenacre, M.J., 1993. Correspondence Analysis in Practice. Academic Press,London.
Halter, D.A., Urban, J., Rickert, C., Ner, S.S., Ito, K., Travers, A.A., Technau,G.M., 1995. The homeobox gene repo is required for the differentiationand maintenance of glia function in the embryonic nervous system ofDrosophila melanogaster. Development 121, 317–332.
Hild, M., Beckmann, B., Haas, S.A., Koch, B., Solovyev, V., Busold, C.,Fellenberg, K., Boutros, M., Vingron, M., Sauer, F., Hoheisel, J.D., Paro, R.,2003. An integrated gene annotation and transcriptional profiling approachtowards the full gene content of the Drosophila genome. Genome Biol. 5,R3.
Hosoya, T., Takizawa, K., Nitta, K., Hotta, Y., 1995. Glial cells missing: a binaryswitch between neuronal and glial determination in Drosophila. Cell 82,1025–1036.
Ito, K., Urban, J., Technau, G., 1995. Distribution, classification, anddevelopment of Drosophila glial cells in the late embryonic and early larvalventral nerve cord. Roux's Arch. Dev. Biol. 204, 284–307.
Jiang, J., Kosman, D., Ip, Y.T., Levine, M., 1991. The dorsal morphogengradient regulates the mesoderm determinant twist in early Drosophilaembryos. Genes Dev. 5, 1881–1891.
Jones, B.W., 2005. Transcriptional control of glial cell development inDrosophila. Dev. Biol. 278, 265–273.
Jones, B.W., Fetter, R.D., Tear, G., Goodman, C.S., 1995. Glial cells missing: agenetic switch that controls glial versus neuronal fate. Cell 82, 1013–1023.
Jones, B.W., Abeysekera, M., Galinska, J., Jolicoeur, E.M., 2004. Transcrip-tional control of glial and blood cell development in Drosophila: cis-regulatory elements of glial cells missing. Dev. Biol. 266, 374–387.
Jordan, B.J., 2004. How consistent are expression chip platforms? BioEssays26, 1236–1242.
Kammerer, M., Giangrande, A., 2001. Glide2, a second glial promoting factor inDrosophila melanogaster. EMBO J. 20, 4664–4673.
Klaes, A., Menne, T., Stollewerk, A., Scholz, H., Klämbt, C., 1994. The Etstranscription factors encoded by theDrosophila gene pointed direct glial celldifferentiation in the embryonic CNS. Cell 78, 149–160.
Klämbt, C., 1993. The Drosophila gene pointed encodes two ETS-like proteinswhich are involved in the development of the midline glial cells.Development 117, 163–176.
Kosman, D., Ip, Y.T., Levine, M., Arora, K., 1991. Establishment of themesoderm–neuroectoderm boundary in the Drosophila embryo. Science254, 118–122.
Lebestky, T., Chang, T., Hartenstein, V., Banerjee, U., 2000. Specification ofDrosophila hematopoietic lineage by conserved transcription factors.Science 288, 146–149.
Miller, A.A., Bernardoni, R., Giangrande, A., 1998. Positive autoregulation ofthe glial promoting factor glide/gcm. EMBO J. 17, 6316–6326.
Patel, N.H., 1994. Imaging neuronal subsets and other cell types in whole-mountDrosophila embryos and larvae using antibody probes. Methods Cell Biol.44, 445–487.
Ragone, G., Van De Bor, V., Sorrentino, S., Kammerer, M., Galy, A., Schenck, A.,

560 B. Altenhein et al. / Developmental Biology 296 (2006) 545–560
Bernardoni, R., Miller, A.A., Roy, N., Giangrande, A., 2003. Transcriptionalregulation of glial cell specification. Dev. Biol. 255, 138–150.
Schmidt, H., Rickert, C., Bossing, T., Vef, O., Urban, J., Technau, G.M., 1997.The embryonic central nervous system lineages ofDrosophila melanogaster:II. Neuroblast lineages derived from the dorsal part of the neuroectoderm.Dev. Biol. 189, 186–204.
Schwabe, T., Bainton, R.J., Fetter, R.D., Heberlein, U., Gaul, U., 2005. GPCRsignaling is required for blood–brain barrier formation in Drosophila. Cell123, 133–144.
Soustelle, L., Jacques, C., Altenhein, B., Technau, G.M., Volk, T., Giangrande,A., 2004. Terminal tendon cell differentiation requires the glide/gcmcomplex. Development 131, 4521–4532.
Tan, P.K., Downey, T.J., Spitznagel Jr., E.L., Xu, P., Fu, D., Dimitrov, D.S.,Lempicki, R.A., Raaka, B.M., Cam, M.C., 2003. Evaluation of geneexpression measurements from commercial microarray platforms. NucleicAcids Res. 31, 5676–5684.
Tautz, D., Pfeifle, C., 1989. A non-radioactive in situ hybridization method forthe localization of specific RNAs in Drosophila embryos reveals
translational control of the segmentation gene hunchback. Chromosoma98, 81–85.
Urbach, R., Technau, G.M., 2003. Molecular markers for identifiedneuroblasts in the developing brain of Drosophila. Development 130,3621–3637.
Vincent, S., Vonesch, J.L., Giangrande, A., 1996. Glide directs glial fatecommitment and cell fate switch between neurones and glia. Development122, 131–139.
Wu, V.M., Schulte, J., Hirschi, A., Tepass, U., Beitel, G.J., 2004. Sinuous is aDrosophila claudin required for septate junction organization and epithelialtube size control. J. Cell Biol. 164, 313–323.
Xiong, W.C., Okano, H., Patel, N.H., Blendy, J.A., Montell, C., 1994. repoencodes a glial-specific homeo domain protein required in the Drosophilanervous system. Genes Dev. 8, 981–994.
Yuasa, Y., Okabe, M., Yoshikawa, S., Tabuchi, K., Xiong, W.C., Hiromi, Y.,Okano, H., 2003. Drosophila homeodomain protein REPO controls glialdifferentiation by cooperating with ETS and BTB transcription factors.Development 130, 2419–2428.
Copyright © 2022 FDOKUMEN