Genotoxicity testing of two lead-compounds in somatic cells of Drosophila melanogaster
Upload
khangminh22Category
view
2download
0
Southern Adventist UniversityKnowledgeExchange@Southern
Senior Research Projects Southern Scholars
1998
A Qualitative Analysis of Larval Drosophilamelanogaster Mitochondrial DNA via thePolymerase Chain ReactionJason Gatling
Follow this and additional works at: https://knowledge.e.southern.edu/senior_research
Part of the Biology Commons
This Article is brought to you for free and open access by the Southern Scholars at KnowledgeExchange@Southern. It has been accepted for inclusionin Senior Research Projects by an authorized administrator of KnowledgeExchange@Southern. For more information, please [email protected].
Recommended CitationGatling, Jason, "A Qualitative Analysis of Larval Drosophila melanogaster Mitochondrial DNA via the Polymerase Chain Reaction"(1998). Senior Research Projects. 104.https://knowledge.e.southern.edu/senior_research/104

)
A Qualitative Analysis of Larval Drosophila melanogaster
Mitochondrial DNA via the Polymerase Chain Reaction
Jason Gatling
Southern Scholars Senior Research Project
Research Advisor: Joyce Azevedo
AprillO, 1998

Introduction
A Qualitative Analysis of Larval Drosophila melanogaster
Mitochondrial DNA via the Polymerase Chain Reaction
Mitochondria, which are present in virtually all eukaryotic cells, are membrane-bound
organelles that convert energy to forms that can be used to drive cellular reactions. The common
pathway whereby mitochondria derive energy for biological purposes operates on a process
known as chemiosmotic coupling [1]. The energy from the oxidation of food materials is used to
drive a membrane-bound proton (H+) pump that transfers H+from one side of the mitochondrial
membrane to the other. The H+pump therefore generates an electrochemical proton gradient
across the membrane [2]. The H+gradient drives many energy storing reactions when the H+ flow
back through membrane-embedded protein energy machines. The mitochondrion is therefore
extremely important for the production of daily aerobic energy [3].
Mitochondria contain their own DNA (mtDNA) in a relatively small16.5 kb circular
molecule which is exclusively concerned with coding for 13 polymerases, 22 tRNA' s, 2 rRNA' s,
and most of the components of the respiratory-chain/oxidative phosphorylation system [4]. The
mitochondiral genome is about 10-5 times smaller than the size of an average nuclear genome [3].
The mtDNA genome is nearly the same size in animals as diverse as the common fruit fly
(Drosophila melanogaster) and humans. All mitochondria contain multiple copies of the
organelle DNA molecule which are usually distributed in several clusters in the matrix of the
mitochondria where they are thought to be attached to the inner membrane [2]. Although it is not
known how the mtDNA is packaged from replication to replication, the genome structure is
thought to resemble that of bacteria rather than eukaryotic chromatin [3]. For example, a distinct
1

difference, is that mtDNA does not contain any histones for tight and efficient packaging [3].
Despite the fact that mtDNA encodes for only a small number of proteins in comparision to that
of nuclear DNA, the mitochondria carries out its own DNA replication, DNA transcription, and
protein synthesis [3]. These processes take place in the mitochondrial matrix where countless
other important energy transforming reactions take place [2].
In comparison to the nuclear genome, the mitochondiral genome has several interesting
features. (1) Unlike other genomes, nearly every nucleotide appears to be part of a coding
sequence, for either a tRNA, rRNA, or protein. Because of these direct coding sequences, there
is very little room for regulatory DNA sequences. (2) Whereas 30 or more tRNA's specify amino
acids (aa) in the cytosol, only 22 tRNA's are required for mitochondrial DNA synthesis. (3) And
most surprising is the comparison of mt gene sequences and aa sequences of the corresponding
proteins which indicates that the genetic code is different. There are 4 of the 64 co dons that have
a different meaning from those ofthe same codons in other genomes [3] .
Purpose
The project undertaken involved research into the mitochondrial (mt) DNA genome of
Drosophila melanogaster. This mtDNA genome of D. melanogaster has been found to undergo
spontaneous deletions over the lifetime of the organism. Previous research has indicated that
there are several "hot-spots" where deletions have occurred within organisms as disparate as fungi
and humans [4]. The purpose of this project was to optimize the "Polymerase Chain Reaction"
(PCR) parameters and conditions for the stable amplification of a small region (approximately 250
nucleotide pairs) from the larval Drosophila melanogaster mtDNA genome.
2

Methods & Materials
Design ofmtPNA Primers
The genome sequence of Drosophila melanogaster was obtained [5] and initially three
primers (18, 18, and 20 nucleotides respectively) were designed (Table 1). The initial three
primers targeted two mtPNA sequences; the first one 512 nucleotides in length and the second
3196 nucleotides in length. After several PCR analyses, a fourth primer was designed to
complement one of the previous primers and target a 252 nucleotide sequence. Upon arrival, the
lyophilized primers were resuspended in 100 Jll to make a 20.0 JlM stock primer suspension. The
stock primer suspension was then diluted as needed to a 1.0 JlM working concentration.
Table 1. Designed Primers for PCR Analysis
Primer1 # Primer Sequence2 MW3 Span of Primer Sequence4
Primer 1 GAACATAAACCATGAGCA 5495 8613 to 8630 (Fred-A)
Primer 2 GTTGAGGTTATCAGCCAG 5543 9159 to 9142 (Edward-B)
Primer 3 GGAACTTTACCTCGATTTC 6071 11,845 to 11,826 (Maggie-C) G
Primer 4 CTGGAGCTTCAACATGAGC 5799 8907 to 8926 (Sue-D)
1 Primer name is given below each primer. 2 Primer sequence is given in the 3' direction. 3 Molecular weight is given in units ofDaltons (Da). 4 The span ofthe primer sequence is given using the GenBank numbering system [4].
3

mtDNA Isolation
Approximately twenty wild-type larval Drosophila melanogaster were isolated for DNA
extraction. The Drosophila melanogaster larva were washed in 0.9% saline and frozen at -80°C.
The larva were then homogenized in 1.0 ml of a buffer solution: 10 mM Tris-HCl (pH 7.5), 10
mM EDT A, 60 mM CaC12, and 0.5% SDS. The buffered homogenate was then centrifuged at a
low speed for approximately two minutes. After the centrifugation, the supernatant was poured
off and frozen at -80°C. The pelleted larval organelle debris was discarded. The frozen
supernatant was later thawed and incubated in 10 of5.3 mg/ml RNase at 37°C for 15 minutes.
Proteins were extracted using a 1: 1 phenol to chloroform solution mixed 1: 1 with the supernatant
and centrifuged at high speed for 10 minutes. The DNA was extracted with the aqueous
supernatant solution and frozen at -80°C.
To date, sixteen PCR reactions were run which attempted to isolate and identify the
variable conditions for the proper PCR amplification. Each reaction set had its own unique
variable that could help solidify the purpose of the research project which was to design a set of
primers and determine the optimum conditions to amplify a targeted sequence of D. melanogaster
mtDNA. All of the PCR reactions were performed in a Thermojet™ temperature cycler. The
following cycle times and temperatures were used in all trials unless otherwise indicated: 1 min.
denaturation at 94°C, 1 min. annealing at 62-65°C, and 2 min. elongation at 72°C. Distilled de-
ionized water was added to all tubes in all reaction trials to increase the final tube volume
4

)
to 25 Each PCR reaction included 30 cycles and ended with a 10 min. post-cycle at 72°C.
The latitude of the ThermojetTM temperature cycler allowed that a temperature of 4°C to be
reached as a final resting temperature following the 10 min. post-cycle.
Rxn Set-1 was performed to determine the viability oflarval vs. adult mtDNA and also
effectiveness ofEpicentreTmTfl thermostable polymerase on mtDNA amplification (Table 2).
Table 2. Ttl Trial 1.
Tubel Tube2 Tube3 Tube4
* 2 Jlllarval DNA * 2 Jll adult DNA * 2 Jlllarval DNA * 2 Jll adult DNA
2 Jll primer (Fred) 2 Jll primer (Fred) 2 primer (Fred) 2 Jll primer (Fred)
2 Jll primer (Edward) 2 primer (Maggie) 2 primer (Edward) 2 Jll primer (Maggie)
4 Jll dNTP's {1.25 4 Jll dNTP's (1.25 4 dNTP's (1.25 4 dNTP's (1.25
2.5 Buffer 2.5 Buffer 2.5 1 0X Buffer 2.5 lOX Buffer
* 1 Tfl enzyme * 1 Tfl enzyme * 1 Tfl enzyme * 1 Tfl enzyme
2 Jll MgS04 2 MgS04 (25J.lM) 2 MgS04 (25J.lM) 2 MgS04 (25J.lM)
*Project defined variable(s) for each Rxn Set.
5

Rxn Set-2 was performed to determine the viability oflarval vs. adult mtDNA and also
effectiveness ofBiometra Tm PrimeZyme thermostable polymerase on mtDNA amplification {Table
3).
Table 3. PrimeZyme Triall.
TubeS Tube6 Tube7 Tube 8
* 2 larval DNA * 2 adult DNA * 2 larvalDNA * 2 J.ll adult DNA
2 primer (Fred) 2 primer (Fred) 2 primer (Fred) 2 primer (Fred)
2 primer (Edward) 2 primer (Maggie) 2 primer (Edward) 2 primer (Maggie)
4 dNTP's (1.25 4 dNTP's (1.25 4 dNTP's (1.25 4 dNTP's (1.25
2.5 10X Buffer 2.5 10X Buffer 2.5 10X Buffer 2.5 10XBuffer
* 1 PrimeZyme * 1 PrimeZyme * 1 PrimeZyme * 1 PrimeZyme
Rxn Set-3 was performed to quantify two variables: 1) to determine whether larval
mtDNA was properly extracted from D. melanogaster and 2) to determine which thermostable
polymerase was more efficient: Epicentretm Ttl or Biometra Tm PrimeZyme (Table 4).
Table 4. Tfl Trial 2 and PrimeZyme Trial 2.
Tubel Tube2 Tube3 Tube4
* 2 larvalDNA * 2 larvalDNA * 2 larvalDNA * 2 larvalDNA
2 primer (Fred) 2 primer (Fred) 2 primer (Fred) 2 primer (Fred)
2 primer (Edward) 2 primer (Maggie) 2 primer (Edward) 2 primer (Maggie)
4 dNTP's (1.25 4 dNTP's (1.25 4 dNTP's (1.25 4 dNTP's (1.25
2.5 lOX Buffer 2.5 10XBuffer 2.5 1 10XBuffer 2.5 10XBuffer
* 1 Ttl enzyme * 1 Ttl enzyme * 1 PrimeZyme * 1 PrimeZyme
2 MgS04 (25 2 MgS04
6
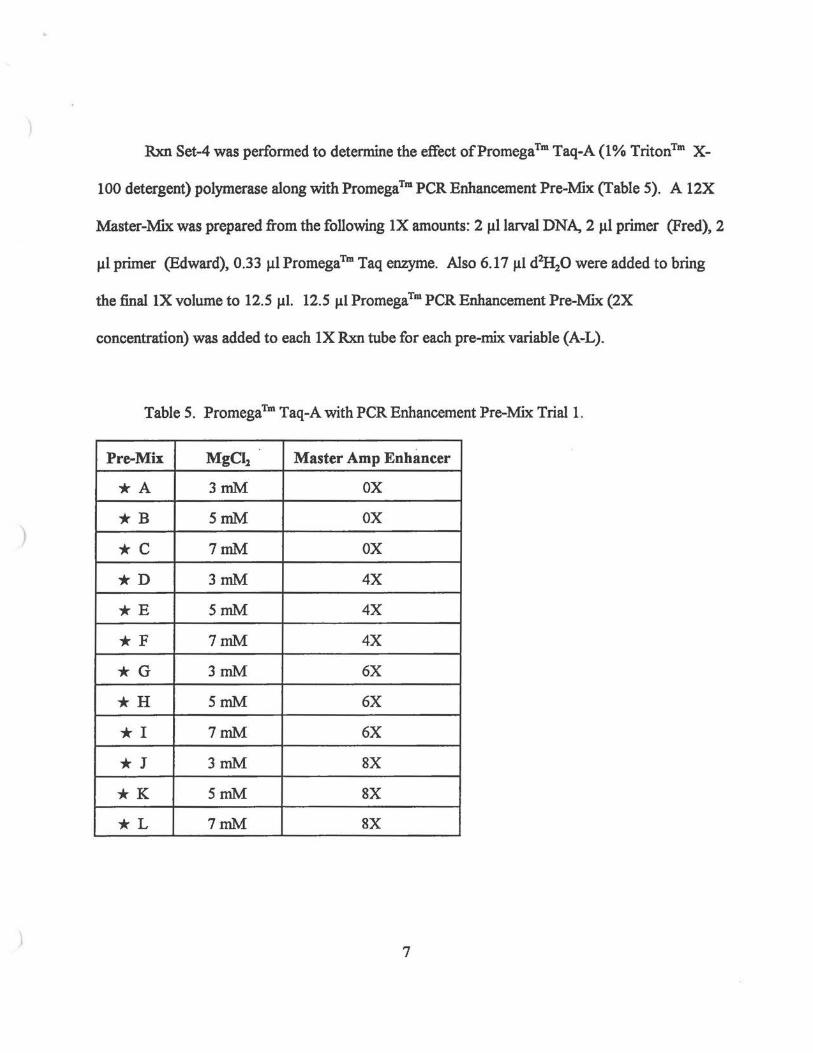
Rxn Set-4 was performed to determine the effect ofPromegaTm Taq-A (1% TritonTm X-
100 detergent) polymerase along with PromegaTm PCR Enhancement Pre-Mix (Table 5). A 12X
Master-Mix was prepared from the following 1X amounts: 2 larvalDNA, 2 primer (Fred), 2
primer (Edward), 0.33 PromegaTm Taq enzyme. Also 6.17 d2H20 were added to bring
the final1X volume to 12.5 12.5 PromegaTm PCR Enhancement Pre-Mix (2X
concentration) was added to each 1X Rxn tube for each pre-mix variable (A-L).
Table 5. PromegaTm Taq-A with PCR Enhancement Pre-Mix Tria11.
Pre-Mix Mgal Master Amp Enhancer
*A 3mM ox *B 5mM ox *C 7mM ox *D 3mM 4X
*E 5mM 4X
*F 7mM 4X
*G 3mM 6X
*H 5mM 6X
*I 7mM 6X
*] 3mM 8X
*K 5mM 8X
*L 7mM 8X
7
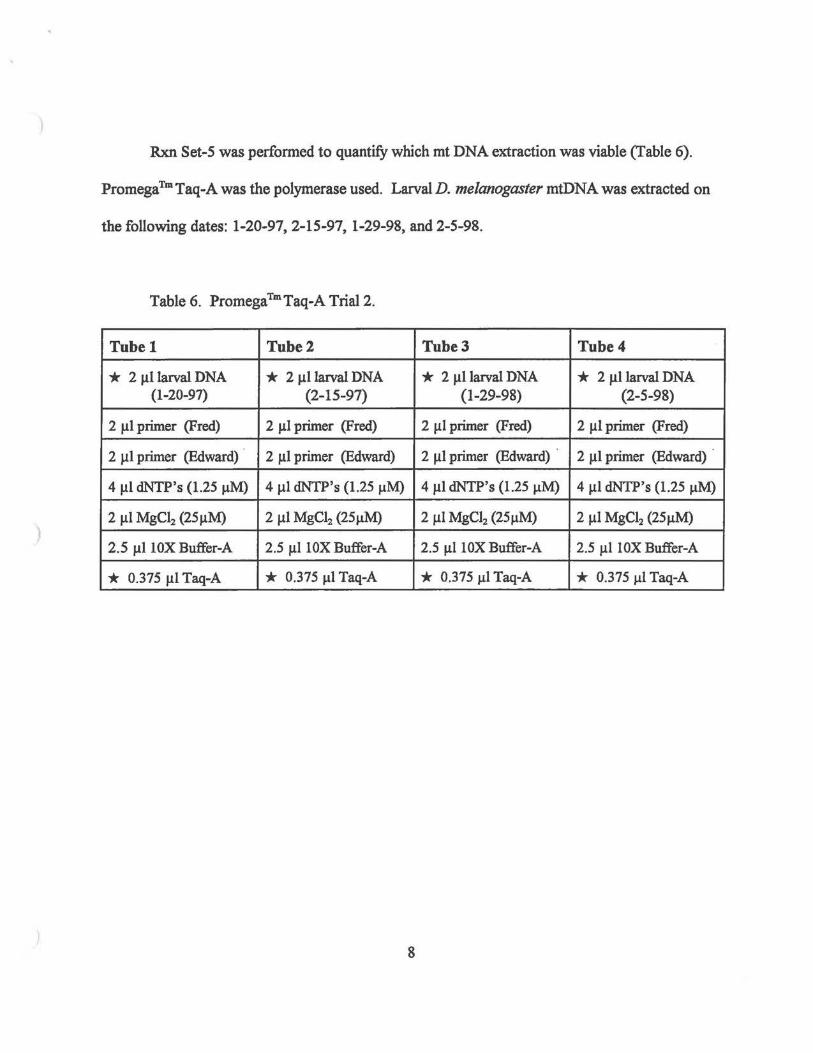
Rxn Set-S was performed to quantify which mt DNA extraction was viable (Table 6).
PromegaTmTaq-A was the polymerase used. Larval D. me/anogaster mtDNA was extracted on
the following dates: 1-20-97, 2-15-97, 1-29-98, and 2-5-98.
Table 6. PromegaTmTaq-A Trial2.
Tubel Tube2 Tube3 Tube4
* 2 larvalDNA * 2 larvalDNA * 2 larvalDNA * 2 larvalDNA (1-20-97) (2-15-97) (1-29-98) (2-5-98)
2 primer (Fred) 2 primer (Fred) 2 primer (Fred) 2 primer (Fred)
2 primer (Edward) 2 primer (Edward) 2 primer (Edward) 2 primer (Edward)
4 dNTP's (1.25 4 dNTP's (1.25 4 dNTP's (1.25 4 dNTP's (1.25
2 MgC12 (25 2 MgC12 (25 2 MgCI2 (25 2 MgC12 (25
2.5 10XBuffer-A 2.5 10XBuffer-A 2.5 10XBuffer-A 2.5 10XBuffer-A
* 0.375 Taq-A * 0.375 Taq-A * 0.375 Taq-A * 0.375 Taq-A
8

)
Rxn Set-6 was performed was performed to quantify which mt DNA extraction was viable
{Table 7). PromegaTmTaq-B (0.5% TweenTm 20 and 0.5% NonidentTm P-40 detergents) was the
polymerase used. Larval D. melanogaster mtDNA was extracted on the following dates: 1-20-
97, 2-15-97, 1-29-98, and 2-5-98.
Table 7. PromegaTmTaq-B Trial I.
Tubel Tube2 Tube3 Tube4
* 2 larval DNA * 2 larval DNA * 2 larval DNA * 2 larval DNA (1-20-97) (2-15-97) (1-29-98) (2-5-98)
2 primer (Fred) 2 primer (Fred) 2 primer (Fred) 2 primer (Fred)
2 primer (Edward) 2 primer (Edward) 2 primer (Edward) 2 J .tl primer (Edward)
) 4 dNTP's (1.25 4 J .tl dNTP's (1.25 4 dNTP's (1.25 JlM) 4 Jll dNTP's (1.25 J.1M)
2 MgC12 (25 2 MgC12 (25 2 MgCI2 (25 2 MgCI2 (25
2.5 10XBuffer-B 2.5 10XBuffer-B 2.5 10XBuffer-B 2.5 10XBuffer-B
* 0.375 Taq B * 0.375 Taq-B * 0.375 Jll Taq-B * 0.375 Jll Taq-B
9

)
Rxn Set-7 was performed with two variables involved {Table 8). The first variable was
the mtDNA template used combined a I: I ratio of extracted DNA on I-25-98 and 2-5-98. The
second variable was the annealing temperature was lowered 3 degrees to 62°C to decrease the
stringency of annealing. A I2X Master-Mix was prepared from the following IX amounts: 2
larval DNA, 2 primer (Fred), 2 primer (Edward), 0.33 PromegaTm Taq-B Polymerase.
Also 6.I7 were added to bring the final IX volume to I2.5 I2.5 PromegaTm PCR
Enhancement Pre-Mix (2X concentration) was added to each IX Rxn tube for each pre-mix
variable {A-L).
Table 8. PromegaTmTaq-B with PCR Enhancement Pre-Mix Trial2.
Pre-Mix MgCI1 Master Amp Enhancer
*A 3mM ox *B SmM ox *C 7mM ox *D 3mM 4X
*E SmM 4X
*F 7mM 4X
*G 3mM 6X
*H 5mM 6X
*I 7mM 6X
*I 3mM 8X
*K SmM 8X
*L 7mM 8X
10

Rxn Set-8 was performed to determine the effect of two different concentrations ofMgC12
and also the effect ofmtDNA extracted on 1-29-98 and 2-5-98 (Table 9). PromegaTmTaq-A was
the polymerase used. The annealing temperature was also lowered 3 degrees to 62°C to decrease
the stringency of annealing.
Table 9. PromegaTmTaq-A Trial3.
Tubel Tube2 Tube3 Tube4
* 2 J.1llarval DNA * 2 J.1llarval DNA * 2 J.1llarval DNA * 2 larval DNA (1-29-98) (1-29-98) (2-5-98) (2-5-98)
2 primer (Fred) 2 primer (Fred) 2 primer (Fred) 2 primer (Fred)
2 primer (Edward) 2 primer (Edward) 2 primer (Edward) 2 primer (Edward)
) 4 dNTP's (1.25 4 J.ll dNTP's (1.25 4 dNTP's (1.25 4 dNTP's (1.25
* 0.5 MgCI2 * 1. 0 MgCI2 * 0.5 MgC12 * 1. 0 MgC12
(25J.1M)
2.5 10XBuffer-A 2.5 10XBuffer-A 2.5 10XBuffer-A 2.5 10XBuffer-A
* 0.375 Taq-A * 0.375 Taq-A * 0.375 Taq-A * 0.375 Taq-A
11

Rxn Set-9 was performed to determine the effect of two different concentrations ofMgC12
and also the effect ofmtDNA extracted on 1-29-98 and 2-5-98 (Table 10). PromegaTmTaq-B
was the polymerase used. The annealing temperature was also lowered 3 degrees to 62°C to
decrease the stringency of annealing.
Table 10. PromegaTmTaq-B Trial3.
Tubel Tube2 Tube3 Tube4
* 2 larval DNA * 2 larvalDNA * 2 larvalDNA * 2 larvalDNA (1-29-98) (1-29-98) (2-5-98) (2-5-98)
2 primer (Fred) 2 primer (Fred) 2 primer (Fred) 2 primer (Fred)
2 primer (Edward) 2 primer (Edward) 2 primer (Edward) 2 primer (Edward)
) 4 dNTP's (1.25 4 dNTP's (1.25 4 dNTP's (1.25 4 dNTP's (1.25
* 0.5 MgC12 * 1.0 MgCI2 * 0.5 MgCI2 * 1.0 MgCI2
2.5 10XBuffer-B 2.5 lOX Buffer-B 2.5 10XBuffer-B 2.5 lOX Buffer-B
* 0.375 Taq-B * 0.375 Taq-B * 0.375 Taq-B * 0.375 Taq-B
12

Rxn Set-10 was performed to determine the effect of a new primer, Sue-D on the targeted
mtDNA sequence (Table 11 ). This primer was designed to complement with primers Edward-B
and Maggie-C which targeted different sequences to be amplified. Both PromegaTmTaq-A and
Taq-B were used to optimize amplification conditions. The annealing temperature was also
lowered 3 degrees to 62°C to decrease the stringency of annealing.
Table 11. Promega Tm Taq-A and Taq-B Trials 4.
Tubel Tube2 Tube3 Tube4
2 Jlllarval DNA 2 Jlllarval DNA 2 Jlllarval DNA 2 Jlllarval DNA (1-29-98) (1-29-98) (1-29-98) (1-29-98)
* 2 primer (Sue) * 2 primer (Sue) * 2 primer (Sue) * 2 primer (Sue)
* 2 primer * 2 primer * 2 primer * 2 primer (Edward) (Maggie) (Edward) (Maggie)
4 dNTP's (1.25 JlM) 4 dNTP's (1.25 JlM) 4 Jll dNTP's (1.25 J.1M) 4 dNTP's (1.25 JlM)
2 MgC12 2 MgC12 2 MgC12 2 MgC12
(25J.1M) {25J.1M) (25J.1M)
2.5 10XBuffer-A 2.5 10XBuffer-A 2.5 10XBuffer-B 2.5 10XBuffer-B
* 0.375 Taq-A * 0.375 Taq-A * 0.375 Jll Taq-B * 0.375 Jll Taq-B
13

Rxn Set-11 was performed to determine the effect of Sue-D on increasing concentrations
ofMgCl2 (Table 12). PromegaTmTaq-B was used to optimize the amplification conditions. A 7X
Master-Mix was prepared from the following IX amounts: larvalDNA (1-29-98),
primer (Fred), 2 primer (Edward), dNTP's, 2.5 10X Buffer-B, and 0.33 PromegaTm
Taq-B Polymerase. Also d2H20 was added to bring the final IX volume per tube to 25.0
Also, the annealing temperature was lowered 3 degrees to 62°C to decrease the stringency of
annealing.
Table 12. PromegaTmTaq-B TrialS.
Tube# MgCI2 Concentration
* 1 3.0
*2 3.5 Jll
* 3 4.0
*4 4.5
* 5 5.0
*6 5.5
*7 6.0
14

Rxn Set-12 was performed to determine the effect of primer Sue-D on PromegaTm PCR
Enhancement Pre-Mix (Table 13). A 6X Master-Mix was prepared from the following 1X
amounts: 2 larval DNA (1-29-98), 2 primer (Sue), 2 primer (Maggie), 0.33
PromegaTm Taq-B Polymerase. Also 6.17 were added to bring the final1X volume to
12.5 12.5 PromegaTm PCR Enhancement Pre-Mix (2X concentration) was added to each
1XRxn tube for each pre-mix variable (A-F). The annealing temperature was also lowered 3
degrees to 62°C to decrease the stringency of annealing.
Table 13. PromegaTmTaq-B Trial6.
Pre-Mix MgCl2 Master Amp Enhancer
*A 3mM ox *B 5mM ox *C 7mM ox *D 3mM 4X
*E SmM 4X
*F 7mM 4X
15

Rxn Set-13 was performed to determine the effect of Sue-D on increasing concentrations
ofMgC12 (Table 14). PromegaTmTaq-A was used to optimize the amplification conditions. A 6X
Master-Mix was prepared from the following IX amounts: 2 larvalDNA (1-29-98},
primer (Sue), 2 primer (Edward), 4 dNTP's, 2.5 10XBuffer-A, and 0.33 PromegaTm
Taq-A Polymerase. Also was added to bring the final IX volume per tube to 25.0
Also, the annealing temperature was lowered 3 degrees to 62°C to decrease the stringency of
annealing.
Table 14. PromegaTmTaq-A TrialS.
Tube# MgCI2 Concentration
* 1 2.0
*2 2.5
*3 3.0 . *4 3.5
* 5 4.0
* 6 4.5
16

)
Rxn Set-14 was performed to determine the effect of Sue-D on increasing concentrations
ofMgC12 (Table 15). Primer Edward-B was used as the complement for annealing. PromegaTm
Taq-A was used to optimize the amplification conditions. A 3X Master-Mix was prepared from
the following IX amounts: 2 larval DNA (1-29-98), 2 primer (Sue), 2 primer (Edward),
4 dNTP's, 2.5 10XBuffer-A, and 0.33 PromegaTm Taq-APolymerase. Also d2H20 was
added to bring the final IX volume per tube to 25.0 Also, the annealing temperature was
lowered 3 degrees to 62°C to decrease the stringency of annealing.
Table 15. PromegaTmTaq-A Trial6.
Tube# MgCl2 Concentration
* 1 2.0 Jll
*2 2.5
* 3 3.0 Jll
17

Rxn Set-15 was performed to determine the effect of Sue-D on increasing concentrations
ofMgCl2 (Table 16). Primer Maggie-C was used as the complement for annealing. PromegaTm
Taq-A was used to optimize the amplification conditions. A 3X Master-Mix was prepared from
the following 1X amounts: 2 Jlllarval DNA (1-29-98), 2 primer (Sue), 2 primer (Maggie),
4 dNTP's, 2.5 10XBuffer-A, and 0.33 PromegaTm Taq-APolymerase. Also d2H20 was
added to bring the :final1X volume per tube to 25.0 Jll. Also, the annealing temperature was
lowered 3 degrees to 62°C to decrease the stringency of annealing.
Table 16. PromegaTmTaq-A Trial?.
Tube# MgCI2 Concentration
* 1 2.0
*2 2.5
*3 3.0
18
)
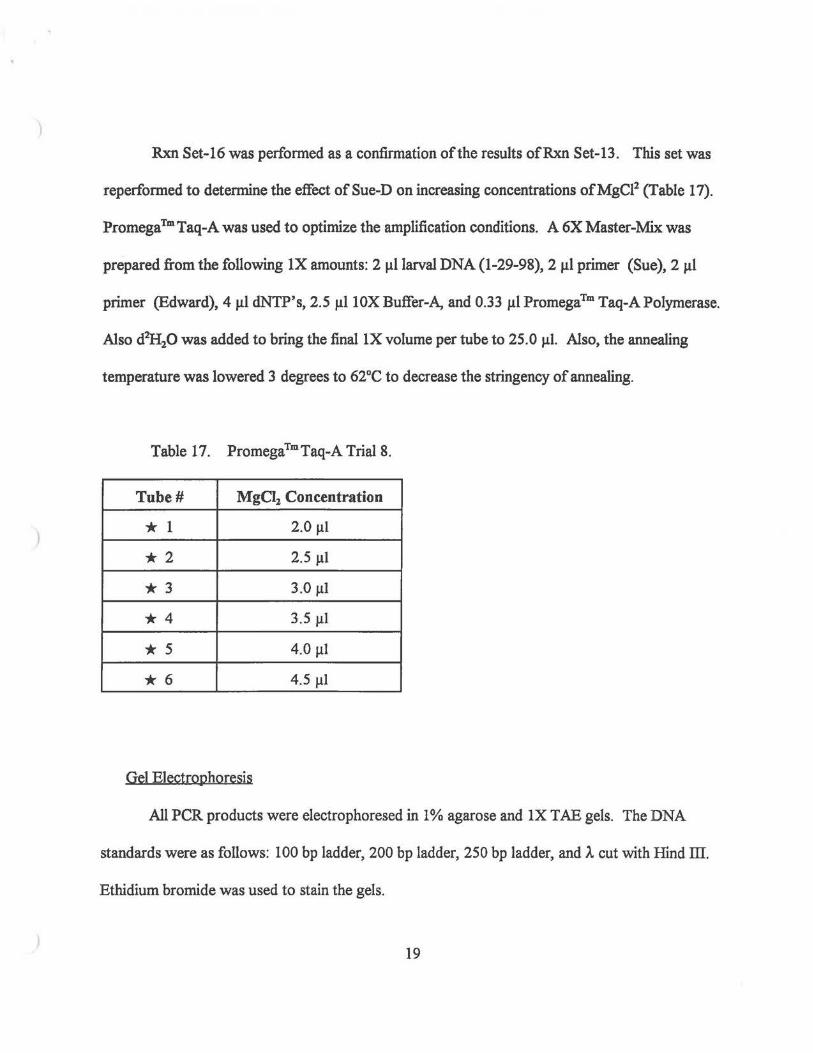
Rxn Set-I6 was performed as a confirmation of the results ofRxn Set-13. This set was
reperformed to determine the effect of Sue-D on increasing concentrations ofMgC12 (Table I7).
Promega Tm Taq-A was used to optimize the amplification conditions. A 6X Master-Mix was
prepared from the following IX amounts: 2 larvalDNA (1-29-98), 2 primer (Sue), 2
primer (Edward), 4 dNTP's, 2.5 10XBuffer-A, and 0.33 PromegaTm Taq-APolymerase.
Also was added to bring the final IX volume per tube to 25.0 Also, the annealing
temperature was lowered 3 degrees to 62°C to decrease the stringency of annealing.
Table I7. PromegaTmTaq-A TrialS.
Tube# MgCI2 Concentration
* I 2.0
*2 2.5
* 3 3.0
*4 3.5
* 5 4.0
* 6 4.5
Gel Electrophoresis
All PCR products were electrophoresed in I% agarose and IX TAE gels. The DNA
standards were as follows: 100 bp ladder, 200 bp ladder, 250 bp ladder, and cut with Hind III.
Ethidium bromide was used to stain the gels.
I9

Results
The results of each PCR reaction set were analyzed by gel electrophoresis. Each gel
contained one or more lanes of size standards along with six or more lanes of PCR product.
Gel electrophoresis ofEpicentreTm Tfl Trials 1 and 2 and also EpicentreTm PrimeZyme
Trials 1 and 2 showed no amplification ofDNA. However, there were primer-dimers at the end
of the gel which gives evidence that there was primer annealing in the PCR tubes. The three
standards, 100 and 250 bp ladders and nr, were clearly visible and therefore
electrophoresed and stained well.
Gel electrophoresis ofPromegaTmTaq-A Trials 1, 2, 3, 4, 6, and 7 showed no
amplification ofDNA. However, there were primer-dimers at the end of the gel which gives
evidence that there was primer annealing in the PCR tubes. The three standards, 100 and 250 bp
ladders and were clearly visible and therefore electrophoresed and stained well.
Gel electrophoresis ofPromegaTmTaq-B Trials 1, 3, 4, and 6 showed no amplification of
DNA. However, there were primer -dimers at the end of the gel which gives evidence that there
was primer annealing in the PCR tubes. The three standards, 100 and 250 bp ladders and
Ill, were clearly visible and therefore electrophoresed and stained well.
Gel electrophoresis ofPromega Tm Taq-B Trial 2 showed a minute smear of amplified
DNA. The lanes with Master Amp Enhancer and with 3, 5, 7 mM ofMgC12 gave a smear
over approximately a 1500 bp range (between 200-1900 bp). These ranges were not the targeted
areas on the mtDNA genome that were supposed to be amplified. There were again good primer-
dimers at the end of the gel. The three standards, 100 and 250 bp ladders and IIIwere
20
clearly visible and therefore electrophoresed and stained well.
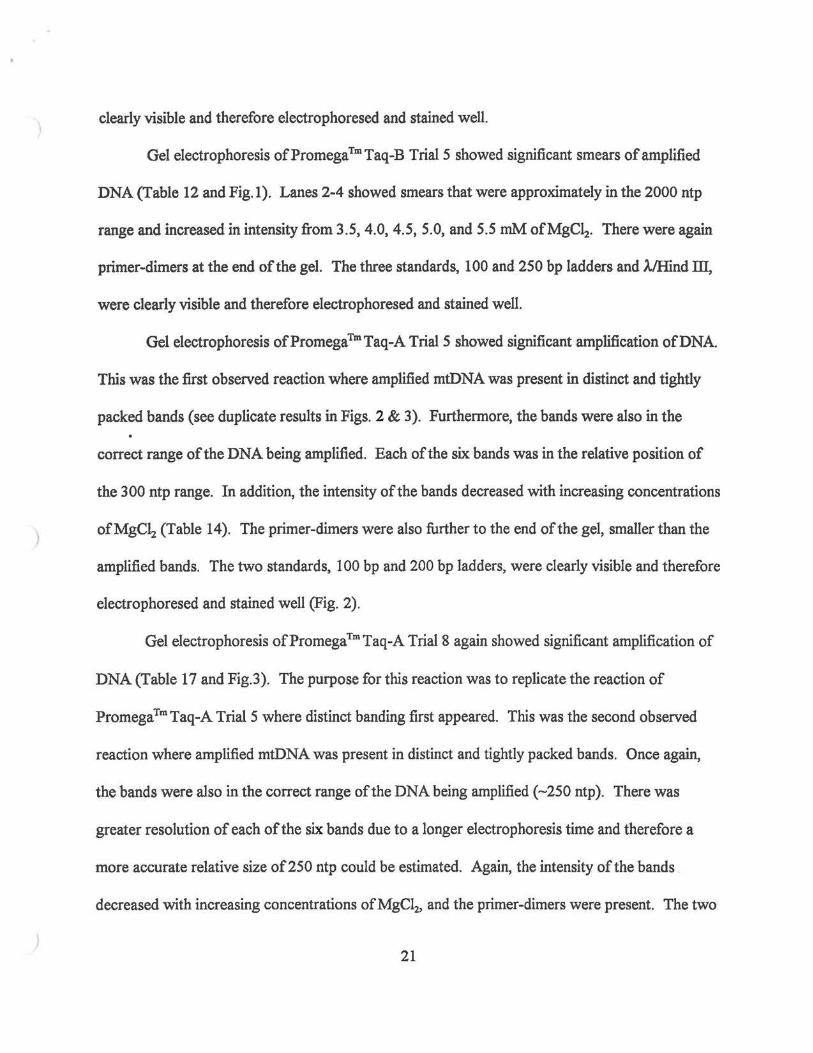
Gel electrophoresis ofPromega Tm Taq-B Trial 5 showed significant smears of amplified
DNA (Table 12 and Fig.1 ). Lanes 2-4 showed smears that were approximately in the 2000 ntp
range and increased in intensity from 3.5, 4.0, 4.5, 5.0, and 5.5 mM ofMgC12• There were again
primer-dimers at the end of the gel. The three standards, 100 and 250 bp ladders and m,
were clearly visible and therefore electrophoresed and stained well.
Gel electrophoresis ofPromegaTmTaq-A TrialS showed significant amplification ofDNA.
This was the first observed reaction where amplified mtDNA was present in distinct and tightly
packed bands (see duplicate results in Figs. 2 & 3). Furthermore, the bands were also in the
correct range of the DNA being amplified. Each of the six bands was in the relative position of
the 300 ntp range. In addition, the intensity of the bands decreased with increasing concentrations
ofMgC12 (Table 14). The primer-dimers were also further to the end of the gel, smaller than the
amplified bands. The two standards, 100 bp and 200 bp ladders, were clearly visible and therefore
electrophoresed and stained well {Fig. 2).
Gel electrophoresis ofPromegaTmTaq-A TrialS again showed significant amplification of
DNA (Table 17 and Fig.3). The purpose for this reaction was to replicate the reaction of
PromegaTmTaq-A TrialS where distinct banding first appeared. This was the second observed
reaction where amplified mtDNA was present in distinct and tightly packed bands. Once again,
the bands were also in the correct range of the DNA being amplified (~250 ntp). There was
greater resolution of each of the six bands due to a longer electrophoresis time and therefore a
more accurate relative size of250 ntp could be estimated. Again, the intensity of the bands
decreased with increasing concentrations ofMgC12, and the primer-dimers were present. The two
21

standards, 100 bp and 200 bp, were clearly visible and therefore electrophoresed and stained well
(Fig. 3).
Discussion
The purpose ofthis research project was to make a qualitative analysis of larval D.
melanogaster mtDNA via the PCR reaction. Minimal success was achieved in the beginning
partly because of improper procedures such as non-sterile pipetting and procedure mix-ups.
Many mistakes were made during the first few weeks of the project and were the result of a
limited knowledge of the workings of PCR and gel electrophoresis. In the latter stages of the
project, proper laboratory protocol and the design of a new primer, Sue-D {Table 11), helped to
give a more definite amount of success. According to the results, Sue-D primed best in
conjunction with Edward-B to produce an expected amplification product. The primers, Sue-D
and Edward-B along with Taq-A polymerase, dNTP's, viable DNA, and correct concentrations of
MgC12 allowed for the amplification of the targeted mtDNA sequence (Tables 14 & 17 and Figs.2
&3).
Based upon research results from Rxn Sets 13 and 16 (Tables 14 & 17), mtDNA
amplification was improved with the use ofPrimers Sue-D and Edward-B along with PromegaTm
Taq-A Polymerase. These reactions also identified which concentrations ofMgCl2 were most
efficient for this particular targeted mtDNA sequence. The results ofRxn Sets 13 and 16 (Tables
14 & 17) showed that the optimal MgC12 concentration was approximately 5.0 rnM. Distinct
banding slowly faded as increased concentrations ofMgC12 were added to the reaction tubes (Fig.
2 & 3). According to the results, a region ofmtDNA was amplified under the appropriate
22

conditions which resulted in a segment of approximately 250 ntp (Fig. 2 & 3). According to
calculations from the D. melanogaster genome [4], the use ofprimers Sue-D and Edward-B
would amplify a targeted region of252 ntp.
For reasons unknown, primer Sue-D did not complement well with Maggie-C. During the
reaction sets involving Sue-D and Maggie-C, there were no amplification bands at all. The
optimistic targeted region for this set of primers was 1800 ntp. According to results of this
project, the proper reaction conditions for the amplification of the 252 ntp region differs from that
of the 1800 ntp region. If bands were produced in the targeted 1800 ntp region, then there would
be more conclusive evidence for the hypothesis that PCR reactions can be effectively used on the
mtDNA genome of D. melanogaster as a tool to detect the presence of deletions.
As a reference to the continuation of this project, there are many other aspects yet to be
elucidated. Future research needs to be attempted in this area concerning the longer targeted
sequence between Sue-D and Maggie-C. To this point, there appears to be no reason why these
particular primers did not complement to produce a proper amplification product. Once
amplification can be performed of both targeted regions, another logical research project is the
qualitative analysis of mtDNA deletions occuring during successive stages on the D.
melanogaster life-cycle [6]. There is good evidence that mtDNA is more vulnerable to damage
than nuclear DNA It has a 10 fold higher mutation rate, lacks protective histones, has few and
inefficient repair mechanisms, and a high rate of replication turnover [4]. Such research into the
role that mtDNA plays in the senescence of an organism is of current concern and optimism.
23

Literature Cited
1. Campbell, N.A. 1992. Biology, 3rd Ed. The Benjamin/Cummings Publishing Company, Inc., Redwood, CA.
2. Stryer, L. 1995. Biochemistry, 4th Ed. W.H. Freeman and Co., New York.
3. Alberts, B., D. Bray, J. Lewis, M. Raff, K. Roberts, and J.D. Watson, 1994. Molecular Biology of THE CELL, 3'd Ed. Garland Publishing, Inc., New York.
4. Brierley, E., M. Johnson, 0. James, D. Turnbull, 1997 ''Mitochondiral involvement in the ageing process." Molecular and Cell Biochemistry. 174: 325-328.
5. GenBank Database 1998. http://www.ncbi.nlm.gov/irx/cgi-binlbirx_doc?genbank (3-20-98).
6. Mazet, F., F. Morel, S. Touraille, 1995. "Changes in the respiratory chain complexes activities and in the mitochondrial DNA content during ageing in D. subobscura." Mechanisms of Aging and Development. 84: 171-181.
24

1 2 3 4 5 6 7 8
1.
3.
Figure 1. -Gel Electrophoresis ofRxn Set-11. Lane 4 contains III standard. Lanes 1-3 and 5-7 contain increasing concentrations
ofMgC12 (Table 12). Features of interest: 1- PCR amplification smears of mtDNA. 2- III standard. 3- Primer-dimers at bottom of gel.

1 2 3 4 5 6 7 8
2. 3.
Figure 2. -Gel Electrophoresis ofRxn Set-13 . Lanes 1 and 8 contain 100 and 200 bp ladders respectively. Lanes 22-7 contain increasing concentrations ofMgC12 (Table 14). Features of interest: 1- Highly packed PCR amplification bands of mtDNA approximately 250 ntp in size. 2- 100 bp ladder. 3- 200 bp ladder. 4- Primer-dimers at bottom of geL

l 2 3 4 5 6 7 8
2. 3.
Figure 3. -Gel Electrophoresis ofRxn Set-16. The purpose of this reaction was to replicate the results ofRxn Set-13. Lanes 1 and 8 contain 100 and 200 bp ladders respectively. Lanes 2-7 contain increasing concentrations ofMgC12 (Table 17). Features of interest: 1- Highly packed PCR amplification bands of mtDNA approximately 250 ntp in size. 2- 100 bp ladder. 3- 200 bp ladder. 4- Primer-dimers at bottom of gel.
Copyright © 2022 FDOKUMEN