Characterization of the Drosophila segment determination morphome
34
Characterization of the Drosophila segment determination morphome Svetlana Surkova a , David Kosman b , Konstantin Kozlov a , Manu d , Ekaterina Myasnikova a , Anastasia A. Samsonova c , Alexander Spirov d , Carlos E. Vanario-Alonso e , Maria Samsonova a , and John Reinitz d,* a Department of Computational Biology, Center for Advanced Studies, St. Petersburg State Polytechnical University, 29 Polytehnicheskaya Street, St. Petersburg, 195251, Russia b Division of Biological Sciences, University of California at San Diego, 9500 Gilman Drive, La Jolla, CA 92093-0349, USA c Department of Genetics, Harvard Medical School, 77 Avenue Louis Pasteur, Boston, MA 02115, USA d Department of Applied Mathematics and Statistics, and Center for Developmental Genetics, Stony Brook University, Stony Brook, NY 11794-3600, USA e Instituto de Biofisica Carlos Chagas Filho, Universidade Federal do Rio de Janeiro, Ave Brigadeiro Trompowsky, CCS BL-G, Rio de Janeiro, RJ 21949, Brazil Abstract Here we characterize the expression of the full system of genes which control the segmentation morphogenetic field of Drosophila at the protein level in one dimension. The data used for this characterization are quantitative with cellular resolution in space and about 6 min in time. We present the full quantitative profiles of all 14 segmentation genes which act before the onset of gastrulation. The expression patterns of these genes are first characterized in terms of their average or typical behavior. At this level, the expression of all of the genes has been integrated into a single atlas of gene expression in which the expression levels of all genes in each cell are specified. We show that expression domains do not arise synchronously, but rather each domain has its own specific dynamics of formation. Moreover, we show that the expression domains shift position in the direction of the cephalic furrow, such that domains in the anlage of the segmented germ band shift anteriorly while those in the presumptive head shift posteriorly. The expression atlas of integrated data is very close to the expression profiles of individual embryos during the latter part of the blastoderm stage. At earlier times gap gene domains show considerable variation in amplitude, and significant positional variability. Nevertheless, an average early gap domain is close to that of a median individual. In contrast, we show that there is a diversity of developmental trajectories among pair-rule genes at a variety of levels, including the order of domain formation and positional accuracy. We further show that this variation is dynamically reduced, or canalized, over time. As the first quantitatively characterized morphogenetic field, this system and its behavior constitute an extraordinarily rich set of materials for the study of canalization and embryonic regulation at the molecular level. Keywords Drosophila embryo; Segmentation genes; Blastoderm; Gene expression; Quantitative expression data; Positional information * Corresponding author. Fax: +1 631 632 8490. E-mail address: [email protected] (J. Reinitz). NIH Public Access Author Manuscript Dev Biol. Author manuscript; available in PMC 2009 January 15. Published in final edited form as: Dev Biol. 2008 January 15; 313(2): 844–862. NIH-PA Author Manuscript NIH-PA Author Manuscript NIH-PA Author Manuscript
Transcript of Characterization of the Drosophila segment determination morphome

Characterization of the Drosophila segment determinationmorphome
Svetlana Surkovaa, David Kosmanb, Konstantin Kozlova, Manud, Ekaterina Myasnikovaa,Anastasia A. Samsonovac, Alexander Spirovd, Carlos E. Vanario-Alonsoe, MariaSamsonovaa, and John Reinitzd,*
a Department of Computational Biology, Center for Advanced Studies, St. Petersburg State PolytechnicalUniversity, 29 Polytehnicheskaya Street, St. Petersburg, 195251, Russia
b Division of Biological Sciences, University of California at San Diego, 9500 Gilman Drive, La Jolla, CA92093-0349, USA
c Department of Genetics, Harvard Medical School, 77 Avenue Louis Pasteur, Boston, MA 02115, USA
d Department of Applied Mathematics and Statistics, and Center for Developmental Genetics, Stony BrookUniversity, Stony Brook, NY 11794-3600, USA
e Instituto de Biofisica Carlos Chagas Filho, Universidade Federal do Rio de Janeiro, Ave BrigadeiroTrompowsky, CCS BL-G, Rio de Janeiro, RJ 21949, Brazil
AbstractHere we characterize the expression of the full system of genes which control the segmentationmorphogenetic field of Drosophila at the protein level in one dimension. The data used for thischaracterization are quantitative with cellular resolution in space and about 6 min in time. We presentthe full quantitative profiles of all 14 segmentation genes which act before the onset of gastrulation.The expression patterns of these genes are first characterized in terms of their average or typicalbehavior. At this level, the expression of all of the genes has been integrated into a single atlas ofgene expression in which the expression levels of all genes in each cell are specified. We show thatexpression domains do not arise synchronously, but rather each domain has its own specific dynamicsof formation. Moreover, we show that the expression domains shift position in the direction of thecephalic furrow, such that domains in the anlage of the segmented germ band shift anteriorly whilethose in the presumptive head shift posteriorly. The expression atlas of integrated data is very closeto the expression profiles of individual embryos during the latter part of the blastoderm stage. Atearlier times gap gene domains show considerable variation in amplitude, and significant positionalvariability. Nevertheless, an average early gap domain is close to that of a median individual. Incontrast, we show that there is a diversity of developmental trajectories among pair-rule genes at avariety of levels, including the order of domain formation and positional accuracy. We further showthat this variation is dynamically reduced, or canalized, over time. As the first quantitativelycharacterized morphogenetic field, this system and its behavior constitute an extraordinarily rich setof materials for the study of canalization and embryonic regulation at the molecular level.
KeywordsDrosophila embryo; Segmentation genes; Blastoderm; Gene expression; Quantitative expressiondata; Positional information
* Corresponding author. Fax: +1 631 632 8490. E-mail address: [email protected] (J. Reinitz).
NIH Public AccessAuthor ManuscriptDev Biol. Author manuscript; available in PMC 2009 January 15.
Published in final edited form as:Dev Biol. 2008 January 15; 313(2): 844–862.
NIH
-PA Author Manuscript
NIH
-PA Author Manuscript
NIH
-PA Author Manuscript

IntroductionDuring Drosophila embryogenesis the segmented body plan is established through a cascadeof maternally and zygotically expressed segmentation genes (reviewed in Akam, 1987;Ingham, 1988). The zygotic genes have been classified according to their mutant phenotypesand expression patterns. ‘Gap’ genes are expressed in one to three broad domains, ‘pair-rule’genes initially form seven transverse stripes and ‘segment polarity’ genes manifest in patternsof fourteen stripes about one cell wide. Of these genes, maternal, gap, and pair-rule genes actduring the blastoderm stage, giving rise to the initial expression of segment polarity genes atthe onset of gastrulation, by which time the segmental pattern is determined (Simcox and Sang,1983). This process is of general interest because it is perhaps the best characterized exampleof a “morphogenetic field” (Gilbert et al., 1996).
The morphogenetic field is a fundamental object in developmental biology. It was shown inthe late 19th century that groups of cells underwent collective determination events(morphallaxis) in which cell fate was stably assigned to individual cells with exquisite spatialprecision. Although early workers (Driesch, 1914) were pessimistic regarding the question ofwhether critical phenomena connected with determination could be understood on a chemicalbasis, the introduction of high-throughput technologies gives rise to optimism. Success inelucidating genomes, proteomes, and so on suggests the importance of understanding the“morphome”, by which we mean the complete set of determinants of a morphogenetic field.In general, the morphome will consist of a description of the quantities of morphogeneticdeterminants at a resolution in space and time sufficient to uniquely determine the biologicaltrajectory of the system. Because of the central role of cells and their genomes, the informationabout the morphome must be of at least cellular resolution in space, must include the expressionlevels of all the genes encoding cell fate determinants, and must be of a time resolution shorterthan the time in which significant changes in the levels of these determinants can take place.
In this paper we present a preliminary description of the morphome of segment determinationin the Drosophila blastoderm in terms of the one-dimensional protein expression levels ofsegmentation genes.
During this period the embryo is syncytial and only a very limited number of zygotic genesare expressed. Saturation mutagenesis (Nüsslein-Volhard and Wieschaus, 1980) has identifiedmost or all of the segmentation genes. Of these, only 14 act in the blastoderm as determinantsof the segmentation morphogenetic field. All of these genes code for transcription factors(Rosenberg et al., 1986; Mohler et al., 1989; Nauber et al., 1988; Tautz et al., 1987; Pignoniet al., 1990; Driever and Nüsslein-Volhard, 1988; Macdonald et al., 1986; Kuroiwa et al.,1984; Ish-Horowicz et al., 1985; Gergen and A., 1988; Coulter et al., 1990; Frigerio et al.,1986; Benedyk et al., 1994; Grossniklaus et al., 1992). This fact, together with the syncytialnature of the blastoderm suggests that cell–cell communication by means of signaling pathwaysdoes not occur in the segmentation morphogenetic field, but rather that spatial interactionsoccur through diffusion of these transcription factors. Mechanical forces and cell migrationappear to be uncoupled from the segment determination process as well, since mutations insegmentation genes do not affect morphology until after gastrulation. The segmental fieldstretches from 30% egg length (EL) from the anterior pole to about 93% EL. In this regiongenes controlling the anterior–posterior (A–P) axis are uncoupled from those controlling thedorso-ventral (D–V) axis, and hence a one-dimensional treatment is a good approximation.The description of the segmentation morphome given here is quantitative, at cellular spatialresolution, and has a temporal resolution of about 6 min. The treatment presented here isnevertheless preliminary as it does not consider the full three-dimensional blastoderm,signaling events in the terminal regions, or certain late acting segmentation genes.
Surkova et al. Page 2
Dev Biol. Author manuscript; available in PMC 2009 January 15.
NIH
-PA Author Manuscript
NIH
-PA Author Manuscript
NIH
-PA Author Manuscript

In order to characterize the segmentation morphome, it is necessary to assemble the full time-dependent expression pattern from many individual embryos of different ages which have beenstained for different combinations of proteins. We first characterize this typical, or integrated,pattern of gene expression for each of the segmentation genes. We demonstrate that domainsform in a characteristic way over time, and in some cases shift position during the course ofdevelopment. We also consider the question of how close the integrated patterns are to thoseof actual individuals. Such comparisons as well as comparisons between individuals giveinsight into the relationship between natural variation and the regulation, or error correction,properties of this morphogenetic field. Classically, regulation was assayed after surgicalmanipulation, but recent work has demonstrated that regulation can be observed in thevariations of the levels of gene products from one individual to another without surgicalmanipulation (Houchmandzadeh et al., 2002; Spirov and Holloway, 2003b; Holloway et al.,2006).
In this work we show that there is substantial variation between individual expression patternsearly, but this variation is canalized into highly uniform patterns by the onset of gastrulation.We further demonstrate that as early broad expression domains transform themselves into anincreasing number of subdomains, the new subdomains show variational behavior that at earlytimes is independent of that of other subdomains of the same gene. The data described hereare accessible on the Internet database FlyEx (Poustelnikova et al., 2004,http://urchin.spbcas.ru/flyex or http://flyex.ams.sunysb.edu/flyex).
A large number of studies published for the most part in the late 1980s and early 1990s gavea good overall picture of segmentation gene expression (see Supplementary Information,Section 1 for a brief review). In certain cases, diagrams of the relative patterns of expressionof several genes were produced for a particular region of blastoderm at a particular time.Nevertheless, three very basic questions remained unanswered. First, it is evident thatdetermination proceeds using the cell (or nucleus) as a fundamental processing unit. Hence thebiologically essential information is not the overall shape of an expression pattern, but ratherwhat quantities of gene products are present in each cell. Second, the expression patterns areknown to change in time, and hence it does not suffice to know the expression levels at anyone time; it is necessary to characterize the entire time course. Finally, the differences betweenindividuals must be categorized. We present partial answers to these questions in what follows.
Materials and methodsQuantitative gene expression data
Approximately 1600 embryos from Oregon-R flies were fixed and incubated with primaryantibodies as described (Kosman et al., 1998), using sera raised against bacterially expressedprotein products of bcd and cad; the gap genes Kr, kni, gt, hb, and tll; the pair-rule genes eve,ftz, h, run, odd, prd, and slp. All of these serums were raised by us as described (Kosman etal., 1998), except for rabbit anti-Eve, which was a generous gift of Manfred Frasch (Azpiazuand Frasch, 1993). Some embryos were stained with secondary sera conjugated to FITC, TexasRed, and Cy5 (Jackson Labs), and others with sera conjugated to Alexa Fluor 488, 555, 647,and 700 as described (Janssens et al., 2005).
Each embryo was stained for Eve protein and two other segmentation proteins. Approximatelyhalf of these were also counterstained with nuclear marker as described (Janssens et al.,2005), while in the remainder nuclei were detected by constructing a pixel maximum imagefrom the three gene expression channels (Kosman et al., 1997). Embryos were imaged at stagesranging from cleavage cycle 10 (when proteins synthesized from maternal transcripts begin toappear) up to the onset of gastrulation. Embryos showing any morphological signs of
Surkova et al. Page 3
Dev Biol. Author manuscript; available in PMC 2009 January 15.
NIH
-PA Author Manuscript
NIH
-PA Author Manuscript
NIH
-PA Author Manuscript
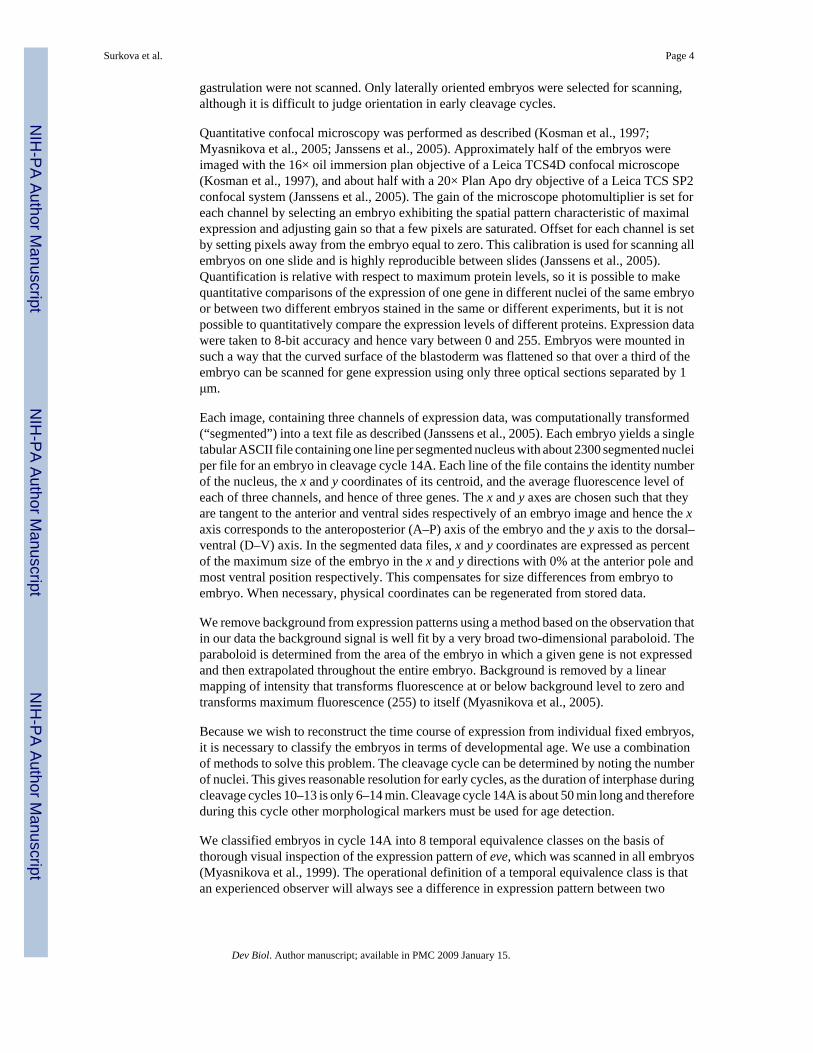
gastrulation were not scanned. Only laterally oriented embryos were selected for scanning,although it is difficult to judge orientation in early cleavage cycles.
Quantitative confocal microscopy was performed as described (Kosman et al., 1997;Myasnikova et al., 2005; Janssens et al., 2005). Approximately half of the embryos wereimaged with the 16× oil immersion plan objective of a Leica TCS4D confocal microscope(Kosman et al., 1997), and about half with a 20× Plan Apo dry objective of a Leica TCS SP2confocal system (Janssens et al., 2005). The gain of the microscope photomultiplier is set foreach channel by selecting an embryo exhibiting the spatial pattern characteristic of maximalexpression and adjusting gain so that a few pixels are saturated. Offset for each channel is setby setting pixels away from the embryo equal to zero. This calibration is used for scanning allembryos on one slide and is highly reproducible between slides (Janssens et al., 2005).Quantification is relative with respect to maximum protein levels, so it is possible to makequantitative comparisons of the expression of one gene in different nuclei of the same embryoor between two different embryos stained in the same or different experiments, but it is notpossible to quantitatively compare the expression levels of different proteins. Expression datawere taken to 8-bit accuracy and hence vary between 0 and 255. Embryos were mounted insuch a way that the curved surface of the blastoderm was flattened so that over a third of theembryo can be scanned for gene expression using only three optical sections separated by 1μm.
Each image, containing three channels of expression data, was computationally transformed(“segmented”) into a text file as described (Janssens et al., 2005). Each embryo yields a singletabular ASCII file containing one line per segmented nucleus with about 2300 segmented nucleiper file for an embryo in cleavage cycle 14A. Each line of the file contains the identity numberof the nucleus, the x and y coordinates of its centroid, and the average fluorescence level ofeach of three channels, and hence of three genes. The x and y axes are chosen such that theyare tangent to the anterior and ventral sides respectively of an embryo image and hence the xaxis corresponds to the anteroposterior (A–P) axis of the embryo and the y axis to the dorsal–ventral (D–V) axis. In the segmented data files, x and y coordinates are expressed as percentof the maximum size of the embryo in the x and y directions with 0% at the anterior pole andmost ventral position respectively. This compensates for size differences from embryo toembryo. When necessary, physical coordinates can be regenerated from stored data.
We remove background from expression patterns using a method based on the observation thatin our data the background signal is well fit by a very broad two-dimensional paraboloid. Theparaboloid is determined from the area of the embryo in which a given gene is not expressedand then extrapolated throughout the entire embryo. Background is removed by a linearmapping of intensity that transforms fluorescence at or below background level to zero andtransforms maximum fluorescence (255) to itself (Myasnikova et al., 2005).
Because we wish to reconstruct the time course of expression from individual fixed embryos,it is necessary to classify the embryos in terms of developmental age. We use a combinationof methods to solve this problem. The cleavage cycle can be determined by noting the numberof nuclei. This gives reasonable resolution for early cycles, as the duration of interphase duringcleavage cycles 10–13 is only 6–14 min. Cleavage cycle 14A is about 50 min long and thereforeduring this cycle other morphological markers must be used for age detection.
We classified embryos in cycle 14A into 8 temporal equivalence classes on the basis ofthorough visual inspection of the expression pattern of eve, which was scanned in all embryos(Myasnikova et al., 1999). The operational definition of a temporal equivalence class is thatan experienced observer will always see a difference in expression pattern between two
Surkova et al. Page 4
Dev Biol. Author manuscript; available in PMC 2009 January 15.
NIH
-PA Author Manuscript
NIH
-PA Author Manuscript
NIH
-PA Author Manuscript

embryos in different temporal classes, but typically cannot distinguish an age difference in twoembryos of the same class.
The 8 classes are approximately equally populated, and each class represents an age range ofa little over 6 min. To confirm this classification, we made use of morphological features ofthe embryo that can be observed in both fixed and living tissue. Such features include the extentof membrane invagination and changes in nuclear shape. We confirmed the temporalclassification by rephotographing 120 embryos from cycle 14A in Differential InterferenceContrast (DIC) optics. We measured the length of membrane as percent cortex length in thesephotographs and compared this ratio with a published standard curve (Merrill et al., 1988).This showed that the gene expression based classification method was consistent with othermethods and that the time classes were uniform in duration, as shown in Fig. 1. The Leica TCSSP2 is equipped with DIC, and we acquired blastoderm morphology images for all embryosscanned on this system.
The in vivo studies reported here were conducted as follows. Embryos were dechorionated andmounted between Biofolie 25 semipermeable membranes (In Vitro Systems and ServicesGmbh) with halocarbon oil 27 (Sigma). Embryos were imaged in a Leica TCS SP2 ConfocalSystem using transmission mode with a 40× objective, 2.5× digital zoom and DIC optics.Images are 8-bit and 1024×1024-pixel resolution with averaging over 4 scans.
We wish to map the expression patterns of all genes in the morphome but can only image theproducts of three genes at once. However, each embryo is stained for eve expression, and bysmall coordinate transformations, it is possible to align expression patterns from multipleembryos so as create aligned patterns which can be averaged. This was usually done by aligningpeaks and valleys of the eve pattern as described (Myasnikova et al., 2001). Embryos in thefirst temporal class of cleavage cycle 14A or younger are not susceptible to this method becauseof a lack of features and were not registered.
In the central area of the blastoderm that constitutes the presumptive segmented germ band,segmentation and homeotic genes expression is a function of A–P position in the embryoniccoordinate system, and D–V gene expression is a function of the embryonic D–V coordinate.Because of the asymmetric curvature of the embryo, this coordinate system is orthogonal butcurvilinear. Although the extent of the curvature is exaggerated by mechanical deformation inthe embryos considered here, it is clearly seen in non-deformed whole mounts (J. Reinitz,unpublished observations) and in tissue sections hybridized to RNA in situ (Reinitz and Levine,1990). Although we have developed methods for working with 2D data (Spirov et al., 2000,2001; Kozlov et al., 2002), the essential biology of the segmentation genes is well representedin one dimension and hence it is sufficient to consider data extracted from the narrow strip ofnuclei comprising the central 10% of the embryo in the D–V direction. This strip yields geneexpression measurements from about 350 nuclei per embryo.
Finally, we obtain an integrated pattern for the full set of gene products by dividing this central10% strip into A–P zones of 1% egg length (EL) which is very close to the observed averagenuclear width of 0.97% EL. We take the average expression level of each gene in each A–Pzone and consider this to be a one-dimensional nuclear model of an expression pattern. Wetake 0% EL to be at the anterior pole and 100% EL at the posterior pole, contrary to the normalconvention, so that A–P position increases from left to right in graphs. We refer to these dataas “one-dimensional integrated data” or “integrated data for the 10% strip” (Myasnikova et al.,2001).
Surkova et al. Page 5
Dev Biol. Author manuscript; available in PMC 2009 January 15.
NIH
-PA Author Manuscript
NIH
-PA Author Manuscript
NIH
-PA Author Manuscript

Statistical analysis of gene expression dataThe most natural way to study the dynamics of formation of segmentation gene expressiondomains is to describe these domains by a small number of characteristic features of the patternand to monitor how these features change in time. We consider data in the 10% central stripalong the A–P axis of an embryo in order to ensure a sufficient number of samples. As thecharacteristic features of segmentation gene expression domains we take the A–P positions ofexpression maxima as well as points where expression is a predefined percentage of maximum,typically 50% (Supplementary Fig. 1).
The characteristic features of expression domains of pair-rule genes were extracted using thefast dyadic wavelet transform (FRDWT) (Kozlov et al., 2000; Myasnikova et al., 2001), or ina small number of specific cases that are noted in the text by singular spectrum analysis (SSA;see below under Classification methods). FRDWT is good enough for accurate detection ofthe extremal points of the pattern. However the domains of gap genes and maternal gradientsoccupy larger territories than pair-rule gene expression domains and contain local spikes whichdo not correspond to domain maxima. To identify the most essential features of each domainand to eliminate noise on the curves, we approximate the gene expression pattern by quadraticsplines, which provide a smooth approximation of the domains, and classifies each pattern bya set of features (Myasnikova et al., 1999, 2001). The quality of automatic extraction of featureswas checked by thorough visual inspection.
To validate the significance of temporal changes in the positions of expression domains(“shifts”), we performed ANOVA (StatSoft Statistica version 6.0) to test the differencesbetween mean positions of characteristic features of expression domains in each time class forstatistical significance at a confidence level of P=0.05. The positional variability of expressionpatterns was estimated by computing the standard deviations of the positions of characteristicfeatures.
Classification methodsIndividual eve patterns subjected to automated classification were treated as follows. First, theembryos were subjected to a coordinate transformation that straightens their stripes, asdescribed (Spirov et al., 2000; Spirov and Holloway, 2003a). Further processing was performedon a strip containing the central 50% of D–V values, which captures the expression levels ofabout 1500 nuclei in cleavage cycle 14A. In order to classify expression variation amongindividual embryos in terms of the pattern over the whole A–P axis, the D–V coordinate ofeach nucleus was suppressed, and the resulting noisy pattern was smoothed by means ofsingular spectrum analysis (SSA) (Broomhead and King, 1986; Fraedrich, 1986; Vautard andGhil, 1989). In SSA, a single 1D sequence of length N whose ith value is xi is considered asan M-dimensional series of length N−M+1 whose ith element is given by the M-tuple(xi−M+1, … xi−1, xi) (Elsner and Tsonis, 1996). M is called the “window length”. Principalcomponent analysis is performed on this M-dimensional series, resolving the total varianceinto M components of which the first few terms contain most of the variance. The series canthen be reconstructed from these resolved components. Much of the behavior of the series canbe reconstructed from the first few terms, and such reconstruction was used here as an adaptivesmoothing method (Golyandina et al., 2001). Initial studies (Holloway et al., 2006) were madewith M=N/2 to determine a suitable noise model; here M is chosen small in light of that noisemodel to ensure proper smoothing.
In order to classify the patterns entirely on the basis on their intensity profiles, variations ofintensity were eliminated by renormalizing intensity to 100, and patterns were spatiallyregistered by placing the maximum of the SSA smoothed pattern at 35% EL classification wasperformed by the method of self-organizing maps (SOM) (Kohonen, 1990; Team, 1995;
Surkova et al. Page 6
Dev Biol. Author manuscript; available in PMC 2009 January 15.
NIH
-PA Author Manuscript
NIH
-PA Author Manuscript
NIH
-PA Author Manuscript
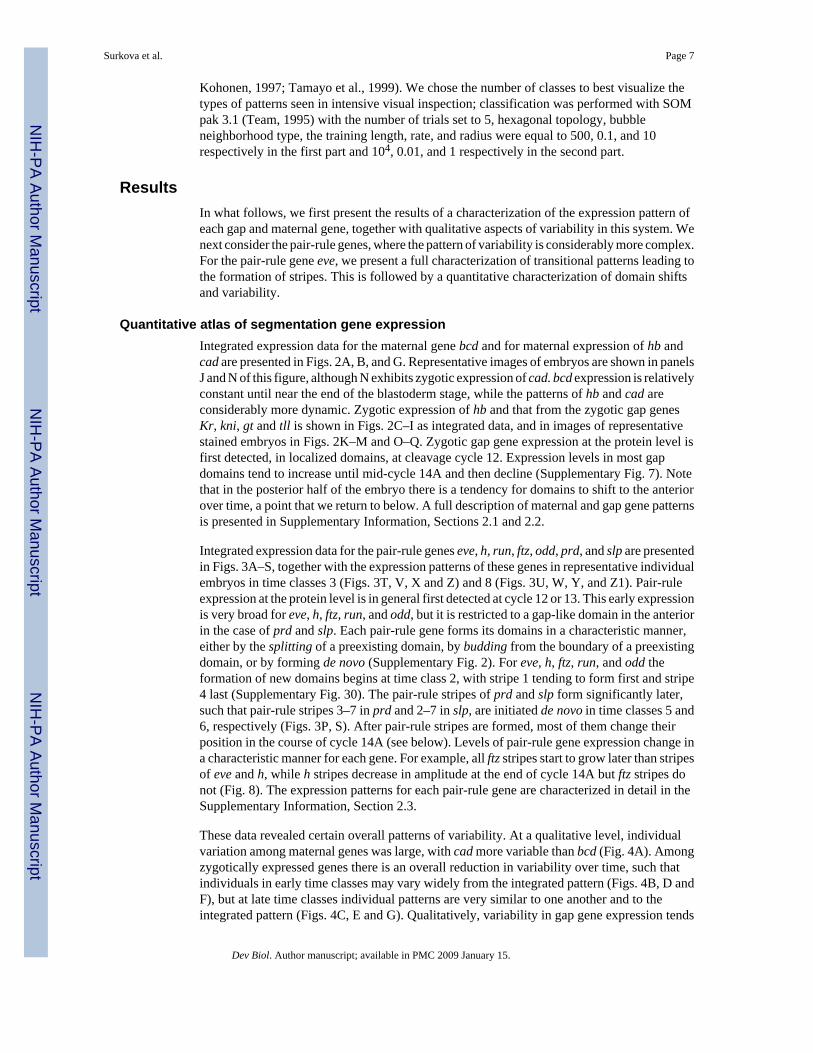
Kohonen, 1997; Tamayo et al., 1999). We chose the number of classes to best visualize thetypes of patterns seen in intensive visual inspection; classification was performed with SOMpak 3.1 (Team, 1995) with the number of trials set to 5, hexagonal topology, bubbleneighborhood type, the training length, rate, and radius were equal to 500, 0.1, and 10respectively in the first part and 104, 0.01, and 1 respectively in the second part.
ResultsIn what follows, we first present the results of a characterization of the expression pattern ofeach gap and maternal gene, together with qualitative aspects of variability in this system. Wenext consider the pair-rule genes, where the pattern of variability is considerably more complex.For the pair-rule gene eve, we present a full characterization of transitional patterns leading tothe formation of stripes. This is followed by a quantitative characterization of domain shiftsand variability.
Quantitative atlas of segmentation gene expressionIntegrated expression data for the maternal gene bcd and for maternal expression of hb andcad are presented in Figs. 2A, B, and G. Representative images of embryos are shown in panelsJ and N of this figure, although N exhibits zygotic expression of cad. bcd expression is relativelyconstant until near the end of the blastoderm stage, while the patterns of hb and cad areconsiderably more dynamic. Zygotic expression of hb and that from the zygotic gap genesKr, kni, gt and tll is shown in Figs. 2C–I as integrated data, and in images of representativestained embryos in Figs. 2K–M and O–Q. Zygotic gap gene expression at the protein level isfirst detected, in localized domains, at cleavage cycle 12. Expression levels in most gapdomains tend to increase until mid-cycle 14A and then decline (Supplementary Fig. 7). Notethat in the posterior half of the embryo there is a tendency for domains to shift to the anteriorover time, a point that we return to below. A full description of maternal and gap gene patternsis presented in Supplementary Information, Sections 2.1 and 2.2.
Integrated expression data for the pair-rule genes eve, h, run, ftz, odd, prd, and slp are presentedin Figs. 3A–S, together with the expression patterns of these genes in representative individualembryos in time classes 3 (Figs. 3T, V, X and Z) and 8 (Figs. 3U, W, Y, and Z1). Pair-ruleexpression at the protein level is in general first detected at cycle 12 or 13. This early expressionis very broad for eve, h, ftz, run, and odd, but it is restricted to a gap-like domain in the anteriorin the case of prd and slp. Each pair-rule gene forms its domains in a characteristic manner,either by the splitting of a preexisting domain, by budding from the boundary of a preexistingdomain, or by forming de novo (Supplementary Fig. 2). For eve, h, ftz, run, and odd theformation of new domains begins at time class 2, with stripe 1 tending to form first and stripe4 last (Supplementary Fig. 30). The pair-rule stripes of prd and slp form significantly later,such that pair-rule stripes 3–7 in prd and 2–7 in slp, are initiated de novo in time classes 5 and6, respectively (Figs. 3P, S). After pair-rule stripes are formed, most of them change theirposition in the course of cycle 14A (see below). Levels of pair-rule gene expression change ina characteristic manner for each gene. For example, all ftz stripes start to grow later than stripesof eve and h, while h stripes decrease in amplitude at the end of cycle 14A but ftz stripes donot (Fig. 8). The expression patterns for each pair-rule gene are characterized in detail in theSupplementary Information, Section 2.3.
These data revealed certain overall patterns of variability. At a qualitative level, individualvariation among maternal genes was large, with cad more variable than bcd (Fig. 4A). Amongzygotically expressed genes there is an overall reduction in variability over time, such thatindividuals in early time classes may vary widely from the integrated pattern (Figs. 4B, D andF), but at late time classes individual patterns are very similar to one another and to theintegrated pattern (Figs. 4C, E and G). Qualitatively, variability in gap gene expression tends
Surkova et al. Page 7
Dev Biol. Author manuscript; available in PMC 2009 January 15.
NIH
-PA Author Manuscript
NIH
-PA Author Manuscript
NIH
-PA Author Manuscript

to involve variations in amplitude, while variability in pair-rule expression appears to involvevariability in the formation of new domains which will become stripes.
These observations introduce an important question concerning the segmentationmorphogenetic field. Variability in domain amplitude is compatible with a picture in whichthe field follows an essentially fixed trajectory over time, but that different individuals traversethis trajectory at different rates at early stages. In this picture, the differing amplitudes of Krexpression in Fig. 4B represent a form of developmental heterochrony, in which embryos atthe same clock time are at different places on the same developmental pathway. Alternatively,it is possible that there is no single developmental trajectory early and that embryos reach thelow variability state at gastrulation by a variety of pathways. In order to answer this questionit is necessary to be able to fully sample the space of possible patterns, which in our datasetcan only be performed for eve. We thus complete our characterization of the overall appearanceof expression patterns with a comprehensive classification of early individual eve patterns.
Variability of early even-skipped patternsA characterization of the variability of full expression patterns requires a sufficient number ofsamples such that each pattern is seen in multiple individuals. The complexity of individualpatterns means that computational classification must be used, while the requirement forextensive data restricts the study to eve, since it is the only gene whose expression wasmonitored in every embryo in our dataset. To separate individual variation in patterndevelopment from nucleus to nucleus variation in expression amplitude, we consider smoothedpatterns that have been rescaled and registered (see Materials and methods). Thesepreprocessed patterns were then subjected to classification by self-organizing maps (SOM),the essential feature of which is that the user provides the number of classes and the SOMalgorithm adjusts the classes so that each one contains elements which are as similar as possibleto one another and as different as possible from members of other classes (Tamayo et al.,1999).
The most diverse eve patterns are found in temporal class 2 (Fig. 5). The seven classes foundrange from a single domain with a posterior bump (Fig. 5B) to cases where seven peaks arevisible (Fig. 5H). Group G, containing 19% of the embryos, was the predominant class. Mostgroups contain a feature – either a peak or shoulder – corresponding to stripe 2, small butvarying expression of region 3, and extremely variable expression of region 2, the areas thatwill give rise to stripe 7 and stripes 4–6 respectively (Fig. 3B). Patterns with a large numberof peaks, such as those shown in Fig. 5H, may belong to the oldest embryos in temporal class2, and perhaps patterns with only a few features (Figs. 5B and C) belong to the youngest.Overall, however, it is hard to imagine how the patterns shown in Fig. 5 could be sampled froma single temporal sequence. Inspection of unsmoothed data in the central 10% strip supportsthe machine analysis of smoothed patterns. All temporal class 2 embryos had stripe 1, 54%had some sign of stripes 2 and 7, 34% had stripe 3, 27% had stripe 4, while stripes 5 and 6were detected in less than 6% of temporal class 2 embryos (Supplementary Fig. 30).Description of the computational classification of eve patterns from cycle 13 and time classes1 and 3 of cycle 14A is presented in Section 2.4 of the Supplementary Information.
The positional shifts of expression domainsMost expression domains of segmentation genes change their position during cycle 14A(Supplementary Figs. 26 and 27A; Table 1 and Supplementary Table 3). These shifts can beseen in both registered (Jaeger et al., 2004b) and unregistered data. In this section we considerthe unregistered data, which enables us to use positional variation within a temporal class toassess the statistical significance of shifts.
Surkova et al. Page 8
Dev Biol. Author manuscript; available in PMC 2009 January 15.
NIH
-PA Author Manuscript
NIH
-PA Author Manuscript
NIH
-PA Author Manuscript

The shifts of the central domain of Kr and posterior domains of kni, gt and hb are statisticallysignificant (Supplementary Table 3) and directed from the posterior to the anterior of anembryo. For example, the posterior boundaries of the Kr, kni and gt expression domains shiftby about 5, 6 and 15 nuclei respectively. In each case, posterior borders shift more than anteriorones, resulting in a net contraction of each expression domain as well as the entire pattern overtime. This is particularly evident for the Kr, kni, and gt domains, which contract to about twothirds of their original size over the course of cycle 14A (Supplementary Table 4). Thereduction in spatial width takes place during early temporal classes while expression levels arerapidly increasing.
The boundaries of the anterior gt domain do not move and this domain does not contract withtime (Supplementary Tables 3 and 4). However during temporal class 4 a new domain (domain2 in Fig. 2F) starts to form at the left boundary of the anterior gt domain. The formation of thisnew domain is correlated with a shift in the old one (domain 3 in Fig. 2F) by 5 nuclei posteriorly,in the opposite direction of shifts of the posterior gap domains.
From temporal class 1 to temporal class 8 the posterior boundary of the hb anterior domainshifts to the posterior by about 0.9 nuclei as it becomes steeper with time (Supplementary Table3). The domain as a whole does not move. Although not fully quantified because of D–Vdependence, it is clear that the head domains of Kr and gt expression undergo shifts in theposterior direction, by about 4 nuclei from time classes 4 to 8 and by about 2 nuclei from timeclasses 6 to 8 respectively (Figs. 2C and F).
Most peaks of pair-rule gene expression change their position and shift in the anterior direction(Table 1) in a statistically significant manner. The same is true of interstripes (data not shown).With the exception of h and odd the most anterior peaks of these genes either do not move ormove slightly. The first stripe of h shifts to the posterior and that of odd to the anterior; in thecase of h this correlates with the formation of the anterodorsal domain 1 (Lardelli and Ish-Horowicz, 1993), and for odd with the formation of stripe 2. The largest shifts were observedfor posterior domains of eve, run, and h, with eve stripe 7 shifting by about 5 nuclei. Theseshifts cause the contraction of expression patterns over time (Supplementary Table 5 andSupplementary Fig. 28). In contrast, the ftz pattern does not shrink with time (SupplementaryFig. 28), as its posterior boundary does not move (Table 1 and Supplementary Table 5). Thebehavior of the odd pattern is ambiguous in this regard as the posterior domain of oddexpression forms only at the end of cycle 14A.
The above analysis was performed by considering shifts at eight discrete time points. In orderto demonstrate that the shift takes place continuously, we performed a further analysis byassigning 120 individual embryos a precise developmental age by comparing their degree ofmembrane invagination to in vivo time lapse data (Supplementary Fig. 27). It is clear thateve stripes move continuously in an anterior direction over time, although the rate of shift forstripes 5 and 6 is less uniform than for stripe 7. The uniform movement of eve stripe 7 isreminiscent of similar smooth shifts seen in the most posterior stripes of h and run (not shown).This smooth motion of these posteriormost stripes is in marked contrast to the nonuniformmovement of the other stripes, the shift of which correlates with the formation of new domainswithin the pattern. For example, odd stripe 1 undergoes a large shift over time classes 3 to 5,when stripe 2 forms by budding. Similarly, the formation of odd stripe 7 during temporal classes5–7 is associated with a narrowing of odd stripe 6 between temporal classes 6 and 7 (Fig. 3Oand Supplementary Fig. 22C), followed by a large shift in the maximum of this stripe betweentemporal classes 7 and 8 (Fig. 6). The formation of h stripe 4 in time classes 3–5 is accompaniedby a shift in position of stripe 3 by 2.5 nuclei during the same period. That constitutes nearly3/4 of the total shift of stripe 3 during cycle 14A (Table 1).
Surkova et al. Page 9
Dev Biol. Author manuscript; available in PMC 2009 January 15.
NIH
-PA Author Manuscript
NIH
-PA Author Manuscript
NIH
-PA Author Manuscript
It has recently been shown that nuclei in the pregastrulation blastoderm undergo morphogeneticmovements (Keränen et al., 2006), which these authors refer to as “morphological flow.” Weinvestigated the role of this phenomenon by monitoring nuclear movements in living embryos(Figs. 10A–C, Supplementary Table 6) by following the location of three nuclei on the dorsaland ventral surfaces of 4 embryos. These nuclei were located at the position of the presumptivecephalic furrow, the posterior border of the central Kr domain at temporal class 1, and themaximum of h stripe 3 when it first forms during temporal class 3. We find that the nuclei atthe positions of the initial Kr border and h stripe 3 shift by about a half nucleus (Figs. 10A–C,Supplementary Table 6), but this movement is nonuniform in time. In early cycle 14A, fromabout time class 1 to time class 3, the nuclei shift slightly to the posterior, while in the laterpart of cycle 14A the nuclei move slightly to the anterior. These periods correspond roughlyto the slow and fast phase of membrane invagination accompanied by the elongation of nuclei(Loncar and Singer, 1995; Lecuit, 2004).
Further evidence that shifts in the presumptive germ band are primarily due to shifts in geneexpression rather than of nuclei can be adduced by noting that the run 2/3 interstripe and hstripe 3 shift position with respect to one another, a phenomenon that cannot be due to motionsof nuclei (Fig. 10D). In the anterior, by contrast, we find that a nucleus at the position of thepresumptive cephalic furrow shifts to the posterior by about two nuclei (Figs. 10A–C,Supplementary Table 6), an amount that is as large as the posterior expression shifts which weobserved in the anterior part of the embryo (Fig. 9; Table 1 and Supplementary Table 3).
The positional variability of segmentation gene expression patternsThe full characterization of the variability of segmentation gene expression is extremelycomplex. By examining specific features of the pattern, rather than the pattern as a whole aswas done with eve, we can quantitatively assay variation in expression in the full set ofsegmentation genes. One particular feature which has received considerable attention is thevariability in position of particular levels of expression or domain borders with respect to thetotal length of the embryo. Another measure of variability is with respect to a single domain,where the variability in width or intensity can be assessed. Lastly, it is possible to measure theoverall deviation in proportional spacing of multiple domains. This last measure is essentiallythe variance of domain positions following affine registration and has been presentedpreviously (Myasnikova et al., 2001). In this section we consider the variation of position ofa number of domains as well as the variation in the width of eve stripes. We will show that thelatter provides a finer scale measure of spatial variability. In this section we consider onlyunregistered data.
With respect to the variation of border location, it has been shown (Houchmandzadeh et al.,2002) that a particular level of Bcd expression has high embryo-to-embryo positionalvariability but that this noise in positional information is strongly decreased at the level ofexpression of the gap gene hb. Here we confirm this result and extend it to other genes. Wemeasured the position in the embryo where the Bcd concentration was respectively 70%, 50%,24%, and 12% of maximum. In cleavage cycle 14A, the standard deviation of these positionsranges from 3% to 6% EL, with larger standard deviations associated with lower expressionlevels and more posterior positions (Supplementary Table 7 and Fig. 7A). The standarddeviation of the points at which Bcd was at 70% and 50% of maximal expression was the samein cycles 13 and 14A, but there is a distinct rise in the standard deviation of positions of smallerexpression levels between cycle 13 and 14A (Table 2 and Supplementary Table 7). This is indistinct contrast to a general fall in positional variation of zygotic gene expression over time.
The variability of cad expression shows significant contrasts to that of bcd. In the posteriorhalf of the embryo, where expression is high, cad expression cannot be characterized as agradient (Fig. 7A). Although the positional error of lower levels of Cad is of the same general
Surkova et al. Page 10
Dev Biol. Author manuscript; available in PMC 2009 January 15.
NIH
-PA Author Manuscript
NIH
-PA Author Manuscript
NIH
-PA Author Manuscript

magnitude as that of Bcd, the trend is towards smaller positional variability at lower expressionlevels, in contrast to bcd (Supplementary Table 7).
We measured the standard deviation of the position of the peaks of Kr and eve expressionduring cleavage cycle 13, as well as the position of the posterior boundaries at half maximumof hb and eve expression (Table 2). The standard deviations fell into two classes. On theposterior slope of the cycle 13 eve domain, the standard deviation was about that seen forbcd in the same portion of the embryo (at about 12% EL), while all other features measured incycle 13 had noticeably smaller spatial standard deviations of 2.3 to 2.5% EL (Table 2, Fig.7B).
The positional error of zygotic expression domains continues to decrease until temporal class2 of cycle 14A. For example, the dense coverage of eve in our dataset enables us to assess thisgene’s positional variability in every temporal class. Once stripes form, there is no statisticallysignificant change in their positional variation over time (Supplementary Table 10). Thisappears to indicate two very distinct temporal regimes of spatial eve variability. During theearly phase, the posterior gradient of eve expression behaves like bcd, but later takes on anextremely high level of precision (Fig. 7B). Supplementary Table 10 also indicates that errorsin the specification of eve stripes increase from the center of an embryo towards its ends, andF-statistics computed for minimal and maximal values of errors shows that their difference isstatistically significant at a 0.05 confidence level. A similar effect can be seen with other pair-rule genes (Supplementary Table 9). We believe that this phenomenon is a consequence ofvariability in orientation.
We summarize the positional variation of other genes in temporal class 5. At this time, thepositional standard deviation of spatial expression of the four nonterminal gap genes rangedfrom 0.97 to 1.5% EL (Supplementary Table 8). Because the posterior boundaries of kni, gtand the hb posterior domains shift significantly even within the limits of one time class, partof the positional variation of these borders stems from limited temporal resolution. For eve theincrease in spatial precision is quite marked. At temporal class 1 the positional error in thespecification of eve expression domains is almost the same as it was in cycle 13, but it declinesby temporal class 2 (Table 2). The spatial variability of expression domains of pair-rule genesin the nonterminal regions of the embryo approaches an accuracy of one nucleus(Supplementary Tables 9 and 10).
While the positional variation with respect to the entire embryo appears to become essentiallystatic by temporal class 2, variation within individual expression domains continues todecrease. For example, the variation in width of eve stripes can be estimated by evaluating thestandard deviation of the distance between the stripe peak and an adjacent minimum. Thismeasure of variation is shown in Supplementary Table 11, which extends from temporal class3, when nearly all stripes are visible, to temporal class 8. The table shows that by this measure,standard deviation decreases until temporal class 5 or 6, with a small rise in temporal class 8.A similar result was found for ftz (data not shown).
The temporal variability of segmentation gene expression patternsThe detailed characterization of patterns which we have generated permits us to estimate thetemporal variability of the formation of a single domain with a resolution of one temporal class,that is about 6 min. The natural way to estimate the temporal variability of domain formationis to monitor how quickly each domain appears in 100% of embryos. The pair-rule genesprovide a particularly rich set of features with which to do this. The results of a stripe by stripeanalysis for each gene are shown in Supplementary Fig. 30. These data give us the raw materialwith which to estimate the temporal precision with which each pair-rule stripe is formed. Forexample, the temporal precision of the formation of run stripe 1 is less than 6 min, since this
Surkova et al. Page 11
Dev Biol. Author manuscript; available in PMC 2009 January 15.
NIH
-PA Author Manuscript
NIH
-PA Author Manuscript
NIH
-PA Author Manuscript

stripe begins to form at temporal class 1 and is formed by temporal class 2 in 100% of allembryos observed (Fig. 7E). In sharp contrast, the temporal variability of formation of ftz stripe4 is about 24 min. This stripe starts to form at time class 1 and is not observed in all embryosuntil temporal class 5. These two stripes are the most and least variable, while other cases liein between (Supplementary Fig. 30).
Each pair-rule stripe forms with a distinctive temporal precision, so that the temporal precisionof stripe formation is different for each stripe of one pair-rule gene. Moreover, it is clear thatfor many pair-rule genes stripes do not form in a fixed order. ftz provides an excellent exampleof such behavior. Although stripe 5 always appears first, it can be followed by the appearanceof either stripe 1 or 2. Stripe 3 can appear before or after stripe 6, and the last stripe to formcan be either 4 or 7 (Figs. 7G–I). At our current level of temporal resolution, these possibilitiesare in no way exhaustive. Not only can the order of stripe formation vary, but the same stripecan form by more than one mode. For example, ftz stripe 3 can form by splitting or posteriorbudding (Figs. 7C, D).
Temporal variability in the formation of gap domains differs significantly from that of pair-rule stripes. During the middle part of cycle 14A, there is considerable variation in the time ofappearance of the anteriormost domains of Kr and gt. We detected the Kr anterior domain (Fig.2C) in 13%, 56% and 80% of embryos from time classes 3, 4 and 5 respectively; domain 1 ofgt (Fig. 2F) in 10%, 47%, and 87% of embryos in time classes 5, 6 and 7 respectively; and gtdomain 2 (Fig. 2F) in 10%, 61% and 94% of embryos at temporal classes 4, 5 and 6 respectively.Thus the variability in the time of formation of these gap domains spans about 24 min in allcases, although the start of this period varies from domain to domain (Fig. 7F). Moreover, therate of formation of these domains is more uniform over time compared to ftz stripe 4, whichis also formed during about 24 min of cycle 14A (Fig. 7E).
DiscussionHere we summarize the major biological conclusions arising from this work. First, we haveachieved a comprehensive characterization of the segmentation morphome at the systems level.Secondly, we have shown that the morphome exhibits canalizing behavior. This couples ourwork to classics studies of embryonic regulation, but while these studies were performed usingunnatural methods of microsurgery, we have characterized regulation in its natural context.Thirdly, we show that pattern formation in the Drosophila takes place by a rich but highlyvaried set of trajectories; this has serious implications for efforts to model and understand thesystem. Finally, we have demonstrated that patterns do not form “in place”, but rather involvea set of precise spatial movements which differ in characteristic ways for each gene. We nowdiscuss each of these points in turn.
The segmentation morphomeIn this paper we have performed a detailed characterization of the expression patterns of 14segmentation genes during the blastoderm stage. In most previous studies, the expression ofsegmentation genes was characterized by visual inspection of patterns, typically of the productsof one or at most two genes. The vast majority of these studies were focused on the measurementof dynamics of mRNA accumulation. Much less attention has been paid to the assessment ofsegmentation gene expression at the protein level. This work contains a full characterizationof the protein patterns of kni, odd, run, and slp, which have not been published except in amethod paper and two theoretical analysis based on the data which is fully presented in thiswork (Kosman et al., 1998; Jaeger et al., 2004a,b). In the case of ftz we have reported expressionin cleavage cycle 13, although previous studies did not see expression prior to cycle 14A(Carroll and Scott, 1985; Karr and Kornberg, 1989).
Surkova et al. Page 12
Dev Biol. Author manuscript; available in PMC 2009 January 15.
NIH
-PA Author Manuscript
NIH
-PA Author Manuscript
NIH
-PA Author Manuscript
We believe that the characterization of the entire morphome is essential for understanding itsbiological function. Indeed, we have made use of such data previously in semiquantitative(Reinitz et al., 1995; Reinitz and Sharp, 1995; Reinitz et al., 1998) and fully quantitative forms(Jaeger et al., 2004a,b) to answer specific questions about the function of the segmentationsystem. More recently, there has been an increased interest in obtaining quantitative spatiallyresolved expression data from the blastoderm at both the protein and RNA levels. The first ofthese studies provided the first description of canalizing phenomena at the level of Hb responseto the Bcd gradient (Houchmandzadeh et al., 2002, 2005). A large-scale study of the morphomeat the RNA level is also in progress (Luengo-Hendriks et al., 2006; Keränen et al., 2006).
The work reported here provides the first detailed characterization of protein expression levelsthroughout the entire period of blastoderm expression at high time resolution. A drawback ofour approach is that it is limited to one dimension, although this limitation is of little importancein the presumptive segmented germ band, where the separation between the A–P and D–Vmorphogenetic systems is rather strict. Although there is a weak coupling to the D–V systemwhich causes the “splaying” effect of stripes (Spirov et al., 2000; Keränen et al., 2006), thiseffect does not influence one-dimensional data because images are obtained in a standard lateralorientation, and any remaining error is compensated for during the registration process. In thepresumptive head, this decoupling is lost, and one-dimensional data must be regarded withcaution. Nevertheless, our ability to reconstruct a lateral hemisphere of the embryo in 2Denables good visualization of many head patterns (see Supplementary Fig. 13).
These data are of very high resolution in intensity, space, and time. Because all measurementsof expression levels are calibrated against embryos at maximum expression levels for theirrespective proteins, it is possible to compare expression levels of one gene at different stages(see for example Fig. 8). The spatial resolution of the data has enabled us to discover shifts inthe pattern (Jaeger et al., 2004a,b and this work) that were overlooked in qualitative studies.The temporal resolution of 6.5 min has permitted us to describe transient patterns inconsiderable detail, and to characterize the systems level variation of gene expression precisely.
We have described the expression of the segmentation morphome both at the level of individualembryos and in terms of averaged reference data, which we refer to as one-dimensionalintegrated data. A full discussion of the detailed findings from this data is presented in Section3 of the Supplementary Information.
The motion of expression domainsIn this work we present an analysis of dynamic changes in positions of expression domainsduring cleavage cycle 14A by means of statistical tests on high-resolution data. Nevertheless,the particularly large shift in the posterior domain of gt was noted from qualitative observations(Eldon and Pirrotta, 1991). Here we demonstrate that this phenomenon is inherent to mostdomains of segmentation genes; certain aspects of these results have been reported previouslyby us in a modeling study (Jaeger et al., 2004b) and other observations of shifts have recentlybeen made at the RNA level (Keränen et al., 2006).
At cycle 14A central and posterior domains of gap genes and most expression domains of pair-rule genes shift anteriorly (Table 1 and Supplementary Table 3), while the anterodorsal domainof Kr, the first and third domains of gt and h stripe 1 move in the opposite direction (Fig. 9).Thus, all domains moving in the posterior direction are located to the anterior of the futurecephalic furrow, which arises at the juxtaposition of the head and trunk patterning systems andis one of the first morphological manifestations of the patterning process (Vincent et al.,1997;Blankenship and Wieschaus, 2001). Given that, we conclude that shifts to the posteriorare inherent to domains formed in the future head region. Thus, the cephalic furrow serves asa watershed which separates regions of anterior and posterior domain shifts.
Surkova et al. Page 13
Dev Biol. Author manuscript; available in PMC 2009 January 15.
NIH
-PA Author Manuscript
NIH
-PA Author Manuscript
NIH
-PA Author Manuscript

An important difference exists between the posterior shifts in the head and anterior shifts inthe presumptive germ band, however. The shifts in the head appear to arise from shifts of nuclei(Keränen et al., 2006), rather than from gene regulation (Fig. 10). We show here that in thepresumptive germ band nuclear movements are much smaller than expression shifts and thatexpression patterns of different segmentation genes shift with respect to one another (Figs. 9and 10, Supplementary Table 6). That, together with the asymmetric distribution of mRNAwith respect to protein in gap domains (Jaeger et al., 2004b), shows that in the presumptivegerm band shifts occur as a consequence of gene regulation.
We have found that the Tll protein has different dynamics of accumulation in comparison tothe “classical” gap genes. In cycle 13 and early cycle 14A tll expression sharply increases andreaches maximum (Fig. 2I). It remains constant during about 30 min of development anddeclines before gastrulation. Furthermore, in contrast to the posterior domains of the other gapgenes, the tll posterior domain does not shift position with time (Fig. 2I).
Of particular significance are the shifts of the posterior boundaries of the Kr central domainand the posterior domains of kni and gt, which range from 5 to 15 nuclei. The shifts of domainsinside the expression pattern of pair-rule genes usually occur at the time when a new stripearises in the vicinity and range from about 1 to 4 nuclei, while the posterior stripes of eve,run and h move by about 3–5 nuclei. It is possible that the large shift of run stripe 7 is partlycaused by a dynamic change of its shape because this stripe becomes asymmetric by temporalclass 8. Given that the width of pair-rule stripes ranges from 3 to 5 nuclei at the end of cleavagecycle 14A, it is clear that the shifts of gap and pair-rule domains are on the order of the size ofa pair-rule stripe. Hence these shifts are critical for the positioning of domains of downstreamgenes and are biologically essential to the pattern formation process.
Central and posterior gap domains contract with time due to larger shifts of the posteriorboundaries than the anterior ones (Supplementary Tables 1 and 4). Large shifts of posteriorstripes result in the contraction of the expression patterns of eve, h and run (SupplementaryTable 5, Supplementary Fig. 28). In contrast, the ftz pattern does not shrink with time, as itsposterior boundary does not move (Table 1). It is well known that the complementary patternsof eve and ftz expression set the positions of en stripes (Hughes and Krause, 2001). Our resultsdemonstrate that the complementary phasing of eve and ftz stripes comes about by the shift ofeve pattern in relation to ftz and is not simply the result of refinement of these striped patternsin one place (Supplementary Fig. 29). Currently the subdivision of pair-rule genes into primaryand secondary ones is a matter of controversy. It has been pointed out that ftz is not a secondarypair-rule gene (Yu and Pick, 1995) in the initial sense of this term (Ingham and Martinez-Arias,1986; Howard and Ingham, 1986). Nevertheless there are some features which set this geneapart from other pair-rule genes. It is well known from the literature that ftz has differentregulatory inputs and a different organization of its regulatory region than other pair-rule genes(Hiromi et al., 1985; Klingler et al., 1996). In this study we have found that ftz stripes formand refine in a different way than stripes of other pair-rule genes: stripe 5 is the first stripe toform and stripe 7 does not move with time (Supplementary Fig. 30, Table 1).
With respect to the anterior, it has been previously noted that the region of the blastodermanterior to the presumptive cephalic furrow is a domain of low nuclear density which formsby cleavage cycle 11 and persists until gastrulation (Blankenship and Wieschaus, 2001). Duringcycle 14A a region with a greater depth of cellularization forms at the location of the futurecephalic furrow, a fact that may be connected with the observed nuclear movements in theanterior part of the embryo. These processes were shown to be under control of the genesbcd and prd, which thus makes it the earliest manifestation of morphological control by thesegmentation system (Blankenship and Wieschaus, 2001).
Surkova et al. Page 14
Dev Biol. Author manuscript; available in PMC 2009 January 15.
NIH
-PA Author Manuscript
NIH
-PA Author Manuscript
NIH
-PA Author Manuscript
Variation and canalization of blastoderm expression patternsOur analysis shows that by the onset of gastrulation some gap genes and all pair-rule genesform patterns which are highly uniform from embryo to embryo. However, there is largeembryo-to-embryo variability of these patterns in cycle 13 and early temporal classes of cycle14A. This variability manifests itself in variation in gene expression levels, variation in thetime of formation of individual domains, variation in the manner in which a domain forms,variation in the sequence of formation of individual domains, and variation in the position ofexpression domains. These types of variability place limitations on what we can conclude aboutthe morphome, and at the same time are of fundamental biological interest in their own right.We discuss each form of variability in turn.
Variability in gene expression levels and the limitations of the integrated dataThe integrated data on the expression of 14 genes presented here were assembled from manyindividual isogenic embryos, each stained for the products of three genes. Even in an isogenicpopulation, there are differences between individuals. The fundamental criterion for thevalidity of our integrated data is that it should represent the possible actual dynamics of oneindividual in the isogenic population. Without the ability to simultaneously monitor theexpression of all 14 segmentation genes in vivo, it is impossible to check directly whether ornot this criterion is satisfied. Nevertheless, inspection of the figures which compare individualpatterns to integrated patterns permits a number of conclusions to be drawn.
First of all, late in cleavage cycle 14 the integrated data and individual data are very close, andthe integrated data likely well represent an individual. Variation between individuals involvesposition and amplitude, the latter of which also subsumes the order of appearance of domains.Here we confine our attention to variations in amplitude, which in any case is much larger thanvariation in position (see the following section). In the first half of cleavage cycle 14 there isconsiderable variation in amplitude among individuals, which has a markedly differentcharacter for gap and pair-rule genes. Gap gene domains (see Fig. 4B and Supplementary Fig.10) which vary in amplitude have very similar profiles, and it is evident from the superimposedmean expression patterns that the means are very close to a median individual pattern.
In the case of early pair-rule patterns, the variation in the order in which stripes arise (see Figs.4D and F) causes the early integrated patterns to be flatter than actual individuals because thereis a tendency for peaks and valleys in different individuals to cancel out. We discuss theindividual variations in the order of stripe appearance below. We believe that this variation inearly pair-rule stripes is driven by the variation in gap gene amplitudes, since there have beennumerous studies indicating that the first pair-rule interstripes are driven by repressive inputsfrom gap genes (Small et al., 1992; Hartmann et al., 1994; Reinitz and Sharp, 1995; Klingleret al., 1996). Unfortunately, it is not feasible to generate integrated data from medianindividuals without being able to select all median patterns simultaneously from one individual.
Finally, we note that because the integrated data are in one dimension, there will be somevariation in the expression along the D–V axis that will not be captured. In the present study,this problem may manifest itself in the increased variation in positioning of pair-rule stripesnear the ends of the embryo (Supplementary Tables 9 and 10). Otherwise, inspection of ourimages and a related study in 3 dimensions indicate that this error is small (Keränen et al.,2006).
Variability in time of domain formationOur detailed characterization of patterns allowed us estimate the variability of the time offormation of each stripe. Currently this variability can be estimated with a precision of about6 min, as this is the temporal resolution of our dataset. We have found that the temporal
Surkova et al. Page 15
Dev Biol. Author manuscript; available in PMC 2009 January 15.
NIH
-PA Author Manuscript
NIH
-PA Author Manuscript
NIH
-PA Author Manuscript

precision of stripe formation can vary in a wide range from less than 6 to as much as 24 minof development (Figs. 7E and Supplementary Fig. 30). This is a very high level of temporalvariability, especially if one recalls that the whole pair-rule pattern forms within about 50 min.Each pair-rule stripe forms with its own characteristic temporal precision. Examination of thetime of formation of three anterior gap domains showed that the temporal precision of theirformation is about 24 min of development independent of when each domain first appears (Fig.7F).
Variation in the manner of stripe formationWe have found that the stripes of pair-rule genes can arise de novo, by splitting, or by budding(Supplementary Fig. 2), and there is variation in the manner in which specific stripes ofindividual genes form. For example, ftz stripe 3 can form in two different ways, either by thesplitting of one large domain or by posterior budding from stripe 2 (Figs. 7C, D). Theclassification of modes of domain formation can be extended to the formation of gap domains,but here there is little indication of variation. Most domains of gap genes form de novo,however, the second domain of gt arises at the boundary of the third domain by budding (Fig.2F). Different modes of pair-rule stripe formation may reflect different regulatory mechanismsgoverning the appearance of these stripes.
Variability in the sequence of domain formationWe can assess variability in the order of domain formation from the patterns of ftz and eve. Attemporal class 2, all embryos have ftz stripe 5. However, among these there are embryos inwhich stripe 1 is formed, embryos with stripe 2, and embryos with both these stripes. Thismeans that after formation of stripe 5 the next stripe to appear may be stripe 1 or stripe 2 (Fig.7G). In the case of eve, the large number of available embryos analyzed by machineclassification procedures demonstrates an extremely diverse set of possible developmentaltrajectories (Fig. 5, Supplementary Figs. 16 and 17). These trajectories are indeed too diverseto permit a classification in terms of the order of appearance of particular stripes and providea striking contrast to the precise and stereotyped arrangement of eve stripes that exists bytemporal class 6. It is likely that such diversity is characteristic of all pair-rule stripes at earlystages of formation. As such it is a dramatic illustration of the phenomenon of canalizationproposed by Waddington (1940). On a fundamental level, it demonstrates that there is no fixeddevelopmental pathway in the segmentation system, but rather a range of developmentaltrajectories compatible with viability, which converge as gastrulation approaches. Thesefindings concerning canalization are strongly reinforced by studies of the reduction ofpositional error, which we consider in the next section.
Variability in the position of expression domainsThe analysis of spatial variability of segmentation gene expression patterns is directlyconnected to the idea of positional information (Wolpert, 1969; Jaeger and Reinitz, 2006) andhence has received considerable attention. It has been shown that the variability of positionalinformation is strongly reduced in the transfer of this information from the Bcd gradient tohb (Houchmandzadeh et al., 2002), a process which these authors and ourselves refer to as thefiltration of positional error. We have confirmed these results and extended them to othermaternal gradients, as well as gap and pair-rule genes (Figs. 7A, B; Table 2; and SupplementaryTables 7–10). The canalization described in the previous paragraph manifests itself here asfiltration of noise inherent in maternal gradients over time (Fig. 11). It is evident that at thegap gene level partial filtration of bcd error has already happened at cycle 13. The filtration ofthis error continues at temporal class 1 and is completed by temporal class 2. In comparisonwith gap genes, the filtration of bcd positional error at the pair-rule gene level begins later and
Surkova et al. Page 16
Dev Biol. Author manuscript; available in PMC 2009 January 15.
NIH
-PA Author Manuscript
NIH
-PA Author Manuscript
NIH
-PA Author Manuscript

happens faster: at temporal class one, eve positional error is comparable with that of bcd,however by temporal class 3 eve variability is comparable with that of gap genes.
Supplementary MaterialRefer to Web version on PubMed Central for supplementary material.
Acknowledgements
This work was supported by grant RR07801 from the US NIH, by GM072022 jointly from the US NIH and NSF, byCRDF GAP Awards RBO-1286 and RUB1-1578, by contract 02.467.11.1005 from the FASI of the RF, and by grant047.011.2004.013 from the NWO-RFBR. We thank N. Golyandina and T. Alexandrov for the SSA methods andsoftware; A. Samsonov, H. Janssens, and J. Jaeger for their valuable discussions; and D. Holloway for the helpfulcomments about the manuscript.
ReferencesAkam M. The molecular basis for metameric pattern in the Drosophila embryo. Development
1987;101:1–22. [PubMed: 2896587]Azpiazu N, Frasch M. tinman and bagpipe: two homeo box genes that determine cell fates in the dorsal
mesoderm of Drosophila. Genes Dev 1993;7:1325–1340. [PubMed: 8101173]Benedyk MJ, Mullen JR, DiNardo S. odd-paired: a zinc finger pair-rule protein required for the timely
activation of engrailed and wingless in Drosophila embryos. Genes Dev 1994;8:105–117. [PubMed:8288124]
Blankenship JT, Wieschaus E. Two new roles for the Drosophila AP patterning system in earlymorphogenesis. Development 2001;128:5129–5138. [PubMed: 11748148]
Broomhead D, King G. Extracting qualitative dynamics from experimental data. Physica D 1986;20:217–236.
Carroll SB, Scott MP. Localization of the fushi tarazu protein during Drosophila embryogenesis. Cell1985;43:47–57. [PubMed: 3000605]
Coulter DE, Swaycus EA, Beran-Koehn MA, Goldberg D, Wieschaus E, Schedl P. Molecular analysisof odd-skipped, a zinc finger encoding segmentation gene with a novel pair-rule expression pattern.EMBO J 1990;8:3795–3804. [PubMed: 2120051]
Driesch, H. The History and Theory of Vitalism. Ogden, CK., translator. MacMillan and Company;London: 1914.
Driever W, Nüsslein-Volhard C. A gradient of bicoid protein in Drosophila embryos. Cell 1988;54:83–93. [PubMed: 3383244]
Eldon ED, Pirrotta V. Interactions of the Drosophila gap gene giant with maternal and zygotic pattern-forming genes. Development 1991;111:367–378. [PubMed: 1716553]
Elsner, J.; Tsonis, A. A New Tool in Time Series Analysis. Plenum Press; New York: 1996. SingularSpectrum Analysis.
Fraedrich K. Estimating the dimensions of weather and climate attractors. J Atmos Sci 1986;43:419–432.Frigerio G, Burri M, Bopp D, Baumgartner S, Noll M. Structure of the segmentation gene paired and the
Drosophila PRD gene set as part of a gene network. Cell 1986;47:735–746. [PubMed: 2877746]Gergen JP, Butler BA. Isolation of the Drosophila segmentation gene runt and analysis of its expression
during embryogenesis. Genes Dev 1988;2:1179–1193. [PubMed: 2847961]Gilbert SF, Opitz JM, Raff RA. Resynthesizing evolutionary and developmental biology. Dev Biol
1996;173:357–372. [PubMed: 8605997]Golyandina, N.; Nekrutkin, V.; Zhigljavsky, A. Analysis of Time Series Structure: SSA and Related
Techniques. Chapman and Hall/CRC; Boca Raton: 2001.Grossniklaus U, Pearson RK, Gehring WJ. The Drosophila sloppy paired locus encodes two proteins
involved in segmentation that show homology to mammalian transcription factors. Genes Dev1992;6:1030–1051. [PubMed: 1317319]
Surkova et al. Page 17
Dev Biol. Author manuscript; available in PMC 2009 January 15.
NIH
-PA Author Manuscript
NIH
-PA Author Manuscript
NIH
-PA Author Manuscript
Hartmann C, Taubert H, Jäckle H, Pankratz MJ. A two-step mode of stripe formation in theDrosophila blastoderm requires interactions among primary pair rule genes. Mech Dev 1994;45:3–13. [PubMed: 8186146]
Hiromi Y, Kuroiwa A, Gehring WJ. Control elements of the Drosophila segmentation gene fushitarazu. Cell 1985;43:603–613. [PubMed: 3935327]
Holloway DM, Harrison LG, Kosman D, Vanario-Alonso CE, Spirov AV. Analysis of pattern precisionshows that Drosophila segmentation develops substantial independence from gradients of maternalgene products. Dev Dyn 2006;235:2949–2960. [PubMed: 16960857]
Houchmandzadeh B, Wieschaus E, Leibler S. Establishment of developmental precision and proportionsin the early Drosophila embryo. Nature 2002;415:798–802. [PubMed: 11845210]
Houchmandzadeh B, Wieschaus E, Leibler S. Precise domain specification in the developingDrosophila embryo. Phys Rev, E Stat Nonlinear Soft Matter Phys 2005;72:061920.
Howard K, Ingham PW. Regulatory interactions between the segmentation genes fushi tarazu, hairy, andengrailed in the Drosophila blastoderm. Cell 1986;44:949–957. [PubMed: 3955654]
Hughes SC, Krause HM. Establishment and maintenance of parasegmental compartments. Development2001;128:1109–1118. [PubMed: 11245576]
Ingham PW. The molecular genetics of embryonic pattern formation in Drosophila. Nature 1988;335:25–34. [PubMed: 2901040]
Ingham PW, Martinez-Arias A. The correct activation of antennapedia and bithorax complex genesrequires the fushi tarazu gene. Nature 1986;324:592–597. [PubMed: 2878371]
Ish-Horowicz D, Howard K, Pinchin SM, Ingham PW. Molecular and genetic analysis of the hairy locusin Drosophila. Cold Spring Harbor Symp Quant Biol 1985;50:135–144. [PubMed: 3006986]
Jaeger J, Reinitz J. On the dynamic nature of positional information. BioEssays 2006;28:1102–1111.[PubMed: 17041900]
Jaeger J, Blagov M, Kosman D, Kozlov KN, Manu, Myasnikova E, Surkova S, Vanario-Alonso CE,Samsonova M, Sharp DH, Reinitz J. Dynamical analysis of regulatory interactions in the gap genesystem of Drosophila melanogaster. Genetics 2004a;167:1721–1737. [PubMed: 15342511]
Jaeger J, Surkova S, Blagov M, Janssens H, Kosman D, Kozlov KN, Manu, Myasnikova E, Vanario-Alonso CE, Samsonova M, Sharp DH, Reinitz J. Dynamic control of positional information in theearly Drosophila embryo. Nature 2004b;430:368–371. [PubMed: 15254541]
Janssens H, Kosman D, Vanario-Alonso CE, Jaeger J, Samsonova M, Reinitz J. A high-throughputmethod for quantifying gene expression data from early Drosophila embryos. Dev Genes Evol2005;215:374–381. [PubMed: 15834586]
Karr TL, Kornberg TB. Fushi tarazu protein expression in the cellular blastoderm of Drosophila detectedusing a novel imaging technique. Development 1989;106:95–103. [PubMed: 2697548]
Keränen SVE, Fowlkes C, Luengo C, Sudar D, Knowles DK, Malik J, Biggin MD. Quantitation oftemporal changes in morphology and gene expression in the Drosophila cellular blastoderm. GenomeBiol 2006;7:R124. [PubMed: 17184547]
Klingler M, Soong J, Butler B, Gergen JP. Disperse versus compact elements for the regulation of runtstripes in Drosophila. Dev Biol 1996;177:73–84. [PubMed: 8660878]
Kohonen T. The self-organizing map. Proc IEEE 1990;78:1464–1480.Kohonen, T. Self-Organizing Maps. 2. Springer; Heidelberg: 1997.Kosman, D.; Reinitz, J.; Sharp, DH. Automated assay of gene expression at cellular resolution. In:
Altman, R.; Dunker, K.; Hunter, L.; Klein, T., editors. Proceedings of the 1998 Pacific Symposiumon Biocomputing, PSB Proceedings. World Scientific Press; Singapore: 1997. p.6-17.http://www.smi.stanford.edu/projects/helix/psb98/kosman.pdf
Kosman D, Small S, Reinitz J. Rapid preparation of a panel of polyclonal anti-bodies to Drosophilasegmentation proteins. Dev Genes Evol 1998;208:290–294. [PubMed: 9683745]
Kozlov K, Myasnikova E, Samsonova M, Reinitz J, Kosman D. Method for spatial registration of theexpression patterns of Drosophila segmentation genes using wavelets. Comput Tech 2000;5:112–119.
Surkova et al. Page 18
Dev Biol. Author manuscript; available in PMC 2009 January 15.
NIH
-PA Author Manuscript
NIH
-PA Author Manuscript
NIH
-PA Author Manuscript

Kozlov K, Myasnikova E, Pisarev A, Samsonova M, Reinitz J. A method for two-dimensional registrationand construction of the two-dimensional atlas of gene expression patterns in situ. In Silico Biol2002;2:125–141. [PubMed: 12066837]
Kuroiwa A, Hafen E, Gehring WJ. Cloning and transcriptional analysis of the segmentation gene fushi-tarazu of Drosophila. Cell 1984;37:825–831. [PubMed: 6430567]
Lardelli M, Ish-Horowicz D. Drosophila hairy pair-rule gene regulates embryonic patterning outside itsapparent stripe domains. Genes Dev 1993;2:1021–1036.
Lecuit T. Junctions and vesicular trafficking during Drosophila cellularization. J Cell Sci 2004;117:3427–3433. [PubMed: 15252125]
Loncar D, Singer SJ. Cell membrane formation during the cellularization of the syncytial blastoderm ofDrosophila. Proc Natl Acad Sci U S A 1995;92:2199–2203. [PubMed: 7892247]
Luengo-Hendriks CL, Keranen SV, Fowlkes CC, Simirenko L, Weber GH, Henriquez C, Kaszuba D,Hamann B, Eisen M, Malik J, Sudar D, Biggin MD, Knowles DW. 3D measurement of morphologyand gene expression in the Drosophila blastoderm at cellular resolution. Genome Biol 2006;7:R123.[PubMed: 17184546]
Macdonald PM, Ingham P, Struhl G. Isolation, structure, and expression of even-skipped: a second pair-rule gene of Drosophila containing a homeo box. Cell 1986;47:721–734. [PubMed: 2877745]
Merrill PT, Sweeton D, Wieschaus E. Requirements for autosomal gene activity during precellular stagesof Drosophila melanogaster. Development 1988;104:495–509. [PubMed: 3151484]
Mohler J, Eldon ED, Pirrotta V. A novel spatial transcription pattern associated with the segmentationgene, giant, of Drosophila. EMBO J 1989;8:1539–1548. [PubMed: 2504582]
Myasnikova, E.; Kosman, D.; Reinitz, J.; Samsonova, M. Spatio-temporal registration of the expressionpatterns of Drosophila segmentation genes. In: Lengauer, T.; Schneider, R.; Bork, P.; Brutlag, D.;Glasgow, J.; Mewes, H-W.; Zimmer, R., editors. Proceedings of the Seventh InternationalConference on Intelligent Systems for Molecular Biology; AAAI Press, Menlo Park, CA. 1999. p.195-201.
Myasnikova E, Samsonova A, Kozlov K, Samsonova M, Reinitz J. Registration of the expression patternsof Drosophila segmentation genes by two independent methods. Bioinformatics 2001;17:3–12.[PubMed: 11222257]
Myasnikova E, Samsonova M, Kosman D, Reinitz J. Removal of back-ground signal from in situ dataon the expression of segmentation genes in Drosophila. Dev Genes Evol 2005;215:320–326.[PubMed: 15711806]
Nauber U, Pankratz MJ, Kienlin A, Seifert E, Klemm U, Jäckle H. Abdominal segmentation of theDrosophila embryo requires a hormone receptor-like protein encoded by the gap gene knirps. Nature1988;336:489–492. [PubMed: 2904128]
Nüsslein-Volhard C, Wieschaus E. Mutations affecting segment number and polarity in Drosophila.Nature 1980;287:795–801. [PubMed: 6776413]
Pignoni F, Baldarelli RM, Steingrimsson E, Diaz RJ, Patapoutian A, Merriam JR, Lengyel JA. TheDrosophila gene tailless is expressed at the embryonic termini and is a member of the steroid receptorsuperfamily. Cell 1990;62:151–163. [PubMed: 2364433]
Poustelnikova E, Pisarev A, Blagov M, Samsonova M, Reinitz J. A database for management of geneexpression data in situ. Bioinformatics 2004;20:2212–2221. [PubMed: 15059825]
Reinitz J, Levine M. Control of the initiation of homeotic gene expression by the gap genes giant andtailless in Drosophila. Dev Biol 1990;140:57–72. [PubMed: 1972684]
Reinitz J, Sharp DH. Mechanism of eve stripe formation. Mech Dev 1995;49:133–158. [PubMed:7748785]
Reinitz J, Mjolsness E, Sharp DH. Cooperative control of positional in-formation in Drosophila bybicoid and maternal hunchback. J Exp Zool 1995;271:47–56. [PubMed: 7852948]
Reinitz J, Kosman D, Vanario-Alonso CE, Sharp DH. Stripe forming architecture of the gap gene system.Dev Genet 1998;23:11–27. [PubMed: 9706690]
Rosenberg UB, Schröder C, Preiss A, Kienlin A, Cóté S, Riede I, Jäckle H. Structural homology of theproduct of the Drosophila krüppel gene with Xenopus transcription factor IIIA. Nature1986;319:336–339.
Surkova et al. Page 19
Dev Biol. Author manuscript; available in PMC 2009 January 15.
NIH
-PA Author Manuscript
NIH
-PA Author Manuscript
NIH
-PA Author Manuscript

Simcox AA, Sang JH. When does determination occur in Drosophila embryos? Dev Biol 1983;97:212–221. [PubMed: 6404675]
Small S, Blair A, Levine M. Regulation of even-skipped stripe 2 in the Drosophila embryo. EMBO J1992;11:4047–4057. [PubMed: 1327756]
Spirov AV, Holloway D. Evolutionary techniques for image processing to construct integrated datasetof early Drosophila embryo genes activity. EURASIP Journal on Applied Signal Processing, SpecialIssue on Genetic and Evolutionary Computation for Signal Processing and Image Analysis. 2003a
Spirov, AV.; Holloway, D. Making the body plan: precision in the genetic hierarchy of Drosophilaembryo segmentation; Silico Biology. 2003b. p. 0009http://www.bioinfo.de/isb/2003/03/0009/
Spirov, AV.; Timakin, DL.; Reinitz, J.; Kosman, D. Experimental determination of Drosophilaembryonic coordinates by genetic algorithms, the simplex method, and their hybrid. In: Cagnoni, S.;Poli, R., editors. Proceedings of the Second European Workshop on Evolutionary Computation inImage Analysis and Signal Processing, Springer Verlag Lecture Notes in Computer Science, Number1803; Springer. 2000. p. 97-106.
Spirov AV, Timakin DL, Reinitz J, Kosman D. Use of evolutionary computations in image processingfor quantitative atlas of Drosophila gene expression. Appl Evol Comput Proc Lect Notes ComputSci 2001;2037:374–383.
Tamayo P, Slonim D, Mesirov J, Zhu Q, Kitareewan S, Lander EDES, Golub TR. Interpreting patternsof gene expression with self-organizing maps: methods and application to hematopoieticdifferentiation. Proc Natl Acad Sci U S A 1999;96:2907–2912. [PubMed: 10077610]
Tautz D, Lehmann R, Schnürch H, Schuh R, Seifert E, Kienlin A, Jones K, Jäckle H. Finger protein ofnovel structure encoded by hunchback, a second member of the gap class of Drosophila segmentationgenes. Nature 1987;327:383–389.
Team, SP. Helsinki University of Technology; Helsinki, Finland: 1995. SOM PAK: The Self-OrganizingMap Program Package. Available at ftp://cochlea.hut.fi
Vautard R, Ghil M. Singular spectrum analysis in nonlinear dynamics, with applications to paleoclimatictime-series. Physica D 1989;35:395–424.
Vincent A, Blankenship JT, Wieschaus E. Integration of the head and trunk segmentation systems controlscephalic furrow formation in Drosophila. Development 1997;124:3747–3754. [PubMed: 9367430]
Waddington, CH. Organisers and Genes. Cambridge Univ. Press; Cambridge, UK: 1940.Wolpert L. Positional information and the spatial pattern of cellular differentiation. J Theor Biol
1969;25:1–47. [PubMed: 4390734]Yu Y, Pick L. Non-periodic cues generate seven ftz stripes in the Drosophila embryo. Mech Dev
1995;50:163–175. [PubMed: 7619728]
Surkova et al. Page 20
Dev Biol. Author manuscript; available in PMC 2009 January 15.
NIH
-PA Author Manuscript
NIH
-PA Author Manuscript
NIH
-PA Author Manuscript

Fig. 1.The 8 temporal classes of cycle 14A. A typical embryo of each class is shown in each row.The left-hand panel shows an image of eve expression in that embryo; the middle panel showsthe segmented expression pattern from the central 10% strip; the right-hand panel shows a highmagnification DIC image of the blastoderm morphology. In the DIC images vertical black linesindicate the cortical cytoplasm, the black arrows in time classes 1 and 2 indicate the elongationof nuclei, and the white arrows in time classes 3–8 show the position of membrane front.
Surkova et al. Page 21
Dev Biol. Author manuscript; available in PMC 2009 January 15.
NIH
-PA Author Manuscript
NIH
-PA Author Manuscript
NIH
-PA Author Manuscript

Fig. 2.Temporal dynamics of expression of maternal and gap genes. The 1D integrated patterns ofbcd (A), cad (B), Kr (C), kni (D), gt (E and F), hb (G and H) and tll (I) expression are shownfor time points indicated in each panel. Expression domains within the gt expression patternon panel F are numbered from anterior to posterior as indicated. Panels J–Q show representativeconfocal images of the expression of the genes shown in panels A–I in individual embryosbelonging to temporal classes 1 (T1) and 8 (T8). Genes expressed in the same individualembryo are shown by different colors as given in the key for each panel.
Surkova et al. Page 22
Dev Biol. Author manuscript; available in PMC 2009 January 15.
NIH
-PA Author Manuscript
NIH
-PA Author Manuscript
NIH
-PA Author Manuscript

Fig. 3.Temporal dynamics of expression of pair-rule genes. The 1D integrated patterns of eve (A–C),ftz (D–F), h (G–I), run (J–L), odd (M–O), prd (P, Q) and slp (R–S) expression are shown fortime points indicated in each panel. Numbers in panel B indicate the three transient domainsof integrated eve expression during temporal class 2. Representative confocal images showingexpression of these genes in individual embryos belonging to temporal classes 3 (T3) and 8(T8) are shown in panels T–Z1. Genes expressed in the same individual embryo are shown bydifferent colors as given in the key for each panel.
Surkova et al. Page 23
Dev Biol. Author manuscript; available in PMC 2009 January 15.
NIH
-PA Author Manuscript
NIH
-PA Author Manuscript
NIH
-PA Author Manuscript

Fig. 4.The variability of gene expression in individual embryos. bcd and cad patterns are shown inpanel A for three individual embryos belonging to time class 2 and stained for the expressionof both genes. Panels B, D and F show several of the most diverse patterns of early expressionof Kr, eve and h in individual embryos from time classes 1, 3 and 4, respectively. The expressionof Kr in time class 6 (C) eve (E) and h (G) in time class 7 is shown for a randomly chosen setof 13, 12 and 16 individual embryos respectively. For each gene the graph of the correspondingone-dimensional integrated data is shown in red.
Surkova et al. Page 24
Dev Biol. Author manuscript; available in PMC 2009 January 15.
NIH
-PA Author Manuscript
NIH
-PA Author Manuscript
NIH
-PA Author Manuscript

Fig. 5.Automated classification of eve profiles for 69 embryos in temporal class 2 by self-organizingmaps (SOM). (A) An overlay of all eve profiles from temporal class 2. (B–H) Seven classesof expression patterns found by SOM with the percent of the total number of embryos belongingto that class.
Surkova et al. Page 25
Dev Biol. Author manuscript; available in PMC 2009 January 15.
NIH
-PA Author Manuscript
NIH
-PA Author Manuscript
NIH
-PA Author Manuscript
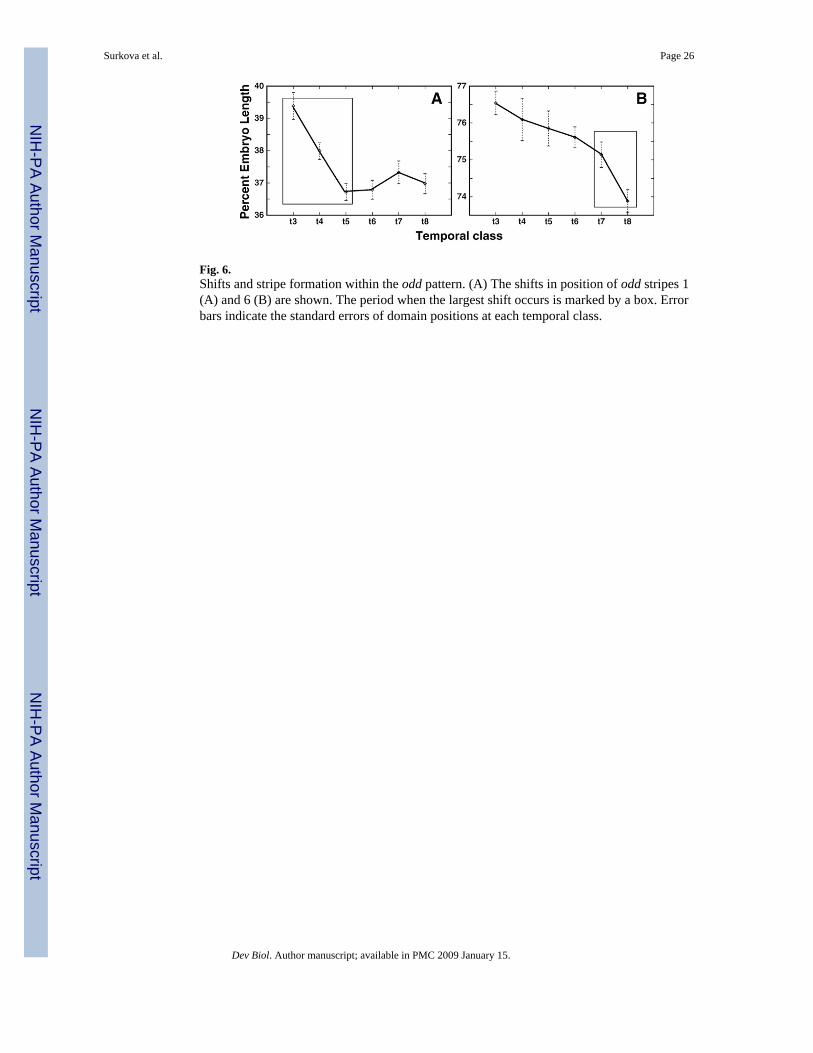
Fig. 6.Shifts and stripe formation within the odd pattern. (A) The shifts in position of odd stripes 1(A) and 6 (B) are shown. The period when the largest shift occurs is marked by a box. Errorbars indicate the standard errors of domain positions at each temporal class.
Surkova et al. Page 26
Dev Biol. Author manuscript; available in PMC 2009 January 15.
NIH
-PA Author Manuscript
NIH
-PA Author Manuscript
NIH
-PA Author Manuscript

Fig. 7.The variability in space, time, sequence and manner of domain formation. (A) The spatialvariability of Bcd, Cad, and Kni domains in cycle 14A. The figure shows 26 embryos stainedfor bcd and cad and 18 embryos stained for kni. We show the posterior part of the kni patternat 35–100% EL for temporal class 8. The thresholds corresponding to different percents ofmaximal expression are shown. (B) Spatial variability of the individual eve patterns in cycle13 and temporal class 7 of cycle 14A. The variability in position of the posterior border ofeve pattern is marked by white arrow. Black arrows mark the variability of eve stripes formedat the territory of posterior boundary of early eve. (C, D) Patterns of ftz expression in twoembryos from time class 3 showing the variable mode of formation of stripe 3, which is marked
Surkova et al. Page 27
Dev Biol. Author manuscript; available in PMC 2009 January 15.
NIH
-PA Author Manuscript
NIH
-PA Author Manuscript
NIH
-PA Author Manuscript

with a red rectangle. (E, F) Temporal variability in formation of the pair-rule (E) and gap (F)domains indicated in the key. For each temporal class we show the percent of embryos in whichthe indicated domain has appeared. (G–I) Variability in the sequence of formation of stripeswithin the ftz pattern in temporal classes 2 (G), 3 (H), and 4 (I). Each bar shows the percent ofembryos in which the indicated stripes are formed.
Surkova et al. Page 28
Dev Biol. Author manuscript; available in PMC 2009 January 15.
NIH
-PA Author Manuscript
NIH
-PA Author Manuscript
NIH
-PA Author Manuscript

Fig. 8.Temporal changes in the levels of expression of pair-rule genes. (A) eve, (B) h, (C) ftz; eachcurve corresponds to a particular stripe as shown in the key.
Surkova et al. Page 29
Dev Biol. Author manuscript; available in PMC 2009 January 15.
NIH
-PA Author Manuscript
NIH
-PA Author Manuscript
NIH
-PA Author Manuscript

Fig. 9.Summary of domain shifts. Direction of shifts is shown by arrows. Digits in brackets denoteeve and h stripes, other domains are as indicated. Values of shifts were computed for the domainpeaks over the following time intervals: from time classes 1 to 8 for gt(3), gt(4), Krcent andknipost; from time classes 2 to 8 for hbpost; from time class 3 to time class 8 for eve stripes 1–4 and 7 and h stripes 1–3; from time class 4 to time class 8 for Krant, eve stripes 5 and 6 andh stripes 4–7; from time classes 6 to 8 for gt(1). The approximate position of the prospectivecephalic furrow (cf) is indicated.
Surkova et al. Page 30
Dev Biol. Author manuscript; available in PMC 2009 January 15.
NIH
-PA Author Manuscript
NIH
-PA Author Manuscript
NIH
-PA Author Manuscript

Fig. 10.In vivo nuclear motion compared to gene expression. Panels A–C are frames from a movie ofthe dorsal side of a living embryo, taken at the times indicated. Panel D is a graph of run andh expression patterns at temporal classes 3 and 8. In panels A–C, the identified nucleus 31 isat the approximate position of the presumptive cephalic furrow (cf); the identified nucleus 62is at the position of the posterior border of Kr at temporal class 1 (Supplementary Table 1);and in panel B, the identified nucleus 51 is at the position of the maximum of h stripe 3 intemporal class 3. We track the positions of these nuclei (solid ovals) during time classes 1–8for Kr and 3–8 for h. The dashed ovals in panel C indicate the A–P positions of the posteriorborder of Kr domain and h stripe 3 maximum in temporal class 8. Black arrows show thedistance between positions of the tracked nuclei and the real positions of the correspondingexpression domains in time class 8. Similar results were obtained from the ventral and dorsalsides of 15 embryos. Panel D shows that the positions of the maximum of h stripe 3 and theminimum of the run 2/3 interstripe, which have the same A–P positions in time class 8, shiftposition with respect to one another between temporal classes 3 and 8.
Surkova et al. Page 31
Dev Biol. Author manuscript; available in PMC 2009 January 15.
NIH
-PA Author Manuscript
NIH
-PA Author Manuscript
NIH
-PA Author Manuscript

Fig. 11.Dynamic filtration of the positional error at the level of zygotic gene expression. We considerthe standard deviations (SD) in the positions of the posterior border of the anterior hb domain,maximum of the central Kr domain, and the posterior border of the early eve domain, whichlater corresponds to the position of eve stripe 3. Changes in the positional error of these domainsare compared to the level of variability in position of the 12% concentration threshold of theBcd protein gradient. All these features have approximately the same positions along the A–P axis of an embryo (45–55% EL). In cycle 14A we show the Bcd variability only for timeclass 1, as it remains at approximately the same level thereafter.
Surkova et al. Page 32
Dev Biol. Author manuscript; available in PMC 2009 January 15.
NIH
-PA Author Manuscript
NIH
-PA Author Manuscript
NIH
-PA Author Manuscript

NIH
-PA Author Manuscript
NIH
-PA Author Manuscript
NIH
-PA Author Manuscript
Surkova et al. Page 33Ta
ble
1Te
mpo
ral s
hifts
of p
air-
rule
dom
ains
Gen
e/D
omai
nSt
ripe
1St
ripe
2St
ripe
3St
ripe
4St
ripe
5St
ripe
6St
ripe
7
eve
tc3–
83–
83–
83–
84–
84–
83–
8(N
=654
)Sh
ift0.
51.
92.
03.
43.
22.
65.
3ftz
tc3–
83–
83–
84–
83–
84–
85–
8(N
=158
)Sh
ift0.
2*1.
31.
71.
92.
33.
81.
0*h
tc3–
83–
83–
84–
84–
84–
84–
8(N
=105
)Sh
ift−2
.21.
53.
61.
12.
63.
33.
8od
dtc
3–8
4–8
3–8
5–8
3–8
3–8
–(N
=85)
Shift
2.4
1.1*
3.0
0.9
3.7
2.7
–ru
ntc
3–8
4–8
3–8
5–8
3–8
3–8
5–8
(N=6
5)Sh
ift0.
2*1.
72.
82.
61.
63.
43.
6
The s
hifts
are c
alcu
late
d fr
om th
e stri
pe’s
max
ima.
Tim
e int
erva
ls b
egin
at th
e tim
e of f
orm
atio
n of
each
strip
e and
are g
iven
in te
rms o
f tem
pora
l cla
sses
(tc)
. The
sam
ple s
ize N
is sh
own
for e
ach
dom
ain.
We
do n
ot p
rese
nt sh
ifts f
or o
dd st
ripe
7, a
s it f
orm
s at t
he v
ery
end
of c
ycle
14A
. Pos
itive
val
ues f
or sh
ifts i
ndic
ate
mot
ion
to th
e an
terio
r and
con
vers
ely
for n
egat
ive
valu
es. A
ster
isks
indi
cate
shift
sth
at w
ere
stat
istic
ally
insi
gnifi
cant
at t
he 0
.05
conf
iden
ce le
vel.
Dev Biol. Author manuscript; available in PMC 2009 January 15.

NIH
-PA Author Manuscript
NIH
-PA Author Manuscript
NIH
-PA Author Manuscript
Surkova et al. Page 34Ta
ble
2Sp
atia
l var
iabi
lity
of th
e bc
d, h
b, K
r and
eve
pat
tern
s at c
ycle
13
and
early
cyc
le 1
4A
Gen
e/D
evel
opm
enta
l tim
ebc
d C
ycle
13
(N=8
0)hb
Cyc
le 1
3 (N
=25)
Kr C
ycle
13
(N=2
0)
A–P
pos
ition
70%
50%
24%
12%
PPe
akSD
3.1
4.4
4.0
3.8
2.3
2.5
Gen
e/D
ev. t
ime
eve
Cyc
le 1
3 (N
=75)
eve
Tim
e cl
ass 1
(N=7
8)ev
e Ti
me
clas
s 2 (N
=63)
A–P
pos
ition
APe
akP
APe
akP
APe
akSD
2.4
2.4
3.7
2.0
2.2
3.4
1.4
1.6
“A–P
pos
ition
” gi
ves t
he p
ositi
ons o
f cha
ract
eris
tic fe
atur
es fo
r eac
h ge
ne. T
he c
hara
cter
istic
feat
ures
of b
cd a
re th
e po
sitio
ns o
f poi
nts a
t fou
r ind
icat
ed th
resh
olds
with
resp
ect t
o m
axim
al fl
uore
scen
cein
tens
ity. F
or th
e do
mai
ns o
f oth
er g
enes
, “pe
ak”
indi
cate
s the
pos
ition
of m
axim
um e
xpre
ssio
n, a
nd “
A”
and
“P”
resp
ectiv
ely
indi
cate
the
posi
tions
of 5
0% m
axim
um e
xpre
ssio
n at
the
ante
rior a
ndpo
ster
ior.
The
sam
ple
size
s N a
re sh
own.
SD
stan
ds fo
r sta
ndar
d de
viat
ion.
Dev Biol. Author manuscript; available in PMC 2009 January 15.