
Internal waves, solitary-like waves, and mixing on the Monterey Bay shelf
22
ARTICLE IN PRESS Continental Shelf Research 25 (2005) 1499–1520 Internal waves, solitary-like waves, and mixing on the Monterey Bay shelf Glenn S. Carter a, , Michael C. Gregg a , Ren-Chieh Lien b a Applied Physics Laboratory and School of Oceanography, University of Washington, 1013 NE 40th Street, Seattle, WA 98105, USA b Applied Physics Laboratory, University of Washington, 1013 NE 40th Street, Seattle, WA 98105, USA Received 7 June 2004; received in revised form 5 April 2005; accepted 11 April 2005 Available online 24 June 2005 Abstract Microstructure measurements taken on the Monterey Bay continental shelf, within 4 km of the shelf break, reveal a complex mixing environment. Depth- and time-averaged dissipation rates 咞 7:4255:8 10 9 W kg 1 Þ and diapycnal diffusivities ð K r ¼ 6:1237:8 10 5 m 2 s 1 Þ were elevated above observations made over other continental shelves with no significant topography, but were below those influenced by topographic features. The close proximity of the shelf break/canyon rim, locally generated internal tides, and nonlinear internal waves all contributed to the elevated turbulence. The complex bathymetry associated with Monterey Submarine Canyon allowed an internal tide to be generated at depths greater than 1500 m, as well as at the shelf break. The observed velocity field was normally dominated by upward energy propagation from the local shelf break generated internal tide, but near low tide downward energy propagation from a surface reflection of the internal tide generated below 1500 m was observed. Turbulent dissipation rates were not well parameterized by either the open-ocean Gregg–Henyey model or the recently developed MacKinnon–Gregg shelf model. Like its application on the New England shelf, the MacKinnon–Gregg model had the correct functional dependence on shear and stratification (dissipation increasing with increasing shear and increasing stratification), however, the magnitude and range of values were too small. The most surprising finding was the presence of what we believe to be large, high-aspect-ratio, downslope-propagating nonlinear internal solitary- like waves of elevation. Upon reaching the canyon rim, these waves propagated into deep water and transformed into waves of depression. On the shelf south of the canyon, the waves of elevation accounted for 20% of the observed turbulent kinetic energy dissipation. Off the shelf, where the solitary-like waves changed to downward displacement, 0278-4343/$ - see front matter r 2005 Elsevier Ltd. All rights reserved. doi:10.1016/j.csr.2005.04.011 Corresponding author. Tel.: +1 206 685 9080; fax: +1 206 543 6785. E-mail addresses: [email protected] (G.S. Carter), [email protected] (M.C. Gregg), [email protected] (R.-C. Lien).
-
Upload
independent -
Category
Documents
-
view
4 -
download
0
Transcript of Internal waves, solitary-like waves, and mixing on the Monterey Bay shelf
ARTICLE IN PRESS
0278-4343/$ - se
doi:10.1016/j.cs
�CorrespondiE-mail addre
(R.-C. Lien).
Continental Shelf Research 25 (2005) 1499–1520
Internal waves, solitary-like waves, and mixing on theMonterey Bay shelf
Glenn S. Cartera,�, Michael C. Gregga, Ren-Chieh Lienb
aApplied Physics Laboratory and School of Oceanography, University of Washington, 1013 NE 40th Street, Seattle, WA 98105, USAbApplied Physics Laboratory, University of Washington, 1013 NE 40th Street, Seattle, WA 98105, USA
Received 7 June 2004; received in revised form 5 April 2005; accepted 11 April 2005
Available online 24 June 2005
Abstract
Microstructure measurements taken on the Monterey Bay continental shelf, within 4 km of the shelf break, reveal a
complex mixing environment. Depth- and time-averaged dissipation rates ð� ¼ 7:4255:8� 10�9 Wkg�1Þ and diapycnal
diffusivities ðKr ¼ 6:1237:8� 10�5 m2 s�1Þ were elevated above observations made over other continental shelves with
no significant topography, but were below those influenced by topographic features. The close proximity of the shelf
break/canyon rim, locally generated internal tides, and nonlinear internal waves all contributed to the elevated
turbulence. The complex bathymetry associated with Monterey Submarine Canyon allowed an internal tide to be
generated at depths greater than 1500m, as well as at the shelf break. The observed velocity field was normally
dominated by upward energy propagation from the local shelf break generated internal tide, but near low tide
downward energy propagation from a surface reflection of the internal tide generated below 1500m was observed.
Turbulent dissipation rates were not well parameterized by either the open-ocean Gregg–Henyey model or the recently
developed MacKinnon–Gregg shelf model. Like its application on the New England shelf, the MacKinnon–Gregg
model had the correct functional dependence on shear and stratification (dissipation increasing with increasing shear
and increasing stratification), however, the magnitude and range of values were too small. The most surprising finding
was the presence of what we believe to be large, high-aspect-ratio, downslope-propagating nonlinear internal solitary-
like waves of elevation. Upon reaching the canyon rim, these waves propagated into deep water and transformed into
waves of depression. On the shelf south of the canyon, the waves of elevation accounted for 20% of the observed
turbulent kinetic energy dissipation. Off the shelf, where the solitary-like waves changed to downward displacement,
e front matter r 2005 Elsevier Ltd. All rights reserved.
r.2005.04.011
ng author. Tel.: +1206 685 9080; fax: +1 206 543 6785.
sses: [email protected] (G.S. Carter), [email protected] (M.C. Gregg), [email protected]
ARTICLE IN PRESS
G.S. Carter et al. / Continental Shelf Research 25 (2005) 1499–15201500
their average dissipation increased 10-fold to � ¼ 2:6� 10�6 Wkg�1, and accounted for nearly half the dissipation in the
upper 150m.
r 2005 Elsevier Ltd. All rights reserved.
PACS: 92.10.Lq; 92.10.Ns; 92.10.Sx
Keywords: Oceanic turbulence; Mixing processes; Continental shelves; Internal waves; Solitary waves; Parameterization; USA,
California, Monterey Bay; 122�W; 36:8�N
1MacKinnon and Gregg (2003b) found that excluding
boundary layers 75% of the dissipation occurred in the
pycnocline with half of that associated with the passage of
solitary waves. Fifty-five percent of the observed dissipation
occurred in the unstratified bottom mixed layer.
1. Introduction
Turbulent mixing on continental shelves is muchmore variable than in the open-ocean thermocline.Although comparatively few direct turbulencemeasurements have been made on the shelf,observed diapycnal diffusivities span more thanfour orders of magnitude from almost molecularlevels to over 10�2 m2 s�1 (Gregg et al., 1999;Gregg and Ozsoy, 1999; Nash and Moum, 2001).A multitude of factors contribute to this increasedturbulent variability including nearby topography,stronger tidal currents, a large percentage of thewater column in the surface and bottom mixed-layers, internal tide generation, and the presence ofinternal solitary waves. In recent years researchershave begun examining different regimes, identify-ing dominant processes, and looking for ways toparameterize the dissipation (e.g. Simpson et al.,1996; Horne et al., 1996; Gregg et al., 1999; Nashand Moum, 2001; Sundermeyer and Ledwell,2001; MacKinnon and Gregg, 2003a, b).Mixing on the continental shelf is important
both locally and globally. Nutrients, sediments,freshwater, and pollutants all enter the ocean fromterrestrial sources via the continental shelf. Tur-bulent mixing is an important process for redis-tributing these quantities throughout the watercolumn (e.g. Shea and Broenkow, 1982; Horne etal., 1996; Sharples et al., 2001). On a global scale,Munk (1997) suggests that bays and inlets accountfor 100GW of tidal dissipation. Using Topex/Poseidon altimetry data to constrain a numericalmodel, Egbert and Ray (2000) estimated thatEuropean, Northwest Australian, and Patagonianshelves each dissipate more that 100GW.The change of slope at the shelf break is an ideal
location for barotropic-to-baroclinic energy conver-sion (e.g. Prinsenberg et al., 1974; Prinsenberg and
Rattray, 1975; Baines, 1982; Pingree and New,1989). Energy lost from the surface tide radiatesaway as internal waves, with an unknown propor-tion dissipated locally (Rudnick et al., 2003).Coastal solitary waves may be formed as part ofthis process, and appear to play a significant role inlocal mixing. From numerical simulations, Boguckiet al. (1997) report that up to 73% of the internalwave field energy could be in solitary waves. Rampet al. (2004) note that the most energetic motionspassing a moored array on the South China Seacontinental shelf were highly nonlinear internalsolitary waves. MacKinnon and Gregg (2003b)estimate that approximately 15% of their observeddissipation and 50% of the dissipation in thethermocline occurred during the passage of solitarywaves.1 Moum et al. (2003) report that within asolitary wave, diapycnal diffusivities were similar tothose observed in internal hydraulic jumps.Here, we present microstructure and acoustic
data collected on the continental shelf within andat the mouth of Monterey Bay during August1997. Section 2 outlines the experiment locationand data collected. The velocity structure suggestsboth local and more distant internal tide genera-tion (Section 3). The turbulence observations aredescribed and compared to other shelf measure-ments in Section 4. A recently suggested turbu-lence scaling for shelf environments (MacKinnonand Gregg, 2003b) is compared to the MontereyBay dissipations (Section 5). In Section 6 we suggestthat turbulent backscatter features could be non-linear internal solitary-like waves that propagated
ARTICLE IN PRESS
G.S. Carter et al. / Continental Shelf Research 25 (2005) 1499–1520 1501
from the shelf out over the canyon. Finally, the keyfindings are summarized in Section 7.
2. Location and data
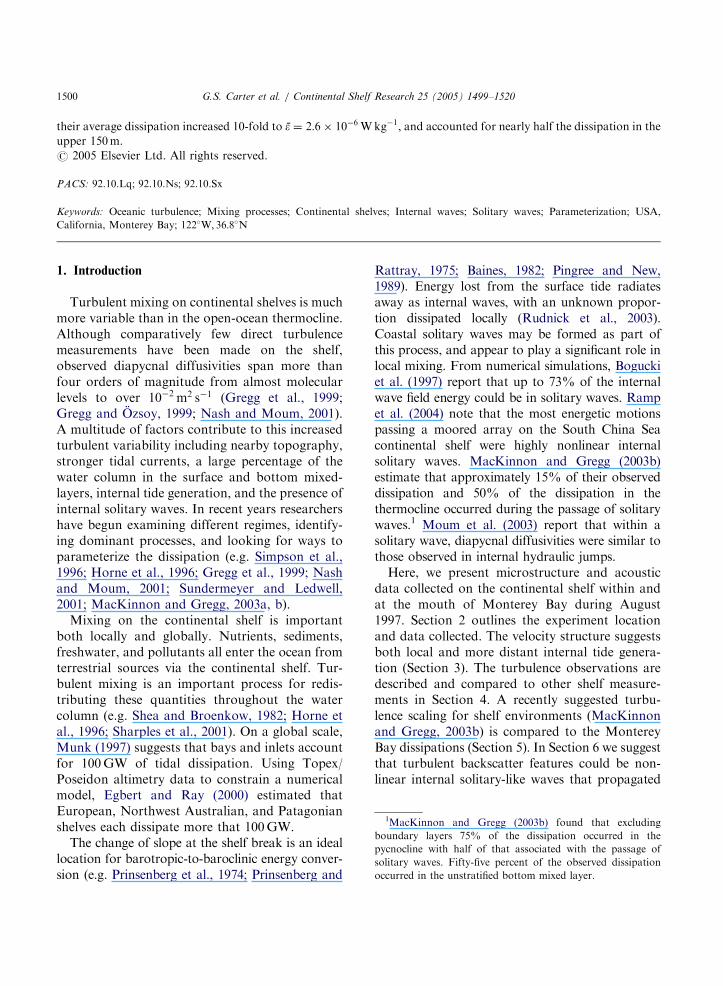
Monterey Bay, located in central California,features the largest submarine canyon on the westcoast of the United States. The canyon terminateswithin 100m of the shore at the eastern end of thebay. Within the bay, the shelf north and south ofthe canyon is 410 km wide (Fig. 1a). Estimates ofthe barotropic tidal velocity in the bay range from0:01m s�1 (Petruncio et al., 1998) to 0:18m s�1
(Breaker and Broenkow, 1994). Inflow through thecanyon means that surface currents are out of thebay on flood tide (Petruncio et al., 1998).A microstructure survey was conducted between
8 and 22 August 1997. The data collection
Fig. 1. (a) Map of the complex topography within and offshore of M
Gregg (2001) are shown in orange, and those analyzed in Carter and G
the heavier lines at 1000-m intervals. (b) Detailed map showing the lo
Contour interval is 100m, with the heavier contours marking the 500
microstructure profiles marked.
concentrated primarily on mixing at the head ofthe submarine canyon (Carter and Gregg, 2002)and over a submarine fan at the mouth ofMonterey Bay (Lien and Gregg, 2001). Themicrostructure data were collected with the looselytethered deep Advanced Microstructure Profiler(AMP), which was cycled from the stern as theship maintained steerage ð�1 knotÞ. The AMPmeasures the turbulent kinetic energy dissipationrate � (Osborn and Crawford, 1980; Wesson andGregg, 1994), temperature, and salinity. FollowingOsborn (1980), diapycnal diffusivity is given by
Kr ¼g�N2
, (1)
where g is the mixing efficiency, taken to be p0:2;N is the buoyancy frequency.Although the continental shelf was not the focus
of this experiment, 202 profiles separated into fourspatial regions were collected on the Monterey Bay
onterey Bay. The location of the profiles analyzed in Lien and
regg (2002) are plotted in yellow. Contour interval is 250m, with
cation of the four microstructure sampling regions on the shelf.
-m intervals. (c) Tidal elevation ðZÞ with the times of the shelf
ARTICLE IN PRESS
Dep
th /m
D
epth
/m
Dep
th /m
D
epth
/m
0
50
100
100
100
100
1500
50
1500
50
1500
50
150
u/m
s-1
-0.2
0
0.2
v/m
s-1
-0.2
0
0.2
Sp
eed
/ms
-1
0
0.3
0.2
0.1
Distance from southern rim of canyon / km
-1 -0.5 0 0.5
Dir
ecti
on
/ N
°
0
90
180
270
360
19:1519:3019:4520:0020:15
(a)
(b)
(c)
(d)
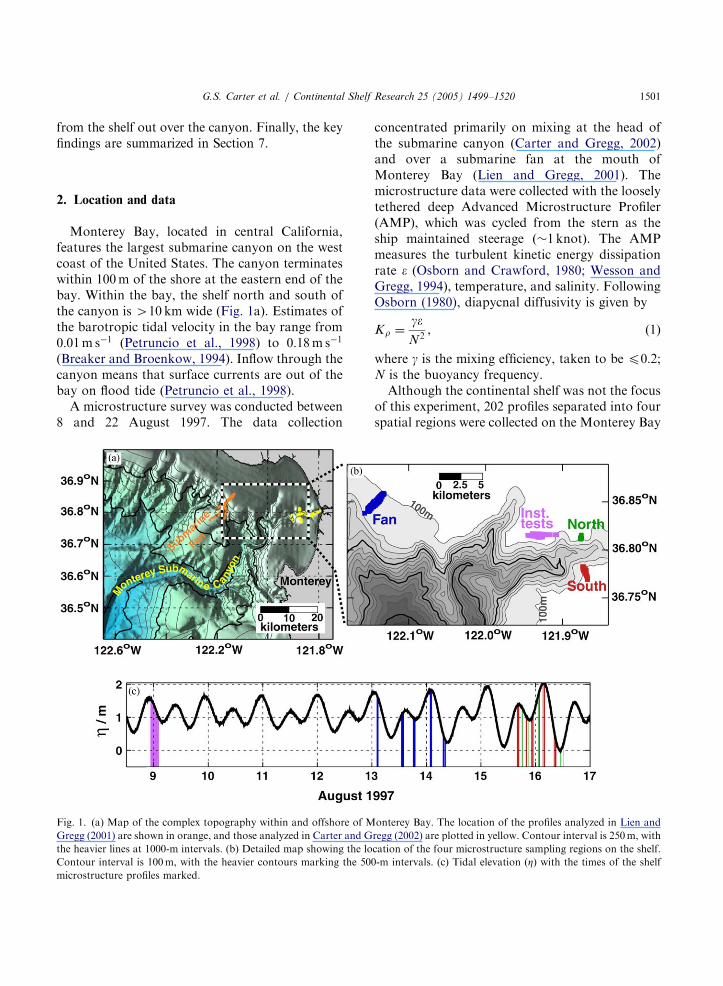
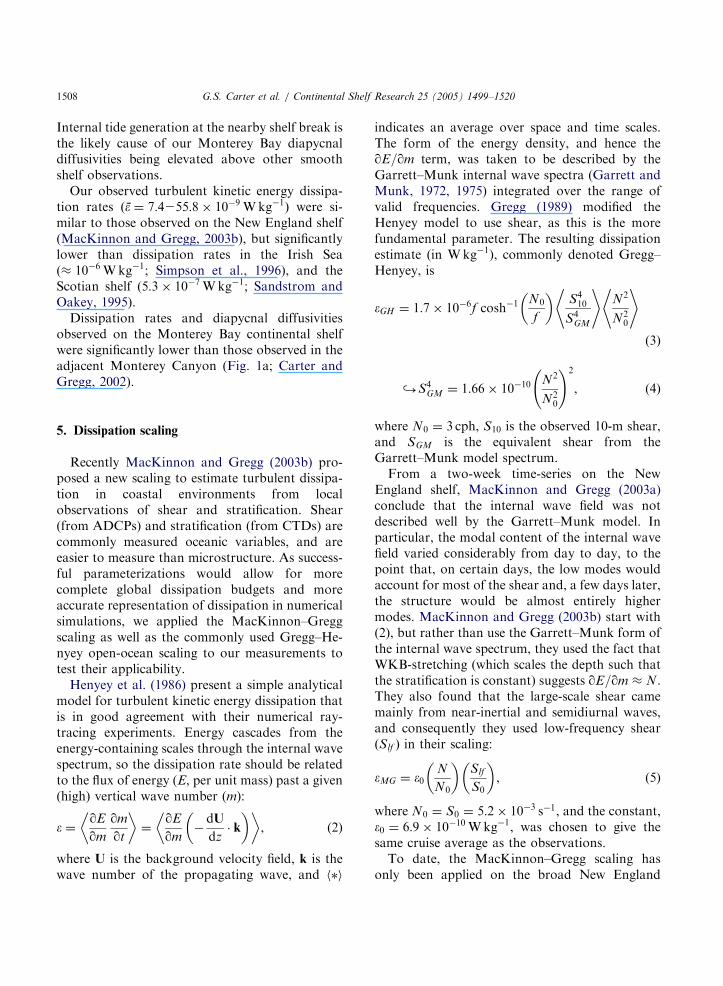
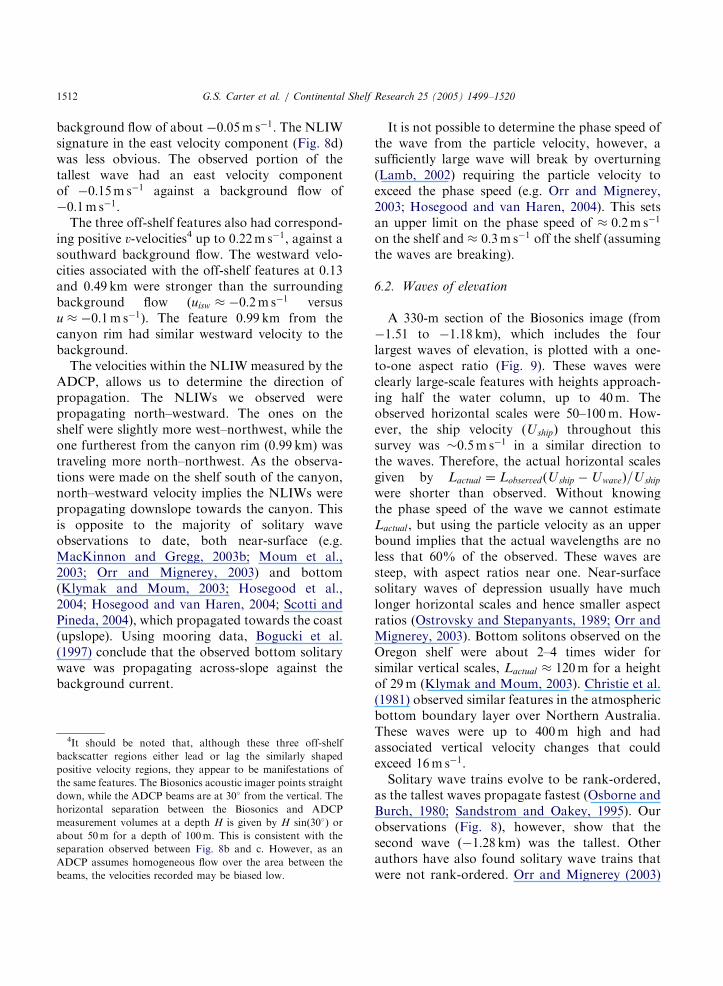
Fig. 2. ADCP velocity from the second run across the southern
G.S. Carter et al. / Continental Shelf Research 25 (2005) 1499–15201502
shelf. Apart from 38 profiles taken during instru-ment testing at the beginning of the experiment, allthe shelf profiles were taken as part of off-shelf orcross-canyon survey lines. Eighty profiles weretaken over 34 h (02:05 13 August to 12:21 14August) on the shelf adjacent to the submarine fanat the mouth of the bay. A cross-canyon survey(� 9 km from the canyon head) was conducted for22 h (14:57 15 August to 12:25 16 August).Asymmetries in the shelf depth on either side ofthe canyon (80m on the north rim and 120m onthe south rim) lead to significantly more profilesbeing taken on the southern (74) than the northern(10) shelf. Data from all four regions were within4 km of either the shelf break or the canyon rim.A 150-kHz broadband vessel-mounted ADCP
measured water velocities below 11m at 4-mintervals, and for most analysis an averaginginterval of 3min was used. Unfortunately, theADCP power supply failed on 16 August; thus halfof the cross-canyon surveys do not have corre-sponding velocity data. Acoustic images wererecorded using a 200-kHz Biosonics single-beamechosounder with vertical resolution of 0.125m.Tidal elevations were recorded at MontereyHarbor as part of the National Oceanic andAtmospheric Administration (NOAA) NationalWater Level Observation Network.
canyon rim (19:12 to 20:18, 15 August 1997). (a) u (east)
velocity component, (b) v (north) velocity component, (c)
velocity magnitude, and (d) velocity direction showing counter-
clockwise rotation with depth. The vertical white stripe results
from an erroneous ensemble being removed.
3. Locally generated IW field
ADCP velocity observations on and near theshelf showed a complex multilayer flow pattern.However, only the flow direction, and not thecurrent speed, was strongly depth dependent. Thispattern, consistent with a propagating internalwave, was repeated both near the submarine fanand within the bay. Complex bathymetry allowedbarotropic-to-baroclinic conversion (Munk, 1997;Holloway and Merrifield, 1999) at abyssal depthsas well as at the shelf break. The combination oflocally and more distantly generated internal tidesled to a complex internal wave field on the shelf,with both upward- and downward-propagatinginternal waves.Fig. 2 shows u, v velocity components, as well as
the current speed and direction ðy ¼ tan�1ðuvÞ, so
y ¼ 0� is north, and y ¼ 90� is east) over the shelfsouth of the canyon from our second across-canyonrun. These data were collected during the laterportion of the minor ebb on 15 August, between19:12 and 20:18 UTC. Magnitudes of up to0:25m s�1 were observed in both velocity compo-nents, and are consistent with our observations atother times and locations. The current speed (Fig.2c) shows neither the two-layer structure of the u-component (Fig. 2a), nor the three-layer structure ofthe v-component (Fig. 2b). However, the currentdirection (Fig. 2d) shows counterclockwise rotationwith depth. At the surface, flow was south-eastward.By 75m depth, the flow was northward. Off the
ARTICLE IN PRESS
G.S. Carter et al. / Continental Shelf Research 25 (2005) 1499–1520 1503
shelf, where deeper measurements were taken, theflow was west–northwest.Counterclockwise rotation with depth implies
upward internal wave energy propagation (Leamanand Sanford, 1975; Gill, 1982), i.e. an internal wavegenerated or reflected off the seabed. The proximityof the shelf break and canyon rim suggests localinternal tide generation. Lien and Gregg (2001)report finding a semidiurnal internal tidal beamdirectly off the shelf break adjacent to the sub-marine fan. Within Monterey Canyon fluxes wereconsistent with local generation (Kunze et al., 2002;Carter and Gregg, 2002). Therefore, although ourshelf sampling cannot be interpreted as a time-seriesand does not allow an estimate of the frequency ofthe wave, tidal forcing seems most likely.Over half of our velocity observations on the
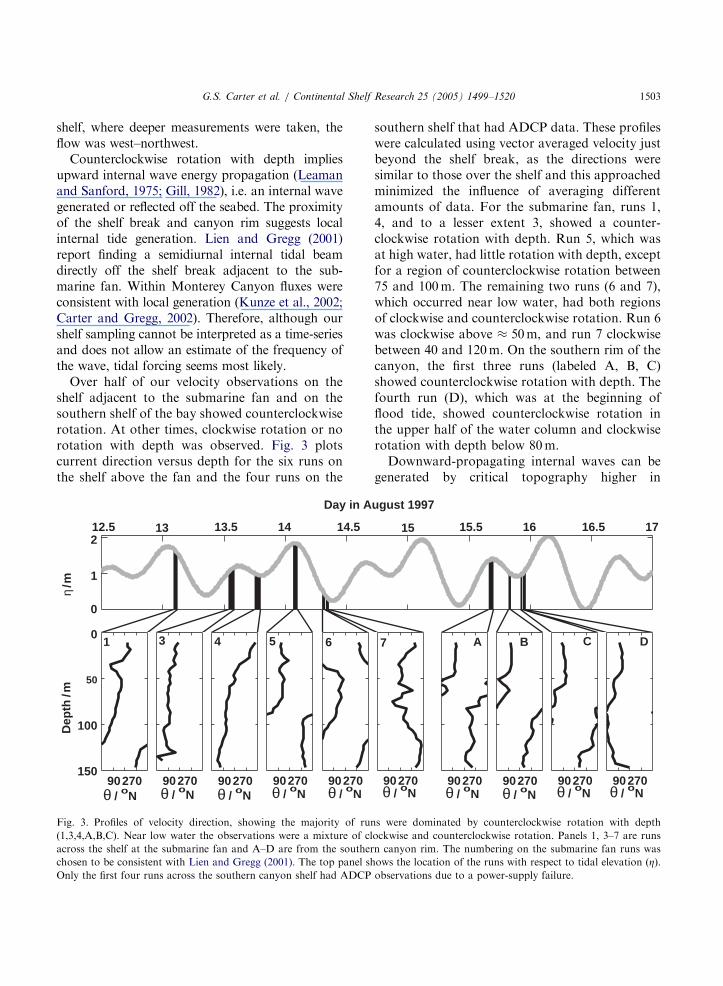
shelf adjacent to the submarine fan and on thesouthern shelf of the bay showed counterclockwiserotation. At other times, clockwise rotation or norotation with depth was observed. Fig. 3 plotscurrent direction versus depth for the six runs onthe shelf above the fan and the four runs on the
0
1
2
η / m
12.5 13 13.5 14 14.5
Day in A
41 3 5 6
90270 90270 90270 90270 90270θ / oN θ / oN θ / oN θ / oN θ / oN
0
50
100
150
Dep
th/m
Fig. 3. Profiles of velocity direction, showing the majority of run
(1,3,4,A,B,C). Near low water the observations were a mixture of cl
across the shelf at the submarine fan and A–D are from the souther
chosen to be consistent with Lien and Gregg (2001). The top panel sh
Only the first four runs across the southern canyon shelf had ADCP
southern shelf that had ADCP data. These profileswere calculated using vector averaged velocity justbeyond the shelf break, as the directions weresimilar to those over the shelf and this approachedminimized the influence of averaging differentamounts of data. For the submarine fan, runs 1,4, and to a lesser extent 3, showed a counter-clockwise rotation with depth. Run 5, which wasat high water, had little rotation with depth, exceptfor a region of counterclockwise rotation between75 and 100m. The remaining two runs (6 and 7),which occurred near low water, had both regionsof clockwise and counterclockwise rotation. Run 6was clockwise above � 50m, and run 7 clockwisebetween 40 and 120m. On the southern rim of thecanyon, the first three runs (labeled A, B, C)showed counterclockwise rotation with depth. Thefourth run (D), which was at the beginning offlood tide, showed counterclockwise rotation inthe upper half of the water column and clockwiserotation with depth below 80m.Downward-propagating internal waves can be
generated by critical topography higher in
15 15.5 16 16.5 17
ugust 1997
7 A B C D
90270 90270 90270 90270 90270θ / oN θ / oN θ / oN θ / oN θ / oN
s were dominated by counterclockwise rotation with depth
ockwise and counterclockwise rotation. Panels 1, 3–7 are runs
n canyon rim. The numbering on the submarine fan runs was
ows the location of the runs with respect to tidal elevation ðZÞ.observations due to a power-supply failure.
ARTICLE IN PRESS
Table 1
Mean dissipation rates and diapycnal diffusivities observed in
the four shelf regions
Region � Wkg�1 95% conf. int. Wkg�1
Test 7:4� 10�9 ½6:129:0� � 10�9
Fan 52:9� 10�9 ½44:6263:8� � 10�9
North 49:1� 10�9 ½38:3260:8� � 10�9
South 55:8� 10�9 ½49:0263:9� � 10�9
Region Kr m2 s�1 95% conf. int. m2 s�1
Test 6:1� 10�5 ½4:328:8� � 10�5
Fan 27:0� 10�5 ½18:7239:5� � 10�5
North 14:1� 10�5 ½10:6217:9� � 10�5
South 37:8� 10�5 ½32:7244:8� � 10�5
Data within the surface and bottom mixed-layers has been
excluded. The 95% bootsrapped confidence intervals on the
means are also given.
G.S. Carter et al. / Continental Shelf Research 25 (2005) 1499–15201504
shallower water, or by either reflection or genera-tion at the surface. The clockwise rotation in runD was below the shelf break depth, and thereforemay be indicative of local generation. However,the downward-propagation in runs 6 and 7 isabove the shelf level, and therefore must have beengenerated or reflected at the surface. As there wereno strong wind-forcing events (Carter and Gregg,2002), the most likely source of the downwardpropagation would be surface reflection from aremote generation site. Petruncio et al. (1998)conclude that an internal tide is generated between1000- and 1500-m depth on the submarine fan(Fig. 1a).Kunze et al. (2002) find no evidence to support
this and suggest the internal tides are generateddeeper on the complex bathymetry associated withthe submarine canyon. Internal tides generatedoffshore and focused by coastal topography wouldalso be consistent with their data. Numericalmodels suggest generation at the base of thesubmarine fan (O. Fringer, pers. comm.). There-fore, a possible interpretation of our data is thatthe incoming barotropic tide generates an internaltide deep on the submarine fan or canyon, then asecond internal tide is generated as the barotropictide passes over the shelf break or canyon rim. Theincoming deeply generated internal tide reflects offthe surface inshore of its generation region andpropagates downward on to the shelf.
4. Observed mixing
Observed turbulent kinetic energy dissipationrates on the shelf ranged from o10�10 to� 10�5 Wkg�1. Diapycnal diffusivity2 ranged oversix orders of magnitude from 10�7 m2 s�1. Con-siderable variability was observed on the shelf,
2When calculating diapycnal diffusivity (1), the stratification
used should represent the local background density field. The
short spatial scales associated with shelf break processes
combined with our irregular profile spacing meant time
averaging the stratification was not possible. Consequently,
Kr values in this paper were calculated with stratification
derived from a single density profile resort to be monotonically
increasing with depth. The diapycnal diffusivities were calcu-
lated over 1-m vertical intervals.
both in magnitude and depth distribution. Spa-tially as well as temporally varying environmentfactors appeared to be important.
4.1. Average mixing
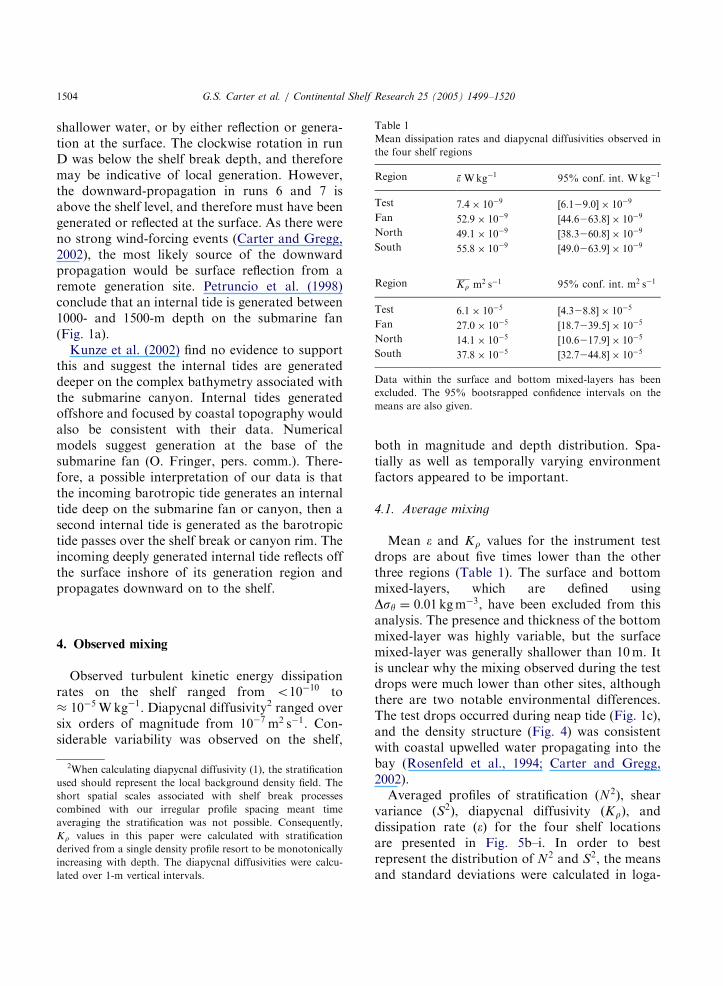
Mean � and Kr values for the instrument testdrops are about five times lower than the otherthree regions (Table 1). The surface and bottommixed-layers, which are defined usingDsy ¼ 0:01 kgm�3, have been excluded from thisanalysis. The presence and thickness of the bottommixed-layer was highly variable, but the surfacemixed-layer was generally shallower than 10m. Itis unclear why the mixing observed during the testdrops were much lower than other sites, althoughthere are two notable environmental differences.The test drops occurred during neap tide (Fig. 1c),and the density structure (Fig. 4) was consistentwith coastal upwelled water propagating into thebay (Rosenfeld et al., 1994; Carter and Gregg,2002).Averaged profiles of stratification ðN2Þ, shear
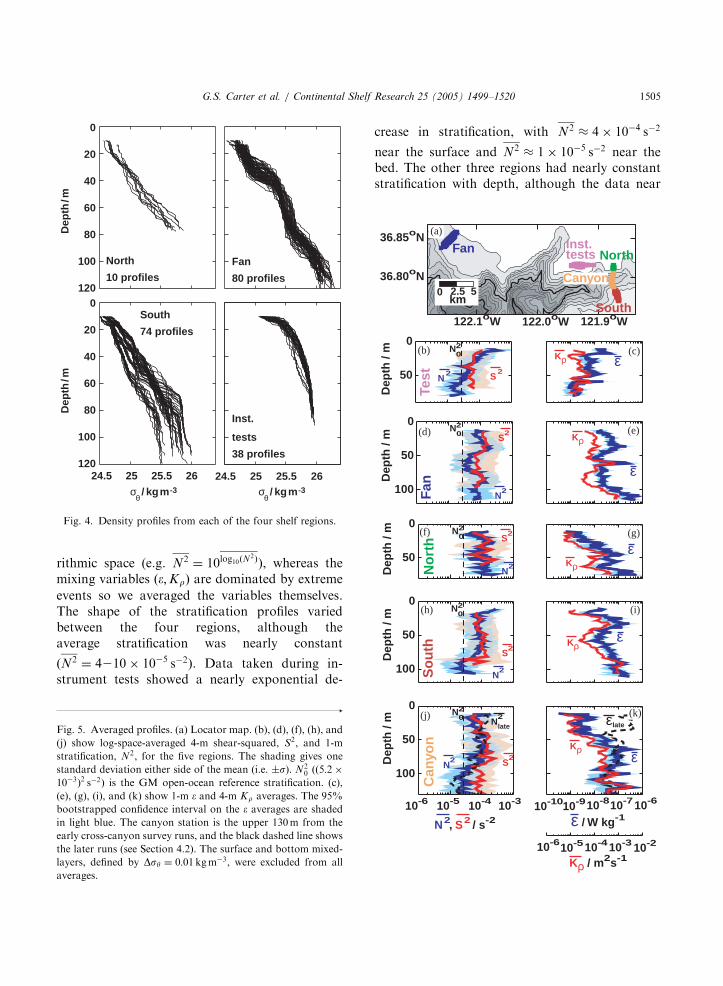
variance ðS2Þ, diapycnal diffusivity ðKrÞ, anddissipation rate ð�Þ for the four shelf locationsare presented in Fig. 5b–i. In order to bestrepresent the distribution of N2 and S2, the meansand standard deviations were calculated in loga-
ARTICLE IN PRESS
24.5 25 25.5 26
0
20
40
60
80
100
120
0
20
40
60
80
100
120
24.5 25 25.5 26
Dep
th /m
D
epth
/m
North
10 profiles
South
74 profiles
Fan
80 profiles
Inst.
tests
38 profiles
σθ / kg m-3 σ
θ / kg m-3
Fig. 4. Density profiles from each of the four shelf regions.
South
NorthInst.testsFan
Canyon
Test
Fan
No
rth
So
uth
N2
S2
S2
S2
S2
N2
N2
N2
Kρ
Kρ
Kρ
Kρ
121.9oW122.1oW 122.0oW
36.80oN
36.85oN
0 2.5 5km
0
50
0
50
100
0
50
0
50
100
Dep
th /
mD
epth
/ m
Dep
th /
mD
epth
/ m
N02
N02
N02
N02
ε
ε
ε
ε
(b) (c)
(d) (e)
(f) (g)
(h) (i)
(a)
G.S. Carter et al. / Continental Shelf Research 25 (2005) 1499–1520 1505
rithmic space (e.g. N2 ¼ 10log10ðN2Þ), whereas the
mixing variables ð�;KrÞ are dominated by extreme
events so we averaged the variables themselves.The shape of the stratification profiles variedbetween the four regions, although theaverage stratification was nearly constant
ðN2 ¼ 4210� 10�5 s�2Þ. Data taken during in-strument tests showed a nearly exponential de-
Fig. 5. Averaged profiles. (a) Locator map. (b), (d), (f), (h), and
(j) show log-space-averaged 4-m shear-squared, S2, and 1-m
stratification, N2, for the five regions. The shading gives one
standard deviation either side of the mean (i.e. s). N20 ðð5:2�
10�3Þ2 s�2Þ is the GM open-ocean reference stratification. (c),
(e), (g), (i), and (k) show 1-m � and 4-m Kr averages. The 95%
bootstrapped confidence interval on the � averages are shadedin light blue. The canyon station is the upper 130m from the
early cross-canyon survey runs, and the black dashed line shows
the later runs (see Section 4.2). The surface and bottom mixed-
layers, defined by Dsy ¼ 0:01 kgm�3, were excluded from all
averages.
crease in stratification, with N2 � 4� 10�4 s�2
near the surface and N2 � 1� 10�5 s�2 near thebed. The other three regions had nearly constantstratification with depth, although the data near
N2 S2 ε
Kρ
Can
yon
S2
N2
Kρ
0
50
100
Dep
th /
m
10-6 10-5 10-4 10-3 10-1010-910-810-710-6
10-3 10-210-610-510-4
, / s-2 / W kg-1
/ m2s-1
N02
εlateN2late
ε
(j) (k)
ARTICLE IN PRESS
G.S. Carter et al. / Continental Shelf Research 25 (2005) 1499–15201506
the submarine fan had a � 40-m thick low-stratification region at mid-depth, and the southregion stratification decreased below 80m. The 4-m first-difference shear profiles are very similaracross all four regions; the test data is slightlylower in magnitude.Averaged profiles of dissipation rate for the fan
and south regions show a local maximum at35–40m and a near-bed increase, which starts at100-m depth for the fan but was more gradual forthe south region (starting at 60m). The �=Kr peaknear 60m in the fan average is mainly due to asingle mixing event. To first order, the averagedprofile of the test data showed dissipation thatdecreased with increasing depth. Whereas, thenorth region showed depth-averaged � increasingwith depth. These two regions are only 5 km apart,but sampling was separated by 7 days and thedensity field differed. The north, south, and fanregions all had similar near-bottom dissipationrates ð�410�7 Wkg�1Þ, however, the depth-aver-aged near-bed dissipation during the test dropswas � 2� 10�9 Wkg�1. Averaged diapycnal dif-fusivity showed similar patterns.The two regions that had survey lines run
multiple times (fan and south) showed variabilityin average mixing values between runs. Averagedissipation on the shelf near the fan varied asmuch as 10-fold between occupations, with con-siderable patchiness in the location of the turbu-lence (not shown). Lien and Gregg (2001) reportthat in the water column above the submarine fan,dissipation was stronger during ebb tide. With ourlimited sampling (and the fact we often sampled onthe shelf near slack water), we are unable tocomment on any possible links between tidal phaseand dissipation.
4.2. Mixing above Monterey Canyon
The last two panels in Fig. 5 give averageprofiles in the upper 130m from the cross-canyonsurvey runs conducted �9 km from Moss Landing(Fig. 5a). Data north of the 200-m isobath of thenorthern side of the canyon were disregarded dueto elevated mixing from interactions with the steeptopography. Primarily, Fig. 5j and k shows datafrom the first half of the cross-canyon survey
(17:04 15 August to 00:19 16 August), however,the black dashed lines give the depth-averaged N2
and � profiles after the pycnocline had shallowed(04:36 to 12:05 16 August) resulting in significantchanges to the average dissipation profiles.When the pycnocline was between 50 and 80m
depth, the average near-surface dissipation ð� �4� 10�10 Wkg�1Þ was lower than any of the shelfregions surveyed. Between 40 and 60m, averaged �increased to � 10�7 Wkg�1, and below 100mdepth the isolated features associated with highacoustic backscatter (Sections 4.3 and 6) domi-nated the average. The stratification and shear-squared profiles are very similar to those observedon the neighboring shelves north and south of thecanyon.Once the pycnocline shallowed (dashed lines),
stratification in the upper 40m increased by afactor of about 3. The near-surface dissipation,however, increased by over two orders of magni-tude to �late � 3� 10�7 Wkg�1, and was largerthan our other shelf observations. It appears thatmost of the increased near-surface dissipationoccurred near the diurnal maximum high water.In their study of dissipation along the canyon axis,Carter and Gregg (2002) also found that dissipa-tion levels increased by up to 102 times when thepycnocline shallowed from 120 to 50m.
4.3. Mixing associated with isolated backscatter
events
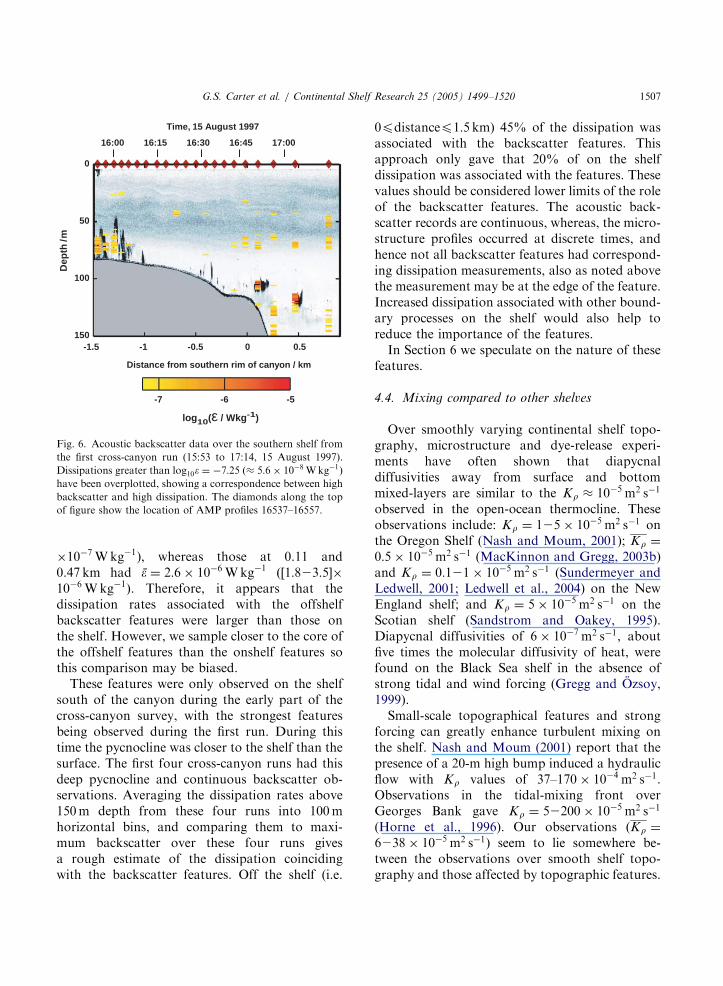
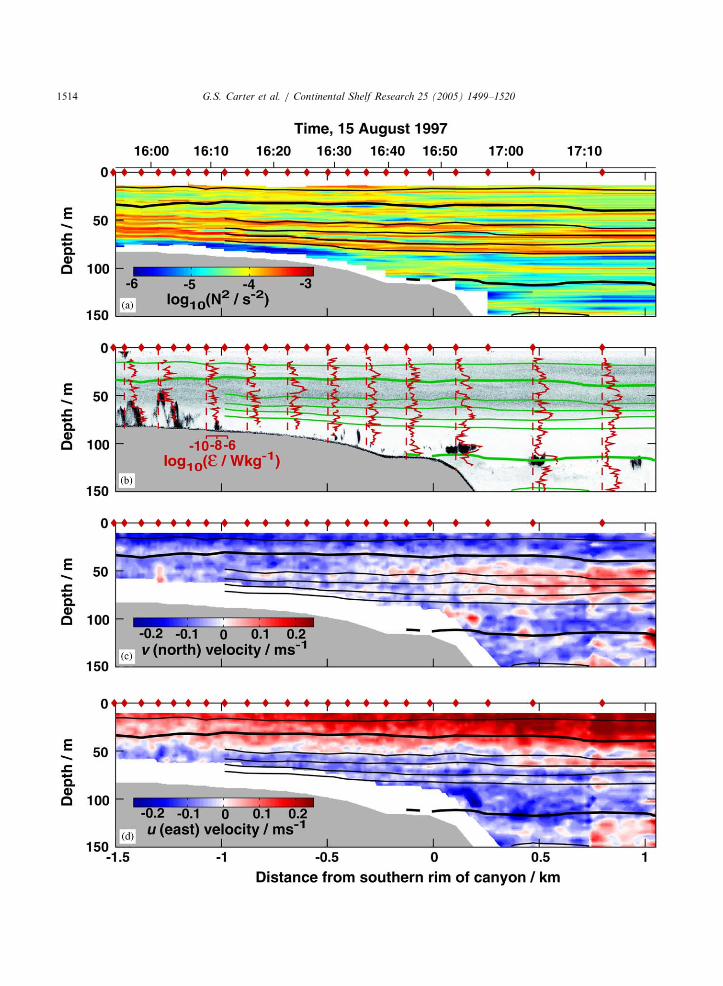
Turbulent kinetic energy dissipation rates ele-vated relative to the local background wereobserved coincident with isolated high acousticbackscatter features (Fig. 6). The tall backscatterfeatures on the shelf (�1:5 to �1:2 km) haddissipation rates approaching 9� 10�7 Wkg�1,while above them �t5� 10�8 Wkg�1. Two AMPprofiles sampled through backscatter features indeeper water (0.11 and 0.47 km), and showednarrow patches of intense mixing corresponding tothe backscatter. These 10-m thick patches haddissipations 102–103 times that of the surroundingwater.The features between �1:5 and �1:2 km had � ¼
1:8� 10�7 Wkg�1 (with a 95% bootstrappedconfidence interval on the mean of [1.1–2.7]
ARTICLE IN PRESS
16:00 16:15 16:30 16:45 17:00
0
50
100
150-1.5 -1 -0.5 0 0.5
-7 -6 -5
log10(ε / Wkg-1)
Distance from southern rim of canyon / km
Time, 15 August 1997
Dep
th / m
Fig. 6. Acoustic backscatter data over the southern shelf from
the first cross-canyon run (15:53 to 17:14, 15 August 1997).
Dissipations greater than log10� ¼ �7:25 ð� 5:6� 10�8 Wkg�1Þ
have been overplotted, showing a correspondence between high
backscatter and high dissipation. The diamonds along the top
of figure show the location of AMP profiles 16537–16557.
G.S. Carter et al. / Continental Shelf Research 25 (2005) 1499–1520 1507
�10�7 Wkg�1), whereas those at 0.11 and0.47 km had � ¼ 2:6� 10�6 Wkg�1 ð½1:823:5��10�6 Wkg�1Þ. Therefore, it appears that thedissipation rates associated with the offshelfbackscatter features were larger than those onthe shelf. However, we sample closer to the core ofthe offshelf features than the onshelf features sothis comparison may be biased.These features were only observed on the shelf
south of the canyon during the early part of thecross-canyon survey, with the strongest featuresbeing observed during the first run. During thistime the pycnocline was closer to the shelf than thesurface. The first four cross-canyon runs had thisdeep pycnocline and continuous backscatter ob-servations. Averaging the dissipation rates above150m depth from these four runs into 100mhorizontal bins, and comparing them to maxi-mum backscatter over these four runs givesa rough estimate of the dissipation coincidingwith the backscatter features. Off the shelf (i.e.
0pdistancep1:5 km) 45% of the dissipation wasassociated with the backscatter features. Thisapproach only gave that 20% of on the shelfdissipation was associated with the features. Thesevalues should be considered lower limits of the roleof the backscatter features. The acoustic back-scatter records are continuous, whereas, the micro-structure profiles occurred at discrete times, andhence not all backscatter features had correspond-ing dissipation measurements, also as noted abovethe measurement may be at the edge of the feature.Increased dissipation associated with other bound-ary processes on the shelf would also help toreduce the importance of the features.In Section 6 we speculate on the nature of these
features.
4.4. Mixing compared to other shelves
Over smoothly varying continental shelf topo-graphy, microstructure and dye-release experi-ments have often shown that diapycnaldiffusivities away from surface and bottommixed-layers are similar to the Kr � 10�5 m2 s�1
observed in the open-ocean thermocline. Theseobservations include: Kr ¼ 125� 10�5 m2 s�1 onthe Oregon Shelf (Nash and Moum, 2001); Kr ¼
0:5� 10�5 m2 s�1 (MacKinnon and Gregg, 2003b)and Kr ¼ 0:121� 10�5 m2 s�1 (Sundermeyer andLedwell, 2001; Ledwell et al., 2004) on the NewEngland shelf; and Kr ¼ 5� 10�5 m2 s�1 on theScotian shelf (Sandstrom and Oakey, 1995).Diapycnal diffusivities of 6� 10�7 m2 s�1, aboutfive times the molecular diffusivity of heat, werefound on the Black Sea shelf in the absence ofstrong tidal and wind forcing (Gregg and Ozsoy,1999).Small-scale topographical features and strong
forcing can greatly enhance turbulent mixing onthe shelf. Nash and Moum (2001) report that thepresence of a 20-m high bump induced a hydraulicflow with Kr values of 37–170� 10�4 m2 s�1.Observations in the tidal-mixing front overGeorges Bank gave Kr ¼ 52200� 10�5 m2 s�1
(Horne et al., 1996). Our observations ðKr ¼
6238� 10�5 m2 s�1Þ seem to lie somewhere be-tween the observations over smooth shelf topo-graphy and those affected by topographic features.
ARTICLE IN PRESS
G.S. Carter et al. / Continental Shelf Research 25 (2005) 1499–15201508
Internal tide generation at the nearby shelf break isthe likely cause of our Monterey Bay diapycnaldiffusivities being elevated above other smoothshelf observations.Our observed turbulent kinetic energy dissipa-
tion rates ð� ¼ 7:4255:8� 10�9 Wkg�1Þ were si-milar to those observed on the New England shelf(MacKinnon and Gregg, 2003b), but significantlylower than dissipation rates in the Irish Sea(� 10�6 Wkg�1; Simpson et al., 1996), and theScotian shelf (5:3� 10�7 Wkg�1; Sandstrom andOakey, 1995).Dissipation rates and diapycnal diffusivities
observed on the Monterey Bay continental shelfwere significantly lower than those observed in theadjacent Monterey Canyon (Fig. 1a; Carter andGregg, 2002).
5. Dissipation scaling
Recently MacKinnon and Gregg (2003b) pro-posed a new scaling to estimate turbulent dissipa-tion in coastal environments from localobservations of shear and stratification. Shear(from ADCPs) and stratification (from CTDs) arecommonly measured oceanic variables, and areeasier to measure than microstructure. As success-ful parameterizations would allow for morecomplete global dissipation budgets and moreaccurate representation of dissipation in numericalsimulations, we applied the MacKinnon–Greggscaling as well as the commonly used Gregg–He-nyey open-ocean scaling to our measurements totest their applicability.Henyey et al. (1986) present a simple analytical
model for turbulent kinetic energy dissipation thatis in good agreement with their numerical ray-tracing experiments. Energy cascades from theenergy-containing scales through the internal wavespectrum, so the dissipation rate should be relatedto the flux of energy (E, per unit mass) past a given(high) vertical wave number (m):
� ¼qE
qm
qm
qt
� �¼
qE
qm�dU
dz� k
� �� �, (2)
where U is the background velocity field, k is thewave number of the propagating wave, and h�i
indicates an average over space and time scales.The form of the energy density, and hence theqE=qm term, was taken to be described by theGarrett–Munk internal wave spectra (Garrett andMunk, 1972, 1975) integrated over the range ofvalid frequencies. Gregg (1989) modified theHenyey model to use shear, as this is the morefundamental parameter. The resulting dissipationestimate (in Wkg�1), commonly denoted Gregg–Henyey, is
�GH ¼ 1:7� 10�6f cosh�1N0
f
� �S410
S4GM
* +N2
N20
* +
(3)
+S4GM ¼ 1:66� 10�10
N2
N20
!2
, (4)
where N0 ¼ 3 cph, S10 is the observed 10-m shear,and SGM is the equivalent shear from theGarrett–Munk model spectrum.From a two-week time-series on the New
England shelf, MacKinnon and Gregg (2003a)conclude that the internal wave field was notdescribed well by the Garrett–Munk model. Inparticular, the modal content of the internal wavefield varied considerably from day to day, to thepoint that, on certain days, the low modes wouldaccount for most of the shear and, a few days later,the structure would be almost entirely highermodes. MacKinnon and Gregg (2003b) start with(2), but rather than use the Garrett–Munk form ofthe internal wave spectrum, they used the fact thatWKB-stretching (which scales the depth such thatthe stratification is constant) suggests qE=qm � N.They also found that the large-scale shear camemainly from near-inertial and semidiurnal waves,and consequently they used low-frequency shearðSlf Þ in their scaling:
�MG ¼ �0N
N0
� �Slf
S0
� �, (5)
where N0 ¼ S0 ¼ 5:2� 10�3 s�1, and the constant,�0 ¼ 6:9� 10�10 Wkg�1, was chosen to give thesame cruise average as the observations.To date, the MacKinnon–Gregg scaling has
only been applied on the broad New England
ARTICLE IN PRESS
G.S. Carter et al. / Continental Shelf Research 25 (2005) 1499–1520 1509
shelf, about halfway between the shelf break andthe coast. MacKinnon and Gregg (2003b) con-sidered data from late summer 1996, but excludeddissipations associated with the passage of solitarywaves of depression, as these tended to be higherfor given S2 and N2. They found that while boththe MacKinnon–Gregg and Gregg–Henyey scal-ings predicted the shape of the average profilecorrectly, the MacKinnon–Gregg scaling predictedmagnitude and variability much better. Ledwell etal. (2004), who conducted a dye-release experimentas part of the same investigation, report that theMacKinnon–Gregg scaling was consistent withdiapycnal diffusivities inferred from dye-spreading(although the dye-spreading included the effect ofsolitary waves). During late spring the followingyear, MacKinnon and Gregg (2005) found thatdissipation followed the MacKinnon–Gregg scal-ing but an �0 about three times larger ð�0 ¼ 2:0�10�9 Wkg�1Þ was required.The Monterey Bay shelf dissipations were
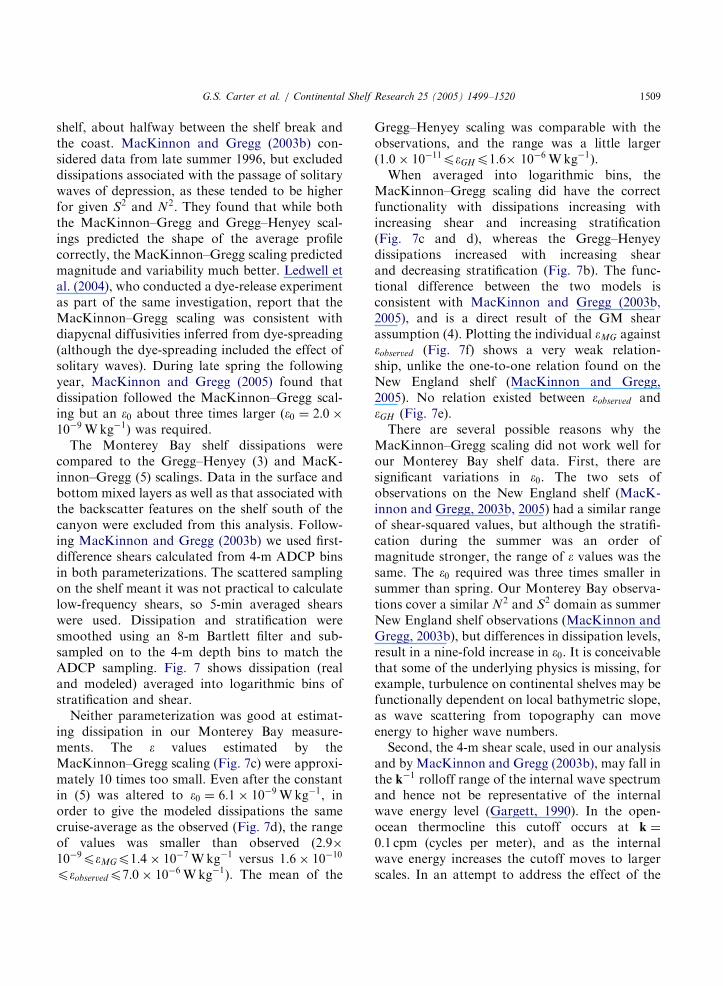
compared to the Gregg–Henyey (3) and MacK-innon–Gregg (5) scalings. Data in the surface andbottom mixed layers as well as that associated withthe backscatter features on the shelf south of thecanyon were excluded from this analysis. Follow-ing MacKinnon and Gregg (2003b) we used first-difference shears calculated from 4-m ADCP binsin both parameterizations. The scattered samplingon the shelf meant it was not practical to calculatelow-frequency shears, so 5-min averaged shearswere used. Dissipation and stratification weresmoothed using an 8-m Bartlett filter and sub-sampled on to the 4-m depth bins to match theADCP sampling. Fig. 7 shows dissipation (realand modeled) averaged into logarithmic bins ofstratification and shear.Neither parameterization was good at estimat-
ing dissipation in our Monterey Bay measure-ments. The � values estimated by theMacKinnon–Gregg scaling (Fig. 7c) were approxi-mately 10 times too small. Even after the constantin (5) was altered to �0 ¼ 6:1� 10�9 Wkg�1, inorder to give the modeled dissipations the samecruise-average as the observed (Fig. 7d), the rangeof values was smaller than observed (2:9�10�9p�MGp1:4� 10�7 Wkg�1 versus 1:6� 10�10
p�observedp7:0� 10�6 Wkg�1). The mean of the
Gregg–Henyey scaling was comparable with theobservations, and the range was a little largerð1:0� 10�11p�GHp1:6� 10�6 Wkg�1Þ.When averaged into logarithmic bins, the
MacKinnon–Gregg scaling did have the correctfunctionality with dissipations increasing withincreasing shear and increasing stratification(Fig. 7c and d), whereas the Gregg–Henyeydissipations increased with increasing shearand decreasing stratification (Fig. 7b). The func-tional difference between the two models isconsistent with MacKinnon and Gregg (2003b,2005), and is a direct result of the GM shearassumption (4). Plotting the individual �MG against�observed (Fig. 7f) shows a very weak relation-ship, unlike the one-to-one relation found on theNew England shelf (MacKinnon and Gregg,2005). No relation existed between �observed and�GH (Fig. 7e).There are several possible reasons why the
MacKinnon–Gregg scaling did not work well forour Monterey Bay shelf data. First, there aresignificant variations in �0. The two sets ofobservations on the New England shelf (MacK-innon and Gregg, 2003b, 2005) had a similar rangeof shear-squared values, but although the stratifi-cation during the summer was an order ofmagnitude stronger, the range of � values was thesame. The �0 required was three times smaller insummer than spring. Our Monterey Bay observa-tions cover a similar N2 and S2 domain as summerNew England shelf observations (MacKinnon andGregg, 2003b), but differences in dissipation levels,result in a nine-fold increase in �0. It is conceivablethat some of the underlying physics is missing, forexample, turbulence on continental shelves may befunctionally dependent on local bathymetric slope,as wave scattering from topography can moveenergy to higher wave numbers.Second, the 4-m shear scale, used in our analysis
and by MacKinnon and Gregg (2003b), may fall inthe k�1 rolloff range of the internal wave spectrumand hence not be representative of the internalwave energy level (Gargett, 1990). In the open-ocean thermocline this cutoff occurs at k ¼
0:1 cpm (cycles per meter), and as the internalwave energy increases the cutoff moves to largerscales. In an attempt to address the effect of the

ARTICLE IN PRESS
10-5
10-4
10-3
S2 /s-2
4
10-4 10-3N2 /s-2
4
10-4 10-3N2 /s-2
4
10-4 10-3N2 /s-2
4
10-4 10-3N2 /s-2
4
< -10 -9.5 -9 -8.5 -8 -7.5 -7 -6.5 -6 -5.5 -5
log10(ε / W kg-1)
10-5
10-5
10-5
10-5
10-6 10-6
10-6 10-6
10-7 10-7
10-7 10-7
10-8 10-8
10-8 10-8
10-9 10-9
10-910-910-10 10-10
10-10 10-10
εGH / Wkg-1 εMG (ε0 = 6.1 x 10⁻⁹) / Wkg-1
ε Ob
serv
ed
/ W
kg-1
εGH εMGεObservedεMG
ε0=6.9x10⁻¹⁰ ε0=6.1x10⁻⁹
(a) (b) (c) (d)
(e) (f)
Fig. 7. (a) Observed dissipation data averaged in bins of stratification and shear variance. S24 is the first-difference shear variance
calculated from 4-m ADCP depth bins, N24 is the buoyancy frequency filtered to match the ADCP sampling. (b) Gregg–Henyey model
dissipation data averaged in bins of stratification and shear variance. (c) Same for the MacKinnon–Gregg scaling with the original
empirical constant ð�0 ¼ 6:9� 10�10Þ. (d) Same for MacKinnon–Gregg scaling with �0 ¼ 6:1� 10�9, derived from matching model and
observed averages. (e) and (f) Observed dissipation plotted against modeled �GH and �MG ð�0 ¼ 6:1� 10�9Þ dissipation, respectively.
G.S. Carter et al. / Continental Shelf Research 25 (2005) 1499–15201510
shear scale, we calculated equivalent 12-m first-difference shears from the 4-m ADCP shears,3 andrepeated the above analysis. The qualitative resultsremain the same, although the smoother shearsand stratifications lead to an even smaller range ofdissipations.
3Twelve-meter velocities are calculated from a 4-m ADCP by
1=9vi þ 2=9viþ1 þ 3=9viþ2 þ 2=9viþ3 þ 1=9viþ4. The 12-m first-
difference shear is then given by ½ð1=9vi þ 2=9viþ1 þ 3=9viþ2þ
2=9viþ3þ 1=9viþ4Þ � ð1=9viþ3þ 2=9viþ4 þ 3=9viþ5þ 2=9viþ6þ
1=9viþ9Þ�=12. Equating this with 4-m first-difference shears
implies weighting of 1/27, 3/27, 6/27, 7/27, 6/26, 3/27, and 1/27
to get 12-m shears from 4-m shears.
A potentially more fundamental problem is thatboth scalings are based on wave–wave interac-tions, in which small-scale internal waves areforced towards breaking by interaction withlarge-scale (e.g. low-mode) shears. Only when theenergy is contained in stable low modes arewave–wave interactions expected to dominateturbulence production (MacKinnon and Gregg,2005). When the energy-containing scales areunstable, shear instabilities dominate and dissipa-tion rates tend to be higher. During internal wavegeneration or topographical interaction, highmodes, which are unstable and dissipate quickly,are created. As our observations were influenced
ARTICLE IN PRESS
G.S. Carter et al. / Continental Shelf Research 25 (2005) 1499–1520 1511
by local internal tide generation (Section 3), it ispossible the energy-containing modes are unstable.Therefore, wave–wave interaction models may notbe applicable to this data.The MacKinnon–Gregg scaling appears to be a
reasonable starting point for turbulence parame-terization on continental shelves, as it has thecorrect functional dependence on N and S whenaveraged into logarithmic bins. However, becausethe empirical constant �0 varies between datasets,some underlying physics may be unaccounted for.Finally we caution that continental shelves maycontain regions where any wave–wave interaction-based parameterization may not be valid becausedifferent physics dominate.
6. Discussion: nonlinear internal waves
In Section 4.3 we showed the presence ofacoustic backscatter features which coincided withelevated turbulent kinetic energy dissipation rates.The exact nature, and certainly the origin of thesefeatures is unclear. Possible explanations includebiology, dense water gravity flow, or a nonlinearinternal wave (NLIW). The airfoil shear probesused to estimate � are extremely sensitive toimpacts with plankton, but as these impacts areno more common in the features than elsewhere itseems unlikely they represent concentrated cloudsof biology. The bottom mixed layer in the regionof the shelf corresponding to the features was0.01–0:02 kgm�3 lighter than that observed in theadjacent profiles further down the shelf.In this section, we suggest that these feature are
nonlinear internal solitary-like waves. Internalsolitary waves are a common feature of the coastalocean. Waves of depression (downward displace-ment), which propagate below the surface mixed-layer, are the most commonly observed (e.g.Sandstrom and Oakey, 1995; MacKinnon andGregg, 2003b; Moum et al., 2003). These can beformed if the layer above the pycnocline is thinnerthan the deep layer (Liu et al., 1998). When thepycnocline is in the lower half of the water-column, solitary waves will have upward displace-ment (waves of elevation). Observations of near-bottom waves of elevation have been published for
the southern California (Bogucki et al., 1997),Oregon (Klymak and Moum, 2003), and Massa-chusetts (Scotti and Pineda, 2004) shelves, as wellas the continental slope of the Faeroe–ShetlandChannel (Hosegood et al., 2004; Hosegood andvan Haren, 2004). The relative thickness of thelayers above and below the pycnocline can varyalong the propagation path, for example, solitarywaves have been observed transforming fromwaves of depression to waves of elevation as theypropagated from the South China Sea onto theshelf (Liu et al., 1998; Orr and Mignerey, 2003;Ramp et al., 2004).The short wavelength of the features means we,
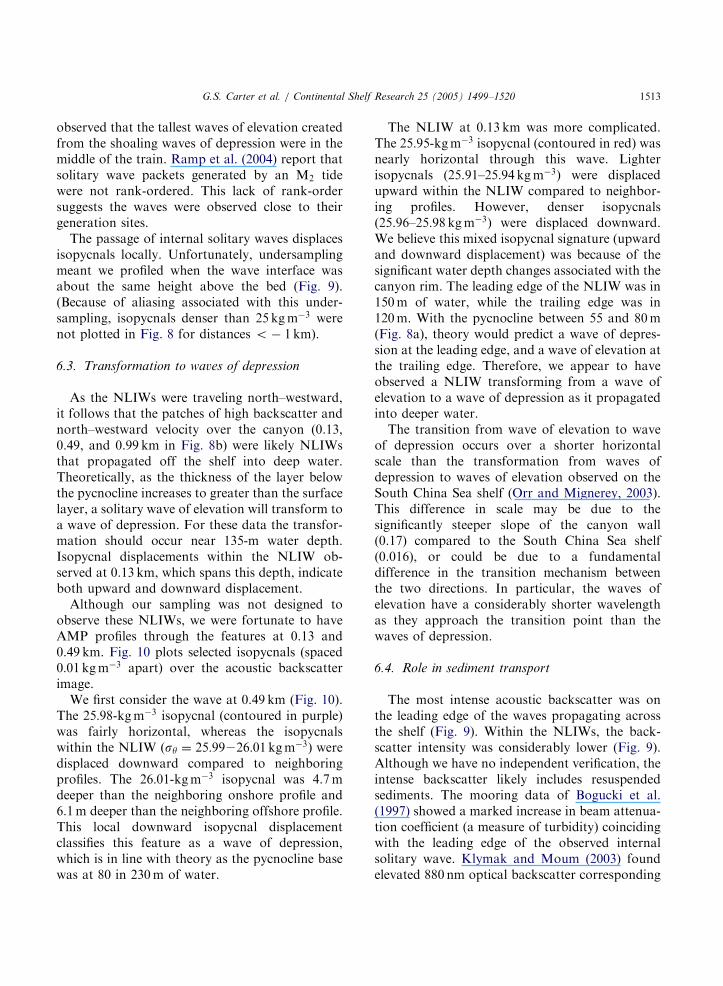
unfortunately, lack the high-resolution density andcurrent field observations required to fully describethem as internal solitary waves. The features wereobserved during the first half of our 22-h cross-canyon survey, when the pycnocline on the south-ern shelf tended to be just above the bottommixed-layer allowing for solitary waves of eleva-tion. ADCP velocity measurements reported be-low indicate that these NLIWs propagatednorth–westward down the shelf south of thecanyon and into the deeper water above thecanyon. In agreement with theory, the NLIWsappear to transform from waves of elevation towaves of depression at the canyon rim.Fig. 8 shows stratification, acoustic backscatter,
and velocity data collected over the Monterey Bayshelf south of the canyon during the first across-canyon run. The data shown were taken between121�52:10W, 36�46:10N and 121�52:70W, 36�47:50N(approximately 9 km along the canyon axis fromMoss Landing), over a 1.5-h period starting at15:52 15 August. To give as much detail aspossible in the narrow features a 90-s averaginginterval was used for the velocity (Fig. 8c and d).
6.1. Velocity structure
Although sidelobe interference prevents anADCP from measuring currents in the bottom15% of the water column, the top of the tallestwave on the shelf ð�1:28 kmÞ was clearly visible inthe north velocity record (Fig. 8c). This upperportion of the wave had a north velocity compo-nent approaching 0:1m s�1, against a southward
ARTICLE IN PRESS
G.S. Carter et al. / Continental Shelf Research 25 (2005) 1499–15201512
background flow of about �0:05m s�1. The NLIWsignature in the east velocity component (Fig. 8d)was less obvious. The observed portion of thetallest wave had an east velocity componentof �0:15m s�1 against a background flow of�0:1m s�1.The three off-shelf features also had correspond-
ing positive v-velocities4 up to 0:22m s�1, against asouthward background flow. The westward velo-cities associated with the off-shelf features at 0.13and 0.49 km were stronger than the surroundingbackground flow (uisw � �0:2m s�1 versusu � �0:1m s�1Þ. The feature 0.99 km from thecanyon rim had similar westward velocity to thebackground.The velocities within the NLIW measured by the
ADCP, allows us to determine the direction ofpropagation. The NLIWs we observed werepropagating north–westward. The ones on theshelf were slightly more west–northwest, while theone furtherest from the canyon rim (0.99 km) wastraveling more north–northwest. As the observa-tions were made on the shelf south of the canyon,north–westward velocity implies the NLIWs werepropagating downslope towards the canyon. Thisis opposite to the majority of solitary waveobservations to date, both near-surface (e.g.MacKinnon and Gregg, 2003b; Moum et al.,2003; Orr and Mignerey, 2003) and bottom(Klymak and Moum, 2003; Hosegood et al.,2004; Hosegood and van Haren, 2004; Scotti andPineda, 2004), which propagated towards the coast(upslope). Using mooring data, Bogucki et al.(1997) conclude that the observed bottom solitarywave was propagating across-slope against thebackground current.
4It should be noted that, although these three off-shelf
backscatter regions either lead or lag the similarly shaped
positive velocity regions, they appear to be manifestations of
the same features. The Biosonics acoustic imager points straight
down, while the ADCP beams are at 30� from the vertical. The
horizontal separation between the Biosonics and ADCP
measurement volumes at a depth H is given by H sinð30�Þ or
about 50m for a depth of 100m. This is consistent with the
separation observed between Fig. 8b and c. However, as an
ADCP assumes homogeneous flow over the area between the
beams, the velocities recorded may be biased low.
It is not possible to determine the phase speed ofthe wave from the particle velocity, however, asufficiently large wave will break by overturning(Lamb, 2002) requiring the particle velocity toexceed the phase speed (e.g. Orr and Mignerey,2003; Hosegood and van Haren, 2004). This setsan upper limit on the phase speed of � 0:2m s�1
on the shelf and � 0:3m s�1 off the shelf (assumingthe waves are breaking).
6.2. Waves of elevation
A 330-m section of the Biosonics image (from�1:51 to �1:18 km), which includes the fourlargest waves of elevation, is plotted with a one-to-one aspect ratio (Fig. 9). These waves wereclearly large-scale features with heights approach-ing half the water column, up to 40m. Theobserved horizontal scales were 50–100m. How-ever, the ship velocity ðUshipÞ throughout thissurvey was �0:5m s�1 in a similar direction tothe waves. Therefore, the actual horizontal scalesgiven by Lactual ¼ Lobserved ðUship � UwaveÞ=Uship
were shorter than observed. Without knowingthe phase speed of the wave we cannot estimateLactual , but using the particle velocity as an upperbound implies that the actual wavelengths are noless that 60% of the observed. These waves aresteep, with aspect ratios near one. Near-surfacesolitary waves of depression usually have muchlonger horizontal scales and hence smaller aspectratios (Ostrovsky and Stepanyants, 1989; Orr andMignerey, 2003). Bottom solitons observed on theOregon shelf were about 2–4 times wider forsimilar vertical scales, Lactual � 120m for a heightof 29m (Klymak and Moum, 2003). Christie et al.(1981) observed similar features in the atmosphericbottom boundary layer over Northern Australia.These waves were up to 400m high and hadassociated vertical velocity changes that couldexceed 16m s�1.Solitary wave trains evolve to be rank-ordered,
as the tallest waves propagate fastest (Osborne andBurch, 1980; Sandstrom and Oakey, 1995). Ourobservations (Fig. 8), however, show that thesecond wave ð�1:28 kmÞ was the tallest. Otherauthors have also found solitary wave trains thatwere not rank-ordered. Orr and Mignerey (2003)
ARTICLE IN PRESS
G.S. Carter et al. / Continental Shelf Research 25 (2005) 1499–1520 1513
observed that the tallest waves of elevation createdfrom the shoaling waves of depression were in themiddle of the train. Ramp et al. (2004) report thatsolitary wave packets generated by an M2 tidewere not rank-ordered. This lack of rank-ordersuggests the waves were observed close to theirgeneration sites.The passage of internal solitary waves displaces
isopycnals locally. Unfortunately, undersamplingmeant we profiled when the wave interface wasabout the same height above the bed (Fig. 9).(Because of aliasing associated with this under-sampling, isopycnals denser than 25 kgm�3 werenot plotted in Fig. 8 for distances o� 1 km).
6.3. Transformation to waves of depression
As the NLIWs were traveling north–westward,it follows that the patches of high backscatter andnorth–westward velocity over the canyon (0.13,0.49, and 0.99 km in Fig. 8b) were likely NLIWsthat propagated off the shelf into deep water.Theoretically, as the thickness of the layer belowthe pycnocline increases to greater than the surfacelayer, a solitary wave of elevation will transform toa wave of depression. For these data the transfor-mation should occur near 135-m water depth.Isopycnal displacements within the NLIW ob-served at 0.13 km, which spans this depth, indicateboth upward and downward displacement.Although our sampling was not designed to
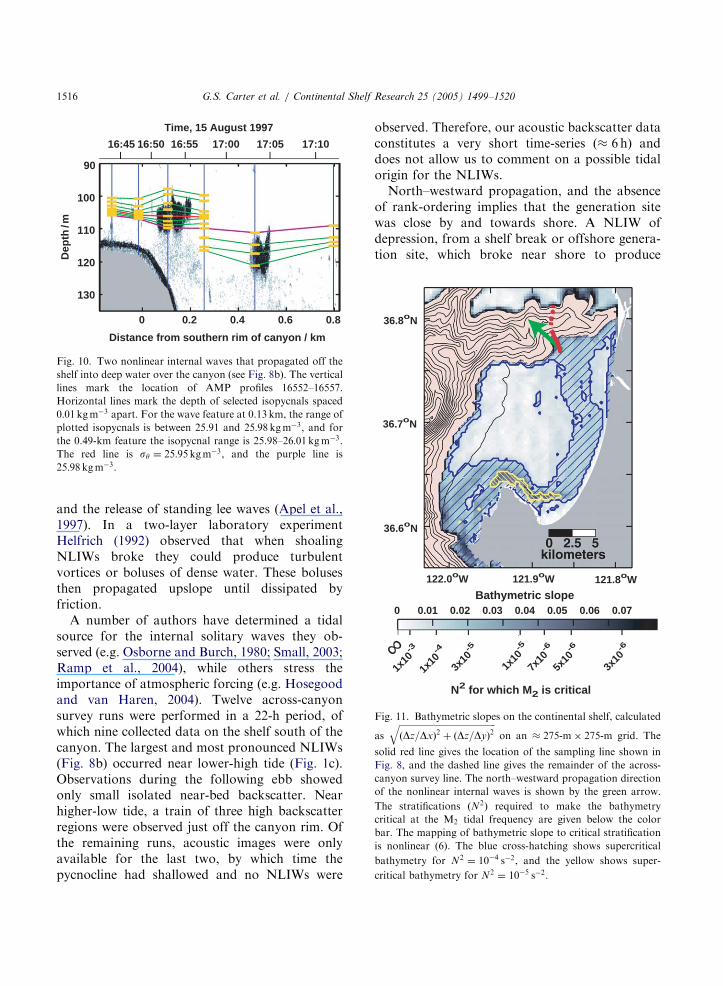
observe these NLIWs, we were fortunate to haveAMP profiles through the features at 0.13 and0.49 km. Fig. 10 plots selected isopycnals (spaced0:01 kgm�3 apart) over the acoustic backscatterimage.We first consider the wave at 0.49 km (Fig. 10).
The 25:98-kgm�3 isopycnal (contoured in purple)was fairly horizontal, whereas the isopycnalswithin the NLIW ðsy ¼ 25:99226:01 kgm�3Þ weredisplaced downward compared to neighboringprofiles. The 26:01-kgm�3 isopycnal was 4.7mdeeper than the neighboring onshore profile and6.1m deeper than the neighboring offshore profile.This local downward isopycnal displacementclassifies this feature as a wave of depression,which is in line with theory as the pycnocline basewas at 80 in 230m of water.
The NLIW at 0.13 km was more complicated.The 25:95-kgm�3 isopycnal (contoured in red) wasnearly horizontal through this wave. Lighterisopycnals (25.91–25:94 kgm�3) were displacedupward within the NLIW compared to neighbor-ing profiles. However, denser isopycnals(25.96–25:98 kgm�3) were displaced downward.We believe this mixed isopycnal signature (upwardand downward displacement) was because of thesignificant water depth changes associated with thecanyon rim. The leading edge of the NLIW was in150m of water, while the trailing edge was in120m. With the pycnocline between 55 and 80m(Fig. 8a), theory would predict a wave of depres-sion at the leading edge, and a wave of elevation atthe trailing edge. Therefore, we appear to haveobserved a NLIW transforming from a wave ofelevation to a wave of depression as it propagatedinto deeper water.The transition from wave of elevation to wave
of depression occurs over a shorter horizontalscale than the transformation from waves ofdepression to waves of elevation observed on theSouth China Sea shelf (Orr and Mignerey, 2003).This difference in scale may be due to thesignificantly steeper slope of the canyon wall(0.17) compared to the South China Sea shelf(0.016), or could be due to a fundamentaldifference in the transition mechanism betweenthe two directions. In particular, the waves ofelevation have a considerably shorter wavelengthas they approach the transition point than thewaves of depression.
6.4. Role in sediment transport
The most intense acoustic backscatter was onthe leading edge of the waves propagating acrossthe shelf (Fig. 9). Within the NLIWs, the back-scatter intensity was considerably lower (Fig. 9).Although we have no independent verification, theintense backscatter likely includes resuspendedsediments. The mooring data of Bogucki et al.(1997) showed a marked increase in beam attenua-tion coefficient (a measure of turbidity) coincidingwith the leading edge of the observed internalsolitary wave. Klymak and Moum (2003) foundelevated 880 nm optical backscatter corresponding
ARTICLE IN PRESS
G.S. Carter et al. / Continental Shelf Research 25 (2005) 1499–15201514

ARTICLE IN PRESS
40
60
80
100
Dep
th /m
-1.5 -1.45 -1.4 -1.35 -1.3 -1.25 -1.2
Distance from southern rim of canyon / km
15:54 15:56 15:58 16:00 16:02 16:04
Time, 15 August 1997
Fig. 9. A 330-m section including the main solitary-like wave features on the southern shelf observed during the first cross-canyon run
(see Fig. 8b). This figure is plotted with a one-to-one aspect ratio. Dissipation rates and density are overplotted for AMP profiles
16536–16540, the exact profile locations are uncertain within �5m. The short horizontal lines mark the depth of the
sy ¼ 25:4; 25:5; 25:6; 25:7, and 25:8 kgm�3 isopycnals.
G.S. Carter et al. / Continental Shelf Research 25 (2005) 1499–1520 1515
to resuspended fine silt and clay within a solitarywave train. Using sediment traps Hosegood et al.(2004) found the daily sediment flux increasedmore than 100-fold after the passage of a solitarywave train. They describe a ‘rotor’ with upwardvelocities at the leading edge of the solitary wave,which eroded the surface layer and exposed theunderlying nutrient rich sediment.Interestingly, the bottom NLIW located be-
tween �1:37 and �1:45 km had a discernableellipse-shaped region of lower backscatter at itscenter, completely surrounded by high backscat-ter. This may indicate a trapped core, which is apossible nonlinear solitary wave solution (Lamb,2003; Klymak and Moum, 2003), and wouldgreatly increase transport of fluids and particles.Strong sediment resuspension associated with
near-bottom NLIWs of elevation, combined withpropagation into the canyon, may be an efficientmechanism for removing sediment from the
Fig. 8. Data over the southern shelf from the first cross-canyon run
backscatter, (c) v (north) velocity, and (d) u (east) velocity. The
propagating nonlinear internal waves (see text). Panel b has dissipation
sy ¼ 24:8 and 26:2kgm�3 are overlayed in 0:2-kgm�3 intervals on eac
greater than 25kgm�3 are not plotted between �1:5 and �1km becau
AMP profiles 16537–16557 are marked.
Monterey Bay shelf. Below the NLIWs at 0.13and 0.49 km there was increased backscattersuggestive of entrained sediments settling out(Fig. 10).
6.5. Generation
It is unclear where the observed downslope-propagating bottom NLIWs were generated.Generally, coastal internal solitary waves areformed by nonlinear steepening of internal wavespropagating from a shelf break generation region(Sandstrom and Oakey, 1995), or by distantlygenerated internal waves propagating over theshelf break (Small, 2003). The resulting solitarywaves propagate upslope towards the coast.Alternative mechanisms include internal solitarywaves generated by and propagating upstreamaway from critical flow over a topographic feature(Melville and Helfrich, 1987; Bogucki et al., 1997),
(15:52 to 17:17, 15 August 1997). (a) Stratification, (b) acoustic
high backscatter regions are associated with north–westward
rate profiles overlayed for selected profiles. Isopycnals between
h panel, the heavier lines are sy ¼ 25 and 26 kgm�3. (Isopycnals
se of aliasing.) Along the top of each panel, the positions of the
ARTICLE IN PRESS
122.0oW 121.9oW 121.8oW
36.6oN
36.7oN
36.8oN
Bathymetric slope
1x10⁻⁴
3x10⁻⁵
1x10⁻⁵
7x10⁻⁶
5x10⁻⁶
3x10⁻⁶
N2 for which M2 is critical
∞1x
10-3
0 0.01 0.02 0.03 0.04 0.05 0.06 0.07
Fig. 11. Bathymetric slopes on the continental shelf, calculated
as
ffiffiffiffiffiffiffiffiffiffiffiffiffiffiffiffiffiffiffiffiffiffiffiffiffiffiffiffiffiffiffiffiffiffiffiffiffiffiffiffiffiffiffiffiðDz=DxÞ2 þ ðDz=DyÞ2
qon an � 275-m� 275-m grid. The
solid red line gives the location of the sampling line shown in
Fig. 8, and the dashed line gives the remainder of the across-
canyon survey line. The north–westward propagation direction
of the nonlinear internal waves is shown by the green arrow.
The stratifications ðN2Þ required to make the bathymetry
critical at the M2 tidal frequency are given below the color
bar. The mapping of bathymetric slope to critical stratification
is nonlinear (6). The blue cross-hatching shows supercritical
bathymetry for N2 ¼ 10�4 s�2, and the yellow shows super-
critical bathymetry for N2 ¼ 10�5 s�2.
0 0.2 0.4 0.6 0.8
90
100
110
120
130
Distance from southern rim of canyon / km
Dep
th /m
16:45 16:50 16:55 17:00 17:05 17:10
Time, 15 August 1997
Fig. 10. Two nonlinear internal waves that propagated off the
shelf into deep water over the canyon (see Fig. 8b). The vertical
lines mark the location of AMP profiles 16552–16557.
Horizontal lines mark the depth of selected isopycnals spaced
0:01 kgm�3 apart. For the wave feature at 0.13 km, the range of
plotted isopycnals is between 25.91 and 25:98 kgm�3, and for
the 0.49-km feature the isopycnal range is 25.98–26:01 kgm�3.
The red line is sy ¼ 25:95 kgm�3, and the purple line is
25:98 kgm�3.
G.S. Carter et al. / Continental Shelf Research 25 (2005) 1499–15201516
and the release of standing lee waves (Apel et al.,1997). In a two-layer laboratory experimentHelfrich (1992) observed that when shoalingNLIWs broke they could produce turbulentvortices or boluses of dense water. These bolusesthen propagated upslope until dissipated byfriction.A number of authors have determined a tidal
source for the internal solitary waves they ob-served (e.g. Osborne and Burch, 1980; Small, 2003;Ramp et al., 2004), while others stress theimportance of atmospheric forcing (e.g. Hosegoodand van Haren, 2004). Twelve across-canyonsurvey runs were performed in a 22-h period, ofwhich nine collected data on the shelf south of thecanyon. The largest and most pronounced NLIWs(Fig. 8b) occurred near lower-high tide (Fig. 1c).Observations during the following ebb showedonly small isolated near-bed backscatter. Nearhigher-low tide, a train of three high backscatterregions were observed just off the canyon rim. Ofthe remaining runs, acoustic images were onlyavailable for the last two, by which time thepycnocline had shallowed and no NLIWs were
observed. Therefore, our acoustic backscatter dataconstitutes a very short time-series ð� 6 hÞ anddoes not allow us to comment on a possible tidalorigin for the NLIWs.North–westward propagation, and the absence
of rank-ordering implies that the generation sitewas close by and towards shore. A NLIW ofdepression, from a shelf break or offshore genera-tion site, which broke near shore to produce
ARTICLE IN PRESS
G.S. Carter et al. / Continental Shelf Research 25 (2005) 1499–1520 1517
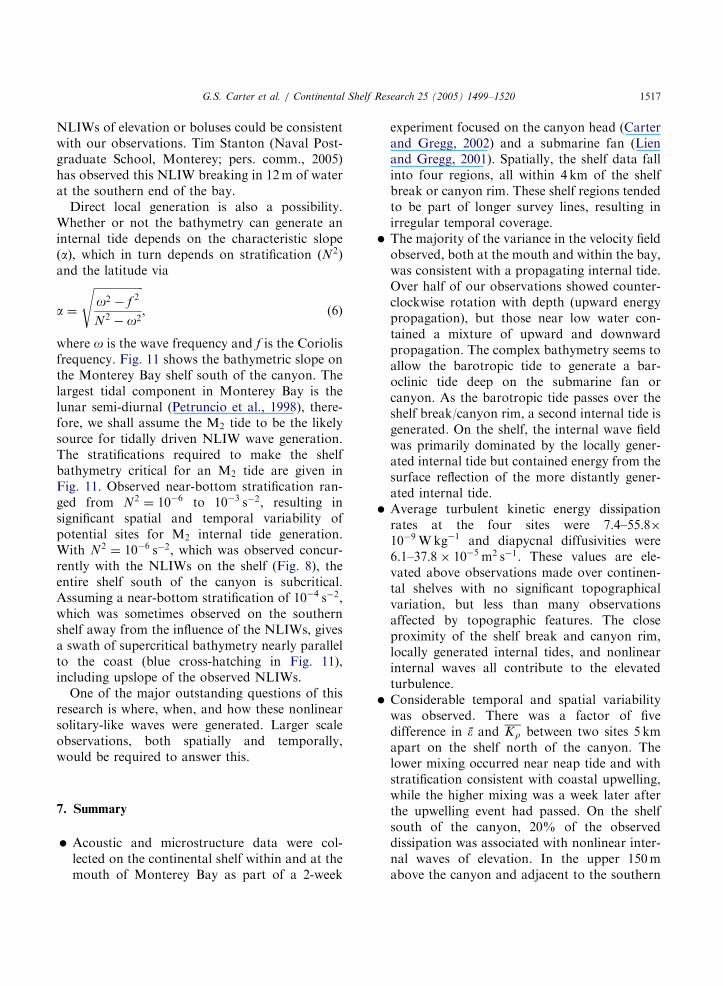
NLIWs of elevation or boluses could be consistentwith our observations. Tim Stanton (Naval Post-graduate School, Monterey; pers. comm., 2005)has observed this NLIW breaking in 12m of waterat the southern end of the bay.Direct local generation is also a possibility.
Whether or not the bathymetry can generate aninternal tide depends on the characteristic slopeðaÞ, which in turn depends on stratification ðN2Þ
and the latitude via
a ¼
ffiffiffiffiffiffiffiffiffiffiffiffiffiffiffiffiffiffio2 � f 2
N2 � o2
s, (6)
where o is the wave frequency and f is the Coriolisfrequency. Fig. 11 shows the bathymetric slope onthe Monterey Bay shelf south of the canyon. Thelargest tidal component in Monterey Bay is thelunar semi-diurnal (Petruncio et al., 1998), there-fore, we shall assume the M2 tide to be the likelysource for tidally driven NLIW wave generation.The stratifications required to make the shelfbathymetry critical for an M2 tide are given inFig. 11. Observed near-bottom stratification ran-ged from N2 ¼ 10�6 to 10�3 s�2, resulting insignificant spatial and temporal variability ofpotential sites for M2 internal tide generation.With N2 ¼ 10�6 s�2, which was observed concur-rently with the NLIWs on the shelf (Fig. 8), theentire shelf south of the canyon is subcritical.Assuming a near-bottom stratification of 10�4 s�2,which was sometimes observed on the southernshelf away from the influence of the NLIWs, givesa swath of supercritical bathymetry nearly parallelto the coast (blue cross-hatching in Fig. 11),including upslope of the observed NLIWs.One of the major outstanding questions of this
research is where, when, and how these nonlinearsolitary-like waves were generated. Larger scaleobservations, both spatially and temporally,would be required to answer this.
7. Summary
�
Acoustic and microstructure data were col-lected on the continental shelf within and at themouth of Monterey Bay as part of a 2-weekexperiment focused on the canyon head (Carterand Gregg, 2002) and a submarine fan (Lienand Gregg, 2001). Spatially, the shelf data fallinto four regions, all within 4 km of the shelfbreak or canyon rim. These shelf regions tendedto be part of longer survey lines, resulting inirregular temporal coverage.
�
The majority of the variance in the velocity fieldobserved, both at the mouth and within the bay,was consistent with a propagating internal tide.Over half of our observations showed counter-clockwise rotation with depth (upward energypropagation), but those near low water con-tained a mixture of upward and downwardpropagation. The complex bathymetry seems toallow the barotropic tide to generate a bar-oclinic tide deep on the submarine fan orcanyon. As the barotropic tide passes over theshelf break/canyon rim, a second internal tide isgenerated. On the shelf, the internal wave fieldwas primarily dominated by the locally gener-ated internal tide but contained energy from thesurface reflection of the more distantly gener-ated internal tide.�
Average turbulent kinetic energy dissipationrates at the four sites were 7.4–55:8�10�9 Wkg�1 and diapycnal diffusivities were6.1–37:8� 10�5 m2 s�1. These values are ele-vated above observations made over continen-tal shelves with no significant topographicalvariation, but less than many observationsaffected by topographic features. The closeproximity of the shelf break and canyon rim,locally generated internal tides, and nonlinearinternal waves all contribute to the elevatedturbulence.�
Considerable temporal and spatial variabilitywas observed. There was a factor of fivedifference in � and Kr between two sites 5 kmapart on the shelf north of the canyon. Thelower mixing occurred near neap tide and withstratification consistent with coastal upwelling,while the higher mixing was a week later afterthe upwelling event had passed. On the shelfsouth of the canyon, 20% of the observeddissipation was associated with nonlinear inter-nal waves of elevation. In the upper 150mabove the canyon and adjacent to the southern
ARTICLE IN PRESS
G.S. Carter et al. / Continental Shelf Research 25 (2005) 1499–15201518
canyon rim, almost half the observed dissipa-tion was associated with nonlinear internalwaves.
�
The open-ocean scaling of shear variance andstratification to dissipation (Gregg, 1989), aswell as a recently developed shelf scaling(MacKinnon and Gregg, 2003b), were com-pared to our microstructure observations withthe nonlinear internal waves excluded. Neitherscaling estimated the dissipation on the Mon-terey shelf well. The MacKinnon–Gregg modelhad the correct functional dependence on N andS, i.e. dissipation increased with increasingshear and increasing stratification. The empiri-cal constant �0 required to give the sameaveraged model dissipation as observed wasnine times that given by MacKinnon and Gregg(2003b). This may suggest some underlyingphysics is missing. The proximity of ourobservations to an internal tide generationregion, where unstable locally generated highmodes can be expected to contain energy, meantthe wave–wave interaction mechanisms under-lying these parameterizations may not bedominant locally.�
An unexpected, but important finding was theexistence of what we believe to be downslope-propagating nonlinear internal solitary-likewaves. Large-amplitude near-bottom waves ofelevation were observed propagating north–westward across the shelf south of the canyon.These high-aspect-ratio waves had verticalscales up to 40m. Once they reached the canyonrim they propagated into deep water, trans-forming into waves of depression. Acousticbackscatter images suggest that sediment en-trained by the waves of elevation on the shelfsettles out over the canyon. Turbulent kineticenergy dissipation rates in the solitary-likewaves are elevated compared to the localbackground levels. Average � levels were higherin the waves of depression compared to thewaves of elevation.Further observations will be required to under-stand the processes involved in this complexcoastal mixing environment.
Acknowledgements
We are grateful to Jack Miller, Earl Krause,Gordy Welsh, Jen MacKinnon, Jody Klymak, andthe crew of R/V Point Sur for assistance in datacollection. Discussions with Dave Winkel, EricKunze, Jen Mackinnon, Matthew Alford, JodyKlymak, Oliver Fringer, and two anonymousreviewers were helpful. This research was fundedby the National Science Foundation grantOCE9633067.
References
Apel, J.R., Badiey, M., Chiu, C.-S., Finette, S., Headrick, R.,
Kemp, J., Lynch, J.F., Newhall, A., Orr, M.H., Pasewark,
B.H., Tielbuerger, D., Turgut, A., von der Heydt, K., Wolf,
S., 1997. An overview of the 1995 SWARM shallow-water
internal wave acoustic scattering experiment. IEEE Journal
of Oceanic Engineering 22 (3), 465–500.
Baines, P.G., 1982. On internal tide generation models. Deep-
Sea Research 29 (3A), 307–338.
Bogucki, D., Dickey, T., Redekopp, L.G., 1997. Sediment
resuspension and mixing by resonantly generated internal
solitary waves. Journal of Physical Oceanography 27 (7),
1181–1196.
Breaker, L.C., Broenkow, W.W., 1994. The circulation of
Monterey Bay and related processes. In: Ansell, A.D.,
Gibson, R.N., Barnes, M. (Eds.), Oceanography and
Marine Biology: An Annual Review, vol. 32. UCL Press,
pp. 1–64.
Carter, G.S., Gregg, M.C., 2002. Intense, variable mixing near
the head of Monterey Submarine Canyon. Journal of
Physical Oceanography 32 (11), 3145–3165.
Christie, D.R., Muirhead, K.J., Clarke, R.H., 1981. Solitary
waves in the lower atmosphere. Nature 293 (5827), 46–49.
Egbert, G.D., Ray, R.D., 2000. Significant dissipation of tidal
energy in the deep ocean inferred from satellite altimeter
data. Nature 405, 775–778.
Gargett, A.E., 1990. Do we really know how to scale the
turbulent kinetic energy dissipation rate � due to breaking ofoceanic internal waves? Journal of Geophysical Research 95
(C9), 15971–15974.
Garrett, C.J.R., Munk, W.H., 1972. Space-time scales of
internal waves. Geophysical and Astrophysical Fluid
Dynamics 2, 225–264.
Garrett, C.J.R., Munk, W.H., 1975. Space-time scales of
internal waves: a progress report. Journal of Geophysical
Research 80, 291–297.
Gill, A.E., 1982. Atmosphere–Ocean Dynamics. Academic
Press, New York 662pp.
Gregg, M.C., 1989. Scaling turbulent dissipation in the
thermocline. Journal of Geophysical Research 94 (C7),
9686–9698.
ARTICLE IN PRESS
G.S. Carter et al. / Continental Shelf Research 25 (2005) 1499–1520 1519
Gregg, M.C., Ozsoy, E., 1999. Mixing on the Black Sea shelf
north of the Bosphorous. Geophysical Research Letters 26
(13), 1869–1872.
Gregg, M.C., Winkel, D.P., Mackinnon, J.A., Lien, R.-C., 1999.
Mixing over shelves and slopes. In: Muller, P., Henderson, D.
(Eds.), Dynamics of oceanic internal gravity waves II,
Proceedings, Hawaiian Winter Workshop, January 18–22,
1999. University of Hawaii at Manoa, pp. 35–42.
Helfrich, K.R., 1992. Internal solitary wave breaking and run-
up on a uniform slope. Journal of Fluid Mechanics 243,
133–154.
Henyey, F.S., Wright, J., Flatte, S.M., 1986. Energy and action
flow through the internal wave field: an eikonal approach.
Journal of Geophysical Research 91, 8487–8495.
Holloway, P.E., Merrifield, M.A., 1999. Internal tide genera-
tion by seamounts, ridges, and islands. Journal of Geophy-
sical Research 104 (C11), 25,937–25,951.
Horne, E.P., Loder, J.W., Naime, C.E., Oakey, N.S., 1996.
Turbulence dissipation rates and nitrate supply in the upper
water column on Georges Bank. Deep-Sea Research II 43
(7–8), 1683–1712.
Hosegood, P., van Haren, H., 2004. Near-bed solibores over the
continental slope in the Faeroe–Shetland Channel. Deep-
Sea Research II 51, 2943–2971.
Hosegood, P., Bonnin, J., van Haren, H., 2004. Solibore-
induced sediment resuspension in the Faeroe–Shetland
Channel. Geophysical Research Letters 31, L09301.
Klymak, J.M., Moum, J.N., 2003. Internal solitary waves of
elevation advancing on a shoaling shelf. Geophysical
Research Letters 30 (20), 2045.
Kunze, E., Rosenfeld, L.K., Carter, G.S., Gregg, M.C., 2002.
Internal waves in Monterey Submarine Canyon. Journal of
Physical Oceanography 32 (6), 1890–1913.
Lamb, K.G., 2002. A numerical investigation of solitary
internal waves with trapped cores formed via shoaling.
Journal of Fluid Mechanics 451, 109–144.
Lamb, K.G., 2003. Shoaling solitary waves: on a criterion for
the formation of waves with trapped cores. Journal of Fluid
Mechanics 478, 81–100.
Leaman, K.D., Sanford, T.B., 1975. Vertical energy propaga-
tion of inertial waves: a vector spectral analysis of velocity
profiles. Journal of Geophysical Research 80 (15),
1975–1978.
Ledwell, J.R., Duda, T.F., Sundermeyer, M.A., Seim, H.E.,
2004. Mixing in a coastal environment, Part I: a view from
dye dispersion. Journal of Geophysical Research 109 (C10),
C10013.
Lien, R.-C., Gregg, M.C., 2001. Observations of turbulence in a
tidal beam and across a coastal ridge. Journal of Geophy-
sical Research 106 (C3), 4575–4591.
Liu, A.K., Chang, Y.S., Hsu, M.-K., Liang, N.K., 1998.
Evolution of nonlinear internal waves in the East and South
China Seas. Journal of Geophysical Research 103 (C4),
7995–8008.
MacKinnon, J.A., Gregg, M.C., 2003a. Shear and baroclinic
energy flux on the summer New England shelf. Journal of
Physical Oceanography 33 (7), 1462–1475.
MacKinnon, J.A., Gregg, M.C., 2003b. Mixing on the late-
summer New England shelf—solibores, shear and stratifica-
tion. Journal of Physical Oceanography 33 (7), 1476–1492.
MacKinnon, J.A., Gregg, M.C., 2005. Spring mixing: turbu-
lence and internal waves during restratification on the New
England shelf. Journal of Physical Oceanography, accepted
for publication.
Melville, W.K., Helfrich, K.R., 1987. Transcritical two-layer
flow over topography. Journal of Fluid Mechanics 178,
31–52.
Moum, J.N., Farmer, D.M., Smyth, W.D., Armi, L., Vagle, S.,
2003. Structure and generation of turbulence at interfaces
strained by internal solitary waves propagating shoreward
over the continental shelf. Journal of Physical Oceanogra-
phy 33 (10), 2093–2112.
Munk, W., 1997. Once again: once again—tidal friction.
Progress Oceanography 40 (1), 7–35.
Nash, J.D., Moum, J.N., 2001. Internal hydraulic flows on the
continental shelf: high drag states over a small bank.
Journal of Geophysical Research 106 (C3), 4593–4611.
Orr, M.H., Mignerey, P.C., 2003. Nonlinear internal waves in
the South China Sea: observation of the conversion of
depression internal waves to elevation internal waves.
Journal of Geophysical Research 108 (C3), 3064.
Osborne, A.R., Burch, T.L., 1980. Internal solitons in the
Andaman Sea. Science 208 (4443), 451–460.
Osborn, T.R., 1980. Estimates of the local rate of vertical
diffusion from dissipation measurements. Journal of Phy-
sical Oceanography 10, 83–89.
Osborn, T.R., Crawford, W.R., 1980. An airfoil probe for
measuring turbulent velocity fluctuations in water. In:
Dobson, F., Hasse, L., Davis, R. (Eds.), Air–Sea Interac-
tion: Instruments and Methods. Plenum Press, New York,
pp. 369–386.
Ostrovsky, L.A., Stepanyants, Y.A., 1989. Do internal
solitons exist in the ocean? Review of Geophysics 27 (3),
293–310.
Petruncio, E.T., Rosenfeld, L.K., Paduan, J.D., 1998. Observa-
tions of the internal tide in Monterey Canyon. Journal of
Physical Oceanography 28 (10), 1873–1903.
Pingree, R.D., New, A.L., 1989. Downward propagation on
internal tidal energy into the Bay of Biscay. Deep-Sea
Research 36 (5), 735–758.
Prinsenberg, S.J., Rattray Jr., M., 1975. Effects of continental
slope and variable Brunt–Vaisala frequency on the coastal
generation of internal tides. Deep-Sea Research 22,
251–263.
Prinsenberg, S.J., Wilmot, W.L., Rattray Jr., M., 1974.
Generation and dissipation of coastal internal tides. Deep-
Sea Research 21, 263–281.
Ramp, S.R., Tang, D., Duda, T.F., Lynch, J.F., Liu, A.K.,
Chiu, C.-S., Bahr, F., Kim, H.-R., Yang, Y.J., 2004.
Internal solitons in the Northeastern South China Sea part
I: sources and deep water propagation. IEEE Journal of
Ocean Engineering 29 (4), 1157–1181.
Rosenfeld, L.K., Schwing, F.B., Garfield, N., Tracy, D.E.,
1994. Bifurcating flow from an upwelling center: a cold

ARTICLE IN PRESS
G.S. Carter et al. / Continental Shelf Research 25 (2005) 1499–15201520
water source for Monterey Bay. Continental Shelf Research
14 (9), 931–964.
Rudnick, D.L., Boyd, T.J., Brainard, R.E., Carter, G.S.,
Egbert, G.D., Gregg, M.C., Holloway, P.E., Klymak,
J.M., Kunze, E., Lee, C.M., Levine, M.D., Luther, D.S.,
Martin, J.P., Merrifield, M.A., Moum, J.N., Nash, J.D.,
Pinkel, R., Rainville, L., Sanford, T.B., 2003. From tides to
mixing along the Hawaiian Ridge. Science 301, 355–357.
Sandstrom, H., Oakey, N.S., 1995. Dissipation in internal tides
and solitary waves. Journal of Physical Oceanography 25
(4), 604–614.
Scotti, A., Pineda, J., 2004. Observation of very large and steep
internal waves of elevation near the Massachusetts coast.
Geophysical Research Letters 31, L22307.
Sharples, J., Moore, C.M., Abraham, E.R., 2001. Internal tide
dissipation, mixing, and vertical nitrate flux at the shelf edge
of NE New Zealand. Journal of Geophysical Research 106
(C7), 14069–14081.
Shea, R.E., Broenkow, W.W., 1982. The role of internal tides in
nutrient enrichment of Monterey Bay, California. Estuar-
ine, Coastal and Shelf Science 15 (1), 57–66.
Simpson, J.H., Crawford, W.R., Rippeth, T.P., Campbell,
A.R., Cheok, J.V.S., 1996. The vertical structure of
turbulent dissipation in shelf seas. Journal of Physical
Oceanography 26 (8), 1579–1590.
Small, J., 2003. Refraction and shoaling of nonlinear internal
waves at the Malin Shelf break. Journal of Physical
Oceanography 33 (12), 2657–2674.
Sundermeyer, M.A., Ledwell, J.R., 2001. Lateral dispersion
over the continental shelf: analysis of dye release experi-
ments. Journal of Geophysical Research 106 (C5),
9603–9621.
Wesson, J.C., Gregg, M.C., 1994. Mixing at Camarinal Sill in
the Strait of Gibraltar. Journal of Geophysical Research 99,
9847–9878.


![4.1.1] plane waves](https://static.fdokumen.com/doc/165x107/6322513728c445989105b845/411-plane-waves.jpg)