Catenin Signaling Promotes Proliferation of Progenitor Cells in the Adult Mouse Subventricular Zone
Upload
independentCategory
view
2download
0
www.elsevier.com/locate/ydbio
Developmental Biology 270 (2004) 200–213
Glial progenitors of the neonatal subventricular zone differentiate
asynchronously, leading to spatial dispersion of glial clones and to the
persistence of immature glia in the adult mammalian CNS
Marielba Zerlin,1 Ana Milosevic, and James E. Goldman*
Department of Pathology, College of Physicians and Surgeons, Columbia University, New York, NY 10032, USA
The Center for Neurobiology and Behavior, College of Physicians and Surgeons, Columbia University, New York, NY 10032, USA
Received for publication 12 July 2002, revised 26 February 2004, accepted 27 February 2004
Available online 12 April 2004
Abstract
The subventricular zone (SVZ) of the developing mammalian forebrain gives rise to astrocytes and oligodendrocytes in the neocortex and
white matter, and neurons in the olfactory bulb in perinatal life. We have examined the developmental fates and spatial distributions of the
descendants of single SVZ cells by infecting them in vivo at postnatal day 0–1 (P0–1) with a retroviral ‘‘library’’. In most cases, individual
SVZ cells gave rise to either oligodendrocytes or astrocytes, but some generated both types of glia. Members of glial clones can disperse
widely through the gray and white matter. Progenitors continued to divide after stopping migration, generating clusters of related cells.
However, the progeny of a single SVZ cell does not differentiate synchronously: individual clones contained both mature and less mature glia
after short or long intervals. For example, progenitors that settled in the white matter generated three types of clonal oligodendrocyte clusters:
those composed of only myelinating oligodendrocytes, of both myelinating oligodendrocytes and non-myelinating oligodendrocytes, or of
only non-myelinating cells of the oligodendrocyte lineage. Thus, some progenitors do not fully differentiate, but remain immature and may
continue to cycle well into adult life.
D 2004 Elsevier Inc. All rights reserved.
Keywords: Glia; Astrocytes; Oligodendrocytes; SVZ; Cell lineage
Introduction
The subventricular zone (SVZ) of the mammalian fore-
brain contains mitotically active, migratory progenitors that
give rise to many of the astrocytes and oligodendrocytes of
the neocortex, subcortical white matter, and deep gray
matter (Altman, 1966; Kakita and Goldman, 1999; Levison
and Goldman, 1993; Luskin and Mc Dermott, 1994; Parna-
velas, 1999; Paterson et al., 1973; Privat, 1975). Retroviral
lineage studies indicate that progenitors generate tightly knit
clonal clusters of glia in the neocortex (Grove et al., 1993;
Levison and Goldman, 1993; Luskin and Mc Dermott,
1994; Luskin et al., 1993; Parnavelas, 1999), indicating that
0012-1606/$ - see front matter D 2004 Elsevier Inc. All rights reserved.
doi:10.1016/j.ydbio.2004.02.024
* Corresponding author. Department of Pathology, College of Physi-
cians and Surgeons, Columbia University, 630 West 168th Street, New
York, NY 10032. Fax: +1-212-305-4548.
E-mail address: [email protected] (J.E. Goldman).1 Present address: GliaMed Inc., 3960 Broadway, New York, NY
10032, USA.
a given cell continues to divide after it has stopped migrat-
ing. The majority of these clusters have appeared homoge-
neous with respect to glial type, although a smaller
proportion contain both astrocytes and oligodendrocytes.
However, these studies would not have identified glial
clones, the members of which were separated in space by
more than the confines of a ‘‘cluster’’. Thus, the full extent
of spatial dispersion and the degree of cellular heterogeneity
of glial clones have not been thoroughly explored.
Another issue not approached in previous studies con-
cerns whether the descendants of a single progenitor differ-
entiate synchronously or not. Is a given clone made up
entirely of mature astrocytes or myelinating oligodendro-
cytes? The asynchronous differentiation of progenitors
would result in clonal mixtures of mature and immature glia,
leading to a plausible explanation for the continued presence
of immature cells in the adult CNS (Gensert and Goldman,
1996, 2001; Levison et al., 1999; McCarthy and Leblond,
1988; Wolswijk and Noble, 1989).
M. Zerlin et al. / Developmental Biology 270 (2004) 200–213 201
In the present study, we address the issue of clonal
dispersion and asynchronous differentiation by genetically
labeling early postnatal SVZ progenitors in vivo with a
retroviral library (Walsh and Cepko, 1992), so that their
progeny could be identified later in development regardless
of their location in the brain. Our results indicate that SVZ
progenitors can give rise to clones that disperse spatially and
that progenitors can generate both homogeneous and het-
erogeneous glial populations, although the former predom-
inate. The descendants of a single SVZ cell do not always
differentiate synchronously in vivo. Thus, some members of
oligodendrocyte clones do not differentiate into myelinating
oligodendrocytes, but rather remain as non-myelinating
cells of the oligodendrocyte lineage. In fact, some clones
were composed entirely of non-myelinating cells or mix-
tures of myelinating and non-myelinating cells as much as 2
months after retroviral labeling.
Materials and methods
Retroviral labeling of SVZ cells in vivo by stereotactic
injection
SVZ labeling by stereotactic injection into Sprague–
Dawley rats (on P0–1, the day of birth being P0) was
performed as described (Zerlin et al., 1995). Protocols were
approved by the University Animal Institute Care Commit-
tee. At the appropriate times after injection, animals were
anesthetized and euthanized by intracardiac perfusion of
tissue culture medium containing heparin followed by
paraformaldehyde. Brains were sectioned at 100-Am inter-
vals and X-gal histochemistry was performed (Levison and
Goldman, 1993; Zerlin et al., 1995). Before PCR analysis,
maps of each of the brains were constructed indicating the
exact location of each of the labeled cells and each cell
identified by morphology and photographed.
Low titer labeling of SVZ cells in vivo to obtain brains for
PCR analysis
Different dilutions of the retrovirus library were used to
label SVZ cells in vivo in P0–1 rats to determine the
appropriate dilution that consistently would label only a
few cells per brain. One to 2 days after the injection, the
animals were perfused and the brains processed for X-gal
histochemistry (Levison and Goldman, 1993; Zerlin et al.,
1995). Either 1:60 or 1:90 dilutions of the library
(corresponding to titers of 8 � 103 and 5 � 103 CFU/ml,
respectively, as determined by infection of NIH 3T3 cells in
the absence of polybrene) labeled only a few, on average no
more than five, SVZ cells per brain. These dilutions were
alternated in labeling experiments to obtain brains labeled at
low titer to use in the PCR analysis. To control for
experimental variation, half of the injected animals in every
labeling experiment (comprised of 10–14 animals) were
analyzed 1 day later to monitor the number of X-gal-labeled
SVZ cells per brain. If these brains contained only a few
labeled cells, then the rest of the injected animals would be
analyzed after either a few days or 4–7 weeks.
PCR analysis of retrovirally infected cells
PCR analysis was carried out essentially as previously
described (Walsh, 1995; Walsh and Cepko, 1992) with
certain modifications. Dissected X-gal-labeled cells were
digested overnight at 55–60jC in 12 Al digestion buffer
containing 0.4 mg/ml proteinase K (Sigma) in 10 mM Tris–
HCl pH 8.3, 0.5% Tween 20. Digested samples were then
incubated at 85jC for 20 min, subsequently microwaved at
full power for 3 min, and then chilled on ice before
proceeding with the first PCR amplification reaction (PCR
I): 85jC for 2 min, then the addition of 1 unit of Amplitaq
DNA polymerase (Perkin-Elmer) per sample in 20 Al of PCRI reaction mix containing 10 mM Tris–HCl (pH 8.3), 50 mM
KCl, 0.1% gelatin, 2.5 mMMgCl2, 1 AM each of the external
primers PBR-5 and BND-4, 200 AM each of dA, dC, dG, and
dTTP; then the reaction continued at 94jC for 30 s, 50jC for
3 min, 72jC for 2 min (45 cycles), and 72jC for 7 min. A
second PCR reaction (PCR II) was carried out using the
products of the first PCR as templates. Each of the PCR I
reactions was diluted one in a hundred in 40 Al of PCR II
reaction mix containing 10 mM Tris–HCl (pH 8.3), 50 mM
KCl, 0.5 mM MgCl2, 0.01% gelatin, 0.2 AM each of the
internal nesting primers PBR-4 and BND-3, 10% glycerol,
150 AM each of dA, dC, dG, and dTTP, and 0.025 units/Al (1unit/reaction) of Amplitaq DNA polymerase (Perkin-Elmer)
and amplified at 94jC for 30 s, 55jC for 3 min, 72jC for 2
min (30 cycles), and then 72jC for 7 min. Products from
PCR II amplification were characterized by restriction en-
zyme digestion and agarose gel electrophoresis of the diges-
tion products. All incubations were performed under mineral
oil. In each experiment, 13% of the samples were represented
by negative controls containing unlabeled tissue located
several millimeters away from X-gal-labeled cells to monitor
the specificity of the PCR amplification.
Characterization of the retrovirus library with regard to its
complexity
Appropriate use of the retroviral library strategy requires
that all members of the library are approximately equally
represented. That is, no one or a few members are highly
overrepresented and therefore more likely to occur in any
random selection. To investigate insert representations in the
library, we examined labeled cells selected at random in
brains that were labeled at a titer at least 50 times higher than
the one used in brain B5. These brains also contained
mixtures of different retroviral integrates. A total of 46
labeled cells were selected at random from four of these
brains (out of many hundreds of X-gal-labeled cells) for PCR
analysis and products were recovered from 32 cells. We

M. Zerlin et al. / Developmental Biology 270 (2004) 200–213202
recovered four cells, each having a different insert from the
first brain, seven cells representing six different inserts from
the second, 14 cells representing nine different inserts from
the third, and three cells, each with a different insert, from the
fourth. In addition, as noted above, inserts recovered from
B5 were all different from each other and different from
those recovered from M1, B3, and B4. Thus, we have no
indication that the library is skewed toward a few members.
Immunocytochemistry
In a separate series of experiments, we injected a green-
fluorescent protein (GFP) encoding retrovirus into the same
region of the SVZ as we labeled with the ‘‘library’’. The
distribution and characteristics of cells labeled with this virus
are the same as those labeled with the beta-galactosidase
encoding virus used in our previous studies and in this study
(for comparison, see Kakita and Goldman, 1999; Suzuki and
Goldman, 2003). Five to 7 weeks after the injection of the
GFP retrovirus, animals were euthanized and perfused as
described above, and brains were immersed in 4% parafor-
maldehyde overnight and transferred to 20% sucrose for
cryoprotection. The GFP-labeled cells were characterized
further on frozen sections using the antibodies to CNPase
(diluted 1:100, Sternberger Monoclonals Incorporated, MD),
NG2 (1:400 dilution, a gift from Dr. Stallcup), PDGFRa
(1:100, Santa Cruz, CA), and the Yp form of glutathione-S-
transferase (1:50, Biotrin). Sections were incubated over-
night at 4jC in primary antibodies diluted in 5% normal goat
serum and 0.25% Triton X-100 in PBS. Sections were
Fig. 1. Antigenic characterization of retroviral-labeled cells. The clonal progeny o
after injection into lateral SVZ at P0–1. (a) Clone in the white matter consisted of
immature oligodendrocyte (arrow) that was not labeled with antibodies to NG2 (
cortex consisted of four ‘‘lacy’’ oligodendrocytes, three of which were labeled w
example of an immature cell found in the white matter that did not express NG2 o
4a1. Scale bar: 10 Am.
washed in PBS and appropriate fluorescent secondary anti-
bodies were applied. The secondary antibodies used were
conjugated to TRITC or Cy5 (Chemicon International Inc.,
Temecula, CA). After completing the immunolabeling, sec-
tions were mounted and examined on an LSM 510 META
laser scanning confocal microscope attached to the Zeiss
Axiovert 200 inverted microscope (Carl Zeiss, Inc., Thorn-
wood, NY), as described before (Milosevic and Goldman,
2002). Images were processed in Adobe PhotoShop 7.0.
Results
Classification of retrovirally labeled glia
To classify the various glial types in the clones, we relied
on both morphology and antigen markers. Mature astrocytes
were easily identified by their bushy appearance and contacts
with blood vessels or the pial surface (Figs. 2c and 4d; for
many examples of retrovirally labeled astrocytes, see Kakita
and Goldman, 1999; Levison and Goldman, 1993; Levison
et al., 1999; Luskin and Mc Dermott, 1994; Parnavelas,
1999). Immature astrocytes were discerned because of their
early blood vessel contacts (Zerlin and Goldman, 1997).
Myelinating oligodendrocytes displayed the h-galactosidaseor GFP in long thin, usually parallel processes because the
reporter protein is found in the oligodendrocyte loops of
myelin sheaths (Figs. 2f and 4a and the above-noted refer-
ences). Myelinating oligodendrocytes were also immunola-
beled for CNPase (Fig. 1a). We also found oligodendrocytes
f progenitors initially labeled with GFP retrovirus was analyzed 5–7 weeks
mature, myelinating oligodendrocyte (arrowheads), expressing CNPase, and
red) or CNPase (blue). (b) Clone on the border between white matter and
ith NG2 antibody (arrowheads), while the fourth was not (arrow). (c) An
r CNPase (not shown). Similar cells, stained with X-gal, were shown in Fig.
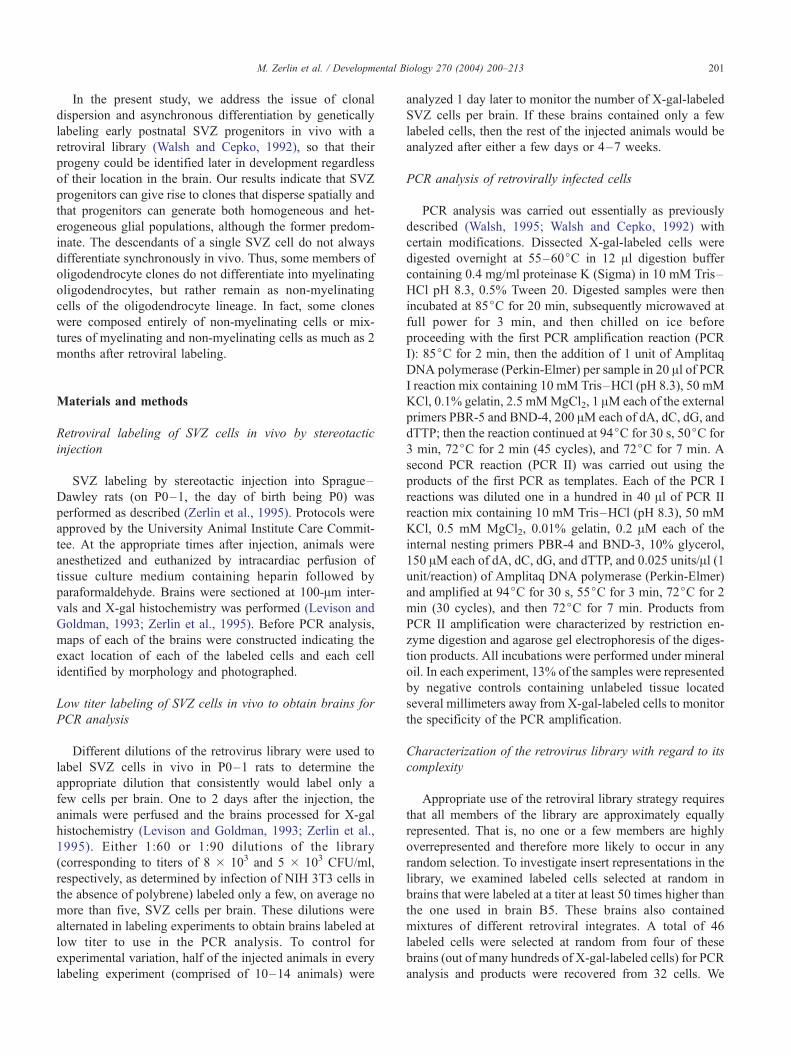
Fig. 2. Clonal analysis of retrovirus-labeled cells in brain M1 by PCR. X-
gal-labeled cells were identified morphologically at 5 weeks postinjection,
their positions mapped, and each cell isolated and analyzed by PCR. (Panel
a) Three 100-Am coronal sections (1 being the most anterior) around the
injection site showing the location of labeled cells: f, immature cell; *,
astrocyte; o, early myelinating oligodendrocyte, and ., myelinating
oligodendrocyte. (Panel b) An agarose gel showing restriction enzyme
digests of PCR products corresponding to each of the X-gal-labeled cells in
panel a. Lanes 1–5 correspond to cells in section 1; lanes 6 and 7 from cells
in section 2; and lanes 8–11 from cells in section 3. In lanes 9 and 10, PCR
products were from two cells dissected together because they were next to
each other, while the rest of the samples correspond to single cells. Control
samples: u, undigested PCR product; n, PCR amplification of unlabeled
tissue. (Panels c– f) Examples of the different X-gal-labeled cells in this
brain: c, protoplasmic astrocyte; d, immature cell from section 1; e, early
myelinating oligodendrocyte; f, cluster of 10 myelinating oligodendrocytes
(six of them yielded PCR products, panel b, lanes 8–11). Scale bar: 60 Amfor panels c, d, and e; 120 Am for panel f.
M. Zerlin et al. / Developmental Biology 270 (2004) 200–213 203
in an early stage of myelination, in which a round cell body
was attached to thin processes, some of which branched in a
‘‘T’’ form (Fig. 2e). As described below, however, many of
the oligodendrocyte clones contained non-myelinating cells.
These fit into several morphological categories: (1) cells with
round somas and many thin, branching processes, often
arranged radially, giving the cell a ‘‘lacy’’ appearance (Figs.
1b and 4c, and see Levison et al., 1999); (2) cells with somas
larger than myelinating oligodendrocytes, but with very few,
short processes (Fig. 1a, arrow, and see Levison et al., 1999);
and (3) unipolar or bipolar cells that looked like immature
glia (Fig. 1c).
It would have been technically problematic to perform h-galactosidase staining, immunostaining for several different
antigens, and then PCR on the same cells, so we used another
strategy to help define these non-myelinating cells. We
injected the GFP-encoding retrovirus into the same region
of the lateral SVZ at P0–1, fixed tissue after the same
interval (5–7 weeks), and then analyzed the labeled cells
by immunofluorescence. We were able to perform double
labeling for antigens in addition to visualizing the cell’s
morphology clearly with the GFP by confocal microscopy.
The large majority (96%, 23/24) of the ‘‘lacy’’ cells were
labeled with the NG2 antibody (Fig. 1b). As noted before,
these cells are characterized by a round nucleus and an
extensive network of many, delicate, branching processes
(see Figs. 2B, 3C, and 4C in Levison et al., 1999). This
morphology is typical of cells that express the NG2 proteo-
glycan (Levine and Card, 1986; Levison et al., 1999; Stall-
cup and Beasly, 1987, and for recent reviews, see Butt and
Berry, 2000; Nishiyama et al., 1999). There is current
controversy over the nature of these cells—they have been
called ‘‘polyandrocytes’’ (Nishiyama et al., 2003) or ‘‘syn-
antocytes’’ (Berry et al., 2002; Butt et al., 2002), and
considered by some investigators to represent a stable glial
population in the mammalian CNS. They are thought to
belong to the oligodendrocyte lineage. For our present
purposes, however, we will forgo a specific terminology
and function, and characterize them by morphology and
NG2 expression, and call them ‘‘lacy’’ oligodendrocytes.
In contrast, the cells with few processes were neither NG2
nor CNPase-positive (Fig. 1a, arrow), but some were labeled
with the antibodies to the Yp form of glutathione-S-transfer-
ase or PDGFRa (data not shown). They probably represent
some form of immature oligodendrocyte (see below). Nei-
ther the ‘‘lacy’’ nor the larger cells with few processes were
labeled with antibodies to astrocyte markers, GFAP and S-
100 beta (and see Levison et al., 1999). The bipolar or
unipolar cells did not stain with any of these antibodies, and
we consider them ‘‘immature’’ and draw no conclusions as to
the specific lineages to which these cells belong. They
comprise but a few percent of the total labeled population.
Thus, the category of ‘‘non-myelinating oligodendrocytes’’
used in the text includes immature oligodendrocytes as well
as ‘‘lacy’’ NG2-positive cells. The proportion of these two
classes of oligodendrocytes is presented in the later sections.
Labeling SVZ cells in vivo for clonal analysis
A library of 100 different LacZ retrovirus vectors, each
carrying a unique PCR-amplifiable sequence tag (Walsh,
1995; Walsh and Cepko, 1992), was used to label SVZ cells
in newborn rats (Levison and Goldman, 1993; Zerlin et al.,
1995). Their brains were analyzed later during early adult-
hood and the progeny of infected cells was identified by X-
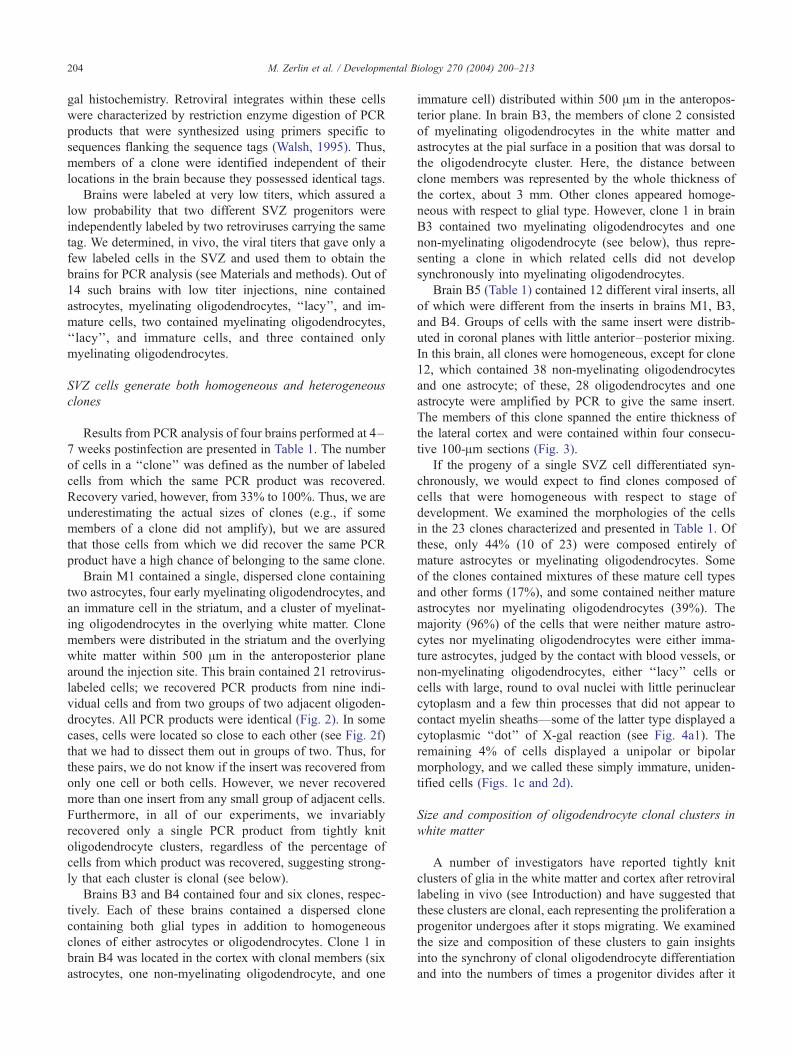
M. Zerlin et al. / Developmental Biology 270 (2004) 200–213204
gal histochemistry. Retroviral integrates within these cells
were characterized by restriction enzyme digestion of PCR
products that were synthesized using primers specific to
sequences flanking the sequence tags (Walsh, 1995). Thus,
members of a clone were identified independent of their
locations in the brain because they possessed identical tags.
Brains were labeled at very low titers, which assured a
low probability that two different SVZ progenitors were
independently labeled by two retroviruses carrying the same
tag. We determined, in vivo, the viral titers that gave only a
few labeled cells in the SVZ and used them to obtain the
brains for PCR analysis (see Materials and methods). Out of
14 such brains with low titer injections, nine contained
astrocytes, myelinating oligodendrocytes, ‘‘lacy’’, and im-
mature cells, two contained myelinating oligodendrocytes,
‘‘lacy’’, and immature cells, and three contained only
myelinating oligodendrocytes.
SVZ cells generate both homogeneous and heterogeneous
clones
Results from PCR analysis of four brains performed at 4–
7 weeks postinfection are presented in Table 1. The number
of cells in a ‘‘clone’’ was defined as the number of labeled
cells from which the same PCR product was recovered.
Recovery varied, however, from 33% to 100%. Thus, we are
underestimating the actual sizes of clones (e.g., if some
members of a clone did not amplify), but we are assured
that those cells from which we did recover the same PCR
product have a high chance of belonging to the same clone.
Brain M1 contained a single, dispersed clone containing
two astrocytes, four early myelinating oligodendrocytes, and
an immature cell in the striatum, and a cluster of myelinat-
ing oligodendrocytes in the overlying white matter. Clone
members were distributed in the striatum and the overlying
white matter within 500 Am in the anteroposterior plane
around the injection site. This brain contained 21 retrovirus-
labeled cells; we recovered PCR products from nine indi-
vidual cells and from two groups of two adjacent oligoden-
drocytes. All PCR products were identical (Fig. 2). In some
cases, cells were located so close to each other (see Fig. 2f)
that we had to dissect them out in groups of two. Thus, for
these pairs, we do not know if the insert was recovered from
only one cell or both cells. However, we never recovered
more than one insert from any small group of adjacent cells.
Furthermore, in all of our experiments, we invariably
recovered only a single PCR product from tightly knit
oligodendrocyte clusters, regardless of the percentage of
cells from which product was recovered, suggesting strong-
ly that each cluster is clonal (see below).
Brains B3 and B4 contained four and six clones, respec-
tively. Each of these brains contained a dispersed clone
containing both glial types in addition to homogeneous
clones of either astrocytes or oligodendrocytes. Clone 1 in
brain B4 was located in the cortex with clonal members (six
astrocytes, one non-myelinating oligodendrocyte, and one
immature cell) distributed within 500 Am in the anteropos-
terior plane. In brain B3, the members of clone 2 consisted
of myelinating oligodendrocytes in the white matter and
astrocytes at the pial surface in a position that was dorsal to
the oligodendrocyte cluster. Here, the distance between
clone members was represented by the whole thickness of
the cortex, about 3 mm. Other clones appeared homoge-
neous with respect to glial type. However, clone 1 in brain
B3 contained two myelinating oligodendrocytes and one
non-myelinating oligodendrocyte (see below), thus repre-
senting a clone in which related cells did not develop
synchronously into myelinating oligodendrocytes.
Brain B5 (Table 1) contained 12 different viral inserts, all
of which were different from the inserts in brains M1, B3,
and B4. Groups of cells with the same insert were distrib-
uted in coronal planes with little anterior–posterior mixing.
In this brain, all clones were homogeneous, except for clone
12, which contained 38 non-myelinating oligodendrocytes
and one astrocyte; of these, 28 oligodendrocytes and one
astrocyte were amplified by PCR to give the same insert.
The members of this clone spanned the entire thickness of
the lateral cortex and were contained within four consecu-
tive 100-Am sections (Fig. 3).
If the progeny of a single SVZ cell differentiated syn-
chronously, we would expect to find clones composed of
cells that were homogeneous with respect to stage of
development. We examined the morphologies of the cells
in the 23 clones characterized and presented in Table 1. Of
these, only 44% (10 of 23) were composed entirely of
mature astrocytes or myelinating oligodendrocytes. Some
of the clones contained mixtures of these mature cell types
and other forms (17%), and some contained neither mature
astrocytes nor myelinating oligodendrocytes (39%). The
majority (96%) of the cells that were neither mature astro-
cytes nor myelinating oligodendrocytes were either imma-
ture astrocytes, judged by the contact with blood vessels, or
non-myelinating oligodendrocytes, either ‘‘lacy’’ cells or
cells with large, round to oval nuclei with little perinuclear
cytoplasm and a few thin processes that did not appear to
contact myelin sheaths—some of the latter type displayed a
cytoplasmic ‘‘dot’’ of X-gal reaction (see Fig. 4a1). The
remaining 4% of cells displayed a unipolar or bipolar
morphology, and we called these simply immature, uniden-
tified cells (Figs. 1c and 2d).
Size and composition of oligodendrocyte clonal clusters in
white matter
A number of investigators have reported tightly knit
clusters of glia in the white matter and cortex after retroviral
labeling in vivo (see Introduction) and have suggested that
these clusters are clonal, each representing the proliferation a
progenitor undergoes after it stops migrating. We examined
the size and composition of these clusters to gain insights
into the synchrony of clonal oligodendrocyte differentiation
and into the numbers of times a progenitor divides after it
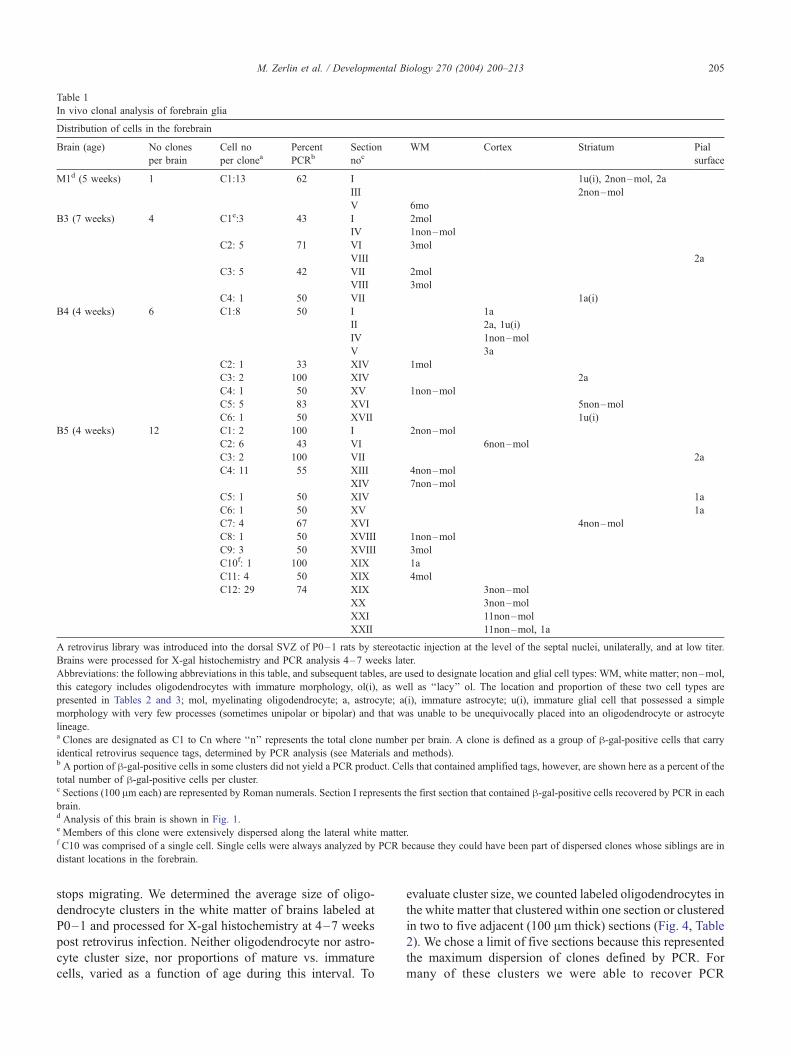
Table 1
In vivo clonal analysis of forebrain glia
Distribution of cells in the forebrain
Brain (age) No clones
per brain
Cell no
per cloneaPercent
PCRb
Section
nocWM Cortex Striatum Pial
surface
M1d (5 weeks) 1 C1:13 62 I 1u(i), 2non–mol, 2a
III 2non–mol
V 6mo
B3 (7 weeks) 4 C1e:3 43 I 2mol
IV 1non–mol
C2: 5 71 VI 3mol
VIII 2a
C3: 5 42 VII 2mol
VIII 3mol
C4: 1 50 VII 1a(i)
B4 (4 weeks) 6 C1:8 50 I 1a
II 2a, 1u(i)
IV 1non–mol
V 3a
C2: 1 33 XIV 1mol
C3: 2 100 XIV 2a
C4: 1 50 XV 1non–mol
C5: 5 83 XVI 5non–mol
C6: 1 50 XVII 1u(i)
B5 (4 weeks) 12 C1: 2 100 I 2non–mol
C2: 6 43 VI 6non–mol
C3: 2 100 VII 2a
C4: 11 55 XIII 4non–mol
XIV 7non–mol
C5: 1 50 XIV 1a
C6: 1 50 XV 1a
C7: 4 67 XVI 4non–mol
C8: 1 50 XVIII 1non–mol
C9: 3 50 XVIII 3mol
C10f: 1 100 XIX 1a
C11: 4 50 XIX 4mol
C12: 29 74 XIX 3non–mol
XX 3non–mol
XXI 11non–mol
XXII 11non–mol, 1a
A retrovirus library was introduced into the dorsal SVZ of P0–1 rats by stereotactic injection at the level of the septal nuclei, unilaterally, and at low titer.
Brains were processed for X-gal histochemistry and PCR analysis 4–7 weeks later.
Abbreviations: the following abbreviations in this table, and subsequent tables, are used to designate location and glial cell types: WM, white matter; non–mol,
this category includes oligodendrocytes with immature morphology, ol(i), as well as ‘‘lacy’’ ol. The location and proportion of these two cell types are
presented in Tables 2 and 3; mol, myelinating oligodendrocyte; a, astrocyte; a(i), immature astrocyte; u(i), immature glial cell that possessed a simple
morphology with very few processes (sometimes unipolar or bipolar) and that was unable to be unequivocally placed into an oligodendrocyte or astrocyte
lineage.a Clones are designated as C1 to Cn where ‘‘n’’ represents the total clone number per brain. A clone is defined as a group of h-gal-positive cells that carry
identical retrovirus sequence tags, determined by PCR analysis (see Materials and methods).b A portion of h-gal-positive cells in some clusters did not yield a PCR product. Cells that contained amplified tags, however, are shown here as a percent of the
total number of h-gal-positive cells per cluster.c Sections (100 Am each) are represented by Roman numerals. Section I represents the first section that contained h-gal-positive cells recovered by PCR in each
brain.d Analysis of this brain is shown in Fig. 1.e Members of this clone were extensively dispersed along the lateral white matter.f C10 was comprised of a single cell. Single cells were always analyzed by PCR because they could have been part of dispersed clones whose siblings are in
distant locations in the forebrain.
M. Zerlin et al. / Developmental Biology 270 (2004) 200–213 205
stops migrating. We determined the average size of oligo-
dendrocyte clusters in the white matter of brains labeled at
P0–1 and processed for X-gal histochemistry at 4–7 weeks
post retrovirus infection. Neither oligodendrocyte nor astro-
cyte cluster size, nor proportions of mature vs. immature
cells, varied as a function of age during this interval. To
evaluate cluster size, we counted labeled oligodendrocytes in
the white matter that clustered within one section or clustered
in two to five adjacent (100 Am thick) sections (Fig. 4, Table
2). We chose a limit of five sections because this represented
the maximum dispersion of clones defined by PCR. For
many of these clusters we were able to recover PCR

Fig. 3. Position of the members of clone 12 from brain B5 at 4 weeks post
in vivo retrovirus labeling of SVZ cells. This clone was comprised of 39
cells that spanned the whole cortical thickness and were distributed over
four consecutive 100-Am sections. Identical retrovirus tags were recovered
from 29 cells. These included non-myelinating oligodendrocytes in each
subcluster as well as a protoplasmic astrocyte. o, non-myelinating
oligodendrocytes that yielded the PCR product; �, immature oligoden-
drocytes that did not yield any PCR product; *, protoplasmic astrocyte that
yielded the PCR product.
Fig. 4. Examples of several types of clusters found in brains infected at P0
and analyzed 4–7 weeks later. (Panels a1, a2, b1, and b2) Analysis of brain
K1, 5 weeks postlabeling; this brain contained only two large oligoden-
drocyte clusters. Panels a-1 and a-2 illustrate one cluster in the white matter
dorsal to the SVZ, in two consecutive 100-Am sections. It contained 14
myelinating and two lightly stained, non-myelinating oligodendrocytes
(indicated by an arrow in panel a1). Notice the perinuclear localization of
the X-gal reaction product typically found in these immature cells (see inset
in panel a-1 for detail). Cells in this cluster did not yield PCR products.
Panels b1 and b2 illustrate the second cluster of myelinating oligoden-
drocytes in this brain, located in the striatum, just ventral to the SVZ, in
four consecutive 100-Am sections located more posterior than those
containing the previous cluster. This clone contained 24 myelinating
oligodendrocytes (13 of them in b1, 6 in b2, and 5 in a more anterior cluster
not shown here). All were analyzed by PCR and 16 yielded identical PCR
amplified products (66% PCR recovery). Six cells from each of the clusters
shown in panels b-1 and b-2 yielded the same PCR product and so did four
cells from the more anterior fraction of the clone. (Panel c) A fraction of
clone 12 in brain B5 (Table 1, Fig. 3). This cortical clone, identified by PCR
analysis, was comprised of 38 non-myelinating oligodendrocytes and a
mature protoplasmic astrocyte. The members of this clone were distributed
through the whole thickness of the lateral cortex, extending from the
cortex–white matter border up to the pial surface, and were contained
within four 100-Am consecutive sections. Some of the oligodendrocytes
(shown here) possessed an extensive network of very delicate processes,
typical of NG2-positive cells previously described in adult rat neocortex.
(Panel d) Radial array of cortical astrocytes in a low titer labeled brain not
included in Table 1. Cells in this cluster did not yield PCR products, but
results from double virus injections (Levison et al., 1993) provide evidence
for the clonal origin of this kind of radially oriented cluster. The arrow
points to the radial orientation, in the direction of the pial surface. Scale bar
represents 50 Am for panel c; 100 Am for panels a1, a2, and d; and 200 Amfor panels b1 and b2.
M. Zerlin et al. / Developmental Biology 270 (2004) 200–213206
products, although the percentage of cells in each cluster
from which we recovered a product varied widely, from 0%
to 83%. For the analysis we chose clusters in which every
member was within 100 Am of its nearest neighbor and
considered all cells in each of such clusters highly likely to
be related to each other for two reasons. First, in all such
clusters from which PCR products were recovered, only a
single PCR product was found, regardless of the percentage
of cells from which a product was recovered. Second, a
previous in vivo clonal analysis performed by labeling SVZ
cells with a mixture of two recombinant retroviruses (of
higher titer than used in the present study), each with a
different reporter gene, concluded that there was a 96%
chance that each tightly knit cluster was in fact clonal
(Levison and Goldman, 1993).
We examined a total of 44 oligodendrocyte clusters for
size and cell type composition (Table 2). Twenty-four of
these clusters came from brains whose PCR analyses are
presented in Table 1: M1, B3, B4, and B5. The other 20
clusters came from seven brains that were not included in
that table, but that contained oligodendrocyte clusters in the
white matter. Three brains of the total of 14 brains analyzed
did not contain such clusters.
We divided clusters into three groups: (1) those that
contained only myelinating oligodendrocytes; (2) those that
contained both myelinating oligodendrocytes and non-mye-

Table 2
Analysis of oligodendrocyte clusters in the white matter
A retrovirus library, at low titer, was injected into the dorsal SVZ of P0–1
rats by stereotactic injection. Brains were analyzed 4–7 weeks later by X-
gal histochemistry. Clusters of h-galactosidase-positive oligodendrocytes
whose members were in contact or close proximity to each other were
included in this analysis. The distance between any member of a cluster and
its nearest neighbor was <100 Am.aAbbreviations for cluster types are as described in Table 1 legend.bCluster size: mean cell number per cluster F SEM.cRange: minimum to maximum cell number per cluster.dTotal number of mol and ol(i) in all of the 44 clusters analyzed.
Table 3
Analysis of oligodendrocyte clusters in the cortex and striatum
A retrovirus library, at low titer, was injected into the dorsal SVZ of P0–1
rats. Brains were analyzed 4–7 weeks later by X-gal histochemistry.
Clusters of h-galactosidase-positive oligodendrocytes whose members were
in contact or close proximity to each other were included in this analysis.
The distance between any member of a cluster and its nearest neighbor was
V100 Am.aAbbreviations for cluster types are as described in Table 1 legend. ‘‘Lacy’’
ol. clusters are composed of cells that possessed a round nucleus and an
extensive network of fine branching processes typical of NG2+ cells (see
text).bCluster size: mean number of cells per cluster F SEM.cRange: minimum to maximum cell number per cluster.dTotal of mol and ol(i) plus ‘‘lacy’’ ol in all the 26 clusters analyzed.
M. Zerlin et al. / Developmental Biology 270 (2004) 200–213 207
linating or early myelinating oligodendrocytes; and (3)
those that contained only non-myelinating oligodendrocytes
(Table 2, Fig. 4). We observed only rare ‘‘lacy’’ oligoden-
drocytes in the white matter after retroviral injection. The
average size of clusters that contained only myelinating
oligodendrocytes (5.8 F 0.9 (FSEM) cells, n = 31 clusters)
was similar to that of clusters containing mixtures of
myelinating and non-myelinating cells (7.8 F 3.3 cells, n
= 4 clusters). Both of these were appreciably larger than
clusters that contained only non-myelinating cells (2.2 F0.4 cells; n = 9 clusters). The size of myelinating oligoden-
drocyte clusters varied widely from 1 to 23 cells. Each
mixed cluster contained between 1 and 14 myelinating
oligodendrocytes as well as two or three non-myelinating
cells, so that the majority of cells in these mixed clusters
were myelinating oligodendrocytes. The clusters containing
only non-myelinating oligodendrocytes were always small,
containing from one to five cells.
Despite the mixture of myelinating and non-myelinating
oligodendrocytes, the population as a whole was heavily
skewed toward myelinating cells. When we counted the
total number of cells in all of the tightly knit clusters, we
found 87% (201/231) were myelinating oligodendrocytes
and 13% (30/231) were non-myelinating cells (Table 2).
Size and composition of oligodendrocyte clonal clusters in
the cortex and striatum
Clonal clusters in the cortex and striatum also contained
myelinating and non-myelinating oligodendrocytes. In con-
trast to their relative rarity in the white matter, ‘‘lacy’’
oligodendrocytes, characterized by a round nucleus and an
extensive network of many delicate branching processes,
appeared frequently in the cortex and striatum (see Figs. 1b
and 4c). In a previous study (Levison et al., 1999) and in the
present work, we found that the large majority of the cells
with that characteristic morphology express the NG2 pro-
teoglycan (see above). Some of these clonal clusters are
represented in Table 1. Thus, in brain B4, clone 5 contained
five ‘‘lacy’’ oligodendrocytes in the striatum, and clones 2
(in cortex) and 7 (in striatum) in brain B5 contained six and
four ‘‘lacy’’ oligodendrocytes, respectively. In addition,
clone 1 in B4 and clone 12 in B5 also contained one and
five ‘‘lacy’’ oligodendrocytes, respectively. These two latter
groups of cells had to be defined as clonal by PCR because
some members resided farther than the 100-Am distance
from other cells.
We examined 26 oligodendrocyte clusters for size and cell
type composition (Table 3); 17 of them came from brains
presented in Table 1: M1, B3, B4, and B5. The other nine
clusters came from five brains not included in that table. The
proportions of different types of oligodendrocyte clonal
clusters are as follows: 42% were composed only of myeli-
nating oligodendrocytes (11/26) (Fig. 4b); 8% were com-
posed of myelinating, early myelinating, and non-myelinat-
ing oligodendrocytes (2/26); 19% were composed of early
myelinating and non-myelinating oligodendrocytes (5/26)
(Fig. 2e); and 31% were composed of ‘‘lacy’’ oligodendro-
cytes (8/26) (Fig. 4c). One cortical clone (B5, clone 12, see
Fig. 3) was composed of one astrocyte and 38 non-myelinat-
ing oligodendrocytes, including both ‘‘lacy’’ cells and im-
mature oligodendrocytes (PCR products were recovered from
the one astrocyte and 28 oligodendrocytes; all products were
identical). The average size of clusters that contained only
myelinating oligodendrocytes (3.7 F 2.1 cells; n = 11
clusters) was similar to that of clusters containing mixtures
of myelinating and non-myelinating cells (2.5 average; n = 2
clusters). Both of these were similar to clusters that contained
only ‘‘lacy’’ cells or immature cells (3.8 F 0.9 cells; n = 13
clusters), with ‘‘lacy’’ and immature clusters approximately
equivalent in size. The size of myelinating oligodendrocyte
clusters varied widely from 1 to 24 cells. The clusters
containing only ‘‘lacy’’ or immature cells ranged from 1 to
14 cells.

Fig. 5. Early patterns of clonal dispersion in the cortex 5 days postinjection.
These two radial arrays, located in two adjacent 300-Am sections (a and b),
were the only labeled cells found in the entire brain. Four cells are complex,
showing features of early astrocytic differentiation (blood vessel contacts
and early branching), while other cells appear immature. Arrows indicate
those cells that yielded PCR products. Lines at the top represent the pial
surface.
M. Zerlin et al. / Developmental Biology 270 (2004) 200–213208
In contrast to the white matter, where the population as a
whole was heavily skewed toward myelinating oligoden-
drocytes, at this age in cortex and striatum, the population
was more evenly split. When we counted the total number
of labeled cells of the oligodendrocyte lineage, we found
45% (43/95) were myelinating oligodendrocytes and 55%
(52/95) were either immature oligodendrocytes or ‘‘lacy’’
oligodendrocytes (Table 3).
Size and composition of astrocyte and mixed astrocyte/
oligodendrocyte clusters
A total of 20 astrocyte clusters (16 in cortex, 4 in
striatum) were analyzed. Ten of these clusters came from
brains included in Table 1: B4, B3, and B5. The other 10
came from brains not included in that table. Labeled
astrocytes were rarely found in the white matter, as previ-
ously noted (Levison and Goldman, 1993). Clusters com-
posed only of astrocytes averaged 2.2 F 0.2 cells (n = 20)
in size and ranged from one to five cells. We found one
cluster of astrocytes plus immature oligodendrocytes (four
cells total) and three dispersed clones containing both
astrocytes and immature oligodendrocytes or ‘‘lacy’’ cells
(9, 16, and 39 cells). The last two of these clones corre-
spond to clone 1 from brain B4 and clone 12 from brain B5
(Table 1 and Fig. 3).
Clonal dispersion during early stages of gliogenesis
We considered that examining the early stages of clonal
growth might reveal further insights into the clonal disper-
sion and differentiation patterns of glial progenitors. There-
fore, brains were examined 4–5 days after retroviral
labeling. An example is shown in Fig. 5, in which two
intracortical radial arrays of immature cells were found in
two consecutive 300-Am sections. All were analyzed by
PCR and inserts, all identical, were isolated from three cells.
Because these X-gal-positive cells were the only labeled
cells in the entire brain, it is likely that cells in these arrays
were clonal.
These cells showed morphological heterogeneity. Several
looked immature (unipolar), while others exhibited a more
complex appearance, contacting and beginning to wrap
around blood vessels, indicative of early astrocytic differ-
entiation (Zerlin and Goldman, 1997; Zerlin et al., 1995).
Two immature cells are not radially aligned, but tangentially
oriented. This is likely due to tangential dispersion, as
recently visualized in living tissue slices (Kakita and Gold-
man, 1999).
A second brain analyzed 4 days postinjection showed a
single radial array of 13 cells, dispersed from the white
matter-gray matter border to the pial surface. We recovered
identical inserts from four to seven of these cells (three
analyses were performed on pairs of closely situated cells,
so we do not know whether the insert represented one or
two cells). All of the cells in this radial array also displayed
either immature morphology or early astrocyte character-
istics (not shown).
Discussion
SVZ cells generate both homogeneous and heterogeneous
clones and both dispersed and clustered clones
Single SVZ cells generate dispersed and clustered clones,
most of them homogeneous in lineage type, but others
composed of both astrocytes and oligodendrocytes. Some
clones were composed of widely dispersed clusters, indi-
cating that related cells do not necessarily remain together
after division, while others were composed of a single
cluster or groups of clusters near each other. Several
mechanisms could generate these various clonal patterns.
Homogeneous clones could have been generated from SVZ
cells that became restricted to a single lineage before they
M. Zerlin et al. / Developmental Biology 270 (2004) 200–213 209
migrated out of the SVZ. However, they could have also
originated from progenitors that became committed to a
lineage during their migration through the CNS, or even
after migration ceased. Heterogeneous clones would pre-
sumably arise from progenitors that are not restricted to a
specific lineage before they emigrate from the SVZ, but
diverge in lineage during migration. Heterogeneous clonal
clusters would arise from a progenitor that gave rise to
astrocytic and oligodendrocytic lineages during continued
cell divisions after migration had ceased.
While it is possible that a heterogenous clonal cluster
could have been generated by a group of related SVZ cells
that migrated together and then stopped at exactly the same
place, this seems highly unlikely because there is extensive
and constant progenitor mixing within the SVZ, where cells
appear undirected in their movements (Kakita and Goldman,
1999). Thus, it seems unlikely for sibling cells to take
identical migratory paths. Furthermore, when we have
observed division of migrating cells in white or gray matter
in living slices, the two progeny invariably migrate away
from the site of division in different directions (Suzuki and
Goldman, unpublished observations).
Several previous observations argue for some degree of
fate restriction during progenitor migration. First, SVZ cells,
labeled in vivo with retrovirus and then placed in culture
within 24 h, generated a much higher proportion of mixed,
astrocyte/oligodendrocyte clones (30–70%) than that which
we found in vivo (Levison and Goldman, 1997; Levison et
al., 1993). This suggests that, as a population, retroviral-
labeled SVZ cells display a far greater developmental
plasticity while residing in the SVZ than they show after
they migrate. Second, during postnatal development, the
large majority of SVZ cells that colonize the subcortical
white matter become oligodendrocytes, while the large
majority that migrate into the neocortex and differentiate
during the first postnatal week develop into astrocytes
(Levison et al., 1993; Zerlin and Goldman, 1997). SVZ
cells also generate oligodendrocytes in the cortex, but these
tend to arise later. This suggests that there are strong
influences in the gray and white matter that may promote
specific glial differentiation. Third, SVZ cells begin to
express early markers of oligodendrocyte (NG2) or astro-
cyte (zebrin II, GLAST) differentiation as they migrate
through the white matter and cortex (Milosevic and Gold-
man, 2002; Staugaitis et al., 2001), suggesting that some
early lineage differentiation occurs during migration.
Fourth, we have injected the P0 SVZ with an alkaline
phosphatase-expressing retrovirus, waited 3–4 days, and
then carefully removed just the neocortex (without under-
lying the white matter and SVZ) and grown the resulting
cells for 7 days. The labeled cells generated three types of
clone, visualized with an alkaline phosphatase substrate:
homogeneous astrocyte, homogeneous oligodendrocyte, and
mixed astrocyte/oligodendrocyte (Zerlin, unpublished
observations). We never found neurons in these clones,
even under culture conditions in which SVZ cells will
generate neurons as well as glia (Levison and Goldman,
1997).
At this point, we favor a developmental model in which
some SVZ cells begin to differentiate into oligodendrocytes
or astrocytes before or during their migration, while others
retain a bipotency during migration. It is likely that these
SVZ cells correspond to a type of glial-specified (or glial
fate-restricted) progenitor. Whether or not they are similar or
identical to progenitors isolated from the embryonic spinal
cord that appear restricted to a glial fate (Rao et al., 1998)
bears further study. However, our clonal observations in
vivo strongly suggest that at least some of the SVZ cells
become specified to a glial fate but still retain the ability to
differentiate into either astrocytes or oligodendrocytes.
The process of lineage restriction may in fact be a
stochastic one in which a given progenitor has a certain
probability of beginning astrocytic or oligodendrocytic
differentiation during its migration. Those that ‘‘escape’’
such restriction can generate mixed clonal clusters. It is
likely that fate specification of some oligodendrocytes
occurs even before the generation of the large perinatal
SVZ because there is evidence that at least some oligoden-
drocytes of the dorsal telencephalon appear to be specified
more ventrally at much earlier embryonic times (reviewed in
Woodruff et al., 2001).
The neonatal forebrain SVZ is the source of both glia and
neurons, the former migrating radially and developing into
glia, the latter migrating anteriorly to the olfactory bulb,
where they develop into interneurons (Luskin et al., 1993).
We were unable in this study, however, to conclude one way
or another whether the labeled glial cells were lineally
related to olfactory interneurons. We have seen both glia
and neurons generated from retroviral injections at all
coronal levels of the forebrain (Suzuki and Goldman,
2003). However, the relative numbers of olfactory inter-
neurons vs. glia is a function of several variables. First, SVZ
cells labeled with retrovirus at any coronal level will
produce neurons and glia, but one sees many more neurons
with injections into the anterior aspect of the SVZ and
relatively fewer with injections at more posterior levels. The
injections in our clonal study were performed at the coronal
level of the septal nuclei, posterior to the most anterior SVZ.
Second, we have observed that with very low titers of
injected retrovirus at the level of the septal nuclei or further
posteriorly, we only see glia, while with high titers, we
always observe both neurons and glia. We are not sure why
this is the case–perhaps different cell cycle times could play
a role. However, we seem to label glioblastic population(s)
preferentially with the low titer injections. In the present
clonal study, we were constrained to use very low titer
injections because of the statistical arguments.
There are ‘‘potentially’’ multipotent cells in the SVZ at
this time, however. When we injected retrovirus into the
early postnatal SVZ and then placed the cells in culture, we
observed clones containing both neurons and glia (Levison
and Goldman, 1997). Thus, there are dividing cells in the
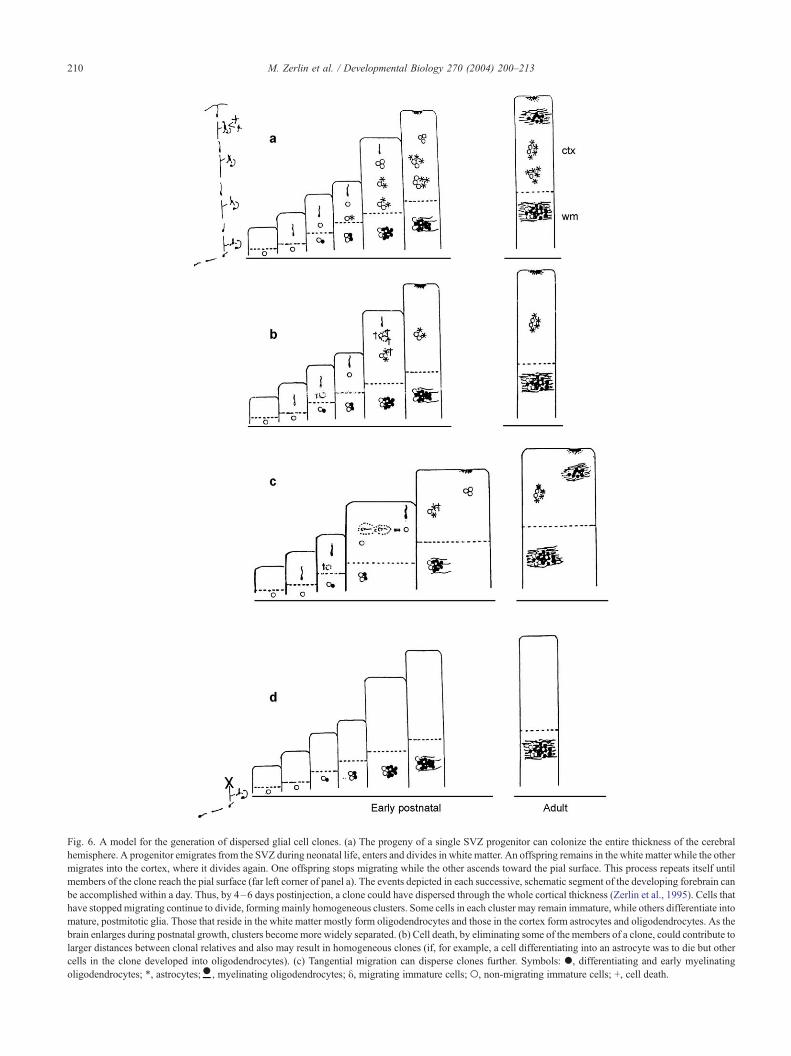
Fig. 6. A model for the generation of dispersed glial cell clones. (a) The progeny of a single SVZ progenitor can colonize the entire thickness of the cerebral
hemisphere. A progenitor emigrates from the SVZ during neonatal life, enters and divides in white matter. An offspring remains in the white matter while the other
migrates into the cortex, where it divides again. One offspring stops migrating while the other ascends toward the pial surface. This process repeats itself until
members of the clone reach the pial surface (far left corner of panel a). The events depicted in each successive, schematic segment of the developing forebrain can
be accomplished within a day. Thus, by 4–6 days postinjection, a clone could have dispersed through the whole cortical thickness (Zerlin et al., 1995). Cells that
have stoppedmigrating continue to divide, forming mainly homogeneous clusters. Some cells in each cluster may remain immature, while others differentiate into
mature, postmitotic glia. Those that reside in the white matter mostly form oligodendrocytes and those in the cortex form astrocytes and oligodendrocytes. As the
brain enlarges during postnatal growth, clusters becomemore widely separated. (b) Cell death, by eliminating some of the members of a clone, could contribute to
larger distances between clonal relatives and also may result in homogeneous clones (if, for example, a cell differentiating into an astrocyte was to die but other
cells in the clone developed into oligodendrocytes). (c) Tangential migration can disperse clones further. Symbols: ., differentiating and early myelinating
oligodendrocytes; *, astrocytes; , myelinating oligodendrocytes; y, migrating immature cells; o, non-migrating immature cells; +, cell death..
M. Zerlin et al. / Developmental Biology 270 (2004) 200–213210
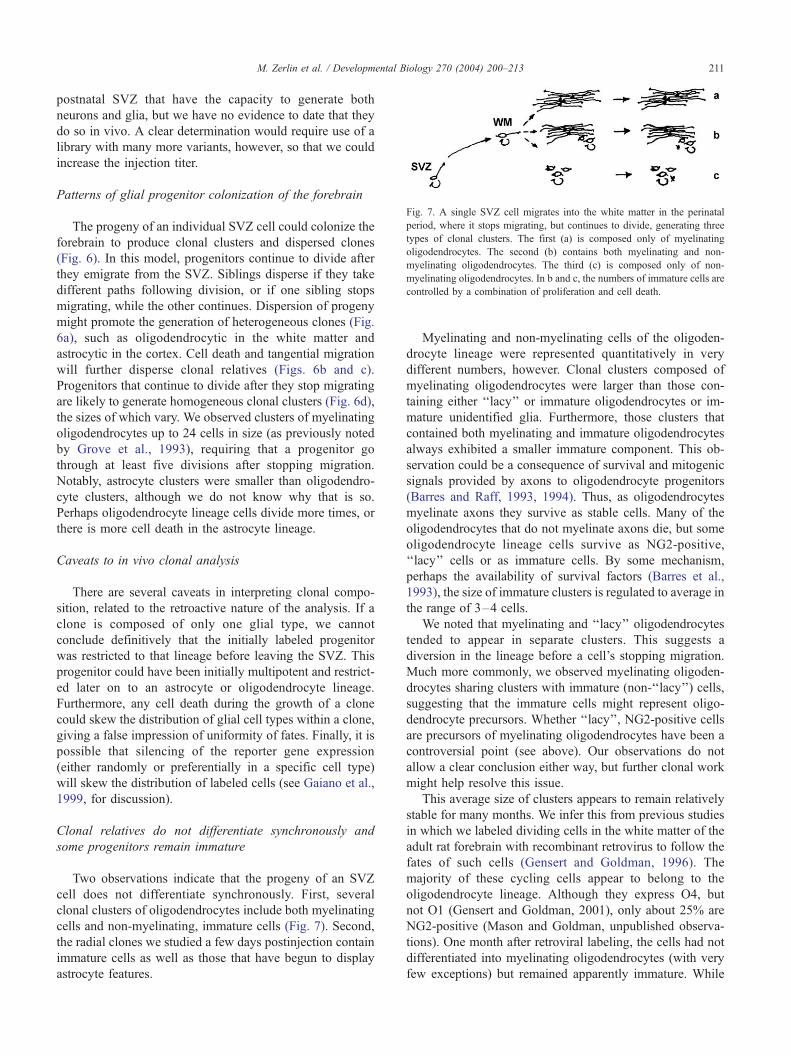
Fig. 7. A single SVZ cell migrates into the white matter in the perinatal
period, where it stops migrating, but continues to divide, generating three
types of clonal clusters. The first (a) is composed only of myelinating
oligodendrocytes. The second (b) contains both myelinating and non-
myelinating oligodendrocytes. The third (c) is composed only of non-
myelinating oligodendrocytes. In b and c, the numbers of immature cells are
controlled by a combination of proliferation and cell death.
M. Zerlin et al. / Developmental Biology 270 (2004) 200–213 211
postnatal SVZ that have the capacity to generate both
neurons and glia, but we have no evidence to date that they
do so in vivo. A clear determination would require use of a
library with many more variants, however, so that we could
increase the injection titer.
Patterns of glial progenitor colonization of the forebrain
The progeny of an individual SVZ cell could colonize the
forebrain to produce clonal clusters and dispersed clones
(Fig. 6). In this model, progenitors continue to divide after
they emigrate from the SVZ. Siblings disperse if they take
different paths following division, or if one sibling stops
migrating, while the other continues. Dispersion of progeny
might promote the generation of heterogeneous clones (Fig.
6a), such as oligodendrocytic in the white matter and
astrocytic in the cortex. Cell death and tangential migration
will further disperse clonal relatives (Figs. 6b and c).
Progenitors that continue to divide after they stop migrating
are likely to generate homogeneous clonal clusters (Fig. 6d),
the sizes of which vary. We observed clusters of myelinating
oligodendrocytes up to 24 cells in size (as previously noted
by Grove et al., 1993), requiring that a progenitor go
through at least five divisions after stopping migration.
Notably, astrocyte clusters were smaller than oligodendro-
cyte clusters, although we do not know why that is so.
Perhaps oligodendrocyte lineage cells divide more times, or
there is more cell death in the astrocyte lineage.
Caveats to in vivo clonal analysis
There are several caveats in interpreting clonal compo-
sition, related to the retroactive nature of the analysis. If a
clone is composed of only one glial type, we cannot
conclude definitively that the initially labeled progenitor
was restricted to that lineage before leaving the SVZ. This
progenitor could have been initially multipotent and restrict-
ed later on to an astrocyte or oligodendrocyte lineage.
Furthermore, any cell death during the growth of a clone
could skew the distribution of glial cell types within a clone,
giving a false impression of uniformity of fates. Finally, it is
possible that silencing of the reporter gene expression
(either randomly or preferentially in a specific cell type)
will skew the distribution of labeled cells (see Gaiano et al.,
1999, for discussion).
Clonal relatives do not differentiate synchronously and
some progenitors remain immature
Two observations indicate that the progeny of an SVZ
cell does not differentiate synchronously. First, several
clonal clusters of oligodendrocytes include both myelinating
cells and non-myelinating, immature cells (Fig. 7). Second,
the radial clones we studied a few days postinjection contain
immature cells as well as those that have begun to display
astrocyte features.
Myelinating and non-myelinating cells of the oligoden-
drocyte lineage were represented quantitatively in very
different numbers, however. Clonal clusters composed of
myelinating oligodendrocytes were larger than those con-
taining either ‘‘lacy’’ or immature oligodendrocytes or im-
mature unidentified glia. Furthermore, those clusters that
contained both myelinating and immature oligodendrocytes
always exhibited a smaller immature component. This ob-
servation could be a consequence of survival and mitogenic
signals provided by axons to oligodendrocyte progenitors
(Barres and Raff, 1993, 1994). Thus, as oligodendrocytes
myelinate axons they survive as stable cells. Many of the
oligodendrocytes that do not myelinate axons die, but some
oligodendrocyte lineage cells survive as NG2-positive,
‘‘lacy’’ cells or as immature cells. By some mechanism,
perhaps the availability of survival factors (Barres et al.,
1993), the size of immature clusters is regulated to average in
the range of 3–4 cells.
We noted that myelinating and ‘‘lacy’’ oligodendrocytes
tended to appear in separate clusters. This suggests a
diversion in the lineage before a cell’s stopping migration.
Much more commonly, we observed myelinating oligoden-
drocytes sharing clusters with immature (non-‘‘lacy’’) cells,
suggesting that the immature cells might represent oligo-
dendrocyte precursors. Whether ‘‘lacy’’, NG2-positive cells
are precursors of myelinating oligodendrocytes have been a
controversial point (see above). Our observations do not
allow a clear conclusion either way, but further clonal work
might help resolve this issue.
This average size of clusters appears to remain relatively
stable for many months. We infer this from previous studies
in which we labeled dividing cells in the white matter of the
adult rat forebrain with recombinant retrovirus to follow the
fates of such cells (Gensert and Goldman, 1996). The
majority of these cycling cells appear to belong to the
oligodendrocyte lineage. Although they express O4, but
not O1 (Gensert and Goldman, 2001), only about 25% are
NG2-positive (Mason and Goldman, unpublished observa-
tions). One month after retroviral labeling, the cells had not
differentiated into myelinating oligodendrocytes (with very
few exceptions) but remained apparently immature. While
M. Zerlin et al. / Developmental Biology 270 (2004) 200–213212
the retrovirus initially labeled individual, non-clustered cells,
after 1 month, the cells were distributed in clusters. We have
argued that these clusters most likely represented local,
clonal expansion of some of the initially labeled cells. The
average size of these clusters (about three cells, with a range
of 1–15) is very close to the average size of non-myelinating
oligodendrocyte clusters we describe in this paper. These
observations do not, however, rule out the generation of
white matter oligodendrocytes from residual SVZ cells in
these adult brains. The nature and heterogeneity of these
immature cells in adult white matter are not fully understood.
Some of them will differentiate into myelinating oligoden-
drocytes in vivo after a demyelinating lesion (Gensert and
Goldman, 1997). Most will develop along an oligodendro-
cyte pathway in vitro (Gensert and Goldman, 2001; Mason
and Goldman, 2002). However, the adult mammalian white
matter does contain immature cells capable of differentiating
in vitro into astrocytes (Gensert and Goldman, 2001) or even
neurons (Nunes et al., 2003).
Most of the progeny of SVZ cells that settled in the white
matter developed into myelinating oligodendrocytes. The
ratio of (labeled) myelinating oligodendrocytes to non-
myelinating cells in the subcortical white matter was about
6.7:1 (Table 2). We assume that this ratio is representative of
the progeny of all the SVZ cells that emigrated out of the
SVZ at that time, not just the retroviral-labeled cells, and
have no a priori reason to think otherwise. In a previous
study, we analyzed the phenotypes of the progeny of SVZ
cells identically labeled with retrovirus at P0 but then not
analyzed until 8 months later (Levison et al., 1999). The
ratio of myelinating oligodendrocytes to non-myelinating
oligodendrocytes in the white matter was 3.9:1. These ratios
suggest that over time, the proportion of oligodendrocyte-
lineage cells that fall into an immature category does not
decline. A similar ratio, about 4:1, of mature to immature
oligodendrocytes in the adult mouse corpus callosum was
calculated by Sturrock (1976).
Thus, an apparent consequence of the asynchronous
differentiation of SVZ cells is the continued presence of
immature glia in the adult white matter. We suggest that the
neonatal SVZ is the source of at least some of the immature,
cycling glia that populate the adult white matter (see Gensert
and Goldman, 1996; Levison et al., 1999; McCarthy and
Leblond, 1988). To keep the numbers of such immature
cells relatively constant despite proliferation, cell division
must be balanced by cell death.
Acknowledgments
We are most grateful to Drs. Chris Walsh and Chris Reid
for the retroviral library and much technical advice and
discussions, Drs. Steve Suhr and Theo Palmer for providing
us with the retroviral packaging cell line for the GFP
retrovirus, Dr. Bill Stallcup for the gift of NG2 antibody, Dr.
Martin Julius for helpful advice with PCR and many
discussions, Drs. Julius and Carol Mason for their valuable
suggestions on the manuscript, Drs. Mason and Steve Brown
for kindly making available equipment in their laboratories,
and Ms. Bernetta Abramson and Ms. Theresa Swayne for
technical assistance. This work was supported by NIH Grant
NS-17125.
References
Altman, J., 1966. Proliferation and migration of undifferentiated precursor
cells in the rat during postnatal gliogenesis. Exp. Neurol. 16, 263–278.
Barres, B.A., Raff, M., 1993. Proliferation of oligodendrocyte precursor
cells depends upon electrical activity in axons. Nature 361, 258–260.
Barres, B.A., Raff, M., 1994. Control of oligodendrocyte number in the
developing rat optic nerve. Neuron 12, 935–942.
Barres, B.A., Schmid, R., Sendtner, M., Raff, M., 1993. Multiple extracel-
lular signals are required for long-term oligodendrocyte survival. De-
velopment 118, 283–295.
Berry, M., Hubbard, P., Butt, A.M., 2002. Cytology and lineage of NG2-
positive glia. J. Neurocytol. 31, 457–467.
Butt, A.M., Berry, M., 2000. Oligodendrocytes and the control of myeli-
nation in vivo: new insights from the rat anterior medullary velum. J.
Neurosci. Res. 59, 477–488.
Butt, A.M., Kiff, J., Hubbard, P., Berry, M., 2002. Synantocytes: new
functions for novel NG2 expressing glia. J. Neurocytol. 31, 551–565.
Gaiano, N., Kohtz, I.D., Turnbull, D.H., Fishell, G., 1999. A method for
rapid gain-of function studies in the mouse embryonic nervous system.
Nat. Neurosci. 2, 812–819.
Gensert, J.M., Goldman, J.E., 1996. In vivo characterization of proliferat-
ing cells in adult rat subcortical white matter. Glia 17, 39–51.
Gensert, J.M., Goldman, J.E., 1997. Endogenous progenitors remyelinate
demyelinated axons in the adult CNS. Neuron 19, 197–203.
Gensert, J.M., Goldman, J.E., 2001. Heterogeneity of cycling glial progen-
itors in adult white matter. J. Neurobiol. 48, 75–86.
Grove, E.A., Williams, B.P., Da-Qing, L., Hajihosseini, M., Friedrich, A.,
Price, J., 1993. Multiple restricted lineages in the embryonic rat cerebral
cortex. Development 117, 553–561.
Kakita, A., Goldman, J.E., 1999. Patterns and dynamics of SVZ cell mi-
gration in the postnatal forebrain: monitoring living progenitors in slice
preparations. Neuron 23, 461–472.
Levine, J.M., Card, J.P., 1986. Light and electron microscopic localization
of a cell surface antigen (NG2) in the rat cerebellum: association with
smooth protoplasmic astrocytes. J. Neurosci. 7, 2711–2720.
Levison, S.W., Goldman, J.E., 1993. Both oligodendrocytes and astrocytes
develop from progenitors in the subventricular zone of postnatal rat
forebrain. Neuron 10, 201–212.
Levison, S.W., Goldman, J.E., 1997. Multipotential and lineage restricted
precursors coexist in the mammalian perinatal subventricular zone. J.
Neurosci. Res. 48, 83–94.
Levison, S.W., Chuang, C., Abramson, B.J., Goldman, J.E., 1993. The
migrational patterns and developmental fates of glial precursors in the
rat subventricular zone are temporally regulated. Development 119,
611–622.
Levison, S.W., Young, G.M., Goldman, J.E., 1999. Cycling cells in the
adult rat neocortex produce oligodendrocytes. J. Neurosci. Res. 57,
435–446.
Luskin, M.B., Mc Dermott, K., 1994. Divergent lineages for oligodendro-
cytes and astrocytes originating in the neonatal forebrain subventricular
zone. Glia 11, 211–226.
Luskin, M.B., Parnavelas, J.G., Barfield, J.A., 1993. Neurons, astrocytes
and oligodendrocytes of the rat cerebral cortex originate from separate
progenitor cells: an ultrastructural analysis of clonally related cell. J.
Neurosci. 13, 1730–1750.
Mason, J.L., Goldman, J.E., 2002. A2B5+ and O4+ cycling progenitors in

M. Zerlin et al. / Developmental Biology 270 (2004) 200–213 213
the adult forebrain white matter respond differentially to PDGF-AA,
FGF-2, and IGF-1. Mol. Cell. Neurosci. 20, 30–42.
McCarthy, G.F., Leblond, C.P., 1988. Radioautographic evidence for slow
astrocyte turnover and modest oligodendrocyte production in the corpus
callosum of adult mice infused with 3H-thymidine. J. Comp. Neurol.
271, 589–603.
Milosevic, A., Goldman, J.E., 2002. Progenitors in the postnatal cerebellar
white matter are antigenically heterogeneous. J. Comp. Neurol. 452,
192–203.
Nishiyama, A., Chang, A., Trapp, B., 1999. NG2+ glial cells: a novel glial
cell population in the adult brain. J. Neuropathol. Exp. Neurol. 58,
1113–1124.
Nishiyama, A., Watanabe, M., Yang, Z., Bu, J., 2003. Identity, distribution
and development of polydendrocytes: NG2 + expressing glial cells. J.
Neurocytol. 31, 437–455.
Nunes, M.C., Roy, N.S., Keyoung, H.M., Goodman, R.R., McKhann II, G.,
Jiang, L., Kang, J., Nedergaard, M., Goldman, S.A., 2003. Identifica-
tion and isolation of multipotential neural progenitor cells from the
subcortical white matter of the adult human brain. Nat. Med. 9 (4),
439–447.
Parnavelas, J.G., 1999. Glial cell lineages in the rat cerebral cortex. Exp.
Neurol. 156, 418–429.
Paterson, J.A., Privat, A., Ling, E.A., Leblond, C.P., 1973. Investigation of
glial cells in semithin sections III. Transformation of subependymal
cells into glial cells as shown by radioautography after 3H-thymidine
injection into the lateral ventricle of the brain of young rats. J. Comp.
Neurol. 149, 83–102.
Privat, A., 1975. Postnatal gliogenesis in the mammalian brain. Int. Rev.
Cytol. 40, 281–323.
Rao, M., Noble, M., Mayer-Proschel, M., 1998. A tripotential glial precur-
sor cells is present in the developing spinal cord. Proc. Natl. Acad. Sci.
U. S. A. 95, 3996–4001.
Stallcup, W.B., Beasly, L., 1987. Bipotential glial precursor cells of the optic
nerve express the NG2 proteoglycan. J. Neurosci. 7, 2737–2744.
Staugaitis, S., Zerlin, M.A., Hawkes, R., Levine, J., Goldman, J.E., 2001.
Aldolase C/Zebrin II Expression in the neonatal rat forebrain reveals
cellular heterogeneity within the subventricular zone and early astrocyte
differentiation. J. Neurosci. 21, 6195–6205.
Sturrock, R., 1976. Light microscopic identification of immature glial cells
in semithin sections of the developing mouse corpus callosum. J. Anat.
122, 521–537.
Suzuki, S.O., Goldman, J.E., 2003. Multiple cell populations in the early
postnatal, subventricular zone take distinct migratory pathways: a dy-
namic study of glial and neuronal progenitor migration. J. Neurosci. 23,
4240–4250.
Walsh, C.A., 1995. Polymerase chain reaction-based techniques for uti-
lizing retroviruses as cell lineage markers. Methods Mol. Genet. 7,
280–295.
Walsh, C.A., Cepko, C.L., 1992. Widespread dispersion of neuronal
clones across, functional regions of the cerebral cortex. Science
255, 434–440.
Wolswijk, G., Noble, M., 1989. Identification of an adult-specific glial
progenitor cell. Development 105, 387–400.
Woodruff, R.H., Tekki-Kessaris, N., Stiles, C.D., Rowitch, D.H., Richard-
son, W.D., 2001. Oligodendrocyte development in the spinal cord and
telencephalon: common themes and new perspectives. Int. J. Dev. Neu-
rosci. 19, 379–385.
Zerlin, M., Goldman, J.E., 1997. Interactions between glial progenitors and
blood vessels during early postnatal corticogenesis: blood vessel contact
represents an early stage of astrocyte differentiation. J. Comp. Neurol.
387, 537–546.
Zerlin, M., Levison, S.W., Goldman, J.E., 1995. Early patterns of migration,
morphogenesis, and intermediate filament expression of subventricular
zone cells in the postnatal rat forebrain. J. Neurosci. 15, 7238–7249.
Copyright © 2022 FDOKUMEN