Evidence of upstream and downstream solitary wavetrains coexistence in the real atmosphere
13
Evidence of upstream and downstream solitary wavetrains coexistence in the real atmosphere Quanan Zheng College of Marine Studies, University of Delaware, Newark, Delaware, USA Samuel S. P. Shen Department of Mathematical Sciences, University of Alberta, Edmonton, Alberta, Canada Yeli Yuan The First Institute of Oceanography, SOA, Qingdao, Shandong, China Norden E. Huang Ocean &Ice Branch, NASA Goddard Space Flight Center, Greenbelt, Maryland, USA Victor Klemas and Xiao-Hai Yan College of Marine Studies, University of Delaware, Newark, Delaware, USA Fengyan Shi Center for Applied Coastal Research, Department of Civil Engineering, University of Delaware, Newark, Delaware, USA Xuebin Zhang and Zhongxiang Zhao College of Marine Studies, University of Delaware, Newark, Delaware, USA Xiaofeng Li and Pablo Clemente-Colón NOAA/NESDIS, E/RA3, Room 102, WWBG, 5200 Auth Road, Camp Springs, Maryland, USA Submitted to International Journal of Remote Sensing March, 2003
Transcript of Evidence of upstream and downstream solitary wavetrains coexistence in the real atmosphere
Evidence of upstream and downstream solitary wavetrains coexistence in the real
atmosphere
Quanan Zheng College of Marine Studies, University of Delaware, Newark, Delaware, USA Samuel S. P. Shen Department of Mathematical Sciences, University of Alberta, Edmonton, Alberta, Canada Yeli Yuan The First Institute of Oceanography, SOA, Qingdao, Shandong, China Norden E. Huang
Ocean &Ice Branch, NASA Goddard Space Flight Center, Greenbelt, Maryland, USA
Victor Klemas and Xiao-Hai Yan College of Marine Studies, University of Delaware, Newark, Delaware, USA Fengyan Shi Center for Applied Coastal Research, Department of Civil Engineering, University of Delaware, Newark, Delaware, USA Xuebin Zhang and Zhongxiang Zhao
College of Marine Studies, University of Delaware, Newark, Delaware, USA
Xiaofeng Li and Pablo Clemente-Colón NOAA/NESDIS, E/RA3, Room 102, WWBG, 5200 Auth Road, Camp Springs, Maryland, USA
Submitted to International Journal of Remote Sensing
March, 2003

From a true color image of the Sea-viewing Wide Field-of-view Sensor (SeaWiFS) onboard the
Orbview-2 satellite, we observed two packets of orderly wave clouds on two sides of Hainan
Island in the South China Sea. A packet of 23 wave clouds stretches southward from the island.
A second packet of more than 20 wave clouds stretches northeastward off the northeast coast of
the island. The concave orientation of the wave cloud lines implies that both packets are
propagating away from the island. A chart of geopotential height and velocity at 850 mb shows
a southwesterly air flow over the island; hence the two wave cloud packets propagate upstream
and downstream, simultaneously. Thus, we have found new evidence of the coexistence of both
upstream and downstream solitary wavetrains generated in the real atmosphere by land
topographic disturbances. Comparison with theoretical results supports this conclusion.
1. Introduction
In recent years, solitary wave packets (Zheng et al., 1998a), mountain waves (Eckermann
and Preusse, 1999), coastal lee waves (Zheng et al., 1998b; Li et al., 2001), island lee waves
(Vachon et al., 1994), gravity waves (Chunchuzov et al., 2000), vortex streets (Li et al., 2000),
and upstream wave packets (Li et al., 2002) in the atmosphere have all been identified from
satellite images. Most of these waves are generated by airflow over a topographic (or dynamical)
obstacle, constitute a single wave packet, and propagate in one direction only. Theories
developed by Grimshaw and Smyth (1986), Wu (1987), and Shen (1993), among others;
however, predicted that perturbation of a topographic obstacle could generate two separate wave
2
packets arranged on two sides of the topography. Recently, Porter and Smyth (2002) simulated
the morning glory of the Gulf of Carpentaria, Australia, using numerical solution of the
Benjamin-Ono equation. Their model indeed generated two solitary wavetrains propagating in
two opposite directions on two sides of the topography. Farmer and Armi (1999) and Armi and
Farmer (2002) measured the behavior of stratified water flow over bottom topography in Knight
Inlet, British Columbia, Canada. Their measurements also showed that an upstream solitary
wavetrain was indeed generated by the topography. Here we report a new case, which appears
on satellite images and provides striking evidence of the coexistence of both upstream and
downstream solitary wavetrains in the real atmosphere. In order to confirm this conclusion, we
will also show the comparison between the observed case with theoretical models derived by
Grimshaw and Smyth (1986).
2. Satellite Images
The SeaWiFS onboard the Orbview-2 satellite is an 8 band (6 visible and 2 near infrared)
optical scanner and was launched into a sun-synchronous orbit at 705-km altitude on August 1,
1997 (McClain et al., 1998). The images are produced by the National Aeronautics and Space
Administration (NASA) Goddard Space Flight Center (GSFC) and distributed by the Distributed
Active Archive Center (DAAC). There are two kinds of image products with different coverage
for users’ choices: Local Area Coverage (LAC) SeaWiFS images with a swath width of 2801 km
and a spatial resolution at nadir of 1.1 km, and Global Area Coverage (GAC) SeaWiFS images
with a swath width of 1502 km and a spatial resolution at nadir of 4.5 km. The images used for
this study are LAC images.
3

3. Interpretation
The case of interest is shown in figure 1. Previously studies suggest that all undular cloud
patterns represent signatures of atmospheric waves (Zheng et al., 1998a; Eckermann and Preusse,
1999; Li et al., 2001). A digitally orthorectified version of figure 1 (in black and white and not
shown here) was used to obtain accurate measurements of the phenomena. The packet stretching
southward from the island (P1) contains 23 waves. The concave orientation of the wave cloud
lines in P1 implies that the wave packet propagates southward. The average separation distance
(or wavelength) between solitons is 6.4 km. The maximum length of the crest lines is 330 km.
The packet located northeastward 200 km off the northeast coast of the Island (P2) contains more
than 20 waves. The concave orientation of the wave cloud lines in P2 again implies that the wave
packet propagates northward. The average wavelength of the first ten solitons is 9.8 km. The
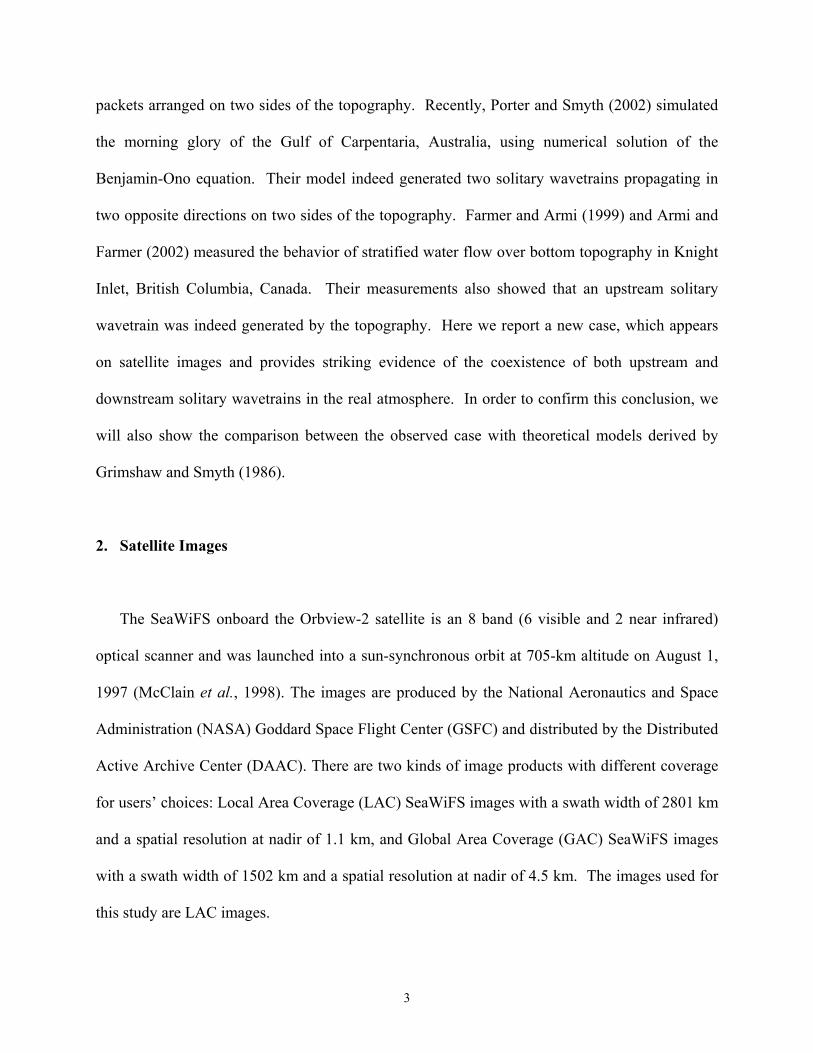
maximum length of crest lines is 370 km. Figure 2 shows charts of sea surface pressure and wind
velocity (upper) and geopotential height and velocity at 850 mb (lower) on the same date and
indicates a low pressure center moving southeastward from South China toward the study area.
At the sea surface, the wind is southerly at 5 ms-1. At 850 mb, it is southwesterly and around 10
ms-1. These observations provide additional evidence that wave packet P1 propagates upstream
and P2 downstream, respectively.
Figure 3 shows a cross section taken along the red line in Figure 1. Shown at the bottom
of the figure is the topography of Hainan Island with a 1/12º by 1/12º resolution. Most of the
island is covered by the Wuzhi Mountain with a peak at 1867 m above sea level located at
109º42’E 18º54’N near the center of the island. Shown at the top of the figure are the gray value
4

curves of the wave clouds. The gray values are related to cloud top altitudes, but are not
calibrated. In Figure 3, P1 is just in front of a steep topographic elevation rising from the ocean
surface, which constitutes a sudden obstruction in the way of the airflow, producing favorable
conditions for generating upstream solitons. P2 is distributed on the downstream side located 200
km off the coast of the island.
4. Comparison with Theoretical Models
In order to confirm relationship between the two coexisting atmospheric wave packets shown
on Figure 1 and to determine their dynamical features, we decide to compare the observed case
with available theoretical results. In the non-resonant case of continuously stratified flow of an
inviscid incompressible fluid over topography, Grimshaw and Smyth (1986) found a wave
motion solution in the form of
( ) ( ) ( TcXGcc
TcXGcc
XGVc
cA ss
s
sss
s
ss
s
ss
−−
++ ++−+
−−=
2222
2
), for , (1) ∞ππ T0
where π/2Nhcs = , in which N is the Brunt-Väisälä frequency and h is the vertical dimension of
the waveguide, and is the long-wave phase speed relative to a basic state at rest, V is a constant
horizontal velocity from left to right, ( )XsG is the normalized background topography,
, Vs ±ccs =± ( )Tcs+−XGs and ( )T−cXG ss + represent two coexisting, freely propagating long
waves, respectively, X is the slow space variable positive right, and T is the slow time variable.
Those waves ( )Tcs+−XsG with phase speed c propagate downstream, while those waves +
s
( )Tcs−+XGs with speed propagate upstream for subcritical flow, V , and propagate
downstream for supercritical flow, V
−sc scπ
scφ . This solution is derived based on the following
assumptions of lengthscales: a) the amplitude of the topography to be much less than the vertical
5

dimension of the waveguide; b) the wave amplitude to be much less than the vertical dimension
of the waveguide; and c) the horizontal lengthscale of the topography to be much greater than the
vertical dimension of the waveguide. The solution also predicts that, on a long timescale, the
freely propagating waves will be affected by nonlinearity and dispersion, and will evolve either
into a finite number of solitary waves, or into an oscillatory wavetrain.
In our case, the topography is imposed by the Hainan Island. The horizontal lengthscale
of the island is 250 km and the average amplitude of a mountain ridge along 19º N is 600 m.
The satellite image (figure 1) shows bands of clouds forming large clusters, 300-400 km in
extent. The morphology of these features indicates that the clouds are stratocumulus, a sort of
low-level cloud with the cloud top height lower than 3 km (Kidder and Vonder Haar, 1995).
This implies that the vertical dimension of the waveguide is less than 3 km. Cloud images have
solitary wave packet features the same as the case observed in the north Arabian Sea (Zheng et
al., 1998a). Hence, according to classification of atmospheric solitary waves by Rottman and
Grimshaw (2002), the waves we observed belong to the class of low-level solitary waves. The
lengthscales of our case meet assumption c), probably meet assumption a), but do not include the
wave amplitude scale. Here we consider assumption b) to be met so that we may compare our
case with theoretical solution (1). On the basis of solution (1), our case should be generated by
subcritical flow, because a wave packet propagates upstream and another downstream,
simultaneously. If the two wave packets coexist, in other words they were generated at the same
time, the following relation must be ture:
+− =s
d
s
u
cL
cL
, (2)
where and are upstream and downstream distances from the mountain ridge to the
upstream and downstream packets, respectively. From the digitally orthorectified version of
uL dL
6

Figure 1 (not shown here), we measure 140=uL km and 370=dL km. Substituting these value
into (2) yields
2/ =Vs
−s
h
sc sc
uda
.64.2=−+
=−
+
VcVc
cc
s
s
s
s (3)
From Figure 2, we determine V m s10= -1. Thus, we obtain 2.c , and m s22=sc -1. Both
the ratio and the value of c are close to that of morning glory cases (Rottman and Grimshaw,
2002). In other words, they are within a reasonable range. Therefore, we believe that relation (2)
stands in our case. This confirms the coexistence of upstream and downstream solitary wavetrains.
Vcs / s
Solution (1) also gives the normalized amplitudes of upstream ( ) and downstream ( )
solitary wavetrains. Substituting values of , , and into (1) yields = 1.83, and =
0.69. Although we can determine the ratio of these amplitudes based on satellite images, we
cannot determine their absolute values. The amplitude of a soliton is inversely proportional to the
square of the characteristic half width (Zheng et al., 2001), and the latter is directly proportional
to the width of a cloud image line no matter what imaging mechanisms. Therefore, the ratio of
and , , can be estimated from the satellite image. In our case we measure the average
image width of leading soliton of upstream wavetrain as 3.5 km, and that of the last soliton of
downstream wavetrain as 5.6 km, thus = 2.6. On the other hand, the theories give as
2.65. Both values are almost the same. This further confirms the coexistence of upstream and
downstream solitary wavetrains.
uA dA
dA
ud
+ c uA
uA dA uda
a
Using the above data, we calculate the generation time of the waves as of 3.2 hr earlier.
The vertical dimension of a waveguide can be calculated using Ncs 2/π= . If we take the
Brunt-Väisälä frequency N as 0.02 , a typical value for the low-level atmosphere (Rottman 1−s
7

and Grimshaw, 2002), we obtain an estimate for h of 1.7 km, which is close to the cases of
morning glory (Noonan and Smith, 1985). We also obtain an estimate for the Froude number
(V/Nh) of 0.3, implying subcritical flow in this case.
5. Conclusions
From SeaWiFSsatellite images we observed two packets of orderly wave clouds on two sides
of Hainan Island in the South China Sea. Weather charts and the concave orientations of the
wave cloud lines imply that the packets propagate both upstream and downstream in the wind
direction simultaneously. Our observation and interpretation are well supported by the wave
solutions derived by (Grimshaw and Smyth, 1986). Therefore, we conclude that this case
provides evidence for the coexistence of upstream and downstream solitary wavetrains generated
in the real atmosphere by topographic disturbances.
Acknowledgements This research was supported partially by the National Aeronautics and
Space Administration (NASA) through Grant NAG5-12745, by the Office of Navy Research
(ONR) through Grant N00014-03-1-0337, by the National Oceanic and Atmospheric
Administration (NOAA) through Grant NA17EC2449, and NOAA Sea Grant through
NA03OAR4170011.
8

References
Armi, L., and Farmer, D., 2002, Stratified flow over topography: bifurcation fronts and transition to
the uncontrolled state, Proceedings of the Royal Society of London Series A, 458, 513-538.
Eckermann, S. D., and Preusse, P., 1999, Global measurements of stratospheric mountain waves
from space, Science, 286, 1,534-1,537.
Farmer, D., and Armi, L., 1999, Stratified flow over topography: the role of small-scale
entertainment and mixing in flow establishment, Proceedings of the Royal Society London A,
455, 3221-3258.
Chunchuzov, I., Vachon, P. W., and Li, X., 2000, Analysis and modeling of atmospheric gravity
waves observed in RADARSAT SAR images, Remote Sensing of Environment, 74, 343-361.
Grimshaw, R. H. J., and Smyth, N., 1986, Resonant flow of a stratified fluid over topography.
Journal of Fluid Mechanics, 169, 429-464.
Kidder, S. G., and Vonder Harr, T. H., 1995, Satellite Meteorology, Academic Press, San Diego,
pp. 164-166.
Li, X., Clemente-Colón, P., Pichel, W. G., and Vachon, P. W., 2000, Atmospheric vortex streets
on a RADARSAT SAR image. Geophysical Research Letters, 27, 1,655-1,658.
Li, X., Zheng Q., Pichel, W. G., Yan, X.-H., Liu, W. T., and Clemente-Colón, P., 2001, Analysis
of coastal lee waves along the coast of Texas observed in advanced very high resolution
radiometer images, Journal of Geophysical Research, 106, 7,017-7,025.
Li, X., Clemente-Colón, P., Pichel, W. G., and Friedman, K., 2002, SAR and MODIS images of
atmospheric solitary waves generated by upstream blocking in flow over St.Lawrence Island
Bering Sea, Proceedings of the International Geoscience and Remote Sensing Symposium
(IGARSS 2002), Toronto, Canada, June 24-28, pp. 3.
9

McClain, C. R., Cleave, M. L., Feldman, G. C., Gregg, W. W., and Hooker, S. B., 1998, Science
quality SeaWiFS data for global biosphere research, Sea Technology, 39, 10-15.
Noonan, J. A., and Smith, R. K., 1985, Linear and weakly nonlinear internal wave theories
applied to “morning glory” waves, Geophysical and Astrophysical Fluid Dynamics, 33, 123-
143.
Porter, A., and Smyth, N. F., 2002, Modeling the morning glory of the Gulf of Carpentaria,
Journal of Fluid Mechanics, 454, 1-20.
Rottman, J. W., and Grimshaw, R., 2002, Atmospheric internal solitary waves, in Environmental
Stratified Flows ed. by R. Grimshaw, Kluwer Academic Publishers, Boston, pp. 61-88.
Shen, S. S. P., 1993, A Course on Nonlinear Waves. Kluwer Academic Publishers, London, 147-
187 pp.
Vachon, P. W., Johannessen, O. M., and Johannessen, J. A., 1994, An ERS-1 synthetic aperture
radar image of atmospheric lee waves, Journal of Geophysical Research, 99, 22,483-22,490.
Wu, T. Y.-T., 1987, Generation of upstream advancing solitons by moving disturbances, Journal
of Fluid Mechanics, 184, 75-99.
Zheng, Q., Yan, X.-H., Liu, W. T., Klemas, V., Greger, D., and Wang, Z., 1998a, A solitary wave
packet in the atmosphere observed from space, Geophysical Research Letters, 25, 3559-3562.
Zheng, Q., Yan, X.-H., Liu, W. T., Klemas, V., Ho, C.-R., Kuo, N.-J., and Wang, Z., 1998b, Coastal
lee waves on ERS-1 SAR images, Journal of Geophysical Research, 103, 7,979-7,993.
Zheng, Q., Yuan, Y., Klemas, V., and Yan, X.-H., 2001, Theoretical expression for an ocean
internal soliton SAR image and determination of the soliton characteristic half width, Journal
of Geophysical Research, 106, 31,415-31,423.
10

Figure legends
Figure 1. A true color SeaWiFS image taken on March 19, 1999. The waters of the northern
South China Sea are shown in dark blue. Aerosol contamination is evident to the west of the
Hainan Island. Two groups of wave clouds in white arrayed on the two sides of the island are
interpreted as signatures of upstream (P1) and downstream (P2) solitary wavetrains generated in
the real atmosphere by topographic disturbances. The red line represents the wind direction at
850 mb.
Figure 2. Weather charts for the observation area on March 19, 1999 (NCEP/NCAR Reanalysis
data taken from NOAA website). (a). Sea surface pressure and wind velocity. Units of color
code are Pa. Arrows represent the wind field. In the study area, the sea surface wind is southerly
and about 5 m s-1. (b). Geopotential height and wind velocity at 850mb isobaric lavel. Units of
color code are in m. Arrows represent the wind field. In the study area, the wind is southwesterly
and about 10 m s-1.
Figure 3. Cross section along the red line shown in Figure 1. The topography of Hainan Island
(extracted from ETOPO5 5’×5’ Navy bathymetry data taken from NAVY website) is shown at
the bottom. The grey value curves of wave packets P1 and P2 with arrows showing the
propagation directions are shown at the top.
11

Fig.1
12
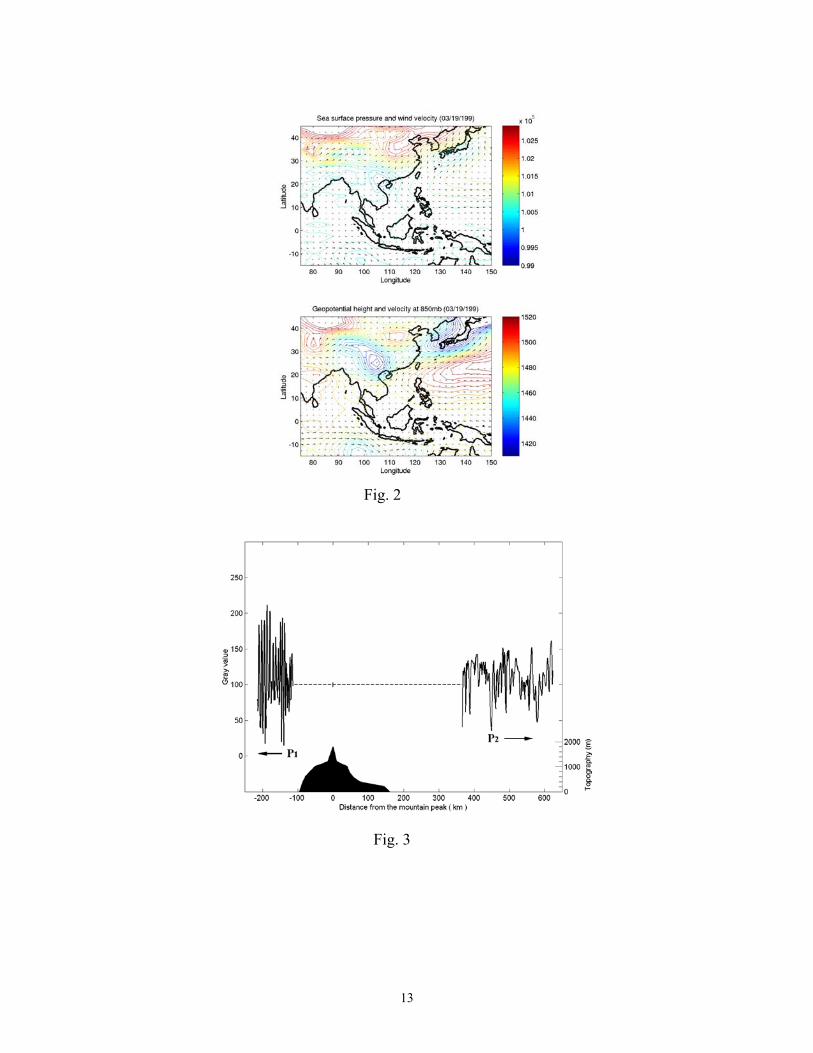
Fig. 2
Fig. 3
13