An analysis of household budget survey expenditures in Kosovo
14
Munich Personal RePEc Archive A nation’s mission of housing and food consumption: An analysis of household budget survey expenditures in Kosovo Aliu, Florin and Mulaj, Isa UBT College 30 October 2020 Online at https://mpra.ub.uni-muenchen.de/107850/ MPRA Paper No. 107850, posted 25 May 2021 01:34 UTC
-
Upload
khangminh22 -
Category
Documents
-
view
1 -
download
0
Transcript of An analysis of household budget survey expenditures in Kosovo

Munich Personal RePEc Archive
A nation’s mission of housing and food
consumption: An analysis of household
budget survey expenditures in Kosovo
Aliu, Florin and Mulaj, Isa
UBT College
30 October 2020
Online at https://mpra.ub.uni-muenchen.de/107850/
MPRA Paper No. 107850, posted 25 May 2021 01:34 UTC

9th Annual International Conference on Management, Business and Economics
UBT College, Pristina, 30-31 October, 2020
A nation’s mission of housing and food consumption: An analysis of
household budget survey expenditures in Kosovo
Florin Aliu1), Isa Mulaj2)
1) Faculty of Management, Business and Economics, UBT College, Republic of Kosovo, [email protected]
2) Department of Economic Research, Institute for Economic Policy Research and Analyses,
Republic of Kosovo, [email protected]
Abstract
In the digital and artificial intelligence intensification era where up to 2/3 of Gross Domestic
Product (GDP) is generated from the service sector, nearly ¾ of household budget is spent by the Kosovo
families in food and accommodation. This is a larger and greater share than in the neighboring countries
to which Kosovo approximately has the same level of income per capita. At the same time, for some years
spending for education until the recent available data remains below 1%, showing another difference with
the neighboring countries in volume as well as in total share of household budget expenditures. Using the
secondary data from the Kosovo Agency of Statistics (KAS) on household survey, this paper finds that the
ongoing high share of income spending in food and accommodation at the expense of other sectors becomes
a source of inefficiency. Moreover, this issue might plunge the households into unaffordable debts and
problems with their future payments. The population on a large scale consider much of their life mission
only through available incomes for food and housing (construction of houses and buying furniture) as a
wealth. In contrast to the previous studies, the recommendations from the findings of our work address
recommendations to the population, because the government, state and public institutions are a product of
this people whose primary life objective is in buildings and consumption on individual, family and clannish
bases.
Keywords: Kosovo, household budget survey, housing, consumption, education
JEL Classification: D19, G51
Suggested citation: Aliu, Florin and Mulaj, Isa (2020), “A nation’s mission of housing and food consumption: An analysis of household budget survey expenditures in Kosovo”, Proceedings of
the 9th Annual International Conference, UBT College, Pristina, 30-31 October, 2020.
DOI: 10.33107/ubt-ic.2020.281.

1. Introduction
Household as a cell of social and economic organization is also a component of the
economy as producer and consumer. Despite a distinction between household and family, this
paper uses them interchangeably as per data on household survey and family economies as one
unit. A family is also a household that is identified by its members such as parents, children, or
siblings living in the same house and jointly owning the property, but a household often cannot be
a family as the members living in the same house or apartment are not related by family such as
tenants who have their own separate economic life. The family economy has become a branch on
her own which until the 1960s, regardless of superficial references, has not been studied as a
separate discipline or was not given the due weight of research. Both family and household have
evolved during different historical stages and the circumstances occurring in the world. In
developed countries, there is a tendency of small size families, low birth rates, late marriage,
increased life expectancy, and a good network of social security. This trend is likely to be followed
by the developing countries upon their greater economic development.
After the 1999 war in Kosovo, what is known as the family economy was more identified
with the economy in rural areas, mostly focused on agriculture and livestock breeding. A survey
in 2004 with 1 000 Kosovo families divided into 542 in rural and 458 in urban areas, analyzed
their social and economic aspects. At the time, crediting in rural areas was exceptionally low,
where agriculture took part by only 2% in the total volume of loans. Of all families surveyed, only
5.7% in rural areas received loans compared to nearly twice that share (10.3%) in urban areas. The
total amount of loans delivered to family economies, 64% in villages and 46% in rural areas, had
a payback period of one year. The amount of loans for the majority of the families was below €5 000, and this was the case for 77% in rural and 57% in urban areas (Riinvest, 2004).
The number of family economies in Kosovo since 1948 has constantly risen along with the
total number of the population as well as family size. An exception is made after the 1999 war or
in the 2011 census, and this may be due to the change in social and economic conditions of the
population. The average number of members per family in Kosovo as per the 2011 census was 5.9,
down from 6.9 in 1981. The overwhelming majority of the families had children, with a dominant
group of four members. Out of 1,738,402 inhabitants registered in Kosovo (excluding the Serbs
who boycotted the census), 50.3% were males and 49.7% females, living in 297,090 family
economies. The total number of families was higher (415,090), and this figure differs from the
lower number of family economies and households since there are families without economies and
children, who live by renting the apartments, somewhere inside Kosovo, or in asylum of social
housing for the elderly (Kosovo Agency of Statistics – KAS, 2013).
This discussion study focuses on the areas of how and where the family budget is spent,
i.e. household budget survey expenditures. Besides, it is associated with investigating the source
of incomes, loans, and household debts accumulated. The rest of the paper is organized as follows:
first, a note about methodology and data used; the second section provides a literature review on
household budget survey; HBS is analyzed in third section where a comparison with the
neighboring countries were made as appropriate in a subsection; and, the last section concludes
with some remarks about future research.

2. Methodology and data
Registering and measuring the family economies is not an easy task, in part due to their
ambiguous definition with households. For a research purpose, family economies are mostly
analyzed in terms of household surveys like in many other countries. The base inclusive profile
was created by the population census as stipulated by the Law No. 03/L-237 on Population and
Household Census 2011, approved by the Kosovo Assembly on October 7, 2010. The census was
carried out in 2011 by the KAS. Another database from the KAS on family economies was through
Household Budget Surveys (HBS). They are supplemented by the data of the Central Bank of the
Republic of Kosovo (CBRK), namely those related to the loans and debts by family economies
compared to businesses. KAS and CBRK directly translate family economies from Albanian as
households, and that is why the data are used as being for one of the same category. In terms of
regional perspective, all Kosovo's neighboring countries such as Albania, Montenegro, North
Macedonia, and Serbia are included for descriptive comparative analysis in several indicators
limited to household share of expenditures by categories, loans, and accumulated debts or the focus
of the paper. Bosnia and Herzegovina is left out from consideration due to her more specific
political status (consisting of two entities) having many of their economic statistics separate, and
not bordering Kosovo.
3. Theoretical consideration and studies on household survey
Early economists were mostly interested in how individuals contribute to social production,
which translated into how much work they do in the labor market, but domestic production was
not the only one that received systematic treatment from early economists. The family as an
economic unit have been known since the time of Adam Smith, but did not attract enough attention
of scholars until the 1960s, when it began to be studied as an integral part of economic research
and theory (Schultz, 1974). In modern times, there is an increasing tendency for production to take
place in the family as part of the development economics. Parente et al. (2004) introduced
household production into a neoclassical model of economic growth to examine its implications.
Their results showed that the inclusion of household products according to the neoclassical growth
model can improve the ability to calculate differences in per capita income for different countries.
Therefore, an increase in income differences caused by different economic policies and the market
situation (monopolies, cartels, market failures, tax rates, price impacts, etc.), can be reduced,
among others, by promoting and supporting household production, whether for the market or other
reasons, such as consumption within the family. Why for consumption? Because, the incomes that
the family would spend to buy goods in the market, can save it for itself, so the money would not
go elsewhere in any business that would affect the increase in income differences.
The marginalist school, developed in the late 19th century, shifted the focus of the economy
away from the family. The focus of early marginalists like Leon Walras, Stanley Jevons, and
Alfred Marshall was on market transactions, thus any work by household was not of interest. On
the contrary, in the 1920s and 1930s, some economists argued that household production was an
important part of national production and without its inclusion, gross national product (GNP) could
not be a complete indicator of the national level (Jefferson and King, 2001). Despite its importance,
economists often try to avoid dealing with family or household economics. They justify this by
arguing that everyone in the family has the same interests, or if their interests change, the family
has a dominant member who decides for the rest. In many countries, women receive less food, less

free time, less education, and fewer inputs from their parents than their brothers. These
discrepancies are greater in large families. Thus larger families mean that inequality between
generations in terms of resource allocation is greater (Bauer and Mason, 1993). Larger families
living in the same household have a strong incentive to keep their older children at home for work,
denying them the future benefits of education. This pattern leads to earlier marriage, higher birth
rates, and higher poverty cycles. When girls from large traditional families reach adulthood, they
are more likely to perform traditional roles, have less knowledge of the world around them, less
profitable skills, and will be less able to access their resources. As a result, they will have less
bargaining power within the family, will be more dependent on their husband and children, and
less likely to use modern contraceptive methods and have more children (Lloyd, 1994).
The financial balances of the families were deeply affected by the 2007-8 global financial
crisis. When the effect of the crisis began to be felt, the family debts were relatively high compared
to disposable incomes. Despite increased attention for consumer loans in the media and Wall
Street, it did not become the main focus of the economists who were largely dealing with the
national economic consequences of the crisis. In deep contrast to the view that an increase in
consumer loans negatively impacts the economy, a consensus appears that such an increase is
positively associated with future consumption. There is little evidence that debt servicing of family
economies is positively related to future consumption, despite that some theoretical models suggest
a more complicated relationship can be operational. The heavy burden of debt servicing in
particular, can make family or household consumption more vulnerable (Maki, 2002). Other
studies have found that the families change the composition of their portfolio, such as the risk level
as a consequence of the financial crisis. Ramb and Scharnagl (2011) found that households in
Germany have reduced their stock holdings since the financial crisis by increasing the preference
for more liquid assets at the expense of assets at risk. As a result, overall stock holdings have fallen
in the portfolios, while savings deposits have shown an upward trend. At the same time, mutual
funds have increased in popularity as a result of the demand for risk diversification.
Household loans are provided and taken to improve the living standards of citizens, but
also to expand economic capacity. In the first case, they are known as consumer loans. To increase
consumption, households need different investments, and investments require financing.
Financing can be internal or from household savings, but in most cases, they need external
financing which can be provided by the banks and non-bank lending financial institutions.
Consumer credit can be defined as money, goods, or services provided to an individual in the
absence of immediate payment. The cost of the loan is the additional amount over the borrowed
amount, which the borrower has to pay. Some costs are mandatory, required by the lender as an
integral part of the loan agreement. Other costs, such as those for securing the loan, maybe
optional, where the borrower chooses whether or not to be part of the arrangement. Interest rates
and other payments are presented in different ways, but under many legislative regimes, lenders
must quote all liabilities in the form of an annual interest rate (Finlay, 2009).
Studying family finances is challenging because family behavior is difficult to measure
and families face limitations that are not captured by textbook models. There is some evidence that
households understand their limitations and avoid financial strategies for which they feel
unqualified. Many families seek advice from financial planners and other experts, however, some
families make decisions that are difficult to agree with this advice or any standard model. This
response leads to the view that behavioral financing theory describes the choices that families
currently make, while standard finance theory describes the choices that maximize the family well-
being and that the families can be educated to make choices. Another important aspect of

household financing is borrowing restrictions. Households need to take into account the fact that
their future consumption can be determined not only by wealth and investment opportunities, but
also by their expected net income if they are forced into borrowing. Borrowing restrictions may
be more important for new households than for older ones that have built up some retirement
savings. Aspects of the family finance life cycle also complicate normative theory because
stationary infinite horizon models cannot be used, but instead more complicated finite horizon
models that capture the evolution of financial strategy should be used as families refill and
accumulate financial wealth (Campbell, 2006).
Since mortgages make up the bulk of household debt in all countries, choosing the type of
mortgage is likely to have a significant impact on family well-being. Although other forms of
mortgages at fixed and adjusted rates are present, and mortgage contracts can vary across several
dimensions (e.g. maturity, prepayment options, refinancing options, etc.), most mortgages are held
by the households are fixed or customized. For example, based on 2007 data in the U.S., 17.2% of
mortgage holders had adjusted rates and the vast majority kept fixed rates (Hypostat, 2009). In a
fixed-rate mortgage, the borrower pays a constant nominal amount over some time and is thus
subject to inflation risk. Also, fixed rates carry the risk premium. If the mortgage contains a
prepayment option, borrowers can reduce their risk exposure by exercising it and moving to the
current moment with nominal market rates. Adjusted-rate mortgages are free from inflation risk,
but they are subject to income risk. Since adjustable rates are indexed to the short-term rates that
track inflation, the real value of the mortgage payment changes over time. However, to the extent
that nominal incomes are subject to fluctuations, and not fully at the same time indexed to inflation,
variations in nominal rates can cause significant declines in household consumption (Guiso and
Sodini, 2013).
To sum up this section, household and family economy are more complicated and with
diversified impacts in the national economy than the attention they receive by the scholars. The
complication arises from mixing, measuring, and reporting households and the family economies
as one. Certainly, there is a difference between them, and this can be proven by definition and
empirical research if they are considered separately.
4. Analyses and results
As noted in the methodological part, the database and figures used in this paper come from
the KAS, first from the 2011 census, and second from the HBS. Most households in Kosovo have
children, and the largest number of these families have between 4 and 5 members, with an overall
average of 5.9 members (see Annex I for a more detailed summary). HBS provides the statistics
on consumption, income, and other figures related to the standard of living by the households in
Kosovo. Amongst the important summary results of this survey were the consumption,
expenditures, and household income for 2013-2017, and living conditions during this period. The
survey sample included 2 400 randomly selected households. Household income, consumption,
and expenditure have wide dimensions. Let us first look at the total consumption.

Table 1. Total consumption in Kosovo, 2013-2017
Year in € million Consumption in € per household Consumption in € per capita
2013 a) 2,382 7,625 1,402
2014 a) 2,471 7,611 1,386
2015 a) 2,461 7,503 1,432
2016 b) 2,321 7,539 1,430
2017 b) 2,340 7,803 1,511
Source: a) KAS (2016), Table 1, p. 6.; b) KAS (2018), Table 1, p. 6.
By the end of 2017, total consumption was lower than in all previous years except in 2016.
Consumption per household has been falling steadily and for three years in a row (2014-2016)
remained lower than in 2013. Only in 2017, this figure recorded the highest level compared to
previous years. The same trend has followed consumption per capita. It may be an indication that
Kosovo households were in crisis or recession during 2013-2016 and they began to recover in
2017. Though an important indicator, consumption as a whole does not tell a clearer picture, but
its sources or by type where the households spend, tells a lot and becomes central with chain effect
for the rest of this paper.
Table 2. Distribution of total consumption by the type of consumption 2013-2017 (in %)
Consumption in 2013 a) 2014 a) 2015 a) 2016 b) 2017 b)
Food and beverages 45 44 43 42 40
Housing 30 28 30 29 29
Household food 6 6 7 6 5
Education 1 1 1 0 0
Other 18 21 19 23 26
Total 100 100 100 100 100
Source: a) KAS (2016), Table 2, p. 7; b) KAS (2018), Table 2, p. 7.
Housing includes construction or renovating a house, furniture, household appliances,
renting and associated expenses such as electricity and water supply bills. Household food is
related to subsistence agriculture, while education to the amount by the household for their children
spent in public and/or private schools, training, conferences, seminars, research, and so on. The
most notable feature is a higher share of food and beverages in total consumption which in 2013
made up to 45% and in 2017 by 40% (where meat accounts for 20% of its subtotal), to be followed
by housing. These two alone accounted for 75% or ¾ of total consumption by the households in
2013, and in the last year of reporting (2017) around 60%. It implies that the overwhelming
majority of consumption goes for food and housing. A striking indicator is the share of education
in spending as total consumption, which from 1% for three years in e row has dropped to 0% in
recent years. These figures are rounded percentage, e.g. when it was greater than 0.5% equaled as
1% and below 0.50% as 0%. How much further down can it go than 0%? A reader will find this
share as an alarm to the future of this society. And indeed it is. This can be proven by the OECD
(2019) report about PISA (Programme for International Student Assessment) where Kosovo in
2018 ranked somewhere at the bottom (75) out of a total of 78 countries. The most recent report
by the World Bank (2020) also indicates a worrisome situation with education in Kosovo. A child
born in Kosovo when grown will be only 57% productive. In harmonized test results Kosovo has
374 or just 74 points more than the minimum compared to the European average of 479. The
average of effective learning is 7.9 years and 5.3 years of schooling are lost. Even worse, it is
warning in a narrower sense and probably, as this paper will later show, one of the main causes of
debts in which Kosovo households are submerging to, more than in any other neighboring

countries with similar levels of income per capita. The households get the money for their
consumption from two main sources: i) incomes (various sources) and, ii) loans or debts. First, let
us have a look at the distribution of their incomes.
Figure 1. Sources of households’ income, in %.
Source: a) For 2014-2015, KAS (2016), Table 2, p. 7; b) For 2016-2017, KAS (2018), Table 5, p. 17,
and Authors' own calculations.
The household sector appears to be quite reliant on the wages and salaries it receives from
the public sector, which has increased slightly in favor of the private sector in the following years.
The sector which is its own, household business or family economy, has a relatively small share,
growing from 10% in 2014 to 13% by 2017, roughly at the same share with pensions. Remittances
are the fifth largest share of incomes for households by 8%. During the period 2014-2017, the
trend and volume of loans to households and enterprises appear as in the figure below.
Figure 2: Enterprise and household loans 2014-2017
Source: CBRK (2019), figure 20, p. 36.
The volume of loans to households, but also to enterprises has increased gradually. The
growth rate of loans to households was always higher than that of enterprises, reaching 14.7%
22
30
10
13
8
17
26
22
1113
9
19
25 26
11 11
8
19
23
29
13 12
8
15
0
5
10
15
20
25
30
35
Wages and
salaries (public
sector)
Wages and
salaries (private
sector)
Household
business
Pensions Remittances Other
2014 2015 2016 2017

growth in 2016, and 12.7% in 2017. In enterprises, the volume of loans was higher, the rate of
growth between the smallest years but there was a continuous growth trend reaching 10.7% in
2017. The increase in loans also means the accumulation of debts by entities that have received
and used them. Figure 3 gives an overview of debts from loans to enterprises and households,
which can be superficially compared to loans received.
Figure 3: Debt trend of enterprises and households
Source: CBRK (2020), figure 1, p. 17.
Households as well as enterprises throughout the period observed have accumulated larger
debts. This trend suggests that lending to households and enterprises is becoming less profitable,
they have greater difficulty in repaying the loans, and this is further related to the purposes of using
loans. This gives the impression that there are funds available from and to households, but their
lending is resulting more in debts than in growth and development. The debt-to-income ratio has
reached 30%, and expenditure affordability to 43%. To better understand for a longer period the
issue of household lending, the following are the calculations based on the period 2007-2017, from
data of the CBRK.
Table 3. Lending to households about total loans 2007-2017 Years Loans in € mil. Change in % Total loans in €
mil.
Change in % % in total loans
2007 200.6 100.0 892.1 100.0 22.5
2008 281.0 140.1 1183.4 132.7 23.7
2009 343.5 122.2 1289.0 108.9 26.6
2010 434.2 126.4 1458.7 113.2 29.8
2011 514.6 118.5 1698.1 116.4 30.3
2012 546.3 106.2 1763.4 103.8 31.0
2013 567.7 103.9 1805.8 102.4 31.4
2014 625.3 110.1 1882.4 104.2 33.2
2015 697.7 111.6 2019.5 107.3 34.5
2016 799.1 114.5 2230.0 110.4 35.8
2017 900.4 112.7 2485.5 111.5 36.2
Source: CBRK (2018).
For a period of 11 years, the volume of loans to households marked a continuous growth
trend. From 2007 to 2017 this volume increased 4.5 times from 200.6 to 900.4 million. Lending to
this sector from year to year has had a higher growth rate than any type of sector, even in some
periods where the growth of total loans is presented with the highest rate, such as in 2008 by
32.7%, in households this increase was 40.1%. Moreover, the last column in the table that presents
the share of loans to households within total loans, shows a continuous and significant increase in
participation from 22.5% to 36.2%. This is also an indication that lending to households is gaining
momentum. Over the period from 2007 to 2017, the cumulative household lending has reached
close to €6 billion, €5,910.4 million respectively.
4.1. Comparative analysis with neighboring countries
As of 2017, the countries bordering Kosovo have significantly lower family size members,
which ranges from 2.9 members in Serbia’s households, to 3.2 in Montenegro, 3.6 in North Macedonia, and 3.9 in Albania (United Nations, 2017). Kosovo’s neighboring households, too,
have seen an ongoing increase in borrowing as well as accumulated debts. Apart from these two,
the indicators for comparison in this subsection will take into account several consumption
categories referred to for Kosovo earlier, and with a specific emphasis on education and how they
ranked in PISA. First, the following Table provides the figures about the volume of loans delivered
to the households in the neighboring countries.
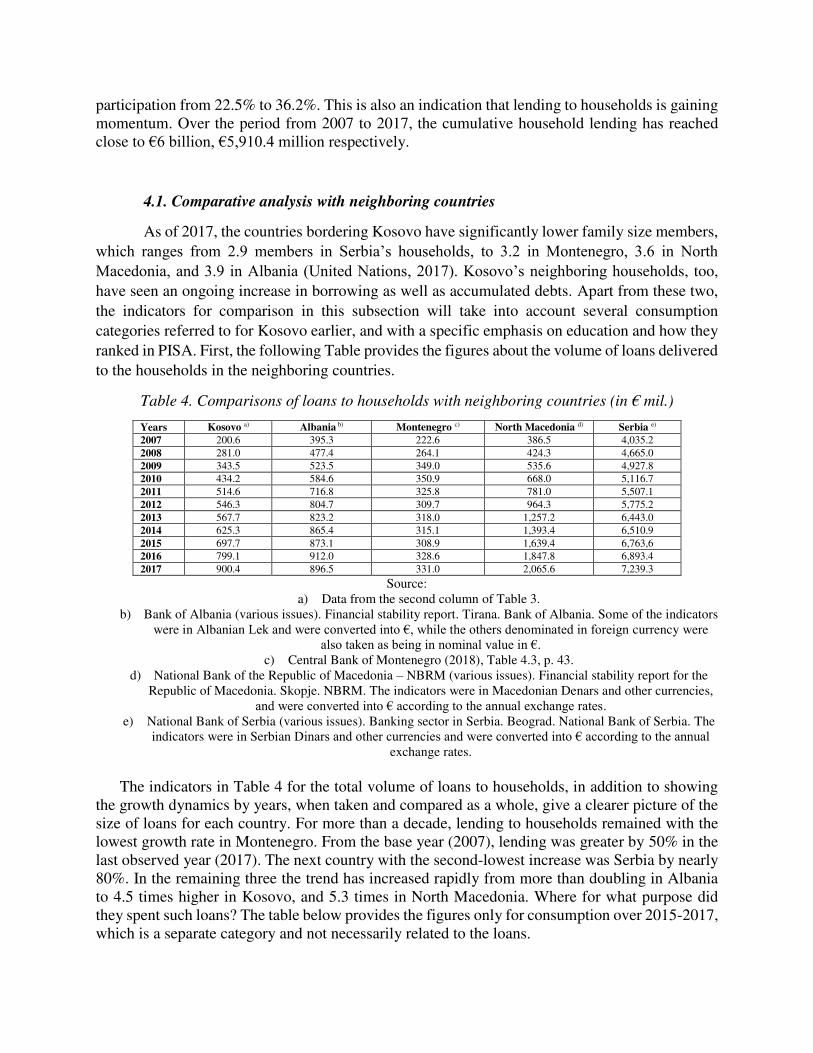
Table 4. Comparisons of loans to households with neighboring countries (in € mil.)
Years Kosovo a) Albania b) Montenegro c) North Macedonia d) Serbia e)
2007 200.6 395.3 222.6 386.5 4,035.2
2008 281.0 477.4 264.1 424.3 4,665.0
2009 343.5 523.5 349.0 535.6 4,927.8
2010 434.2 584.6 350.9 668.0 5,116.7
2011 514.6 716.8 325.8 781.0 5,507.1
2012 546.3 804.7 309.7 964.3 5,775.2
2013 567.7 823.2 318.0 1,257.2 6,443.0
2014 625.3 865.4 315.1 1,393.4 6,510.9
2015 697.7 873.1 308.9 1,639.4 6,763,6
2016 799.1 912.0 328.6 1,847.8 6,893.4
2017 900.4 896.5 331.0 2,065.6 7,239.3
Source:
a) Data from the second column of Table 3.
b) Bank of Albania (various issues). Financial stability report. Tirana. Bank of Albania. Some of the indicators
were in Albanian Lek and were converted into €, while the others denominated in foreign currency were
also taken as being in nominal value in €. c) Central Bank of Montenegro (2018), Table 4.3, p. 43.
d) National Bank of the Republic of Macedonia – NBRM (various issues). Financial stability report for the
Republic of Macedonia. Skopje. NBRM. The indicators were in Macedonian Denars and other currencies,
and were converted into € according to the annual exchange rates.
e) National Bank of Serbia (various issues). Banking sector in Serbia. Beograd. National Bank of Serbia. The
indicators were in Serbian Dinars and other currencies and were converted into € according to the annual exchange rates.
The indicators in Table 4 for the total volume of loans to households, in addition to showing
the growth dynamics by years, when taken and compared as a whole, give a clearer picture of the
size of loans for each country. For more than a decade, lending to households remained with the
lowest growth rate in Montenegro. From the base year (2007), lending was greater by 50% in the
last observed year (2017). The next country with the second-lowest increase was Serbia by nearly
80%. In the remaining three the trend has increased rapidly from more than doubling in Albania
to 4.5 times higher in Kosovo, and 5.3 times in North Macedonia. Where for what purpose did
they spent such loans? The table below provides the figures only for consumption over 2015-2017,
which is a separate category and not necessarily related to the loans.

Table 5. Distribution of consumption by countries and categories, in %
Countries Years Food and
beverages
Housing and
appliances
Household
food and
Services
Education Other Total
Albania
2015 48.7 15.1 5.8 2.1 28.3 100.0
2016 45.2 15.2 6.5 4.3 28.8 100.0
2017 44.0 15.7 6.1 3.9 30.3 100.0
Kosovo
2015 43 30 7 1 19 100
2016 42 29 6 0 23 100
2017 40 29 5 0 26 100
Montenegro
2015 30.7 18.3 5.2 2.5 43.3 100.0
2016 n/a n/a n/a n/a n/a n/a
2017 29.7 16.8 4.9 2.1 46.5 100.0
North
Macedonia
2015 38.5 18.4 4.4 0.4 38.3 100.0
2016 40.7 18.3 4.4 0.7 35.9 100.0
2017 37.8 16.8 4.8 0.2 40.4 100.0
Serbia
2015 35.0 20.2 5.6 0.9 38.3 100.0
2016 34.8 20.3 5.9 1.1 37.9 100.0
2017 34.5 21.3 6.0 1.2 37.0 100.0
Sources: Authors’ own elaboration based on the national statistical agencies of the respective countries.
n/a – data not available or the HBS was not conducted.
The share of consumption by households in Albania and Kosovo appears to be mostly
concentrated in food and beverages, by more than 10% on average than in Montenegro and Serbia.
As the households in neighboring countries spent more in education as a share of consumption
expenditures, they also fare better in terms of education compared to Kosovo. Referring again to
the PISA test results of 2018 were Kosovo ranked 75, the countries bordering her had this general
rankings: Serbia 44, Montenegro 54, Albania 55, and North Macedonia 67. The figures in Table 5
appear to confirm the relation between low spending in education and low ranking in the PISA
test, especially for Kosovo and North Macedonia. An exception can be make for Albania whose
consumption as spending for education had the highest share, but ranks in test behind Serbia and
Montenegro.
Borrowing by households in Albania has constantly risen and this has reflected into debts.
Repayment ability had not changed for 60% of households during the period surveyed (2013-
2017), while the rest experienced a deterioration regarding the repayment of the loans. Around
28% of the families reported that they had at least one debt not paid for (Bank of Albania, 2018).
In Montenegro, borrowing by households and enterprises over 2015-2017 has increased as the
interest rate on loans fell from 8% to 5.5%, but the real wages among the households fell as a result
of increased debts (Central Bank of Montenegro, 2018). In North Macedonia, households are the
most important clients of the banking system and the entire financial system, because their cyclical
behavior proved to be important for financial stability, especially in 2015 and 2016. As in other
countries in the region, most of the loans have gone for consumption, even increasing in share
from year to year, from 42.9% in 2013 to 48.6% in 2017 (NBRM, 2018). Household lending in
Serbia continued to grow in 2017, reaching 857.7 billion dinars (€ 7,239 million) representing 43% of total loan volume, and 20.3% of GDP. Much of this growth continued to be driven by cash loans
(including refinancing loans). The trend of household lending is likely to continue to grow in
Serbia driven smaller ratio of debts, competition between the banks eased lending terms and
conditions (National Bank of Serbia, 2017). However, Aliu and Nadirov (2016) confirm that
Kosovo banking industry is highly concentrated and interest rates on lending do not justify the risk
that the banks are exposed to.
To sum up this section, Kosovo and her neighboring countries continue to increase their
borrowing from the banks and other financial institutions, while at the same time households have

increased their debts. Much of the spending or household consumption expenditures is focused on
food and non-alcoholic beverages with Kosovo having the highest share of it and lowest in
education.
5. Conclusion and future research
Individuals and households get e kind of relief upon receiving a credit line or loan which
can boost their activity for investment and consumption, if their ongoing incomes allow the
payback. However, in the course of spending the loan, they are not able to anticipate if something
at the national level such as market failures, financial crashes, or even a global crisis occurs.
Economists on the other hand focus more their studies on national economies or cases related to
businesses and corporations. This is a gap that this discussion paper has tried to build a bridge
between focusing on households and their impact on various national sectors of the economy such
as consumption, investment, education, and most importantly, the banks that remain for future
research.
Kosovo households spend much of their incomes and loans for food, housing, and
accommodation. This has led them into considerable accumulated debts, a worse situation than in
her neighboring countries. The share of education by 1% or below in total consumption
expenditures fits well into the theory that less educated people are more likely to be plunged into
debts, and this trend continues on both fronts (more debts and less education) to worsen. The most
important finding of this paper in line with the mainstream theory is that the average family size
in Kosovo, as of 2011 census, is relatively large (5.9 members), and this comes at the expense of
many members having less access to more education. This can be proven by double sources: first,
by fairly symbolic or zero percent spending in education by the households as part of total
consumption expenditures, and second, by the PISA test results which ranks Kosovo somewhere
at the bottom and far behind the neighboring countries. Consequently, households have less
knowledge about the loans, require assistance, do not care much about the financial crisis and
market failures that may be just around the corner, but in the end, it is them who have to pay the
bill or face consequences. There is little the government or the international organizations can do
to reverse this unfavorable trend in the short to medium term. Therefore, the main recommendation
from this discussion paper does not go to the government but to the households even on an
individual basis – to convince them by a hard talk and counselor services that the source of their
debts and bleak prospects for the future have their address on very small share or even no spending
in education, which is worse than the debts themselves. Future research should also be undertaken
separately in comparison with each other, among households and family economies as they are
different, therefore have different impacts on a national economy. Finally, this paper leaves an
open topic for research which it has identified from a disproportional or higher spending in
housing. Will this lead to a housing bubble in Kosovo?
References
1. Aliu, F., and Nadirov, O. (2016). Kosovo banking paradox. Academic Journal of Economic
Studies, 2(4), 11-22.
2. Bank of Albanian (2018). Financial stability report. Tirana. Bank of Albania.
3. Bauer, J. and Mason, A. (1993). Equivalence scales, costs of children and poverty in the Philippines
and Thailand, in Fertility, Family Size and Structure: Consequences for Families and Children, C.B.
Lloyd (ed.), New York. Population Council, 13-39.
4. Campbell, J. Y. (2006). Household Finance. The Journal of Finance 61 (4): 1553-1604.
5. Central Bank of Montenegro (2018). Financial stability report 2017. Podgorica. Central Bank of
Montenegro
6. Central Bank of the Republic of Kosovo – CBRK (2018), Financial Stability Report, No. 13, Pristina.
CBRK.
7. Central Bank of the Republic of Kosovo – CBRK (2019), Annual Report 2018, Pristina. CBRK.
8. Central Bank of the Republic of Kosovo – CBRK (2020). Financial Stability Report, No. 16, Pristina.
CBRK
9. Finlay, S. (2009). Consumer Credit Fundamentals (2nd ed.). New York. Palgrave Macmillan.
10. Guiso, L. and Sodini, P. (2013). Household Finance: An Emerging Field. Handbook of the Economics
of Finance. Chapter 21. Amsterdam. Elsevier, 1397-1532.
11. Hypostat (2009). A review of Europe’s mortgage and housing markets. European Mortgage Federation. AMECO Database. Luxembourg. Eurostat.
12. Albanian Agency of Statistics - Instat (2016). Household Budget Survey 2015.
13. Albanian Agency of Statistics - Instat (2017). Household Budget Survey 2016. Tirana.
14. Albanian Agency of Statistics - Instat (2018). Household Budget Survey 2017. Tirana. Instat.
15. Jefferson, T. and King, J. (2001). Never Intended to be a Theory of Everything: Domestic Labor in
Neoclassical and Marxian Economics. Feminist Economics 7 (3): 71–101.
16. Kosovo Agency of Statistics – KAS (2013), “Kosovo Population and Housing Census 2011: Results.
Pristina. KAS.
17. KAS (2016), “Results of the household budget survey 2015”, Series 5: Social Statistics, Pristina” KAS. 18. KAS (2018), “Results of the household budget survey 2017”, Series 5: Social Statistics, Pristina” KAS. 19. Lloyd, C. B. (1994). Investing in the Next-generation: Implications of high Fertility at the Level of the
Family. Research Division Working Paper, No. 63, New York. Population Council.
20. Maki, D. M. (2002) ed., The Growth of Consumer Credit and the Household Debt Service Burden.
The Impact of Public Policy on Consumer Credit, Chapter 3, 43-68.
21. National Bank of the Republic of Macedonia - NBRM (2018). Financial stability report for the Republic
of Macedonia in 2017. Skopje. NBRM.
22. National Bank of Serbia (2017). Trends in lending: First quarter report 2017. Belgrade. National Bank
of Serbia.
23. National Bank of Serbia (2018). Banking sector in Serbia. Beograd. National Bank of Serbia.
24. Parente, S.L., Rogerson, R. & Wright, R., (2000). Homework in Development Economics: Household
Production and the Wealth of Nations. Journal of Political Economy 108: 680-687.
25. OECD (2019). PISA 2018 Worldwide Ranking – average score of mathematics, science, and reading,
available at: https://factsmaps.com/pisa-2018-worldwide-ranking-average-score-of-mathematics-
science-reading/, accessed on September 2020.
26. Ramb, F. and Scharnagl, M. (2011). Households' Portfolio Structure in Germany- Analysis of Financial
Accounts Data 1959-2009 (Report 1335) Frankfurt am Main. European Central Bank.

27. Riinvest (2004). Rural development in Kosovo, research report, Promoting economic development
through civil society II, Pristina. Riinvest.
28. Schultz, Th. W. (1974). ed., Economics of the Family: Marriage, Children, and Human Capital,
Chicago: University of Chicago Press.
29. Statistical Office of Montenegro – Monstat (2016). Household Budget Survey in 2015. Podgorica.
Monstat. Release No. 107.
30. Statistical Office of Montenegro – Monstat (2018). Hoousehold Budget Survey in 2017. Podgorica.
Monstat. Release No. 98/82.
31. State Statistical Office of the Republic of Macedonia (2016). Household Consumption in the Republic
of Macedonia 2015. Skopje. Statistical review No. 849.
32. State Statistical Office of the Republic of Macedonia (2017). Household Consumption in the Republic
of Macedonia 2015. Skopje. Statistical review No. 872.
33. State Statistical Office of the Republic of Macedonia (2018). Household Consumption in the Republic
of Macedonia 2015. Skopje. Statistical review No. 892.
34. Statistical Office of the Republic of Serbia (2017). Household Budget Survey Serbia 2017. Beograd.
Statistical Release No. 346, Year LXVII.
35. Statistical Office of the Republic of Serbia (2018). Statistical Yearbook of the Republic of Serbia
2018. Beograd. No. 51.
36. United Nations (2017). Household Size and Composition Around the World 2017 – Data Booklet.
United Nations. Geneva. Department of Economic and Social Affairs. Population Division.
37. World Bank (2020). The Human Capital Index 2020 Update: Human Capital in the Time of COVID-
19. Washington D.C. World Bank.
ANNEX I: Profile of family economies in Kosovo as per 2011 census
Settlement Families With
children
No children With 2
members
With 3
members
With 4
members
With 5
members
6>
Urban 163,232 135,076 28,156 34,291 32,381 43,201 32,894 20,459
Rural 251,858 208,743 43,115 50,830 43,666 57,282 52,277 47,785
Total 415,090 343,819 71,271 85,121 76,047 100,483 85,171 68,244
Total in % 100.0 82.3 17.7 20.5 18.3 24.2 20.5 16.4
Ownership
With
property
Private Public Mixed Joint property Other
Urbane 128,131 125,774 1,025 498 295 539
Rural 168,959 167,679 235 285 375 385
Total 297,090 293,453 1,260 783 670 924
Total in % 100.0 98.8 0.4 0.3 0.2 0.3
Gender composition
Members of the family economy Members of agriculture
Economies Inhabitants Male Female Total Male Female Missing
Total 297-,090 1,738,402 874,814 863,588 652,956 331,269 321,687 19
Total in % 100 100 50.3 49.7 100 50.7 49.3 -
Source: KAS (2013), “Kosovo Population and Housing Census 2011: Final Results. Pristina. KAS, Table 1.2, p.13; Table 1.6, p.48; and Table 1.9, p. 57, and Authors’ own calculation.