Kosovo Migration Profile 2013 - Prague Process
161
2013 GOVERNMENTAL AUTHORITY FOR MONITORING OF MIGRATION MOVEMENTS Kosovo Migration Profile
-
Upload
khangminh22 -
Category
Documents
-
view
2 -
download
0
Transcript of Kosovo Migration Profile 2013 - Prague Process

2013
GOVERNMENTAL AUTHORITY FOR MONITORING OF MIGRATION
MOVEMENTS
Kosovo
Migration Profile

1
MP
KO
SO
VA
20
13
All rights are reserved. No part of this publication can be reproduced, copied or transmitted in
whatever form or with whatever means, electronic or mechanical, including photocopying,recording,or
any other ingathering of the information and correction system(throwback),without the permission of
the rights of the authors-Governmental Authority for Monitoring of Migration Movements-
Government of the Republic of Kosovo.

2
MP
K
OS
OV
A
20
13
KOSOVO
Migration Profile 2013
Crafted by:
Ministry of Internal Affairs
Kosovo Police
Civil Registry Agency
Ministry of Diaspora
Ministry for Communities and Returns
Ministry of Economic Development
Ministry of Education, Science and Technology
Ministry of Finance
Ministry of Foreign Affairs
Ministry of Labor and Social Welfare
Ministry of Trade and Industry
Ministry of European Integration
Kosovo Central Bank
Kosovo Agency of Statistics
Supported by:
International Organization for Migration
United Nations High Commissioner for Refugees
European Union Office in Kosovo

3
MP
KO
SO
VA
20
13
CONTENTS
LIST OF TABLES ....................................................................................................................................... 7
LIST OF GRAPHICS .................................................................................................................................. 9
FOREWARD ............................................................................................................................................. 14
ABBREVIATIONS AND ACRONYMS ................................................................................................... 14
GENERAL INFORMATION FOR THE STATE .................................................................................... 17
PART A: INTRODUCTION ..................................................................................................................... 18
A1. GENERAL OVERVIEW ..................................................................................................................... 18
A2. BACKGROUND OF MIGRATION IN KOSOVO ...................................................................................... 21
PART B: ANALYSIS OF THE SOCIO-ECONOMIC CONTEXT OF MIGRATION ........................... 22
B1. THE POPULATION OF KOSOVO ........................................................................................................ 22
B1.1. RESIDENT POPULATION ............................................................................................................................ 22
B1.2.POPULATION GROWTH, ETHNIC COMPOSITION AND DENSITY ................................................................. 22
B2. ECONOMY AND ECONOMIC CLIMATE .............................................................................................. 22
B2.1. ECONOMY ................................................................................................................................................. 22
B2.2. ESSENTIAL ECONOMIC POLICIES .............................................................................................................. 23
B2.3. MAIN MACROECONOMIC INDICATORS ...................................................................................................... 23
B2.4. THE INVESTMENT CLIMATE ....................................................................................................................... 26
B2.5. CAPITAL INVESTMENTS ............................................................................................................................ 28
B2.6. FOREIGN DIRECT INVESTMENT ................................................................................................................ 28
B2.7. MIGRANT REMITTANCES (REMITTANCES) ................................................................................................ 30
B2.8. COMPENSATION OF EMPLOYEES ............................................................................................................... 32
B2.8. INFORMAL ECONOMY ............................................................................................................................... 32
B2.9. BUSINESS .................................................................................................................................................. 33
B3. LABOR MARKET ANALYSIS ............................................................................................................. 40
B3.1. MAIN INDICATORS OF LABOR MARKET..................................................................................................... 40
B3.2. ASSESSMENT OF NEEDS AND THE MAIN CHALLENGES FOR EMPLOYMENT AND VOCATIONAL TRAINING 41

4
MP
K
OS
OV
A
20
13
B3.3.MULTIPLE NEEDS FOR SOCIAL PROTECTION .............................................................................................. 44
B4. HUMAN CAPITAL ............................................................................................................................. 47
B4.1. DEGREE / LEVEL OF EDUCATION ............................................................................................................... 47
B4.2. THE ABILITY TO ACCESS THE EDUCATIONAL SYSTEM .............................................................................. 48
B4.3. ACCESS TO HIGHER EDUCATION ............................................................................................................... 48
B4.5.THE SHORTCOMINGS AND CHALLENGES OF THE EDUCATION SECTOR ...................................................... 49
PART C: ABALYSIS OF MIGRATION SITUATION IN THE COUNTRY / STATE .......................... 50
C2.IMMIGRATION ................................................................................................................................. 51
C2.1. VISA REGIME ............................................................................................................................................ 51
C2.2. FOREIGNERS WHO STAY IN KOSOVO AND THE TYPE OF IMMIGRANTS ..................................................... 53
C2.2. FOREIGNERS WHO HAVE ACQUIRED AND HAVE BEEN DENIED CITIZENSHIP OF THE REPUBLIC OF KOSOVO
........................................................................................................................................................................... 58
C2.3 IRREGULAR IMMIGRANTS .......................................................................................................................... 61
C2.4 ASYLUM AND DETERMINATION OF THE INTERNATIONAL PROTECTION STATUS ....................................... 82
C3. EMIGRATION .................................................................................................................................. 86
C3.1 APPLICATIONS FOR VISAS .......................................................................................................................... 86
C3.1 THE TOTAL NUMBER OF EMIGRANTS ......................................................................................................... 88
OF THE TOTAL, IN 2013 LEAD COUNTRIES: GERMANY (39%), SWITZERLAND (13%), AND ITALY (12%). 89
C3.2 CATEGORIES OF EMIGRANTS ..................................................................................................................... 89
C3.3 LABOR MIGRANTS...................................................................................................................................... 90
C3.4 IRREGULAR EMIGRANTS ............................................................................................................................ 96
C4. DIASPORA .................................................................................................................................... 103
C5. REPATRIATION AND REINTEGRATION OF KOSOVO CITIZENS RETURNED FROM FOREIGN COUNTRIES
........................................................................................................................................................... 107
C5.1. VOLUNTARY AND FORCED READMISSION .............................................................................................. 107
C5.2. THE REINTEGRATION OF REPATRIATED PERSONS ................................................................................... 115
C6. INTERNALLY DISPLACED PERSONS (IDP) AND DISPLACED PERSONS IN THE REGION (DPR) SERBIA,
MONTENEGRO, THE FORMER YUGOSLAV REPUBLIC OF MACEDONIA) ................................................ 119

5
MP
KO
SO
VA
20
13
PART D: MIGRATION POLICIES AND PROGRAMS AND THEIR EFFECTIVENESS IN
MANAGEMENT OF MIGRATION AND CHALLENGES OF DEVELOPMENT ............................. 122
D1. POLICY FRAMEWORK AND LAWS ON MIGRATION IN KOSOVO ....................................................... 122
D1.1. THE POLICY FRAMEWORK ...................................................................................................................... 122
D1.2. THE LEGAL FRAMEWORK IN THE FIELD OF MIGRATION ......................................................................... 123
D1.3. INTERNATIONAL LEGAL FRAMEWORK IN THE FIELD OF MIGRATION ..................................................... 127
D2. OVERVIEW OF NATIONAL INSTITUTIONAL FRAMEWORK AND STAKEHOLDERS IN THE FIELD OF
MIGRATION ......................................................................................................................................... 130
D2.1. LOCAL INSTITUTIONS IN THE FIELD OF MIGRATION ............................................................................... 130
D2.2. ORGANIZATIONS AND CIVIL SOCIETY ACTORS IN THE FIELD OF MIGRATION ......................................... 131
D3. REGIONAL AND INTERNATIONAL COOPERATION ON MIGRATION ................................................... 131
D3.1 COOPERATION WITH ORGANIZATIONS AND REGIONAL AND INTERNATIONAL INITIATIVES, AS WELL AS
OTHER INTERNATIONAL ACTORS IN THE FIELD OF MIGRATION ........................................................................ 131
D3.2. BILATERAL COOPERATION IN THE FIELD OF MIGRATION ....................................................................... 132
PART E: ASSESSMENT OF THE IMPACT OF MIGRATION AND MIGRATION POLICY FOR
SOCIO-ECONOMIC DEVELOPMENT ................................................................................................ 133
E1. THE EFFECTS OF MIGRATION ON SOCIO-ECONOMIC DEVELOPMENT OF THE COUNTRY OF ORIZIN . 133
E1.2. IMPACT OF MIGRATION ON TRADE AND INVESTMENT ............................................................................ 135
E1.3. THE SOCIAL IMPACT OF MIGRATION ....................................................................................................... 136
E2. EFFECTS OF SOCIO-ECONOMIC DEVELOPMENT OF MIGRATION POLICIES AND OTHER INTERVENTIONS
AIMED AT MIGRATION ......................................................................................................................... 136
PART F: CONCLUSIONS ...................................................................................................................... 139
F1. THE MAIN MIGRATION RESULTS (FINDINGS) WITH RESPECT TO FUTURE MIGRATION TENDENCIES ........... 140
REGULAR MIGRATION ........................................................................................................................ 141
IRREGULAR MIGRATION ..................................................................................................................... 141
ASYLUM-SEEKERS IN KOSOVO ............................................................................................................ 141
KOSOVAR ASYLUM-SEEKERS IN EU STATES ........................................................................................ 141
F2. IMPROVEMENT OF MIGRATION STATISTICS ................................................................................... 142
F3. RECOMMENDATIONS RELATED TO MIGRATION MANAGING ........................................................... 144

6
MP
K
OS
OV
A
20
13
ATTACHMENTS .................................................................................................................................... 147
I – SOURCES AND THE VARIABLES (VARIABLES) USED FOR DATA COLLECTION .................................... 147
THE SOURCES USED FOR DATA COLLETION ................................................................................................ 147
II –STATISTICAL APPENDIX FOR ADDITIONAL TABLES (EXTRA ) AND FIGURES .................................... 148
III – REFERENCES ................................................................................................................................ 159

7
MP
KO
SO
VA
20
13
List of tables
TABLE1:INDICATORS , ACCORDING MACROECONOMIC IN YEARS 2009 - 2013 ....................... 24
TABLE 2: THE TAX LIABILITIES - 2013 ...................................................................................... 26
TABLE3: KOSOVO IN LIST OF COUNTRIES MORE REFORMERSIN THE WORLD ...................... 28
TABLE4: MIGRANT REMITTANCES – ACCORDING TO CHANNELS (IN MILLIONS OF EUROS,
NON-CUMULATIVE STATISTICS), 2006 - 2013 ............................................................................ 31
TABELA 5: MIGRANTS REMITANCES BY COUNTRY, IN PERCENTAGE, 2008 - 2013 .................. 31
TABLE 6:TRADE BALANCE FOR GOODS (IN MILLIONS OF EUROS), 2010 - 2013 ........................ 33
TABLE7: TRADE GROUPS OF STATES IN THE PERCENTAGE, (2010 – 2013) ............................... 34
TABLE8: KEY INDICATORS OF THE LABOR MARKET (%), 2013 ................................................ 40
TABLE9: THE LABOR MARKET SUMMARY, 2012 - 2013MESHK ................................................ 40
TABLE10: SOCIAL PROTECTION SYSTEM IN KOSOVO, SCHEMES, NUMBER OF BENEFICIARIES
AND EXPENSES, 2012 ................................................................................................................ 44
TABLE11: EDUCATION LEVEL OF THE POPULATION EXPRESSED IN PERCENTAGE, 2011/2012,
2012/2013 AND 2013/2014 ........................................................................................................... 47
TABLE12: PERCENTAGE OF INCLUSION IN EDUCATION SYSTEM BY LEVELS, 2011- 2014 ....... 47
TABLE13: WORK PERMITS BY TYPE, 2013 ................................................................................ 57
TABLE14: INTRODUCTION REASONS FOR REFUSAL, 2013 ....................................................... 66
TABLE17:INTERNATIONAL POLICE COOPERATION REGARDING THE INVESTIGATION OF
TRAFFICKING WITH PERSONS, EXCHANGE OF INFORMATION, INTERNATIONAL LEGAL
ASSISTANCE, 2009 - 2013 ........................................................................................................... 79
TABLE18:SMUGGLING OF MIGRANTS R.KOSOVO2011 – 2013 ................................................... 79
TABLE19;SMUGGLING OF MIGRANTS, MEN, 2001 – 2013 .......................................................... 80
TABLE20: SMUGGLING OF MIGRANT WOMEN 2011 - 2013 ........................................................ 80
TABLE22: KOSOVO CITIZENS WITH VALID RESIDENCE PERMIT IN MEMBER STATES OF THE
EU STATES AND SCHENGEN AREA, 2011 - 2013 ........................................................................ 88
TABLE23: KOSOVO MIGRANTS IN EU COUNTRIES AND SHENGEN SPACE BY REASON OF
RESIDENCE, 2013 ...................................................................................................................... 90
TABLE 28: HOUSEHOLD MONTHLY INCOME REMITTERS ....................................................... 106

8
MP
K
OS
OV
A
20
13
TABLE29;THE NUMBER OF IDPS AND RDP, 2009 - 2013 ........................................................... 119
TABLE 30:HOUSES BUILT BY MRC AND EXTERNAL ACTORS, 2009-2013 ................................. 120
TABLE31:NUMBER OF COLLECTIVE CENTRES UNDER UNHCE, 2013 ...................................... 121
TABLE 32::ISSUANCE OF PERMITS TO STAY TEMPORARY BY REASON AND COUNTRY, 2013
................................................................................................................................................ 148
TABLE33:REFUSAL OF ENTRY BY CITIZENSHIP (10 KEY STATES BY CONTINENT), 2009 – 2013
................................................................................................................................................ 149
TABLE34: AND GRAB THE FOREIGNERS STAYING IRREGULAR R. KOSOVO2009 – 2013 ......... 149
TABLE 35:NUMBER OF FOREIGNERS IRASTEVE CAUGHT WITH ILLEGAL RESIDENCE IN
KOSOVO PROCEEDED IN COURTS DISMISSAL AND ORDER, 2009 – 2013 ................................. 150
TABLE 37: REJECTION OF FOREIGN STATES AND CONTINENTS, 2013 .................................... 150
TABLE 38:KOSOVO CITIZENS WHO WERE REFUSED ENTRY AT THE BORDER OR
APPREHENDED AT THE BORDER OF EU STATES AND SCHENGEN AREA, 2009-2013 ............. 151
TABLE 39:KOSOVO CITIZENS WHO ARE CAUGHT ILLEGALLY RESIDING WITHIN THE
TERRITORY OF THE EU MEMBER STATES AND SCHENGEN AREA, 2011 – 2013 ....................... 152
TABLE 40:KOSOVO NATIONALS ILLEGALLY RESIDING IN MEMBER STATES OF THE EU
SCHENGEN S AND AFTER RELEASE ORDER FOR DISMISSAL BY STATES AND YEARS, 2011 -
2013 .......................................................................................................................................... 152
TABLE 41 KOSOVO NATIONALS OF MEMBER STATES AND MULTILATERAL REMOVED FROM
THE EU AND THE SCHENGEN AREA BASED ON THE ORDER FOR REMOVAL BY COUNTRY,
2011 - 2013 ................................................................................................................................ 153
TABLE 42: READMISSION (FORCE AND VOLUNTARY) BY COUNTRY, 2011-2013 ..................... 154
TABLE 43: READMISSION (FORCED AND VOLUNTARY) BY SEX, AGE GROUP, AND
KOMUNITETTEVE, 2011-2013 ................................................................................................... 155
TABLE 44:NDIHMA DHE MBESHTETJA E OFRUAR PER PERSONAT E RIATDHESUAR PER
PERFITIM NGA PROGRAMI/FONDI PER RI INTEGRIM SIPAS SKEMAVE, 2011 - 2013 ................ 155
TABLE 45: BUSINESSES DIASPORA, 2012 -2013 ........................................................................ 156
TABLE 46: DIPLOMATIC AND CONSULAR MISSIONS OF KOSOVO, 2009 - 201 .......................... 156
TABLE 47: STATES THAT EXEMPT FROM VISA REGIME FOR INTRODUCTION , TRANSIT AND
STAY IN THE TERRITORY OF THE REPUBLIC OF KOSOVO UP TO 90 DAY‟S FOR A PERIOD SIX
MONTHS FROM THE DATE OF FIRST ENTRY(JULY 2013) ......................................................... 157

9
MP
KO
SO
VA
20
13
List of graphics
GRAPH 1:GDP GROWTH OF REAL AND CONTIBUTION OF ITS COMPONENTS, 2011 - 2017 ........ 24
GRAPH 2:CREDIT GROWTH ,DEPOSIT AND GDP NOMINAL IN PERCENTAGE 2010 - 2017 ......... 25
GRAPH 3:FOREING INVESTMENT DIRECT IN KOSOVO IN EURO MILLIONS AND AS A
PERCENTAGE OF GDP, 2006 - 2013 ............................................................................................ 29
GRAPH 4: FOREIGN DIRECT INVESTMENT ACCORDING TO THE MAIN ECONOMIC SECTORS,
IN PERCENTAGE, 2007 –2013 ..................................................................................................... 29
GRAPH 5:STRUCTURE OF FDI ACCORDINGMAIN STATES , IN PERCENT, 2011 - 2013 ................ 30
GRAPH 6: REMITTANCES AS A SHARE OF GDP AND TRADE BALANCE DEFICIT, 2007 - 2013 ... 31
GRAPH 7: WORKERS COMPENSATION 2007 – 2013 .................................................................... 32
GRAPH 8: TRADE BALANCE FOR GOODS, (IN MILLIONS OF EUROS), 2010 – 2013 ..................... 33
GRAPH 9: STATES WITH THE PERCENTAGE THEMOST IN EXPORTS, 2013 ............................... 35
GRAPH 10: STATES WITH THE PERCENTAGE THEMOST IN IMPORTS, 2013 .............................. 35
GRAPH 11: COMMERCIAL BALANCE OF SERVICES, 2010 - 2013 ................................................ 36
GRAFPH 12:MICRO,SMALL AND MEDIUM ENTERPRISES , 2011 - 2013 ...................................... 37
GRAPH 13: NUMBER OF NEW AND CLOSED BUSINESSES, 2010 - 2013 ...................................... 37
GRAPH 14: THE NUMBER OF ENTERPRISES BASED ECONOMIC ACTIVITY, 2013...................... 38
GRAPH 15: NUMBER OF WORKERS BY INDUSTRY, 2009 - 2013 ................................................ 39
GRAPH 16: NUMBER OF ENTERPRISES BY INDUSTRY, 2009 - 2013 ............................................ 39
GRAPH 17: VACANCIES SECTOR FOR 12 MONTHS, 2013 ........................................................... 42
GRAPH 18: EMPLOYMENTS BY SECTOR FOR 12 MONTHS, 2013 ................................................ 42
GRAPH 19: AVARAGE SALARY, 2012 - 2013 ............................................................................... 43
GRAPF20: REQUIREMENTS FOR ENTRY VISA TO KOSOVO, BY STATES, 2013 ......................... 52
GRAPH21: NUMBER OF VISAS ISSUED IN PKK, JULY-DECEMBER 2013 .................................... 53
GRAPH 22: ISSUANCE OF TEMPORARY RESIDENCE PERMITS BY CATEGORIES, 2011 - 2013 .... 54
GRAPH 23: ISSUANCE OF TEMPORARY RESIDENCE PERMITS, COMPARISON OF 2012 - 2013 ... 54
GRAPH 24: ISSUANCE OF A TEMPORARY RESIDENT PERMITS BY TIME PERIODS, 2013 .......... 55

10
MP
K
OS
OV
A
20
13
GRAPH 25: ISSUANCE OF TEMPORARY RESIDENCE PERMITS BY STATES, 2013 ..................... 56
GRAPH 26: IDENTITY CARDS FOR FOREIGNERS ISSUED BY YEAR,2009 - 2013 ......................... 57
GRAPH 27: EMPLOYMENT OF FOREIGN NATIONALS IN KOSOVO, BY PERCENTAGES AND
STATES, 2013............................................................................................................................. 58
GRAPH28: POSITIVE DECISIONS FOR ACQUISITION OF CITIZENSHIP BY GENDER, 2009 - 2013 59
GRAPH 29: POSITIVE DECISIONS FOR PROFIT CITIZENSHIP BY AGE GROUP, 2012 - 2013 ......... 60
GRAPH 30: POSITIVE DECISIONS FOR ACQUISITION OF CITIZENSHIP BY AGE GROUP, 2009 -
2013 ........................................................................................................................................... 60
GRAPH 31:POSITIVE AND NEGATIVE DECISIONS FOR ACQUISITION OF CITIZENSHIP BY
PREVIOUS CITIZENSHIP,2013 .................................................................................................... 61
GRAPH 32: THE NUMBER OF FOREIGNERS WHO HAVE BEEN REFUSED ENTRY TO THE PKK
R.KOSOVO,2009 - 2013 ............................................................................................................... 63
GRAPH 33: REJECTION OF FOREIGNERS IN BCK (ONLY WITH NEIGHBORING COUNTRIES), BY
PERCENTAGE, 2013 ................................................................................................................... 63
GRAPH 34: REFUSAL OF ENTRIES FOR EU CITIZENS, 2012- 2013 ............................................... 64
GRAPH 35: REFUZALS OF ENTRY IN BCK BY CONTINENTS, 2013 ............................................. 64
GRAPH 36: REFUSAL OF ENTRY BY CITIZENSHIP (10 MAJOR STATES BY CONTINENTS), 2013 64
CHART 37: INTRODUCTION TO THE PKK REFUSAL, TOP 10 COUNTRIES – 2013 ....................... 65
GRAPH 38: ENTRY REFUSALS IN BCP, TOP 10 STATES - 2012 .................................................... 66
GRAPH 39: NUMBER OF INSPECTIONS AND CAPTURES OF THE FOREIGNERS WITH
IRREGULAR STAY IN THE REPUBLIC OF KOSOVO, 2009 - 2013 ................................................. 67
GRAPH 40: COMPARISON BETWEEN INSPECTIONS AND THE CAPTIVES WITH IRREGULAR
STATUS, 2009 - 2013................................................................................................................... 68
GRAPH 41: CASES OF FOREIGNERS CAUGHT WITH IRREGULAR RESIDENCE, PROCEEDED TO
THE COURT AND EVICTION ORDERS, 2011 - 2013 ................................................................... 68
GRAPH 42: NUMBER OF FOREIGNERS TRAPPED R.KOSOVES TERRITORIES, IRREGULAR CASES
LAWSUIT TO THE COURT BY CITIZENSHIP, 2011 - 2013 ............................................................ 69
GRAPH 43: NUMBER OF FOREIGNERS TRAPPED THE TERRITORY REPUBLIC OF KOSOVO,
IRREGULAR CASES LAWSUIT TO THE COURT BY GENDER, 2011 – 2013 .................................. 70

11
MP
KO
SO
VA
20
13
GRAPH 44: NUMBER OF FOREIGNERS CAUGHT WITHIN THE TERRITORY OF THE REPUBLIC
KOSOVO IRREGULAR CASES PRECEDED AT THE COURT BY AGE, 2011 - 2013......................... 70
GRAPH 45: CASES OF FOREIGN NATIONALS FOR WHICH THE COURT HAS ISSUED AN
DEPORTATION ORDER FROM KOSOVO, BY GENDER, 2011 - 2013 ............................................. 71
GRAPH 46: CASES OF FOREIGN CITIZENS WHO WERE IMPOSED MEASURE OF DEPORTATION
FROM KOSOVO BY COURT, BY AGE, 2011 - 2013 ....................................................................... 72
GRAPH 47: CASES OF FOREIGN CITIZENS FOR WHOM THE COURT HAS IMPOSED THE
MEASURE OF DEPORTATION FROM KOSOVO BY CITIZENSHIP AND PERCENTAGE, 2011 - 2013
................................................................................................................................................. 72
GRAPH 48: CASES OF IMPOSING OF REMOVAL ORDERS FOR FOREIGNERS CAUGHT WITHIN
THE TERRITORY OF KOSOVO BY CITIZENSHIP AND PERCENTAGE, 2011 -2013 ....................... 73
GRAPH 49: CASES OF REMOVAL ORDERS FOR FOREIGNERS CAUGHT WITHIN THE
TERRITORY R.KOSOVES BY AGE, 2011 - 2013 ........................................................................... 74
GRAPH 50: THESE DATA SHOW THAT MOST FOREIGNERS THAT LEAVE VOLUNTARILY ARE
YOUNG FEMALES ..................................................................................................................... 74
GRAPH 51: VICTIMS OF TRAFFICKING WITH PERSONS IDENTIFIED IN KOSOVO BY
CITIZENSHIP AND PERCENTAGE, 2009 – 2013 .......................................................................... 77
GRAPH 52:VICTIMS OF TRAFFICKING WITH PERSONS IDENTIFIED IN KOSOVO BY AGE AND
PERCENTAGE, 2009 - 2013 ......................................................................................................... 78
GRAPH 53: THE NUMBER OF FOREIGNERS WHO HAVE IRREGULARLY WORKED AND FOR
WHICH WAS IMPOSED THE REMOVAL ORDER, BY GENDER AND AGE, 2011 - 2013 ............... 81
GRAPH 54: THE NUMBER OF FOREIGNERS WHO WORKED IRREGULARLY AND FOR WHO WAS
IMPOSED THE REMOVAL ORDER BY CITIZENSHIP AND PERCENTAGE, 2011 - 2013 ................. 82
GRAPH 55: ASYLUM SEEKERS STATES, 2013 ............................................................................ 83
GRAPH 56: ASYLUM SEEKERS IN THE R OF KOSOVO BY GENDER, 2011 - 2013 ........................ 84
GRAPH 57: ASYLUM SEEKERS IN THE REPUBLIC OF KOSOVO BY AGE, 2011 - 2013 ................. 84
GRAPH 58: ASYLUM SEEKERS IN THE REPUBLIC OF KOSOVO BY STATES, 2011 – 2013 ........... 84
GRAPH 59: NUMBER OF ASYLUM SEEKERS IN THE R. OF KOSOVO, 2009 - 2013 ...................... 85
GRAPH 60 :STATISTICS FOR SCHENGEN VISA APPLICATIONS AND REFUSALS OF SCHENGEN
VISA FOR CITIZENS OF KOSOVO BY COUNTRY, 2013 ............................................................... 86

12
MP
K
OS
OV
A
20
13
GRAPH 61: KOSOVO CITIZENS TRENDS WITH VALID RESIDENCE PERMIT IN EU MEMBER
STATES AND SCHENGEN AREA 2011 - 2013 .............................................................................. 88
GRAPH 62: RELEASE FROM CITIZENSHIP OF THE REPUBLIC OF KOSOVO (POSITIVE AND
NEGATIVE DECISIONS), 2011- 2013 ........................................................................................... 91
GRAPH 63: WAIVER OF CITIZENSHIP OF THE REPUBLIC OF KOSOVO BY GENDER, 2011-2013 . 92
GRAPH 64: POSITIVE DECISION ON RELEASE FROM CITIZENSHIP BY AGE GROUPS, 2011 - 2013
................................................................................................................................................. 92
GRAPH 65: COMPARING THE NUMBER OF ASYLUM SEEKERS IN THE EU STATES,2011 – 2013 94
GRAPH 66: NUMBER OF ASYLUM SEEKERS IN EU COUNTRIES AND THE SCHENGEN AREA BY
GENDER, 2013 ........................................................................................................................... 95
GRAPH 67: NUMBER OF ASYLUM SEEKERS IN THE EU STATES AND THE SCHENGEN AREA BY
AGE GROUP, 2011 - 2013 ............................................................................................................ 95
GRAPH 68: TREND OF KOSOVO ASYLUM SEEKERS IN EU STATES AND SCHENGEN AREA, 2011
- 2013 ......................................................................................................................................... 96
GRAPH 69: KOSOVO CITIZENS WHO HAVE BEEN REFUSED ENTRY AT THE BORDER OR
CAUGHT AT THE BORDERS IN MEMBER STATES OF THE EU AND SCHENGEN AREA, 2011-2013
................................................................................................................................................. 97
GRAPH 70: KOSOVO CITIZENS WHO ARE CAUGHT ILLEGALLY RESIDING WITHIN THE
TERRITORY OF EU MEMBER STATES-AND SCHENGEN AREA BY GENDER, 2011 - 2013 ........... 98
GRAPH 71: KOSOVO CITIZENS WHO ARE CAUGHT ILLEGALLY RESIDING WITHIN THE
TERRITORY OF EU MEMBER STATES AND SCHENGEN AREA BY AGE GROUPS AND STATES
IN%, 2011 – 2013 ....................................................................................................................... 100
GRAPH 72: KOSOVO CITIZENS WHO ARE CAUGHT ILLEGALLY RESIDING WITHIN THE
TERRITORY OF THE EU MEMBER STATES AND SCHENGEN AREA BY STATES AND YEARS,
2011 - 2013 ................................................................................................................................ 100
GRAPH 73:KOSOVO NATIONALS ILLEGALLY RESIDING IN EU MEMBER STATES AND
SCHENGEN AFTER THE ISSUANCE OF THE REMOVAL ORDER BY STATES AND YEARS, 2011 -
2013 .......................................................................................................................................... 101
GRAPH 74: KOSOVO CITIZENS REMOVED FROM EU MEMBER STATES AND SCHENGEN SPACE
UNDER THE REMOVAL ORDER IN PERCENTAGE (2011-2013) .................................................. 102
GRAPH 75: KOSOVO CITIZENS REMOVED FROM EU MEMBER STATES AND SCHENGEN AREA
BASED ON THE REMOVAL ORDER BY STATES AND YEARS (2011-2013) ................................. 102

13
MP
KO
SO
VA
20
13
GRAPH 76: EDUCATION OF HOUSEHOLD HEADS AND THOSE EMIGRANT LIVING IN KOSOVO
................................................................................................................................................ 105
GRAPH 77: READMISSION TO THE PERCENTAGE BY LAW ENFORCEMENT AND BILATERAL
AGREEMENTS, 2011 – 2013 ....................................................................................................... 108
GRAPH 78: REPATRIATION (VOLUNTARY AND FORCED) BY THE TOP 10 COUNTRIES, 2011-2013
................................................................................................................................................ 108
GRAPH 79: READMISSION (FORCE AND VOLUNTARY) BY GENDER, 20011 – 2013 ................... 109
GRAPH 80: READMISSION (FORCE AND VOLUNTARY) BY AGE GROUP, 2011-2013 ................. 110
GRAPH 81: READMISSION TREND (FORCED AND VOLUNTARY) BY COMMUNITIES, 2011 - 2013
................................................................................................................................................ 110
GRAPH 82: TREND READMISSION (FORCE AND VOLUNTARY) BY YEAR, 2009 – 2013 ............. 111
GRAPH 83: ASSISTED PERSONS THAT RETURNED VOLUNTARILY, 2007 - 2013 ....................... 112
GRAPH 84 :THAT ASSISTED PERSONS RETURNED VOLUNTARILY BY COUNTRY OF ORIGIN,
2013 .......................................................................................................................................... 112
GRAPH 85:THAT ASSISTED PERSONS RETURNED VOLOUNTARILY BY GENDER 2013 ............ 113
GRAPH 86:THAT ASSISTED PERSONS RETURNED VOLUNTARILY BY AGE GROUP ................ 113
GRAPH 87: ASSISTED PERSONS THAT VOLUNTARY RETURNED BY ETHINCITY, 2010 - 2013 .. 114
GRAPH 88: RE INEGRATED PEOPLE SUPPORTED IMMEADIATELY AFTER ARRIVING, 2011 –2013
................................................................................................................................................ 117
GRAPH 89:NEW INTEGRATED REFLECTS PERSONS EMERGENCY SUPPORT INSIDE 12 MONTHS,
2011 - 2013 ................................................................................................................................ 117
GRAPH 90:REFLEKS FAMILIES/PERSONS REITEGRATEDSUPPORT SUSTAINABLE
REINTEGRATION, 2011 - 2013 ................................................................................................... 118
GRAPH 91:RETURN BY YEAR, 2009 - 2013 ................................................................................ 120
GRAPH 92:PERSONAL DOCUMENTS ISSUED IN DIPLOMATIC AND CONSULAR MISSIONS , 2011
- 2013 ........................................................................................................................................ 129

14
MP
K
OS
OV
A
20
13
FOREWARD
ABBREVIATIONS AND ACRONYMS
NQA National Qualifications Authority
KAS Kosovo Agency of Statistics
AVRR Assistance of Voluntary Returnees and Reintegration
WB World Bank
EU European Union
DCAM Department of Citizenship, Asylum and Migration
EIB European Investment Bank
EURODAC European Database for fingerprints for identification of
asylum seekers
EUAS
ECMI
European Agency for Statistics
European Centre for Minority Issue
IMF International Monetary Fund
ICJ International Court of Justice
SSI Semi-structured interviews
FDI Foreign Direct Investment
ICMPD International Centre for Preparation of Migration policies
IOM International Organization for Migration
VTC Vocational Training Centers
MTEF Medium Term Expenditure Framework
UN United Nations

15
MP
KO
SO
VA
20
13
MEST Ministry of Education, Science and Technology
MF Ministry of Finance
MCR Ministry for Communities and Returns
MIA Ministry of Internal Affairs
MLSW
Ministry of Labor and Social Welfare
IBM Integrated Border Management
GDP Domestic production of the Country
BP Border Police
BCP Border Crossing Points
IDP Internally Displaced Person
UNHCR United Nations High Commissioner for Refugees
MOCR Municipal Offices for Communities and Returns
EO
DRRP
Employment Offices
Department for Reintegration of Repatriated Persons
CCR
Central Commission for Reintegration
MCR
Municipal Commission for Reintegration
CMS
Case Management System
DPR
Displaced Persons in Region
DITHB
IDTHB
Directorate for Investigation of Trafficking with Human
Beings
Department for Investigation of Trafficking with Human
Beings

16
MP
K
OS
OV
A
20
13
- No data
: The data are not available

17
MP
KO
SO
VA
20
13
GENERAL INFORMATION FOR THE STATE
Capital: Pristina
The surface: 10,908.1 square km
The boundaries
terrestrial:
Total: 743.556 km:Albania, 113.551 km; Ex Yugoslav Republic of
Macedonia, 170.772 km; Montenegro, 79.165 km ; Serbia, 380.068 km;
Population: 1,815 606 (evaluation of the year 2012)1
Ethnic Groups: Albanian91.0%; Serbian 3.2% and other 5.8% (2011)
Languages: Albanian and Serbian
President: Mrs. Atifete Jahjaga2
Prime Minister: Mr. Hashim Thaçi3
The form of
Government:
Parlamentary Republic
1 Estimating population 2012 :Source: Statistical Agency of Kosovo 2http://www.president-ksgov.net, October 4, 2011 3http://www.kryeministri-ks.net/?page=2,1 October 4, 2011

18
MP
K
OS
OV
A
20
13
PART A: INTRODUCTION
A1. General Overview
In the context of regional or international initiatives for building partnerships and bridges of cooperation on
migration as a multidimensional and complex phenomenon, preparation and publication of the Migration
Profile is an indispensable and necessary contribution for better management of migration by the responsible
structures.
Initially, the migration profile is proposed by the European Commission in the Communication over
Migration and Development in year 2005.Specified in the text, the migration profile should „have purpose of
gathering information, on issues dealing with the labor market situation unemployment rate, labor market
demand and supply, and current deficiencies and those potential of skills according to sectors and
occupations and ,occupational needs in the country, skills available in the diaspora, migratory movements,
incoming and outgoing movements associated with migration, including remittances as well as relevant
gender aspects and those associated with minors.4
Government of Republic of Kosovo in accordance with the above mentioned Communication of the European
Commission, different integration processes , as the process of European integration, undertaking of
necessary reforms in context of participation in various initiatives as the Prague Process, and in accordance
with internal Governmental programs for the institutional consolidation and of policies for migration
management has initiated the process of drafting of the Expanded Profile for Migration with the data of the
period 2008-2012 and which document has been approved in October of 2013.
Compilation of the Expanded Migration Profile 2012 is coordinated by Department for Citizenship, Asylum
and Migration (DSHAM) within the Ministry of Internal Affairs (MIA) of the Republic of Kosovo and with
the involvement of all relevant local instructions and with the support of international partners as IOM,
UNHCR and ZBE in Kosovo.
For the first time, state structures responsible for monitoring of the migratory flows as a an non- formalized
group, in cooperation with other structures that contribute in the field of ,migration in Kosovo, as those
governmental and non-governmental have developed the first Profile of migration which is adopted in
October 2013. These structures have received official form through a decision of the Government of the
Republic of Kosovo 29 November 2013 for foundation of Governmental Authority for monitoring of
migration movements(hereinafter will be referred as Authority Migration).
The first migration profile was an comprehensive document with the standard data for migration and data
related with other fields which potentially are affected and affect in the phenomenon of migration such as the
:labor market, human capital, education, trade etc. The goal of this document is the construction of a solid
4Communication from the Commission to the European Parliament, the Council, the European Economic and Social Committee and
the Committee of Regions: Migration and Development: Some concrete orientations COM (2005) 390, p. 37, annex 8

19
MP
KO
SO
VA
20
13
backdrop for coherent policy development in the field of migration and development. This document is
evaluated positively by the experts of European Union in the framework of dialogue on visa liberalization.
Considering that profiles of migration should be developed and updated in annual basis, governmental
authority as a responsible group has drafted the second Profile of Migration with the data that covers period
in 2013.
Drafting of this document has preceded by a preparatory work of respective local institutions through the
data collecting, their analysis as well as discussions during the workshops held on a weekly basis for a time
period of four months. Every institution according to respective databases has offered data for the appropriate
fields, due to lack of integration of these databases. Also, the data are consulted also with resources from
other international organizations as EUROSTAT, IOM, UNHCR and other sources. Statistical data and
information of this document belong to the period until the end of year 2013; while some predictions / guesses
are extend beyond this period of time.
Preparation of the Migration Profile in Kosovo contains not only statistical data, but also an comprehensive
analysis of current migratory situation, predictions for inclinations and migration trends in the future as well
as relevant recommendations for improvements in all the chains related to migration. In the second profile of
migration are taken into account also the suggestions and comments made by experts of the European Union
as well as IOM for first Profile of Migration.
As regards the structural organization of the document ,after the presentation of content and of structure of
the document and a general overview over background of migration indicated in the Part A, Part B of the
Migration profile is intended to give an overview of socio-economic conditions of the country in order to
understand the socio-economic context that affect in migration .
Part C examines and analyzes the migration situation in the country and ensures an overview of the existing
data of number and types of regular immigrants of the regular, irregular immigrants/emigrants, and the
situation of re-admission and reintegration in Republic of Kosovo. Part C also provides statistics over the
internally displaced persons.
Part D summarizes policies and migration programs, legal framework and explains their effectiveness in
management of migration and development challenges as well as major institutional stakeholders involved in
migration management and issues related to diaspora. Also this part mentions issues dealing with regional and
international cooperation always in relation to migration.
Identification of key impeller and attractive factors that affect in migration , the main trends of migration, as
well as the impact of migration as a phenomenon in investments and trade in general are the focus of the part
E of this document .
Findings and the main analysis have been presented in the part F of this profile. In part F are shown the
shortcomings of the existing data and possible recommendations for the improvement of data on migration.

20
MP
K
OS
OV
A
20
13
Also, are provided suggestions to improve the quality during the drafting of updated profile and key
recommendations are provided for policymakers for improvement of current management of migration.
Development of this document highlights challenges and difficulties with which encounter the respective
institutions and policymakers to ensure an efficient and complete responsiveness of the dynamic of migration
in Kosovo. These challenges and difficulties are elaborated in details in the part F of this document.

21
MP
KO
SO
VA
20
13
A2. Background of migration in Kosovo
Due to various politico-economic circumstances in the past, Kosovo population is known as immigrant
population. Despite the expressed migration, only a few studies are performed in the field of migration and
development of Kosovo.
The main propellant factors of emigration were different but dominate family reunification (46%), socio-
economic factors (35%), without ignoring the political factor, better education, etc.
The largest number of persons who had emigrated from Kosovo was during years 1990-s, reaching the peak
during the war of the years 1998-99 for which were reported 51.728 inhabitants (respectively 21.973 and
29.755) or about 13.6% of all Kosovar immigrants.
Years that are characterized by the lowest migration with about 1.7% are the years 1986, 1987 and 2001.
Mostly young people of the age groups 25-44 years emigrated, who constituted 47.2% of immigrant
population (the main reproductive age in terms of fertility and the workforce)while , dominant age group
30-34 age with 12.7%.
The persons of retirement age constituted a small number of about 1.30 % of Kosovo migration. This small
number of Kosovar emigrants, results with that the immigrant population after this age turn to live the other
part of the retirement in Kosovo. Based on data from the population census in year 2011, over 35% of Kosovo
immigrants have emigrated to Germany,23% in Switzerland and over 7%.In Italy .While, in other countries
as: Canada, Australia and other countries constituted over 10% of the Kosovo migrant population.
According to estimates of KSA (based on vital statistics , natural growth , fertility, KAS surveys during
previous years , population census 2011, assessment of population forecast 2011-2061) starting from the
year 1969, representative number of the population of Kosovo who had emigrated from Kosovo (of all
communities ) until April 2011 is assessed to be about 550.000 inhabitants. If children born outside Kosovo
would be included, those who have at least one parent from Kosovo, the number of Kosovo diaspora will be
significantly higher.
As a representative value KSA through the necessary calculations will get the middle value, natural growth
number from 153.978 children born outside Kosovo who have at least one parent from Kosovo. Thus, number
of emigrated Kosovo population and the population with Kosovo background (1969-2011)is estimated to be
about703.978 inhabitants .
Despite huge international migration, a small number of persons who had migrated for years from Kosovo
have returned. According to population census data from the year 2011, in Kosovo are 128.808 immigrants
(arrivals) or about 7.4% of the population.
About 97%of immigrants have citizenship of Kosovo, therefore, the vast majority of immigrants were
actually returned to their country.

22
MP
K
OS
OV
A
20
13
PART B: ANALYSIS OF THE SOCIO-ECONOMIC CONTEXT OF
MIGRATION
This part of this document intends to present an overview of socio-economic conditions of Kosovo in order to
understand the push / pull factors who affect the migration from Kosovo and immigration in Kosovo. The
data collected in this part are provided by the Statistical Office of Kosovo, Ministry of Labor and Social
Welfare, Ministry of Economic Development, Ministry of Finance, Ministry of Trade and Industry, Ministry
of Education, Science and Technology and the Central Bank of Kosovo.
B1. The population of Kosovo
B1.1. Resident population
The last assessment on the resident population in Kosovo is the assessment of the year 2012 with total
1.815.606 inhabitants5.Preliminary data for the year 2013 despite the positive natural growth, the expressed
international migration in the year 2013 has influenced the number of resident population in Kosovo to be
almost rough with the year 2012.Socio-economic conditions were the determining push factors for an
immigration expressed as the provision of a work place, securing a better economic future, higher living
standard while a part of them has migrated for also for reasons of family reunification, reasons of marriages
or and vocational education.
B1.2.Population Growth, Ethnic Composition and Density
Birth rate for the year 2013 is estimated to be around 13.7pro mile while, mortality rate 4.13 pro mile. Natural
growth for the year 2013 is estimated to be about 0.97%.
According to estimates of the Kosovo Agency of statistics in the year 2012, Albanians constituted 91.03%of
the population, Serbs 3.2 %and other minorities about 5.8%of the total of the population. The ethnic
composition for the year 2013 in Kosovo is estimated to be the same with the year 2012.
The unchanged resident population of Kosovo for year 2013, shows that the density of Kosovo population
continues to be about 166 inhabitants for 1km2.
B2. Economy and Economic climate
B2.1. Economy
Kosovo's economy in the recent years has shown significant resistance facing the turmoil of the Euro zone
economy. This is because the Government of Kosovo has taken successful steps towards improving of
competitiveness of the economy against countries in the region, including improved climate of doing business
and large public investment in infrastructure, always maintaining the fiscal sustainability. As a result,
although Kosovo's economic growth has slowed over these years, she has remained positive at a time when
23
MP
KO
SO
VA
20
13
most countries of the region have fallen in recession. Economic growth for the year 2013 is assessed to be
3.2%.
In the year 2012 and 2013 Kosovo‟s economic growth is estimated to have been under the potential one,
which is also reflected with low pressures of the inflation in prices of goods and non-tradable services. In the
medium term period the output gap is expected to narrow when the economy is expected to grow in
accordance with the potential level of growth, which reflects the substitute of the import and increase of
exports of goods.
Great work is shown in improving the environment of doing business which will further continue, aiming the
realization of Kosovo's progress in top 40 reformers in 2015 according to estimates of the World Bank for
doing business.
B2.2. Essential Economic policies
Analysis of the real sector of the economy, or more precisely that of identification of leading providers of
contribution in economic growth, shows that the so far accumulation of stock of the public capital and fiscal
policy formulated in accordance with macroeconomic developments has not caused predomination of public
sector versus private sector, but resulted with the promotion of private sector. For this reason, over the
medium term, the private consumption, private investments and export are those that are expected to lead the
economic growth. On the side of the offer, the structure of the economy is expected to be dominated by the
increase of the productivity in agriculture, associated with larger investments in light industry and
manufacturing.
Medium Term Framework of Expenditure is designed in accordance with fiscal -budget policies for which the
Government has discussed and has agreed with International Monetary Fund (IMF). Based on this, Budget
development process should consider the respect of the fiscal rule where the deficit of overall budget should
not exceed 2% of the Gross Local Production (GLP).
Also, it will be continued with the economic growth rate, maintaining low budget deficits, stable level of the
Public debt of the country, low taxes for business and increasing the level of collection of revenue within the
country in relation to those collected at the border.
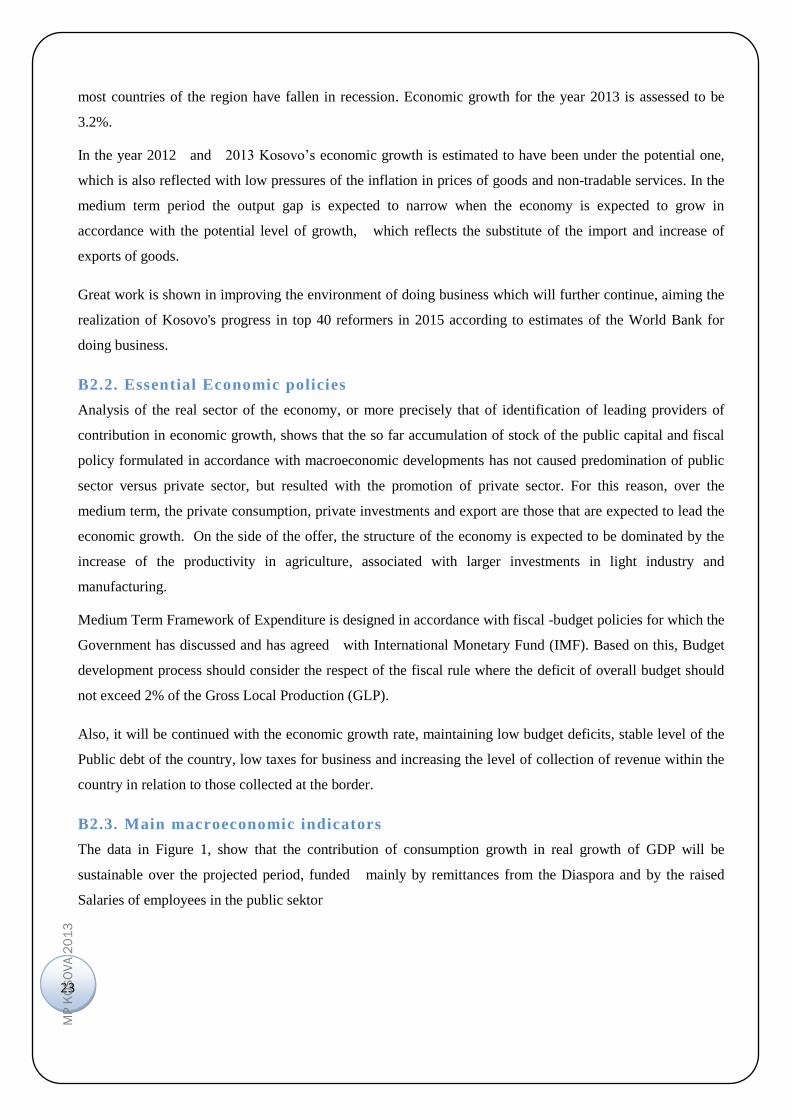
B2.3. Main macroeconomic indicators
The data in Figure 1, show that the contribution of consumption growth in real growth of GDP will be
sustainable over the projected period, funded mainly by remittances from the Diaspora and by the raised
Salaries of employees in the public sektor

24
MP
K
OS
OV
A
20
13
GRAPH1:GDP GROWTH OF REAL AND CONTIBUTION OF ITS COMPONENTS, 2011 - 2017
SOURCE : AGENCY OF STATISTICS OF THE KOSOVO
TABLE1:INDICATORS , ACCORDING MACROECONOMIC IN YEARS 2009 - 2013
Description 2009 2010 2011 2012 2013*
GDP nominal, in mil. Euro 4,008 4,291 4,773 4,916 5,125
GDP, real growth, in% 3.5% 3.2% 4.8% 2.5% 3.2%
GDP for head of population, in euro 2,238 2,418 4,773 4,916 5,125
Inflation rate, in % 3.5% 7.4% 7.4% 2.4% 1.8%
Public debt, as % of GDP 7.5% 6.0% 5.3% 8.4% 9.3%
Export and the goods and services (% of GDP) 16.4% 19.5% 20.1% 18.8% 18.1%
Imports of goods and services (% of GDP) 52.8% 56.9% 57.3% 53.9% 51.1%
Services of loans as a percentage of exports as
goods and services 6.7% 2.4% 2.2% 2.3% 2.7%
Exports of goods and services, in mil. Euro 657.0 835.1 958.9 922.1 927.0
Imports of goods and services, in mil. Euro 2,114 2,443 2,737 2,649 2,619
SOURCE: DPEP/MF
*For the year 2013 is assessment, in the absence of the official data from ASK.

25
MP
KO
SO
VA
20
13
Financial sector
The Structure of bank composition continued to remain the same as regards of market allocation, where banks
with international capital continue to dominate the market in Kosovo. During the past two years is noticed an
increase in inter- bank competitive activities as regards providing attractive products and services in order to
advance services for keeping and adding of customers. During the year 2013, lending of the Kosovo
economy has continued to have a slight increase where loans reached a value of 1.806 billion euro with an
increase of 2% in comparison with the year 2012 and deposits 2.449 billion euros with an increase of 7%.
During the period 2010-2013 loans recorded an average increase of 9% while deposits recorded an average
increase 8.9%, increase which matched with the trend of increasing nominal GDP .Graph2, illustrates the
trends of increasing norms of nominal GDP , loans and deposits.
GRAPH2:CREDIT GROWTH ,DEPOSIT AND GDP NOMINAL IN PERCENTAGE 2010 - 2017
SOURCE: KCB, AND CALCULATIONS DEPARMENT FOR POLICY ECONOMIC-PULBIC
External sector
In the year 2013, Current account of balance of payments recorded a deficit of 6.6% of GDP from 7.7% as it
was in 2012. Considering that the current account position reflects the dependence of the economy from the
outside funding, its reduction would indicate a positive development. However, the main factors affecting in
reducing the current account have been the decline of import of goods, increasing exports of goods and
increase of transfers account, including remittances from the Diaspora.
Capital and financial account is increased in 3.2% of the GDP from 2.9% in 2012. This growth has come
mainly due to the decrease of investments in securities abroad that are supposed to be re-oriented toward
securities of the Government of Kosovo. In addition, foreign direct investments have increased in report with
GDP from 4.3% in 4.7%.

26
MP
K
OS
OV
A
20
13
B2.4. the investment climate
In 2013, Kosovo, compared with other countries, has had more favorable fiscal policies in the region and
lower tax rates. International standards of accounting are applicable. Tax liabilities are as follows:
TABLE 2: THE TAX LIABILITIES - 2013
Personal income Personal Income Tax in (%)
0 - 80 € 0%
80 - 250 € 4%
250 - 450 € 8%
Over 450 € 10%
VAT
VAT flat for Farmers
16%
16%
Taxes on corporate income 10%
Pension contributions for workers 5% gross salary
SOURCE : MF
Regarding the fiscal side in 2013 Tax rates remain almost the same, except for a change. On 10 September
2013 has started the application of a flat rate for farmers, through which is aimed an easier business for
farmers, where inclusion in the normal regime of the VAT would create difficulties. Any Agricultural
manufacturer which does not exceed the registration limit of VAT has the right to apply for inclusion in flat
rate VAT.This is an good opportunity for all new farmers in business, but also for those present who for the o
development of their normal activity need a so-called Investment subsidy by State or Tax Relief.
Based on economic stability and created climate for business, assistance and subsidies, especially for the
agricultural sector are available. Agriculture is seen as a potential for further development. Kosovo citizens
have the opportunity to be involved in these kind of activities taking into account these facilities, to exploit
them to develop this sector which will certainly affect in the decline of emigration and economic development
of the Country.
• Environment of doing business
According to the World Bank Report on Doing Business 2014, Kosovo was ranked as the 5th in the list of
most reformatory countries in the world as one of the countries with most improving and reformative
economy placing it in place 86 from 189 countries of the world. This means that Kosovo keeps the best
position compared with its neighbors.
Moreover, Kosovo is ranked in the list of States that have established One Stop Shop points for providing all
services in one place for business. As a next important point is also the fact that Kosovo is part of the states
which have renounced by the minimum requirements to having capital for the opening of an enterprise.
Another apparent achievement is ranking of Kosovo in countries which do obtaining of a construction

27
MP
KO
SO
VA
20
13
permit easier and lowering of payments needed in that regard. Also, Kosovo adopted a new system of
notaries and combined procedures for drafting and legalization of agreements for sale and purchase and for
property registration.
It is worth mentioning as following:
- the biggest reforms in process of the starting of a business;
- Opening of 27 One-Stop Shop centers;
- the capital for companies with limited responsibility is eliminated;
- Initial capital needed for joint stock companies from 25,000 is decreased in 10,000 euro;
- Shortening of the deadline for business registration from 10 days to 3 days;
- Taxes for initial registration of businesses is removed;
- All procedural deadlines are decreased, from 60 days to 30 days, from 10 days to 3 days and from 20
days to 15 days;
- project for integration of system with ATK is finalized, now in One Stop Shop are obtained: the
registration number, fiscal number, certificate of VAT, etc.;
- The request for approval of the main construction project is eliminated;
- The payment for technical approval is eliminated by the municipality and reduction of payment for
the construction permit; and
- Procedures related with registration of the property and costs are reduced.
Kosovo has marked an increased from the 117th place to the 86th in 2013 compared with 2011. Progress is as
follows:
- Kosovo has improved the Business Start indicator for 68 countries during this period;
- Indicator for Registration of Property has moved positively for 15countries;
- Indicator for Construction Permits has improved for 35 countries;
- Protecting Investors In Kosovo has moved positively for 76 countries;
- Regulation of bankruptcy procedures has improved for 3 countries
- Cross Border Trade has improved for 10 countries; and
- Enforcing Contracts has moved positively for 19 countries.

28
MP
K
OS
OV
A
20
13
TABLE3: KOSOVO IN LIST OF COUNTRIES MORE REFORMERSIN THE WORLD
Indicators 2011 2012 2012/2011 2013 2013/2012 2013/2011
Doing business, facilitations 117 98 19 86 12 31
Starting a business 168 126 42 100 26 68
Building permits 171 152 19 136 16 35
Access to electricity 124 120 4 121 -1 3
Registration of Property 73 75 -2 58 17 15
Obtaining a credit 24 24 0 28 -4 -4
Investment Protection 174 95 79 98 -3 76
Payment of taxes 38 42 -4 43 -1 -5
Cross-border trade 131 122 9 121 1 10
Empowering contracts 157 139 18 138 1 19
Choosing liquidity 31 86 -55 83 3 -52
SOURSE :MINISTRY OF TRADE AND THE INDUSRTY
B2.5. Capital investments
The development of public infrastructure is expected to strongly influence in the economic development
generally including the creation of new work places, empowering of the small and medium businesses,
integral rural development, etc. Meeting the needs for electricity, with increased production and power supply
in accordance with international standards, will be done through the start of project implementation of the TC
New Kosovo. Amongst capital investments could be mentioned even the project implementation Co-
generation system. This system will make the link of the heat plant of the Pristina city (existing network) with
TC "Kosovo B". This will affect in the decrease of the demand for electricity and contributes to increase of
security of the power supply.
B2.6. Foreign Direct Investment
Foreign Direct Investment (FDI) in Kosovo in 2013 was 258.5 billion euro or 13.1 percent higher than in the
previous year. As shown in Figure 3, FDI in Kosovo during the period 2008 – 2011 have maintained a similar
level by average 8.3 percent of PBB. As a result of the global financial crisis, during 2009 FDI scored sharper
fall, whereas in 2010-2011 the value of these investments began to rise again, although with a slow rhythm
while, the trend worsened significantly in 2012 reaching about 5 percent of PBB and this trend continued
almost at the same level during 2013. This worsening trend shows the sensitivity that FDI have towards
economic developments of the Euro zone countries, which also represent the main source of FDI in Kosovo.

29
MP
KO
SO
VA
20
13
GRAPH3:FOREING INVESTMENT DIRECT IN KOSOVO IN EURO MILLIONS AND AS A PERCENTAGE OF
GDP, 2006 - 2013
SOURCE: KCB
FDI in Kosovo during 2013 were mainly focused in the economy sectors as: real estate 35.4 percent of total
FDI, construction with 15.1 percent, productivity with 6.9 percent, financial sector with 11 percent, followed
by transport and telecommunication sector with participation from 14.2 percent of total FDI.
As it is presented in graphic 4, the year 2013 was characterized by changes regarding the structure of FDI
based on sectors. The value of investments in real estate, category which consists mainly from investments of
immigrants in real estate, is almost similar to the previous year, but due to the declining of investments in the
construction and production sector it is observed an larger participation of this sector in total FDI. The
financial sector which in 2010 suffered a sharp decline in total FDI in two successive years recorded a slight
increase and is expected mark an increase in 2014 also, since a new bank already licensed will start its
operation in banking system of Kosovo.
GRAPH 4: FOREIGN DIRECT INVESTMENT ACCORDING TO THE MAIN ECONOMIC SECTORS, IN
PERCENTAGE, 2007 –2013
SOURCE :KCB
0%
5%
10%
15%
20%
25%
30%
35%
40%
Real e
sta
te
Constr
uction
Pro
du
ction
Fin
an
ce
Tra
nsp
. and tele
c.
Min
ing
Tra
de
2007 2008 2009 2010 2011 2012 2013

30
MP
K
OS
OV
A
20
13
EU countries continue to present the main source of FDI in Kosovo. However, viewed in terms of current
statistics then it can be said that Turkey in 2013 also in the last year presents the main Country from where
the FDI in Kosovo mostly came (33.6 percent of total FDI). Investments by this state, in 2013 were oriented
mainly in the transport and telecommunication sector (57.2 percent), electricity (31.8) financial services (6
percent), real estate (3 percent), etc. Significant increase FDI there was also from Albania, which during this
period represents the second Country with the greatest increase for the period 2013 (by 2.8 in 7.9 percent).
Another very important source of FDI in Kosovo was Switzerland (16.1 percent of total FDI). In contrast to
Turkey, FDI from Switzerland during 2013 were mainly concentrated in real estate (84.9 percent) and in
construction (7.7 percent). By most EU countries, including the Germany, there was a decline of FDI,
however, since the decline of FDI from Great Britain was big enough, by some other countries it is noticed
and increase of participation in the FDI structure.
GRAPH5:STRUCTURE OF FDI ACCORDINGMAIN STATES , IN PERCENT, 2011 - 2013
SOURCE :BQK
B2.7. Migrant remittances (Remittances)
The Income from remittances in Kosovo during the last five years had a volume that averaged 590 million
euros. In 2013 remittances reached the amount of 620.8 million euro, compared with 2012 represents an
increase of 2.5 %. Migrant remittances in 2013 had the same level with the previous year having a share from
12 percent of GDP. The highlighting of macroeconomic importance of remittances noted from the fact that
they cover more than 30 percent of Kosovo's trade deficit.
0 5 10 15 20 25 30 35
Austria
Bullgaria
Shqipëria
Sllovenia
SHBA
Britania e Madhe
Zvicra
Gjermania
Turqia
2011 2012 2013

31
MP
KO
SO
VA
20
13
GRAPH6: REMITTANCES AS A SHARE OF GDP AND TRADE BALANCE DEFICIT, 2007 - 2013
SOURCE: CBK
Regarding the channels of sending back the remittances from the Table 4, it can be seen that about 25 %of
emigrant remittances are transferred via banking channels while over 35 % are transferred through money
transfer agencies. The rest of remittances are transferred through other channels that include informal
channels also. The main source of the total migrant remittances received in Kosovo continues to be Germany
(33.4 %) and Switzerland (23.5%), followed by other countries.
TABLE4: MIGRANT REMITTANCES – ACCORDING TO CHANNELS (IN MILLIONS OF EUROS, NON-
CUMULATIVE STATISTICS), 2006 - 2013
Description Total Banks ATM Other
2006 467.1 135.1 184.7 147.3
2007 515.6 137.1 198.7 179.8
2008 608.7 126.3 213.1 269.3
2009 585.7 148.8 213.1 223.8
2010 584.3 141.3 213.1 229.9
2011 584.8 139.7 225.3 219.8
2012 605.6 126.5 218.5 260.6
2013 620.8 158.9 211.4 250.5
SOURCE: CBK
TABELA 5: MIGRANTS REMITANCES BY COUNTRY, IN PERCENTAGE, 2008 - 2013
Description Total
Ger
ma
ny
Sw
itze
rla
nd
Ita
ly
Au
stri
a
Bel
giu
m
US
A
Sw
eden
Fra
nce
No
rwa
y
Ca
na
da
Gre
at
Bri
tain
Oth
er
Co
un
trie
s
2008 100 37.7 15.9 13.1 6.2 2.8 2.8 3.7 3.9 1.9 2.2 1.5 8.3
39.8 38.1 36.9
35.5 33.3
28.4 29.2 31.2
0.0
2.0
4.0
6.0
8.0
10.0
12.0
14.0
16.0
18.0
20.0
0.0
5.0
10.0
15.0
20.0
25.0
30.0
35.0
40.0
45.0
2006 2007 2008 2009 2010 2011 2012 2013
Remittances/Trade Deficit Remittances/GDP (right axis)

32
MP
K
OS
OV
A
20
13
2009 100 37.4 21.1 10.3 5.7 3.1 2.8 3.2 3.8 2.7 1.8 1.3 6.7
2010 100 34.2 21.2 7.7 5.4 2.7 4.1 3.3 3.8 2.8 1.9 1.5 11.4
2011 100 33.2 23.1 7.0 5.5 2.6 3.7 3.5 3.9 2.7 1.9 1.4 11.6
2012 100 34.3 23.4 7.4 6.1 3.4 4.5 2.7 2.4 2.8 1.0 2.2 9.7
2013 100 33.4 23.5 7.6 5.4 2.2 4.5 2.8 3.4 2.5 1.2 2.4 8.8
SOURCE: CBK
B2.8. Compensation of employees
Compensation of employees continues to be the largest category under the account of the income which
during 2013 had a balance of 218.9 million euros (214.3 million euro during 2012). This category consists
mainly from the incomes of employees abroad such as seasonal workers as well as the workers in Afghanistan
and Iraq.
GRAPH7: WORKERS COMPENSATION 2007 – 2013
SOURCE: CBK
B2.8. Informal economy
In 2013 a study was conducted in this regard by an Informal Business Perspective in Kosovo Friedrich
Ebert Stiftung, Kosovo Foundation for Open Society and Riinvest Institute for Research and Development.
While based in the strategy for combating informal economy, money laundering and terrorist financing,MF is
in the process of assessing the level of Informal Economy. The results derived from this study provide an
estimate for the degree of Informal Economy which expressed as a percentage was approximately 34.4% of
GDP.
0
50
100
150
200
250
2007 2008 2009 2010 2011 2012 2013

33
MP
KO
SO
VA
20
13
B2.9. Business
Consumer Price Index
Consumer prices in 2013 experienced an increase of 1.8%. Price increase was noted mainly on food products,
nonalcoholic beverages but also in clothes and shoes. While in 2012 the inflation rate was 2.8% in 2013 the
rate was 1.8%.
Trading Exchanges for merchandise for the period 2010-2013
Merchandise exports in 2013 reached a value of 293 million euros, an increase of 6.5% year compared with
2012. On the other hand, imports reached a value of 2.4 billion euros in 2013, which implies a 2 percent
decrease compared with the previous year. The ratio of import coverage by exports as a percentage of
merchandise imports during 2013 was 12%.
TABLE 6:TRADE BALANCE FOR GOODS (IN MILLIONS OF EUROS), 2010 - 2013
Year 2010 2011 2012 2013
Exports 295,957 319,165 276,100 293,919
Imports 2,157,725 2,492,348 2,507,609 2,450,363
Trade Balance -1,861,768 -2,173,183 -2,231,509 -2,156,444
SOURCE: MTI
GRAPH8: TRADE BALANCE FOR GOODS, (IN MILLIONS OF EUROS), 2010 – 2013,
SOURCE: MTI
295,957 319,165 276,100 293,919
2,157,725 2,492,348 2,507,609 2,450,363
-1,861,768 -2,173,183 -2,231,509 -2,156,444
2010 2011 2012 2013
Export Import Trade balanc
Linear (Export) Linear (Import) Linear (Trade balanc)

34
MP
K
OS
OV
A
20
13
Trade with EU and CEFTA countries, constitute the most important part of Kosovo trade exchanges, with
about 72% of the all foreign trade for 2013.
Trade with EU countries - Kosovo, in terms of foreign trade has the EU countries as the most important
trading partner in recent years, in both imports and exports. From this, 41% of Kosovo trade exchanges during
2013 have been destined for EU countries. More than 39.4% the country's total exports are destined to the
EU. Also, imports from EU countries cover the major part of the General imports in Kosovo, 41.3% for 2013.
Thus, during 2013, Imports from EU countries were about 1 billion euros or 41% of total imports, marking an
increase of 3.4% compared to 2012. Kosovo Exports to EU countries amounted to 115 million Euros, or
around 39.4% of total exports, an increase of 7.8%.
Trade with the CEFTA Countries / Kosovo exports to countries participating in the CEFTA have risen
around 4.4% (107 million Euro), which includes 36.4% of all exports to Kosovo. Meanwhile, imports from
CEFTA countries during 2013 were 749.5 million Euros, a decrease of 11.3% that constitutes 30.6% of total
imports in Kosovo.
TABLE7: TRADE GROUPS OF STATES IN THE PERCENTAGE, (2010 – 2013)
Group of States EXS/ IMP 2010 2011 2012 2013
EU
Exports 44.5 43.0 38.4 39.4
Imports 38.3 38.0 38.7 41.3
CEFTA
Exports 23.5 26.0 36.8 36.4
Imports 37.0 35.0 33.7 30.6
Others
Exports 32.0 31.0 24.8 24.1
Imports 24.5 27.0 27.6 28.1
SOURCE :MTI
The most attractive Country for export remains Italy with 25.3%, followed by Albania 14.9%, India 9.9%,
and Macedonia with 8.9 %. It is worth mentioning that in 2012 and 2013 Montenegro has entered the top 10
countries where Kosovo exports.

35
MP
KO
SO
VA
20
13
GRAPH9: STATES WITH THE PERCENTAGE THEMOST IN EXPORTS, 2013
SOURCE :MTI
From the above figures we see that the leading partner in imports for 2013 is Serbia (11.6% participation of
Kosovo‟s total imports), followed by Germany (10.3%). Other important commercial partners are: Italy,
Turkey, Macedonia, etc.
GRAPH10: STATES WITH THE PERCENTAGE THEMOST IN IMPORTS, 2013
SOURCE : MTI
Trade in exported services over the years is as follows:
- year 2013 with 308.4 million euros;
- year 2012 with 346.2 million euros;
- year 2011 with 265.7 million euros; and
- year 2010 with 186.9 million euros.
Trade in exported services in 2013 had 11% less compared to 2012, 16% increase compared to 2011; and
65% increase compared with 2010.
Even during 2013, the main component in the framework of trade in services continues to be the travel
category that consists of the sale of services for the non-residents. In 2013 the balance of travel services
account amounted to 306 million euros. Another Important category within services was the commercial
25.3
14.9
9.9 8.9 5.9 4.9 3.7 2.6 2.5 2.2
11.6 10.3 9.3 8.4 7.6 7.3
6.0 4.5
3.4 3.0

36
MP
K
OS
OV
A
20
13
activity in communication services. Value in the framework of traffic services during 2013 amounted to 56.8
million euros exports and 23.6 million imports resulting in a positive balance of 33.2 million euros.
Another important category in the framework of services was the export of services for the Kosovo
Government related to services provided to the international presence in Kosovo i.e. diplomatic missions and
other international institutions (EULEX and KFOR). The balance of this item in 2013 is 23.2 million euros.
Another important category is construction services with 9.4 million euros export and 2.9 million euros
import in 2013.
With negative balance (for years) in the context of trade services continues to be the transport with 36.7
million euros export and 88 million euros import in 2013.
GRAPH11: COMMERCIAL BALANCE OF SERVICES, 2010 - 2013
SOURCE :MTI
Micro, Small and Medium Enterprises (EMSM)
Micro, Small and medium enterprises play an extremely important role in Kosovo's economic development.
They constitute 98% of enterprises in Kosovo and employ 50% of employees in the labor market in Kosovo.
Therefore, their effect in employment and consequently economic growth is extremely important. However,
most EMSMEs are micro enterprises with 1 to 9 employees. This fact shows their inability to expand and
develop as businesses, an indicator fact of the economic situation in the country. One of the main problems in
this regard is access to finances which prevents the normal and rapid business development; however
businesses in Kosovo also face numerous other problems dealing with the law enforcement or energy
infrastructure of the Country. As a result, unemployment rate in Kosovo remains high and this may be one of
the reasons why young people decide to seek solutions to their problems abroad.

37
MP
KO
SO
VA
20
13
GRAFPH12:MICRO,SMALL AND MEDIUM ENTERPRISES , 2011 - 2013
SOURCE :MTI
Number of new and closed businesses over the years 2010 - 2013
Based on statistics obtained by the Agency for Registration of Businesses in Kosovo, we have an increase in
the number of businesses registered between 2010 and 2013. So we have 26% or 1.877 more businesses
registered in 2013 compared with the year 2010. However, the biggest change was recorded between 2011
and 2012 where we have have 21% or 1.600 more registered businesses in 2012 than in 2011. This may be
related to doing business reforms.
GRAPH13: NUMBER OF NEW AND CLOSED BUSINESSES, 2010 - 2013
SOURCE:MTI
0 1000 2000 3000 4000 5000 6000 7000 8000 9000 10000
2011
2012
2013
2011 2012 2013
Ndërmarrje të mesme(50-249) 15 16 20
Ndërmarrje te vogla (10-49) 105 125 126
Ndërmarrje mikro (1-9) 7492 8953 9056
2010 2011 2012 2013
Biznese te reja 7,201 7,397 8,997 9,078
Biznese të mbyllura 1,377 953 1,106 1,514
0
1,000
2,000
3,000
4,000
5,000
6,000
7,000
8,000
9,000
10,000

38
MP
K
OS
OV
A
20
13
Number of enterprises based in economic activity in the year 2013
According to the data of Ministry of Trade and Industry, the wholesale and retail trade which includes also the
activities dealing with the repair of motor vehicles, motorcycles and articles for personal and home use
Constitute the most common economic activity in 2013 with 2757 companies operating in this field. This
includes 30% of companies operating in 2013. In the second place we have 1,041 businesses working in the
real estate sector which include 11% of the market.
GRAPH14: THE NUMBER OF ENTERPRISES BASED ECONOMIC ACTIVITY, 2013
SOURCE :MTI
Number of enterprises and employees by industry
In the following graphs and tables is provided information on the number of enterprises and employees in
various industries. It is important to note that the food industry employs the largest number of workers since
2009. In the meantime, it is observed an increase in the number of enterprises and employees in most
industries during the years presented in tables and graphs.
2757
1041
922
917
889
802
775
717
187
95
32
27
25
14
30.0%
11.3%
10.0%
10.0%
9.7%
8.7%
8.4%
7.8%
2.0%
1.0%
0.3%
0.3%
0.3%
0.2%
Tregtia me shumicë dhe pakice
Afarizmi me pasuri te padundshme
Prodhimi i ushqimit ,pijeve dhe produkteve të duhanit
Ndërtimtari
Hoteleri
Të tjera
Bujqësia,gjuetia dhe pylltaria
Transporti, magazinimi dhe komunikacioni
Mbrojtja shëndetësore dhe sociale
Edukimi
Administrimi publik dhe i mbrojtjes,sigurimi social i…
Indusria nxjerrëse
Furnizimi me energji elektrike ,gaz dhe ujë të ngrohtë
Ndërmjetësimi financiar
% Numri i ndermarrjeve sipas aktivitetit ekonomik 2013

39
MP
KO
SO
VA
20
13
GRAPH15: NUMBER OF WORKERS BY INDUSTRY, 2009 - 2013
SOURCE : MTI
GRAPH16: NUMBER OF ENTERPRISES BY INDUSTRY, 2009 - 2013
SOURCE : MTI
0 1000 2000 3000 4000 5000 6000 7000
IND.USHQIMORE
IND.TEKSTILIT
IND.LEKURES
IND.DRURIT
IND.LETRES
IND.NAFTES
IND.KEMIKALEVE
IND.GUMES DHE PLASTIKES
IND. MINERALEVE JO METALIKE
IND.METALEVE
IND.PRODH. E MAKINAVE
IND.PAISJ. ELEK. DHE OPTIKE
IND.TRANSPORTIT
TJERA
IND.USHQIMORE
IND.TEKSTILIT
IND.LEKURES
IND.DRURIT
IND.LETRES
IND.NAFTES
IND.KEMIKALEVE
IND.GUMESDHE
PLASTIKES
IND.MINERALEVE JOMETALIK
E
IND.METALEVE
IND.PRODH. E
MAKINAVE
IND.PAISJ. ELEK.
DHEOPTIKE
IND.TRANSPORTI
TTJERA
2013 6261 1315 234 1314 1975 39 598 1797 3776 2265 321 74 33 1571
2012 5537 1235 181 1304 1724 12 578 1755 3776 2403 316 60 47 1160
2011 4503 1281 153 1039 1598 5 533 1505 3197 1648 180 132 48 1072
2010 5479 1222 119 1403 1734 3 722 1393 4040 1934 168 267 316 984
2009 4960 791 104 1183 1422 0 509 1346 3084 2126 136 190 301 849
0 200 400 600 800 1000 1200 1400
IND.USHQIMORE
IND.LEKURES
IND.LETRES
IND.KEMIKALEVE
IND. MINERALEVE JO METALIKE
IND.PRODH. E MAKINAVE
IND.TRANSPORTIT
IND.USHQIMORE
IND.TEKSTILIT
IND.LEKURES
IND.DRURIT
IND.LETRES
IND.NAFTES
IND.KEMIKALEVE
IND.GUMESDHE
PLASTIKES
IND.MINERALEVE JOMETALIK
E
IND.METALEVE
IND.PRODH. E
MAKINAVE
IND.PAISJ. ELEK.
DHEOPTIKE
IND.TRANSPORTI
TTJERA
2013 1288 391 38 596 416 8 135 384 473 756 71 7 8 542
2012 1193 361 36 586 380 8 125 371 441 730 74 6 6 519
2011 1120 311 29 581 359 6 116 334 421 699 31 61 10 456
2010 1067 302 28 593 352 7 115 306 413 658 30 65 9 412
2009 1099 307 34 606 329 8 113 294 387 673 30 64 6 403

40
MP
K
OS
OV
A
20
13
B3. Labor Market Analysis
TABLE8: KEY INDICATORS OF THE LABOR MARKET (%), 2013
KEY INDICATORS OF THE LABOUR MARKET (%) Men Females Total
The rate of labor force participation 60.2 21.1 40.5
The rate of non-activity 38.8 78.9 59.5
Employment ratio to population ( unemployment rate) 44 19.9 28.4
Percentage of vulnerable employment toward overall employment 25 18.9 23.6
The unemployment rate 26.9 38.8 30
The unemployment rate among young people (15-24 years) 50.4 68.4 55.9
Neeta percentage of youth in the population of young adults (15-24
years) 30 40.9 35.3
SOURCE: MPMS
B3.1. Main indicators of labor market
The LFS data of 2012 and LFS of 2013 are comparable because the data collection and analytical definitions
were the same in both years. The following table summarizes the key indicators of the labor market for these
two years.
TABLE9: THE LABOR MARKET SUMMARY, 2012 - 2013MESHK
Kosovo 2012 Kosovo 2013
The rate of non-activity 63.1 59.5
The rate of labor force participation (%) 36.9 40.5
Men 55.4 60.2
Females 17.8 21.1
The employment rate 25.6 28.4
Men 39.9 44
Females 10.7 12.9
Part-time (as a% of employees) 11.1 11.9
Men 11.3 11.1
Females 10.3 14.3
Temporary employees (as% of employees) 73 68.8
Meshkuj 73.2 68.9
Femra 72.5 68.7
self employed (as% of employees) 19.8 22.9
Men 22.7 26
Females 8.3 12.8
Unemployment rate (%) 30.9 30
Men 28.1 26.9

41
MP
KO
SO
VA
20
13
Females 40 38.8
The unemployment rate among young people (% of the
age group 15-24) 55.3 55.9
Men 52 50.4
Females 63.8 68.4
Long-term unemployment (12 + months unemployed) 59.8 68.9
Men 59.1 71
Females 61.3 68.9
UJ I
SOURCE : MLSW
B3.2. Assessment of needs and the main challenges for employment and
vocational training
Policy development in the field of employment and vocational training and coordination, monitoring and
evaluation of their implementation is done by MESW, respectively by the Division of Labor and Employment
and Vocational Training within the Department of Labor and Employment. Public Employment Services
(PES) are provided through a network of seven regional employment centers, 23 municipal employment
offices, 8 vocational training centers and their 6 mobile units.
Employment Office (EO), has the responsibility to register the unemployed, explore the job market and to
provide job seekers with labor market information (including opportunities for migration for work), career
counseling and training and to mediate for their employment. Vocational training is offered through eight
vocational training centers (VTCs) and 6 mobile units, but also by engaging of other non-public providers in
specific cases.
MESW through VTC offers free trainings (based on class and workshops) for over 30 different professions.
Besides trainings offered by VTC, schools for vocational training offer various trainings for adults in different
profiles which are offered for regular students also. The maximum duration of the program is 3 months.
Vocational schools are allowed to charge participants for these programs in accordance with conditions
regulated by the MEST. In addition to the training provided by the public sector, the non-profit sector and the
private sector provide such trainings also. Trainings of the private sector are focused mainly in the IT courses,
business management, accounting and auditing.
As has happened in the region, in Kosovo are also being established the private employment agencies,
including specialized recruitment websites to provide services for job vacancies, recruitment services and
temporary employment. National Qualifications Authority (NQA) has the overall responsibility on the
National Qualifications Framework (NQF) by ensuring the compliance with the European Qualifications
Framework, establishment of criteria and processes for the approval of proposed qualifications for
involvement in CCC, accreditation of VET providers and quality assurance in accredited institutions.

42
MP
K
OS
OV
A
20
13
Vacancies by Sector
During 2013, concerning the classic classification of economic sectors, as in previous years, most of the
vacancies offered refer to the tertiary sector (services, 70%), and followed by the secondary sector
(production, 21%) and the primary sector (agriculture, 9%).
GRAPH17: VACANCIES SECTOR FOR 12 MONTHS, 2013
SOURCE: MLSW
Tertiary sector shows a modest increase in the number of job vacancies reported during this reporting period
from 56% as it was in 2012 to 70% in domestic sources 2013. While the secondary sector shows declining
value of 32% as it was in 2012 to 21% during the year. Same primary sector showed a decrease of 12% as last
year was 9% for 2013.
Employments by Sector
Mediation in Employments by economic sectors confirm the developments related to job vacancies found
from the job market research which is done by the employment advisors. Regarding the employment in the
tertiary sector (services) in 2013 represent an increase of 63.3% in this reporting year compared with 2012
with 56.9%.
GRAPH18: EMPLOYMENTS BY SECTOR FOR 12 MONTHS, 2013
SOURCE :MLSW
5%
12%
9%
28%
32%
21%
67%
56%
70%
2011
2012
2013
Fig.11:Vendet e lira sipas sektorit për 12 muaj
Terciar Sekondar Primar
4.6%
15.5%
14.0%
32.4%
27.6%
22.7%
63.0%
56.9%
63.3%
2011
2012
2013
Fig.17: Punësimet sipas Sektorit për 12 muaj
Terciar Sekondar Primar

43
MP
KO
SO
VA
20
13
The secondary sector (manufacturing) marked a sharp decline from the previous year of 27.6% to 22.7%
during the second 2013. The share of all employment that refer to the primary sector during this reporting
year show a decline from 15.5% as it was in 2012 in 14.0% for 2013 (see graph.18).
The average salary in Kosovo
Wage growth is an element that is discussed every day and the study of the average salary in Kosovo as part
of this research has been a challenge, considering that the salaries determine also the work as an act that
relates the employer and employee in terms of employment relationship.
The study will focus on the trend of increasing of the wages, for the reason that this growth is often made only
after pressure of the workers syndicate and not as a result of necessary growth due to increased market prices.
GRAPH19: AVARAGE SALARY, 2012 - 2013
SOURCEI:MLSW
The research, which was conducted for the needs of the labor market in the entire territory of Kosovo, has
covered 1,480 enterprises, respectively employers representing about 19,962 employees. Average salary on a
Country‟s scale each year marks a slight increase, when considering the comparative method from year to
year showing the positive trend of growth. The main factor of this growth of the average salary comes as a
result of economic progress especially last year where investments in infrastructure, growth of the
construction sector, agriculture and energy have been among the highest in recent years. This significant
increase is noticed, if we compare 2011 with 2013, where it reaches the level of more than 5.8%.The average
salary for employees in Kosovo is reached by around 346 €.
If we compare this average to the year 2011 then the difference is 5.82%, which means that from 2010 as it
was 292 €, in 2011 has been 327 € or growth was approximately 12%, while for 2013 is 346 euros for 5.8%
increase.
327 €
346 €
315 €
320 €
325 €
330 €
335 €
340 €
345 €
350 €
v 2012 v 2013

44
MP
K
OS
OV
A
20
13
B3.3.Multiple needs for social protection
The social protection system in Kosovo is relatively closed social network for people in need. It consists of
social security, social (monetary) transfers in form of targeted social assistance, other small categorical
programs and social assistance in the form of social and family services and family.
Benefit programs in Kosovo (pensions and social protection schemes) according to estimates of MLSW cover
over 300,000 persons what means about 15% of the population have access to one of the social payment
schemes managed by MLSW.
With the high level of poverty, and high level of unemployment, development and expansion of social
protection network is essential in order to enable to the poor and vulnerable families better management of the
socio-economic risk. In Kosovo, the main tool for this is the Social Assistance Scheme (SAS). Pensions and
in particular the basic pension scheme also play an important role in poverty alleviation. Various pension and
social protection schemes are an important source of incomes for families, particularly for those with low
incomes. Remittances from abroad (remittances) also continue to have a very important role for households
and significant effect in reducing poverty.
The table below provides a simplified illustration of social protection system in Kosovo, including the number
of beneficiaries in each of them and the costs of the scheme for 2012:
TABLE10: SOCIAL PROTECTION SYSTEM IN KOSOVO, SCHEMES, NUMBER OF BENEFICIARIES AND
EXPENSES, 2012
Protection social relating to schemes
The number of
beneficiaries in
2012
The amount of
benefits in 2012
(EUR million)
Basic pension contributions 147,765 111.25
Pensions and disability benefits 21,965 15.72
Early retirement of KPC and Trepca 4,641 4.67
War Invalids Benefits 13,232 6.61
Social assistance 31,111 27.39
Labor Market and the puerperium 8,818 3.95
SOURCE: MLSW
In order to improve the living conditions, poverty alleviation, solving social and economic problems of
citizens in social need are set up and the schemes that are functional are: Social Assistance Scheme,
Emergency scheme, Support Scheme for families with Children with Disabilities, Basic Pension Scheme – for
the ol age, -Contributory Pension Scheme,Pensioners Scheme of Trepca,Pension Scheme of KPC, Pensioners
Scheme for People with Disabilities,Scheme of Martyrs' Families, War Invalids and Civilian Victims.
Social Assistance Scheme

45
MP
KO
SO
VA
20
13
Through this scheme it is aimed the alleviation of poverty.The scheme is public, universal and financed by
public funds. Social Assistance Scheme in Kosovo, for the first time was presented in the year 2000 and was
revised in 2003 and 2012. This scheme was set up in order to protect and care for the families endangered in
social and economic aspect.
Scheme of children with permanent disabilities 1-18 years
Based on Law no.03/L-022 for support to families who have children with permanent disabilities, MLSW
through DSW has continued with the implementation of Scheme for families who have children with
permanent disabilities, with material compensation in the amount of 100 € monthly for a child.
Also Family Housing - is an alternative form of protection of children without parental care for
abandoned, children of parents prevented of the parental duty, endangered, neglected and abused children
without shelter who are placed in foster families.
There are two forms of foster care: 1.) Foster care by relatives or relatives who voluntarily accept supervision
of children without parental care, and 2.) Foster care outside the family that realized by families who have no
relations with the children.
Foster care to relatives- for children without parental care and are accommodated at their relatives, are 575
children with material compensation that is 75- € per month. And Family Housing Alternative / outside
family for abandoned babies after birth, neglected, abused children, and the children of the parents prevented
from exercising the parental duty that are temporarily accommodated in the trained and assessed families by
SWC, who have no family ties with family, payment is 150 € per month for one child plus 75€ the initial
payment upon placement. Currently at this shelter are 77 children.
Basic Pension Scheme of - the old age
It is a general scheme, noncontributing, funded by the Kosovo Budget. It is conceived as a fixed monthly fee,
for all citizens of Kosovo, over 65 years, regardless of whether they have previously worked or not, and
whether they realize pensions from abroad.
The Contributory Pension Scheme
Contributions paid pensions were intended for persons who have reached 65 years of age and who show that
they have been employed for over 15 years. According to MLSW, these pensions are using 34.722
pensioners, who receive 112 euros per month and now with the recent rise, they receive 140 euros per month.
Pension of Trepca only intended for underground mining miners, who have not yet reached the age of 65
years. It started to be implemented from January 2003. During 2003/2004 the monthly amount of this pension
was 40 euros, while from 2005 until now it was 50 euros per month. But with the recent growth it is with
50 % increase for a miner. These pensions currently are using 3.913 miners.

46
MP
K
OS
OV
A
20
13
Pensions of former KPC are using 728 persons. The minimum payment is 100 euros while the maximum is
347, according to official military rank and the degree of determination.
Pensioners Scheme for People with Disabilities
This pension or financial support is provided to adults over the age of 18 years or less than 65 years who are
fully disabled and unable to work.This pension are using 18,427 people, in the amount of 45 euros, then 60
euros, and now with increase in 2014, 75 euros per month.
Scheme of Martyrs' Families, War Invalids and Civilian Victims
The scheme is aimed at providing benefits for categories of citizens who have suffered from maltreatments
and the war that happened during 1998/99 in Kosovo.
Currently benefiting from this scheme are over 13.196 persons. In this scheme, we have some classifications
of beneficiaries as: war invalids, civilian invalids of war, martyrs‟ families who have missing persons, war
invalids caretakers, etc.

47
MP
KO
SO
VA
20
13
B4. Human capital
B4.1. Degree / level of education
The education system in Kosovo is being reformed, and these processes have affected every level of his.
Besides educational programs such as the drafting of the New Curriculum of Kosovo, which is in the pilot
stage (this year included 114 schools in the pilot), reform has included the form of organization of
institutions. In Kosovo, in addition to public schools and colleges, there are also private institutions for all
levels of education. The illiteracy rate in Kosovo according to the data from the population census was 3.85%.
TABLE11: EDUCATION LEVEL OF THE POPULATION EXPRESSED IN PERCENTAGE, 2011/2012, 2012/2013 AND
2013/2014
2011/12 Preschool Before
Primary
Primary and
lower
secondary
Secondary
High University
Females 47.60% 48.20% 48.40% 46% 53%
Men 52.40% 51.80% 41.60% 54% 47%
2012/13
Females 53.20% 48.90% 48.20% 46% 49.50%
Men 46.80% 51.10% 51.80% 54% 50.50%
2013/14
Females 52.50% 49.20% 46.70% 46.60% 49.30%
Men 47.50% 50.80% 53.30% 53.40% 50.70%
SOURCE : MEST
TABLE12: PERCENTAGE OF INCLUSION IN EDUCATION SYSTEM BY LEVELS, 2011- 2014
Year Preschool Before
Primary
Primary and
lower
secondary
Secondary
High University
2011/12 4.22% 1.10% 61.50% 22.26% 11%
2012/13 4.30% 1.14% 61% 22.10% 11.40%
2013/14 4.27% 1.15% 62% 22% 10.60%
SOURCEI : MEST
Ministry of Education, Science and Technology possesses Management Information System on Education
(EMIS), through which provides data for total number of students involved at all levels of pre-university,
starting from the 0 - including preschool education, Primary level - grades 1-5, lower secondary level - grades
6-9 and upper secondary level - grades 10-12 (since 2013/14 school year was the Last year where within the
education system in Kosovo has also functioned the 13th grade).

48
MP
K
OS
OV
A
20
13
Also, the Ministry of Education, Science and Technology has an ongoing collaboration with the Statistical
Agency of Kosovo to provide data for general census population and birth registration, in order to do a good
planning for registration of students in the first elementary grade.
B4.2. The ability to access the educational system
In Kosovo, no person shall be denied the right to education. Pre university education is a responsibility shared
between parents, educational and training institutions, municipalities and government, according to the
functions and duties, prescribed by the relevant law. All bodies involved in the provision of pre-university
education should plan and provide efficient, effective, flexible, comprehensive and professional services
designed to provide to all the children equal rights to education, in accordance with their skills and their
specific needs, as well as to advance their social and educational development. During the planning,
management and implementation of pre-university education system, MEST, municipalities, educational and
training institutions should take into account international norms adopted for education for all, children's
rights, and protection of vulnerable groups in society and for gender equality promotion.
Secondary vocational education, which means vocational schools, as the primary goal have the preparation of
students for the job market and operates according to the Law on Education and vocational training and
adults education, and NQF (National Qualifications Framework). This education provides the opportunity to
apply for higher studies also, such as university. In this area we have numerous advances, including the
establishment of the Agency for Education, Vocational Training and Adult Education.
Advances have been made in the professional development of teachers through numerous trainings and
through ATP program (Advancing of teachers qualifications), and within two years each teacher over the age
of 50 years shall possess at least a bachelor's degree. Also, equipping of teachers with the licenses is an
important step in this direction.
In the professional development of teachers MEST has invested continuously, has organized programs in
ATP (Advancing of Teacher Qualifications)in collaboration with the Faculty of Education has also accredited
13 training programs and five NGO organizations. A software program is provided for the establishment of
licensing data; during 2013 were licensed 20,530 teachers. Among the most important, trainings are trainings
on the implementation of the new curriculum ECDL and the training with “Base in school ".
B4.3. Access to higher education
Higher Education offers study opportunities for all persons within or outside the territory of Kosovo, without
any discrimination (national, racial, religious, gender). Now there are 6 public universities within the territory
of the Republic of Kosovo, as well as 25 private colleges. Each of these institutions of higher education being
public or private, offer study programs accredited by the Accreditation Agency of Kosovo. There is no age
limit to register or to gain higher education qualifications in Kosovo. The total number of students in Private
Higher Education (accredited by AAK) in the academic year 2012/2013 there were 10,195 students. Payment
of the semester is brought from 400 € to 500 € (except AUK, where price ranges up to 2500 dollars).

49
MP
KO
SO
VA
20
13
Within the Ministry of Education, Science and Technology operates NARIC center, which makes the
equivalence of higher education degrees obtained abroad.
Higher education can be followed on a regular, part-time, through distance learning and the combination of
any of these modes of study, as provided in the statutes of the respective institutions that offer higher
education qualifications.
In the case when a certificate for completion of a school in another state is presented, recognition, except in
exceptional cases, will be made only for the certificate showing the completion of at least 12 years of
education, and that gives the right to its holder to apply in college or to enter the university entrance test in the
respective foreign country.
B4.5.The shortcomings and challenges of the education sector
Vocational training and knowledge acquired through higher education are important factors in generating jobs
and creating a welfare state and society.
Despite the efforts made in recent years, the education system in Kosovo still does not address the educational
needs and training needs of the youngest population in Europe, which results in high numbers of unemployed
young people without skills or qualifications required by growing and developing economy. The system is
burdened by the sheer number of population in urban areas resulting from the rapid migration from rural
areas.
Access is uneven as a result of the huge contrast between schools in terms of quality. In management
education there is a profound gender gap. Although there are more women teaching in primary level, there are
very few women appointed as director or educational official at the municipal level
We have an evident decrease of drop-out rates at all levels of pre university education. Thus, in the school
year 2012/13 at levels 1 and 2 (grades 1-9) dropout rate is 0.12%, while the 3rd level (grades 10-13) dropout
rate is 0.82% (source data MEST, EMIS).
During 2013 (January-June) through the Department of Inspection 6.824 documents are verified for students
who want to attend school outside of the Republic of Kosovo, while 1091 requests were submitted for
Verification of pre-university education documents (from different countries of the world) during 2013.

50
MP
K
OS
OV
A
20
13
PART C: ABALYSIS OF MIGRATION SITUATION IN THE
COUNTRY / STATE
Factors that encourage migration are often intertwined and complex, and in the case of Kosovo these factors
have changed over the time and depending on the internal and external context of Kosovo.
Immigration
- Push factors
- As demonstrated by applications for visas, unstable political situation in the Middle East countries
and from Africa have brought as effect the reduction of capabilities of the police of these countries
to ban immigration from their states,
- Armed conflicts as the one in Syria has driven the search for ways to get out of these places.
- Pull factors
- The geographical position of Kosovo, part of SEE and land borders with Albania, Montenegro,
Macedonia and Serbia, can be seen by immigrants, as a transit country for European Union countries
of Central Europe;
- Many people choose to come for reunion with other persons of the family who may be employed in
Kosovo or for the reason of marriage with the citizens of Kosovo. Family reunion as noted by
statistics is a growing push factor;
- As a result of improving the overall climate for doing business in Kosovo is increasing the number of
applications for permanent residence from Turkey, China and India.
Emigration
- Push factors
- Kosovo's economic imbalances compared with the developed countries of the EU;
- Unemployment and low salaries offered by private business and public administration in Kosovo;
- The situation of the ongoing ethnic conflict in Kosovo which culminated in armed conflict in 1998-
1999, has been a booster dominant factor in the past for those who have emigrated and who still live
abroad.
- Pull factors
- Geographical distance with the destination country where there is a support from thousands of
Kosovars who live and work in EU countries, mostly in Germany and Switzerland;
- Greater opportunities for employment, education and social assistance to children eg. in Sweden;
- Perceived opportunities for legalization of residency documents in a quick and easy way.

51
MP
KO
SO
VA
20
13
In comparison to the last year there have been changes in the dynamics of push and pull factors for migration
as: improving of the doing business climate, increasing of family reunification and reducing of the
dominance of propellant factor related to ethnic conflict in previous years.
C2.Immigration
C2.1. Visa Regime
Since July of 2013, the Republic of Kosovo applies the visa system for 87 different countries of the world.
According to the Government Decision dated May 8, 2013, complemented with the Decision dated 29
November 2013, nationals from the countries listed in the table 47 (Statistical Annex for complementary
table) are exempted from visa regime for entry, transit and residence in the territory of the Republic of
Kosovo for up to 90 days, for a period of six months from the date of first the entry. Moreover, according to
the Governments Decision, certain categories are exempted from the need to obtain an entry visa to Kosovo.
Those categories are:
Nationals of countries for whom Kosovo applies visa regime but who have valid biometric residence permit
issued by one states of Schengen Area, also holders of a valid multi-entry visa to Schengen are freed from
the need to obtain a visa to enter, transit and stay in Kosovo. Their stay within Kosovo is limited to 15 days.
Nationals of the Member States of the EU member states of the Schengen zone, The Holy See, the
Principality of Andorra, Principality of Monaco, Republic of San Marino, Republic of Albania, Montenegro,
and the Republic of Serbia are permitted to enter, transit and stay up to 90 days for a period of six (6) months,
with biometric ID cards valid.
Holders of diplomatic and official passports issued by the Russian Federation states, People's Republic of
China, Egypt, Indonesia, and Ukraine are allowed to enter transit and stay up to 15 days in Kosovo.
Holders of valid travel documents issued by the administration of specific regions of the People's Republic of
China: Hong Kong and Macao, are exempt from the need to obtain a visa.
Holders of travel documents issued by Taiwan are exempt from the need to apply for a visa as long as they
notify in advance the diplomatic / consular mission in Kosovo.
When valid travel documents issued under the Convention Relating to the Status of Refugees (1951) and the
Convention on the Status of Stateless Persons (1954) as well as valid travel documents for foreigners, are
issued by member states of the EU and the Schengen Area, and the United States of America, Canada,
Australia, Japan, New Zealand, then their holders are freed from the need to obtain a Kosovo visa to enter,
transit, and stay in Kosovo for up to 15 days.

52
MP
K
OS
OV
A
20
13
Holders of travel documents (Laissez-Passer) issued by the UN, NATO, OSCE, Council of Europe and
European Union, are exempted from the procedures for visa equipment to enter the country regardless of
their nationality.
Applications for entry visa to Kosovo and the number of visas issued
During the period July-December 2013 Kosovo entry visas are issued only at the General Consulate in
Istanbul. In exceptional cases, a number of visas are issued in PKK as well. From January 2014 the visa
system will be operational in most diplomatic and consular missions in Kosovo and will stretch far and wide.
During the period July-December 2013, 359 applications were received for entry visa to Kosovo, of which
lead the visa applications intended to visit family (32,9%), then study visas (invitations to participate in
trainings, seminars, summer universities – 20,7%), official visas (by invitation of state bodies and
international organizations accredited in Kosovo - 17.2%), business visas (invitations from non-governmental
organizations, private businesses - 16.8%) and tourism visas (8.7%).Of the total number of visa applications,
325 (or 90.5% of total applications) entry visas were issued and 34 requests (9.5%) have been rejected.
GRAPF20: REQUIREMENTS FOR ENTRY VISA TO KOSOVO, BY STATES, 2013
SOURCEI :MFA
Highest percentage of refusals for entry visa to Kosovo have the citizens of Syria (31,9%), Iraq (22.2%) and
Egypt (20%), whereas the highest percentage of approved visa have the Afghanistan nationals (100%),
China (100%), Ukraine (100%), Iran (100%) and Libyan (98.7%). The reason for a high percentage of visa
refusals for citizens of Syria, Iraq and Egypt is explained by the incomplete visa documentation (applicants
have not been to argument the purpose and reason of the planned trip to Kosovo).On the other hand, a high
percentage of visa approvals for the above mentioned states derive due to the reason of visa application in
Kosovo, where we mainly have to do with official or business visits (with corresponding invitations).
81
47
29 20 18
13 12 10 10 9
0102030405060708090

53
MP
KO
SO
VA
20
13
GRAPH21: NUMBER OF VISAS ISSUED IN PKK, JULY-DECEMBER 2013
SOURCE :MFA
In CCP were issued 88 visas or 27.1%.This high number of visas issued in CCP can be justified by the fact
that persons who have received visas at the border(mainly with formal invitation from local and international
institutions) have had planned visits in Kosovo and have not been able to apply for a visa (Chart 21).
C2.2. Foreigners who stay in Kosovo and the type of immigrants
Residence permits issued to foreigners b y citizenship, residence permit
types and duration
Immigration issues are now regulated by Law no. 04 / L-219 for Foreigners, which entered into force on 5
September 2013.This Law regulates the conditions of entry, movement, residence and employment of
foreigners in the territory of the Republic of Kosovo. Although in September 2013 Law no. 04 / L -219 for
Foreigners entered into force, it should be noted that the migration data are based on previous Law No. 04 /
L-069.Law for Foreigners includes all matters relating to foreigners starting from entrance , movement and
their stay in the Republic of Kosovo and addresses to all relevant institutions dealing with this field.
According to Law on Foreigners (Article 37) there are three types of stay: stay up to ninety (90) days,
temporary residence and permanent residence.
Temporary residence permits
During 2013 a total of 2,592 claims have been filed to the Commission for examination of Requests for a
temporary residence permit (including requests for extension of residence permit).Of this number 2,479 were
positive decisions (401 decisions without setting the duration, which have not been accepted yet by the parties
- until 12.31.2013)6, 25 decisions have been negative, 88 requests pending decision.
Consequently, for 2013 were approved 95.6% of the total number of applications for temporary residence
permits, 1.0% were rejected, in procedure were 3.4% and positive decisions without setting the length 15.30%
6 2078 persons are divided by category while 401 persons are not included in the table.
4
17
12
3
22
30
Korrik Gusht Shtator Tetor Nentor Dhjetor

54
MP
K
OS
OV
A
20
13
(from the number of positive decisions).Of the total number of positive decisions for a temporary residence
permit, as required, are granted: family reunification - 46.0%, Labor - 33.0%, Studies - and other 6.0% -
15.0%. Whereas by the data from the total number of temporary resident permits in 2013, leads the female
gender with 52% (1082) compared with the masculine with 48% (996).
GRAPH22: ISSUANCE OF TEMPORARY RESIDENCE PERMITS BY CATEGORIES, 2011 - 2013
SOURCE : DCAM-MIA
From the data of the total number of temporary residential permits of the year 2013 (2078) compared to 2012
(1866) there is an increase with 11.4% while in comparison with 2011 (1722) there is an increase of 20.7%.
GRAPH23: ISSUANCE OF TEMPORARY RESIDENCE PERMITS, COMPARISON OF 2012 - 2013
SOURCE: DCAM/MIA
518
893
51
260
691 728
166
281
962
679
128
309
0
200
400
600
800
1000
1200
B. familjar Punësim Studim Arsye të tjera
2011 2012 2013
691 728
166 281
962
679
128
309
0
200
400
600
800
1000
1200
B. familjar Punësim Studim Arsye të tjera
2012 2013

55
MP
KO
SO
VA
20
13
It is evident that the trend of increased issuance of residence permits in 2013 compared with 2012 is most
notable in the category of "Family reunification" (39.20%) followed by the category "Other"7 (9.50%) while
decreasing the category "Work" (-7.20%) while at the category "Research" (-29.69%) was noted a significant
decrease.
GRAPH24: ISSUANCE OF A TEMPORARY RESIDENT PERMITS BY TIME PERIODS, 2013
SOURCE: DCAM/MIA
Issuance of temporary residence permits in 2013, for at least 6 months but less than 12 months is dominant
with 94% of the total number. This time period seems to be more acceptable for all activities related to work,
which on the other hand are linked to family reunification, study, and other.
One of the main reasons for the growing number of temporary resident permits in total is due to the increasing
number of family reunification. In this increase is thought to have contributed the family reunification of
foreigners who work in Kosovo as are marriages, economic development associated with the growth of
foreign investment.
7 cultural, sport and religious activities are inclouded in the category "other"
36 45 7 18
924
622
121
291
2 12 0 0 0
100
200
300
400
500
600
700
800
900
1000
B. familjar Punësim Studim Arsye të tjera
3-6 muaj6-12 muaj

56
MP
K
OS
OV
A
20
13
GRAPH25: ISSUANCE OF TEMPORARY RESIDENCE PERMITS BY STATES, 2013
SOURCE :MIA/DCAM
Regarding granting of temporary residence permits for foreigners based on states, leads Turkey, Albania,
Serbia and Macedonia. Of the total number, leads Turkey with 34%, followed by Albania and Serbia with
22% to 16%, of the total number of residential permits granted.
Permanent residence permit
In September of 2013 began the issuance of permanent resident permits, by the end of 2013 a total of 20
requests were received, of which 19 are approved, while one application is refused. The numbers of
applications submitted are by these countries China (7), Turkey (5), India (2), Greece (2), Albania (1), Israel
(1) Pakistan (1) and the USA (1).
ID cards for foreigners
According to the data of Civil Registration Agency, Department for Production of Documents, in 2013 a total
of 1457 ID cards for temporary residence permit for foreigners were produced , that in comparison with 2012
has increased (in 2013 there were more)140 % (605) while the comparison between 2012 and 2011 there
was an increase (in 2012 there were more) 20% (5
05).The reason for the increase in 2013 was due the non-production of the corresponding documents for a
period of 6 months due to preparatory procedures that enabled the production of documents at the biometric
level. The Reason for non-compliance of residence permit decisions and production of ID cards for foreigners
is that the minor aged foreigners are not provided with identity card for foreigners.
Regarding Travel Document for foreigners and Travel Document with the Convention of the 28 July 1951 we
can say that for these documents there is a design but there is still no request accepted for their issuance.
565
372
278
147 127
57 43 40 26 25
398
0
100
200
300
400
500
600
TUR
KE
SHQ
IPET
AR
E
SER
BE
MA
QED
ON
ASE
AM
ERIK
AN
E
KIN
EZE
GJE
RM
AN
E
BU
LLG
AR
E
TAIL
AN
DEZ
E
FILI
PIN
ASE
Tjer
a

57
MP
KO
SO
VA
20
13
GRAPH26: IDENTITY CARDS FOR FOREIGNERS ISSUED BY YEAR,2009 - 2013
SOURCE :CRA
Employment of foreign nationals8
Procedures for issuing work permits for foreign nationals who wish to work in the Republic of Kosovo is
regulated by the Law Nr. 13 / L-136 on Provision of Work Permit and Employment of Foreign Nationals in
the Republic of Kosovo and Administrative Instruction Nr. 05/2010 for Regulation of procedures for Work
permits and Employment of Foreign Nationals in the Republic of Kosovo.
However, during 2013 was approved the Law on Foreigners, which regulates the issue of sustainability and
work permits for foreign nationals. With this law are abbreviated the procedures for equipping foreign
nationals with work and residence permits, the process is more simple and the time for obtaining permission
is faster. This law enters into force in 2014.
Ministry of Labor and Social Welfare based on the old law by the end of 2013 has issued a total of 1,614
work permits by type.
TABLE13: WORK PERMITS BY TYPE, 2013
Types of Permits Total Percentage
"A" (granted for foreigners for a period of time not longer than six months) 27 1.70%
“B” (granted to foreigners to be employed in a certain profession, in a geographical
area and given to aa specific employer for a period of one year)
1396 86.50%
“D” (self-employment work permit is granted for a period of one year) 7 0.40%
“F” (given to foreign persons in Kosovo studying for the uschool year) 1 0.10%
“G"(Given to foreigners who invest for a period of one year) 58 3.60%
"Exclusion" (Exemption from liability "- was given for a period of one year) 125 7.70%
Total 1614 100%
8 Source - MESW
1250
434 505
605
1457
0
200
400
600
800
1000
1200
1400
1600
2009 2010 2011 2012 2013

58
MP
K
OS
OV
A
20
13
SOURCE: MLSW
Of the total number of work permits issued by MLSW, the largest number of work permits was given to Turk
nationals with 49.7%, followed by Albanians from Albania with 18.3%, Macedonia 6.6% (see graf.27)
GRAPH27: EMPLOYMENT OF FOREIGN NATIONALS IN KOSOVO, BY PERCENTAGES AND STATES, 2013
BURIMI :MPMS
SOURCE: MLSW
C2.2. Foreigners who have acquired and have been denied citizenship of the
Republic of Kosovo
Law No. 04 / L-215 for Citizenship of Kosovo, determines the ways of acquisition, Loss, and regaining the
citizenship of the Republic of Kosovo and regulates other matters related to the citizenship of the Republic of
Kosovo. This law consists of 35 articles in total. In Article 5 are defined the criteria for Acquisition of
Citizenship of the Republic of Kosovo: by birth, by adoption, by naturalization, based on international
agreements and under Articles 31 and 32 of this Law.
With regard to the acquisition of citizenship, some requests are made by persons originating from Kosovo.
Kosovo citizenship law which regulates the conditions for the acquisition, loss or regaining of citizenship was
changed in 2011 and 2013. As a result these changes have caused some facilitation for granting citizenship to
persons originating from Kosovo. The law included provisions which allow stateless people to acquire
citizenship of Kosovo by respecting legal procedures.
Application procedures for acquisition of citizenship
Submission of the request for acquisition citizenship is done personally by the applicant at the civil
registration Municipal office where the applicant had the last residence; also the submission of the request for
acquisition of citizenship can be done in diplomatic/ consular missions9. In addition to the request shall be
attached the supporting documents required by the instructions, depending by the profit criterion which is
9 Diplomatic and consular missions: Germany (Berlin, Frankfurt, Stuttgart), Austria, Sweden, Holland, Bulgaria, Turkey (Ankara,
Istanbul), Switzerland, Slovenia, USA, Croatia.

59
MP
KO
SO
VA
20
13
being applied. Civil registration office in the respective municipality and diplomatic/ consular missions - after
the application, submit the files to the MIA, respectively Citizenship Division10
.
From a total of 667 claims submitted for acquisition of citizenship in 2013, of which 124 are positive
decisions (62 females and 62 males)and 372 are rejection or negative decisions (190 females and 182
males),Based on these data we can see that the number of rejections is significantly higher than the positive
decisions, this is due to not meeting the criteria required by the legislation in force as : legitimate residence in
Republic of Kosovo and inconsistency of data (for the Diaspora cases)11
.
GRAPH28: POSITIVE DECISIONS FOR ACQUISITION OF CITIZENSHIP BY GENDER, 2009 - 2013
SOURCE : DCAM-MIA
In graph 28 having as a reference the period of time 2009 to 2013, we see a significant decrease of acquisition
of citizenship in 2013, while an upward trend we had in the year 2011, with more than in other years, also
based on the data we see in figure, females gender lead in all years. The main reason is that as the number of
requests for acquiring citizenship under family reunification is greater, in this case referring to the law of
Citizenship where the criteria for eligibility for citizenship is 3-10 years, in Article 11 it is mentioned the
naturalization of the husband / wife which is up to 3 years, while in Article 10 is the naturalization of foreign
persons up to 10 years.
10
The statistical data for 2013 stem from the Law on Citizenship No.04 / L-034 and Supplementation amending the Law No. 04 / L-
059 and Law on Citizenship No. 04 / L-215 11
There are also other reasons of rejection but are small in comparison with the two reasons mentioned above.
40 58
123 89
62
55 59
155
106
62
0
50
100
150
200
250
300
2009 2010 2011 2012 2013
Mashkuj Femra

60
MP
K
OS
OV
A
20
13
GRAPH29: POSITIVE DECISIONS FOR PROFIT CITIZENSHIP BY AGE GROUP, 2012 - 2013
SOURCE : DCAM-MIA
Figures above show that the volume of persons who have acquired citizenship of the Republic of Kosovo in
2012 was greater than in 2013, where in 2012 of 195 persons female gender leads by 8.7% more than males,
while in 2013 there were 124 persons who have acquired citizenship, so here we have an equal number, 62
males and 62 females. As a result the number of individuals who acquire citizenship of the Republic of
Kosovo is greater than those of the family.
GRAPH30: POSITIVE DECISIONS FOR ACQUISITION OF CITIZENSHIP BY AGE GROUP, 2009 - 2013
SOURCE : DCAM - MIA
In terms of age groups shown in the figure above we see that in all the years (2009-2013) the age group 18-34
(334 or 41.3%) and 35-64 (363 or 44.9%) is growing, followed by the age group over 66 (79 or 9.8%) years.
1 1 4
89
78
22
0 0 0 1
62
46
15
0
0-5 6-13 14-17 18-34 35-64 >=65 Tjera
2012
2013
0-5 6-13 14-17 18-34 35-64 66+
2009 3 1 1 43 41 6
2010 1 1 2 39 65 9
2011 3 10 4 101 133 27
2012 1 1 4 89 78 22
2013 0 0 1 62 46 15
0
20
40
60
80
100
120
140

61
MP
KO
SO
VA
20
13
GRAPH31:POSITIVE AND NEGATIVE DECISIONS FOR ACQUISITION OF CITIZENSHIP BY PREVIOUS
CITIZENSHIP,2013
SOURCE : DCAM-MIA
According to statistics, in the figure above ,it is shown that people with Albanian citizenship lead with
decisions for acquisition of citizenship with (113 or 91.2%),these data are followed by persons with Turkish
citizenship (6 or 25%),while if we make comparisons with previous years this year we see that people with
previous Serbian citizenship suffered a decline.
C2.3 Irregular immigrants
Law no. 04 / L-219 for foreigners regulates the entry, movement, residence and employment of foreigners in
the territory of the Republic of Kosovo. This law includes all matters relating to foreigners from the moment
of entry, movement and their stay in the Republic of Kosovo and addresses all relevant institutions dealing
with this field. Law for Foreigners, Chapter III regulates the entry and departure of foreigners, Article 31
Conditions for entry of foreigner in the Republic of Kosovo, Article 32 Refusal of entry of a foreigner in the
Republic of Kosovo, Chapter V regulates illegal residence, return and expulsion of foreigners (Articles 93-
99), Border Police fully implements the laws applicable to foreigners in Kosovo through the control of
entrance, movement and residence of foreigners in the territory of the Republic of Kosovo.
The Border Police is one of the five departments of the police of the Republic of Kosovo. Border Police is
responsible for the management and control of borders against irregular migration and migrant smuggling.
Border Police cooperates and interacts with bodies that have jurisdiction in matters of asylum, refugees and
residence of foreigners, in order to achieve effective control and management of migration, and supervise the
border crossing points, the green and blue.
Criteria for categorization and standardization of border crossing points are developed by taking into
consideration the evaluation of internal and external factors and on the basis of interstate agreements
(international agreements). This categorization is based on the current situation, as well as in meeting EU
113
6 3 0 0 0 0 2
235
101
12 4 4 3 3 10
0
50
100
150
200
250
SHQIPTARE TURKE SERBE BOSHNJAK MALI I ZI SUDANEZ BULGAR TE TJERË
Vendime pozitive Vendime negative

62
MP
K
OS
OV
A
20
13
standards, such as: The circulation of people and goods, Cross-border crime, Migration and asylum and the
presence of authorized agencies in the integrated management and state border control (IBM).
Defining of the border crossing point‟s categories is done with the decision of the Government of the
Republic of Kosovo based on the recommendation of the Executive Board for IBM and in accordance with
bilateral agreements with neighboring states. Where required by the Executive Board for IBM, it can be
proposed the change of names and categorization of these border crossing points. Border crossing points of
the road, rail and air transport according to their importance and activity, are categorized into three
categories:
- Category A: BCP in category A are open 24 hours and serve for circulation of persons, vehicles and goods.
In these BCP, are constantly present BP (Border Police), KC (Kosovo customs) and AUV (Food and
Veterinary Agency).
- Category B: BCP in category B are open 24 hours and serve for circulation of persons and vehicles and non-
commercial goods. In these BCP (BCP), PK (border police) is present 24 hours, while KC (Kosovo Customs)
and AUV (Food and Veterinary Agency) during time intervals determined by bilateral agreements with
neighboring states.
Category C: BCP in category C are temporary BCK and are open to certain intervals. These BCK only serve
for circulation of people and open in accordance with bilateral agreements with neighboring states. Border
Police has the Directorate for Migration and foreigners and regional units for Migration and Foreigners within
the three regions East, West, North and Airport. Directorate and regional units have priority irregular
migration of foreigners in the Republic of Kosovo.
Foreigners who have been refused entry at the border of the Republic of
Kosovo
According to the Law no.04 / L-219 of foreigners, Article 32 and the decision no. 15/158 for the visa regime,
foreigners shall be denied entry to the territory of the Republic of Kosovo and a decision shall be issued with
the justification regarding the refusal of entry. The graph below shows the refused entry of foreigners in the
Republic of Kosovo.

63
MP
KO
SO
VA
20
13
GRAPH32: THE NUMBER OF FOREIGNERS WHO HAVE BEEN REFUSED ENTRY TO THE PKK
R.KOSOVO,2009 - 2013
SOURCE : BORDER POLICE DEPARTMENT, AND UNIT OF EVALUATION AND ANALYSIS OF RISK
By Border Police in 2013 were rejected in total 1449 persons. As a hot spot of refusals of entry is the airport
as in the entrance were refused altogether 549 persons or 37.89%,in all BCP with Serbia were rejected 440
persons or 30.37%, BCPs in Albania are rejected 271 persons or 18.70%, BCPs in Macedonia are rejected
162 persons or 11.18%,in Montenegro PKK are rejected 27 persons or 1.86%.
GRAPH33: REJECTION OF FOREIGNERS IN BCK (ONLY WITH NEIGHBORING COUNTRIES), BY
PERCENTAGE, 2013
SOURCE : BORDER POLICE DEPARTMENT, DEPARTMENT OF ANALYSIS AND RISK ASSESMENT
By all rejected 68.53% of those rejected are from European countries, 18.50% of persons rejected are from
Asian countries, 12.63%of those rejected were from African countries while 0.35%, were from America.
Most of those rejected by African and Asian countries are rejected pursuant to law on Foreigners and
administrative instruction mentioned above.
Citizens of EU countries during of 2013 were refused entry referring to law on Foreigners, and the decision of
the Government for state border crossing, decision no. 15/158 by which decision it is not allowed the border
cross without a visa, with non- biometric ID cards, unless biometric issued by countries of the EU or
Schengen countries.
1396 1466
1838 1911
1449
0
500
1000
1500
2000
2500
2009 2010 2011 2012 2013
Aeroport 37.89%
PKK me Serbinë 30.37%
PKK me Shqiperinë
18.70%
PKK me Maqedoni
në 11.18%
PKK me Malin e Zi
1.86%

64
MP
K
OS
OV
A
20
13
GRAPH34: REFUSAL OF ENTRIES FOR EU CITIZENS, 2012- 2013
SOURCE: BORDER POLICE DEPARTMENT, UNIT FOR ANALYSIS AND RISK ASSESMENT
This decision regulates the entry of nationals from 87 countries around the world who before entering the
Republic of Kosovo shall be equipped with entry visa in diplomatic and consular missions of the Republic of
Kosovo. These citizens may enter the Republic of Kosovo without a visa if they possess a valid multi-
entrance Schengen visa. Citizens of other European countries were denied entry because they did not have an
entry visa, sufficient sustenance means, they could not justify the purpose of stay and stay conditions.
Citizens of neighboring countries such as Albania, Serbia, and Macedonia were refused entry due to lack of
valid documents and because of restrictions to enter the Republic of Kosovo.
GRAPH35: REFUZALS OF ENTRY IN BCK BY CONTINENTS, 2013
SOURCE: BORDER POLICE DEPARTMENT, UNIT OF ANALYSIS AND RISK ASSESMENT
GRAPH36: REFUSAL OF ENTRY BY CITIZENSHIP (10 MAJOR STATES BY CONTINENTS), 2013
96
64
55
46 42
38
0 0
21
36
23 19
23
11
32
8
0
20
40
60
80
100
120
Gjermania Bullgaria Italia Zvicra Rumania Sllovenia Greqia Franca
2012 2013
Afrika, 12.63%
Amerika, 0.35%
Azia, 18.50%
Evropa, 68.53%

65
MP
KO
SO
VA
20
13
SOURCE: BORDER POLICE DEPARTMENT, UNIT FOR ANALYSIS AND RISK ASSESMENT
CHART 37: INTRODUCTION TO THE PKK REFUSAL, TOP 10 COUNTRIES – 2013
SOURCE: BORDER POLICE DEPARTMENT, UNIT FOR ANALYSIS AND RISK ASSESSMENT
In the graphs above, to the top 10 states in 2013 and 2012 we can see changes of entry rejections. Serbian
citizens are -10%less in 2013 as they were in 2012, citizens of Albania are -12.8%less in 2013 than in 2012,
Turkey citizens are declining from -177.7%less in 2013 compared with 2012. Regarding the Macedonian
citizens there was noted an increase in rejection entries for 33% more in 2013 than in 2012.This is due to
the fact that these citizens have attempted to enter Kosovo without valid documents.
285
196
125
81
56
36
32
28
23
23
21
19
11
8
8
41
Serbia
Shqipëria
Maqedonia
Turqia
Rusisë
Bullgaria
Greqia
BiH
Rumania
Italia
Gjermania
Zvicra
Sllovenia
Kazakistani
Franca
Te tjera
Europa - 2013
74
45
40
23
13
12
12
7
6
6
5
4
4
3
3
11
Siria
Kina
Jordania
Pakistani
Irani
Bangladeshit
India
Afganistani
Iraku
Jemeni
Sri Lanka
Libani
Arabia Saudite
Palestina
Kirkistanit
Te tjera
12
34
56
78
91
01
11
21
31
41
51
6
Azia- 2013
24
21
19
18
22
17
10
8
7
5
4
4
4
4
3
13
Maroku
Nigeria
Kameruni
Algjeria
Egjipti
Gambia
Kongo
Senegali
Bregu i…
Sudani
Mali
Libia
Guineja
Sierra Leones
Tunizi
Te tjera
12
34
56
78
91
01
11
21
31
41
51
6
Afrika- 2013
285
196
125 81 74 56 45 40 36 32
0
50
100
150
200
250
300

66
MP
K
OS
OV
A
20
13
GRAPH37: ENTRY REFUSALS IN BCP, TOP 10 STATES - 2012
SOURCE : BORDER POLICE DEPARTMENT, AND UNIT FOR ANALYSIS AND RISK ASSESSMENT
The table below gives the refused entries for 2013, according to the reason for the denial.
TABLE14: INTRODUCTION REASONS FOR REFUSAL, 2013
No document /
invalid visa
the
purpose
of the
visit not
justified
Non-
compliance of
the stay period
There is no
sufficient
means for
living
Alert is
issued
for entry
refusal
Threat to
Public
Safety
Not
eligible
for entry
in third
countries
other
529 570 19 70 99 17 12 193
SOURCE: BORDER POLICE DEPARTMENT, UNIT FOR EVALUATION AND RISK ANALYSIS
If we compare the total number of persons refused in this table shows a larger number, the reason is that in
some cases the persons are rejected not only for one reason. The data are only for 2013 because for the past
years there was no special form to record the reasons for the rejection of entries.
Comparing the years 2012 with 2013, refused entries are declining for -39% in 2013, here has influenced the
entry into force of the above mentioned laws and larger commitments of the border police to prevent the entry
of foreigners in order for Kosovo not to be used as a transit country by people from Turkey and other Asian
and African Countries who intend to enter the Republic of Kosovo and then leave through Serbia and
Montenegro to Western countries which creates a bad image of Kosovo and in some cases have become
victims of trafficking with migrants.
Foreigners caught inside Kosovo
Directorate for Migration and Foreigners is a specialized directorate within the Department of Kosovo Border
police, which deals with the treatment of irregular immigrants in the Republic of Kosovo. For the purpose of
prevention, identification and detection of irregular migrants, this Directorate conducts various inspections
throughout the territory of Kosovo, by doing various checks in those places where it was suspected that there
were illegal immigrants, as are different catering businesses, commercial, construction, health, educational
institutions as well as by making vehicle and travelers checkpoints near the border. Based on the Law on
318
225 213
94 90 66 65 57 55 46
0
50
100
150
200
250
300
350

67
MP
KO
SO
VA
20
13
Foreigners 04 / L-069, depending on the violation specified in this law, Department for Migration and
Foreigners has preceded these cases in the court or has issued an expulsion Order imposed for voluntary
return. Expulsion order is an administrative measure defined by the Law for Foreigners No. 03 / L-069, by
which the competent authority, in this case the Department of Migration and Foreigners, interrupts the
foreigners stay and forces him that within the period of 30 days to voluntarily leave the territory of Kosovo.
This measure follows with the ban on re-entry of foreigners in the Republic of Kosovo from 6 months to 1
year. Non-compliance with this provision results that the case of a foreigner to be proceeded at the court.
Analyzing the period 2011-2013, the total number of activities of this Directorate in the identification and
apprehension of illegal immigrants in Kosovo has marked continued progress despite the fluctuations that it
had. If during 2011 were identified and captured 709 foreigners with irregular status, in 2012 this number is
increased for 15% identifying and capturing 817 foreigners with irregular status marking a decrease for
13.5% during 2013 were 720 were identified and captured.
GRAPH38: NUMBER OF INSPECTIONS AND CAPTURES OF THE FOREIGNERS WITH IRREGULAR STAY IN
THE REPUBLIC OF KOSOVO, 2009 - 2013
SOURCE: DIRECTORATE FOR MIGRATION AND FOREIGNERS, BORDER POLICE
During 2013 a total of 1,103 inspections were conducted which have resulted in the identification and
apprehension of 720 foreigners with irregular status, which means 720 irregular immigrants. Of 720 treated
cases, 482 were prosecuted in court, while 238 eviction orders were imposed for voluntary return. During
2012 of the 817 treated cases, 479 were treated by the court while the Directorate for Migration and
Foreigners imposed 338 eviction Orders for voluntary return, and in 2011 from 709 cases 320 were treated by
the court while for 389 cases were imposed eviction Orders for voluntary return by this department.
850
992
1103
709
817 720
320
479 482 389
338
238
0
200
400
600
800
1000
1200
2011 2012 2013
Numri i përgjithshëm iinspektimeve te huajve me statuste parregullt
Numri i përgjithshëm i rasteve tehuajve te kapur me status teparregullt
Raste te dërguara ne gjykate
Urdhër largime
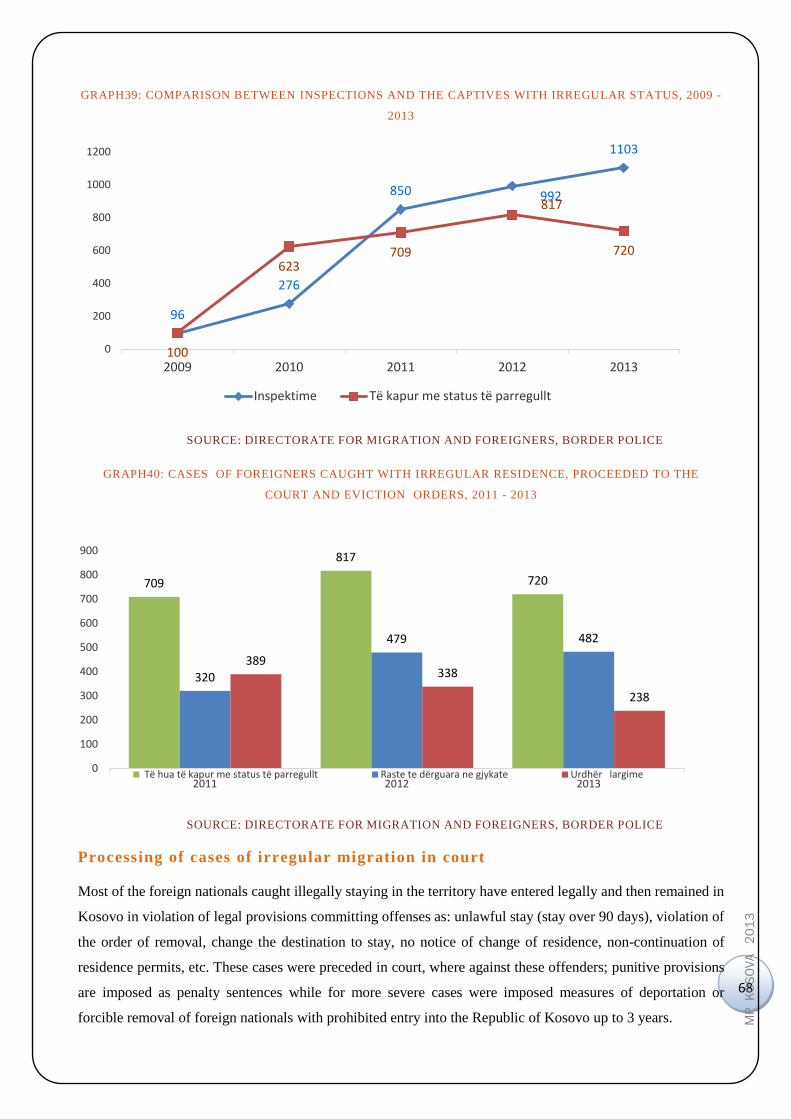
68
MP
K
OS
OV
A
20
13
GRAPH39: COMPARISON BETWEEN INSPECTIONS AND THE CAPTIVES WITH IRREGULAR STATUS, 2009 -
2013
SOURCE: DIRECTORATE FOR MIGRATION AND FOREIGNERS, BORDER POLICE
GRAPH40: CASES OF FOREIGNERS CAUGHT WITH IRREGULAR RESIDENCE, PROCEEDED TO THE
COURT AND EVICTION ORDERS, 2011 - 2013
SOURCE: DIRECTORATE FOR MIGRATION AND FOREIGNERS, BORDER POLICE
Processing of cases of irregular migration in court
Most of the foreign nationals caught illegally staying in the territory have entered legally and then remained in
Kosovo in violation of legal provisions committing offenses as: unlawful stay (stay over 90 days), violation of
the order of removal, change the destination to stay, no notice of change of residence, non-continuation of
residence permits, etc. These cases were preceded in court, where against these offenders; punitive provisions
are imposed as penalty sentences while for more severe cases were imposed measures of deportation or
forcible removal of foreign nationals with prohibited entry into the Republic of Kosovo up to 3 years.
96
276
850 992
1103
100
623 709
817
720
0
200
400
600
800
1000
1200
2009 2010 2011 2012 2013
Inspektime Të kapur me status të parregullt
709
817
720
320
479 482
389 338
238
0
100
200
300
400
500
600
700
800
900
2011 2012 2013 Të hua të kapur me status të parregullt Raste te dërguara ne gjykate Urdhër largime

69
MP
KO
SO
VA
20
13
The processing of cases in the courts has marked a continued increase in the three years period. During 2013
482 cases were treated in the court marking an increase of 0.9% compared with 2012, while in 2011 the
number of cases was 162 or about 51%more. However, if these statistics were compared to 2009 where 100
cases have been treated, 2013 with 482 treated cases marks an increase of 382%The reason for the
identification and larger detection of irregular immigrants consists in performing of a greater number of
police inspections of this Directorate, increasing of the cooperation with other police units in particular
receiving information from police intelligence, have proved to be successful in the prevention and suppression
of illegal immigrants.
GRAPH41: NUMBER OF FOREIGNERS TRAPPED R.KOSOVES TERRITORIES, IRREGULAR CASES LAWSUIT
TO THE COURT BY CITIZENSHIP, 2011 - 2013
SOURCE: DIRECTORATE FOR MIGRATION AND FOREIGNERS, BORDER POLICE
In 2013 the largest number of cases proceeded at the court are foreign nationals from countries in the region
such as Albania, Turkey, Bulgaria, Serbia, etc. In terms of gender coverage of irregular immigrants during
the years 2011-2013 the percentage of females is always more pronounced, compared to 2009 where the
largest number of irregular immigrants were male. So during 2013, 64.5% are female, while 35.5% were
male.
138
28 14 13 5
58 32 32
234
33 15 7
26
79
17
68
336
16 5 2 11
58 27 27
0
50
100
150
200
250
300
350
400
Shqipëri Bullgaria Moldavia Kinë Maqedonia Turqia Serbi Tjera
2011 2012 2013

70
MP
K
OS
OV
A
20
13
GRAPH42: NUMBER OF FOREIGNERS TRAPPED THE TERRITORY REPUBLIC OF KOSOVO, IRREGULAR
CASES LAWSUIT TO THE COURT BY GENDER, 2011 – 2013
SOURCE : DIRECTORATE FOR MIGRATION AND FOREIGNERS, BORDER POLICE
In 2013, from 482 cases prosecuted in court, 379 were aged 18-34 years or 78.6%, 101 aged 35-64 years or
20.09%, and only 2 cases or 0.5% are over the age of 65 years. As a result, the growth trend is characterized
by the age 18-34years old, respectively based on the three years compared we see that this age group
constitutes 58% in 2011, 60% in 2012 and 78.6% in 2013.
GRAPH43: NUMBER OF FOREIGNERS CAUGHT WITHIN THE TERRITORY OF THE REPUBLIC KOSOVO
IRREGULAR CASES PRECEDED AT THE COURT BY AGE, 2011 - 2013
SOURCE: DIRECTORATE FOR MIGRATION AND FOREIGNERS, BORDER POLICE
91
166
86
229
313
396
0
50
100
150
200
250
300
350
400
450
2011 2012 2013
Mashkullore Femerore
186
132
2
287
189
2
379
101
2 0
50
100
150
200
250
300
350
400
18-34 35-64 65-
2011 2012 2013

71
MP
KO
SO
VA
20
13
Foreigners who have been ordered to forcibly leave the Republic o f
Kosovo
Of the cases processed in the court, especially when dealing with cases of illegal staying‟s - stay over 90 days,
or not respecting the voluntary removal order, and based on the Law of Foreigners, the court as a competent
body, except for the penalties, has pronounced also measures of forced removal or expulsion of foreigners
with re-entry ban of up to three years. In such cases, the execution of the final court decision with which the
foreigner must leave Kosovo by force, is made by the Department for Migration and Foreigners.
During 2013 from Kosovo are forcibly removed a total of 94 illegal immigrants. From this number 76.6% are
female and 32.4% male.
GRAPH44: CASES OF FOREIGN NATIONALS FOR WHICH THE COURT HAS ISSUED AN DEPORTATION
ORDER FROM KOSOVO, BY GENDER, 2011 - 2013
SOURCE: DIRECTORATE FOR MIGRATION AND FOREIGNERS, BORDER POLICE
Age 18-34 years with 68% is the most expressed age. These data indicate that the removed persons by force
are female of the young age, which consists approximately with the total percentage of cases proceeded to
court.
29
13 22
72
42
72
0
10
20
30
40
50
60
70
80
2011 2012 2013
Mashkullore Femerore

72
MP
K
OS
OV
A
20
13
GRAPH45: CASES OF FOREIGN CITIZENS WHO WERE IMPOSED MEASURE OF DEPORTATION FROM
KOSOVO BY COURT, BY AGE, 2011 - 2013
SOURCE: DIRECTORATE FOR MIGRATION AND FOREIGNERS, BORDER POLICE
If we compare 2013 with 2012, when 55 foreigners left by force, 2013 has marked an increase of 39 cases or
71%, but compared to 2011 where 101 foreign nationals, were forcibly removed, in 2013 this trend has
marked a decrease of 7%.
With regard to the nationality of the foreigners removed by force lead the regional countries such as Albania,
Serbia, Bulgaria, followed by other countries such as Moldova, Turkey etc.
GRAPH46: CASES OF FOREIGN CITIZENS FOR WHOM THE COURT HAS IMPOSED THE MEASURE OF
DEPORTATION FROM KOSOVO BY CITIZENSHIP AND PERCENTAGE, 2011 - 2013
SOURCE: DIRECTORATE FOR MIGRATION AND FOREIGNERS, BORDER POLICE
2
64
34
1 0
31
23
1 0
64
28
2
0
10
20
30
40
50
60
70
14-17 18-34 35-64 65-
2011 2012 20122
45
7 6 4 2 6
23
8
34
6 3
0 0 1 3 8
75
6 2 0 2 3 3 3
0
10
20
30
40
50
60
70
80
Shq
ipër
i
Bu
llgar
ia
Mo
ldav
ia
Kin
ë
Maq
edo
nia
Turq
ia
Serb
i
Tje
ra
2011 2012 2013
Shqipëri 44%
Bullgaria 7% Moldavia
6%
Kinë 4%
Turqia 6%
Serbi 23%
Tjera 8%

73
MP
KO
SO
VA
20
13
• Foreigners who have been ordered to voluntarily leave the Republic of
Kosovo
Removal Order as administrative measure foreseen in the Law for Foreigners was issued to foreigners staying
illegally, within 30 days to voluntarily leave the territory of Kosovo. In a decision issued by the Directorate of
Migration and Foreigners, is foreseen the deadline to leave the country and the foreigner is obliged that upon
his departure to present this document to the border point control. After issuance of the removal order
foreigner has no right to re-entry into Kosovo in less than six (6) months and not more than one (1) year. Non-
compliance with the voluntary departure order deadline, it results that the case of the foreigner to be
proceeded to the Court and in most cases the court has imposed the measure of forced removal or deportation
with prohibition of re-entry to 3 years.
GRAPH47: CASES OF IMPOSING OF REMOVAL ORDERS FOR FOREIGNERS CAUGHT WITHIN THE
TERRITORY OF KOSOVO BY CITIZENSHIP AND PERCENTAGE, 2011 -2013
SOURCE : DIRECTORATE FOR MIGRATION AND FOREIGNERS, BORDER POLICE
During 2013, after the issuance of the relevant order from Kosovo, a total of 238 irregular immigrants have
left voluntarily. Of this number 86.5% or 206 were female immigrants while 32 were male or 13.5% irregular
immigrants, the age 18-34 years with 74.3%, is the more expressed age.
243
46 27
11 7 7 11 7 4 26
195
18 15 32
13 2
15 5
18 25
198
13 4 6 4 1 1 1 4 6
0
50
100
150
200
250
3002011 2012 2013
62%
12%
7%
3% 2% 2% 3% 2%
1%
6%
Shqipëri
Bulgari
Turqi
Serbi
Moldavi
Kinë
Maqedoni
Ukraina
Rumani
Tjera

74
MP
K
OS
OV
A
20
13
GRAPH48: CASES OF REMOVAL ORDERS FOR FOREIGNERS CAUGHT WITHIN THE TERRITORY
R.KOSOVES BY AGE, 2011 - 2013
SOURCE: DIRECTORATE FOR MIGRATION AND FOREIGNERS, BORDER POLICE
These data show that the most foreigners that have voluntarily left are female and of a young age.
GRAPH49: THESE DATA SHOW THAT MOST FOREIGNERS THAT LEAVE VOLUNTARILY ARE YOUNG
FEMALES
SOURCE: DIRECTORATE FOR MIGRATION AND FOREIGNERS, BORDER POLICE
If these data of the 2013 are compared with 2012 where voluntarily have returned 338 irregular immigrants
while in 2011, 389 have returned, the trend of persons who voluntary left goes by deduction from year to
year.
Victims of trafficking, people by citizenship and age group
251
137
1
213
121
4
177
59
2 0
50
100
150
200
250
300
18-34 35-64 65-
2011 2012 20122
76
119
32
313
219 206
0
50
100
150
200
250
300
350
2011 2012 2013
Mashkullore Femerore

75
MP
KO
SO
VA
20
13
Investigations Directorate of Human Trafficking (IDHT) is specialized directorate of Kosovo Police charged
with the responsibility of investigating cases of human trafficking and other offenses related to human
trafficking. IDHT has been structured under the Organized Crime Division within the Department of
Investigation of the Kosovo Police and has a functional management system and centralized leadership style
and is mandated to conduct investigations and operations against trafficking in the territory of the Republic of
Kosovo. In internal structure at the Central level it is consists by: Investigation Department and the
Department for Assistance and Protection of Victims, while at the local level consists of: Six (6)
Investigations Units of human Trafficking in Police Regions of Kosovo (Pristina, Mitrovica, Peja, Prizren,
Ferizaj and Gjilan).
Sector for Assistance and Protection of Victims deals with the protection and assistance of victims of
trafficking and the creation of a safety conditions for their reintegration and reconciliation into families and
society and the voluntary repatriation of foreign victims of trafficking in the country of origin.
In Kosovo functions the National Authority against human trafficking that is led by the National
Coordinator against Trafficking with human beings. Mainly this negative phenomenon is being conducted
by smugglers using the following methods:
- Job offers - the promise / lure victims (waitresses, dancers, bartenders, etc.) where they are promised
good monthly salary;
- Fraud / false promises of marriage or cohabitation, later known position by traffickers and their
family situation through intimidation and other forms of pressure forcing victims to provide sexual
services;
- Contact through social networks on the Internet, contacted young women from different persons;
- Forcing victims to make their own arrangements to make and take money from customers, not to be
dictated by the police and also if discovered, the case is not considered trafficking in persons but
Enabling prostitution or prostitution Intake.
- Difficulties and obstacles for identifying victims of human trafficking:
- Hidden Nature of the offense of trafficking / perception by the public that they are not forced, but
voluntarily provide;
- Frequent change of modus operandi of traffickers;
- Difficulties of proof and evidence during the investigation, often have only the statement of the
victim / witnesses cooperating with many difficulties;
- Unstable situation of victims / change of statements;
- Failure to cooperate in the rapid exchange of information between states police (lack of confidence);

76
MP
K
OS
OV
A
20
13
- Failure of proper awareness of civil society and other institutions in the referral of potential cases of
trafficking (mainly almost all cases of trafficking are discovered by police intelligence work);
-Non- profiling of social workers to deal with cases of trafficking in human beings - this is necessary
because we consider that we would have more referrals and especially more professional treatment of
identified cases; and
Non- profiling of Prosecutors / non- appointment of prosecutors in Basic prosecution to deal with cases of
trafficking - and this is causing difficulties in handling and managing professional investigations initiated
during all phases of the investigation.
Human trafficking is a complex phenomenon and continuously shows changes in the form and manner of
performance.
Currently trafficking trends in Kosovo are going in the direction of individual network organization, where
we have cases where women are the owners of cafeteria / bars or even in cooperation with their tutors help in
the recruitment of young women in order to victimize them.
Increased internal trafficking - since 2009 we have an increase of the number of local victims of trafficking,
especially age category 15 -17 years old who are most vulnerable / affected due to various factors such as the
following:
- Parental and family neglect
- Difficult economic and social conditions (poverty) ;
Abandonment of schooling ; etc.
- Also, external factors have contributed to this issue as:
- Expansion of the European Union with Eastern countries Romania, Bulgaria, etc.;
- - Visa liberalization of the Balkan countries. Kosovo is not any more an attractive/appealing Country
to traffickers, (victims of these countries move freely in western Europe);
- Most victims of trafficking are still found and identified in pubs, bars and restaurants, but also have
increased the cases when traffickers use private houses and organize transportation services from
houses to motels or other locations;
The main form of exploitation of trafficking victims in Kosovo is use for the provision of sexual services
(forced prostitution) and other forms of exploitation such as forced labor, enslavement and rarely encountered
beggar, etc.
If we refer to official data from DHTQNJ, numbers of trafficking victims by nationality can be summarized as
follows. It is clear from the table that the number of foreign national victims in 2013 has declined compared
to previous years due to effective changes in the law for foreigners as well as the increase the effectiveness of
the police work in investigating and preventing the phenomenon of trafficking with persons.

77
MP
KO
SO
VA
20
13
TABLE15: VICTIMS OF HUMAN TRAFFICKING IDENTIFIED IN KOSOVO BY CITIZENSHIP, 2009 - 2013
Year Kosovo Moldavn Albania Serbian Other Total
2009 16 8 3 1 1 29
2010 28 1 7 2 1 39
2011 35 0 1 3 0 39
2012 29 23 1 0 1 54
2013 44 0 7 1 0 52
Totali 152 32 19 7 3 213
SOURCE : DITHB, KOSOVO POLICE
GRAPH50: VICTIMS OF TRAFFICKING WITH PERSONS IDENTIFIED IN KOSOVO BY CITIZENSHIP AND
PERCENTAGE, 2009 – 2013
SOURCE : DITHB, KOSOVO POLICE
While the statistical situation of victims identified by age groups taking into account the causes described
above the trends of trafficking with Persons is as follows:
71%
15%
9%
3% 2%
Kosovare Moldave Shqiptare Serbe Tjera

78
MP
K
OS
OV
A
20
13
GRAPH51:VICTIMS OF TRAFFICKING WITH PERSONS IDENTIFIED IN KOSOVO BY AGE AND
PERCENTAGE, 2009 - 2013
`SOURCE: DITHB, KOSOVO POLICE
Persons arrested for alleged offenses related to trafficking with human
beings
TABLE16: BY ARREST OF CRIMINAL OFFENSES, 2009 - 2013
The criminal offense 2009 2010 2011 2012 2013 Total
Trafficking in persons 34 76 91 121 91 413
Enabling Prostitution 3 13 39 39 35 129
Prostitution 9 27 50 61 26 173
other offenses 6 5 3 7 30 51
Total arrests 52 121 183 228 182 766
SOURCE: DITHB, KOSOVO POLICE
The cause of the increased number of arrests from 2010 to date is as a result of the centralization of six
regional units under the command of CDITHB (Central Division of investigation of trafficking with human
beings) and Advancement of Investigation Directorate, the Sector in trafficking with Human Beings (IDHT)
With the creation of the Directorate for International Cooperation (ILECU) in the Kosovo Police has
increased the level of police cooperation with other countries in general. This Directorate has also enabled the
shortening of the way for the exchange of information which has resulted in the creation of a climate of
mutual trust.
36%
31%
16%
9%
4%
2% 2%
14-17 18-22 23-25 26-30 31-35 36-40 41-50

79
MP
KO
SO
VA
20
13
TABLE17:INTERNATIONAL POLICE COOPERATION REGARDING THE INVESTIGATION OF TRAFFICKING WITH
PERSONS, EXCHANGE OF INFORMATION, INTERNATIONAL LEGAL ASSISTANCE, 2009 - 2013 y
ear
Alb
an
ia
Ma
ced
on
ia
Mo
nte
neg
ro
Ser
bia
Sw
itze
rla
nd
Ger
ma
ny
Net
her
lan
ds
Sw
eden
Bel
giu
m
Ita
ly
Mo
ldoa
Oth
er
To
tal
2009 2 1 0 2 0 1 0 0 0 0 0 0 6
2010 3 1 1 4 0 1 1 0 0 0 1 0 12
2011 4 3 2 3 2 1 1 1 3 1 1 2 24
2012 4 2 1 1 2 3 1 1 6 1 2 4 28
2013 5 1 1 2 2 0 0 2 1 1 2 2 19
Total 18 8 5 12 6 6 3 4 10 3 6 8 89
SOURCE : DITHB, KOSOVO POLICE
Other: Slovakia, Czech Republic, Poland and Croatia with one case of cooperation and as well as England and
Ukraine with 2 cases.
Smuggling of Migrants
Border Police deals with the investigation and prevention of smuggling of migrants. Unemployment in
Kosovo has affected the Kosovo‟s youth to find different ways to go to European countries and further in
order to find work to have a better economic life for themselves and their family. Even people from other
countries such as Turkey, Pakistan, Palestine, etc .tend to use Kosovo as a transit country to cross to European
countries namely in EU countries. In 2013 there was an increase of 45% (29) of cases of smuggling of
migrants initiated, compared with 2012, and an increase of 42% (20) by comparing 2012 with 2011 (14) .This
increase has come due to the efficiency of the police in cooperation with the police of other states.
TABLE18:SMUGGLING OF MIGRANTS R.KOSOVO2011 – 2013
Years 2011 2012 2013
Cases of smuggling with migrants - Border Police 14 20 29
SOURCE: BORDER POLICE DEPARTMENT, UNIT FOR ANALYSIS AND RISK ASSESMENT
In the table below are presented according to nationality and gender the suspects and the victims. Among the
suspects and victims dominate the Albanian males from Kosovo. In 2011 there were 34 men from Kosovo,
one from Turkey, in 2012 were 56 men from Kosovo, 3 from Turkey, in 2013 were 45 men from Kosovo,
Albania 3, 6 from Turkey and one from Serbia. Men victims in 2011 were 10 from Kosovo and 8 from
Turkey. In 2011 there were no female suspected while victims are two females from Kosovo, in 2012 is one
female suspected from Kosovo, while 4 are victims, in 2013 one suspected female is from Kosovo, one
female suspected from Albania and one female suspected from Serbia, while the victims were 9 women from
Kosovo and 2 from Albania.

80
MP
K
OS
OV
A
20
13
TABLE19;SMUGGLING OF MIGRANTS, MEN, 2001 – 2013
State
Men suspected
Male Victims
Year 2011 2012 2013 Total 2011 2012 2013 Total
Kosovo 34 56 45 135 10 7 38 55
Albania 0 0 3 3 0 0 0 0
Serbia 0 0 1 1 0 0 0 0
Palestine 0 0 0 0 5 0 0 5
Pakistan 0 0 0 0 0 0 4 4
Syria 0 0 0 0 0 3 0 3
Turkey 1 3 6 10 8 13 0 21
Total 35 59 55 149 23 23 42 88
SOURCE: DITHB, KOSOVO POLICE
TABLE20: SMUGGLING OF MIGRANT WOMEN 2011 - 2013
Women suspected Female Victims
State / Year 2011 2012 2013 Total 2011 2012 2013 Total
Kosovo 0 1 1 2 2 4 9 15
Albania 0 0 1 1 0 0 2 2
Turkey 0 0 0 0 0 0 0 0
Pakistan 0 0 0 0 0 0 0 0
Palestin 0 0 0 0 0 0 0 0
Serbia 0 0 1 1 0 0 0 0
Syria 0 0 0 0 0 0 0 0
Total 0 1 3 4 2 4 11 17
SOURCE : DITHB, KOSOVO POLICE
Irregular migration routes (Smuggling)
The Republic of Kosovo is used as a transit area from immigrants who come from countries of Africa and
Asia, and who move in an irregular manner, whereas final destinations have the Western Europe Countries.
Smuggling of migrants is in higher proportions compared with the previous year. This comes as a result of the
global economic crisis and wars in some African and Asian countries, where the chances grow for the growth
of this phenomenon.
Immigrants from countries like Syria, Pakistan, Afghanistan, Palestine, Nigeria, Algeria, Morocco, Mali,
Tunisia, move through Turkey - Greece - Macedonia to Kosovo.

81
MP
KO
SO
VA
20
13
So far results that the nationals of the aforementioned states move assisted by smugglers, where the in
territory of the Republic of Kosovo enter mainly through illegal routes along the Green Line of the border.
But there are some cases when these citizens were found hidden in trucks at border crossing points.
Further direction of their movement has been from Kosovo - Montenegro - Croatia and then EU countries,
and the other direction through Kosovo - Serbia - Hungary and later EU countries.
The number of foreigners who have worked in an irregular way in
Kosovo
As one of the push motives for illegal residence of foreigners in Kosovo is the motive for employment
purposes. In most cases, foreigners enter legally to Kosovo, and later are employed in various businesses
ignoring the legal provisions, which provide that an alien must possess work permits for foreigners and
temporary residence permit. Unlawful employment of foreigners produces informal economy. According to
the data of this phenomenon, the employments are made in the hotel business, in construction, trade,
manufacturing, etc. Referring to statistics from the Department for Migration and Foreigners, the largest
numbers of employees belong to hotel operations as waiters, dancers, singers, cooks, etc. Based on the Law
for Foreigners, when the foreign national is working in an illegal and unauthorized residence, the competent
authority may issue a removal order, with which the foreigner is obliged to leave the territory of the Republic
of Kosovo. During 2013, in Kosovo are caught 212 irregular immigrants working illegally. Of this number
87.5% are female and 12.5% males, age 18-34 years with 78.3% is the most expressed age group.
GRAPH52: THE NUMBER OF FOREIGNERS WHO HAVE IRREGULARLY WORKED AND FOR WHICH WAS
IMPOSED THE REMOVAL ORDER, BY GENDER AND AGE, 2011 - 2013
SOURCE: DIRECTORATE FOR MIGRATION AND FOREIGNERS, BORDER POLICE
76 94
26
313
180 186
0
50
100
150
200
250
300
350
2011 2012 2013
Mashkullore Femerore
251
137
1
190
84
0
166
46
0 0
50
100
150
200
250
300
18-34 35-64 65-
2011 2012 2013

82
MP
K
OS
OV
A
20
13
These data show that the majority of foreigners who work illegally are feminine but young also. If these data
from 2013 are compared with 2012 where 274 illegal immigrants were caught working illegally while in
2011, 389 have returned, so the trend of illegal employees is decreasing from year to year.
GRAPH53: THE NUMBER OF FOREIGNERS WHO WORKED IRREGULARLY AND FOR WHO WAS IMPOSED
THE REMOVAL ORDER BY CITIZENSHIP AND PERCENTAGE, 2011 - 2013
SOURCE: DIRECTORATE FOR MIGRATION AND FOREIGNERS, BORDER POLICE
C2.4 Asylum and Determination of the international protection status
Law no. 04 / L-217 on Asylum entered into force in September 2013. This law is in full compliance with
international standards, namely the Geneva Convention of 1951 (including the 1967 Protocol and relevant
EU- Directives. This law foresees a) the recognition of asylum; b) recognition of subsidiary protection and c)
temporary protection. Also, the law in question clearly defines the principle of non-return (non refoulement),
the right for access to territory and asylum procedures and the rights and obligations as for asylum seekers as
well as for those under protection.
In procedural terms, the Law provides a three instances system of decision-making regarding the protection
status. In this context, the body responsible for examining applications for asylum and for decision-making in
the first instance is the Asylum Division within the Department of Citizenship, Asylum and Migration
(DCAM) in the MIA. National Commission for Refugees is the second instance in the asylum procedure;
while as the final legal remedy is foreseen the judicial review at the competent Court.
Ministry of Internal Affairs, including DCAM and the Kosovo Police has close cooperation with local and
international organizations in the field of asylum. In the framework of this cooperation was also signed an
technical agreement between MIA and UNHCR "On Cooperation to Facilitate Access of Persons in need of
international protection in the territory of Kosovo and the Asylum Procedures"
243
46
7 7 11 27
11
37
134
17 13 2
15 15 31
47
183
7 3 1 1 4 4 9
0
50
100
150
200
250
300
Shq
ipër
i
Bu
lgar
i
Mo
ldav
i
Kin
ë
Maq
ed
on
i
Turq
i
Serb
i
Te t
jera
2011 2012 2013
Shqipëri 62%
Bulgari 12%
Moldavi 2% Kinë
2%
Maqedoni 3%
Turqi 7%
Serbi 3%
Te tjera 9%

83
MP
KO
SO
VA
20
13
Technical Agreement in question strengthens the cooperation between Kosovo institutions and UNHCR,
including Non-Governmental Organizations (NGO) partners of UNHCR, in order to guarantee the rights of
asylum seekers, including the principle of non-expulsion, access to territory of asylum seekers and adequate
consideration of asylum claims.
Within DCAM functions the Asylum Seekers Centre which was inaugurated in March of 2012 in Magura,
Lipljan. This center is responsible for receiving and accommodating asylum seekers. The center was built
with EU standards, divided into two items a) Administration building and b) asylum accommodation facility
with a capacity of 50 persons. Within the Centre are provided: adequate accommodation for individuals or
families, food, clothing, recreation, etc. Also, there is a medical ambulance with four rooms for rehabilitation
of patients.
The status of asylum decisions (out of 62) at the end of the period January - December 2013: awaiting
decision was one case, the termination of the procedure 38, voluntary suspension of the procedure 14, the first
negative decision 6, Positive decisions for subsidiary protection 3, By gender: Male 85% (53), women 15%
(9). Regarding the participation percentage of the age group, leads age group "18-34" with 71%(44 asylum
seekers) from the total number of asylum seekers for the treated period. The dominance of this age group, as
an active age group, is followed by the age group "0-13" with 11.3% (7 asylum seekers), which in most cases
represent their children.
GRAPH54: ASYLUM SEEKERS STATES, 2013
SOURCE: DCAM-MIA
During the period under consideration lead the asylum seekers from Syria (24 or 38.7% of the total number of
asylum-seekers), followed by the asylum seekers from Pakistan (12 or 19.35% of the total number of asylum-
seekers), and so on. Because of the fighting in Syria, the number of asylum seekers from that country has
multiplied compared with 2012, and that from 2 to 24 asylum seekers.
24
12
8 7 5 6
0
5
10
15
20
25
30
Syria Pakistan Nigeria Algeria Senegal Tjera

84
MP
K
OS
OV
A
20
13
GRAPH55: ASYLUM SEEKERS IN THE R OF KOSOVO BY GENDER, 2011 - 2013
SOURCE: DCAM- MIA
GRAPH56: ASYLUM SEEKERS IN THE REPUBLIC OF KOSOVO BY AGE, 2011 - 2013
SOURCE: DSHAM - MPB
GRAPH57: ASYLUM SEEKERS IN THE REPUBLIC OF KOSOVO BY STATES, 2011 – 2013
SOURCEI: DSHAM - MPB
166
40 53 23
6 9
v 2011 v 2012 v 2013
Meshkuj Femra
0-13 14-17 18-34 35-64 >=65 e panjohur
v 2011 23 9 134 17 1 5
v 2012 5 2 31 8 0 0
v 2013 7 4 44 6 1 0
020406080
100120140160
Afganistan
Palestinë Siri Algjeri Tunizi Pakistan Iran Marok Nigeri Somali Tjera
2011 66 40 13 11 17 4 1 8 1 9 19
2012 11 3 2 15 3 0 10 1 0 0 1
2013 0 0 24 7 1 13 0 2 8 0 7
0
10
20
30
40
50
60
70

85
MP
KO
SO
VA
20
13
In general, the number of new asylum seekers entering Kosovo has continued to increase from 2009 to 2010,
while in 2011 there has been a decline while in 2012 there was a drastic decline. The sudden rise in the
number of asylum seekers in 2010 may be related to the economic crisis in Greece, while the decline of the
number in 2012 could be attributed mainly to the increase of tensions and border closures of crossings points
in the northern Kosovo, which are often used as one of the main exit ways towards EU countries.
Regarding 2013, compared with 2012, the number of asylum seekers increased by 34.7%, mainly due to
asylum seekers from Syria.
Referring to the graph 59, the analysis of the 2009-2013 period shows that the trend of asylum seekers in
Kosovo is falling.
GRAPH58: NUMBER OF ASYLUM SEEKERS IN THE R. OF KOSOVO, 2009 - 2013
SOURCE: DSHAM – MPB
In 2013, we have the largest increase of the asylum seekers from Syria, due to the ongoing civil war in that
state. Another increase is also noted at the asylum seekers from Pakistan, due to insecurity in this state,
(Figure 58). By other states have a decreased number of asylum seekers in the territory of the Republic of
Kosovo, mainly due to the better controlling of road lines that lead towards EU countries, which are the target
of all the asylum seekers who use the territory of Kosovo as a transit state.
In total, the increase is 34.7%, and based on the overall data, in the fourth quarter of 2013 there were no
applications for asylum, which affected the trend in this context to have a decline. (Chart 59)
31
267
189
46 62
0
50
100
150
200
250
300
2009 2010 2011 2012 2013
Azilkerkues Trendi

86
MP
K
OS
OV
A
20
13
C3. Emigration
C3.1 Applications for visas
Kosovo continues to be the only country in the Western Balkans still has a visa regime in the Schengen area.
According to a study for the refusal of visas degree in Kosovo by UNDP and USAID during 2010-2012,
217,862 Kosovars have applied for visas, or 82,450 applications in 2010, 67,901 in 2011 and 67,556 in
2012[1]
.During 2013 the number of applications for Schengen visa applications is increased in 88,482
applications. On the other hand, the number of unsuccessful applications for Schengen visas still remains
relatively high, 23.2%.
GRAPH59 :STATISTICS FOR SCHENGEN VISA APPLICATIONS AND REFUSALS OF SCHENGEN VISA FOR
CITIZENS OF KOSOVO BY COUNTRY, 2013
SOURCE: MFA
[1] Study on tha scale of Visa refusals in Kosovo, UNDP, USAID, December, 2013, page-10
2823
26070
4556
1313
2819
13413
4415
23917
1496
841
247
2779
3793
30.8%
16.2%
6.2%
12.9%
26.7%
20.7%
25.7%
24.7%
14.5%
86.7%
70.4%
11.5%
58.7%
0 5000 10000 15000 20000 25000 30000
Belgjikë
Gjermani
Greqi
Finlandë
Hungari
Itali
Slloveni
Zvicër
Norvegji
Rep. Çeke
Sllovaki
Austri (në Shkup)
Suedi (në Shkup)
Refuzimet në %
Këkesat per vizë

87
MP
KO
SO
VA
20
13
TABLE21: VISA APPLICATIONS, VISAS ISSUED FOR FOREIGN CITIZENS BY STATES, 2013
State / Year Visa
Requirements Refusals Visas issued
Total 88482 23.2% (20878) 67969
Belgium 2823 30, 8% (869) 1915
Germany 26070 16.2% (4222) 21848
Greece 4556 6.2% (281) 4275
Finland 1313 12.9% (170) 1143
Hungary 2819 26.7% (753) 2068
Italy 13413 20.7% (2780) 10633
Slovenia 4415 25.7% (1134) 3281
Switzerland 23917 24.7% (5924) 17993
Norway 1496 14.5% (217) 1279
Czech Republic 841 86.7% (729) 112
Slovakia 247 70.4% (174) 68
Austria (in Skopje) 2779 11.5% (320) 2459
Sweden (in Skopje) 3793 58.7% (2227) 895
SOURCE: MFA
As seen from the table above, percentage of rejected requests for a Schengen visa is 23.2%.

88
MP
K
OS
OV
A
20
13
C3.1 The total number of Emigrants
Citizens of the Republic of Kosovo with valid residence permits in
Schengen EU member states
TABLE22: KOSOVO CITIZENS WITH VALID RESIDENCE PERMIT IN MEMBER STATES OF THE EU STATES AND
SCHENGEN AREA, 2011 - 2013
State / Year Total 2011 2012 2013
Total 54,644 16,346 18,218 20,080
Germany 17,495 3,303 6,346 7,846
Italy 9,548 4,126 2,961 2,461
Slovenia 2,336 1,075 15 1,246
Austria 5,899 1,988 2,198 1,713
France 4,993 1,647 1,839 1,507
Belgium 2,153 1,751 : 402
Sweden 3,159 1,048 1,095 1,016
Switzerland 4,920 : 2,301 2,619
England 725 301 214 210
Hungary 653 284 369 :
Other 2,763 823 880 1,060
SOURCE: EUROSTAT12
Of the total number, in 2013 more represented countries are: Germany (39%), Switzerland (13%), and Italy
(12%).
GRAPH60: KOSOVO CITIZENS TRENDS WITH VALID RESIDENCE PERMIT IN EU MEMBER STATES AND
SCHENGEN AREA 2011 - 2013
SOURCE :EUROSTAT13
12 http://appsso.eurostat.ec.europa.eu/nui/submitViewTableAction.do,
16346 18218
20080
0
5000
10000
15000
20000
25000
v 2011 v 2012 v 2013

89
MP
KO
SO
VA
20
13
Number of Kosovar citizens with valid residence permit in the Member States of EU and the Schengen are in
2013 (20.080) is larger for 10.2% compared with 2012 (18,218) while in 2012 is higher by 11.4% compared
with 2011 (16,346).
Treated over the years here, we have a linear increase from year to year, and 10.8% on average each year.
Of the total, in 2013 lead countries: Germany (39%), Switzerland (13%), and Italy (12%).
C3.2 Categories of emigrants
In the emigration from Kosovo various factors affect by dominating those economic, social, and educational
as well as a significant number for family reunions (weddings).
Relevant institutions (civil registry offices) are required to maintain records about emigration but have not
been able to form these records yet. This is because the majority of emigration becomes in non- legal forms
and they or their family members do not register (identification) as people leaving Kosovo.
This expressed and uncontrolled migration by the Kosovo institutions will bring difficulties in identifying the
full number of emigration including other structural, age and gender aspects of emigration. According to
various Kosovo official and unofficial reports (mainly those from countries where emigrants have been
settled) the vast majority of emigration includes the adulthood (16-35 years) dominated by men.
This may hinder the real situation in the field (Kosovo) in the future regarding the population number, number
of the workforce, the unemployed, etc. This irregular emigration is also due to the disbalance in the gender
and age aspect of the resident population in Kosovo.
Education of children and ensuring of a better and safer future for them is another motive that is frequently
encountered in the decisions taken by the family to emigrate. According to the 2011 census, the reasons for
emigration in Kosovo go on the same line, the first dominant reason is the employment and the second reason
is the education of children. According to data from the Statistical Office of Kosovo (2013) the main reasons
for emigrating abroad are listed: for family reasons (46%), employment (35%) studies, (1%) and other reasons
(18%).
13 Right there

90
MP
K
OS
OV
A
20
13
C3.3 Labor migrants
TABLE23: KOSOVO MIGRANTS IN EU COUNTRIES AND SHENGEN SPACE BY REASON OF RESIDENCE, 2013
Country Total Family
Reunification
Acts that are
paid Education Other
Total 20,080 13,100 1,228 679 5,073
Germany 7,846 4,853 125 128 2,740
Switzerland 2,619 2,146 85 28 360
Italy 2,461 1,837 397 31 196
Austria 1,713 766 17 303 627
France 1,507 633 94 23 757
Slovenia 1,246 960 271 13 2
Sweden 1,016 821 81 11 103
Belgium 402 307 4 7 84
Finland 336 243 65 12 16
England 210 98 5 31 76
Other 724 436 84 92 112
SOURCE: EUROSTAT
In the total number, the reasons for seeking a residence permit are listed: Family reunification (65.2%), paid
activities (6.1%), education (3.4%), and other (25.3%)
In grouping "Family Reunification", as a most represented group , it is marked an increase for the period
2011-2013, and that: 2011 (9.877), 2012 (11.138), and 2013 (13,100).By comparing the years 2012 with 2011
for this grouping we have an increased of 12.8%, while if we compare 2013 with 2012 we have an increase
of 17.7%. In other groups, trends in annual periods are not significantly different.
Release from citizenship
The largest number of claims for loss of citizenship is filed by Kosovo citizens who acquire citizenship in
states that do not recognize the dual citizenship. This results in a reduction of the number of population with
Kosovo citizenship. Given the special ties with Kosovo this category is important to regulate their status
under the law for foreigners. Therefore it is important to predict the possibility of equipping them with
residence permit.
According to the Law for Citizenship no. 04 / L-215 which entered into force on 31 June 2013, the citizenship
of the Republic of Kosovo is lost by release from citizenship, by deprivation of citizenship and on the basis of
international agreements.

91
MP
KO
SO
VA
20
13
Submission of application for release of citizenship is made by the applicant in person at the municipal civil
registry office where the applicant has had the last residence, or at diplomatic / consular missions of the
Republic of Kosovo where the applicant resides. 14
Attached to the request should be the supporting documents as required by the instructions. Municipalities
and diplomatic / consular missions officially follow the case to MIA, Division for Citizenship.
Of the total 5182 requests that are submitted for Release of citizenship in 2013, 4950 of them are positive
decisions,33 are negative decisions, while 119 requests are pending the decision on release from citizenship
of the Republic of Kosovo. Based on these data we see that the number of positive decisions is significantly
higher than negative decisions. Based on gender, the total number of positive decisions for release from
citizenship of the Republic of Kosovo,53% (2,619) were male and 47% (2331) of females. In terms of age
groups, leads the age group 18-34 (2298 or 47%), 35-64 (1403 or 28%), 14-17 (674 or 14%) and the
age group 0-13 (557 or 11) %.
According to data for 2013, persons released from citizenship of the Republic of Kosovo are in
Germany with 83.6% (4139), Austria with 8.3% (411) and in other countries with 8.1% (400). While
for negative decisions for release from citizenship leads Germany with 25 persons and Montenegro
with 4 persons.
GRAPH61: RELEASE FROM CITIZENSHIP OF THE REPUBLIC OF KOSOVO (POSITIVE AND NEGATIVE
DECISIONS), 2011- 2013
SOURCE: DCAM- MIA
According to the annual data for the release of the citizenship of the Republic of Kosovo during the last three
years, there has been an increase of 13% for 2013 (4,950) compared with 2012 (4368), and an increase of
14 Consulates: Germany (Berlin, Frankfurt, Stuttgart), Austria, Sweden, Netherlands, Bulgaria, Turkey (Ankara, Istanbul),
Switzerland, Slovenia, USA, Croatia
4950
33
4368
25
2510
0 0
1000
2000
3000
4000
5000
6000
Vendime pozitive Vendime negative
2013 2012 2011

92
MP
K
OS
OV
A
20
13
74% compared with 2012 compared with 2011 (2510).The reason for the relinquishment of the Kosovo
citizenship is to gain the citizenship of another state, especially of the European countries since a
large number of them do not allow dual citizenship.
Annual data for exemption from citizenship of the Republic of Kosovo for the past three years, show a greater
number of males 55% (6486) compared with that of female 45% (5341).General data for the masculine (chart
63) show that there has been an increase of 8% 2013 (2619) compared with 2012 (2422), while an increase of
67% compared to the year 2012 with 2011 (1445).
GRAPH62: WAIVER OF CITIZENSHIP OF THE REPUBLIC OF KOSOVO BY GENDER, 2011-2013
SOURCE: DCAM-MIA
According to the last three years almost in a linear form female gender is growing along with masculine
gender. Data from (chart 62) show that there was an increase of 19% in 2013 (2,331) compared with 2012
(1946), and an increase of (82%) comparing 2012 with 2011 (1064).
GRAPH63: POSITIVE DECISION ON RELEASE FROM CITIZENSHIP BY AGE GROUPS, 2011 - 2013
SOURCE: DCAM
2619 2422
1445
2331 1946
1064
0
500
1000
1500
2000
2500
3000
2013 2012 2011
M F
0-5 6-13 14-17 18-34 35-64 66+
2011 27 112 185 1139 1035 12
2012 115 400 481 1992 1364 16
2013 143 414 674 2298 1403 18

93
MP
KO
SO
VA
20
13
Total annual data for the past three years, show that in all the years the age group 18-34 years (5429 or 46%)
and 35-64 (3802 or 32%)is growing, the age group 14-17 years (1,340 or 11%) and other age groups are
below 3%.
Asylum seekers from Kosovo in EU member states15
and Schengen Area
In 2013, from the total number of Kosovo asylum seekers in EU countries, the largest number of asylum
seekers was in Hungary (29, 4%), France (26.1%), Germany (20.9%), and so on. Men take part with 69%
while females with 31% (Table 24, Figure 65)
TABLE 24: KOSOVO ASYLUM SEEKERS IN EU CONTRUES-AND SHENGEN AREA, 2013
Country Total M F
Total 21090 14505 6560
Hungary 6210 5520 695
France 5500 3185 2315
Germany 4415 2600 1825
Sweden 1280 770 495
Belgium 1265 760 505
Austria 935 730 195
Switzerland 705 435 255
Norway 260 130 120
Luxembourg 150 95 50
Italy 95 80 30
Other 275 200 75
SOURCE: EUROSTAT
In Tables 24 and 25, are presented data for the last three years. From here it can be seen that the increase in
the number of asylum seekers from Kosovo in EU countries in 2013, compared to 2012 (104%), a too high
figure. This phenomenon has affected facilitating of passage through the territory of Serbia, ie getting in
Hungary, state who has served as a transit Country toward most developed countries of the EU. Comparing
2012 with 2011 shows a slight decline for about 3%.
15 All the tables in this chapter are based on data totals form "Eurostat". Each subgroup that is presented in those tables derives from
"rounded" data given by "Eurostat". Therefore, any possible discrepancy refers to the source of those records.
Link to data source: http://appsso.eurostat.ec.europa.eu/nui/shoë.do?dataset=migr_asyappctzm&lang=en

94
MP
K
OS
OV
A
20
13
TABLE 25: KOSOVO ASYLUM SEEKERS IN EU AND SCHENGE STATES, 2011 - 2013
State Total 2011 2012 2013
Total 42120 10695 10335 21090
France 12455 3240 3715 5500
Germani 8840 1890 2535 4415
Hungary 6640 210 220 6210
Belgium 5335 2325 1745 1265
Sweden 3640 1315 1045 1280
Switzerland 1370 665 0 705
Austria 1600 350 315 935
Norway 550 155 135 260
Luxembourg 510 150 210 150
Italy 315 110 110 95
Other 865 285 305 275
SOURCE: EUROSTAT
By the graph 65 it can bee seen that the most influx of asylum seekers from Kosovo in EU countries has been
from the beginning of spring until the end of July. From this graph, despite the largest increase of asylum
seekers in certain months of 2013- for reasons elaborated above, the beginning and end of the addressed years
in this case are roughly with the same trends.
GRAPH64: COMPARING THE NUMBER OF ASYLUM SEEKERS IN THE EU STATES,2011 – 2013
SOURCE:EUROSTAT
1,1
65
1,1
50
1,2
15
1,8
85
2,7
85
3,7
20
2,3
85
1,4
60
1,5
05
1,3
65
1,2
25
1,2
30
0
500
1,000
1,500
2,000
2,500
3,000
3,500
4,000
Jan
ar
Shku
rt
Mar
s
Pri
ll
Maj
Qe
rsh
or
Ko
rrik
Gu
sht
Shta
tor
Teto
r
Nën
tor
Dh
jeto
r
2013 2012 2011

95
MP
KO
SO
VA
20
13
Regarding the gender structure of asylum seekers, the gender ratio is approximately the same each year. In
most cases, men head to the western countries, with the aim of eventual employment and sending of funds for
their families who usually remains at home. For 2013 the gender structure by country is presented in Figure
66.
GRAPH65: NUMBER OF ASYLUM SEEKERS IN EU COUNTRIES AND THE SCHENGEN AREA BY GENDER,
2013
SOURCE: EUROSTAT
For each year that is treated in this case, as a rule, indicators of representation are very similar age groups
(Chart 67).Even in the case of analysis for 2013, convincing leads the age group "18-34" (52.5% of the total
number), followed by the age group "0-14" (23.5% of the total number). Since the age group "18-34" is the
most productive age, it is supposed to take their children with, namely age group "0-14". For the same period,
other age groups are represented as follows: "14-17" (4.5% of the total number), "35 to 64" (19% of the total
number), and "65 +" (0.5 % of the total number).
GRAPH66: NUMBER OF ASYLUM SEEKERS IN THE EU STATES AND THE SCHENGEN AREA BY AGE
GROUP, 2011 - 2013
5520
3185 2600 770 760 730
435 130 95 80 180
695
2315 1825 495 505 195
255 120 50 30 75
Hu
nga
ri
Fran
cë
Gje
rman
i
Sue
di
Be
lgjik
ë
Au
stri
a
Zvic
ra
No
rve
gjia
Luks
em
bu
rg
Ital
i
Tjer
a
Mashkuj Femra
3470 670 4290 2185
80
3620 570
4065 2030
50
4945 940 11080
4075 85
nën 14 14-17 18-34 35-64 65+
2011 2012 2013
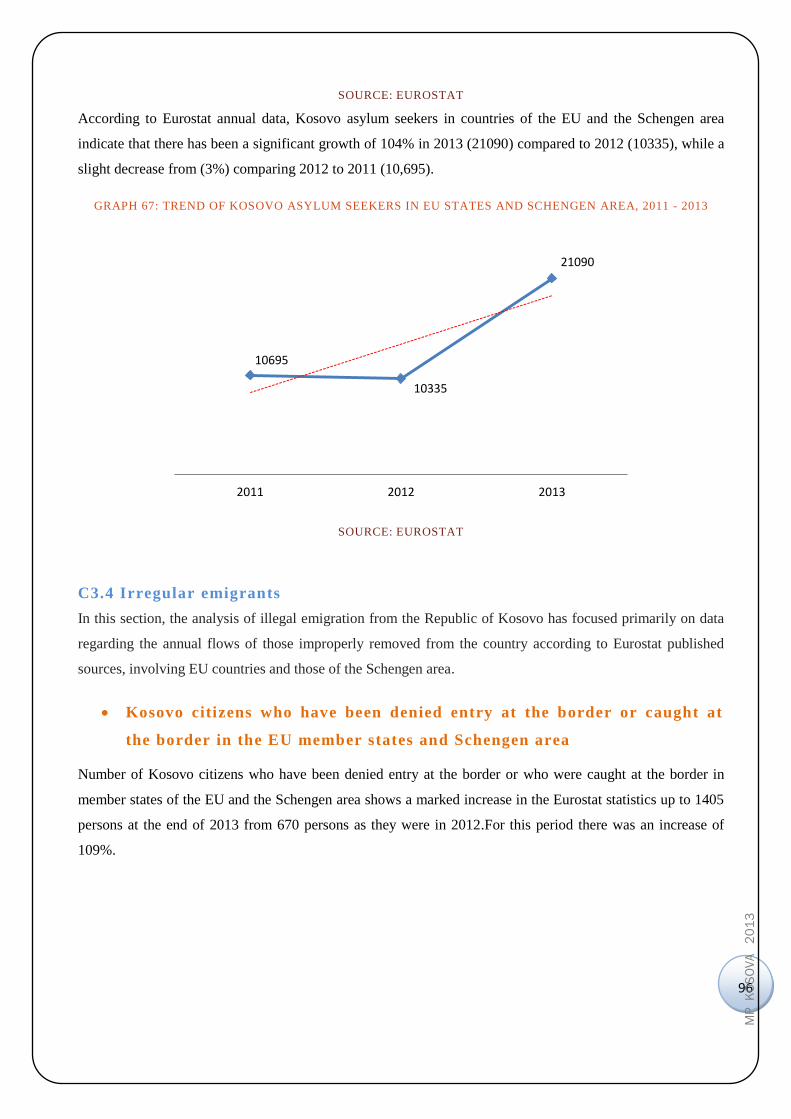
96
MP
K
OS
OV
A
20
13
SOURCE: EUROSTAT
According to Eurostat annual data, Kosovo asylum seekers in countries of the EU and the Schengen area
indicate that there has been a significant growth of 104% in 2013 (21090) compared to 2012 (10335), while a
slight decrease from (3%) comparing 2012 to 2011 (10,695).
GRAPH 67: TREND OF KOSOVO ASYLUM SEEKERS IN EU STATES AND SCHENGEN AREA, 2011 - 2013
SOURCE: EUROSTAT
C3.4 Irregular emigrants
In this section, the analysis of illegal emigration from the Republic of Kosovo has focused primarily on data
regarding the annual flows of those improperly removed from the country according to Eurostat published
sources, involving EU countries and those of the Schengen area.
Kosovo citizens who have been denied entry at the border or caught at
the border in the EU member states and Schengen area
Number of Kosovo citizens who have been denied entry at the border or who were caught at the border in
member states of the EU and the Schengen area shows a marked increase in the Eurostat statistics up to 1405
persons at the end of 2013 from 670 persons as they were in 2012.For this period there was an increase of
109%.
10695
10335
21090
2011 2012 2013

97
MP
KO
SO
VA
20
13
GRAPH68: KOSOVO CITIZENS WHO HAVE BEEN REFUSED ENTRY AT THE BORDER OR CAUGHT AT THE
BORDERS IN MEMBER STATES OF THE EU AND SCHENGEN AREA, 2011-2013
SOURCE: EUROSTAT
This is due to the Croatia entry into the EU and its reporting to Eurostat during 2013. But the refusal of entry
at the border of Kosovo citizens in this country can be as a result of not being informed for the change of
procedures and rules for entry. The data shows that Croatia has refused entry for 100 people because of
invalid documents, 595 persons because of invalid visa or residential permit and 25 people for other reasons,
or 51% of the total number.
Of the total number, Kosovo nationals were mostly refused entry from Croatia 51%, Slovenia 11%, Hungary
10%, France 8%, and Germany 6% and below 5% other states.
200 persons were rejected because of invalid documents, or (14%) higher than 175 persons as they were last
year (2012),but almost the same with 2011 (-0.75%). Rejection due to invalid visa or residence has increased
from 255 as it was in 2012 in 950. Rejection due to falsification of travel documents 20 people, almost the
same as previous years, but with a visa or falsified residence permit has marked an increase of (1.25 %)in
2013 (25) compared with 2012 (20), but a significant drop from (-80%) compared to 2011 (45).
280
85 50 50
0
75 35 40 45 30
235
80 85 65
0 40 30 35 45 55
720
110 140 90
60 150
50 25
60
0
100
200
300
400
500
600
700
800
v 2011 v 2012 v 2013

98
MP
K
OS
OV
A
20
13
Kosovo nationals who are caught staying illegally within the territory of
the EU Member States and Schengen area
From annual data for Kosovo citizens who are caught residing illegally within the territory of the EU
Member States and the Schengen area during the last three years, male gender dominates(17185)compared
with female gender (4525).General data for masculine gender (Chart 70) show that there has been an increase
of 59%in year 2013 (7915) compared with 2012 (4975), and an increase of 15% in 2012 compared to 2011
(4295).
TABLE26: FOREIGN CITIZENS WHO ARE CAUGHT ILLEGALLY RESIDING WITHIN THE TERRITORY OF EU
MEMBER STATES-S AND SCHENGEN STATES BY STATES WITH HIGHER RATES, MALES, AND 2011 – 2013
State V 2011 V 2012 V 2013
Germany 29.92% 35.78% 28.55%
Switzerland 25.38% 21.71% 20.40%
France 13.50% 11.16% 9.67%
Austria 10.71% 8.34% 12.38%
Sweden 10.48% 6.23% 5.37%
Other 10.01% 16.78% 23.63%
SOURCE:EUROSTAT
In the past three years, from the total number of males residing illegally within the territory EU
member states and Schengen area, leads Germany 31%, Switzerland 22%, France 11%, Austria
11%, Sweden 7%, Hungary 11% 7% and other countries.
GRAPH69: KOSOVO CITIZENS WHO ARE CAUGHT ILLEGALLY RESIDING WITHIN THE TERRITORY OF EU
MEMBER STATES-AND SCHENGEN AREA BY GENDER, 2011 - 2013
SOURCE: EUROSTAT
4295 4975
7915
1205 1570 1750
0
2000
4000
6000
8000
10000
v 2011 v 2012 v 2013
M F

99
MP
KO
SO
VA
20
13
According to this source, the female gender is less involved with illegal residence within the territory of the
EU Member States and Schengen area, but it is growing. The data from (chart 70) show that there was an
increase of 11% in 2013 (1750) compared with 2012 (1570), while an increase of (30%) compared with 2012
with 2011 (1205).
TABLE27: KOSOVO CITIZENS WHO ARE CAUGHT ILLEGALLY RESIDING WITHIN THE TERRITORY OF EU
MEMBER STATES AND SCHENGEN AREA BY STATES WITH HIGHER PERCENTAGE OF FEMALES, 2011 -
2013
State V 2011 V 2012 V 2013
Germany 35.68% 55.10% 46.29%
Sweden 29.88% 13.69% 17.14%
Switzerland 16.18% 12.74% 10.00%
Austria 6.22% 5.10% 11.14%
Belgium 4.98% 4.46% 3.14%
Other 7.05% 8.92% 12.29%
SOURCE: EUROSTAT
Out of the total number for the past three years, the female gender illegally staying in the territory of EU
member states and Schengen area by country, is in Germany 46%, Sweden 19%, Switzerland 13%, 8%
Austria, Belgium 4%, France 4% and 6% other countries.
Annual data on the number of illegal residents within the territory of the EU Member States and the
Schengen area by age show that illegal residence consists mainly of young people and they are able to work.
According to the data for 2013, the major part of the persons illegally staying 53% was recorded in the age
group over 35 years followed by the age group 18-34 years (27%), age group 14 – 17 year (6%) and under 14
year (12%) grf. (71).
The data for the age group over 35 years show that there has been an increase of 25% in 2013 (2,535)
compared with 2012 (2025), while (70%) compared to 2011 (1485). For the age group 18-34 years, there was
an increase from 60% in 2013 (6,250) compared with 2012 (3900), while (84%) compared to 2011
(3385).The age group 14-17 years, is less involved with illegal residence but also for this age there was an
increase by 37% in 2013 (275) compared to year 2012 (200), while (44%) compared with the year 2011
(190), while the age group under 14, there was an increase of 49% in 2013 (575)compared to year 2012 (385),
and (43%) compared to 2011 (400).

100
MP
K
OS
OV
A
20
13
GRAPH70: KOSOVO CITIZENS WHO ARE CAUGHT ILLEGALLY RESIDING WITHIN THE TERRITORY OF EU
MEMBER STATES AND SCHENGEN AREA BY AGE GROUPS AND STATES IN%, 2011 – 2013
SOURCE: EUROSTAT
Out of the total number for the last three years (21,670), the highest position with the unlawful staying
constitutes the age group 18-34 years (63%), followed by the age group over 35 years (28%), under 14 (6%)
and the age group 14-17 years (3%). The vast majority of illegal residents of all ages is registered in Germany
and Switzerland while for the age under 14 years in Sweden (graph .71)
GRAPH71: KOSOVO CITIZENS WHO ARE CAUGHT ILLEGALLY RESIDING WITHIN THE TERRITORY OF
THE EU MEMBER STATES AND SCHENGEN AREA BY STATES AND YEARS, 2011 - 2013
SOURCE: EUROSTAT
SuediaGjermani
aAustria Hungaria Belgjika Zvicra Franca Tjera
me pak se 14 vjeç 53% 19% 14% 4% 2% 0 0 8%
14 - 17 vjeç 21% 47% 12% 5% 3% 0 5% 7%
18 - 34 vjeç 5% 32% 11% 7% 4% 22% 11% 8%
më shumë se 35 vjeç 7% 41% 7% 3% 4% 21% 10% 7%
0%
10%
20%
30%
40%
50%
60%
1715
1285
530 630
810
50
250
15 80 25
95
2645
1280
495 610 525
190
250
180 70 95
185
3070
1790
1175
845 725
965
290 180 275
100 245
0
500
1000
1500
2000
2500
3000
3500
Gjermania Zvicra Austria Franca Suedia Hungaria Belgjika Italia Kroacia Britania eMadhe
Gerqia Tjera
v 2011 v 2012 v 2013

101
MP
KO
SO
VA
20
13
Of the total number of illegal residents in 2013, the territory of the EU Member States and Schengen area
leads Germany 32%,Switzerland, 18%, 12% Austria, Hungary, 12%, 9% France, Sweden 7%, and less than
3% other countries. But for the last three years leads Germany 34%, Switzerland 20%, Austria 10%, France
10%, 9% Sweden, Hungary 6%, and below 4% other states.
Details of Kosovo nationals who are caught staying illegally within the territory of the EU Member States o
and the Schengen area for the past three years show that there was an increased by 48% in 2013 (9,660)
compared with 2012 (6525) and an increase of 18% comparing 2012 with 2011 (5485).
Kosovo nationals il legally residing in EU member states and Schengen
area after the issuance of the removal order 2011 -2013
According to the data for 2013, the highest number of Kosovo nationals illegally residing in EU member
states and Schengen area after the issuance of the removal order is 23% in France, followed by Belgium with
22%, Hungary 19%, Austria 8%, 7% Sweden, Switzerland and other countries 5% below 5%. GRF (67).
GRAPH72:KOSOVO NATIONALS ILLEGALLY RESIDING IN EU MEMBER STATES AND SCHENGEN AFTER
THE ISSUANCE OF THE REMOVAL ORDER BY STATES AND YEARS, 2011 - 2013
SOURCE: EUROSTAT
The data of the Kosovo nationals illegally residing in EU member states and Schengen area after the issuance
of the removal order for the last three years show that there has been a decrease of (- 4%) in 2013 (9,410)
compared with 2012 (9870),and an increase (12%) compared to 2011 (8385).
0%
10%
20%
30%
40%
50%
60%
70%
80%
90%
100%
2130 2045 940
1065 945 575 250 100 335
2345 2070
1610
865
1180
330
405
200
260
180
425
2070 2205 1785 665
0
720 450
315 200
100
900
v 2011 v 2012 v 2013

102
MP
K
OS
OV
A
20
13
Kosovo nationals removed from EU member states and Schengen area by
an removal order
Data for Kosovo citizens removed by the EU member states and Schengen area according to the removal
order show that for the last three years the number of removed persons was 14315.These data for Kosovo
citizens removed from EU member states and Schengen area according to the removal order show that there
was an increase of 11% in 2013 (5275) compared with the year 2012 (4720), and an increase of 9% in 2012
compared to 2011 (4320).
GRAPH73: KOSOVO CITIZENS REMOVED FROM EU MEMBER STATES AND SCHENGEN SPACE UNDER
THE REMOVAL ORDER IN PERCENTAGE (2011-2013)
SOURCE: EUROSTAT
GRAPH74: KOSOVO CITIZENS REMOVED FROM EU MEMBER STATES AND SCHENGEN AREA BASED ON
THE REMOVAL ORDER BY STATES AND YEARS (2011-2013)
SOURCE: EUROSTAT
Hungaria 25%
Suedia 17%
Gjermania 13%
Austria 12%
Belgjika 10%
Franca 9%
Norvegjia 3%
Kroacia 2%
Britania e Madhe 2%
Finlanda 2%
Tjera 5%
780 775 710
500
640
475
155
85 60 140
1300
795 855
365
445 465
130 85 80
200
1440
920
275
790
420 390
205 275 100 80
380
0
200
400
600
800
1000
1200
1400
1600
Hungaria Suedia Gjermania Austria Belgjika Franca Norvegjia Kroacia Britania eMadhe
Finlanda Tjera
v 2011 v 2012 v 2013

103
MP
KO
SO
VA
20
13
According to the data for the last three years, Kosovo citizens removed by the EU member states and
Schengen area based on the removal order by percentage are removed by states as follows: Hungary 25%,
Sweden 17%, Germany 13%, Austria 12%, Belgium 10%, France 9% and other states below 3%.
C4. Diaspora
Kosovo Diaspora enjoys legal protection from the Republic of Kosovo. In this respect Law No.. 04/-095
Diaspora was issued, which affects the protection and cultivation of identity, language, culture and education
among members of the Diaspora and their links with the institutions of the Republic of Kosovo, Diaspora
organization in various countries where Kosovo Diaspora lives, encouraging and developing cross-cultural
relations between the Republic of Kosovo and the countries in which the Diaspora is present.
After first establishing the Cultural Center of Kosovo Diaspora and Diaspora in Turkey in January 2013, the
Government of the Republic of Kosovo upon the proposal of the Ministry of Diaspora, in October of 2013
established five Cultural Centers for Diaspora in: Switzerland, Sweden, Germany, France and the USA. These
centers provide various services and information for expatriates Kosovo‟s, help preserve their identity and
provide information on investment opportunities in Kosovo market.
The profile of migrants
There is no reliable census data regarding the Kosovo Diaspora, so it still remains difficult to obtain accurate
information. Their exact number is still unknown. For this purpose, the Ministry of Diaspora has begun the
process of drafting the Registry of Diaspora and other forms of their organization. It has prepared forms to
Register Diaspora and the Guide for this process. Data will be collected from different sources. Distribution
of registration forms and guidelines for completing their diplomatic and consular missions of the Republic of
Kosovo in some countries like Germany, Austria, Switzerland, IALI, France, England, USA, Turkey, Croatia,
Norway, Sweden, Belgium, Slovenia, the Netherlands, Denmark, Finland and Luxembourg. Such forms are
also distributed at border crossings in Kosovo, at the airport and municipalities in order to include a greater
number of them. Also, an online platform is launched where members have the opportunity to register
through the electronic platform.
All this was done by the end of 2013. By the end of 2014 the first published data on the outcome of the
drafting process Registry of Diaspora Associations and other forms of their organization, it is expected to be
published, while the update of this register will be made continuously.
After completing this process, the Republic of Kosovo for the first time will have a register which will
constitute the statistical data regarding the number of members of the Diaspora, the structure of their socio-
economic and demographic, their business activities and other important data in order to create more accurate
policy on Diaspora.

104
MP
K
OS
OV
A
20
13
However, until the completion of the registry, there are some data from other sources alleged. Most of the
Diaspora, about 60%, are citizens of the countries where they live, about 34% have temporary stay (2-10
years), of which 1.3% have student visa. The remaining 6% have no defined status16
.
In terms of preserving cultural and linguistic identity in the Diaspora, for the moment, a greater involvement
of the Diaspora in supplementary education in the Albanian language is Scandinavian countries (Sweden and
Finland).
One of the factors of this involvement is also high support provided by state institutions where the Diaspora
lives. 17
About 25,000 children benefit in many different forms of organization of the Albanian language
learning.
There are about 400 teachers working in schools with additional classes. Compared to last year the Ministry
of Diaspora had data on 5,000 students (about 20% more) involved in supplementary education.
This is because of the numerous activities of the Ministry of Diaspora to promote the inclusion of students
from abroad in additional learning programs, as a result of opening new schools and raising awareness of
involvement in these programs in order to maintain the identity of our migrant. Also, the Diaspora Ministry
compared to last year has given new funding for the identification of additional learning schools. Regional
cooperation, as is the case with the Republic of Albania, may be a useful alternative strategic approach, as it
brings a synergy and cost reduction activities possible.
The potential socio-economic development of Kosovo Diaspora
Role of the Diaspora in the development of Kosovo is not a straightforward process. However, high
expectations regarding the potential of the Diaspora to contribute to the development of Kosovo are reviewed
and analyzed. The project, Diaspora involvement in Economic Development, International Organization for
Migration (IOM) has collected the opinions of the Kosovo Diaspora about their investment and doing
business in Kosovo. To this end, IOM has implemented an online18
questionnaire about the practices of doing
business from abroad
Most of the respondents, 66.0% (entrepreneurs and non-entrepreneurs), plan to start business activities in the
business sector in Kosovo19
. 75.9%The respondents have experience in the sector for which they wish to
invest, 37.2% of them as entrepreneurs, 51.2% and 27.9% as a manager as an employee. Most of them, 74.4%
have more than three years of experience in this field. Those who have business activity, they have been
16 KCB Report of end of year 2008
17 Strategy on Diaspora 2013 – 2018, p.17
18 The questionnaire was published in Albinfo.ch, Telegraph (targeting the Diaspora), Giant and in DfD webpages from 3
June 2013 to 14 July 2013. Also, the questionnaire was also distributed by email to target groups. There are 161
respondents in total, 118 of whom identify themselves as part of Kosovar diaspora.
19 Ibid. p. 1.

105
MP
KO
SO
VA
20
13
doing business for 5 years20
. All these data lead us to believe that the Diaspora has the intention and ability to
strongly contribute to the economy of Kosovo, such as investments, as well as contribute through knowledge
(or "Know How")
While, based on other research from this project21
there are some features identified shipments of remittances.
As seen from the table below, the majority of migrants headed, have completed at least 14 years of schooling
or more, which indicates a satisfactory level of their education.22
The table also shows the comparison of the
level of education in Kosovo and Kosovo migrants abroad which shows that migrants have higher levels of
education, brain drain that has Kosovo and projects need for use their knowledge and their experience.
GRAPH75: EDUCATION OF HOUSEHOLD HEADS AND THOSE EMIGRANT LIVING IN KOSOVO
SOURCEI :MD
As illustrated in the table below, the majority of 54.22% of Kosovo migrants earn more than 2,000 euros a
month. From the statistical data concerning labor experience presented above, there is a high level of
integration in the countries of residence and high potential to have a positive impact on the economy of
Kosovo
20 Ibid. p. 2.
21 The research is based on a representative sample of Albanians, Serbs and other Kosovo ethnic groups. The selected sample includes
8,000 households. Samples of participants are based on etnicity (Albanians, Serbs, and other communities), and residence (urban area
/ rural area).
22 Study on Remittances in Kosovo - October 2013 Statistical Agency of Kosovo, Department of Social Polls, project
was conducted with financial and technical support of the Office of the United Nations Program for Development
(UNDP) in Kosovo. P. 20
8.50%
25.30%
66.20%
6.70%
17.50%
75.80%
0.00%
10.00%
20.00%
30.00%
40.00%
50.00%
60.00%
70.00%
80.00%
Arsimi fillor të përfunduar Arsim fillor Arsim të mesëm dhe më shumë(14+)
Kryefamiljar në Kosovë Kryefamiljar emigrant

106
MP
K
OS
OV
A
20
13
TABLE 28: HOUSEHOLD MONTHLY INCOME REMITTERS23
The average household income Percentage of households sending
Less than €500 1.67%
€(501-1,000) 18.09%
€(1,001-1500) 13.78%
€(1501-2000) 12.04%
€(2,000-4,000) 30.02%
€4,001 or more 24.20%
SOURCE:KSA-UNDP
According to the research, it was found that Kosovo migrant‟s families spent an average of 2,715 euros in
Kosovo during their visits in 2012, EEC total means 270 million euro spent24
. This is another indication of the
actual contribution to the Kosovo economy by members of the Diaspora as well as the potential positive
impact that can be realized if the appropriate conditions exist to empower Diaspora resources.
This research has made a comparison of the gender composition of migrants, compared with the gender
composition of the inhabitants of Kosovo. While gender structure of migrants is 56.7% male and 43.3%
female, while among the inhabitants of Kosovo were 50.3% male and 49.7% female.25
This may be a result of
waves of migration dominated by men who have left the country for economic reasons it was mainly for
employment.
Diaspora Ministry has initiated the process of business networking in Diaspora26
. Business networking
organization in the Diaspora aims to promote business investment from abroad,collect the largest possible
number of people from the business community in the Diaspora, where they will connect the recognition of
new contacts and promote their companies as well as other issues that are in favor of creating a more suitable
climate investment in homeland.
This networking will help to create a powerful lobby of Kosovo, and this will have multiple benefits for
Kosovo, as well as the Diaspora, in terms of investment and profitability of their business and creating
homeland facilities to invest their capital at home. The creation of networks also created the Presidency
(board) of the businesses in the Diaspora network, which will support and promote Diaspora businesses that
are interested in investing and doing business information point in Kosovo. Members of the proposed
business networks Diaspora in certain places, selected participants (entrepreneurs) who propose members
preferred to be part of networking. Then these members elect the President of the Presidency of this
organization.
23 Ibid. P. 20
24 Ibid. P. 23
25 Ibid. P. 19.
26 Networking of the Business in Diaspora began in 2013 and continued in 2014.

107
MP
KO
SO
VA
20
13
In this period the Ministry of Diaspora has helped the process of Diaspora networking businesses in four
countries: Switzerland, Germany, Austria, USA (New York). 2014 has continued the process of networking
and in other countries, and has established Global Business Union Diaspora.
Also, compared with last year, as a result of the process of business networking and Diaspora and other
activities, have been identified largest number of businesses in Diaspora. There are more than 3800 businesses
registered in the Diaspora which are different places in the USA and Europe and about 400 businesses
registered in Kosovo Diaspora. This number can be trusted to be even bigger than that and believe that it will
grow in the process of networking and business in other countries and in the process of drafting the Registry
of Diaspora Associations and Other Forms of their organization. It is presented in Annex Table with Diaspora
businesses.(Table-45).
C5. Repatriation and reintegration of Kosovo citizens returned from
foreign countries
C5.1. voluntary and forced Readmission
Law No. 03 / L-208 and Readmission agreements27
set the rules and procedures for readmission of a person
who is a citizen of the Republic of Kosovo or the foreigner who does not fulfill the conditions in force for
entry or residence in the territory of the State.
The process of re-admission / readmission begins under an official order or an injunction from a host country
that denies legal status of a person or family in that state. Following this decision, the sending states contact
Kosovo institutions to confirm the origin or nationality of the person concerned. After receiving confirmation
readmission by Kosovo institutions, a person can turn in Kosovo. Upon reaching his / her at the airport, the
Kosovo institutions are obliged to accept the person, assess the health status of the person, obtain additional
information about the person's needs and provide him / her with information about their rights and
opportunities for reintegration.
If the person on the day of arrival can not get to the place of residence of his / her in Kosovo, the Kosovo
institutions have an obligation to provide temporary accommodation for up to seven days. Moreover, when
such a thing is necessary, they should arrange transportation to the destination municipality. Upon arrival in
the municipality of origin, municipal institutions, respective departments and offices or separate centers are
responsible to provide the necessary assistance for the person re-integration that includes civil registration,
housing and access to public services, as well as in health, education, employment and social welfare. The
repatriated who return to the border crossing points fall within the categories of voluntary and forced returns.
Annual data show that the number of readmitted (forced and voluntary) during the last three years is 13,790
people. Of this number 303 or 2%, are by Member States of the EU, (only in relation to countries with which
27 Agreements signed: Albania, France, Switzerland, Germany, Denmark, Norway, Austria, Slovenia, Czech R, Belgium,
Luxembourg, Netherlands, Montenegro, Sweden, Finland, Bulgaria, Hungary, Malta, Estonia, Lichtenstein, and Croatia

108
MP
K
OS
OV
A
20
13
no bilateral agreement), while the number of readmitted from third countries (only in relation to countries
with which no bilateral readmission agreements) is 281 or 2%. This indicates that there is need for continued
implementation of national legislation in the field of readmission.
GRAPH76: READMISSION TO THE PERCENTAGE BY LAW ENFORCEMENT AND BILATERAL
AGREEMENTS, 2011 – 2013
SOURCE: BORDER POLICE – BP
While the Member States of the EU (based on bilateral agreements), are readmitted 10431 or 76%, and from
third countries, based on bilateral agreements were readmitted in 2775 or 20%.The data show that the
readmission of persons repatriated to 96% of the cases with countries with which Kosovo has readmission
agreements and in 4% of the cases by applying the law of readmission (Chart 77).
GRAPH77: REPATRIATION (VOLUNTARY AND FORCED) BY THE TOP 10 COUNTRIES, 2011-2013
SOURCE: BORDER POLICE – PK
2% 2%
76%
20%
Shtetet Anëtare të BE-së, (vetëmnë raport me shtetet me të cilatnuk ka marrëveshje bilaterale)
Shtetet e treta, (vetëm në raportme shtetet me të cilat nuk kamarrëveshje bilaterale )
Shtetet Anëtare të BE-së, (bazuarnë marrëveshjet bilaterale)
Shtetet e treta, bazuar nëmarrëveshjet bilaterale
750 644 627 567 363 424 445
172 91 76 329
713 629 556
410 527 260 369
125 80 49
469
923 979
592
470 541 556 363
202 79 81
329
0
500
1000
1500
2000
2500
3000
v 2011 v 2012 v 2013

109
MP
KO
SO
VA
20
13
According to annual data for the past three years the biggest number of readmitted (voluntary and forced) of
Germany was 17% (2386), Switzerland 16% (2252), Sweden 13% (1775), Belgium 10% (1447 ), Hungary
10% (1431), Austria 9% (in 1240), France 9% (1177) and other states with rates below 4% and 4%. (Chart
78)
Based on these data, from Kosovo to readmit citizens during the last three years, 78% (10,711) are male while
22% (3079) female. General data for the masculine gender (Chart 79) shows that there was an increase of
17.3% in 2013 (3,906) compared with 2012 (3229).
GRAPH78: READMISSION (FORCE AND VOLUNTARY) BY GENDER, 20011 – 2013
SOURCE BORDER POLICE - PK
But, for feminine gender shows that there has been steadily increasing readmitted, 20.7% in 2013 (1,209)
compared with 2012 (958), and 4.8% in 2012 compared to 2011 (912).
According readmission data for 2013, the bulk of readmitted of 55% was recorded for the age group 18-34
years, followed by age group 35-64 years (22%), age group 6-13 years (10%), under 0-5 years (8%) and 14-
17 years (4%).
v 2011 v 2012 v 2013
FEMRA 912 958 1209
MESHKUJ 3576 3229 3906
0
500
1000
1500
2000
2500
3000
3500
4000
4500

110
MP
K
OS
OV
A
20
13
GRAPH79: READMISSION (FORCE AND VOLUNTARY) BY AGE GROUP, 2011-2013
SOURCE: BORDER POLICE – PK
Readmission data by age group, for the past three years show that there has been increased for 18 - 34 years
from 15.6% in 2013 (2,830) compared with 2012 (2386), and (5.2%) compared to 2011 (2682). The age
group 35-64 years, is less represent but for this age has been increased from 12.5% in 2013 (1,114) compared
with 2012 (979), and (11.7%) compared to 2011 (983), while the age group under 18 years are less
represented. As a result of illegal immigration mainly for economic reasons, it is reasonable that adults make
up the largest part of readmission.
According to the community, for the past three years (2011-2013) most of the Albanian community belongs
readmitted with 72% (9931), 15% Roma, (2037), Ashkali 5% (690), Serbian 3% (427) and Goran 3% (377)
while other communities in a smaller number of under 2% and 2%.
GRAPH80: READMISSION TREND (FORCED AND VOLUNTARY) BY COMMUNITIES, 2011 - 2013
SOURCE: BORDER POLICE – PK
0 deri 56 deri 13
SH14 deri 17
SH18 deri 34 35 deri 64
me shumse 66
I panjohur
v 2011 364 317 105 786 2682 983 30 7
v 2012 343 327 114 784 2386 979 38 0
v 2013 434 494 215 1143 2830 1114 28 0
0
500
1000
1500
2000
2500
3000
SHQIPTARË SERB RAE TE TJERË
v 2013 3637 91 1156 231
v 2012 2952 112 874 249
v 2011 3342 224 738 184
0
2000
4000
6000
8000
10000
12000

111
MP
KO
SO
VA
20
13
Trend of readmitted in 2013, according to records growing communities Albanian community (18.8%) and
RAE (24.3%) compared with 2012, while the Serb community marks discount (-23%) and for other
community of (-7.7%).
The total number of persons readmitted in 2013 increased for 22% (5115), compared to the previous year
2012 (4187), although below the level of 2010 (5198).Trend of readmission in general ranges from 4000 to
5000 persons per year. During the period 2009 -2013 total of readmitted (voluntary and forced) (23,841) of
them were forcibly returned or 65% (15,440) and 35% or Volunteers (8401)
GRAPH81: TREND READMISSION (FORCE AND VOLUNTARY) BY YEAR, 2009 – 2013
SOURCE: BORDER POLICE PK
Voluntary Repatriation according to the IOM -t
Based on the statistics of the IOM office in Kosovo, a total of 202.002 Kosovars who were returned were
helped from June 1999 to December 2013. The largest number of voluntary returnees came from Germany,
making up 42.1% (85.113) of the group, while they represented Switzerland 17.2% (34,826). However, most
of the returnees from Germany and Switzerland were returned in 1999 and 2000, with 18,408 and 55.140
from Germany, while 15,997 and 17,249 from Switzerland, respectively. For other countries, percentages are
listed below: Austria (3.9%), Norway (3.8%), Belgium (3.0%), UK (2.2%), the Netherlands (2.1%) and a
smaller number of returnees from other European countries, including: Albania, Bosnia and Herzegovina,
Bulgaria, Canada, Croatia, Czech Republic, Denmark, Finland, France, Macedonia, Greece, Hungary,
Iceland, Ireland, Israel, Italy, Japan, Luxemburg, Lithuania, Malta, Montenegro, Poland, Portugal, Romania,
Slovakia, Spain, Sweden, Turkey, USA, Uruguay, Australia and New Zealand.
The total number of individuals who have returned voluntarily assisted increased to 1,411 in 2013 from 1,307
in 2012.This increase is a change in trend from previous years, market which have a regular discount from a
peak of 2,204 in 2010. As illustrated in the graph below, this peak was reached following a growing trend by
2008, corresponding to the year of the declaration of independence of Kosovo
4853 5198
4488 4187
5115
0
1000
2000
3000
4000
5000
6000
v 2009 v 2010 v 2011 v 2012 v 2013

112
MP
K
OS
OV
A
20
13
GRAPH82: ASSISTED PERSONS THAT RETURNED VOLUNTARILY, 2007 - 2013
SOURCE :IOM
In 2013, Austria was country with the largest number of persons engaged to assist voluntarily returned with
29.8%, while in 2012 the country who have sent the most was Hungary, which is now in the second place
19.8%. Increasing the total number of persons engaged to assist the voluntary return in 2013, which result in
the displacement of the trend described above, can be attributed to increased returns from Austria from 144 in
2012 to 420 in 2013. This increase of returnees from Austria could be the result of several factors. Austria is a
prime destination for migrants who are struggling to reach the EU via Serbia, and free travel across the border
to Serbia may have contributed to the growth of immigrants arriving from Austria. It's accompanied by a
depressed job market in Austria less jobs for immigrants, and a policy of deportation of asylum seekers to be
denied by the Austrian authorities can result in the growth witnessed in 2013.
GRAPH83 :THAT ASSISTED PERSONS RETURNED VOLUNTARILY BY COUNTRY OF ORIGIN, 2013
SOURCE :IOM
0
500
1000
1500
2000
2500
2007 2008 2009 2010 2011 2012 2013
Numri i të Kthyerve
30%
20% 15%
12%
11%
5% 5%
1% 0% 0% 1% Austria
Hungaria
Belgjika
Zvicrra
Norvegjija
Luxemburgu
Gjermania
Finlanda
Hollanda

113
MP
KO
SO
VA
20
13
Regarding the gender structure of persons engaged to assist the voluntary return in 2013, there was a slight
increase in the proportion of males from 68.0% in 2012 to 69.8% in 2013. The difference is statistically
insignificant; however, the structure is only slightly higher than the gender structure found among the
Diaspora and migrant communities, 57% male and 43% female. This may be related to the fact that the
feminization of migration from Kosovo is a recent phenomenon and those returning are probably from an
older contingent who were more men.
The percentage of adults who continue to return through IOM programs who wish to return voluntarily has
increased considerably, from 69% in 2012 to 74% in 2013. Because the migration and return should be an
informed decision, it is reasonable that adults will make up a large part of this group. Regarding the ethnic
division of returnees in 2013 it can be seen a decline in the percentage of voluntary returnees from Albania
64% in 2012 and 57% in the year 2013. This follows a general trend over the last few years the percentage of
persons from Albania who are helping to voluntarily turn over ten percentage drops from 68% in 2010. This
is accompanied by a simultaneous increase in the percentage of persons assisted to return voluntarily from
Roma, Ashkali and Egyptians from 18% in 2010 to 28% in 2013.
GRAPH84:THAT ASSISTED PERSONS RETURNED
VOLOUNTARILY BY GENDER 2013
GRAPH85:THAT ASSISTED PERSONS RETURNED
VOLUNTARILY BY AGE GROUP
SOURCE :IOM
SOURCE :IOM
69.76%
30.24% Meshkuj
Femra
69% 74%
31% 26%
0%
10%
20%
30%
40%
50%
60%
70%
80%
2012 2013
Të Rriturit
Të Miturit

114
MP
K
OS
OV
A
20
13
GRAPH86: ASSISTED PERSONS THAT VOLUNTARY RETURNED BY ETHINCITY, 2010 - 2013
SOURCE: IOM
Profile of returnees
In accordance with the applicable mechanisms and definitions there are four categories of returnees to Kosovo
by the Kosovo Ministry of Communities and Returns.
Spontaneous Returns (Small Groups, Individuals): Individuals, families or groups who have returned
without any prior warning and do not receive any material assistance before their return or have not planned
their return earlier.
Assisted Return: Based on the individual requirements of displaced persons, families or relatively small
groups of returnees, offered assistance in money,during and after their return usually through municipalities
or NGOs through programs already set.
Organized return: This return is planned and hosted a full package and assists persons before returning.
Readmission - voluntary and forced return (repatriation): In this group of individuals may be classified,
families, groups, who have been refused refugee status in third countries.Through diverse projects MCR
aimed to build and rebuild homes,schools, sports centers, sewerage network, ndriçimin roads, investing in
projects for financial income which enables all communities realize the best conditions for a normal life.
68% 63% 64%
57%
18% 21%
27% 28%
12% 9%
5% 7%
0%
7% 4% 8%
0% 0% 0% 0% 0%
10%
20%
30%
40%
50%
60%
70%
80%
2010 2011 2012 2013
Shqiptarë
RAE
Serbë
Boshnjakë
Tjera

115
MP
KO
SO
VA
20
13
C5.2. The reintegration of repatriated persons
The reintegration of repatriated persons is as a result of the repatriation process. Initially, reintegration of
repatriated persons has been the responsibility of UNMIK, UNHCR, IOM and other organizations that have
served these cases, while in 2006 this responsibility was transferred to Kosovo institutions.
Government of the Republic of Kosovo is committed to completing the legal basis and Reintegration policies
to create the conditions for successful reintegration for repatriated persons and implementation of the
necessary reforms in order to meet established criteria for visa liberalization. Upon receipt of the roadmap for
visa liberalization, the Government of Kosovo established the Strategy and Action Plan for Reintegration,
Regulation no. 10/2012 Reintegration of Repatriated and Reintegration Programme Management and the
Government of the Republic of Kosovo has adopted these documents in 2013.
The role and responsibility of government for the reintegration of repatriated persons - Providing
effective support for the reintegration of repatriated persons requires close coordination of activities between
various central institutions in key areas such as legal reintegration, health, education, employment, social
welfare and housing. The key ministries responsible for the re-integration are: Ministry of Interior (MoI),
Ministry of Local Government (MLG), Ministry of Labor and Social Welfare (MPMS), Ministry of Health
(Moh), Ministry of Education, Science and Technology (MEST) and the Ministry of Environment and Spatial
Planning (MESP).Each ministry has a mandate aforementioned special and responsibility for providing basic
conditions for return and sustainable reintegration.
Strategic legislative and Reintegration process
Repatriated persons assisted and supported by the Reintegration Program pursuant to Regulation No. GORK.
20/2013Reintegration of Repatriated Persons and Reintegration Program Management, of which is approved
by the Government of the Republic of Kosovo in September 2013and the relevant applicable legislation.
Government policy for Reintegration of Repatriated persons are defined in the National Strategy for
Reintegration of Repatriated and Action Plan, which was approved by the Government of the Republic of
Kosovo in October 2013.
In approving these documents, the Government of the Republic of Kosovo addressed all the challenges
identified during the Reintegration of Repatriated Persons, defined and clarified MOCRs mandate in the field
of reintegration, Municipal Resettlement Committees, Central Commission for Reintegration and Complaints
Commission, as the structure for the reintegration of repatriated persons, who are already fully functional. It
also provided the institutional framework for managing the reintegration of repatriated persons, defines roles
and responsibilities of central institutions local and at each stage of the reintegration process as a whole,
concrete actions to achieve the objectives, defines institutions and support for achieving each objective and
activity, specifies the framework for implementation of each activity and establishes procedures and
coordination mechanisms to address the needs and promote the rights of persons repatriated.

116
MP
K
OS
OV
A
20
13
Functionality of the Department for Reintegration of Repatriated Persons (DRPR)
Department for Reintegration of Repatriated Persons is functional and is organized into four (4) division
during the reporting period:
- Division Admission and Accommodation
- Regional Management Division,
- Division for the Resolution of Claims
- Division for Cooperation with organizations International and Local
Within the Division of Admission and Accommodation Office operates host PIA and Temporary
Accommodation Centre.
During 2013, the DRPR recruited 14 permanent positions which are included in the payroll of the Ministry of
Interior, while during 2014 will recruit additional staff (9 positions).
Management, Coordination and Decision-making at the Central and Local Level
To ensure coordination, facilitation and reduction in management of reintegration process from the moment
when citizens return (repatriation) from different countries in Kosovo until the end of the event and as citizens
integrate in society, there exists a Case Management System (SMR) which is installed in all municipalities
and are conducted all training sessions for officials who use this system.
Ministry of Internal Affairs (MIA), through the Department for Reintegration Repatriated Persons is
responsible for policy on reintegration in close cooperation with: MPMS, MMPH, MSH, MASHT, MAPL,
MF, MTI, MZHE, MeD, MKK, MBPZHR as well as the continuous cooperation and coordination with local
and international organizations regarding the reintegration of repatriated persons.
Reintegration Department initially repatriated persons after confirmation from the Department of Citizenship
Asylum and migration are expected to host Office Reintegration,, International Airport Adem Jashari "in
Pristina, where these persons were invited in the office to complete form, registered in the SMR, about the
services provided by the Program for Reintegration and other services from the central Local and he provided
emergency services immediately upon arrival, includes all repatriated persons regardless of age, gender,
ethnicity, religion and race.
It also informed that the party should file a claim for benefits Reintegration program at the Municipal Office
for Communities Returns and where the demand is directed decision-making bodies provided by Regulation
20/2013, Central Reintegration Commission (CCC) Municipal and Reintegration Commission (MCC)and the
party can take a positive or negative decision for the following schemes:
Central Committee decides on requests Reintegration of repatriated persons to benefit by the Program
Reintegration for: Reconstruction and renovation of houses, financing a business plan for revenue generation,
medical treatment and medication.

117
MP
KO
SO
VA
20
13
Municipal Reintegration Commission decides on requests of repatriated for emergency benefits as follows:
Assistance with food parcels and hygiene, Assistance package for winter, of aid package for furniture and
other material assistance, Providing rental housing through residential bonus, occasional assistance if needed
for repatriated persons. Also repatriated persons are offered vocational training and employment generating
projects revenues.
Children who are repatriated immediately ensured their enrollment in schools, for those students who need
additional language learning offered this service together with relevant stakeholders who cooperate in this
regard. In Annex (Table No. 44) reflects the benefits and support of repatriated persons during reintegration
support immediately after arrival, emergency support within 12 months after repatriation and sustainable
reintegration support for the year 2011-2013. Figures 88, 89 and 90 reflect persons reintegrate support
immediately after arrival, emergency support and support for sustainable reintegration.
GRAPH87: RE INEGRATED PEOPLE SUPPORTED IMMEADIATELY AFTER ARRIVING, 2011 –2013
SOURCE: DEPARTAMENT FOR REINTEGRATION
GRAPH88:NEW INTEGRATED REFLECTS PERSONS EMERGENCY SUPPORT INSIDE 12 MONTHS, 2011 - 2013
SOURCE :DEPARTAMENT FOR REINTEGRATION
2011 2012 2013
Transport deri në vendin e origjinës 163 361 316
Akomodimi i përkohshëm ( 7 ditor) në Qendrën e Akomodimit
120 166 138
Ushqimi i përgatitur (servuar )
78 166 138
0
50
100
150
200
250
300
350
400
Akomodim meqera deri ne 12
muaj
Pako ushqimoredhe higjienike
Pakoja endihmës
shëndetësore
Pakoja endihmës për
dimër ( dru përngrohje)
2011 127 1137 0 0
2012 165 2006 37 509
2013 148 1173 29 276
0
500
1000
1500
2000
2500

118
MP
K
OS
OV
A
20
13
GRAPH89:REFLEKS FAMILIES/PERSONS REITEGRATEDSUPPORT SUSTAINABLE REINTEGRATION, 2011 -
2013
SOURCE: DEPARTAMENT FOR REINTEGRATION
A completed application to have met the criteria to benefit from the Programme for Reintegration, a person or
family can be readmitted beneficiary of two or more schemes Programme / Fund for Reintegration.
Data for services rendered since 2011 when it started the program functionality / Reintegration Fund by
MIA.Trend efficiency works and services provided by the Department for Reintegration Trend efficiency
works and services provided by the Department for Reintegration,as a result of raising the level reintegration.
Office for Reintegration Department offers needed security and staff training for providing these services at
both central and local level, recruitment of staff, decentralization of some powers to the local level, providing
effective support in terms of reintegration of repatriated persons, close coordination in the implementation of
activities between relevant institutions, insurance, communication.
During the reporting period the Department for Reintegration readmitted individuals are providing services
for 4,867 persons.
Financimi ithemelimit të
biznesit
Aftësimprofesional -përgatitja për
tregun e punës
Organizimi ikurseve të
gjuhës (mësimiplotësues)
Rindërtim/Ndërtimshtëpie
Renovimshtëpie
Mobilimi/inventarizimi
i shtëpive
2011 0 0 0 4 16 9
2012 153 134 0 48 28 63
2013 268 127 92 44 9 22
0
50
100
150
200
250
300

119
MP
KO
SO
VA
20
13
C6. Internally displaced persons (IDP) and displaced persons in the
region (DPR) Serbia, Montenegro, the Former Yugoslav Republic of
Macedonia)
Government of the Republic of Kosovo, in particular the Ministry for Communities and Returns, under its
mandate has consistently taken action for the realization of returns projects and has made subsidizing-
financing projects which are based on dialogue, reintegration and development of a multiethnic society.
PID – Persons or groups of persons who have been forced to leave or forced to leave their places of
permanent residence in Kosovo from January 1998 and end March 2004 as a result of or in order to avoid the
effects of armed conflict, situation of generalized violence, violations of human rights, but remain within the
territory of Kosovo.
RDP – Persons or groups of persons who have been forced to flee or to leave their places of permanent
residence in Kosovo between January 1998 and late March 2004 as a result or in order to avoid the effects of
armed conflict, situation of generalized violence, violations of human rights and remain outside Kosovo,
namely in the region.
Voluntary Returns
The following tables represent the number of 28
IDPs and 29
RDP-s from 2009 - 2013 as reported by the
UNHCR. Information sources indicate that there is a gradual decrease in the number of returns (displaced
persons) voluntary. During 2013 there has been a decline in volunteer returns (displaced persons) 73.15%
(280) compared with 2012, while 64% (429) compared to 2011.
TABLE29;THE NUMBER OF IDPS AND RDP, 2009 - 2013
2009 2010 2011 2012 2013 Gjithsej
Serbs 439 895 474 363 293 2493
Rome 214 371 120 132 131 968
Ashkali/Egyptian 281 718 395 305 193 1904
Bosnian 43 49 60 84 40 276
Gorani 90 182 106 89 2 478
Albanians 86 99 27 67 103 382
Others 0 4 10 3 1 18
28 Persons or groups of persons who have been forced or obliged to leave their places of permanent residence in Kosovo between
January 1998 and the end of March 2004, in particular, as a result of or in order to avoid the effects of armed conflict, the situation of
generalized violence, violation of human rights, but remain within the territory of Kosovo.
29 Persons or groups of persons who have been forced to flee or to leave their places of permanent residence in Kosovo between
January 1998 and the end of March 2004, in particular, as a result of or in order to avoid the effects armed conflict, the situation of
generalized violence, violations of human rights and remain outside Kosovo, namely in the regjion.

120
MP
K
OS
OV
A
20
13
Total 1153 2318 1192 1043 763 6519
SOURCE :UNHCR
GRAPH90:RETURN BY YEAR, 2009 - 2013
SOURCE :UNHCR
Semi-structured interviews (IGS) have discovered that certain changes have occurred in the process of
returning in the past five years. Particularly, it has become an accepted practice that the integration of IDPs
occurred in the place of displacement. Many years after the conflict, some IDPs prefer to integrate in places
where they are displaced.
Houses built during the period 2009-2013
Based on the results of the assessment of the level of implementation of the Strategy for Communities and
Returns 2009-2013, which is conducted by ECMI Kosovo in cooperation with the Ministry of Community
and return and is supported by the Royal Norwegian Embassy and British, during the period 2009-2013 were
built 148 flats, about 557 houses funded by the MRC and about 514 houses funded by external interested
parties, mainly from EU funds, the British Embassy, UNHCR returnee and some social occasions.
TABLE 30:HOUSES BUILT BY MRC AND EXTERNAL ACTORS, 2009-2013
Year of construction 2009 2010 2011 2012 2013 Total
Total houses built 229 238 265 247 240 1219
SOURCE:MKR
The table shows that during 2013 there was a decrease in the construction of houses for IDPs and RDP 3% (7)
compared with 2012, and 10% (25) compared to 2011.
Kthimi sipas viteve
0
500
1000
1500
2000
2500
2009 2010 2011 2012 2013
Kthimi sipas viteve

121
MP
KO
SO
VA
20
13
Collective centers
Ministry of Community Returns and through project “EU initiatives to support Roma community in Mitrovica
"finally managed to close refugee camps Çesmin Lug and Camp "Ostorode"in the northern part of Mitrovica
and its inhabitants moved to Roma Mahalla, which provided all necessary conditions for a normal life for
151families respectively 524 persons from Roma, Ashkali and Egyptian communities.
Within the project "EU initiatives to support Roma community in Mitrovica Phase II “ , The main building is
managed Leposavic camp with surrounding objects (former military hangar) be closed, where there were 35
families. According to UNHCR and MOCRs, a significant number of displaced persons continues to live in
collective centers, respectively IDPs 772 and refugees or 312 families.
TABLE31:NUMBER OF COLLECTIVE CENTRES UNDER UNHCE, 2013
Regions Collective Centres Family Individual
Mitrovica 23 104 254
Gjilani 7 133 385
Pristina 6 75 133
Total in Kosovo 36 312 772
SOURCE:MKR

122
MP
K
OS
OV
A
20
13
PART D: MIGRATION POLICIES AND PROGRAMS AND THEIR
EFFECTIVENESS IN MANAGEMENT OF MIGRATION AND
CHALLENGES OF DEVELOPMENT
One of the priorities of the Republic of Kosovo is the development of mechanisms for quality management
and quantitative migration and prevention and reduce the negative effects particularly stemming irregular
migration. In this regard, The Republic of Kosovo has taken a number of actions being drafted and adopted a
series of laws and bylaws, strategic documents and other documents. Among these it is worth emphasizing the
Law on Asylum, Law on Foreigners, Law on Border Control, Law on Citizenship of Kosovo, Law on
Prevention and Combat Trafficking in Persons and the Protection of Victims of Trafficking, Law on
cooperation between the authorities included in the Integrated Border Management, Migration Strategy,
Strategy for Integrated Border Management, Strategy to Combat Trafficking in Persons, Strategy for
Reintegration of Repatriated Persons, etc. Also, the Government of the Republic of Kosovo has signed a
number of agreements in the field of migration, bilateral agreements on readmission of persons who do not
meet the conditions for residence in the respective country, police cooperation, and is in the process of
negotiating a number of such agreements with other countries.
The aim of these policies is administration of migration in all its forms submitted, and strengthening
cooperation with neighboring countries in order to prevent irregular migration and combating human
trafficking and smuggling of migrants. Irregular migration problem is closely related to the process European
integration and visa liberalization.
D1. Policy framework and laws on migration in Kosovo
The Republic of Kosovo has adopted the legal framework governing, directly and indirectly the field of
migration. Besides Constitution, this framework includes a set of laws and bilateral agreements with other
countries which are briefly summarized in this section.
D1.1. The policy framework
The Republic of Kosovo has drafted / approved a number of policies and strategic documents in the field of
migration aimed at combating and preventing human trafficking, integrated border management and the
reintegration of repatriated persons.
In this section briefly summarizes each of these documents.
State Migration Strategy and Action Plan 2013 - 2018, is the main national policy on migration. The
overall goal of this strategy is the promotion of a transparent system and effective management of regular
migration, as well as for prevention and reduction of all forms of irregular migration. Strategy and action
plan provides specific measures for capacity building and administrative structures responsible for entry

123
MP
KO
SO
VA
20
13
and residence of foreigners, legal regulation of entry and asylum seekers stay in place, effective
management, control and protection of the state borders and border crossings, etc30
..
Diaspora and Diaspora Strategy and Action Plan 2013 – 2018. This is the first strategic document,
through which, concrete actions are intended to ensure the advancement of social and political rights of
diaspora, preservation of cultural and linguistic identity of the Diaspora, avoidance of assimilation,
support for integration into their host countries legal and administrative maximum convenience for those
who want to help the economic development of their country.
National Strategy Against Trafficking in Human Beings and Action Plan 2012-2017, is the main
national policy for prevention and combating human trafficking. It aims to promote the coordination and
harmonization of inter-institutional actions, reduce trafficking damage to society, intensify prosecution
and punish offenders who commit this type of crime, and to provide improved quality of services to
victims of human trafficking.31
National Strategy of the Republic of Kosovo for Integrated Border Management Action Plan 2013-
2018. The National leading document for management of policies and border control. The purpose of this
document is to control and effectively supervise borders, national cooperation and internationally among
all authorities competent involved in border security and facilitation of the free movement of people and
goods, and establishing an effective system and integrated border management, in order to achieve the
common goal of open and secure borders32
.
National Strategy for Reintegration of Repatriated Persons in Kosovoand Action Plan 2013-2017 is
the main national policy for the reintegration of repatriated persons. Its goal is the reintegration of Kosovo
citizens repatriated through the creation of appropriate conditions for sustainable reintegration into
society33
.
Visa regime policies: The Republic of Kosovo has established a visa regime with 88 countries, mainly
the Asian continent and the African continent. Visa regime application has started from July 1, 2013,
initially in the diplomatic and consular service of the Republic of Kosovo in the Republic of Turkey.
D1.2. The legal framework in the field of migration
As part of fulfilling the criteria set out in Guidance for visa liberalization and recommendations of the
European Commission of February 2013, it is recommended Amendment of the relevant legislation in the
field of migration, asylum and integrated border management, in order to harmonize legislation with EU and
international standards. In this regard, institutions of the Republic of Kosovo during 2013, have changed
30 http://mpb-ks.org/repository/docs/Strategjia_per_Migrim_SHQ.pdf
31 http://mpb-ks.org/repository/docs/TQNJShqip.pdf
32 http://mpb-ks.org/repository/docs/Serbisht__Plani_i_Veprimit_(tri_shtyllat)_MIK_2013-2018__19.09._2013.pdf
33 http://mpbks.org/repository/docs/Strategjia_Kombetare_per_Riintegrimin_e_Personave_te_Riatdhesuar14112013.pdf

124
MP
K
OS
OV
A
20
13
approved legislation listed below, in accordance with the recommendations and requirements of the European
Commission:
Law on Foreigners;
Law on Asylum;
Law on Citizenship of Kosovo;
Law for the Control and Supervision of the State Border;
Law on Cooperation between authorities involved in the Integrated Border Management;
Law on Prevention and Combat Trafficking in Persons and the Protection of Victims of Trafficking.
The field of migration in Kosovo is regulated by the following legislation:
Law no. 04 / l-069 for Foreigners (published in the Official Gazette on January 12, 2012)34
This Law
regulates the conditions of entry, movement, stay of foreigners in the territory of the Republic of Kosovo. In
September of 2013 repealed the Law for Foreigners with Law no. 04 / L-219 for Foreigners (published in
the Official Gazette on September 5, 2013)35
, in order to harmonize with the acquits communautaire of the
EU. The new law regulates the conditions of entry, movement, attitude and employment of foreigners in the
territory of the Republic of Kosovo.
With the adoption of the new Law on Foreigners melting of the law is made for granting permission to work
and Employment of Foreign Nationals in the Republic of Kosovo under the new law for foreign and a number
of changes in order to facilitate the procedure for the issuance of work permits for foreigners procedure for
voluntary departure order and forced eviction order and fines for foreign, also regulates the issue of
trafficking of foreigners in the Republic of Kosovo.
Law no. 04 / L-073 Asylum (published in the Official Gazette on January 12, 2012)36
, This law regulates
the granting of asylum and recognition of refugee status, granting of temporary or subsidiary protection,
people in need and their return to their country of origin, or to a third country. In September of 2013 it was
repealed the Law on Asylum Law no. 04 / L-217 Asylum (published in the Official Gazette on 30 August
2013)37
, in order to harmonize with the acquis communautaire of the EU and determination of all rights and
obligations of asylum seekers under the EU Directives.
The new law regulates the conditions and procedures for the recognition of refugee status, additional
protection, temporary protection, the status, rights and obligations of asylum seekers, persons with refugee
status, and persons granted subsidiary protection and temporary protection.
Procedures for the acquisition and loss of citizenship of the Republic of Kosovo and other issues related to
citizenship are determined through Law no. 03/034 for Kosovo Citizenship (published in the Official
34
http://gzk.rks-gov.net/ActDetail.aspx?ActID=2797 35
http://gzk.rks-gov.net/ActDetail.aspx?ActID=8876 36
http://gzk.rks-gov.net/ActDetail.aspx?ActID=2798 37
http://gzk.rks-gov.net/ActDetail.aspx?ActID=8869

125
MP
KO
SO
VA
20
13
Gazette on June 20, 2008)38
. In order to regulate the status of stateless persons (apatrid), Law is amended /
supplemented with Law no. 04 / L-059 for amending the Law no. 03/034 for Kosovo Citizenship
(published in the Official Gazette of November 25, 2011)39
. Law on Citizenship of Kosovo and supplement
its change, in September of 2013 was repealed with Law no. 04 / L-215 Citizenship of Kosovo (published in
the Official Gazette on September 2, 2013)40
, in order to harmonize with the acquis communautaire of the EU.
The new law defines the way of profit, losing and regaining the Republic of Kosovo statehood and regulates
other matters related to the citizenship of the Republic of Kosovo. Changing / updating the Law on
Citizenship of Kosovo is made in order to harmonize with the acquis communautaire of the EU, and is
regulated naturalization of persons with refugee status, and naturalization husband naturalized person.
Scope of Integrated Border Management (IBM) in Kosovo is regulated by the following legislation:
Law no. 04 / L-072 Control and Supervision of the State Border (published in the Official Gazette on
January 20, 2012)41
. The law governing border control, police powers within the state, cooperation between
state bodies which have competence in border management and responsibilities of the three agencies IBM
(Kosovo Police, Kosovo Customs, and the Veterinary and Food Agency). In September 2013 the law was
amended with Law no. 04 / L-214 for Change and supplementing the Law no. For Control and
supervision of the State Border (published in the Official Gazette on September 2, 2013)42
, in order to
harmonize with the acquis communautaire of the EU. The main changes in the new law dealing mainly with
definitions and naming the law.
Law no. 04 / l-216 for Cooperation Between Authorities Involved in Integrated Border
Management(published in the Official Gazette on August 30, 2013)43
, regulates cooperation between all
authorities that are included in the Integrated Border Management and implement joint strategies of these
authorities, so that the tasks envisaged for authorities and individual measures relating to prevention,
detection and investigation of criminal illegal activities, control, monitoring and relevant international
cooperation, be met appropriately, efficiently and effectively.
Law no. 04 / l-218 for Prevention and Combat of Trafficking in Persons and Protection of Victims of
Trafficking (published in the Official Gazette on September 4, 2013)44
, aims to prevent and combating
human trafficking in all its forms. Protection of victims of trafficking including providing rights, legal aid,
medical assistance, psycho-social support, compensation insurance and other rights to all persons who are
supposed to be or identify as trafficked, regardless of gender, age, marital status, language, physical or mental
disability, sexual orientation. National cooperation and international levels in order to prevent and combat
trafficking in persons, and providing assistance and protection of trafficked victims.
38http://gzk.rks-gov.net/ActDetail.aspx?ActID=2515 39http://gzk.rks-gov.net/ActDetail.aspx?ActID=2840 40http://gzk.rks-gov.net/ActDetail.aspx?ActID=8873 41http://gzk.rks-gov.net/ActDetail.aspx?ActID=2801 42http://gzk.rks-gov.net/ActDetail.aspx?ActID=8872 43http://gzk.rks-gov.net/ActDetail.aspx?ActID=8868 44http://gzk.rks-gov.net/ActDetail.aspx?ActID=8875

126
MP
K
OS
OV
A
20
13
Law no. 04 / L-076 for Police (published in the Official Gazette on March 19, 2012)45
, regulating the powers
and duties of the Police of the Republic of Kosovo, her organization and other issues related to the activities
and actions of the Police of the Republic of Kosovo. Readmission of persons who are nationals of the
Republic of Kosovo or nationals of other countries, who do not meet or do not meet the entry requirements
for furtheror stay in the territory of the requesting State are regulated by the following legislation:
Law no. 03/208 on Readmission (published in the Official Gazette on July 20, 2010)46
, rules governing and
procedures for readmission of a person who is a citizen of the Republic of Kosovo or a foreigner, which does
not comply the conditions in force for entry or residence in the territory of the requesting State. Implementing
legislation has priority readmission regarding cooperation on readmission with countries with which Kosovo
has not signed bilateral agreements on readmission.
Law no. 04 / l-003 on Civil (published in the Official Gazette on July 22, 2011)47
, regulates the meaning
and components of civil status of Kosovo citizens, foreign nationals and stateless persons, residing
temporarily or permanently in the Republic of Kosovo, defining the rules for creating, maintaining and
changing their and the organization and functioning of the civil service in the Republic of Kosovo.
Law no. 04 / L – 095 for Diaspora and Diaspora (published in the Official Gazette on July 3, 2012)48
,
aimed at maintaining and cultivating national identity, linguistic, cultural and education of members of the
Diaspora and Diaspora, and their connection with the institutions of the Republic of Kosovo. It also aims to
assist in the organization of migrants in various countries where they live and help, promote and develop
intercultural relations between the Republic of Kosovo and states where migrants are present.
Law no. 02 / l-121 for domicile and residence (published in the Official Gazette on October 15, 2008),
regulating registration and de-registration of residence and domicile citizens, guest registration and de-
registration, change of address of residence, guest registration and de-registration, change of address of
residence.
The rights and obligations arising from employment are defined by law as follows:
Law no. 03 / l-212 Work (published in the Official Gazette on August 10, 2009),49
This law aims to regulate
the rights and obligations arising from employment, as defined by this law.
Diplomatic and consular missions of the Republic of Kosovo are regulated by law in the following.
Law no. 03 / l-125 for Diplomatic Consular Services and the Consulate of the Republic of Kosovo
(published in the Official Gazette on January 15, 2009),50
this Law governs consular, supports cooperation
between the Republic of Kosovo and receiving countries in the field of consular services, and promotes the
strengthening of friendly relations between the Republic of Kosovo and the receiving countries.
45http://gzk.rks-gov.net/ActDetail.aspx?ActID=2806 46http://gzk.rks-gov.net/ActDetail.aspx?ActID=2687 47http://gzk.rks-gov.net/ActDetail.aspx?ActID=2743 48http://gzk.rks-gov.net/ActDetail.aspx?ActID=2831 49http://gzk.rks-gov.net/ActDetail.aspx?ActID=2735 50http://gzk.rks-gov.net/ActDetail.aspx?ActID=2618

127
MP
KO
SO
VA
20
13
Decision on Visa Regime – The Government approved on 14 December 2012, And entered into force as of
the date 01Korrik 2013, which stipulates that citizens can enter without a visa in Kosovo, and citizens who
need visas to enter Kosovo. Decision on visa regime is changed / amended by Decision No. 15/158 of 29
November 2013to change the conditions of entry and visa regime for foreigners in the Republic of Kosovo.
The decision to establish government authority to monitor the movements of migration No.. 08/158
approved by the Government on 29 November 2013. Authority as a permanent body responsible for
compiling and updating the profile migration.
D1.3. International legal framework in the field of migration
As stated above a number of declarations and conventions in the field of human rights are directly applicable
in Kosovo. Key documents of international law in the field of migration are the Convention on Asylum, UN
Convention on the Rights of Migrants and Members of Their Families. In addition to general international
documents on human rights, which have direct application in the Republic of Kosovo, as envisaged in Article
22 of the Constitution,
Kosovo during 2013 has continued with the negotiation and signing of bilateral agreements in the field of
migration, specifically for readmission and police cooperation. These agreements are listed in this section.
In the field of migration, the Republic of Kosovo has signed the following agreements:
Cooperation Agreement establishing a partnership on migration between the Swiss Federal Council
and the Republic of Kosovo;
Agreement on technical cooperation to facilitate the access of persons in need of international
protection in the territory and asylum procedures, between the Ministry of Internal Affairs and High
Commissioner for Refugees United Nations.
In the field of police cooperation, Kosovo Police has signed the following agreements:
Agreement on cooperation in preventing and combating crime between Kosovo and the Republic of
Hungary, in July 2013;
Agreement on cooperation in the field of security between the Republic of Kosovo and the Republic
of Finland, in October 2013;
Agreement on Police Cooperation between the Republic of Kosovo and the Swiss Confederation, in
October 2013.
In the field of readmission, The Republic of Kosovo has signed a total of 21 agreements readmission by 2013
this number are signed (3) agreement as follows:
Agreement for "readmission of persons residing without authorization” between the Government of the
Republic of Kosovo and the Republic of Estonia, in May 2013.

128
MP
K
OS
OV
A
20
13
Agreement for "readmission of persons residing without authorization” between the Government of the
Republic of Kosovo and the Principality of Liechtenstein, in June 2013.
Agreement for "readmission of persons residing without authorization” between the Government of the
Republic of Kosovo and the Republic of Croatia, in July 2013.
In order to monitor the implementation of bilateral agreements in the field of readmission, during 2013
the Ministry of Internal Affairs has drafted a report regarding bilateral agreements signed by the Republic
of Kosovo since 2009.
The report is based on input signatories to agreements.
The Republic of Kosovo has continued with the scope and functioning of diplomatic missions Consular and
across the world.Their number by the end of 2013 is 27 and they are reflected in Appendix no. 46.
Since June 2013 is open liaison office in Kosovo in Belgrade and exchanged liaison officers, The initial step
in the normalization of relations between the Republic of Kosovo and Serbia, as two independent. Opening
the liaison office was preceded by agreement on normalization of relations between Kosovo and Serbia 19
April 2013.
During their stay abroad, Kosovo citizens can cope with the difficulties of different natures and can turn to
diplomatic / consular missions to seek advice to overcome them. Help can be provided by diplomatic
missions / consular consists of:
Offering help to Kosovo citizens in exceptional cases;
- Providing assistance to prisoners;
- Providing assistance for restoration of Kosovo citizens who have died outside Kosovo and ensuring
the protection of their property.
- Issuance of travel account for return to Kosovo citizens;
- Processing of applications for passports and identity cards of the Republic of Kosovo;
- Processing of applications for acquiring the citizenship of Kosovo and for release from citizenship of
Kosovo;
- Processing of applications for registration of facts birth, marriage and death; and
- Issuance of certificates of any kind.
The diplomatic mission / consulate can provide assistance for Kosovo citizens only when verified that the
citizen does not have found himself in trouble at the same time and nationality of the receiving state.

129
MP
KO
SO
VA
20
13
GRAPH91:PERSONAL DOCUMENTS ISSUED IN DIPLOMATIC AND CONSULAR MISSIONS , 2011 - 201351
SOURCEI:MFA
From the beginning of 2011 until the end of 2013,issuance of personal documents (passports and IDs) in
Diplomatic and Consular Missions in Kosovo has achieved constant growth. During this period, in
Diplomatic and Consular Missions in Kosovo65,551 were issued personal documents. It is worth mentioning
that during 2013 only issued approximately 36,500 personal documents (12.500 IDs and 24.000
passports),which is more than in the previous two years. In the following table are given the statistics of
personal documents issued in the Diplomatic and Consular Missions in Kosovo.
The total number of issued travel account by Diplomatic and consular missions in Kosovo, Kosovo citizens
who have not been provided with a passport, is 1501.The largest number of these travel account is issued in
Zurich 550 (36,6%), Geneva 360 (23.9%), Brussels 273 (18.1%) and Vienna 145 (9.6%).The rest of the travel
account is issued in Diplomatic / consular missions in Paris, Zagreb, Rome, Bern, Sofia, The Hague, Istanbul
and Stockholm.
Of the total number of travel account (1501) issued 255 official use of vehicles plotline repatriation of Kosovo
citizens. Of this number, the diplomatic / consular mission to Vienna are released 145 (56%), Geneva 55
(21.5%) and Stamboll 23 (9.1%) for the official use of vehicles return to Kosovo.
51 Others in the graph refer Diplomatic / Consular Missions of Kosovo in Vienna, Bern, Paris, Brussels, Rome, Stockholm, New
York, London and Istanbul.
11844 11653
9706
6601 5873
19874
Frankfurt Shtutgart Berlin Cyrih Gjenevë Tjera

130
MP
K
OS
OV
A
20
13
D2. Overview of national institutional framework and stakeholders in
the field of migration
D2.1. Local institutions in the field of migration
Institutions responsible for the oversight and implementation of migration policy in the Republic of Kosovo
by the government's decision are as follows:
1. Ministry of Internal Affairs (MIA)
2. Ministry of Foreign Affairs (MFA)
3. Ministry of Education, Science and Technology (MEST)
4. Ministry of Diaspora (MOJ)
5. Ministry of Labor and Social Welfare (MPMS)
6. Central Bank of Kosovo (CBK)
7. Ministry of Justice (MOJ)
8. Ministry of Finance (MoF)
9. Ministry of Communities and Returns (MCR)
10. Ministry of European Integration (MEI)
11. Statistical Agency of Kosovo (SAK)
For more information on the responsibilities of the above institutions on migration refer expand Profile
migration in 2012.
Governmental Authority for Monitoring the Movements of Migration, is responsible for compiling and
updating the Profile Migration, continuous monitoring of the implementation of migration policies, analysis
of migration policy objectives, providing expertise regarding legislative changes, cooperation and
coordination with institutions, and international organizations regarding the provision of technical assistance
in field of asylum and migration, capacity building in the field of asylum and migration, development of
research in the field of migration and examining ways of cooperation with regional initiatives in this field.
Republic of Kosovo institutions give priority to issues dealing with Kosovo living or staying out of the state
of Kosovo. For this purpose, established in 2011 is the Ministry of Diaspora, as an institution responsible for
the design and implementation of policies and legislation for the Diaspora and Diaspora.
Protection and development of the Diaspora identity, sustainable links between them and the institutions of
the Republic of Kosovo, which provide administrative services that strengthen relationships and
communication with the Diaspora, offering educational programs that strengthen cultural relations between
the Republic of Kosovo and States in which Diaspora lives, are all targets of the Government of the Republic
of Kosovo that are implemented through the Ministry of Diaspora.

131
MP
KO
SO
VA
20
13
D2.2. Organizations and civil society actors in the field of migration
Regarding the cooperation with civil society in the field of migration, A number of local civil society
organizations are actively involved in supporting the implementation of legislation and policy in this field
through projects and various activities .Leading civil society actors involved in this field are :
- Civil Rights Program Kosovo (CRP-K);
- Kosovo Rehabilitation Centre for Torture Victims
- Resource Center for Advocacy and Training Center (ATRC)
- Kosovo Agency for Advocacy and Development (KAAD)
D3. Regional and international cooperation on migration
In the implementation of legislation and policies in the field of migration, Kosovo institutions have developed
various forms of cooperation with organizations and special initiatives in the field of international and
regional migration. Kosovo has also established bilateral cooperation with individual states.
D3.1 Cooperation with organizations and regional and international initiatives,
as well as other international actors in the field of migration
- Key actors in this category involved in migration are:
- International Organization for Migration (IOM)
- Organization for Security and Cooperation in Europe (OSCE) Mission in Kosovo
- United Nations Program for Development (UNDP) in Kosovo
- Office of the High Commissioner of the United Nations for Refugees (UNHCR)
- United Nations Fund for Children (UNICEF);
- EU Office in Kosovo (ZBE);
- International Centre for Migration Policy Preparation (ICMPD);
- Danish Refugee Council (DRC);
- Arbeiter Samariter Bund (ASB);
- (CARITAS);
- European Centre for Minority Issues (ECMI).
For more information on the scope of the above organizations and the nature of cooperation in the field of
migration refer expand Profile migration in 2012.
As part of the assistance provided by ZBE, since January 2013 is being implemented Twinning project on
migration "Strengthening Readmission and Sustainable Reintegration in Kosovo" in order to increase the

132
MP
K
OS
OV
A
20
13
analytical capacity for policy-making within the Ministry of Internal Affairs, with particular emphasis on
strengthening the cooperation between central and local level, help in advancing regulatory and administrative
framework and improving case management for the purpose to achieve Sustainable Reintegration in Kosovo.
Regarding the cooperation with regional and European initiatives, the Republic of Kosovo has intensified its
efforts in this direction during 2013. With participation in thematic roundtables and conferences organized by
the Regional Initiative on Migration, Asylum and Refugees (Marri);European Agency for the Management of
Operational Cooperation at the External Border Member States of the European Union (Frontex).Also, during
2013 the Ministry of Internal Affairs in the framework of cooperation with Eason has submitted a document
in this organization to the needs of the Kosovo authorities, including assistance in the interpretation and
implementation of the Law on Asylum, interview techniques and common procedures asylum.
D3.2. Bilateral cooperation in the field of migration
Kosovo cooperates steadily on diplomatic missions present in the country, in the field of migration. Embassy
of Hungary, Norway and Sweden have appointed attaches migration in Kosovo, but are also a number of
embassies that do not have such attaché appointed yet, but the cover this area by other diplomats. Foreign
diplomatic missions accredited in Kosovo, as well as international organizations accredited in Kosovo who
have diplomatic status are reflected in the supplements (See Table No. 46).
During 2013, the Ministry of Internal Affairs has organized regular meetings with immigration attaché in
diplomatic and consular missions accredited in Kosovo in order to exchange data and discussion about the
challenges in the field of asylum and migration.
In order to raise the awareness regarding the Kosovars irregular migration to the EU, the Government of the
Republic of Kosovo has begun an intensive campaign to prevent irregular migration and inform the broader
public about the process of repatriation and reintegration in Kosovo, as well as opportunities to benefit from
the reintegration program. For more click build awareness campaign (www.visalib.info).
In order to further policy development, international and regional cooperation and institutional capacity
building in this area, the following recommendations should be considered. Continuation of the negotiation
and conclusion of bilateral and multilateral agreements on migration.
- Enhancing cooperation and membership in regional initiatives in the field of European and
international migration;
- Continued expansion of networks for issuing visas in diplomatic and consular missions;
- Continuation and intensification of awareness in order to prevent irregular migration;
Continuation and intensification of awareness in order to prevent irregular migration;

133
MP
KO
SO
VA
20
13
PART E: ASSESSMENT OF THE IMPACT OF MIGRATION AND
MIGRATION POLICY FOR SOCIO-ECONOMIC DEVELOPMENT
This section is intended to provide an overview of the impact of migration on the socio-economic
development and the effectiveness of policies related to migration.
E1. The effects of migration on socio-economic development of the
country of orizin
The effects of migration on socio-economic development of the country of origin relating to five key aspects:
- Impact on the economic and financial field;
- Effects of brain gain/drain;
- The impact on the labor market; and
- Impact on demography.
Given that Kosovo is mainly a source of migration, ie mainly a place from which migrants leave, then the
effects of migration should begin to analyze from the perspective of immigration.
The impact on the economic and financial
Migration has a primary impact on the economy of the country of origin. The most important impact of
migration is considered in the growth of remittances and their use correctly in the interest of economic
development. Expansion of legal migration channels will have a positive impact on economic development
through the expansion of opportunities and channels for bringing foreign direct investment in the country, but
also the Diaspora.
The positive effects
Return migrants together with their financial capital and investment, encourage and support their
direct investment in the country's economic field, will also be associated with creation of new jobs;
Creation of new jobs will reduce the tendency for labor migration and increase revenue with a large
number of citizens, then it would have a direct impact on economic growth;
In the broadest sense, immigration has direct positive impact on the economic area of the country as a
result of remittances of migrants to their country however, given that 40% of remittances in Kosovo
comes through informal channels is difficult to judge the real impact on the economy; and
Kosovo Diaspora is an important factor of economic development of Kosovo. However, this potential
is still not sufficiently utilized and channeled into productive activities that would have economic
impact.

134
MP
K
OS
OV
A
20
13
The negative effects
If we talk about the return of migrants mean reduction and their remittances from migration. This
would constitute a negative impact in the broadest sense of the economic impact.
Impact on loss / profit of the brain
Kosovo as a new state in the construction and consolidation needs more than ever to return country's
intellectual capital or otherwise called brain gain, which will contribute to the establishment of Kosovo
institutions. Until now Kosovo institutions have not been able to do more for them on their return
after completing their education.
Positive effects
Kosovo citizens very well educated abroad represent an important source and a mitigating factor for the
transfer of technology, science and innovation.
The negative effects
Migration due to education or study abroad affects the brain drain the country causing a loss of long-term
investment that is made for their education and training
The impact on the labor market
The impact of migration on the labor market should be viewed in context with the unemployment rate in the
country as well as the pace of economic development associated with labor market prospects for labor.
Positive effects
While in long-term, migration can be considered as a negative phenomenon in the labor market, on
the other hand it has a positive impact in the short term, as falling unemployment accompanied by the
active population.
Return migration of citizens from Kosovo will contribute to the transfer of skills and knowledge
gained in destination countries as a new culture and ethics of working and the missing professions
and trades in the labor market in Kosovo.
The large number of immigrants from Kosovo together with the diversity of their geographic
distribution in almost all countries of Europe, but also beyond, provides the premise that by returning
to Kosovo emigrants brought a valuable contribution to the power skilled labor.
The negative effects
Migration is associated with depletion of the labor force, since most immigrants are relatively young
population and constitute the most active population contributing to the labor market.

135
MP
KO
SO
VA
20
13
Besides immigration, a labor market has an impact on population movements from one area to another area of
the country. Labor migration, or otherwise called "internal emigration, which must be analyzed in light of the
impact on the labor market along with classic migration to other countries of destination.
Impact on demography
Immigration as a movement or shift of population from country of origin to country of destination, or as a
movement of population from one area to another area within the country, necessarily associated with
changes in demography. Immigration has an impact not only on the change in the number of people but also
of gender, age, qualification etc. In the long term, migration has a negative impact on the demographic
situation in Kosovo. Although Kosovo has a positive degree of population growth (2013 estimated to be
0.97%), Kosovo is obviously losing population due to migration.
International migration will affect you in the future to have:
Declining fertility rates, which means;
Impact in the population of Kosovo and also
• Loss of the general population due to migration
E1.2. Impact of migration on trade and investment
Judging from the figures provided by the Central Bank of Kosovo, flaring that foreign direct investment
coming from four countries: Turkey, Germany, Switzerland and with a significant increase this year from
Albania. Given that Germany and Switzerland are countries where there is a huge community of emigrés from
Kosovo, we can then conclude that a part of foreign direct investment can be from the immigrant community.
Another aspect may be the fact of the impact of these communities on foreign companies that decide to invest
in Kosovo.
Turkey has increased investments in Kosovo in 2013 compared with the previous year which combined with
the above figures show the growth of direct investment from Turkey the marked increase in the number of
immigrants. Maybe cause and effect relationships between migration and FDI in the case of Turkey is quite
complex and involves other factors such as historical cultural and linguistic as in some parts of Kosovo
Turkish is spoken widely.
While direct investment increased from Albania can be explained by combining the factors mentioned in the
case of Turkey with other factors such as the transfer of the business because of family ties which was
demonstrated by the increase in family reunification from Albania and Kosovo; increased demand for
residence permits for family reunification.

136
MP
K
OS
OV
A
20
13
Positive effects
Also, the fact that emigration from Kosovo is not new but has created financial capital and therefore a
potential investment return migrants will automatically bring the possibility of bringing these direct
investments in Kosovo.
Based on the data presented in chapter B, it is clear that Kosovo's trade deficit is financed to the
extent of over 30% primarily from remittances (there was an increase of 2.5% 2013 compared with
2012), for which further explains why remittances make up 12% of GDP.
E1.3. The social impact of migration
The social impact of immigration closely related to the effect that immigration has on unemployment and
poverty alleviation. The social impact of migration is complex and can produce positive effects and negative
at the same time.
At the individual level / Family monthly amount of money sent from the Diaspora is close to the average
monthly gross wage in Kosovo, which is estimated to be € 340 in 2009 and the net is lower than the average
of remittances from the Diaspora for families. According to the UN Development Program (UNDP, 2010),
Diaspora remittances contribute about 40 percent of the total monthly income of families who receive it.
At the national level, the social effects of migration include:
Positive effects
The positive effect of falling unemployment due to emigration among others, and in fact is the
reduced budget to pay the costs of the unemployed category.
Negative effects
But at the same time we have reduced the budget to cover the payment of unemployment benefits,
due to the decrease of unemployment by immigration, have and reduction of tax revenues to the
budget.
Migration also produces effects on the elderly, especially in rural areas from which comes the biggest
influx of immigrants. Because of absence of support from children or elderly relatives left alone are
forced to cope on their own services.
E2. Effects of socio-economic development of migration policies and
other interventions aimed at migration
For countries that have significant migration as Kosovo's integration policies related to migration in national
development strategies likely to promote economic and social development and maximizes the impact of
migration on development. Theoretically Migration policies and programs aimed at better management of
migration and more efficient use of its economic development of Kosovo.

137
MP
KO
SO
VA
20
13
In practical question arises: Do these policies and programs are implemented effectively and efficiently to
ensure the desired effects?
Citing World Bank can be said that just as all economies in the Western Balkans, Kosovo's economic
revitalization is not likely to happen without improvements in the labor market and the overall investment
climate.
Kosovo during 2013 drafted and adopted the National Strategy for Migration 2013-2018 which addresses the
commitment of the Government of the Republic of Kosovo to prevent irregular migration and to strengthen
legal migration, advancing and facilitating legal migration and migration simultaneously turning positive
factor for economic development. At the same time this strategy expresses readiness to intensify dialogue and
regional and international cooperation in order to identify common priorities and addressing common
challenges for the management of bilateral and regional migration. Through the Strategy and Action Plan
2013-2018 Migration, migration and management aims to strengthen interagency cooperation and regional
cooperation. The main aim of the international and preventing irregular migration and combating trafficking
of migrants. In addition, the strategy aims to include in this vision and relevant international organizations and
civil society.
This strategic document is divided into two parts: Migration Strategy and Action Plan, which contains
objectives and activities are planned to meet the five year period 2013 - 2018.
As with previous Strategy mainly focus in this strategy and irregular migration management of refugee return
and no effective mechanisms to determine which make it possible to build bridges to promote the economic
aspects of migration. However, it should be noted that, as seen in data from the central bank a very positive
development during 2013. The climate is improving for doing business in Kosovo. When immigrants decide
to return, they often bring savings as they use these savings depends on a number of policies, such as the ease
of doing business and availability of information on investment opportunities.
Facilitate the transfer of remittances from the diaspora and lowering the cost of delivery affects the growth of
remittances (remittances).Until now, rural areas are somehow neglected because bank branches to facilitate
money transfers are mainly in urban areas.
Also, given the large number of migrants and growing insurance protection and promotion of their rights must
also be a priority of the government of Kosovo. Protecting the rights of immigrants can be provided through
bilateral agreements with host countries. Most often Kosovo as a country that sends immigrants remains much
more to do in this regard.
- Finally, in order to further improve the situation in the field of migration in terms of policies and
programs in this field, should be taken into account the following recommendations:
- Continuation of the negotiation and conclusion of bilateral agreements on migration;

138
MP
K
OS
OV
A
20
13
- Identify modalities for cooperation and membership in regional and international initiatives in the
field of migration; Develop policies and incentives to return, but the financial support of returnees

139
MP
KO
SO
VA
20
13
PART F: CONCLUSIONS
The Republic of Kosovo has developed its legal and institutional framework with the intention of achieving
international standards in the field of immigration, as well as to improve regional and international
cooperation in this field. Kosovo received the Visa Liberalization Roadmap (guide) in June 2012 and the
European Commission published the first report related to the implementation of this roadmap‟s criteria in
February 2013. This report highlighted the need for Kosovo to harmonize the legal framework in the field of
immigration with EU legislation.
Besides this, the Republic of Kosovo continued to negotiate the Stabilization-Association Agreement with the
European Union throughout 2013, while migration policies are an integral part of that agreement. This
framework includes the reforms that local institutions will undertake in the field of migration as part of the
agenda to join and integrate in the European Union.
Another positive development was the signing of bilateral agreements for cooperation in the field of migration
with Lichtenstein and Switzerland, which includes the emigrant‟s seasonal employment, education and
training.
During 2013, in the frames of fulfilling the criteria foreseen with the Visa Liberalization Roadmap (Guide),
the laws listed in Part D were changed/amended in line with European legislation in the field of asylum and
migration.
With regard to institucional developments, the Department for the Re-Integration of Re-Patriated Persons was
operationalized during 2013 as an integral part of the Ministry of Internal Affairs. In addition, the National
Center for Border Management has relocated within the headquarters of the Ministry of Internal Affairs,
while the NCBM in its strukture has operationalized the Unit for Risk Analysis.
Construction of a Foreign Detention Center was also inititated during 2013.
Starting from July 2013, the Republic of Kosovo has started to apply the visa system for 87 different
countries based on the government Decision dated 8 May 2013, as amended by the Decision dated 29
November 2013. Item C2.1 elaborates the visa regime in detail.
During 2013, 6 Cultural Centers on Kosovo were established for the Diaspora and Immigration in Turkey,
Switzerland, Sweden, Germany, France and the USA. These Centers offer different services and information
for Kosovar immigrants, helping preserve their identity as well as providing information on different
investment opportunities in the Kosovo market. Also, during 2013, the Ministry for the Diaspora started the
process of drafting a Registry of Immigrants, Associations and other forms of their organization. A Form for
the Diaspora Registry has been prepared, as well as a Guide (instruction) for this process. The data
(information) will then be collected from different sources. The registration forms and the Guides on how to
fill them out have been distributed among diplomatic and consular missions of the Republic of Kosovo in

140
MP
K
OS
OV
A
20
13
several countries, such as Germany, Austria, Switzerland, Italy, France, England, USA, Turkey, Croatia,
Norway, Sweden, Belgium, Slovenia, the Netherlands, Denmark, Finland and Luxembourg.
F1. The main migration results (findings) with respect to future migration
tendencies
Immigration
Regular Immigration
The number of foreigners with temporary residential permits has been increasing during the last three years
(10%), indicating that Kosovo is becoming a destination for legal migration. As regards foreigners with
permanent residential permits, no comparisons can be made this far because the process of issuing permanent
residential permits only began in September 2013. Most of the countries of origin of the foreigners who reside
in Kosovo (with permanent permits issued via regular means) are neighboring countries and places with
which Kosovo developed economic relations: Turkey, Albania, Serbia, and Macedonia. The main reasons for
their legitimate stay in Kosovo are linked to the right to family re-union, employment and studies.
Irregular Immigration
The number of rejected cases of irregular entries into the territory of the Republic of Kosovo has dropped
during the last three years (-39%). The reason behind this drop is also linked to the increased efficiency of the
Border Police in preventing foreigners from entering Kosovo altogether and from having foreigners use it for
transit from Turkey and other Asian and African countries, as they endeavor to enter the Republic of Kosovo
and then leave through Serbia and Montenegro and into European countries.
The number of illegal immigrants caught in the territory of the Republic of Kosovo during the last three years
is between 700 – 800 persons, but compared to 2012, the year 2013 is marked by a 13.5% drop. This proves
the efforts made by Kosovar authorities to manage and control irregular immigration and movements within
the territory. The main places of origin for people engaged in irregular migration are: Albania, Serbia,
Bulgaria and other countries like Moldavia and Turkey.
Kosovar authorities implemented the measures needed for the removal of illegal immigrants from the territory
of the Republic of Kosovo and in this respect the year 2013 was marked with an increase to the number of
people who were forcefully turned back, when compared to the year 2012 (41%), but also a decrease by -
7,4%, when compared to the year 2011.
When it comes to the nationality of the people who were forcefully turned back or deported, they were mostly
from countries in the region such as Albania, Serbia, Bulgaria and other countries such as Turkey and
Moldavia.
Emigration

141
MP
KO
SO
VA
20
13
The year 2013 was characterized with an increasing number of Kosovar emigrants, especially to EU member
states and Schengen states. This increasing trend has been noted among the regular and irregular migration
categories
Regular migration
Related to the regular migration, based on the EUROSTAT data for the citizens of the Republic of Kosovo
with valid residential permits in EU member states and the Schengen area, there is an increasing trend for
2013 comparing to 2012, respectively 20,080 Kosovar citizens with valid residential permission in EU
member states and Schengen area comparing to the number of 18,218 in 2012, which in percentage for the
year 2013 (20,080) is higher for 10,2% comparing to the year 2012 (18,218). From the total from 2013, states
that are more represented are: Germany (39%), Switzerland (13%) and Italy (12%). The reasons for this
increase, based on the statistical data, is a domination of family union category with 65,2%, followed by
employment activities with 6,1% and education with 3,4%.
Irregular migration
On the other side, year 2013 is characterized with the phenomena of irregular migration of Kosovars towards
EU member states and Schengen area states. One of the reasons of this major increase of this phenomenon is
related also to the achievement of agreement of freedom of movement between Kosovo and Serbia, for which
Kosovar citizens have used the territory of Serbia as a transit for illegal passage in the territory of Hungary.
Another element of analysing and grounding of this number increase of irregular migration of Kosovars in EU
member states and in the Schengen area is the increase for 109% of Kosovar citizens to whom was rejected
border crossing or were caught at the border in the EU member states and in Schengen area, respectively from
670 persons in 2012 to 1405 persons in 2013. This reported increased number comes as a result of Croatia‟s
membership in European Union on 1st of July 2013 and their reporting to EUROSTAT as well as a
consequence of non-information of Kosovar citizens regarding the change in procedures and rules of entering
in the territory of Croatia where we have 51% from the total of rejected entrances in this country out of the
total rejections in EU member states and Schengen area.
Asylum-seekers in Kosovo
Kosovo is accepting asylum-seekers as well from the foreign countries and in accordance with the
international rules and national legislation reviews requests for asylum. Kosovo as a transit country (its
geographical position, migration ways from south to north, conflict in Syria, Pakistan as well as the
insufficient management of migration in Greece and Turkey and their policies) have influenced in a certain
degree that asylum-seekers look for migration way through Kosovo. Anyway, the number of asylum-seekers
is not very high and is declining in the last years, but in comparison with 2012 there was an increase of
34,7%. Main countries of origin of asylum-seekers in Kosovo are from: Syria, Pakistan, etc.
Kosovar asylum-seekers in EU states

142
MP
K
OS
OV
A
20
13
The number of Kosovar asylum-seekers in EU states and Schengen area states in the last previous years has
had a declining trend, excluding year 2013. Based on the EUROSTAT statistics, the number of Kosovar
asylum-seekers in EU and Schengen area states for the year 2013 was 21,090 comparing to the 10,335 from
2012, or 104% more in 2013 compared to the year 2012. The largest number of registered Kosovar asylum-
seekers is in Hungary, France, and Germany and goes on with other states of European Union and Schengen
area states.
F2. Improvement of migration statistics
Identify and explain gaps’ existing data and faced problems in data
collection
Migration is a complicated phenomenon in many aspects, where are involved many institutions, which have
different deadlines for data collection (deadline of annual data submission) –gaps:
The deadline for data collection which is used in compiling the Migration Profile vary from
institution to institution and this makes difficult compiling a plan as a result of having certain
deadlines of drafting this document and it influences in delays up to several months in its finalisation.
Lack of annual data collection for migration, remittances, returnees profiling, cause difficulties in
overall data management on migration, and it influences in timely and accurate completion of the
Migration Profile document. Addressing these difficulties on missing data collection will influence in
quality increase and completed overview on migration trends and accurate policies in the context of
overall migration management.
External resources (EUROSTAT, IOM, FRONTEX, etc.) could not be complete at the time of
drafting of this document.
Lack of completed data in the area of re-integration, respectively the failure to input the data on the
system for managing of cases for re-integration of repatriated persons by the municipalities influences
the data quality in this area.
Recommended actions / strategies to improve migration data
Recommended actions about the data:
IT system improvement for data collection in a harmonized way;
Training of relevant institution officials in data collection and analysis, and in main sectors of
migration management;
Inter-institutional cooperation improvement as well as towards the municipal level;

143
MP
KO
SO
VA
20
13
Involvement of academic institutions and non-governmental sector in drafting the document in
general;
Support and external expertise offer, especially towards analytic progress of the document and main
institutions involved in migration management;
Involvement in regional initiatives, establishment of strategic partnership with European and
international organisations.
Training of municipal officials especially in the aspect of re-integration of repatriated persons in their
utilisation of drafting of this document;
Utilisation of this document for the purposes of drafting/reviewing of existing policies in the area of
migration management.
Suggestions on how to regularly update the National Migration
Description (Profile)
National Authority for Migration is established and relevant institutions‟ officials have participated in drafting
of two Migration Profiles. Even so, there are still gaps regarding the inclusion of all relevant data on
migration policies, joint work in data quality as well as related to the part of analysing (drafting of policies
based on evidence). Support of authorities is necessary in further development of Kosovo Migration Profile,
taking into consideration the migration perspective as a supporting element in socio-economic development.
Drafting (and updating) of migration profiles should be a regular exercise, and it is recommended to update
the migration profile every year, therefore it is suggested to appoint contact points for migration profile in
relevant ministries and authorities. This could ensure sustainable commitment and an institutional memory.
In order that this sustainability is ensured further, we could establish a procedure in a form of Standard Action
Procedure in elaborating the Migration Profile (MP). This procedure will determine the time of regular
meetings, will identify relevant participants, responsible persons and authorities in implementing or following
the tasks, which they agreed upon, related to the migration profile drafting. Furthermore, it is recommended to
prepare a brief instruction document (3-4 pages) where will be described the approximate structure of the
Profile from the visual as well as substantial aspect.
It is important to get an agreement regarding the principle that all institutions should take the responsibility
for their part; however they should not comment up to a certain degree the other parts until they are not
against the necessity of being inclusive.
In drafting the MP are encouraged quarterly or bi-annual reports: ministries can ask for information from the
implementing agencies/municipalities, authorities through a simple questionnaire of a single page (by
preparing the reporting template), where could be explained new trends and reasons. This would facilitate the
elaboration of Migration Profile and would be very beneficial in the regular collection of updated information.
During the drafting of the Migration Profile, besides using internal data, one could also use international ones.

144
MP
K
OS
OV
A
20
13
F3. Recommendations related to migration managing
As part of Western Balkans, Kosovo has become a key point on the main migration roads toward the EU.
Consequently, the empowering of the cross-border cooperation as well as the exchange of experiences and
information between the institutions, including the police of the region‟s countries, in the field of managing of
the migration, is an immediate necessity.
Particular fields where more developing policies and interventions are
necessary
According to the analysis and the findings of this document, interventions in several fields may be proposed:
- Identification and empowering of efficient institutional mechanism that will contribute to or have an
impact on the migration phenomenon;
- Empowerment of mechanisms for identification and profilization of individuals in need of
international protection;
- Empowerment of mechanisms for making possible the identification of countries of origin of
undocumented persons;
- Advancing of mechanisms for repatriation to the country of origin of persons found of having no need
for international protection;
- Provision of interpreters and considering having long-distance translation.
- Strengthening of regional and international cooperation
- Establishment of strategic partnerships with European agencies and international organizations
dealing with migration management, as EASO, FRONTEX, EUROPOL, INTERPOL, etc.;
- Kosovo‟s inclusion in regional initiatives dealing with migration issues, as MARRI, etc.;
- Signing of cooperation agreement between Kosovo and the neighboring countries about issues related
to migration management;
- Signing of technical agreements between international organizations operating in Kosovo regarding
the managing of mixed migration, monitoring of borders, and expectations and examination of
procedures;
- Negotiating and signing of readmission agreements, in particular with countries of origin;
- Negotiating and signing of partnership agreements in the migration field, in particular with EU and
Schengen Zone countries.
- Advancing of capabilities on migration management in general
- Provision of modern technologies as well as operational equipment for conducting mobile checks by
the border police, and routine checks;
- Erection of separate facilities for temporary shelter of people who do not need international
protection, for instance retention centers for foreigners.

145
MP
KO
SO
VA
20
13
- Increase of inter-ministerial cooperation on a national level as well as the participation of the civil
society and the academic one in all courses of policymaking.
- Increase of quality of higher education and of professional schools with the purpose of meeting the
needs on the labor market. Increase of scholarships and other financial supportive means for
education that would slow down the number of youngsters who leave abroad out of education
motives.
Key recommendations on how to improve migration management
Since Kosovo has a large number of emigrants and, at the same time, has a young population and a high
unemployment rate, the best alternative then might be to create inter-sectorial and development policies
related to migration. Public policies should facilitate mi8gration policies, reduce remittance transaction costs
and promote investment opportunities for returning migrants.
In order to be a better judge of the great role played by the investments made by the Kosovar
Diaspora and Emigrants, it is necessary to separate the data on direct foreign investments made in
Kosovo, from the investments made by the Diaspora.
In order to promote legal migration as one of the possibilities to emigrate from Kosovo in the future,
the responsible authorities in Kosovo should spend more in efforts to manage the process by drafting
policies at each stage of the process before migration, such as before decision-making, pre-
employment and pre-departure.
Local stakeholders in the field of migration should create programs of cooperation with countries of
destination during migration, in order to make sure that the emigrants have the proper legal status
since all studies indicate that emigrants with a regular legal status are in general more successful than
those who do not have that status.
In spite of the great importance of remittances made by emigrants to develop the country‟s economic
life, the question ensues – how long will the country continue to depend on such remittances
(monetary proceeds/assistance). The country‟s relevant institutions should draft policies for purposes
of internal economic development, in order to gradually reduce the dependency from such
remittances, until export becomes the main source of income.
The determination of quotas for employment, based on the new Law on Foreigners (Aliens), should
be done based on analyses that should identify possible shortfalls in the local labor market.
The possible visa liberalization for Kosovo citizens is expected to reduce the number of illegal
Kosovar emigrants in EU states.
The induction of legal migration on one hand, and the war against illegal migration on the other,
would fulfill the necessary components needed to transform migration into a country‟s development
force.

146
MP
K
OS
OV
A
20
13
The MFA, MJ and MLSW (Migration Service Centers) in Kosovo should provide timely information
to Kosovar emigrants and the public opinion on the changes to the rules and procedures for border
crossing into EU member states and Schengen area countries.

147
MP
KO
SO
VA
20
13
ATTACHMENTS
I – Sources and the variables (variables) used for data collection
The sources used for data colletion
The statistics of Kosovo Central Bank
ASK statistics system
The data base of the Department of Citizenship, Asylum Migration, the Ministry of Internal Affairs
The system of Migration Department statistics and foreign Border Police
The system of IOM Kosovo
The system of statistics UNHCR in Kosovo
The database of Eurostat

148
MP
K
OS
OV
A
20
13
II –Statistical Appendix for Additional tables (extra ) and figures
TABLE 32::ISSUANCE OF PERMITS TO STAY TEMPORARY BY REASON AND COUNTRY, 2013
Citizenship Total Family Union Jobs Study Other
Total 2078 962 679 128 309
TURKISH 565 227 248 54 36
ALBANIAN 372 205 110 12 45
SERB 278 190 9 43 36
MACEDONIAN 147 76 58 6 7
AMERICAN 127 49 9 0 69
CHINESE 57 5 51 0 1
GERMAN 43 16 8 2 17
BULGARIA 40 7 32 0 1
TAILANDEZE 26 1 25 0 0
FILIPINA 25 5 18 0 2
OTHER 398 181 111 11 95
SOURCE:DCAM

149
MP
KO
SO
VA
20
13
TABLE33:REFUSAL OF ENTRY BY CITIZENSHIP (10 KEY STATES BY CONTINENT), 2009 – 2013
SOURCE :BORDER POLICE DEPARTMENT, THE UNIT OF ANALYSIS AND RISK ASSESSMENT
TABLE34: AND GRAB THE FOREIGNERS STAYING IRREGULAR R. KOSOVO2009 – 2013
2009 2010 2011 2012 2013
The total number of inspections foreigners with irregular
status 96 276 850 992 1103
The total number of cases foreigners caught with irregular
status 100 623 709 817 720
SOURSE : DIRECTORATE FOR MIGRATION AND FOREIGNERS, BORDER POLICE
Refuzim hyrjet sipas shteteve - 2009, 2010, 2011, 2012, 2013
Evropa Nr: Azia Nr: Afrika Nr: Amerika Nr:
Serbia 285 Siria 74 Maroku 24 SHBA 2
Shqipëria 196 Kina 45 Nigeria 21 Ekuadori 1
Maqedonia 125 Jordania 40 Kameruni 19 Bolivia 1
Turqia 81 Pakistani 23 Algjeria 18 Kanada 1
Rusisë 56 Irani 13 Egjipti 22
Bullgaria 36 Bangladeshit 12 Gambia 17
Greqia 32 India 12 Kongo 10
BiH 28 Afganistani 7 Senegali 8
Rumania 23 Iraku 6 Bregu i Fildishtë 7
Italia 23 Jemeni 6 Sudani 5
Gjermania 21 Sri Lanka 5 Mali 4
Zvicra 19 Libani 4 Libia 4
Sllovenia 11 Arabia Saudite 4 Guineja 4
Kazakistani 8 Palestina 3 Sierra Leones 4
Franca 8 Kirkistanit 3 Tunizi 3
Ukrain 7 Filipinet 2 Gana 2
Armeni 7 Hong Kong 1 Kameruni 2
Kirgistan 3 Malajzia 1 Kenia 2
Belgjika 3 Tailand 1 Somali 2
Hungari 3 Argjentin 1 Guatemala 2
Moldavisë 3 E.B.Arabe 1 Zimbabvea 1
Azebergjan 3 Uzbekistanit 1 Liberi 1
B. e Madhe 2 Izrael 1 Katari 1
Portugalia 2 Singapuri 1
Bjellorusisë 2 Bahrain 1
Turkmenistan 1
Mali I Zi 1
Spanjës 1
Gjeorgjisë 1
Sllovakisë 1
Austria 1
Totali 993 Totali 268 Totali 183 Totali 5

150
MP
K
OS
OV
A
20
13
TABLE 35:NUMBER OF FOREIGNERS IRASTEVE CAUGHT WITH ILLEGAL RESIDENCE IN KOSOVO
PROCEEDED IN COURTS DISMISSAL AND ORDER, 2009 – 2013
2009 2010 2011 2012 2013
The total number of cases foreigners caught with irregular
status 100 623 709 817 720
Cases sent to court 100 354 320 479 482
Voluntary evacuations orders 0 269 389 338 238
SOURCE : DIRECTORATE FOR MIGRATION AND FOREIGNERS, BORDER POLICE
TABLE 36: NAME
Age 14--17 18--22 23--25 26--30 31--35 36--40 41-50 Totali
Nr.victims 76 66 34 19 9 5 4 213
SOURCE: DIRECTORATE FOR MIGRATION AND FOREIGNERS, BORDER POLICE
TABLE 37: REJECTION OF FOREIGN STATES AND CONTINENTS, 2013
Europe Nr: Asia Nr:2 Africa Nr:3 America Nr:4
Serbia 285 Syria 74 Morocco 24 SHBA 2
Albania 196 China 45 Nigeria 21 Ekuadori 1
Macedonia 125 Jordan 40 Cameroon 19 Bolivia 1
Turkey 81 Pakistan 23 Algeria 18 Kanada 1
Russia 56 Iran 13 Egypt 22
Bulgaria 36 Bangladesh 12 Gambia 17
Greece 32 India 12 Kongo 10
BiH 28 Afghanistan 7 Senegali 8
Romania 23 Iraq 6 Ivory Coast 7
Italy 23 Yemen 6 Sudan 5
Germany 21 Sri Lanka 5 Mali 4
Switzerland 19 Lebanon 4 Libya 4
Slovenia 11 Saudi Arabia 4 Guinea 4
Kazakhstan 8 Palestine 3 Sierra Leone 4
France 8 Kirkistanit 3 Tunisia 3
Ukrain 7 Philippines 2 Ghana 2
Armenia 7 Hong Kong 1 Cameroon 2
Kyrgyzstan 3 Malaysia 1 Kenya 2
Belgium 3 Tailand 1 Somali 2
Hungary 3 Argentina 1 Guatemala 2
Moldova 3 E.B.Arabe 1 Zimbabwe 1
Azebergjan 3 Uzbekistan 1 Liberia 1

151
MP
KO
SO
VA
20
13
Great B. 2 Israel 1 Qatar 1
Portugal 2 Singapore 1
Belarus 2 Bahrain 1
Turkmenistan 1
Montenegro 1
Spain 1
Georgia 1
Slovakia 1
Austria 1
Total 993 Total 268 Total 183 Total 5
SOURCE: BORDER POLICE DEPARTMENT, AND ANALYSIS UNIT RISK ASSESSMENT
TABLE 38:KOSOVO CITIZENS WHO WERE REFUSED ENTRY AT THE BORDER OR APPREHENDED AT THE
BORDER OF EU STATES AND SCHENGEN AREA, 2009-2013
States Total v 2011 v 2012 v 2013
Total 2765 690 670 1405
Croatia 720 - - 720
France 625 280 235 110
Hungary 305 85 80 140
Germany 225 50 85 90
Bulgaria 175 50 65 60
Slovenia 150 0 0 150
Greece 115 75 40 -
Italy 115 35 30 50
Belguim 100 40 35 25
Switzerland 90 45 45 -
Uk 80 0 40 40
Austria 30 15 10 5
Irland 20 5 5 10
Republic Czech 5 5 0 0
Netherlands 5 5 0 0

152
MP
K
OS
OV
A
20
13
Litenshtajni 5 0 0 5
SOURCE : EUROSTAT
TABLE 39:KOSOVO CITIZENS WHO ARE CAUGHT ILLEGALLY RESIDING WITHIN THE TERRITORY OF THE EU
MEMBER STATES AND SCHENGEN AREA, 2011 – 2013
States/Year Total 2011 2012 2013
Total 21670 5485 6525 9660
Germany 7430 1715 2645 3070
Swizerland 4355 1285 1280 1790
Austria 2200 530 495 1175
France 2085 630 610 845
Sweden 2060 810 525 725
Hungary 1205 50 190 965
Belgium 790 250 250 290
Italy 375 15 180 180
Croacia 275 : : 275
Uk 250 80 70 100
Greece 120 25 95 :
Other 525 95 185 245
SOURCE: EUROSTAT
TABLE 40:KOSOVO NATIONALS ILLEGALLY RESIDING IN MEMBER STATES OF THE EU SCHENGEN S AND
AFTER RELEASE ORDER FOR DISMISSAL BY STATES AND YEARS, 2011 - 2013
States Total 2011 2012 2013
Belguim 6545 2130 2345 2070
France 6320 2045 2070 2205
Hungary 4335 940 1610 1785
Sweden 2595 1065 865 665
Germany 2125 945 1180 0
Austria 1625 575 330 720

153
MP
KO
SO
VA
20
13
Swizerland 855 : 405 450
Norway 765 250 200 315
Luxembourg 460 : 260 200
Denmark 380 100 180 100
Other 1660 335 425 900
SOURCE : EUROSTAT
TABLE 41 KOSOVO NATIONALS OF MEMBER STATES AND MULTILATERAL REMOVED FROM THE EU AND THE
SCHENGEN AREA BASED ON THE ORDER FOR REMOVAL BY COUNTRY, 2011 - 2013
States/Years Total 2011 2012 2013
Hungary 3520 780 1300 1440
Sweden 2490 775 795 920
Germany 1840 710 855 275
Austria 1655 500 365 790
Belgium 1505 640 445 420
France 1330 475 465 390
Norway 490 155 130 205
Croatia 275 275
Uk 270 85 85 100
Finland 220 60 80 80
Luxembourg 210 65 45 100
Denmark 155 35 45 75
Italy 120 5 65 50
Netherlands 100 25 30 45
Slovenia 90 0 0 90
Bulgaria 15 5 5 5
Irlend 15 5 5 5
Czech Republic 5 0 0 5
Poland 5 0 0 5
Slovakia 5 0 5 0
SOURCE : EUROSTAT

154
MP
K
OS
OV
A
20
13
TABLE 42: READMISSION (FORCE AND VOLUNTARY) BY COUNTRY, 2011-2013
States/Year Total 2011 2012 2013
Total 13790 4488 4187 5115
Britain 93 37 40 16
Austria 1240 424 260 556
Belgium 1447 567 410 470
Denmark 206 76 49 81
Finland 250 91 80 79
France 1177 445 369 363
Germany 2386 750 713 923
Netherlands 83 24 35 24
Hungary 1431 363 527 541
Italy 144 59 50 35
Irlend 7 2 4 1
Canada 83 30 33 20
Croatia 165 44 78 43
Luxemburgu 177 47 65 65
Mexico 2 2 0 0
Norway 499 172 125 202
Portugal 1 1 0 0
Romania 8 0 5 3
Slovenia 77 38 21 18
Sweden 1775 627 556 592
Australi 1 0 1
Spain 15 2 5 8
Usa 133 31 86 16
Swizerland 2252 644 629 979
Rep. Qeke 16 5 5 6
Rep. Slovak 8 1 7 0
Polond 1 0 0 1
Turkey 15 6 2 7
Montenegro 23 0 0 23
Bosnia and Herzegovina 33 0 6 27
Albania 1 0 0 1
Macedonia 14 0 0 14
Estonia 1 0 1 0

155
MP
KO
SO
VA
20
13
Greece 26 0 26 0
SOURCE: BORDER POLICE - PK
TABLE 43: READMISSION (FORCED AND VOLUNTARY) BY SEX, AGE GROUP, AND KOMUNITETTEVE, 2011-
2013
Year 2011 2012 2013 Total
Sex
Woman 912 958 1209 3079
Men 3576 3229 3906 10711
AGE
0 until 5 364 343 434 1141
6 until 13 SH 317 327 494 1138
14 until17 SH 105 114 215 434
18 until 34 2682 2386 2830 7898
35 until 64 983 979 1114 3076
More than 66 30 38 28 96
Unknown 7 0 0 7
COMMUNITIES
ALBANIA 3342 2952 3637 9931
SERB 224 112 91 427
ROM 506 667 864 2037
ASHKALi 212 198 280 690
EGYPTIAN 20 9 12 41
GORAN 77 151 149 377
TURK 9 11 14 34
BOSNJAK 98 81 61 240
OTHER 0 6 7 13
SOURCE: BORDER POLICE - PK

156
MP
K
OS
OV
A
20
13
TABLE 44: BUSINESSES DIASPORA, 2012 -2013
state The number of registered
businesses in 2012
The number of registered
businesses in 2013
Kosovo More than 300 businesses More than 400 businesses
Germany More than 150 businesses More than 500 businesses
Swizerland about 500 businesses about 500 businesses
Usa More than 200 businesses More than 2000 businesses
Sweden More than 50 businesses More than 50 businesses
Turkey about 100 businesses about 400 businesses
Croati about 20 businesses about 100 businesses
Sloveni about 20 businesses about 100 businesses
Austri about 50 businesses about 400 businesses
France about 10 businesses about 50 businesses
United Kingdom United / More than 100 businesses
A total of 300 registered businesses in
Kosovo and about 1100biznese
identified in the Diaspora.
A total of 400 businesses identified in
Kosovo in 3800 dherreth businesses
in the diaspora.
SOURCE: MINISTRY OF DIASPORA
TABLE 45: DIPLOMATIC AND CONSULAR MISSIONS OF KOSOVO, 2009 - 201
Diplomatic and Consular Missions in Kosovo
North America 1
States States of
America Washington
2 New York
Europa
3 United Kingdom London
4 France Paris
5 Germany Berlin
6 Frankfurt
7 Stuttgart
8 Italy Rome
9 Austri Vienna
10 Swizerland Bern
11 Zurich
12 Geneva
13 Belgium Brussels
14 Netherlands Hage
15 Sweden Stockholm

157
MP
KO
SO
VA
20
13
16 Hungary Budapest
17 Bulgarin Sofia
18 Croati Zagreb
19 Sloveni Ljubljana
20 Czech Republic Prague
21 Macedonia Skopje
22 Albania Tirana
23 Turkey Ankara
24 Istanbul
Asia 25 Japan Tokyo
26 Saudi Arabia Riyadh
Australia 27 Australia Canberra
SOURCE: MPJ
TABLE 46: STATES THAT EXEMPT FROM VISA REGIME FOR INTRODUCTION , TRANSIT AND STAY IN THE
TERRITORY OF THE REPUBLIC OF KOSOVO UP TO 90 DAY’S FOR A PERIOD SIX MONTHS FROM THE DATE
OF FIRST ENTRY(JULY 2013)
1 South Africa 40 Mbr. Saudi Arabia 79 Rep. Malta*
2 Antigua and Barbuda 41 Mbr. United-Ireland Ver.* 80 Rep. Macedonia
3 Argentina 42 Mbr. Belgium* 81 Rep. Cyprus*
4 Australia 43 Mbr. e Denmark* 82 Rep. San Marinos*
5 Bahamas 44 Mbr. e Jordan 83 Rep. Serbia
6 Bahrain 45 Mbr. e Netherlands* 84 Rep. Slovakia*
7 Barbados 46 Mbr. e Norway* 85 Rep. Slovenia*
8 Belize 47 Mbr. e Spain* 86 Rep. Albania
9 Brunei Darussalam 48 Mbr. e Sweden* 87 Rep. Turkey
10 Bulgaria* 49 Mexico 88 Romania*
11 Botswana 50 Mauritius 89 St. Kitts dhe Nevis
12 Domenik 51 Namibia 90 St. Lucia
13 D.Luxembourg's Grand* 52 Nauru 91
Saint Vincent and
Grenadines
14 El Salvador 53 Nicaragua 92 Samoa
15 United Arab Emirates 54 Oman 93 Sao Tome dhe Principe
16 Federation of Micronesia 55 Palau 94 Holy
17 Fiji 56 Panama 95 Swaziland
18 Hungary* 57 Papa New Guinea 96 State of israel

158
MP
K
OS
OV
A
20
13
19 Grenada 58 Paraguaji 97 Us-American
20 Guyana 59 Polond* 98 Trinidad and Tobago
21 Guatemala 60 Portugal* 99 Tonga
22 Greece * 61 Principata Andorës 100 Trinidadi dhe Tobago
23 Marshall Islands 62 Princ. of Liechtensteine 101 Tuvalu
24 Sejshel Islands 63 Principata Monaco* 102 Uruguay
25 Solomon Islands 64 Rep. Austrisë* 103 Venezuela
26 Japan 65 Rep. Estonian* 104 Vanuatu
27 Qatar 66 Rep. Czech* 105 New zealand
28 Canada 67 Rep. Finland* 106 Singaporore
29 Kiribati 68 Rep. France*
30 Columbia 69 Rep. Fed. Brazil
31 Swiss Confederation * 70 Rep. Fed.e Germany*
32 Kuwait 71 Rep. Honduras
33 Latvia* 72 Rep. Irlend*
34 Lesotho 73 Rep. Iceland*
35 Lithuania* 74 Rep. Italy*
36 Malawi 75 Rep. Kilit
37 Malaysia 76 Rep. Kostarikës
38 Maldives 77 Rep. South Korea
39 Montenegro 78 Rep. Croatia*
SOURCE:MPJ

159
MP
KO
SO
VA
20
13
III – REFERENCES
1. Communication from the Commission to the European Parliament, the Council, the European
Economic and Social Committee and the Committee of Regions: Migration and Development: COM
(2005) 390.
2. Report by,Kosovo‟s population Prediction 2011-2061,statistik agency of Kosovo,Prishtina.December
2013.
3. Studies dor the Visa rebucatable in Kosovo UNDP, USAID, December, 2013,
4. The questionare is published on Albinfo.ch Telegraph(trageting Diaspora), the giant of DFD wrbsites
from 3Jun 2013 until 14 July 2013. Also,quastionare was distribitthrough e-mail to traget groups. Are
respondent 161 total 118 of whom are identify them alves as part of Kosovo Diaspora.
5. Kosovo Remittance study– 2013, October 2013, Statistical Agency of Kosovo,Department of Social
Polls .
6. State fot Migration Strategy and Action Plan 2013 – 2018,
http://mpb-ks.org/repository/docs/Strategia_fot_Migratory_SHQ.pdf.
7. Diaspora and Diaspora Strategy and Action Plan 2013 – 2018,
8. Ntional Strategy Against Trafficking in Human Beings and Action 2012-2017,
http://mpb-ks.org/repository/docs/TQNJShqip.pdf.
9. National Strategy of the Republic of Kosovo for Inegrated Bord Managment 2013-2018
http://mpb-ks.org/repository/docs/Serbian__Action_Plan_(threej_s)_MIK_2013-
2018__19.09._2013.pdf .
10. National Strategy for the Reintegration of Reoaried Persons Kosovo and Action 2013-2017
http:/mpbks.org/respository/doc/.National Strategyy
11. Law no. 04/l-069 For Foreingers (published in the newspaper on 12 January2012)
http://gzk.rks-gov.net/ActDetail.aspx?ActID=2797
12. Law no. 04/L-073 for Asylum (published in the Official on newspaper on January 12 .2012),
http://gzk.rks-gov.net/ActDetail.aspx?ActID=2798
13. Law no. 04/L-059for amending –the Law. 03/L-034 on Citizenship of Kosovo (published in the
Official newspaper on 25 November 2011)
http://gzk.rks-gov.net/ActDetail.aspx?ActID=2840.
14. Law No. 04/L-072 for Control and Supervision of the State Border(Published in the official
newspeaper on 20 January 2012)
http://gzk.rks-gov.net/ActDetail.aspx?ActID=2801.
15. Law no. 04/l-216 for cooperation among authorities involved in the Intergrated Border Managment
(published in the Official newspaper on August 30 , 2013)
16. Law No. 04/l-218 for the Prevention and Combating of Trafficking (published in the Official
newspaper on September 04 , 2013)
http://gzk.rks-gov.net/ActDetail.aspx?ActID=8875

160
MP
K
OS
OV
A
20
13
17. Law No. 04/L-076 for Police (published in the Official newpaper on March 19, 2012)
http://gzk.rks-gov.net/ActDetail.aspx?ActID=2806
18. Law No. 03/L-208 Readmission (published in the Official newspaper on July 20, 2010)
http://gzk.rks-gov.net/ActDetail.aspx?ActID=2687
19. Law no. 04/l-003 on Civil status (published in the Official newspaper on July 22, 2011)
http://gzk.rks-gov.net/ActDetail.aspx?ActID=2743
20. Law no. 04/L – 095 for Diaspora and Diaspora (published in the Official newspaper on July 3 ,2012)
http://gzk.rks-gov.net/ActDetail.aspx?ActID=2831
21. Law no. 02/l-121 for domicile and residence (published in the Official newspaper on October
15,2008).
22. Law no. 03/l-212 Labour (published in the Official newspaper on August 10 , 2009),
http://gzk.rks-gov.net/ActDetail.aspx?ActID=2735
23. Law no. 03/l-125 for Consular Service of Diplomat and Consular Mission of the Republic of Kosovo
(published in the Official newspaper on January 15, 2009),
http://gzk.rks-gov.net/ActDetail.aspx?ActID=2618
24. The decision on visa regime-has been approved by the Goverment on 14.12.2012, and entered into
force on the date 01.07.2013. Decision on visa regime /compete with decision No. 15/158 dated
29.11.2013 to the changing conditions of entry as visa regime for foreigners in the Republic of
Kosovo.