Czech University of Life Sciences Prague Faculty of ...
120
on-line Papers in Economics and Informacs hp://online.agris.cz Czech University of Life Sciences Prague Faculty of Economics and Management ISSN 1804-1930 XI, 2019, 4 Internaonal scienfic journal Prague
-
Upload
khangminh22 -
Category
Documents
-
view
0 -
download
0
Transcript of Czech University of Life Sciences Prague Faculty of ...

on-line
Papers in Economics and Informatics
http://online.agris.cz
Czech University of Life Sciences PragueFaculty of Economics and Management
ISSN 1804-1930XI, 2019, 4
International scientific journalPrague
Agris on-line Papers of Economics and Informatics
The international reviewed scientific journal issued by the Faculty of Economics and Management of the Czech University of Life Sciences Prague.
The journal publishes original scientific contributions from the area of economics and informatics with focus on agriculture and rural development.
Editorial officeAGRIS on-line Papers in Economics and InformaticsDepartment of Economics of FEM CULS PragueKamýcká 129, 165 00 Praha-SuchdolCzech RepublicPhone: +420 224 382 056E-mail: agrisonline(at)pef.czu.cz
PublisherFaculty of Economics and ManagementCzech University of Life Sciences PragueKamýcká 129, 165 00 Praha-SuchdolCzech RepublicReg. number: 60460709
ISSN 1804-1930
XI, 2019, 4 30th of December 2019Prague
Agris on-linePapers in Economics and Informatics
ISSN 1804-1930XI, 2019, 4

Agris on-line Papers in Economics and Informatics
Volume XI Number 4, 2019
[1]
Content:
G. A. Helfer, J. L. V. Barbosa, B. G. Martini, R. B. dos Santos, A. B. da Costa: Ubiquitous Computing in Precision Agriculture: A Systematic Review .......................................................................... 3
M. Janecká, J. Homolka, P. Hošková, J. Mach, M. Dvořák: Evaluation of Economic Efficiency of Selected Branch in Animal Production in EU and CR ............................................................................ 15
E. Janšto, P. Polakovič, K. Hennyeyová, I. Slováková: Analysis of the Current Support of E-marketing Activities in Selected Enterprises of the Wine Sector in Slovakia ...................................... 31
Ľ. Kubicová, K. Predanocyová, Z. Kádeková: Factors Affecting the Demand for Milk and Dairy Products in the Slovak Republic .................................................................................................................. 39
A. Macedo, S. Gouveia, J. Rebelo: Does Wine Quality Have a Bearing on Exports? ............................... 49
J. Nagy, Z. Jámbor: Competitiveness in Dairy Trade – the Case of EU and the Visegrad Group Countries ..................................................................................................................................................... 61
J. Š. Novák, J. Masner, J. Vaněk, P. Šimek, K. Hennyeyová: User Experience and Usability in Agriculture – Selected Aspects for Design Systems ................................................................................ 75
V. Novák, M. Stočes, E. Kánská, J. Pavlík, J. Jarolímek: Monitoring of Movement on the Farm Using WiFi Technology ............................................................................................................................... 85
T. Rudinskaya, E. Kuzmenko: Investments, Technical Change and Efficiency: Empirical Evidence from Czech Food Processing ....................................................................................................................... 93
J. P. Sabou, P. Cihelka, M. Ulman, D. Klimešová: Measuring the Similarities of Twitter Hashtags for Agriculture in the Czech Language ..................................................................................................... 105

[2]
Agris on-line Papers in Economics and Informatics
[3]
Agris on-line Papers in Economics and Informatics
Volume XI Number 4, 2019
Ubiquitous Computing in Precision Agriculture: A Systematic ReviewGilson Augusto Helfer1, Jorge Luís Victoria Barbosa1, Bruno Guilherme Martini1, Ronaldo Bastos dos Santos2, Adilson Ben da Costa2
1 Applied Computing Graduate Program, University of Vale do Rio dos Sinos, São Leopoldo, Brazil2 Industrial Systems and Processes Graduate Program, University of Santa Cruz do Sul, Brazil
AbstractThe applications of ubiquitous computing have increased in recent years, especially due to the development of technologies such as mobile computing and its integration with the real world. One of the challenges in this area is the use of context sensitivity. In agriculture, this can be considered as the context related to the environment, such as the chemical and physical aspects that characterize the different soil types. This scenario periodically changes due to factors such as climate, type of cultivar and soil management technique used, among other aspects. This article presents a systematic review on the research works that explore ubiquitous computing in precision agriculture, including which technologies are being currently applied and which gap scan still be researched. Nine scientific repositories were explored to find articles about precision agriculture and ubiquitous computing. As a result of this search and filtering process, 32 works were reviewed, analyzed and categorized between the years of 2009 and 2019. In general, the reviewed articles concentrate on problems arising from the communication between sensors and the management of context-sensitive data.
KeywordsSystematic review, ubiquitous, computing, precision agriculture.
Helfer, G. A., Barbosa, J. L. V., Martini, B. G., dos Santos, R. B. and da Costa A. B.(2019) “Ubiquitous Computing in Precision Agriculture: A Systematic Review", AGRIS on-line Papers in Economics and Informatics, Vol. 11, No. 4, pp. 3-13. ISSN 1804-1930. DOI 10.7160/aol.2019.110401.
IntroductionPrecision agriculture is a suitable strategy to increase productivity, which al-lows the rational use of inputs and reduces the environmental impacts caused by agricultural practices. Currently, the inputs are used in a variable way to meet the specific needs of each location, thus optimizing the production process. However, it is necessary to characterize the soil spatial variability to check chemical and physical attributes through several representative sampling (Costa, de Passos et al., 2014; Bonfante et al., 2017).
Generally, computing research has aimed to develop techniques to integrate information technology into people’s daily lives, so that they are proactively assisted by technology while they execute their daily activities (Weiser, 1999). Ubiquitous computing seeks new forms of communication and interaction that are distributed in the environment, either in a perceptible or imperceptible way. Furthermore, through the use of sensors, computers can detect
and extract data from the environment, which helps users to perform their tasks (Satyanarayanan, 2001).
Context-aware applications are necessary for this vision to become real-ity (Dey et al., 2001). Context means any information that allows the characterization of an entity situation that is relevant to the interaction between a user and an application, which includes information about the situation, identity and lo-cation of people, groups and physical or computational objects. Through the knowledge of contextual data, an application can adjust its own functioning or even act proactively, such as by alerting users ' to a specific scenario or aiding them to develop activities more efficiently. The generated information will enable the construction of a historical database for posterior decision making (Hong et al., 2009; Ciaramella et al., 2010).
This article uses the systematic review methodology developed by Petersen et al. (2008) to conduct a review of the use of ubiquitous computing

[4]
Ubiquitous Computing in Precision Agriculture: A Systematic Review
in agriculture. Guided by the search and two-phase processing, this article concentrates on discovering the main authors in this area. This article also looks for the most relevant works, in addition to the possible research gaps and their challenges.
Materials and methodsThis article uses a systematic review methodology to” identify, analyze and interpret all the available evidence related to a specific research question” (Kitchenham & Charters, 2007), which in this case are relevant to the application of ubiquitous computing imprecision agriculture. This type of methodology not only discusses the conclusion but also examines all of the activities related to the discovery. Hence, a systematic study collects data when the activity occurs and the media in which it was published, and then maps this connection (Cooper, 2016). The methodology consists in the execution of the following steps: a) establish research questions; b) design the process of the research and c) define criteria for filtering results.
Research questions
The research questions led this study to discover works related to the theme. The goal of these questions is to understand how ubiquitous technologies are being used to help in precision agriculture. It is also desirable to find how specific technologies are applied between agriculture and context awareness. Finally, clusters of commonly used terms within selected articles were generated to support the identification of academic research interest trends. Therefore, five questions were established and presented in Table 1.
References Questions
RQ1 Which technologies support precision agriculture?
RQ2 Where are these technologies being applied in precision agriculture?
RQ3 How is ubiquitous computing being used to support precision agriculture?
RQ4 Which are the main clusters of research that express the terms ubiquitous computing and precision agriculture?
RQ5 What is the number of publications per database and per year?
Source: own processingTable 1: Research questions.
Research process
Petersen et al. (2008) defined three stages of a research process: specify the search string, choose the databases to apply them and then get the results. The first stage starts by identifying the keywords and their related terms. In this study, we chose the keywords “Ubiquitous” and “Agriculture” and also other related terms, as indicated in Table 2.
Keyword Related terms
Ubiquitous Context-aware OR Context-sensitive OR Context awareness OR Pervasive OR Internet-of-things OR IoT
Agriculture Agronomy OR Soil
Source: own processingTable 2: Search terms.
These terms generated the following search string to be used in the search databases:((ubiquitous OR context-aware OR context-sensitive OR context awareness OR pervasive OR internet-of-things OR iot) AND (agriculture OR agronomy OR soil)). The term “soil” was inserted in the search string because the term “agriculture” covers other sub-areas of application, such as aquaponic, permaculture, indoors agriculture, organic, subsistence, among others. This enabled this study to filter only the works related to intensive agriculture applied to the soil; that is, that have high productivity, large extensions of land and the use of modern techniques and mechanizations.
Once the search string was defined, we constructed the research parameters to be used on the databases. In the second step, we selected eight re-search databases relevant to the area of computing, including the ACM Digital Library, Semantic Scholar (Citeseerx), Google Scholar, IEEE Xplore Digital Library, Scopus, Science Direct, Springer and Wiley Library. Research in the ACM Digital Library required the use of advanced search features, where each of our strings was inserted in the “Edit Query” tool. Similarly, this practice was applied in the Semantic Scholar (CiteSeerX), Google Scholar, IEEE Xplore and Scopus databases. Only in the Science Direct and Google Scholar base was the string applied in a simple search box that is available on the main page of these sites.
Filters application
To filter the most relevant works, we generated the following Inclusion Criteria (IC) for this selection:
[5]
Ubiquitous Computing in Precision Agriculture: A Systematic Review
–IC1: The study must be published in a conference proceeding or journal.
–IC2: The study must be related to the context of use of ubiquitous com-putting in agriculture.
–IC3: The study must be a full paper.
In turn, the Excluding Criteria (EC) were also defined, as follows:
–EC1: Studies published before 2009.
–EC2: Studies that are not written in English.
–EC3: Studies related to theses or dissertations.
–EC4: Studies that are not related to research questions.
The inclusion and exclusion criteria helped the filtering process to obtain the most relevant studies and to eliminate any noise generated during the search. The studies obtained in the search process were filtered, and those that did not fit in the inclusion criteria were removed. The articles were stored in the Mendeley Desktop© program and organized in specific folders to each database. The next step was to analyze the works by title and abstract, so that they could be later combined in the same folder. Six articles were added by heuristic because they are relevant for this study, even though they were not found during the search process.
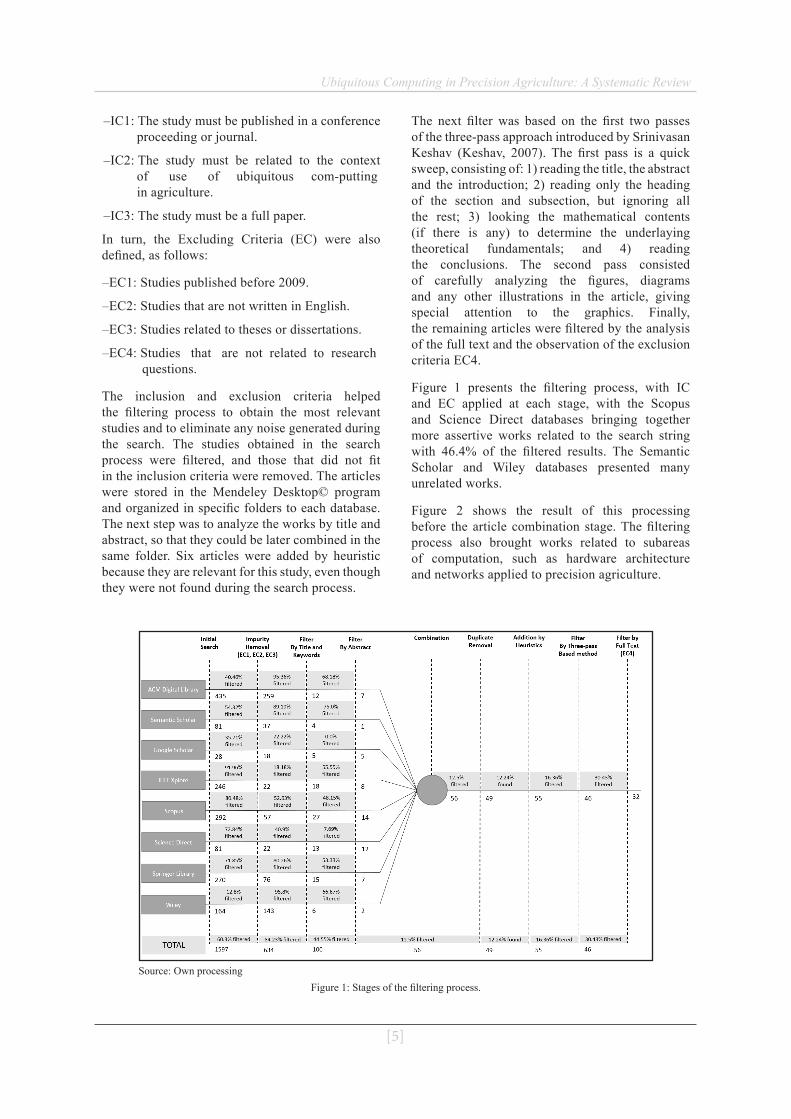
The next filter was based on the first two passes of the three-pass approach introduced by Srinivasan Keshav (Keshav, 2007). The first pass is a quick sweep, consisting of: 1) reading the title, the abstract and the introduction; 2) reading only the heading of the section and subsection, but ignoring all the rest; 3) looking the mathematical contents (if there is any) to determine the underlaying theoretical fundamentals; and 4) reading the conclusions. The second pass consisted of carefully analyzing the figures, diagrams and any other illustrations in the article, giving special attention to the graphics. Finally, the remaining articles were filtered by the analysis of the full text and the observation of the exclusion criteria EC4.
Figure 1 presents the filtering process, with IC and EC applied at each stage, with the Scopus and Science Direct databases bringing together more assertive works related to the search string with 46.4% of the filtered results. The Semantic Scholar and Wiley databases presented many unrelated works.
Figure 2 shows the result of this processing before the article combination stage. The filtering process also brought works related to subareas of computation, such as hardware architecture and networks applied to precision agriculture.
Source: Own processingFigure 1: Stages of the filtering process.

[6]
Ubiquitous Computing in Precision Agriculture: A Systematic Review
Threats to validity
As in any work involving a systematic review, this research presents some risks that can affect the obtained results. These risks are directly related to the data filtering process. To reduce the risk margin, this research searched data in nine different databases, selected from their relevance in the areas of ubiquitous computing and agriculture.
The research string was constructed considering the main terms and some related words to ensure the greatest possible coverage of keywords in the search, avoiding an ineffective search.
Source: Own processingFigure 2: Databases where the researches were found before
the combination stage.
The Petersen technique was used to mitigate the risk that important works may have been removed from the research (Petersen et al., 2008). During this process, articles were analyzed and selected without a reviewer. To reduce the risks that the results may have been affected, we used the review process already handled by other authors (Díaz et al., 2011; Vianna & Barbosa, 2017), we also used software that supports this selection process, especially the Mendeley Desktop© program.
Results and discussionThis section details the survey results obtained by reading and analyzing the 32 mapped studies. In addition, the research questions were answered and additional discussions and analysis on the studies were presented.
RQ1 – Which technologies support precision agriculture?
The technologies that support precision agriculture were analyzed and categorized as IoT & Sensors Applications, Architecture Model, Semantic
& Ontology and, finally, Wireless Network Sensor (WSN). Table 3 maps the works with their categorization.
Based on this question, most of articles focused on WSN. There is a big difference between IoT and WSN, which causes these terms to have been categorized separately. In an IoT system, all of the sensors directly send their information to the Internet, such as soil temperature and moisture. In this case, a direct connection to the Internet will be open immediately or periodically to synchronize data. Already in a WSN, the various sensors connect to some kind of router or central node. A large collection of sensors, as in a mesh network, can be used to individually gather data and send data through a router to the Internet in an IoT system. In other words, WSN is a subset of IoT.
Source: Own processingTable 3: Technologies that support precision agriculture.
Technology Articles Percentual
IoT and Sensors
(Nash, Korduan et al., 2009), (Córdoba, Bruno et al., 2013), (Stojanovic, Falconer et al., 2017), (Phillips, Newlands et al., 2014), (Georgakopoulos and Jayaraman, 2016), (Tzounis, Katsoulas et al., 2017), (Shao, Meng et al., 2017), (Aswathy and Malarvizhi, 2018), (Dobrescu, Merezeanu et al., 2019), (AlZu’bi, Hawashin et al., 2019)
31.25%
Architecture Model
(Steinberger, Rothmund et al., 2009), (Cho, Moon et al., 2011), (Kaloxylos, Groumas et al., 2014), (Lopes, Souza et al., 2014), (Gelogo, Un-Bae et al., 2014), (Babou, Sane et al., 2019), (Jearanaiwongkul, Andres et al., 2019), (Cho, 2019)
25.00%
Semantic and Ontology
(Sivamani, Bae et al., 2013), (Schuster, Lee et al., 2011) 6.25%
WSN
(Lee, Hwang et al., 2010), (Díaz, Pérez et al., 2011), (Sabri, Aljunid et al., 2012), (Kaloxylos, Eigenmann et al., 2012), (Rawat, Singh et al., 2014), (Shi, Li et al., 2014), (Ndzi, Harun et al., 2014), (Bhanu, Reddy et al., 2019), (Simbeye, 2020), (Ali, Ming et al., 2017), (Sivamani, Choi et al., 2018), (Keswani, Mohapatra et al., 2019)
37.50%
[7]
Ubiquitous Computing in Precision Agriculture: A Systematic Review
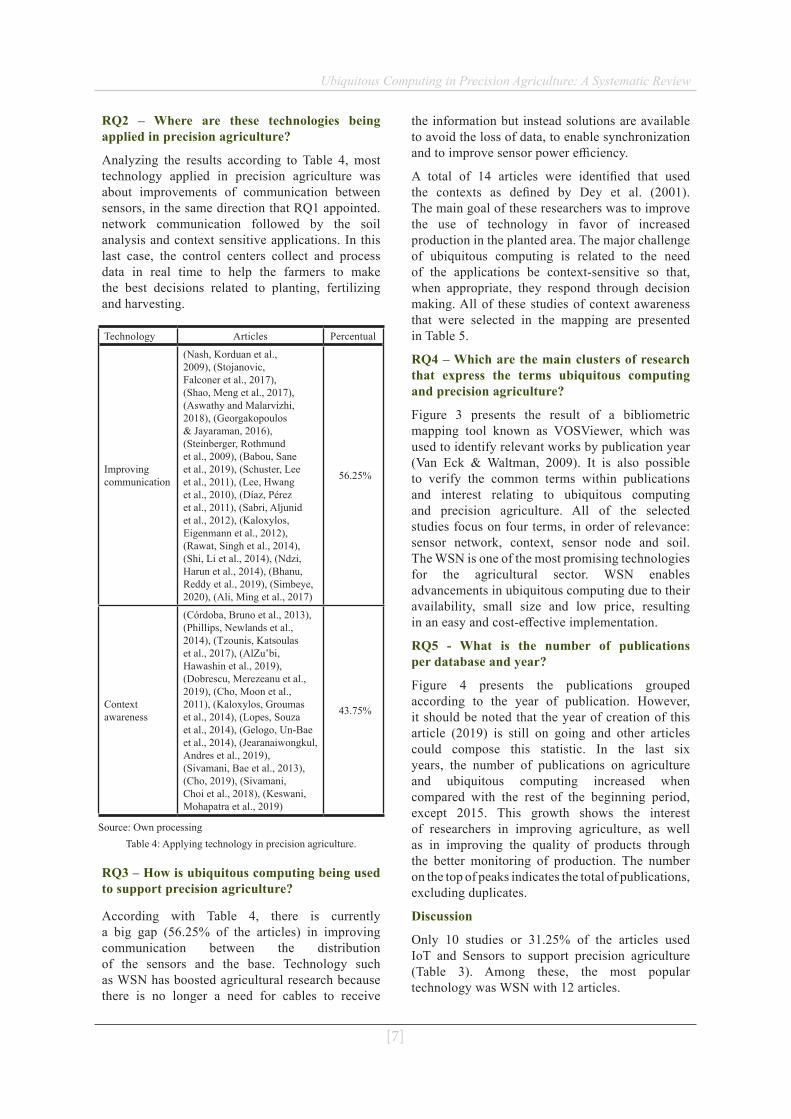
RQ2 – Where are these technologies being applied in precision agriculture?
Analyzing the results according to Table 4, most technology applied in precision agriculture was about improvements of communication between sensors, in the same direction that RQ1 appointed. network communication followed by the soil analysis and context sensitive applications. In this last case, the control centers collect and process data in real time to help the farmers to make the best decisions related to planting, fertilizing and harvesting.
Source: Own processingTable 4: Applying technology in precision agriculture.
Technology Articles Percentual
Improving communication
(Nash, Korduan et al., 2009), (Stojanovic, Falconer et al., 2017), (Shao, Meng et al., 2017), (Aswathy and Malarvizhi, 2018), (Georgakopoulos & Jayaraman, 2016), (Steinberger, Rothmund et al., 2009), (Babou, Sane et al., 2019), (Schuster, Lee et al., 2011), (Lee, Hwang et al., 2010), (Díaz, Pérez et al., 2011), (Sabri, Aljunid et al., 2012), (Kaloxylos, Eigenmann et al., 2012), (Rawat, Singh et al., 2014), (Shi, Li et al., 2014), (Ndzi, Harun et al., 2014), (Bhanu, Reddy et al., 2019), (Simbeye, 2020), (Ali, Ming et al., 2017)
56.25%
Context awareness
(Córdoba, Bruno et al., 2013), (Phillips, Newlands et al., 2014), (Tzounis, Katsoulas et al., 2017), (AlZu’bi, Hawashin et al., 2019), (Dobrescu, Merezeanu et al., 2019), (Cho, Moon et al., 2011), (Kaloxylos, Groumas et al., 2014), (Lopes, Souza et al., 2014), (Gelogo, Un-Bae et al., 2014), (Jearanaiwongkul, Andres et al., 2019), (Sivamani, Bae et al., 2013), (Cho, 2019), (Sivamani, Choi et al., 2018), (Keswani, Mohapatra et al., 2019)
43.75%
RQ3 – How is ubiquitous computing being used to support precision agriculture?
According with Table 4, there is currently a big gap (56.25% of the articles) in improving communication between the distribution of the sensors and the base. Technology such as WSN has boosted agricultural research because there is no longer a need for cables to receive
the information but instead solutions are available to avoid the loss of data, to enable synchronization and to improve sensor power efficiency.
A total of 14 articles were identified that used the contexts as defined by Dey et al. (2001). The main goal of these researchers was to improve the use of technology in favor of increased production in the planted area. The major challenge of ubiquitous computing is related to the need of the applications be context-sensitive so that, when appropriate, they respond through decision making. All of these studies of context awareness that were selected in the mapping are presented in Table 5.
RQ4 – Which are the main clusters of research that express the terms ubiquitous computing and precision agriculture?
Figure 3 presents the result of a bibliometric mapping tool known as VOSViewer, which was used to identify relevant works by publication year (Van Eck & Waltman, 2009). It is also possible to verify the common terms within publications and interest relating to ubiquitous computing and precision agriculture. All of the selected studies focus on four terms, in order of relevance: sensor network, context, sensor node and soil. The WSN is one of the most promising technologies for the agricultural sector. WSN enables advancements in ubiquitous computing due to their availability, small size and low price, resulting in an easy and cost-effective implementation.
RQ5 - What is the number of publications per database and year?
Figure 4 presents the publications grouped according to the year of publication. However, it should be noted that the year of creation of this article (2019) is still on going and other articles could compose this statistic. In the last six years, the number of publications on agriculture and ubiquitous computing increased when compared with the rest of the beginning period, except 2015. This growth shows the interest of researchers in improving agriculture, as well as in improving the quality of products through the better monitoring of production. The number on the top of peaks indicates the total of publications, excluding duplicates.
Discussion
Only 10 studies or 31.25% of the articles used IoT and Sensors to support precision agriculture (Table 3). Among these, the most popular technology was WSN with 12 articles.

[8]
Ubiquitous Computing in Precision Agriculture: A Systematic Review
Source: Own processingTable 5: Filtered works relation.
Reference Objective
(Córdoba, Bruno et al., 2013) This work proposed and illustrated the implementation of a new method for delineation of management areas using satellite images to understand spatial variation within a field and to optimize the use of agricultural inputs (seeds, agrochemicals and soil amendments).
(Phillips, Newlands et al., 2014) This work discussed a series of key recommendations for monitoring the soil moisture dynamics at a field scale to integrate with remote sensing and decision support models. It also concluded that for integrated sensing to be utilized for long-term operational monitoring and decision support web services, soft-ware tools and analysis tools need to be developed. Thus, data from multiple sources could be analyzed and integrated with various models for crop production, food security and environ-mental change.
(Tzounis, Katsoulas et al., 2017) This work presented an overview of recent IoT technologies, their current penetration in the agricultural sector, their potential value for future farmers and the challenges that IoT faces for its propagation in order to optimize production by many ways, including distributed and pervasive computing
(Dobrescu, Merezeanu et al., 2019) This work controlled and monitored an irrigation system connected to an IoT platform to promote the integration of sensor networks and the Cloud. For these tasks, it was necessary to guarantee semantic interoperability, develop context recognition middleware, implement a structure for real-time control development, and maintain a monitoring management.
(AlZu’bi, Hawashin et al., 2019) In this work, yellowing leaves and sprinkles in the soil have been observed using multimedia sensors to detect the level of plant thirstiness in smart farming. The experimental results showed that the use of deep learning proves to be superior in the Internet of Multimedia Things environment to optimize the irrigation process.
(Cho, Moon et al., 2011) This research used context-aware technologies and Web ser-vices technologies in agriculture environments to make the working process of environments more autonomous and intelligent. The suggested service model offers a smart service model based on a context-aware workflow through an entity, an RDF-based constraint and rule-based operators
(Kaloxylos, Groumas et al., 2014) This work developed an open architecture that embodies do-main independent, customizable work environment through web. It also introduced a number of innovative concepts such as the notion of a services’ marketplace, network awareness in order for the system to adapt in malfunctioning Internet links and identification of malfunctioning sensor components
(Lopes, Souza et al., 2014) This work approached an architecture for situational awareness called EXEHDA-SA (Execution Environment for Highly Distributed Applications-Situation Awareness), which supports the acquisition, processing and dissemination of contextual in-formation in a distributed way, independently of the application, in a perspective based on rules and autonomy.
(Gelogo, Un-Bae et al., 2014) This study proposed a design of u-farm mobile application framework performing environmental (temperature, water level, humidity, plant growth and etc.) sensing capability. The main goal is real-time monitoring, alerts and statistical analysis of crop conditions and environmental factors through a generation of keywords. The keywords will then be sent to the knowledge expert system for analysis
(Jearanaiwongkul, Andres et al., 2019)
This work recommends that disease treatments for farmers plants must be considered from a set of related observations. Thus, it developed a theoretical framework for systems to man-age a farmer’s observation data. It introduced the representation of observation data, called warn cons, based on the user’s context information aiming to create a representation of the advice data
(Sivamani, Bae et al., 2013) This work proposed a context model with OWL based ontology to aid the relationship between the domain factors; that is, to define a pattern between system and services. The suggested model is analyzed and derived with the set of concepts such as location, user, system, context, environmental parameter, user and network. The basic concepts proposed in this work can be reused and extended for agricultural-based smart environments
(Cho, 2019) This study proposes a smart farming education service to disseminate solutions to the farmers to help their decision-making in farm management. This work achieves an ubiquitous environment where the farmers have interactive access to a variety of multimedia based materials to help develop their management proficiency
(Sivamani, Choi et al., 2018) This paper proposed a vertical farm ontology. The suggested context model uses OWL based ontology to define common understanding and relationship between the system and services. With the proposed model, the information from the Internet of Things is recomposed as context information and made understandable for the other systems. The basic concepts proposed here can be reused and extended for agricultural-based smart environments.
(Keswani, Mohapatra et al., 2019) This work summarizes the optimum usage of irrigation by the precise management of a water valve using neural network-based prediction of the soil’s water requirement. The irrigation valve control commands were successfully generated with fuzzy logic weather model to fulfil uniform farm irrigation requirement under almost all-weather conditions and in regions with water deficiency.
Table 4 shows that improving communication with WSN was the most relevant theme in the last 10 years. In terms of context awareness, the use of sensors to detect soil moisture for automated irrigation was found in five articles (Gelogo et al.,
2014; Stojanovic et al., 2017; AlZu’bi et al., 2019; Dobrescu et al., 2019; Keswani et al., 2019). However, the use of images in agriculture was found in only one article (Córdoba et al., 2013). This technique is increasing recently through the use

[9]
Ubiquitous Computing in Precision Agriculture: A Systematic Review
of drones and also because the diversity of information that can be obtained with this equipment, such as detecting plant species, plant size, fruit color and plant diseases (Parisi et al., 2019).
By analyzing the entire filtering process presented in Figure 1 and the Research Question 1 (RQ 1), which presents in which databases the articles were published, it is possible to verify that the most accurate databases that processed the query string were Google Scholar and Science Direct because they had a small number of articles in the initial
survey but have a relatively high number when compared to the total articles used in the mapping. The least accurate database was Semantic Scholar - of the 81 papers in the initial search, only one study was used after the last filtering.
ConclusionThis systematic review has presented the state-of-the-art in the application of ubiquitous computing in precision agriculture. Furthermore, it also presented different applications
Source: Own processingFigure 3: Density of research clusters by publication year.
Source: Own processingFigure 4: Number of publications between 2009 and 2019.

[10]
Ubiquitous Computing in Precision Agriculture: A Systematic Review
of technologies associated with computing for better results in agricultural production.
Although many of the selected papers aim to solve WSN problem, one of the gaps that was found during the evaluation of this research corresponds to the application of historical data in precision agriculture. In particular, none of the articles mentioned the use of a historical database and how this collected data could effectively improve production with the support of mobile technology.
Contextual data could lead to a three-dimensional spatial variability of soil conditions, such as fertility, moisture, pH, macro and micronutrients, and other soil attributes. This type of visualization was approached by Stojanovic using yield data (Stojanovic et al., 2017).
The history of contextual data could support decision-making on the farm. In this sense, the formalization of a context (Dey et al., 2001) applied to precision agriculture would allow the generation of context histories (Rosa et al.,
2015) related to a whole plantation or areas of it. This data could be analyzed to generate context pre-dictions (da Rosa et al., 2016) of soil conditions. Therefore, the right moment for agricultural inputs distribution, such as pesticides and fertilizers, could be determined, in addition to uniformity in productivity.
AcknowledgementsThis study was financed in part by the Coordenação de Aperfeiçoamento de Pessoal de Nível Superior - Brasil (CAPES) - Finance Code 001, Fundação de Amparo à Pesquisa do Estado do Rio Grande do Sul - Fapergs/Brasil (http://www.fapergs.rs.gov.br), and Conselho Nacional de Desenvolvimento Científico e Tecnológico - CNPq/Brasil (http://www.cnpq.br). We would also like to thank the University of Vale do Rio dos Sinos - Unisinos (http://www.unisinos.br) and University of Santa Cruz do Sul – Unisc (http://www.unisc.br) for embracing this research.
Corresponding authorsGilson Augusto Helfer Applied Computing Graduate Program, University of Vale do Rio dos Sinos, UNISINOSSão Leopoldo, BrazilE-mail: [email protected]
References[1] Ali, A., Ming, Y., Chakraborty, S. and Iram, S. (2017) "A comprehensive survey
on real-time applications of WSN”, Future Internet, Vol. 9, No 4, pp. 77. ISSN 1999-5903. DOI 10.3390/fi9040077.
[2] AlZu’bi, S., Hawashin, B., Mujahed, M., Jararweh, Y. and Gupta, B. B. (2019) "An efficient employment of internet of multimedia things in smart and future agriculture”, Multimedia Tools and Applications, pp. 1-25. ISSN 1380-7501. DOI 10.1007/s11042-019-7367-0.
[3] Aswathy, R. H. & Malarvizhi, N. (2018) „Internet of things (IoT): a survey on protocols and security risks”, International Journal of Engineering and Technology, Vol. 7 No. 1.7, pp. 6. ISSN 2227-524X. DOI 10.14419/ijet.v7i1.7.9380.
[4] Babou, C. S. M., Sane, B. O., Diane, I. and Niang, I. (2019) "Home Edge Computing Architecture for Smart and Sustainable Agriculture and Breeding”, Proceedings of the 2nd International Conference on Networking, Information Systems & Security, pp. 45. ACM. ISBN 978-1-4503-6645-8. DOI 10.1145/3320326.3320377.
[5] Bhanu, K., Reddy, T. B. and Hanumanthappa, M. (2019) "Multi-agent based context aware information gathering for agriculture using Wireless Multimedia Sensor Networks”, Egyptian Informatics Journal, Vol. 20, No. 1, pp.33-44. ISSN 1110-8665. DOI 10.1016/j.eij.2018.07.001.
[6] Bonfante, A., Sellami, M., Saab, M. A., Albrizio, R., Basile, A., Fahed, S., Giorio, P., Langella, G., Monaco, E. and Bouma, J. (2017) "The role of soils in the analysis of potential agricultural production: A case study in Lebanon”, Agricultural systems, Vol. 156, pp. 67-75. ISSN 0308-521X. DOI 10.1016/j.agsy.2017.05.018.
[11]
Ubiquitous Computing in Precision Agriculture: A Systematic Review
[7] Cho, S., Chung H., Dongil K. and Soonghee L. (2019). „Smart Farming Education Service based on u-learning environment”, Proceedings of the 21st International Conference on Advanced Communication Technology, pp. 471-474. IEEE. ISBN 979-11-88428-02-1. DOI 10.23919/ICACT.2019.8701949.
[8] Cho, Y., Moon, J., Kim, I., Choi, J. and Yoe, H. (2011) „Towards a smart service based on a context-aware workflow model in u-agriculture”, International Journal of Web and Grid Services, Vol. 7, No. 2, pp. 117-133. ISSN 1741-1106. DOI 10.1504/IJWGS.2011.040444.
[9] Ciaramella, A., Cimino, M. G., Lazzerini, B. and Marcelloni, F. (2010) "Using context history to personalize a resource recommender via a genetic algorithm”, Proceedings of the 10th International Conference on Intelligent Systems Design and Applications, IEEE, pp. 965-970. ISBN 978-1-4244-8134-7. DOI 10.1109/ISDA.2010.5687064.
[10] Cooper, I. D. (2016) "What is a mapping study?“, Journal of the Medical Library Association, Vol. 104, No. 1, pp. 76. ISSN 1536-5050. DOI 10.3163/1536-5050.104.1.013.
[11] Córdoba, M., Bruno, C., Costa, J. and Balzarini, M. (2013) "Subfield management class delineation using cluster analysis from spatial principal components of soil variables“, Computers and Electronics in Agriculture, Vol. 97, pp. 6-14. ISSN 0168-1699. DOI 10.1016/j.compag.2013.05.009.
[12] Costa, N. R., de Passos, M., Dal Bem, E. A., Dalchiavon, F. C. and Caldas, R. R. (2014) "Produtividade de laranja correlacionada com atributos químicos do solo visando a zonas específicas de manejo“, Pesquisa Agropecuária Tropical, Vol. 44, No. 4, pp. 391-398. ISSN 1983-4063. DOI 10.1590/S1983-40632014000400001.
[13] da Rosa, J. H., Barbosa, J. L. and Ribeiro, G. D. (2016) "ORACON: An adaptive model for context prediction”, Expert Systems with Applications, Vol. 45, pp. 56-70. ISSN 0957-4174. DOI 10.1016/j.eswa.2015.09.016.
[14] Dey, A. K., Abowd, G. D. and Salber, D. (2001) "A conceptual framework and a toolkit for supporting the rapid prototyping of context-aware applications”, Human–Computer Interaction, Vol. 16, No. 2-4, pp. 97-166. ISSN 0737-0024. DOI 10.1207/S15327051HCI16234_02.
[15] Díaz, S. E., Pérez, J. C., Mateos, A. C., Marinescu, M.-C. and Guerra, B. B. (2011) "A novel methodology for the monitoring of the agricultural production process based on wireless sensor networks”, Computers and electronics in agriculture, Vol. 76, No. 2, pp. 252-265. ISSN 0168-1699. DOI 10.1016/j.compag.2011.02.004.
[16] Dobrescu, R., Merezeanu, D. and Mocanu, S. (2019) "Context-aware control and monitoring system with IoT and cloud support”, Computers and Electronics in Agriculture, Vol. 160, pp. 91-99. ISSN 0168-1699. DOI 10.1016/j.compag.2019.03.005.
[17] Gelogo, Y. E., Un-Bae, J., Woo-Jo, J. and Kim, H.-K. (2014) "Development of u-farm Mobile Application Architecture”, Conference: Advanced Software Engineering & Its Applications, Vol. 74, pp. 132-137.
[18] Georgakopoulos, D. and Jayaraman, P.P. (2016) "Internet of things: from internet scale sensing to smart services”, Computing, Vol. 98, No. 10, pp. 1041-1058. ISSN 0010-485X. DOI 10.1007/s00607-016-0510-0.
[19] Hong, J., Suh, E.-H., Kim, J. and Kim, S. (2009) "Context-aware system for proactive personalized service based on context history”, Expert Systems with Applications, Vol. 36 No. 4, pp. 7448-7457. ISSN 0957-4174. DOI 10.1016/j.eswa.2008.09.002.
[20] Jearanaiwongkul, W., Andres, F. and Anutariya, C. (2019) "A Formal Model for Managing Multiple Observation Data in Agriculture”, International Journal of Intelligent Information Technologies (IJIIT), Vol. 15, No. 3, pp. 79-100. ISSN 1548-3657. DOI 10.4018/IJIIT.2019070105.
[21] Kaloxylos, A., Eigenmann, R., Teye, F., Politopoulou, Z., Wolfert, S., Shrank, C., Dillinger, M., Lampropoulou, I., Antoniou, E. and Pesonen, L. (2012) "Farm management systems and the Future Internet era”, Computers and Electronics in Agriculture, Vol. 89, pp. 130-144. ISSN 0168-1699. DOI 10.1016/j.compag.2012.09.002.
[12]
Ubiquitous Computing in Precision Agriculture: A Systematic Review
[22] Kaloxylos, A., Groumas, A., Sarris, V., Katsikas, L., Magdalinos, P., Antoniou, E., Politopoulou, Z., Wolfert, S., Brewster, C. and Eigenmann, R. (2014) "A cloud-based Farm Management System: Architecture and implementation”, Computers and Electronics in Agriculture, Vol. 100, pp. 168-179. ISSN 0168-1699. DOI 10.1016/j.compag.2013.11.014.
[23] Keshav, S. (2007) "How to read a paper”, ACM SIGCOMM Computer Communication Review, Vol. 37, No. 3, pp. 83-84. ISSN 0146-4833. DOI 10.1145/1273445.1273458.
[24] Keswani, B., Mohapatra, A. G., Mohanty, A., Khanna, A., Rodrigues, J. J., Gupta, D. and de Albuquerque, V. H. C. (2019) "Adapting weather conditions based IoT enabled smart irrigation technique in precision agriculture mechanisms”, Neural Computing and Applications, Vol. 31, No. 1, pp. 277-292. ISSN 0941-0643. DOI 10.1007/s00521-018-3737-1.
[25] Kitchenham, B. and Charters, S. (2007) "Guidelines for performing systematic literature reviews in software engineering", Software Engineering Group - Keele University, Department of Computer Science - University of Durham, UK, Jul. 2007. [Online]. Available: http://citeseerx.ist.psu.edu/viewdoc/citations?doi=10.1.1.117.471 [Accessed: 25 May, 2019].
[26] Lee, H.-C., Hwang, J.-H. and Yoe, H. (2010) "Energy efficient MAC protocol for ubiquitous agriculture”, International Journal of Smart Home, Vol. 4, No. 3, pp. 15-26. ISSN 19754094. DOI 10.1007/978-3-642-17569-5_63.
[27] Lopes, J., Souza, R., Gadotti, G., Pernas, A., Yamin, A. and Geyer, C. (2014) "An architectural model for situation awareness in ubiquitous computing”, IEEE Latin America Transactions, Vol. 12 No. 6, pp. 1113-1119. ISSN 1548-0992. DOI 10.1109/TLA.2014.6894008.
[28] Nash, E., Korduan, P. and Bill, R. (2009) "Applications of open geospatial web services in precision agriculture: a review”, Precision Agriculture, Vol. 10, No. 6, pp. 546. ISSN 1573-1618. DOI 10.1007/s11119-009-9134-0.
[29] Ndzi, D. L., Harun, A., Ramli, F. M., Kamarudin, M. L., Zakaria, A., Shakaff, A. Y. M., Jaafar, M. N., Zhou, S. and Farook, R. S. (2014) "Wireless sensor network coverage measurement and planning in mixed crop farming”, Computers and Electronics in Agriculture, Vol. 105, pp. 83-94. ISSN 0168-1699. DOI 10.1016/j.compag.2014.04.012.
[30] Parisi, E., Suma, M., Korumaz, A.G., Rosina, E. and Tucci, G. (2019) "Aerial Platforms (uav) “Surveys in the vis and TIR Range. Applications on Archaeology and Agriculture”, International Archives of the Photogrammetry, Remote Sensing and Spatial Information Sciences, Vol. 42(2/W11). ISSN 2194-9034. DOI 10.5194/isprs-archives-XLII-2-W11-945-2019.
[31] Petersen, K., Feldt, R., Mujtaba, S. and Mattsson, M. (2008) "Systematic mapping studies in software engineering”, Proceedings of the 12th International Conference on Evaluation and Assessment in Software Engineering, pp. 68-77. [Online]. Available: http://dl.acm.org/citation.cfm?id=2227115.2227123 [Accessed: 25 May. 2019].
[32] Phillips, A. J., Newlands, N. K., Liang, S. H. and Ellert, B. H. (2014) "Integrated sensing of soil moisture at the field-scale: Measuring, modeling and sharing for improved agricultural decision support”, Computers and Electronics in Agriculture, Vol. 107, pp. 73-88. ISSN 0168-1699. DOI 10.1016/j.compag.2014.02.011.
[33] Rawat, P., Singh, K. D., Chaouchi, H. and Bonnin, J. M. (2014) "Wireless sensor networks: a survey on recent developments and potential synergies”, The Journal of Supercomputing, Vol. 68, No. 1, pp. 1-48. ISSN 0920-8542. DOI 10.1007/s11227-013-1021-9.
[34] Rosa, J. H., Barbosa, J. L., Kich, M. and Brito, L. (2015) "A multi-temporal context-aware system for competences management”, International Journal of Artificial Intelligence in Education, Vol. 25 No. 4, pp. 455-492. ISSN 1560-4292. DOI 10.1007/s40593-015-0047-y.
[35] Sabri, N., Aljunid, S. A., Ahmad, R. B., Malek, M., Yahya, A., Kamaruddin, R. andf Salim, M. (2012) "Smart prolong fuzzy wireless sensor-actor network for agricultural application”, Journal of Information Science and Engineering, Vol. 28, No. 2, pp. 295-316. ISSN 1016-2364
[13]
Ubiquitous Computing in Precision Agriculture: A Systematic Review
[36] Satyanarayanan, M. (2001) "Pervasive computing: Vision and challenges”, IEEE Personal Communications, Vol. 8, No. 4, pp. 10-17. ISSN 1070-9916. DOI 10.1109/98.943998.
[37] Schuster, E. W., Lee, H.-G., Ehsani, R., Allen, S. J. and Rogers, J. S. (2011) "Machine-to-machine communication for agricultural systems: An XML-based auxiliary language to enhance semantic interoperability”, Computers and electronics in agriculture, Vol. 78, No. 2, pp. 150-161. ISSN 0168-1699. DOI 10.1016/j.compag.2011.07.002.
[38] Shao, J., Meng, W. and Sun, G. (2017) "Evaluation of missing value imputation methods for wireless soil datasets”, Personal and Ubiquitous Computing, Vol. 21, No. 1, pp. 113-123. ISSN 1617-4909. DOI 10.1007/s00779-016-0978-9.
[39] Shi, H.-L., Li, D., Qiu, J.-F., Hou, C.-D. and Cui, L. (2014) "A task execution framework for cloud-assisted sensor networks”, Journal of Computer Science and Technology, Vol. 29, No. 2, pp. 216-226. ISSN 1000-9000. DOI 10.1007/s11390-014-1424-y.
[40] Simbeye, D. S. (2020) "Deployment of Wireless Sensor Networks for Soil Macronutrients Measurements in Farms”, Proceedings of the International Journal of ICT Research in Africa and the Middle East, pp. 332-346. IGI Global. ISSN 2472-3126. DOI 10.4018/IJICTRAME.2016070103.
[41] Sivamani, S., Bae, N. and Cho, Y. (2013) "A smart service model based on ubiquitous sensor networks using vertical farm ontology”, International Journal of Distributed Sensor Networks, Vol. 9, No. 12. ISSN 1550-1477. DOI 10.1155/2013/161495.
[42] Sivamani, S., Choi, J., Bae, K., Ko, H. and Cho, Y. (2018) "A smart service model in greenhouse environment using event‐based security based on wireless sensor network”, Concurrency and Computation: Practice and Experience, Vol. 30, No. 2. ISSN 1550-1477. DOI 10.1002/cpe.4240.
[43] Steinberger, G., Rothmund, M. and Auernhammer, H. (2009) "Mobile farm equipment as a data source in an agricultural service architecture”, Computers and Electronics in Agriculture, Vol. 65, No. 2, pp. 238-246. ISSN 0168-1699. DOI 10.1016/j.compag.2008.10.005.
[44] Stojanovic, V., Falconer, R.E., Isaacs, J., Blackwood, D., Gilmour, D., Kiezebrink, D. and Wilson, J. (2017) "Streaming and 3D mapping of AGRI-data on mobile devices”, Computers and Electronics in Agriculture, Vol. 138, pp. 188-199. ISSN 0168-1699. DOI 10.1016/j.compag.2017.03.019.
[45] Tzounis, A., Katsoulas, N., Bartzanas, T. and Kittas, C. (2017) "Internet of Things in agriculture, recent advances and future challenges”, Biosystems Engineering, Vol. 164, pp. 31-48. ISSN 1537-5110. DOI 10.1016/j.biosystemseng.2017.09.007.
[46] Van Eck, N. and Waltman, L. (2009) "Software survey: VOSviewer, a computer program for bibliometric mapping”, Scientometrics, Vol. 84, No. 2, pp. 523-538. ISSN 1588-2861. DOI 10.1007/s11192-009-0146-3.
[47] Vianna, H. D. and Barbosa, J. L. V. (2017) "In search of computer-aided social support in non-communicable diseases care”, Telematics and Informatics, Vol. 34, No. 8, pp. 1419-1432. ISSN 0736-5853. DOI 10.1016/J.TELE.2017.06.005.
[48] Weiser, M. (1999) "The computer for the 21st century”, ACM SIGMOBILE mobile computing and communications review, Vol. 3, No. 3, pp. 3-11. ISSN 1559-1662. DOI 10.1145/329124.329126.

[14]
[15]
Agris on-line Papers in Economics and Informatics
Volume XI Number 4, 2019
Evaluation of Economic Efficiency of Selected Branch in Animal Production in EU and CRMarie Janecká1, Jaroslav Homolka1, Pavla Hošková2, Jiří Mach1, Marek Dvořák3
1 Department of Economics, Faculty of Economics and Management, Czech University of Life Sciences Prague, Czech Republic
2 Department of Statistics, Faculty of Economics and Management, Czech University of Life Sciences Prague, Czech Republic
3 Department of Management, Faculty of Economics and Management, Czech University of Life Sciences Prague, Czech Republic
AbstractThe main aim is a verification whether dairy cow breeders in the Czech Republic are able to compete and have the same conditions for milk production as the state of European Union after the Czech Republic´s accession to the European Union. This evaluation is above all in the main cost items for milk depending on the amount of milk yield of cows. A partial aim is an evaluation of development of number of dairy cows and milk production in the monitored period 2000 – 2015. This judgement is used for monitoring of effects of quotas on the number and production part of dairy cows. Also the development of milk purchase prices was evaluated in the original EU 15 states and the Czech Republic. Within the evaluation of the main aim, four main cost items influencing the total dairy cow breeding were judged. The main items are costs for feed, labour costs, costs for veterinary care, and cost for breeding services. This main cost items have an effect beside the milk production on the health state of dairy cows and on reproduction because with the right function of reproductive organs a new onset of lactation curve happens and thereby an induction of higher milk yields with use of high-quality feeds. The used data are based on interview survey in milk producers.
KeywordsDairy cow, cost for feeds, labour costs, cost for veterinary care, breeding costs, price, Czech Republic, European Union, planning, predicting.
Janecká, M., Homolka, J., Hošková, P., Mach, J. and Dvořák, M. (2019) “Evaluation of Economic Efficiency of Selected Branch in Animal Production in EU and CR", AGRIS on-line Papers in Economics and Informatics,Vol. 11, No. 4, pp. 15-30. ISSN 1804-1930. DOI 10.7160/aol.2019.110402.
Introduction Cattle breeding and milk production always were and still are the irreplaceable part in human nutrition all over the world. However, this branch underwent many major structural and organizational changes in the last years. Above all, it was dealt with changes caused by the Czech Republic´s accession in the European Union when within the Common Agricultural Policy the cattle breeding had to comply with the same rules ad also other member states keep. It was deal mainly with an intervention influencing a volume of milk production by the help of production quotas.
The European Union supports development of agriculture and country by means
of the Common Agricultural Policy (Novotníková, 2008). The Common Agricultural Policy represents a complex of mutually connected principles creating together a system enabling the Union to manage agriculture of the whole common market (Fiala, 2003).
In CAP conception, regulatory mechanisms were introduced which the Commission could use for an emergency intervention1 in case of partial overproduction (Holman, 2004). The CAP mechanism intervenes in circumstances on the agricultural markets in a very elaborated system of tools (Jakš, 1998). According to Baldwin
1 Intervention or action of economic authority in favour of aims which it prefers in macroeconomic scale .

[16]
(2004), the CAP is still very controversial. It doesn´t stop to absorb approximately a half of EU budget in spite of that most farmers complains about a lack of support and many of them leave the agricultural sector completely.
The milk quota system was cancelled to the 31.3.2015. A dairy parcel elaborated by the Commission and recommended to the EU states for a realization in the period without quotas influences the milk production problems minimally. Therefore, particular states prepares for this situation individually whereas the main producers (Germany, France, Denmark, Ireland and other) consider an increase in number of dairy cows and milk production (Kvapilík, Růžička, Bucek, 2014). However, indicators of milk production will not develop according to prognoses and calculations after cancellation of quotas either in the EU or in the CR, but on base of development of many factors in the world, in the EU and in the CR (Kvapilík, Růžička, Bucek, 2015). Nevertheless, the European dairy association stresses the profoundly favourable prospects for EU dairy on the medium and long term demand and states that milk is the while gold of the next ten years. It is expected that dairy markets will be mainly driven by Asia and Africa. Obviously, it is clear that the milk quota system, which was introduced on the 2nd April 1984 under the Dairy Produce Quota Regulations, made sense at a time when EU production far outstripped demand (Koeleman, 2015).
Changes in conditions of cattle milk production in the European Union in 2015 will substantially influence a relative significance of milk production characteristics in a breeding intention of Czech milk cattle population. The milk price system is the most important factor influencing a relative weight of milk volume, per cent of fat and proteins, occurrence of CM and SCS in breeding aim (Wolfova, 2006).
Considering the fact that agricultural policy of the European Union focused on market liberalization and decrease of rewards to agriculturists, incomes of producers from sale of milk and meat, and economic profitability decreased; enterprises with dairy or double-purpose cows were more dependent on minimization of production costs. An improvement of animals for so called function characters is one of ways to reduce costs (Miglior et al., 2005; Wolfova, 2006).
The aim of every milk producer is to produce a sufficient amount of milk for creation
of an income that is able to keep a demanded lifestyle and to cover the main costs for milk production which are especially cost for feeding (Tozer at al., 2003). According to Poděbradský (1999), the economics of all manipulation with milk is characterized by a product vertical. It can be defined as a stream, a way of production from its development, research, biological and technical solution, through a mass agricultural production, it processing in a final product including its sale to the consumer. So, it is not dealt with organizational, but technological interconnection (Peterová, 2008). According to Kudrna (1998) it is necessary to consider the production vertical, starting with production of feeds and ending with sale of an animal product, as unified when particular parts of the production hand over gradually besides a natural amount also costs expended for them till this time and this until the moment when the whole production process is terminated with a sale of the final product.
For the economics of the entire production vertical it is decisive a consumer price on one hand and all costs expended within the process of production, processing, and trade activity on the other hand.
For an evaluation of economic impacts of fluctuation of animal efficiency resulting from various alternative strategies of genetic selection it is necessary a complex multidisciplinary system approach including effects on all main components of agricultural enterprises, inclusive of incomes from production as well as variable and fix costs. The agricultural policy has main consequences for development of production systems (Mc Carthy, 2007).
Monitoring of production economics is the basic element of farm management and a condition for achievement of maximal yields from expended incomes (Lawson et al., 2004).
Economic results of animal production are created again by mutually interconnected characteristics:
a) average efficiency per 1 feeding ration b) qualitative parameters of productionc) ratio of market production to the total
production – marketability of the branchd) achieved realization pricee) costs connected with achievement of this
production.
Milked cows are economically, labour intensive, and organizationally the most demanding category of farm animals raised in agricultural enterprises (Kvapilík, 2008). I cattle profit can be gained only at the time when all breeding factors, i.e. genetics,
Evaluation of Economic Efficiency of Selected Branch in Animal Production in EU and CR
[17]
Evaluation of Economic Efficiency of Selected Branch in Animal Production in EU and CR
right nutrition, good management, and human factor (nursing, zootechnical, and veterinary care) and optimal breeding environment in a perfect balance (Doležal and Staněk, 2015). Also the dairy cow breeding has a close relationship to a heifer rearing and a production of slaughter cattle; milk production economic indicators can be improved also in this area (Kvapilík, 2008).
The main factors of efficient milk production are in EU conditions corresponding cow efficiency, good fertility, adequate replacement of herd and with it connected cow longevity, an economy within expending of all cost items, high-quality fodders, and in nutrition balanced feeding rations, a high quality of market products, reliable animal technicians, corresponding level of management and labour organization (Škoda, 2006).
Incomes can be for milk producers hardly predictable because milk and feed markets change all the time and this is further worsened with still changing prices of fuels, fertilizers, and seeds of crops (Buza, 2014). Monitoring of IOFC monthly can determine whether feeding costs are in harmony with the actual milk production or whether management strategies of feeds are successful at present ( Maulfaid et al., 2011)
A nutrition of cows is directly linked with their efficiency whereas fed costs are the highest (c. 35 – 45 %) and the most hardly ascertainable item of milk production With increase in cow milk yields also demands for feed quality increase as well as optimal composition of feeding rations and a health state of cows (Kvapilík, 2010).
Correctly compiled feeding ration has to correspond with the cow´s need, however, it can be economically tolerable. It should be kept in mind that at home produced feed is the cheapest (Mudřík et al., 2006). According to Mach (2009) it is essential to consider the amount of concentrated feeds used for production of 1 kg of milk which significantly influence the costs. Therefore, a correct mutual combination will fulfil not only the necessary physiological need of a dairy cow, but it will be also cheap, so, economically right (Mudřík et al., 2006).
Breeding performances achieving about 2 to 5 % of costs for production of milk influence also fertility of cows which is after the milk yields the second economically the most important character of milked cows. Therefore, their responsibly compiled higher share can be regarded as an intensification measure improving economic results of milk production. it is dealt for example
with early diagnostics of pregnancy, a suitable age at first calving, a quality herd management, a purchase of quality insemination doses and a correct insemination technique, use of bio-technological methods and so on. (Kvapilík and Burdych, 2012).
In Kvapilík´s point of view (2010), the main production diseases in dairy cow breeding beside mastitis are also fertility problems and diseases of legs (limping). Economic loses are in most of production diseases caused by lower efficiency, shortening of production age, and costs for medication and treatments.
Peterová (2008) states that cow longevity should enable to reach generally the most productive lactation, i.e. the fourth to the fifth. In the Czech Republic, about 15 % cows achieve this value. The indicator is connected with a per cent level of culled dairy cows. The reason for elimination of a dairy cow from breeding can be its milk yields, reproduction and health problems, and its age. In our breeding the culling is still about 30%. If the reason for elimination is the milk yields lower than the breeding average, it will improve the quality of the whole herd. In the Czech Republic, there are still the most frequent reasons problems with fertility, disease of mammary gland, and difficult birth. Causes which leads to these are the most frequently in the area of nutrition, above all in high-production herds.
According to Poláčková at al. (2010), all costs connected with feeding and treatment of cows, costs for obtaining, storage and treatment of milk including costs for calves until they are weaned, and costs for breeding bull are included in the costs for dairy cows. Also costs connected with cleaning of manure inclusive its storing on manure heap are calculated.
Economic results of dairy cow breeding are influenced besides milk price and input prices (feeds, labour, veterinary activities, pharmaceuticals and others) by production indicators they are above all milk yields, content of milk components, quality of milk, cow fertility, heard replacement, and a number of weaned calves (Syrůček and Burdych, 2015).
A feed is generally the biggest cost for milk production. With a volatility on feed and milk markets, an Income Over Feed Cost (IOFC) indicator is more advantageous for obtaining a profit than only costs for feeding per cow (Buza, 2014). The indicator IOFC is used in advance breeding countries. It calculates how much a breeder
[18]
Evaluation of Economic Efficiency of Selected Branch in Animal Production in EU and CR
in an enterprise will have after payment of costs for feeds from revenues from milk for payment of other costs incurred and what profit will be (Syrůček and Burdych, 2015). The milk production is monitored often because higher milk production equals to a higher income for milk. A monitoring of only gross income from milk per cow doesn´t provide a good estimation of financial flows of profitability especially whether the costs for feed are high. Wolfová (2010) showed that incomes over feed costs (IOFC) should be monitoring as jako primary indicator of efficiency in dairy cow breeding (Buza et al., 2014; Namiotko and Baležentis, 2017).
The main factors, which can improve economic results of this important branch are animals´ performance corresponding with production conditions, a good health state of animals and with that connected a good fertility, an adequate replacement of herd, low mortality and necessary slaughters of animals, a high lifelong production (longevity), a quality roughage, a low consumption of grain feed and nutrition-balanced feeding rations, a high quality of market products, reliable technicians, appropriate management and work organization, a maximal income of all direct payments and subsidies (Kvapilík, Růžička and Bucek, 2008).
An aim of the paper is an evaluation of dairy cow breeding level in a delimited time period in the Czech Republic and in the European Union. Quantitative indicators of the dairy cow breeding level are expressed by means of number of raised dairy cows, achieved milk yields, and the total milk production.
Partial goals are (i) finding the most important cost items that affect the total cost of milk production as a key factor for the competitiveness of milk producers in the Czech Republic and in the EU, and (ii) assessing the development and dynamics of key production indicators as number of heads of dairy cattle, milk yields, milk sales and milk prices developments in the Czech Republic and the EU in the decade after 2007.
The dairy cow breeding economics is evaluated with use of regression functions for decisive variable components of costs in the dairy cow breeding in relation to the achieved milk yields.
Materials and methodsA data source for a concrete evaluation of dairy cow breeding level in the CR and the EU are data
of the Czech Statistical Office (CzSO), yearbooks of CMBA and Eurostat, and reports of the Ministry of Agriculture of the CR. An intention of their use is obtaining information about breeding of dairy cows in particular years in the CR and the EU.
A development of indicators of dairy cow breeding is evaluated with use of time series and their characteristics like basic and chain indexes and the growth rate of appropriate indictor.
An amount and structure of costs in the dairy cow breeding were found out for the CR in a collection of agricultural enterprises and from ERF data for the European Union.
For the evaluation of dairy cow breeding economics, a method of regression and correlation analysis. By the help of this method, regression functions are expressed between a level of achieved performance (an independent variable) and selected cost items (a dependent variable). The dependent variables are costs for feeds, wage costs, veterinary and breeding service costs. The selected dependencies are expressed both in numbers and in figures.
For monitoring of influence of selected factors on monitored indicators, methods of regression and correlation analysis will be used. The aim of regression analysis is to find a suitable mathematical model that expresses the given dependence. For a basic description, a simpler mathematical functions, for example linear; for searching for more complicated relations, a multiple regression model is constructed.
Parameters of function linear in parameters, or in which linearizing transformation can be realized, are determined by the least squares method. This method results from an requirement so that a sum of deviations of particular empirical (monitored) values of a dependent variable from the regression function, i.e. from theoretical values obtained by installing the appropriate value of independent variable into an equation of regression function, was minimal.
By annulation of partial derivation according to particular parameters and subsequent adjustment, a system of normal equations can be obtained. It has a form for example for a line:

[19]
Evaluation of Economic Efficiency of Selected Branch in Animal Production in EU and CR
Because the given relation can be interspersed with many various functions, than it is important to choose such which can describe the monitored dependence the best. For the choice of suitable function, various criteria are used. However, in most cases, characteristics of correlation are chosen. The correlation measures the dependence tightness with appropriate measures and strengthens the quality of regression function. The evaluated relation is the strongest and regression function the better the more the empiric values of explained variable concentrated around the estimated regression function, and vice versa the weaker the more the empirical values are remote to balanced values. To measure the strength of dependence an determination index I2 is used. It is determined as a share of theoretical dispersion (a dispersion of balanced values) and a dispersion of empirical (measured) values. The larger this share will be the strongest the dependence between characteristics will be.
Determination index reaches values from an interval ˂0; 1˃. The more its value will approximate to one, the more the dependence is considered strongest, so well described by the chosen regression function.
To measure tightness of dependence, a root of determination index is more often used. Its name is a correlation index I. The correlation index provides the same information about dependence
tightness as the determination index, however, it has less explanatory power. The correlation index which ranges from an interval ˂0; 1˃ is used for measurement of dependence tightness for arbitrary regression function parameters of which were estimated by the last squares method.
However, the obtained results of regression and correlation analysis are valid only for the monitored sample. Therefore it is always necessary to verify by means of tests whether there is a dependence among the variables at all, it means whether it is possible, simply said, to generalize the given dependence to a basic set. Most hypothesis suppose that the dependence among characteristics doesn´t exist and that regression and correlation parameters have a zero value in the basic set. In case of rejection of a zero hypothesis it is than stated that the given parameters are statistically significant.
Results and discussionAnalysis of state of dairy cows and milk production
The European Union with its numbers of dairy cows shares with 8.7 % in world numbers. On the contrary to other countries the European Union achieved a growth rate 98.87 % in the monitored period till 2012. This decreasing trend still persisted and the growth rate further fell to a value 9.7 % till 2018 when from 2007 to 2018 number of cows decreased by 1.378 thousands of pieces (Table 1). The decrease in number was caused by ongoing quotas within the milk production and increasing cow efficiency. This is illustrated in Figure 1.
Numbers of cattle 2007 2008 2009 2010 2011 2012 2013 2014 2015 2016 2017 2018
EU 28 24 287 24 406 23 871 23 314 23 053 23 193 23 468 23 559 23 594 23 525 23 311 22 909
basic index (2007=1) 1 1.005 0.983 0.96 0.949 0.955 0.966 0.97 0.972 0.969 0.960 0.943
chain index 1.005 0.978 0.977 0.989 1.006 1.012 1.004 1.002 0.969 0.960 0.943
growth rate 0.957
EU 15 17 785 18 052 17 783 17 553 17 409 17 703 18 029 18 176 18 377 18 364 18 188 17 799
basic index (2007=1) 1 1.015 1 0.987 0.979 0.995 1.014 1.022 1.033 1.033 1.023 1.001
chain index 1.015 0.985 0.987 0.992 1.017 1.018 1.008 1.011 0.999 0.990 0.979
growth rate 0.989
EU 13 6 501 6 354 6 087 5 761 5 643 5 490 5 439 5 383 5 218 5 161 5 122 5 109
basic index (2007=1) 1 0.977 0.936 0.886 0.868 0.844 0.837 0.828 0.803 0.794 0.788 0.786
chain index 0.977 0.958 0.946 0.980 0.973 0.991 0.990 0.969 0.989 0.992 0.997
growth rate 0.993
Source: EurostatTable 1: Numbers of dairy cows in the European Union (thous. heads).

[20]
Evaluation of Economic Efficiency of Selected Branch in Animal Production in EU and CR
Source: EurostatFigure 1: Numbers of dairy cows and milk yields in the European Union
(thous. heads – left axis; litres per head and year – right axis).
Analysis of numbers of dairy cows in the Czech Republic
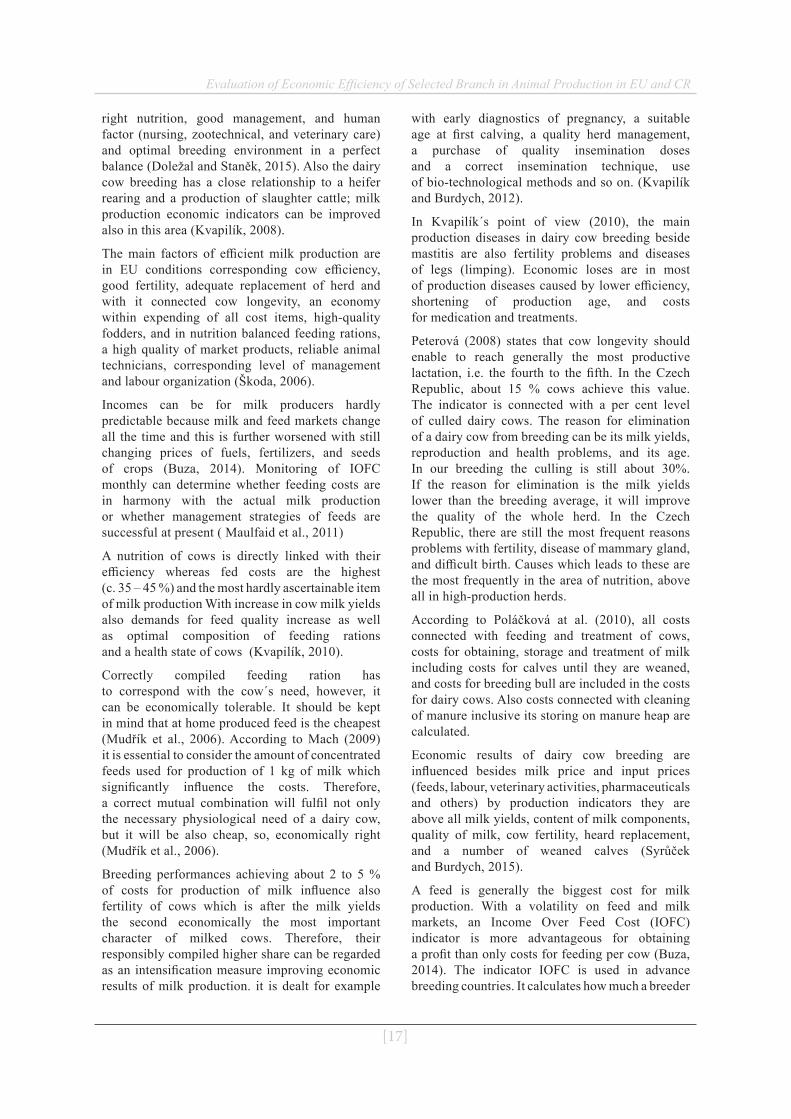
Development of numbers of dairy cows is shown in the Figure 2. The higher numbers of dairy cows within the monitored period were in 2007 when in comparison with the year 2015 they were by 38.3 thousand pieces higher. Since 2007 the number of dairy cows has shown decreasing tendency till 2012 when within this period the decrease was by 40.2 thousand pieces. It represents 10 % fall against 2007. Only in 2013, a slight increase in number of dairy cows was recorded by 8.2 thousand pieces. Against 2012, the increase represented by 2.2 % in comparison with the year 2013.
Development of cow milk production in the EU
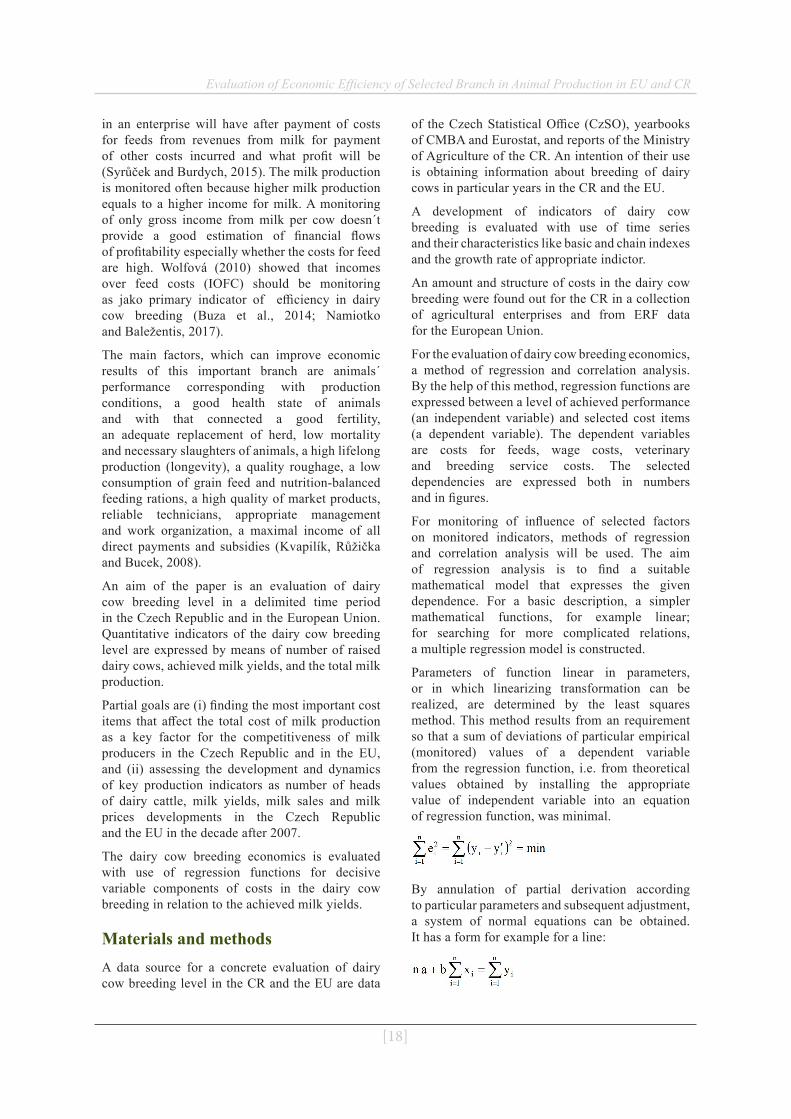
The milk production in the European Union still increases. In 2018 the production amounted already to 153 million l of milk. According to the Table 2 there is provable slight year-on-year increase in milk production. Only in 2009 a slight decrease of production happened against the foregoing year by 1.1 % and the least produced amount over the whole period in a volume 131 million lt.
Small fluctuation in milk production are caused by introduction of milk quotas regulating milk production. Milk quotas were introduced in 1984 and this regulatory tool in milk was terminated in 2015. The quotas and sanction connected with milk overproduction resulted in milk production without significant swings. In the monitored period, the growth rate amounted to 102.3 %. This 2 % was caused by annual slight increase of milk quotas.
Development of production of cow milk in the Czech Republic
Production of cow milk in the Czech Republic over the monitored republic fluctuates. The lowest milk production within this period was the production by 3.5 % lower in 2010 against the foregoing year. Since 2011 a turn has happened. The production increased year-on-yearly at average by 2 %. The highest milk production was reached in 2017 with a volume 2998 million litres of milk. In comparison with 2007, in 2017 it was produced by 314 million litres of cow milk more which represents an increase by 11.7 % in the monitored area. The average production growth rate of cow milk in the Czech Republic was 100.9 % (Table 3).
In the framework of monitored period, between years 2007 to 2017, there was an increase in an amount of sold milk by 279 million litres of milk more. The most amount of sold milk was in 2015 and 2016 with a year-on-year increase by 3.3 %. The average growth rate amounted to 10.9 % in the monitored period.
A milk marketability over the monitored period was the highest in 2007 when 97.58 % from the total production volume was monetized. The lowest marketability was recorded immediately the next year 2008 when the marketability decreased to 95.16 %. Since 2009 the marketability had an increasing trend.
[21]
Evaluation of Economic Efficiency of Selected Branch in Animal Production in EU and CR
Source: CMBA, CzSOFigure 2: Numbers of dairy cows and average milk yields in the Czech Republic.
Country 2007 2008 2009 2010 2011 2012 2013 2014 2015 2016 2017 2018
EU 28 119084 131234 131021 132463 135226 135990 137501 144127 147492 147842 151500 152721
basic index (2007=1) 1 1.102 1.100 1.112 1.136 1.142 1.155 1.210 1.239 1.241 1.272 1.282
chain index 1.102 0.998 1.011 1.021 1.006 1.011 1.048 1.023 1.002 1.025 1.008
growth rate 1.023
EU 15 101711 112195 112464 114361 116697 116624 118262 123699 126681 126450 129285 130113
basic index (2007=1) 1 1.103 1.106 1.124 1.147 1.147 1.163 1.216 1.245 1.243 1.271 1.279
chain index 1.103 1.002 1.017 1.020 0.999 1.014 1.046 1.024 0.998 1.022 1.006
growth rate 1.023
EU 13 17373 19039 18558 18102 18529 19367 19238 20428 20811 21391 22215 22607
basic index (2007=1) 1 1.096 1.068 1.042 1.067 1.115 1.107 1.176 1.198 1.231 1.279 1.301
chain index 1.096 0.975 0.975 1.024 1.045 0.993 1.062 1.019 1.028 1.039 1.018
growth rate 1.025
Source: EurostatTable 2: Milk production in the EU (mil. lt).
2007 2008 2009 2010 2011 2012 2013 2014 2015 2016 2017 2018
Milk production (mil.lt)
2684 2728 2708 2612 2664 2741 2775 2856 2946 2984 2998 152721
BI (2007=1) 1 1.016 1.009 0.973 0.993 1.021 1.034 1.064 1.098 1.112 1.117 1.282
chain index 1.016 0.993 0.965 1.020 1.029 1.012 1.029 1.032 1.013 1.005 1.008
growth rate 1.009
Sale of milk (mil.lt) 2619 2596 2585 2495 2555 2629 2666 2753 2844 2885 2898 130113
BI (2007=1) 1 0.991 0.987 0.953 0.976 1.004 1.018 1.051 1.086 1.102 1.107 1.279
chain index 0.991 0.996 0.965 1.024 1.029 1.014 1.033 1.033 1.014 1.005 1.006
growth rate 1.009
Marketability 97.58 95.16 95.46 95.52 95.91 95.91 96.07 96.39 96.54 96.7 96.7 22607
Source: CMSCH, author´s processionTable 3: Production and sale of milk in The Czech Republic.
[22]
Evaluation of Economic Efficiency of Selected Branch in Animal Production in EU and CR
Cost function
Dependent variable labour costs (euro/year), independent variability milk yields
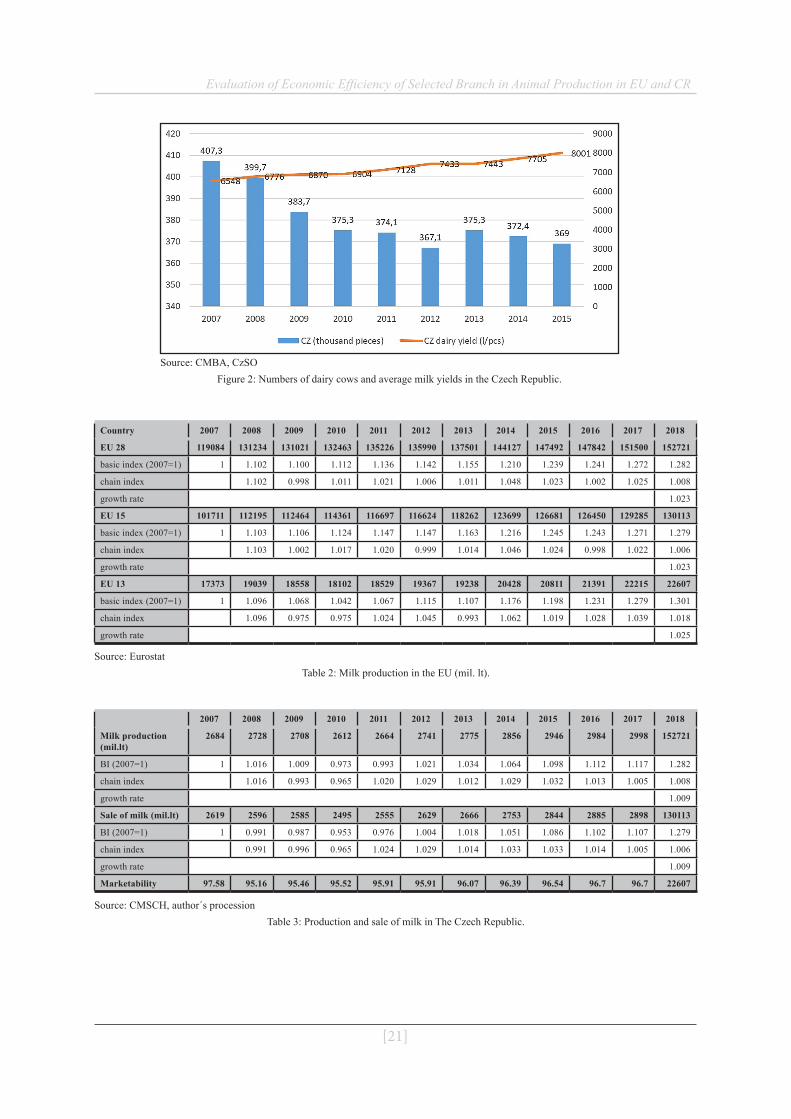
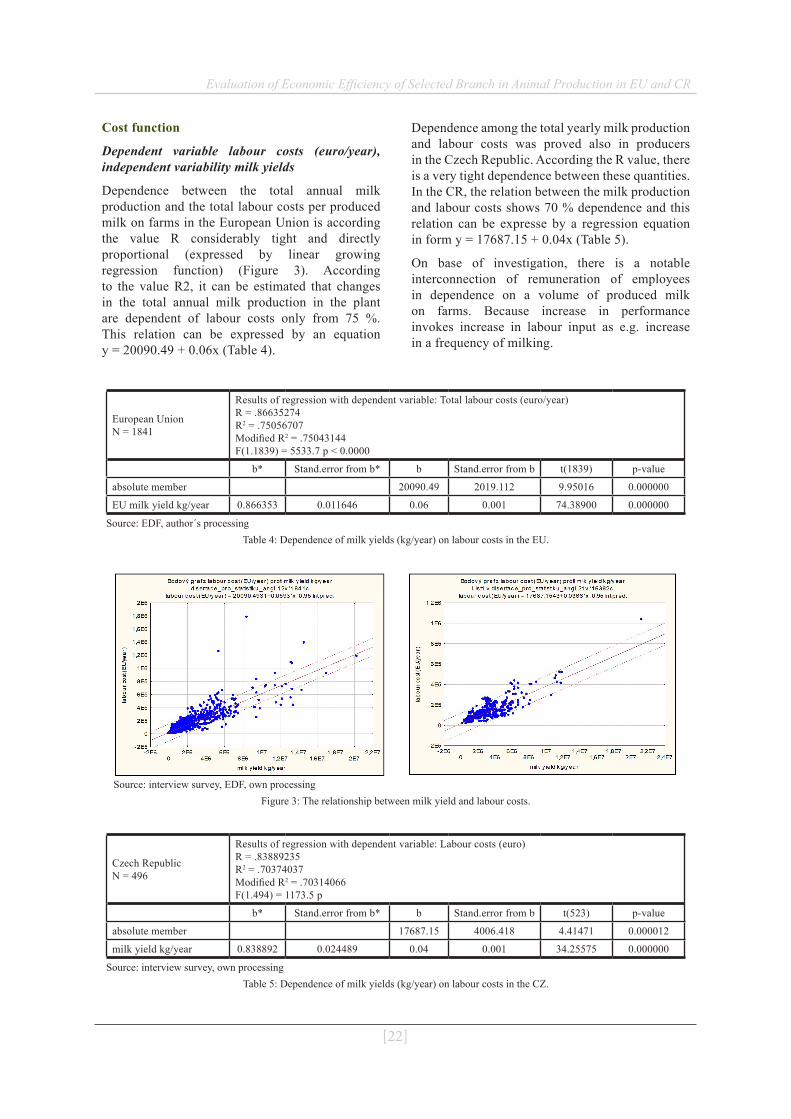
Dependence between the total annual milk production and the total labour costs per produced milk on farms in the European Union is according the value R considerably tight and directly proportional (expressed by linear growing regression function) (Figure 3). According to the value R2, it can be estimated that changes in the total annual milk production in the plant are dependent of labour costs only from 75 %. This relation can be expressed by an equation y = 20090.49 + 0.06x (Table 4).
Dependence among the total yearly milk production and labour costs was proved also in producers in the Czech Republic. According the R value, there is a very tight dependence between these quantities. In the CR, the relation between the milk production and labour costs shows 70 % dependence and this relation can be expresse by a regression equation in form y = 17687.15 + 0.04x (Table 5).
On base of investigation, there is a notable interconnection of remuneration of employees in dependence on a volume of produced milk on farms. Because increase in performance invokes increase in labour input as e.g. increase in a frequency of milking.
Source: EDF, author´s processingTable 4: Dependence of milk yields (kg/year) on labour costs in the EU.
European Union N = 1841
Results of regression with dependent variable: Total labour costs (euro/year) R = .86635274 R2 = .75056707 Modified R2 = .75043144 F(1.1839) = 5533.7 p < 0.0000
b* Stand.error from b* b Stand.error from b t(1839) p-value
absolute member 20090.49 2019.112 9.95016 0.000000
EU milk yield kg/year 0.866353 0.011646 0.06 0.001 74.38900 0.000000
Source: interview survey, EDF, own processingFigure 3: The relationship between milk yield and labour costs.
Source: interview survey, own processing Table 5: Dependence of milk yields (kg/year) on labour costs in the CZ.
Czech Republic N = 496
Results of regression with dependent variable: Labour costs (euro) R = .83889235 R2 = .70374037 Modified R2 = .70314066 F(1.494) = 1173.5 p
b* Stand.error from b* b Stand.error from b t(523) p-value
absolute member 17687.15 4006.418 4.41471 0.000012
milk yield kg/year 0.838892 0.024489 0.04 0.001 34.25575 0.000000

[23]
Evaluation of Economic Efficiency of Selected Branch in Animal Production in EU and CR
Dependent variable cost for feeds (euro), independent variable milk yields of dairy cows (in kg/year) in the Czech Republic and the European Union
One of the largest expenses for dairy farms is feed (USDA-ERS, 2007). Two options exist for feed suources: purchased and homegrown feed. Purchased feed is the expense performance (Hadrich, 2015).
According to the regression function, 96 % tightness was calculated in the total milk production and the total cost for feeds in the Czech Republic (Figure 4). The dependence between these indicators is proved on base of a coefficient of determination in amount 92.67 % in a form of regression equation y = 6056.776 + 0.130 x (Table 6). According to the correlation coefficient, a completely direct dependence was proved between the annual milk
production and the total cost for feeds because the correlation coefficient (R2) is 0.93.
Hardich (2015) anticipated that using a nutritionist would change purchased feed costs because they determine the ration mix and, in some cases, purchase the feed and sometimes include the nutritionist feed within the feed costs. However, jointly this should increase milk production and subsequently milk sales.
According to the regression function, a tightness 86 % was calculated in the total annual milk production and the total annual csts for feeds in the European Union (Figure 4). The dependence between these indicators is proved on base of the determination coefficient in amout of 74.77 %. It is expressed in a form of regression equation y = -32107.9 + 0.1 x (Table 7).
Source: interview survey, own processing Table 6: Dependence of milk yields (kg/year) on costs for feed in the CR.
Czech Republic N = 496
Results of regression with dependent variable: feed costs (euro/year) R = .96263157 R2 = .92665954 Modified R2 = .92651108 F(1.494) = 6241.7
b* Stand.error from b* b Stand.error from b t(523) p-value
absolute member 6056.776 6162.552 0.98284 0.326169
milk yield kg/year 0.963632 0.012185 0.130 0.002 79.0049 0.000000
Source: EDF, author´s processingTable 7: Dependence of milk yields (kg/kus/year) on cost for feeds in the EU.
European Union N = 1841
Results of regression with dependent variable: feed costs (euro/year) R = .86471192 R2 = .74772671 Modified R2 = .74758953 F(1.1839) = 5450.7
b* Stand.error from b* b Stand.error from b t(523) p-value
absolute member -32107.9 4509.669 -7.11979 0.000000
milk yield kg/year 0.864712 0.011712 0.1 0.002 73.82895 0.000000
Source: interview survey, EDF, own processingFigure 4: The relationship between milk yield and feed costs.
[24]
Evaluation of Economic Efficiency of Selected Branch in Animal Production in EU and CR
In comparison the Czech Republic with the European Union, a stronger dependency was proved in the Czech Republic than in the EU. This tightness can be caused by difference in pricing of own feeds within particular EU states. On base of calculation it can be stated that the annual milk production of a plant increases with a growth of annual costs for feeding. Due to the focus on quality of feeds and investment in purchased components affecting the production, and with the help of nutrition consultatnts and above all modern nutrition programmes, Rations are maximally balanced. These rations influence a high utilization of nutrients within a sulibility in time, so subsequently also utilization of genetic potential in dairy cows production. Hadrich (2013) and Streimikiene et al. (2016) states that feed cost management has been cited as one of the most important input cost control measures for dairy operations because it accounts for the largest shre of total costs across gerd sizes (USDA-ERS,2007). Dairy farmers have been using various means of input quantity control measures to manage this large input cost. According to VandeHaar et al. (2016) The increeased feed efficiency was the result of increased milk production per cow achieved throuht genetic selection, nutrition, and management with the desired goal being greater profitability. Cabrera et al. (2016) argues, when the economic efficiency of dairy farms can be improved substantially by adoptiong optimal nutritional grouping strategies for lactating cows. These strategies promote more precise feeding with increased productivity and lowered feed costs. Thesefore, they promote greater IOFC and an ultimately improved profitability and economic efficiency.
Dependent variable veterinarian costs (euro/year), independent variable milk yields of dairy cows (in kg/year) in the Czech Republic and the European Union
Dependence between the total milk production of dairy cow breeders in the Czech Republic
and the veterinary care costs a tight dependence was proved. The correlation coefficient amouts to 0.83. On base of the determination coefficient, relations between the milk production and veterinary care cost are explained. Accordong to a regression equation it can be stated that with raise in milk production also cost for veterinary care increases. This relation can be expressed by a regression equation y = 440.41 + 0.0116x (Table 8).
In the framework of farms from the European Union. with the help of a regression function. A tightness of dependence 84 % was cvalculated in the total annual milk production on a farm and the total costs for veterinary care (Figure 5). The dependence between these indicators is proved on base of coefficient of determinantion in amount 70.7 % in a form of regression equation y = -2233.43 + 0.01x (Table 9). On base of calculation. a connection was found out; costs for veterinary care increase with increasing performace because farmers pay attention topreventive measures and in case of disease to the veterinary care in stables. Investing in the veterinary treatment of dairy cows is profitable. at least whre a cow of average or high production capatiy is concerned (Heikkila et al.. 2008). According to Zwalda et al. (2006). the most costly disease of dairy cows is mastitis because these cost are connected with veterinary treatment. elimination of waste milk from the market one. a decrease in milk production. worsening of reproduction indicators. and an increased risk of spread among particular animals.
High-producing herds need appropriate management during the rearing period to ensure that adult cows will be healthy and strong (Krpálková et al. 2014).
Source: interview survey, own processing Table 8: Dependence of milk yields (kg/year) on costs for veterinary care in the CR.
Czech Republic N = 496
Results of regression with dependent variable: veterinary costs (euro/year) R = .83920255 R2 = .70426091 Modified R2 = .70366225 F(1.494) = 1176.4
b* Stand.error from b* b Stand.error from b t(523) p-value
absolute member 440.4110 1272.527 0.34609 0.729421
milk yield kg/year 0.839203 0.024468 0.0116 0.000 34.29856 0.00000

Evaluation of Economic Efficiency of Selected Branch in Animal Production in EU and CR
[25]
Source: interview survey, EDF, own processingFigure 5: The relationship between milk yield and veterinary costs.
Source: EDF, author´s processing Table 9: Dependence of milk yields (kg/piece/year) on costs for veterinary care in the EU.
European Union N = 1841
Results of regression with dependent variable: veterinary costs (euro/year) R = .84088349 R2 = .70708504 Modified R2 = .70692577 F(1.1839) = 4439.3
b* Stand.error from b* b Stand.error from b t(523) p-value
absolute member -2233.433 485.3975 -4.60125 0.000004
milk yield kg/year 0.864712 0.011712 0.01 0.002 73.82895 0.000000
Dependent variable breeding costs (euro/year). independent variable milk yields of dairy cows (year) in the Czech Republic and European Union
The dependence between the total annual milk production on farm and the total annual costs for insemination and embryotransfer in the Czech Republic is according to the value R considerably tight and directly proportional (expressed by a linear growing regression function) (Figure 6). According to the value R2 it can be estimated that changes in the total annual milk production in the plant are from 80 % dependent of the reproduction costs. This relation can be expressed by a regression equation y = 4118.35 + 0.006x (Table 10).
Dependence between the total annual milk production and the total costs for ensemination and reproduction per produced milk in the European Union is according to the value R considerably tight and directly proportional (expressed by a linear growing regression function) (Figure 6). According to the value R2 it can be estimated that changes of the total annual milk production in the plant in costs for insemination and reproduction are dependent from 66 %. This relation can be expressed by an equation y = 1182.16 + 0.006x (Table 11). The increase of costs effects an increase in production because
at present. concrete breeding (mation) plans from breeding firms are realized in order to increase genetic potential of dairy cows for production and improvement of health state. Many plants also invest in an inembryotransfer by means of which breeders sucure a higher number of high-production dairy cowns in they herd and a creation of the most productive lines of offsprings of the best dairy cows.
The level of reproductive performance directly affects the economic performance of a dairy herd (Lee and Kim, 2007) and its production. Nonetheless. the group of high-producing herds was the most profitable in the current study (Krpálková et al., 2014).
According to Krpálková et al. (2014), the milk yield is a very important factor for dairy farm profitability. The group of farms having the highest milk yield achieved the highest net profit despite having greater fertility problems.
According to Byrne et al. (2016) and Nielsen and Amer (2007). the use of various breeding objectives that tako into account farmers preferences for improvenments in animal traits are expected to maximize the uptake of genetics selection tools.
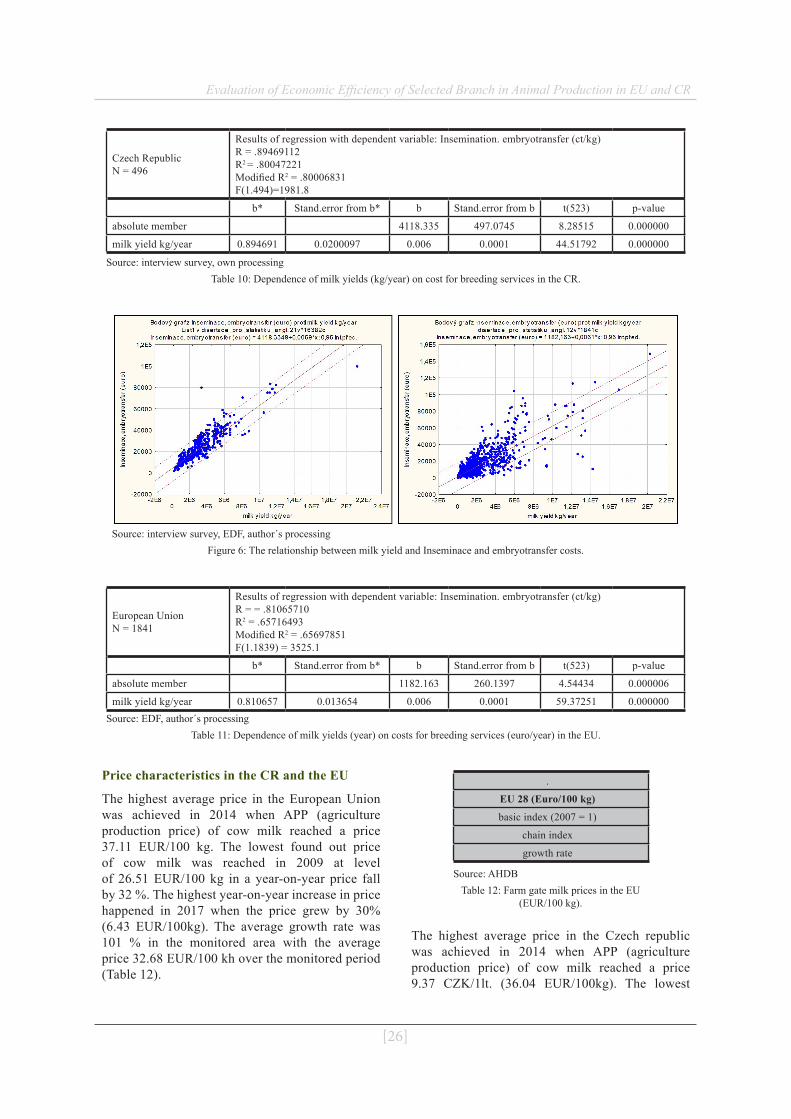
Evaluation of Economic Efficiency of Selected Branch in Animal Production in EU and CR
[26]
Source: interview survey, own processing Table 10: Dependence of milk yields (kg/year) on cost for breeding services in the CR.
Czech Republic N = 496
Results of regression with dependent variable: Insemination. embryotransfer (ct/kg) R = .89469112 R2 = .80047221 Modified R2 = .80006831 F(1.494)=1981.8
b* Stand.error from b* b Stand.error from b t(523) p-value
absolute member 4118.335 497.0745 8.28515 0.000000
milk yield kg/year 0.894691 0.0200097 0.006 0.0001 44.51792 0.000000
Source: interview survey, EDF, author´s processingFigure 6: The relationship between milk yield and Inseminace and embryotransfer costs.
Source: EDF, author´s processing Table 11: Dependence of milk yields (year) on costs for breeding services (euro/year) in the EU.
European Union N = 1841
Results of regression with dependent variable: Insemination. embryotransfer (ct/kg) R = = .81065710 R2 = .65716493 Modified R2 = .65697851 F(1.1839) = 3525.1
b* Stand.error from b* b Stand.error from b t(523) p-value
absolute member 1182.163 260.1397 4.54434 0.000006
milk yield kg/year 0.810657 0.013654 0.006 0.0001 59.37251 0.000000
Price characteristics in the CR and the EU
The highest average price in the European Union was achieved in 2014 when APP (agriculture production price) of cow milk reached a price 37.11 EUR/100 kg. The lowest found out price of cow milk was reached in 2009 at level of 26.51 EUR/100 kg in a year-on-year price fall by 32 %. The highest year-on-year increase in price happened in 2017 when the price grew by 30% (6.43 EUR/100kg). The average growth rate was 101 % in the monitored area with the average price 32.68 EUR/100 kh over the monitored period (Table 12).
.
EU 28 (Euro/100 kg)
basic index (2007 = 1)
chain index
growth rate
Source: AHDBTable 12: Farm gate milk prices in the EU
(EUR/100 kg).
The highest average price in the Czech republic was achieved in 2014 when APP (agriculture production price) of cow milk reached a price 9.37 CZK/1lt. (36.04 EUR/100kg). The lowest
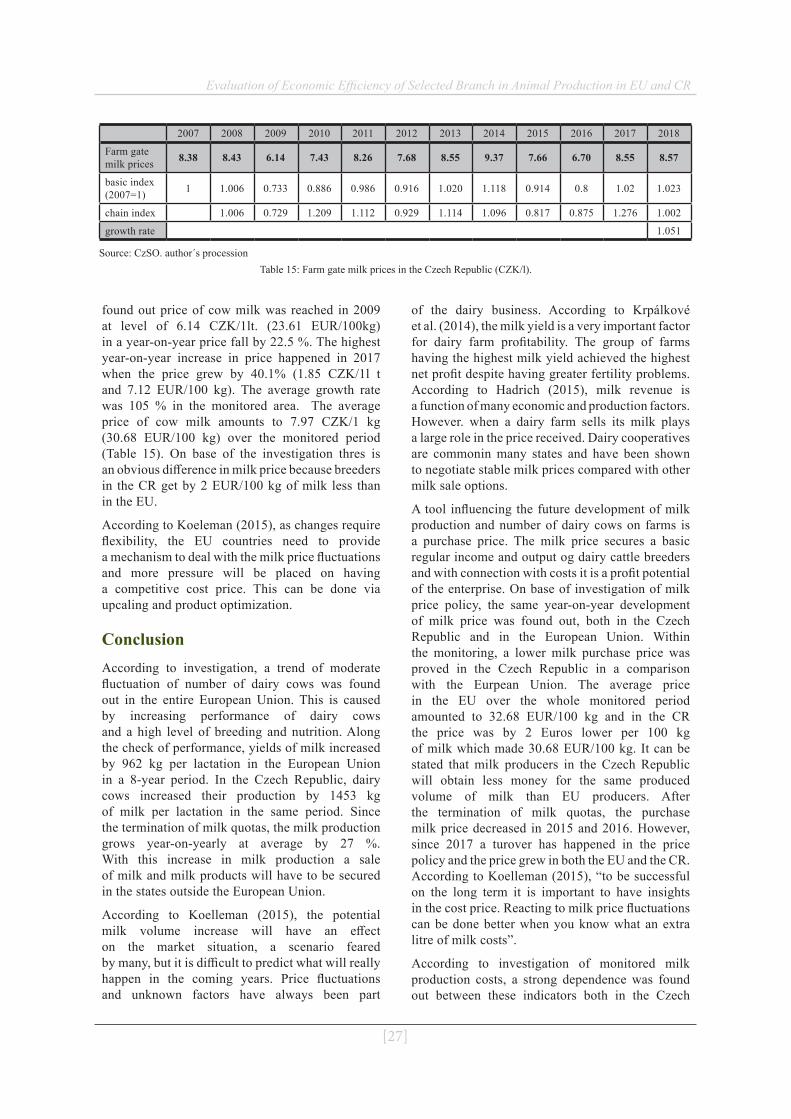
Evaluation of Economic Efficiency of Selected Branch in Animal Production in EU and CR
[27]
found out price of cow milk was reached in 2009 at level of 6.14 CZK/1lt. (23.61 EUR/100kg) in a year-on-year price fall by 22.5 %. The highest year-on-year increase in price happened in 2017 when the price grew by 40.1% (1.85 CZK/1l t and 7.12 EUR/100 kg). The average growth rate was 105 % in the monitored area. The average price of cow milk amounts to 7.97 CZK/1 kg (30.68 EUR/100 kg) over the monitored period (Table 15). On base of the investigation thres is an obvious difference in milk price because breeders in the CR get by 2 EUR/100 kg of milk less than in the EU.
According to Koeleman (2015), as changes require flexibility, the EU countries need to provide a mechanism to deal with the milk price fluctuations and more pressure will be placed on having a competitive cost price. This can be done via upcaling and product optimization.
ConclusionAccording to investigation, a trend of moderate fluctuation of number of dairy cows was found out in the entire European Union. This is caused by increasing performance of dairy cows and a high level of breeding and nutrition. Along the check of performance, yields of milk increased by 962 kg per lactation in the European Union in a 8-year period. In the Czech Republic, dairy cows increased their production by 1453 kg of milk per lactation in the same period. Since the termination of milk quotas, the milk production grows year-on-yearly at average by 27 %. With this increase in milk production a sale of milk and milk products will have to be secured in the states outside the European Union.
According to Koelleman (2015), the potential milk volume increase will have an effect on the market situation, a scenario feared by many, but it is difficult to predict what will really happen in the coming years. Price fluctuations and unknown factors have always been part
of the dairy business. According to Krpálkové et al. (2014), the milk yield is a very important factor for dairy farm profitability. The group of farms having the highest milk yield achieved the highest net profit despite having greater fertility problems. According to Hadrich (2015), milk revenue is a function of many economic and production factors. However. when a dairy farm sells its milk plays a large role in the price received. Dairy cooperatives are commonin many states and have been shown to negotiate stable milk prices compared with other milk sale options.
A tool influencing the future development of milk production and number of dairy cows on farms is a purchase price. The milk price secures a basic regular income and output og dairy cattle breeders and with connection with costs it is a profit potential of the enterprise. On base of investigation of milk price policy, the same year-on-year development of milk price was found out, both in the Czech Republic and in the European Union. Within the monitoring, a lower milk purchase price was proved in the Czech Republic in a comparison with the Eurpean Union. The average price in the EU over the whole monitored period amounted to 32.68 EUR/100 kg and in the CR the price was by 2 Euros lower per 100 kg of milk which made 30.68 EUR/100 kg. It can be stated that milk producers in the Czech Republic will obtain less money for the same produced volume of milk than EU producers. After the termination of milk quotas, the purchase milk price decreased in 2015 and 2016. However, since 2017 a turover has happened in the price policy and the price grew in both the EU and the CR. According to Koelleman (2015), “to be successful on the long term it is important to have insights in the cost price. Reacting to milk price fluctuations can be done better when you know what an extra litre of milk costs”.
According to investigation of monitored milk production costs, a strong dependence was found out between these indicators both in the Czech
2007 2008 2009 2010 2011 2012 2013 2014 2015 2016 2017 2018
Farm gate milk prices 8.38 8.43 6.14 7.43 8.26 7.68 8.55 9.37 7.66 6.70 8.55 8.57
basic index (2007=1) 1 1.006 0.733 0.886 0.986 0.916 1.020 1.118 0.914 0.8 1.02 1.023
chain index 1.006 0.729 1.209 1.112 0.929 1.114 1.096 0.817 0.875 1.276 1.002
growth rate 1.051
Source: CzSO. author´s processionTable 15: Farm gate milk prices in the Czech Republic (CZK/l).

Evaluation of Economic Efficiency of Selected Branch in Animal Production in EU and CR
[28]
Republic and the European Union. On base of calculation it was proved that with increase of input costs also the total milk production lineary grows on farms. Along regression equations calculated from data of the Czech Republic and the European Union, quite similar increase in production can be stated on base of the same
increase of monitored costs in the CR and the EU. It is possible to state that it would be necessary to secure the same milk prurchase price in the Czech Republic as is the average price in the European union. It is dealt with an unfavourable element of Czech dairy cow breeders.
Corresponding authors Prof. Ing. Jaroslav Homolka, CSc. Department of Economics, Faculty of Economics and Management Czech University of Life Sciences Prague, Kamýcká 129, Prague, 165 00 Czech Republic E-mail: [email protected].
References[1] Baldwin. R. and Wyplosz. Ch. (2004) “The economics of European integration“, 458 p.
ISBN 0-077-103947.
[2] Becker, J. C., Heins, B. J. and Hansen, L. B. (2012) “Cost for health care of Holstein cows selected for large versus small body size”, Journal of Dairy Science, Vol. 95, No. 9, pp. 5384-5392. ISSN 0022-0302. DOI 10.3168/jds.2012-5344.
[3] Byrne, T. J., Santos, B. F. S., Amer, P. R., Martin-Collado, D., Pryce, J. E. and Axford, M. (2016) “New breeding objectives and selection indices for the Australian dairy industry”, Journal of Dairy Science, Vol. 99, No. 10., pp. 8146-8167. ISSN 0022-0302. DOI 10.3168/jds.2015-10747.
[4] Buza, M. H., Holden, L. A., White, R. A. and Ishler, V. A. (2014) “Evaluationg the effect of ration composition on income over feed cost and milk yield”, Journal of Dairy Science, Vol. 97, No. 5, pp. 3073-3080. ISSN 0022-0302. DOI 10.3168/jds.2013-7622.
[5] Doležal, O. and Staněk, S. (2015) “Chov dojeného skotu” (In Czech), Profi Press, Prague, 243 p. ISBN 978-80-86726-70-0.
[6] Fiala, P. and Pitrová. M. (2003) “Evropská unie“ (In Czech), Brno. 743 p. ISBN 80-7325-015-2.
[7] Hadrich, J. C. and Johnson. K. K. (2015) ”Estimation of risk management effects on revenue and purchased feed costs on US dairy farms”, Journal of Dairy Science, Vol. 98, No. 9, pp. 6588-6596. ISSN 0022-0302. DOI 10.3168/jds.2014-8864.
[8] Heikkila, A. M., Nousiaines, J. I. and Jauhiainen, L. (2008) ”Optimal Replacement Policy and Economic Value of Dairy Cows with Diverse Health Status and Production Capacity”, Journal of Dairy Science, Vol. 91, No. 6, pp. 2342-2352. ISSN 0022-0302. DOI 10.3168/jds.2007-0736.
[9] Holman, R. (2002) “Ekonomie” (In Czech), Prague, ISBN 80-86006-57-3.
[10] Jakš, J. (1998) “Quo Vadis Evropská unie” (In Czech), Prague, 236 p. ISBN 80-86006-57-3.
[11] Koeleman, E. (2015) “End of milk quota: new limitations arise”, Dairy Global, Vol. 2, No. 2. [Online]. Available: https://www.dairyglobal.net/Articles/General/2015/4/Milk-quota-end-new-limiting-factors-arise-1742551W [Accessed: 15 April 2019].
[12] Kudrna, V. (1998) “Produkce krmiv a výživa skotu” (In Czech), Prague: Agrospoj, 362 p.
[13] Kvapilík, J., Růžička, Z. and Bucek, P. (2008) “Chov skotu v České republice” (In Czech), Yearbook 2007, ČMSCH, SCHČSS, SCHČS, ČSCHMS, Prague.
[14] Kvapilík, J., Růžička, Z. and Bucek, P. (2014) “Chov skotu v České republice” (In Czech), Yearbook 2007, ČMSCH, SCHČSS, SCHČS, ČSCHMS, Prague.
[15] Kvapilík, J., Růžička, Z. and Bucek, P. (2015) “Chov skotu v České republice” (in Czech), Yearbook 2014, ČMSCH, SCHČSS, SCHČS, ČSCHMS, Prague.

Evaluation of Economic Efficiency of Selected Branch in Animal Production in EU and CR
[29]
[16] Kvapilík, J. (2010) “Hodnocení ekonomických ukazatelů výroby mléka” (in Czech), Certified methodology, Research Institute of Animal production, Prague. ISBN 978-80-7403-059-8.
[17] Kvapilík, J. and Burdych, J. (2012) “Výroba mléka a plemenářské výkony” (In Czech), Náš Chov, Profi press Prague, Vol. 5. ISSN 0027-8068.
[18] Krpálková, L., Cabrera, V. E., Kvapilík, J., Burdych, J. and Crump, P. (2014) ”Associationg between age at first calving, rearing average daily weight gain, herd milk yield and dairy herd production, reproduction, and profitability”, Journal of Dairy Science, Vol. 97, No. 10, pp. 6573-6582. ISSN 0022-0302. DOI 10.3168/jds.2013-7497.
[19] Lawson, L. G., Agger, J. F., Lund, M. and Coelli. T. (2004) “Lamenss, metabolic and digestive disorders, and technical efficiency in Danish dairy herds: a stochastic frontier production function approach”, Livestock Production Science, Vol. 91, No. 1-2, pp. 157-172. ISSN 1871-1413. DOI 10.1016/j.livprodsci.2004.07.016.
[20] Mach, J. (2009) “Produkce mléka v EU a její determinant” (In Czech), Collection of papers Ekonomika zdrojů Českého zemědělství a jejich efektivní využívání v rámci zemědělskopotravinářských systémů, CULS Prague. pp. 68-74. ISBN 978-80-213-2011-6.
[21] McCarthy, S., Horan, B., Dillon, P., O’Connor, P., Rath, M. and Shalloo, L. (2007) “Economic comparison of divergent strains of Holstein-Friesian cows in various pasture-based production systems“, Journal of Dairy Science, Vol. 90, No. 3, pp.1493-1505. ISSN 0022-0302. DOI 10.3168/jds.S0022-0302(07)71635-1.
[22] Michaličková, M., Krupová, Z., Polák, P., Hetényi, L. and Krupa. E. (2014) “Development of competitiveness and its determinants in Slovak dairy farms”, Agricultural Economics – Czech, Vol. 60, pp. 82-88. E-ISSN 1805-9295, ISSN 0139-570X. DOI 10.17221/76/2013-AGRICECON.
[23] Mudřík, Z., Doležal, P. and Koukal, P. (2006) “Základy moderní výživy skotu” In Czech), CULS Prague, 1st ed., 270 p. ISBN 80-213-1559-8.
[24] Namiotko, V. and Baležentis, T. (2017) "Dynamic Efficiency under Investment Spikes in Lithuanian Cereal and Dairy Farms, Economics and Sociology", Vol. 10, No. 2, pp. 33-46. ISSN 2071-789X. DOI 10.14254/2071-789X.2017/10-2/3.
[25] Novotníková, H. (2005) “Dotační receptář” (In Czech), Prague, 235 p. ISBN 80-86920-03-8.
[26] Peterová, J. (2008) “Ekonomika výroby a zpracování zemědělských produktů” (In Czech), Faculty of Economics and management, CULS Prague, 4th ed., 238 p. ISBN 978-80-213-2053-6.
[27] Poděbradský, Z. (1999) “Nové poznatky v ekonomice výroby mléka a jatečných prasat” (In Czech), Prague. ISBN 80-7271-039-7.
[28] Poláčková, J. (2010) “Metodika kalkulací nákladů a výnosů v zemědělství“ (In Czech), Prague: Institute of Agricultural Economics and Information, Methodological handbook, 73 p. ISBN 978-80-86671-75-8.
[29] Škoda, J. (2006) “Kde hledat rezervy v ekonomice produkce mléka” (In Czech), Collection of papers from workshop “Metody řízení vysoko užitkových stád dojnic”, Research Institute of Animal Production, Prague. ISBN 90-86454-77-0.
[30] Tozer, P. R. and Heinrichs, A. J. (2001) “What Affects the Costs of Raising Replacement Dairy Heifers: A Multiple-Component Analysis“, Journal of Dairy Science, Vol. 84, No. 8, pp. 1836-1844. ISSN 0022-0302. DOI 10.3168/jds.S0022-0302(01)74623-1.
[31] Streimikiene, D., Baležentis, T. and Kriščiukaitienė, I. (2016) "Benefit of the Doubt Model for Financial Risk Analysis of Lithuanian Family Farms, Economics and Sociology, Vol. 9, No 1, pp. 60-68. ISSN 2071-789X. DOI 10.14254/2071-789X.2016/9-1/4.
[32] Tozer, P. R., Bargo, F. and Muller, L. D. (2003) “Economic Analyses of Feeding Systems Combining Pasture and Total Mixed Ration“, Journal of Dairy Science, Vol. 86, No. 3, pp. 808-818. ISSN 0022-0302. DOI 10.3168/jds.S0022-0302(03)73663-7.
[30]
Evaluation of Economic Efficiency of Selected Branch in Animal Production in EU and CR
[33] VandeHaar, M. J., Armentano, L. E., Weigel. K., Spurlock, D. M., Tempelman, R. J. and Veerkamp, R. (2015) “Harnessing the genetics of the modern dairy cow to continue improvements in feed efficiency”, Journal of Dairy Science, Vol. 99, No. 6, pp. 4941-4954. ISSN 0022-0302. DOI 10.3168/jds.2015-10352.
[34] Wolfová, M., Wolf, J., Kvapilík, J. and Kica J. (2007) “Selection for Profit in Cattle: II. Economic Weights for Dairy and Beef Sires in Crossbreeding Systems”, Journal of Dairy Science, Vol. 90, No. 5, pp. 2456-2467. ISSN 0022-0302. DOI 10.3168/jds.2006-615.
[35] Zwald, N. R., Wigel, K. A., Chang, Y. M., Welper, R. D. and Clay, J. S. (2006) “Genetic Analysis of Clinical Mastitis Data from on-Farm Management Soltware using Threshold Models”, Journal of Dairy Science, Vol. 89, No. 1, pp. 330-336. ISSN 0022-0302. DOI 10.3168/jds.S0022-0302(06)72098-7.
[31]
Agris on-line Papers in Economics and Informatics
Volume XI Number 4, 2019
Analysis of the Current Support of E-marketing Activities in Selected Enterprises of the Wine Sector in SlovakiaErik Janšto1, Peter Polakovič1, Klára Hennyeyová1, Ivana Slováková2
1 Faculty of Economics and Management, Slovak University of Agriculture in Nitra, Slovak Republic2 The Institute of Foreign Languages, Technical University in Zvolen, Slovak Republic
AbstractIn the digital era, implementing an effective marketing strategy requires a more comprehensive view of the marketing strategy than in the past. The concepts of older approaches are already ineffective today, but we consider it important to mention them. Organizations focus on improving production, achieving low cost and mass distribution. The product concept is based on the conviction of consumers who prefer products with the highest quality or innovative characteristics. Managers focus on producing quality products and subsequently improving them. The disadvantage is the disproportionate focus on the product (marketing near-sightedness) as on consumption. The sales concept is characterized by a gradual increase in competition and market saturation. With this characteristic, managers are using a more aggressive fixed sales strategy, paying more attention to sales and building improved sales channels. The most modern approach is the holistic marketing concept that came about with the advent of the digital era. It is a dynamic concept conditional on electronic connectivity and interactivity between the agricultural company, its customers and collaborators. It integrates value exploration, building and delivering activities for mutually satisfying relationships and shared prosperity among stakeholders.
This paper summarizes the most important results of the questionnaire survey of selected companies carried out under the title: Analysis of the current support of e-marketing activities in selected enterprises of the wine sector in Slovakia. The results of the questionnaire survey are evaluated in the text based on submitted scientific hypotheses.
KeywordsMarketing, agricultural companies, ICT, marketing information system (MIS), marketing strategy, agribusiness.
Janšto, E., Polakovič, P., Hennyeyová, K. and Slováková, I. (2019) “Analysis of the Current Support of E-marketing Activities in Selected Enterprises of the Wine Sector in Slovakia", AGRIS on-line Papers in Economics and Informatics, Vol. 11, No. 4, pp. 31-37. ISSN 1804-1930. DOI 10.7160/aol.2019.110403.
IntroductionToday, world wine producers are facing difficult sales problems due to a lack of market space. Structural changes in the wine market, the discovery of multinational retail chains, the growing interest of customers in cheap but quality wines have brought new opportunities for “new world” wineries to the detriment of traditional European winemakers. Since the early 1980s, new markets have been opened in China, Japan, and South Korea, which are still helping hands (growing and selling grapes) for traditional 'old world' countries. The Slovak position of wine growing and production is of marginal importance for the national economy. In many cases, wine
production is linked to local history, traditions, and lifestyle and contributes significantly to rural development. The competitiveness of Slovak wines focuses mainly on the production of high-quality categories with an emphasis on improving feedstock in the processing process. Slovak winemaking is not able to compete with large producers from Southern Europe (Italy, Spain) for its production size or yield per hectare, but it has exceptional potential in terms of originality and uniqueness of wines. To increase the competitiveness of farms, regions or the whole country, it is mainly marketing and innovation. A well-adapted and effective marketing strategy in today's strong competitive environment provides the agricultural company with an understanding of its production capabilities and the ability
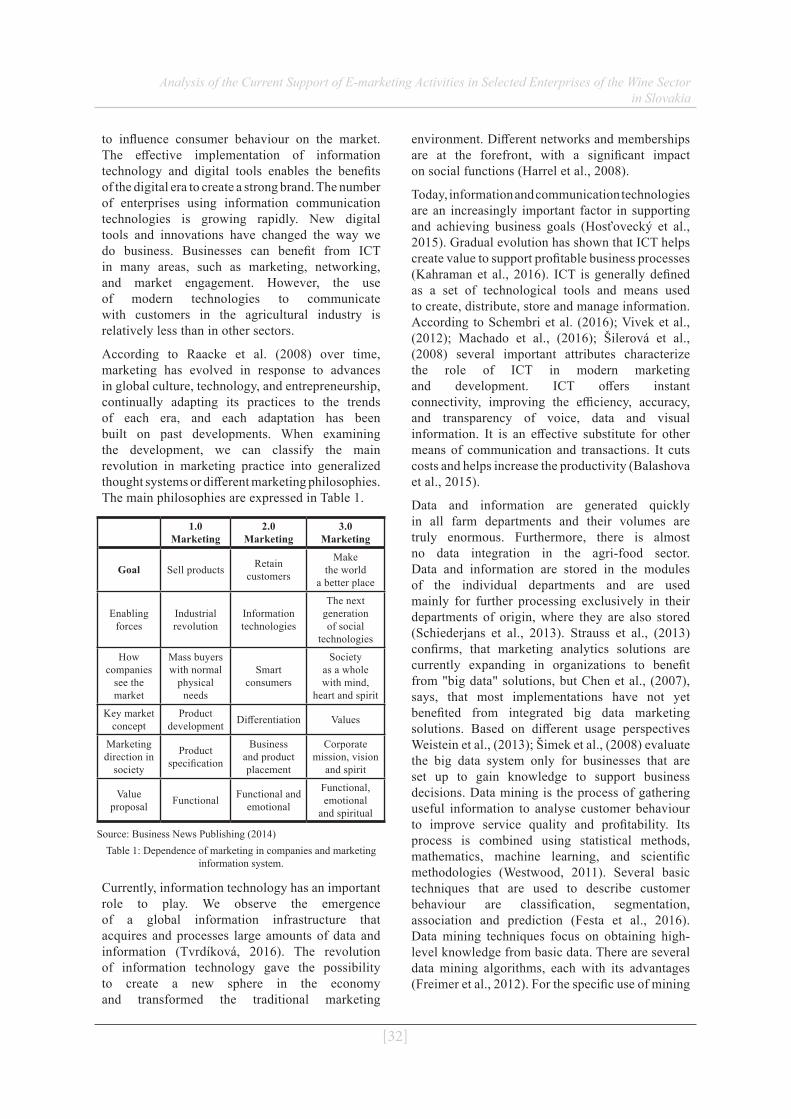
[32]
Analysis of the Current Support of E-marketing Activities in Selected Enterprises of the Wine Sector in Slovakia
to influence consumer behaviour on the market. The effective implementation of information technology and digital tools enables the benefits of the digital era to create a strong brand. The number of enterprises using information communication technologies is growing rapidly. New digital tools and innovations have changed the way we do business. Businesses can benefit from ICT in many areas, such as marketing, networking, and market engagement. However, the use of modern technologies to communicate with customers in the agricultural industry is relatively less than in other sectors.
According to Raacke et al. (2008) over time, marketing has evolved in response to advances in global culture, technology, and entrepreneurship, continually adapting its practices to the trends of each era, and each adaptation has been built on past developments. When examining the development, we can classify the main revolution in marketing practice into generalized thought systems or different marketing philosophies. The main philosophies are expressed in Table 1.
1.0 Marketing
2.0 Marketing
3.0 Marketing
Goal Sell products Retain customers
Make the world
a better place
Enabling forces
Industrial revolution
Information technologies
The next generation of social
technologies
How companies
see the market
Mass buyers with normal
physical needs
Smart consumers
Society as a whole with mind,
heart and spirit
Key market concept
Product development Differentiation Values
Marketing direction in
society
Product specification
Business and product placement
Corporate mission, vision
and spirit
Value proposal Functional Functional and
emotional
Functional, emotional
and spiritual
Source: Business News Publishing (2014)Table 1: Dependence of marketing in companies and marketing
information system.
Currently, information technology has an important role to play. We observe the emergence of a global information infrastructure that acquires and processes large amounts of data and information (Tvrdíková, 2016). The revolution of information technology gave the possibility to create a new sphere in the economy and transformed the traditional marketing
environment. Different networks and memberships are at the forefront, with a significant impact on social functions (Harrel et al., 2008).
Today, information and communication technologies are an increasingly important factor in supporting and achieving business goals (Hosťovecký et al., 2015). Gradual evolution has shown that ICT helps create value to support profitable business processes (Kahraman et al., 2016). ICT is generally defined as a set of technological tools and means used to create, distribute, store and manage information. According to Schembri et al. (2016); Vivek et al., (2012); Machado et al., (2016); Šilerová et al., (2008) several important attributes characterize the role of ICT in modern marketing and development. ICT offers instant connectivity, improving the efficiency, accuracy, and transparency of voice, data and visual information. It is an effective substitute for other means of communication and transactions. It cuts costs and helps increase the productivity (Balashova et al., 2015).
Data and information are generated quickly in all farm departments and their volumes are truly enormous. Furthermore, there is almost no data integration in the agri-food sector. Data and information are stored in the modules of the individual departments and are used mainly for further processing exclusively in their departments of origin, where they are also stored (Schiederjans et al., 2013). Strauss et al., (2013) confirms, that marketing analytics solutions are currently expanding in organizations to benefit from "big data" solutions, but Chen et al., (2007), says, that most implementations have not yet benefited from integrated big data marketing solutions. Based on different usage perspectives Weistein et al., (2013); Šimek et al., (2008) evaluate the big data system only for businesses that are set up to gain knowledge to support business decisions. Data mining is the process of gathering useful information to analyse customer behaviour to improve service quality and profitability. Its process is combined using statistical methods, mathematics, machine learning, and scientific methodologies (Westwood, 2011). Several basic techniques that are used to describe customer behaviour are classification, segmentation, association and prediction (Festa et al., 2016). Data mining techniques focus on obtaining high-level knowledge from basic data. There are several data mining algorithms, each with its advantages (Freimer et al., 2012). For the specific use of mining
[33]
Analysis of the Current Support of E-marketing Activities in Selected Enterprises of the Wine Sector in Slovakia
data Giovannoni et al. (2018) classifies:
• Market segmentation - identify common characteristics of customers who buy the same product from a company,
• Customers - predicting which customers are likely to leave the company and visit a competitor,
• Fraud detection: identifies which transactions are most likely fraudulent,
• Direct marketing - determines which prospects should be included in the mailing list to get the highest response rate,
• Interactive Marketing - predicts what everyone who accesses a website is most likely to see,
• Market analysis - understanding what products or services are purchased together,
• Trend analysis: reveal the difference between a typical customer this month and the last.
The marketing activities of a modern enterprise are closely related to information coming from the internal and external environment, which is the main source of information about marketing databases. The environment in which businesses operate contains a wealth of valuable information. Most often, this information does not end up being held by marketing specialists promptly, which makes decisions taken more risk and uncertain (Kaplan et al., 2010); (Vaněk et al., 2011).
A marketing information system (MIS) is defined as a set of procedures and methods for the regular planning, collection, analysis and presentation of information for use in making marketing decisions (Lamb et al., 2011). Many companies store electronic marketing data in databases and data warehouses. These data warehouses enable merchants to obtain valuable, appropriate and customized information at any time. Marketing specialists can receive database information on websites and email on multiple devices (Strauss et al., 2013).
Solutions to marketing and MIS problems that are available in the literature, e.g. Tvrdíková (2016) defines them as very complex and systemic, but practically unusable for small and medium-sized enterprises. A survey of the organizational structures of SMEs enterprises found that marketing is often delegated by only one employee. It is organizationally located at the sales department or CEO department and usually has many other functions. Harrel (2008) sees a possible
solution for the nomination of a multi-profession team that will provide motivation and evaluation of the results of gathering external and internal information for MIS by all agricultural company employees, solving problems related to authorizing access to information stored in benchmarking the performance of the agricultural company with its main competitors and proposing measures to update the strategy.
Materials and methodsThe paper is the output of internal specific research conducted at the Department of Informatics, Faculty of Economics and Management, SPU in Nitra. The following hypotheses were defined for the processed marketing research:
H1: The use of ICT solutions across marketing areas is statistically significantly related to the organization's growing revenue.
H2: The use of ICT solutions across marketing areas is statistically significant to productivity.
A survey of enterprises was made up of 21 agri-sector enterprises focused on wine producing sector in Slovakia. Several scientific methods have been used in the survey. The main method was the analysis and comparison, which, based on the questionnaire survey, identified the current situation in the marketing of wine companies in Slovakia. We used the synthesis method to process the knowledge from the literature. We have applied the induction method to formulate conclusions based on the evaluation of the survey. Using the deduction method, we have applied the lessons learned from the literature to draw conclusions. To find the data for our analysis, we chose a questionnaire survey, which was distributed to individual entities. Questionnaires were collected and electronically processed in MS Excel, where we processed most tables and charts of the fourth and fifth chapters. Statistical calculations were made by SPSS Statistics. The questionnaire, through its results, was textured to the reliability of its construct. Analysis of selected parts of the survey was performed in the SPSS IMB statistical software. Reliability was tested by Cronbach's Alpha. Cronbach's Alpha is one of the most frequently used indexes for investigating the reliability of a measuring tool (questionnaire). Based on the structure of the questionnaire and the results obtained:
α = (k/(k-1)* [1 – Σ (s2i)/ s2sum] , where

[34]
Analysis of the Current Support of E-marketing Activities in Selected Enterprises of the Wine Sector in Slovakia
k – number of items (number of questions, quality criteria)s2i – variance for the itemss2sum – variance for the sum of items
Several statistical methods have been used for statistical evaluation. Verification of dependencies between the examined characters was performed using the Chi-quadrate test (χ2), respectively (χ2) - square contingency. For statistical tests where the Chi-quadrate independence test could not be used because the cell count assumption in the contingency table was not followed, Fisher's exact test was used. Fisher's exact test is based on a contingency table and verifies the null hypothesis of the equality of two shares, i.e. the independence of the two binary variables. This test is based on the assumption that all marginal frequencies (row totals / columns) in the pivot table are fixed. This assumption is rarely met. Typically, only line counts or only total abundance are fixed.
The hypotheses were tested using standard statistical methods, testing of the hypotheses was through the Kruskal-Wallis test, which is an extension of the Mann-Whitney U test for the use of more than two variables. Analyses of the attribute group indicate that the reliability of the data obtained from the main survey is sufficient (the internal consistency of the scale is considered appropriate, even if the coefficient is greater than 0.7). The values are given in Table 2.
Scope of reliability analysisNumber
of examined items
The value of Cronbach's
alpha
All variable items 21 0.801
Variables to Hypothesis H1 12 0.785
Variables to Hypothesis H2 9 0.791
Source: own research and processingTable 2: Overview of the introduction and use of management
methods and techniques.
Results and discussionThe survey was focused on marketing in individual companies, attention was paid especially to the use of special software or outsourced services in the provision of marketing information system, for this area - 11 businesses. Some of them use sales or sales departments to manage marketing activities or combine e.g. their marketing department and external specialized agricultural company. In this context, it is worth noting that only 4 companies declare that marketing is done intuitively; without a specific organizational chart and specific marketing plans, which is certainly a sign of the development of marketing management.
The comparison of the way of providing marketing and marketing information systems in individual companies is certainly worth closer attention. Table 3 shows several basic trends:
• In companies that have their marketing department, the marketing information system is also managed by internal resources (regardless of whether it was developed by its own or external staff),
• Where marketing is managed intuitively, usually no marketing information system is implemented, as is the case in companies where marketing activities fall under the sales or sales department,
• Enterprises in which only one employee is engaged in marketing, because here (as with companies with their marketing department), the marketing information system is managed by internal resources, probably the only employee,
• Although 6 companies said they did not use any marketing information system support, even 8 companies had already answered a specific application/software question,
Implementation of marketing Licensed software
Licensed software (external
processing)custom software MIS Hosted
applications
Internal marketing department 4 3 3 1 2
One employee 5 - 1 2 2
Intuitively 1 - - - -
External firm 2 3 2 - 1
Intuitively 1 - - - -
External firm 2 3 2 - 1Source: own research and processing
Table 3: Dependence of marketing in companies and marketing information system.
[35]
Analysis of the Current Support of E-marketing Activities in Selected Enterprises of the Wine Sector in Slovakia
• It is also somewhat surprising to find that the well-known SAP information system is used by only 3 companies for their activities. Most often companies choose their software solutions (the most popular are solutions based on CRM, respectively database systems) and database systems in general.
If companies use external specialized companies to manage marketing activities, they are most often advertising - 7 companies and marketing research - 8 companies, one agricultural company uses the services of several external specialists in different areas of marketing. Questions about the use and impact of ICT solutions within each marketing area:
Does your organization allow you to order and book services online through a website or other computer networks?
Does your organization use a CRM system that is based on a specific customer relationship management software solution?
Do you use IT solutions to lure suppliers for pricing or submission?
Does your organization allow you to order and book services online through a website or other computer networks?
Hypothesis 1 was tested to find out whether there is a statistically significant dependence between the occurrence of ICT solutions supporting individual marketing areas and increasing the organization's revenues. Thus, the relationship between the occurrence of ICT solutions within each marketing area and the overall impact of ICT solutions on profit growth was tested. Respondents had to answer whether or not they have implemented ICT solutions within individual areas of marketing. It was, therefore, a variable that took values of 1 - they do not have ICT solutions implemented, 2 - they have the ICT solutions implemented. Respondents also had to answer the question: what impact do they think, ICT solutions to increase revenue (negative, none, positive). More than half of the respondents, up to 89%, answered the question about the impact of ICT solutions on increasing profits and did not even have a single marketing solution within the organization. This implies that respondents do not have real experience with the impact of ICT solutions to support marketing on profit growth or have experience with other ICT solutions. From the sample tested so far, we chose only the answers of those
respondents who answered yes to the question of whether their organization supports marketing or sales processes using specific IT solutions. This means that at least one ICT marketing support solution was present within their organization. Frequency analysis has shown that organizations that have established ICT solutions in at least one of the marketing areas largely claim that marketing digital tools have a positive impact on profit growth. Thus, in hypothesis 1, we cannot confirm the dependence between individual marketing areas that have implemented ICT solutions and the increase in profits.
In the area of productivity growth Hypothesis 2, which should be proportional to the increase in e-marketing services. Companies are divided according to whether or not they invested in ICT during the previous year. When they have invested and appear to have invested in product and service demand forecasting technologies, these firms have the most significant share of positive productivity gains. If they did not invest, it is interesting that it is precisely the inexpensive service of sales auctions that dominates, and therefore companies using this sales channel claim up to 91% that ICT has a positive impact on productivity gains. This sales channel is the most prominent in this statistical expression. Based on the above results, we can conclude that productivity is not affected by quantity but by the quality of each solution.
ConclusionMarketing management is not just a management of an organization's marketing activities, but also includes the management of all activities whose main focus and focus is customer satisfaction and exploiting market opportunities. Based on our research, the following questions were identified for further research:
• What do companies mean by marketing information system?
• How is the marketing department managed?• Specification of the division of marketing
activities into internally and externally managed,
• Supplier relationship management as part of CRM.
• Implementing customer relationship management in business processes,
• Monitoring and analysis of the competition and its importance for business activities.

[36]
Analysis of the Current Support of E-marketing Activities in Selected Enterprises of the Wine Sector in Slovakia
• Marketing management is not only a management of the marketing activities of an organization, but also includes the management of all activities whose main focus and focus is customer satisfaction and exploiting market opportunities. specific research of the relevant workplace.
Our research has also shown that most of the companies surveyed have a lack of work capacity, related in some cases to a lack of qualified marketing staff. Companies are also struggling with a lack of time (which is partly related) and in many companies marketing is also overlooked, it is not seen as the key factors of success and competitiveness of the agricultural company, it is not perceived as a source of sales growth and thus profit. Companies often have no marketing concept in place - some see this as their weakness. However, many companies are unable to answer the question of weaknesses in marketing management at all, so it can be assumed that they do not deal with marketing management. Several companies also mention ineffective communication within the organization itself or marketing with other departments. A similar research was
carried out in 2016 by Kahraman et al., (2016) and has some similar conclusions in our research:
• Marketing management belongs to non-systematic and intuitively solved business processes,
• In business practice, there is a global trend towards customer orientation,
• Businesses see product quality as their greatest competitive advantage.
Given that the results of the research have not shown a significant impact of other marketing ICT solutions on the monitored indicators, we can recommend investing in the specific solutions mentioned above to effectively achieve higher yields and productivity. These results affect companies' investment decisions when investing in e-commerce services with a focus on sales channels. Especially in the digital era, ICT investment is a critical component of increasing the competitiveness of companies, and many companies are starting to invest cautiously, not investing in large business solutions, but in selected the most effective solutions that boost productivity and profitability the most.
Corresponding authorsdoc. PaedDr. Peter Polakovič, Ph.D.Department of Informatics, Faculty of Economics and ManagementSlovak University of Agriculture, Tr. A. Hlinku 2, Nitra, 949 01, Slovak RepublicE-mail: [email protected]
References[1] Balashova, N., Šilerová, E. and Melikhov, V. (2015) "Developing the Metodology to Form Integrated
Reporting“, AGRIS on-line Papers in Economics and Informatics, Vol. 7, No. 4, pp. 19-29. ISSN 1804-1930. DOI 10.7160/aol.2015.070402.
[2] Business news publishing (2014) "Summary: Marketing 3.0: Review and Analysis of Kotler, Kartajaya and Setiawan's Book“, Primento. ISBN 9782511017982.
[3] Festa, G., Cuomo, T. M., Metallo, G. and Festa, A. (2016) "The (r)evolution of wine marketing mix: From the 4Ps to the 4Es“, Journal of Business Research, Vol. 69, No. 5, pp. 1550-1555. ISSN 0148-2963. DOI 10.1016/j.jbusres.2015.10.015.
[4] Freimer, M. and Horsky, D. (2012) "Periodic Advertising Pulsing in a Competitive Market”, Marketing Science, Vol. 31, No. 4, pp. 637-648. ISSN 1526-548X. DOI 10.1287/mksc.1120.0712.
[5] Giovannoni, E. (2018) "Digital Marketing Planning", Casefive, p. 176. ISBN 9781980355021.
[6] Harrel, G. and Amstrong, G. (2008) "Marketing: connecting with customers“, Chicago Education Press, 586 p. ISBN 09-798-3040-0.
[7] Hosťovecký, M., Mišút, M. and Pribilová, K. (2015) "Web based testing in science education", Springer International Publishing, Vol. 313, pp. 247-254. ISBN 978-3-319-06772-8. DOI 10.1007/978-3-319-06773-5_33.

[37]
Analysis of the Current Support of E-marketing Activities in Selected Enterprises of the Wine Sector in Slovakia
[8] Chen, C. and Amstrong, G. (2007) "International hospitality management: concepts and cases“, Elsevier/Butterworth-Heinemann, 695 p. ISBN 978-075-0666-756.
[9] Kahraman, C., Yazici, I. and Karasan, A. (2016) "A Literature Survey on the Usage of Fuzzy MCDM Methods for Digital Marketing", IGI-Global, Vol. 15, No. 8, pp.1-20. ISSN 2328-1316. DOI 10.4018/978-1-4666-8808-7.ch001.
[10] Kaplan, A. and Haenlein, M. (2010) "Users of the world, unite! The challenges and opportunities of social media“, Business Horizons, Vol. 53, No. 1, pp. 59-68. ISSN 0007-6813. DOI 10.1016/j.bushor.2009.09.003.
[11] Lamb, W. Ch, Hair, F. J. and Mcdaniel, C. (2011) "Essentials of Marketing“, Cengage Learning, p. 672. ISBN 9780538478342.
[12] Machado, C. and Davim, J. P. (2016) "Theory and Application of Business and Management Principles", Springer International Publishing, p. 197. ISBN 978-3-319-28279-4.
[13] Raacke, J. and Bonds, J. (2008) "MySpace and Facebook: Applying the uses and gratifications theory to exploring friend-networking sites“, Cyberpsychology & Behavior, Vol. 11, No. 2, pp. 169-174. ISSN 1557-8364. DOI 10.1089/cpb.2007.0056.
[14] Scheiederjans, D., Cao, E. S. and Scheiederjans, M. (2013) "Enhancing financial performance with social media: An impression management perspective", Decision Support Systems, Vol. 55, No. 4, pp. 911-918. ISSN 0167-9236. DOI 10.1016/j.dss.2012.12.027.
[15] Schembri, S. and Latimer, L. (2016) "Online brand communities: constructing and co-constructing brand culture", Journal of Marketing Management, No. 32, Vol. 7, pp. 628-651. ISSN 2333-6099. DOI 10.1080/0267257X.2015.1117518.
[16] Strauss, J. and Frost, R. (2013) "E-marketing“, Pearson Education Limited. ISBN 978-1-29200041-1.
[17] Šilerová, E. and Kučírková, L. (2008) "Knowledge and information systems“, Agricultural Economics, Vol. 5, No. 0, pp. 217-223. ISSN 0139-570X. DOI 10.17221/245-AGRICECON.
[18] Šimek, P., Vaněk, J. and Jarolímek, J. (2008) "Information and communication technologies and multifunctional agri-food systems in the Czech Republic", Plant, Soil and Environment, Vol. 54, No. 12, pp. 547-551. ISSN 2075-1141.DOI 10.17221/426-PSE.
[19] Tvrdíková, M. (2016) "Increasing the Business Potencial of Companies by Ensuring Continuity of the Development of their Information Systems by Current Information Technologies“, Journal of Business Economics and Management, Vol. 17, No. 3, pp. 475-489. ISSN 1611-1699. DOI 10.3846/16111699.2013.839475.
[20] Vaněk, J., Jarolímek, J. and Vogeltanzová, T. (2011) "Information and Communication Technologies for Regional Development in the Czech Republic – Broadband Connectivity in Rural Areas”, AGRIS on-line Papers in Economics and Informatics, Vol. 3, No. 3, pp. 67-76. ISSN 1804-1930.
[21] Vivek, S. D., Beatty, S. E. and Morgan, R. M. (2012) "Customer engagement: Exploring customer relationships beyond purchase", Journal of Marketing Theory and Practice, Vol. 20, No. 2, pp. 122-146. ISSN 1069-6679. DOI 10.2753/MTP1069-6679200201.
[22] Weistein A. (2013) "Handbook of Market Segmentation: Strategic Targeting for Business and Technology Firms“, Routledge, 260 p. ISBN 978-11-351-8566-4. DOI 10.4324/9780203862483.
[23] Westwood, J. (2011) "How to Write a Marketing Plan (Creating Success)", Kogan Page. ISBN 978-07-494-4554-6.

Agris on-line Papers in Economics and Informatics
[38]
Agris on-line Papers in Economics and Informatics
Volume XI Number 4, 2019
Factors Affecting the Demand for Milk and Dairy Products in the Slovak RepublicĽubica Kubicová, Kristína Predanocyová, Zdenka Kádeková
Department of Marketing and Trade Slovak, Faculty of Economics and Management, University of Agriculture in Nitra, Slovakia
AbstractPaper is aimed at dairy sector in the Slovak Republic with an emphasis on identifying the determinants causing low demand for milk and dairy products. The primary objective is to identify consumer behavior and the main factors affecting consumer choices in choosing milk and dairy products. The primary source of information is created by the results of consumer survey proving the consumption of milk and dairy products is widespread among consumers, with cheese and yoghurt as the most preferred ones. The results of the consumer survey were confronted with a survey aimed at identifying the views of producers and processors of milk and dairy products. We identified the main issues, particularly the low redemption price of milk, lack of milk consumption and the absence of sales support.
KeywordsMilk and dairy products, consumption, factors affecting demand, consumer behavior.
Kubicová, Ľ., Predanocyová, K. and Kádeková, Z. (2019) “Factors Affecting the Demand for Milk and Dairy Products in the Slovak Republic", AGRIS on-line Papers in Economics and Informatics, Vol. 11, No. 4, pp. 39-47. ISSN 1804-1930. DOI 10.7160/aol.2019.110404.
IntroductionMilk and dairy products take an irreplaceable place in everyday food consumption (Nicklas, 2009). Milk consumption has a positive impact on human health, growth and development of the human body (Košičiarová et al., 2017), strengthening of cognitive processes, health protection and prevention of various diseases (The Dairy Council, 2014). Despite the positive effects, it is necessary to solve the problem due to their inadequate consumption, which has been below the recommended intake in recent years (Nagyová et al., 2016). However, an individual satisfaction in food consumption depends more on the social and institutional context (Cecchini et al., 2018). The EU exports approximately 12 % of its dairy production in the form of various dairy products (Mach et al., 2018), but the import of agricultural and food products does not regard only the domestic demand (Smutka et al., 2016). The aim of the paper is to examine the consumption of milk and dairy products in Slovakia and the factors determining buying and consumer behavior.
In Slovakia, the development of consumption of milk and dairy products per capita was accompanied by a fluctuating trend in the period
1997-2017. At present, the consumption of milk and dairy products is 176.1 kg per capita, which represents lower consumption by 20.0% compared to the recommended intake. Development of consumption of milk is not proportional to the total consumption of milk and dairy products in the analyzed period 1997-2017 (Figure 1). In the first reference year, consumption was 75.8 kg per capita and in 2017 only 46.3 kg. Consumption of drinking milk does not cover the recommended intake and falls by almost 50%. Low milk consumption contributes to increasing milk prices and to constantly expanding supply of other dairy products such as cheese and yoghurts (Kubicová and Habánová, 2012).
The consumption of cheese is directly proportional to the total milk and dairy consumption. In the monitored period, a gradual increase in the consumption of cheese was recorded (Figure 2). In 1997, consumption was 6.3 kg and in the last analyzed year up to 11 kg, which represented an increase in consumption by 74.6 %.
Consumption of sour-milk products is similar to consumption of cheese. In the analyzed period 1997-2017 there was a gradual increase in the intake of sour-milk products by Slovak consumers (Figure 3). In connection with mentioned, it is
[39]

Factors Affecting the Demand for Milk and Dairy Products in the Slovak Republic
[40]
Source: own processing according to SO SR, 2018Figure 1: Average Consumption of Drinking Milk in kg per Inhabitant of the Slovak Republic.
Source: own processing according to SO SR, 2018Figure 2: Average Consumption of Cheese in kg per Inhabitant of the Slovak Republic.
Source: own processing according to SO SR, 2018Figure 3: Average Consumption of Sour-Milk Products in kg per Inhabitant of the Slovak Republic .
important to highlight the favorable consumption growth of 212.5 % from 8.0 kg in 1997 to 17 kg in the last reference year. Kubicová and Dobák (2012) emphasize that the increase in consumption of sour-milk products was mainly determined by the increased and varied range of products of domestic and foreign production associated with marketing communication and a wider range of price levels.
Demand for milk and dairy products, is relatively low and is influenced by a large number of factors. Influencing factors are the level of retail prices in relation to the average income of the population the gross domestic product and its distribution among the population, the standard of living, the structure of the market, the intensity of international trade or the individual consumer behavior (Matošková and Gálik, 2016), the gross domestic product and its distribution among the population, the standard of living, the structure
of the market, the intensity of international trade or the individual consumer behavior (Skořepa, 2009; Namiotko and Baleženti, 2017). Consumer behavior can be considered as one of the main factors determining the consumption of milk and dairy products (Polakevičová, 2015). Its essence lies in the search, purchase and consumption of selected foods, which satisfy the basic physiological needs of each consumer (Horská et al., 2009; Fogarassy et al., 2018). The article focuses on demand factors for the consumption of milk and dairy products, but one cannot ignore the role of retails and their influence on shaping this demand, e.g. through innovation (Ćuzović et al., 2017; Śmigielska and Stefańska, 2017).
Materials and methodsThe aim of the paper is to point out the consumption of milk and dairy products in Slovakia,
Factors Affecting the Demand for Milk and Dairy Products in the Slovak Republic
[41]
with an emphasis on the identification of factors related to consumer behavior. This goal was achieved by processing secondary data from the Statistical Office of the Slovak Republic (SO SR) and primary data which were obtained through consumer survey and survey of dairy producers and processors.
The questionnaire survey was conducted on a sample of 516 respondents in Slovakia and was implemented in an electronic version from April to December 2018. Respondents participating in the survey were diversified into 9 categories, by gender (women 64.1 %, males 35.9 %), age (up to 25 years 43.0 %, 26-35 years 23.3 %, 36-50 years 19.2 %, 51-60 years 8.5 %, more than 61 years 6.0 %), residence (countryside 48.6 %, city 51.4) and monthly household income (less than 1,000 Eur 19.8 %, 1,001-2,000 Eur 54.7 %, 2,001-3,500 Eur 23.1 %, 3,501-4,500 Eur 2.1 %, more than 4,501 Eur 0.4 %).
The survey focused on milk and dairy producers and processors was carried out between October and December 2018 by personal and e-mail communications and was attended by 23 companies from Slovakia. Business entities were divided according to legal form of business (cooperative 43.5 %, joint stock company 21.7%, limited liability company 13%, self-employed farmer 13%, self-employed person 8.7%), enterprise size (micro enterprise 30.4%, small enterprise 21.7%, medium enterprise 47.8%) and type of produced milk (cow milk 91.3%, sheep milk 26.1%, goat milk 8.7%).
For a deeper analysis of the research objectives, the following hypotheses were formulated:
Hypothesis 1: We expect that consumers assess the importance of the individual criteria for choosing milk and dairy products differently.
Hypothesis 2: We expect that there is a dependency between average monthly expenditure on milk and dairy products per household member and the average monthly household income.
The formulated hypotheses were tested by applying the following statistical tests:
- Chi-square test for independence of two variables was used a cross classification table to examine the nature of the relationship between these variables. This statistical test assumes that there is no relationship between the two variables (Hypothesis 0). The alternative hypothesis states that there is some relationship between the two variables (Hypothesis 1).
r – count of rows c – count of columns Oi,j – observed numbers of cases Ei,j – expected numbers of cases
- Cramer's coefficient was used to examine the power of correlations
χ2 – calculated test criterionn – count of observations
- Friedman test as the non-parametric alternative to the one-way ANOVA with repeated measures was used to test for differences between groups when the dependent variable being measured is ordinal. It can also be used for continuous data that has violated the assumptions necessary to run the one-way ANOVA with repeated measures (e.g., data that has marked deviations from normality).
- Nemeny's method was used to determine which random selections from the pooled random selection differ considerably provided that all selections are of the same range (Matejková et al., 2013; Stehlíková, 2005)
All the above-mentioned tests have been calculated in statistical software XL Stat. In hypothesis testing, if the p-value is lower than significant level 0.05, the null hypothesis is rejected, and the alternative hypothesis is confirmed.
Results and discussionThe results of the consumer survey (Figure 4) proved that the respondents purchased all kinds of dairy products, with milk and cheese as the most preferred ones. This is confirmed by the fact that milk (56.4 %), cheese (57.0 %), butter (51.7 %) and yogurt (51.4 %) are most commonly bought and consumed by consumers in regular intervals. Kubelaková and Šugrová (2017) have come to similar conclusions, that
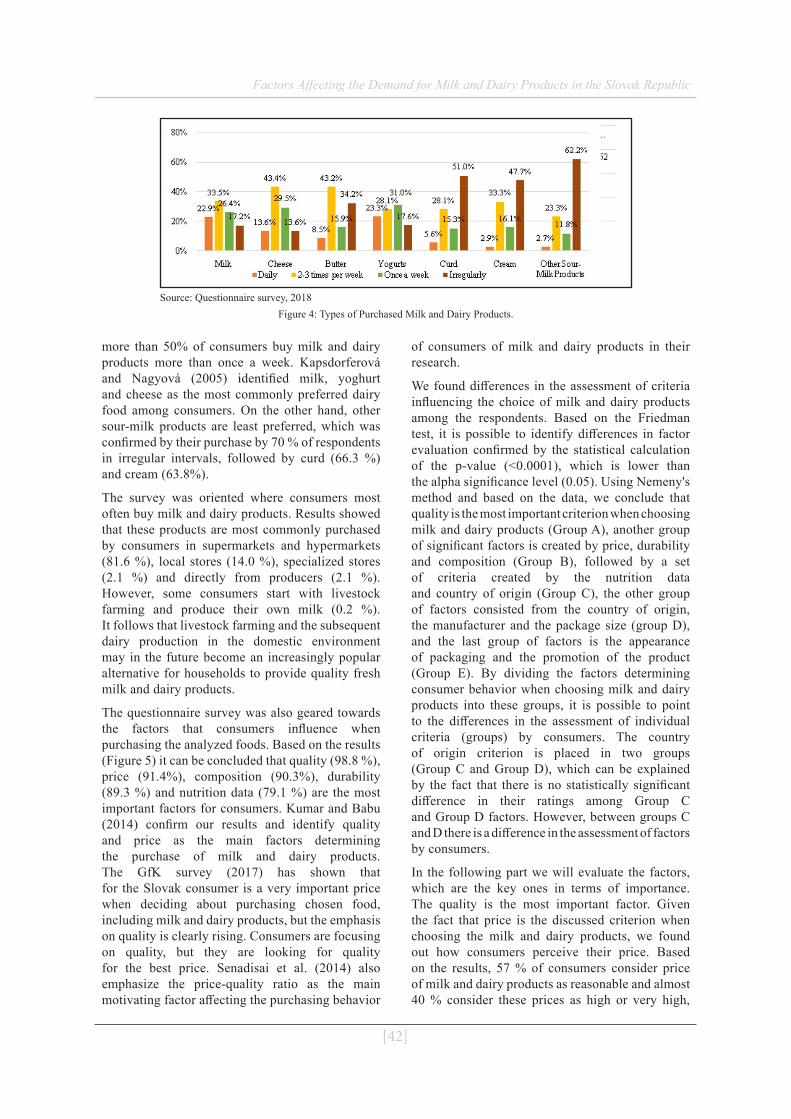
Factors Affecting the Demand for Milk and Dairy Products in the Slovak Republic
[42]
more than 50% of consumers buy milk and dairy products more than once a week. Kapsdorferová and Nagyová (2005) identified milk, yoghurt and cheese as the most commonly preferred dairy food among consumers. On the other hand, other sour-milk products are least preferred, which was confirmed by their purchase by 70 % of respondents in irregular intervals, followed by curd (66.3 %) and cream (63.8%).
The survey was oriented where consumers most often buy milk and dairy products. Results showed that these products are most commonly purchased by consumers in supermarkets and hypermarkets (81.6 %), local stores (14.0 %), specialized stores (2.1 %) and directly from producers (2.1 %). However, some consumers start with livestock farming and produce their own milk (0.2 %). It follows that livestock farming and the subsequent dairy production in the domestic environment may in the future become an increasingly popular alternative for households to provide quality fresh milk and dairy products.
The questionnaire survey was also geared towards the factors that consumers influence when purchasing the analyzed foods. Based on the results (Figure 5) it can be concluded that quality (98.8 %), price (91.4%), composition (90.3%), durability (89.3 %) and nutrition data (79.1 %) are the most important factors for consumers. Kumar and Babu (2014) confirm our results and identify quality and price as the main factors determining the purchase of milk and dairy products. The GfK survey (2017) has shown that for the Slovak consumer is a very important price when deciding about purchasing chosen food, including milk and dairy products, but the emphasis on quality is clearly rising. Consumers are focusing on quality, but they are looking for quality for the best price. Senadisai et al. (2014) also emphasize the price-quality ratio as the main motivating factor affecting the purchasing behavior
of consumers of milk and dairy products in their research.
We found differences in the assessment of criteria influencing the choice of milk and dairy products among the respondents. Based on the Friedman test, it is possible to identify differences in factor evaluation confirmed by the statistical calculation of the p-value (<0.0001), which is lower than the alpha significance level (0.05). Using Nemeny's method and based on the data, we conclude that quality is the most important criterion when choosing milk and dairy products (Group A), another group of significant factors is created by price, durability and composition (Group B), followed by a set of criteria created by the nutrition data and country of origin (Group C), the other group of factors consisted from the country of origin, the manufacturer and the package size (group D), and the last group of factors is the appearance of packaging and the promotion of the product (Group E). By dividing the factors determining consumer behavior when choosing milk and dairy products into these groups, it is possible to point to the differences in the assessment of individual criteria (groups) by consumers. The country of origin criterion is placed in two groups (Group C and Group D), which can be explained by the fact that there is no statistically significant difference in their ratings among Group C and Group D factors. However, between groups C and D there is a difference in the assessment of factors by consumers.
In the following part we will evaluate the factors, which are the key ones in terms of importance. The quality is the most important factor. Given the fact that price is the discussed criterion when choosing the milk and dairy products, we found out how consumers perceive their price. Based on the results, 57 % of consumers consider price of milk and dairy products as reasonable and almost 40 % consider these prices as high or very high,
Source: Questionnaire survey, 2018Figure 4: Types of Purchased Milk and Dairy Products.
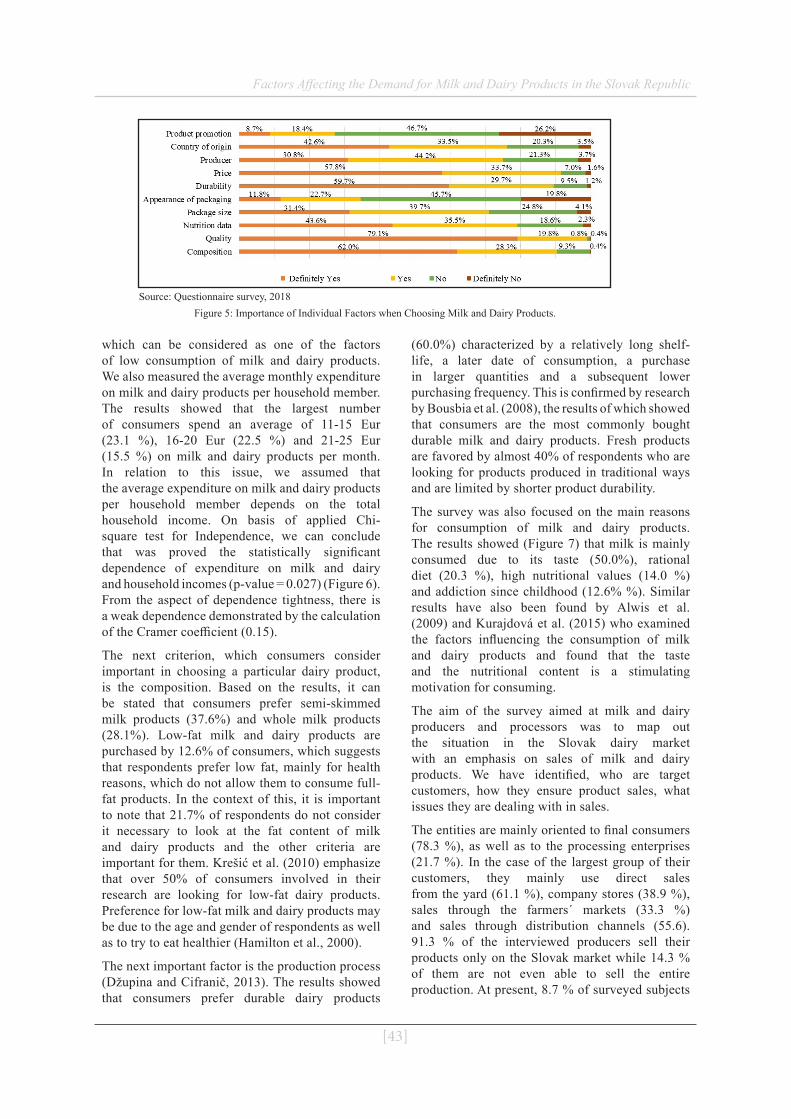
Factors Affecting the Demand for Milk and Dairy Products in the Slovak Republic
[43]
Source: Questionnaire survey, 2018Figure 5: Importance of Individual Factors when Choosing Milk and Dairy Products.
which can be considered as one of the factors of low consumption of milk and dairy products. We also measured the average monthly expenditure on milk and dairy products per household member. The results showed that the largest number of consumers spend an average of 11-15 Eur (23.1 %), 16-20 Eur (22.5 %) and 21-25 Eur (15.5 %) on milk and dairy products per month. In relation to this issue, we assumed that the average expenditure on milk and dairy products per household member depends on the total household income. On basis of applied Chi-square test for Independence, we can conclude that was proved the statistically significant dependence of expenditure on milk and dairy and household incomes (p-value = 0.027) (Figure 6). From the aspect of dependence tightness, there is a weak dependence demonstrated by the calculation of the Cramer coefficient (0.15).
The next criterion, which consumers consider important in choosing a particular dairy product, is the composition. Based on the results, it can be stated that consumers prefer semi-skimmed milk products (37.6%) and whole milk products (28.1%). Low-fat milk and dairy products are purchased by 12.6% of consumers, which suggests that respondents prefer low fat, mainly for health reasons, which do not allow them to consume full-fat products. In the context of this, it is important to note that 21.7% of respondents do not consider it necessary to look at the fat content of milk and dairy products and the other criteria are important for them. Krešić et al. (2010) emphasize that over 50% of consumers involved in their research are looking for low-fat dairy products. Preference for low-fat milk and dairy products may be due to the age and gender of respondents as well as to try to eat healthier (Hamilton et al., 2000).
The next important factor is the production process (Džupina and Cifranič, 2013). The results showed that consumers prefer durable dairy products
(60.0%) characterized by a relatively long shelf-life, a later date of consumption, a purchase in larger quantities and a subsequent lower purchasing frequency. This is confirmed by research by Bousbia et al. (2008), the results of which showed that consumers are the most commonly bought durable milk and dairy products. Fresh products are favored by almost 40% of respondents who are looking for products produced in traditional ways and are limited by shorter product durability.
The survey was also focused on the main reasons for consumption of milk and dairy products. The results showed (Figure 7) that milk is mainly consumed due to its taste (50.0%), rational diet (20.3 %), high nutritional values (14.0 %) and addiction since childhood (12.6% %). Similar results have also been found by Alwis et al. (2009) and Kurajdová et al. (2015) who examined the factors influencing the consumption of milk and dairy products and found that the taste and the nutritional content is a stimulating motivation for consuming.
The aim of the survey aimed at milk and dairy producers and processors was to map out the situation in the Slovak dairy market with an emphasis on sales of milk and dairy products. We have identified, who are target customers, how they ensure product sales, what issues they are dealing with in sales.
The entities are mainly oriented to final consumers (78.3 %), as well as to the processing enterprises (21.7 %). In the case of the largest group of their customers, they mainly use direct sales from the yard (61.1 %), company stores (38.9 %), sales through the farmers´ markets (33.3 %) and sales through distribution channels (55.6). 91.3 % of the interviewed producers sell their products only on the Slovak market while 14.3 % of them are not even able to sell the entire production. At present, 8.7 % of surveyed subjects
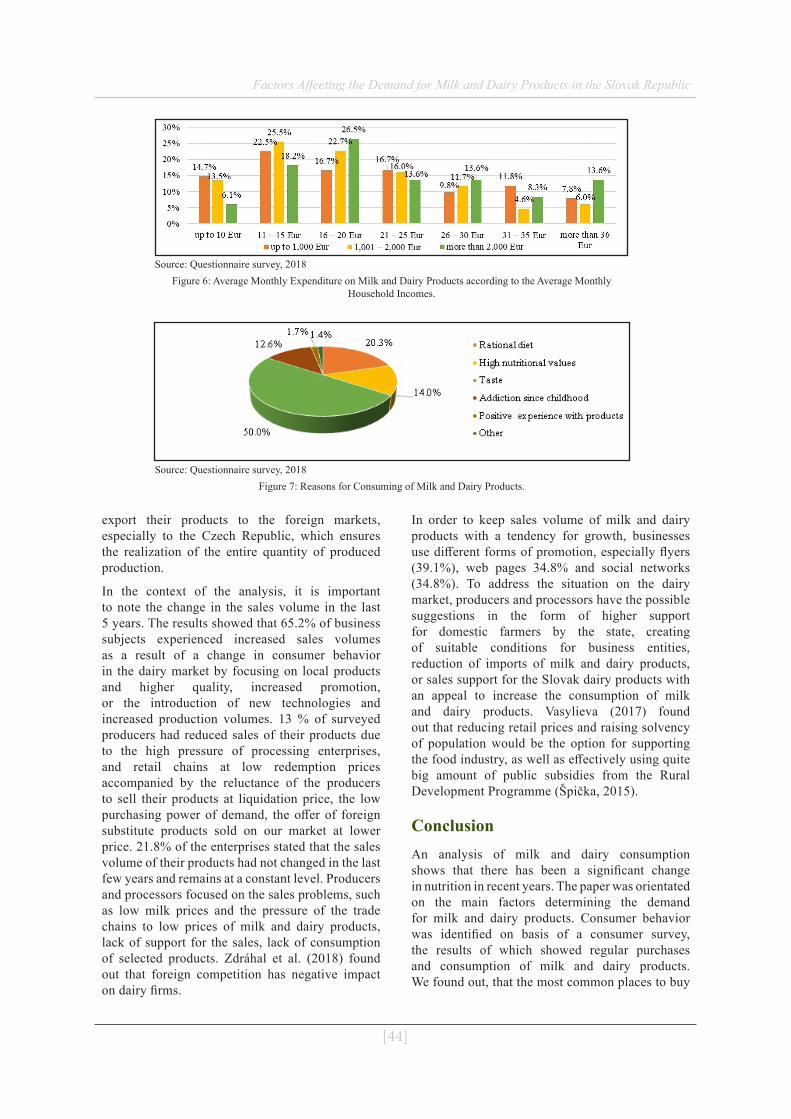
Factors Affecting the Demand for Milk and Dairy Products in the Slovak Republic
[44]
Source: Questionnaire survey, 2018Figure 6: Average Monthly Expenditure on Milk and Dairy Products according to the Average Monthly
Household Incomes.
Source: Questionnaire survey, 2018Figure 7: Reasons for Consuming of Milk and Dairy Products.
export their products to the foreign markets, especially to the Czech Republic, which ensures the realization of the entire quantity of produced production.
In the context of the analysis, it is important to note the change in the sales volume in the last 5 years. The results showed that 65.2% of business subjects experienced increased sales volumes as a result of a change in consumer behavior in the dairy market by focusing on local products and higher quality, increased promotion, or the introduction of new technologies and increased production volumes. 13 % of surveyed producers had reduced sales of their products due to the high pressure of processing enterprises, and retail chains at low redemption prices accompanied by the reluctance of the producers to sell their products at liquidation price, the low purchasing power of demand, the offer of foreign substitute products sold on our market at lower price. 21.8% of the enterprises stated that the sales volume of their products had not changed in the last few years and remains at a constant level. Producers and processors focused on the sales problems, such as low milk prices and the pressure of the trade chains to low prices of milk and dairy products, lack of support for the sales, lack of consumption of selected products. Zdráhal et al. (2018) found out that foreign competition has negative impact on dairy firms.
In order to keep sales volume of milk and dairy products with a tendency for growth, businesses use different forms of promotion, especially flyers (39.1%), web pages 34.8% and social networks (34.8%). To address the situation on the dairy market, producers and processors have the possible suggestions in the form of higher support for domestic farmers by the state, creating of suitable conditions for business entities, reduction of imports of milk and dairy products, or sales support for the Slovak dairy products with an appeal to increase the consumption of milk and dairy products. Vasylieva (2017) found out that reducing retail prices and raising solvency of population would be the option for supporting the food industry, as well as effectively using quite big amount of public subsidies from the Rural Development Programme (Špička, 2015).
ConclusionAn analysis of milk and dairy consumption shows that there has been a significant change in nutrition in recent years. The paper was orientated on the main factors determining the demand for milk and dairy products. Consumer behavior was identified on basis of a consumer survey, the results of which showed regular purchases and consumption of milk and dairy products. We found out, that the most common places to buy
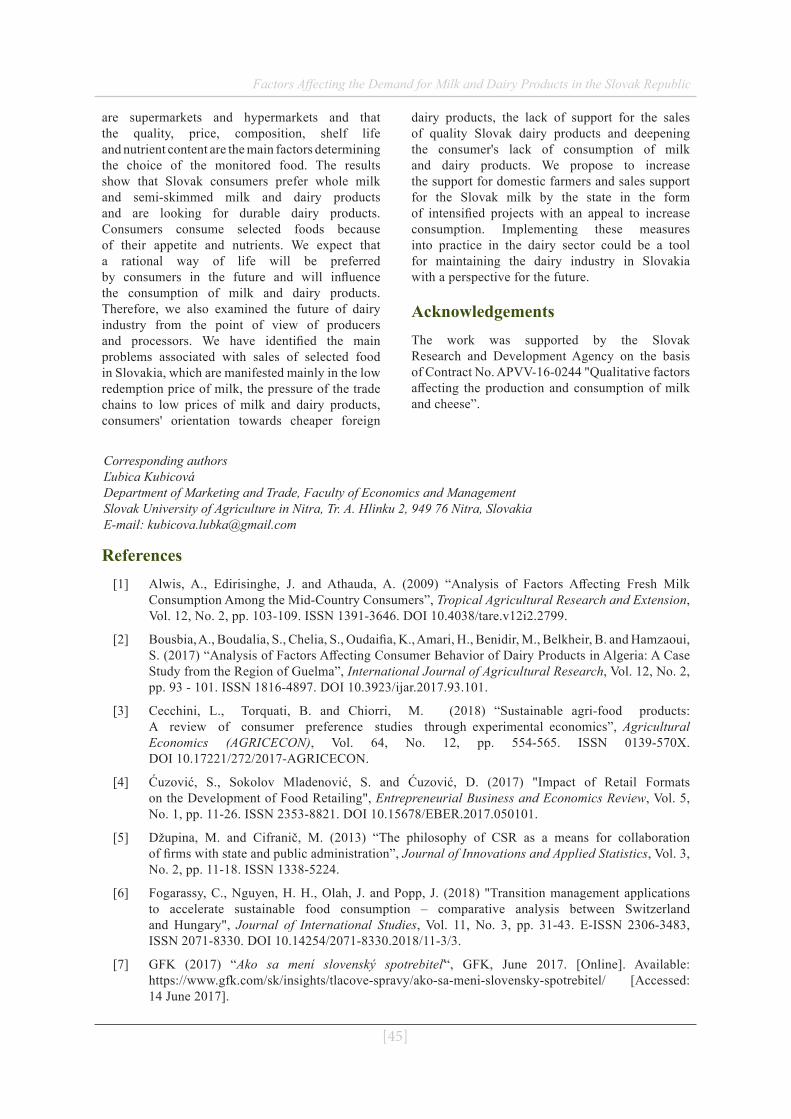
Factors Affecting the Demand for Milk and Dairy Products in the Slovak Republic
[45]
are supermarkets and hypermarkets and that the quality, price, composition, shelf life and nutrient content are the main factors determining the choice of the monitored food. The results show that Slovak consumers prefer whole milk and semi-skimmed milk and dairy products and are looking for durable dairy products. Consumers consume selected foods because of their appetite and nutrients. We expect that a rational way of life will be preferred by consumers in the future and will influence the consumption of milk and dairy products. Therefore, we also examined the future of dairy industry from the point of view of producers and processors. We have identified the main problems associated with sales of selected food in Slovakia, which are manifested mainly in the low redemption price of milk, the pressure of the trade chains to low prices of milk and dairy products, consumers' orientation towards cheaper foreign
dairy products, the lack of support for the sales of quality Slovak dairy products and deepening the consumer's lack of consumption of milk and dairy products. We propose to increase the support for domestic farmers and sales support for the Slovak milk by the state in the form of intensified projects with an appeal to increase consumption. Implementing these measures into practice in the dairy sector could be a tool for maintaining the dairy industry in Slovakia with a perspective for the future.
AcknowledgementsThe work was supported by the Slovak Research and Development Agency on the basis of Contract No. APVV-16-0244 "Qualitative factors affecting the production and consumption of milk and cheese”.
Corresponding authorsĽubica KubicováDepartment of Marketing and Trade, Faculty of Economics and Management Slovak University of Agriculture in Nitra, Tr. A. Hlinku 2, 949 76 Nitra, SlovakiaE-mail: [email protected]
References[1] Alwis, A., Edirisinghe, J. and Athauda, A. (2009) “Analysis of Factors Affecting Fresh Milk
Consumption Among the Mid-Country Consumers”, Tropical Agricultural Research and Extension, Vol. 12, No. 2, pp. 103-109. ISSN 1391-3646. DOI 10.4038/tare.v12i2.2799.
[2] Bousbia, A., Boudalia, S., Chelia, S., Oudaifia, K., Amari, H., Benidir, M., Belkheir, B. and Hamzaoui, S. (2017) “Analysis of Factors Affecting Consumer Behavior of Dairy Products in Algeria: A Case Study from the Region of Guelma”, International Journal of Agricultural Research, Vol. 12, No. 2, pp. 93 - 101. ISSN 1816-4897. DOI 10.3923/ijar.2017.93.101.
[3] Cecchini, L., Torquati, B. and Chiorri, M. (2018) “Sustainable agri-food products: A review of consumer preference studies through experimental economics”, Agricultural Economics (AGRICECON), Vol. 64, No. 12, pp. 554-565. ISSN 0139-570X. DOI 10.17221/272/2017-AGRICECON.
[4] Ćuzović, S., Sokolov Mladenović, S. and Ćuzović, D. (2017) "Impact of Retail Formats on the Development of Food Retailing", Entrepreneurial Business and Economics Review, Vol. 5, No. 1, pp. 11-26. ISSN 2353-8821. DOI 10.15678/EBER.2017.050101.
[5] Džupina, M. and Cifranič, M. (2013) “The philosophy of CSR as a means for collaboration of firms with state and public administration”, Journal of Innovations and Applied Statistics, Vol. 3, No. 2, pp. 11-18. ISSN 1338-5224.
[6] Fogarassy, C., Nguyen, H. H., Olah, J. and Popp, J. (2018) "Transition management applications to accelerate sustainable food consumption – comparative analysis between Switzerland and Hungary", Journal of International Studies, Vol. 11, No. 3, pp. 31-43. E-ISSN 2306-3483, ISSN 2071-8330. DOI 10.14254/2071-8330.2018/11-3/3.
[7] GFK (2017) “Ako sa mení slovenský spotrebiteľ“, GFK, June 2017. [Online]. Available: https://www.gfk.com/sk/insights/tlacove-spravy/ako-sa-meni-slovensky-spotrebitel/ [Accessed: 14 June 2017].
Factors Affecting the Demand for Milk and Dairy Products in the Slovak Republic
[46]
[8] Hamilton, J., Knox, B., Hill, D. and Parr, H. (2000) “Reduced fat products – Consumer perceptions and preferences”, British Food Journal, Vol. 102, No. 7, pp. 494-506. ISSN 0007-070X. DOI 10.1108/00070700010336454.
[9] Horská, E., Nagyová, Ľ., Stávková, J., Turčínková, J., Stejskal, L., Bolaños, R. M., Araque Padilla, R. A., Montero Simó, M. J., Ramírez Sobrino, J. N., Matysik-Pejas, R. and Szafrańska, M. (2009) “Európsky spotrebiteľ a spotrebiteľské správanie” (In Slovak), Nitra, Slovenská poľnohospodárska univerzita v Nitre, 219 p. ISBN 978-80-5520-318-8.
[10] Kapsdorferová, Z. and Nagyová, Ľ. (2005) “Consumer behavior at the Slovak dairy market. Spotrebiteľské správanie na slovenskom trhu mlieka a mliečnych výrobkov“ (in Slovak), Agricultural Economics (AGRICECON), Vol. 51, No. 8, pp. 362-368. ISSN 1805-9295. DOI 10.17221/5120-AGRICECON.
[11] Košičiarová, I., Nagyová, Ľ. and Holienčinová, M. (2017) “Consumer behaviour on Slovak yoghurt and fermented milk products market”, Acta Universitatis Agriculturae et Silviculturae Mendelianae Brunensis, Vol. 65, No. 6, pp. 1967-1978. ISSN 2464-8310. DOI 10.11118/actaun201765061967.
[12] Krešić, G., Herceg, Z., Lelas, V. and Režek Jambrak, A. (2010) “Consumers’ behaviour and motives for selection of dairy beverages in Kvarner region: a pilot study”, Mljekarstvo, Vol. 60, No. 1, pp. 50 – 58. ISSN 1846-4025.
[13] Kubelaková, A. and Šugrová, M. (2017) “Habit or choice? The decision - making process of young generation in purchasing dairy products in the Slovak Republic”, International Day of Science 2017 - economics, management, innovation, Moravian University Olomouc, pp. 113-120. ISBN 978-80-7455-060-7.
[14] Kubicová, Ľ. and Dobák, D. (2012) “Vývoj a úroveň spotreby mlieka a mliečnych výrobkov v SR a modelovanie dopytu po potravinách vo vybraných skupinách domácností” (In Slovak), Slovakian Agriculturtal University in Nitra, p. 88. ISBN 978-80-552-0821-3.
[15] Kubicová, Ľ. and Habánová, M. (2012) “Development of milk consumption and marketing analysis of its demand”, Potravinárstvo, Vol. 6, No. 4, pp. 66-72. ISSN 1337-0960. DOI 10.5219/236.
[16] Kumar, A. and Babu, S. (2014) “Factors Influencing Consumer Buying Behavior with Special Reference to Dairy Products in Pondicherry State”, International Monthly Refereed Journal of Research in Management and Technology, Vol. 3, No. 1, pp. 65-73. ISSN 2320-0073.
[17] Kurajdová, K., Táborecká-Petrovičová, J. and Kaščáková, A. (2015) “Factors influencing milk consumption and purchase behavior – evidence from Slovakia“, Procedia Economics and Finance, Vol. 34, No. 1, pp. 573-580. ISSN 2212-5671. DOI 10.1016/S2212-5671(15)01670-6.
[18] Mach, J., Dvořák, M. and Hošková, P. (2018) “EU Milk and Dairy Market Changes and Impact of Globalisation Trends” (In Czech), Globalization and its socio-economic consequences”, Part III.- Economic Progress in Post-Soviet Countries. 10.10.2018, Rajecke Teplice, Slovakia; Zilina, Slovakia: University of Zilina, pp. 1204-1212. ISSN 2454-0943.
[19] Matejková, E., Pietriková, M. and Poláková, Z. (2013) “Praktikum zo štatistiky A” (In Slovak), Slovenská poľnohospodárska univerzita v Nitre, p. 200. ISBN 978-80-552-1050-6.
[20] Matošková, D. and Gálik, J. (2016) “Trh s mliekom a mliečnymi výrobkami a jeho prognóza do roku 2020”, Ekonomika poľnohospodárstva, Vol. 16, No. 2, pp. 44-62. ISSN 1335-6186.
[21] Namiotko, V. and Baležentis, T. (2017) "Dynamic Efficiency under Investment Spikes in Lithuanian Cereal and Dairy Farms, Economics and Sociology, Vol. 10, No. 2, pp. 33-46. ISSN 2071-789X. DOI 10.14254/2071-789X.2017/10-2/3.
[22] Nagyová, Ľ., Holienčinová, M., Košičiarová, I. and Holota, T. (2016) “Corporate social responsibility in food manufacturing companies - environmental dimensions“, Acta Universitatis Agriculturae et Silviculturae Mendelianae Brunensis. Vol. 64, No.3, pp. 1037-1043. ISSN 1211-8516. DOI 10.11118/actaun201664031037.
Factors Affecting the Demand for Milk and Dairy Products in the Slovak Republic
[47]
[23] Nicklas, T. A., O’Neil, C. E. and Fulgoni, V. L. (2009) “The role of dairy in meeting the recommendations for shortfall nutrients in the American diet”, The Journal of the American College of Nutrition, Vol. 28, No. 1, pp. 73-81. ISSN 0731-5724. DOI 10.1080/07315724.2009.10719807.
[24] Polakevičová, I. (2015) “Application of transactional analysis in marketing research - models of the hierarchy of effects of marketing communication and structural analysis”, Prohuman, Vol. 7, No. 2, pp. 167-173. ISSN 1338-1415.
[25] Senadisai, P., Trimetsoontorn, J. and Fongswan, W. (2014) “Model of Factors Influencing the Intention to Purchase Lactose-free Milk for the Population of Bankok”, Research Journal of Business Management, Vol. 8, No. 3, pp. 284-293. ISSN 2152-0437. DOI 10.3923/rjbm.2014.284.293.
[26] Śmigielska, G. and Stefańska, M. (2017) "Innovative Positioning as a Marketing Tool of Retailers on the Food Market", Entrepreneurial Business and Economics Review, Vol. 5, No. 1, pp. 77-90. ISSN 2353-8821. DOI 10.15678/EBER.2017.050105.
[27] Smutka,L., Svatoš, M., Tomšík, K. and Sergienko,O. I. (2016) “Foreign trade in agricultural products in the Czech Republic”, Agricultural Economics (AGRICECON), Vol. 62, No. 1, pp. 9-25. ISSN 0139-570X. DOI 10.17221/18/2015-AGRICECON.
[28] Statistical Office of the Slovak Republic. (2018) “Databases”. Statistical Office of the Slovak Republic, Dec. 2018. [Online]. Available: https://slovak.statistics.sk/wps/portal/ ext/Databases [Accessed: 6 Dec. 2018].
[29] Stehlíková, B. (2005) “Neparametrické štatistické metódy“, Nitra, Slovenská poľnohospodárska univerzita in Nitra, p. 63. ISBN 80-8069-496-6. (In Slovak)
[30] Špička, J. (2015) “The Efficiency Improvement of Central European Corporate Milk Processors in 2008 - 2013”, AGRIS on-line Papers in Economics and Informatics, Vol. 7, No. 4, pp. 175-188. ISSN 1804-1930. DOI 10.7160/aol.2015.070417.
[31] The Dairy Council (2016) “Milk”, The Dairy Council, Jan. 2016. [Online]. Available: https://www.milk.co.uk/hcp/wp-content/uploads/sites/2/woocommerce_uploads/2016/ 12/Milk_consumer_2016.pdf [Accessed: 01 Jan. 2016].
[32] Vasylieva, V. (2017) “Economic Aspects of Food Security in Ukrainian Meat and Milk Clusters“, AGRIS on-line Papers in Economics and Informatics, Vol. 9, No. 3, pp. 81-92. ISSN 1804-1930. DOI 10.7160/aol.2017.090308.
[33] Zdráhal, I., Chmelíková, G. and Blažková, I. (2018) “Sector-Wide and Country-Specific Drivers of Firm Performance in the Visegrad Group Dairy Industry“, AGRIS on-line Papers in Economics and Informatics, Vol. 10, No. 4, pp. 89-100. ISSN 1804-1930. DOI 10.7160/aol.2018.100410.

Agris on-line Papers in Economics and Informatics
[48]
[49]
Agris on-line Papers in Economics and Informatics
Volume XI Number 4, 2019
Does Wine Quality Have a Bearing on Exports?Anthony Macedo, Sofia Gouveia, João Rebelo
Department of Economics, Sociology and Management, Centre for Transdisciplinary Development Studies, University of Trás-os-Montes and Alto Douro, Vila Real, Portugal
AbstractThis study examines the macroeconomic determinants of exports, taking quality into account through vertical differentiation and using data on Portuguese Douro wines. Based on a gravity model from 2006 to 2015 and covering a range of 192 potential trade partners, estimations show that quality influences export performance. However, quality differences are not assimilated in the same way in all international markets, resulting in an export surplus of the best categories of wine to some world regions (West Europe and Anglo-Saxon countries) and a correspondingly export deficit to other regions (Middle East, North Africa, East Europe and Central Asia).
JEL classification codes: F14; L15; L66
KeywordsVertical differentiation; Market segmentation; Gravity model; Douro wine.
Macedo, A., Gouveia, S. and Rebelo, J. (2019) “Does Wine Quality Have a Bearing on Exports?", AGRIS on-line Papers in Economics and Informatics, Vol. 11, No. 4 pp. 49-59. ISSN 1804-1930. DOI 10.7160/aol.2019.110405.
IntroductionIn today’s globalized world, the economic performance of a country is closely related to the world market competitiveness of its key products. Wine is a typical product of globalization for which international trade started to increase significantly in the 1970s (Castillo et al., 2016) but has recently undergone a slowdown of growth (Pomarici, 2016). Since the 1970s, new exporting countries have emerged and demand for wine has flourished worldwide, which has in turn, led to diversification of the product, changes in consumption patterns and increasing competition between players at an international level.
Therefore, having an understanding of the determinants of exports is crucial in the decision-making process of stakeholders. Much of the debate over the factors influencing international trade centres on the gravity model formulated by Tinbergen (1962) and later enriched by the contributions of Anderson (1979), Helpman (1984, 1987), Helpman and Krugman (1985), Bergstrand (1985, 1989), Eaton and Kortum (2002), Anderson and van Wincoop (2003), and Silva and Tenreyro (2006), among others. From this perspective, there is
a substantial amount of literature focusing on the determinants of the international wine trade (Dascal et al., 2002; Castillo et al., 2016; Dal Bianco et al., 2016; Lombardi et al., 2016; Balogh and Jámbor, 2018). However, most attention has been focused on horizontal differentiation while the influence of vertical differentiation on wine exports has not been the subject of so much interest, despite the recognition that quality differentials exist in the wine industry (Cardebat and Figuet, 2004)1. Some studies (e.g., Schamel, 2006; Brentari et al., 2011) explore this perspective estimating the hedonic price function to support the idea that wines with geographical indications (horizontal differentiation) benefit from collective reputation because they are commonly perceived as guarantees of quality for which consumers are willing to pay more. Other approaches attempting to study
1 Comparing different varieties of a product equally priced, there is horizontal differentiation if consumers have heterogeneous preferences regarding the most preferred mix of different attributes. If, on the contrary, most of the consumers unanimously agree on a quality index then the product is vertically differentiated (Church and Ware, 2000). Wine is a product horizontally differentiated in the sense that consumers do not have the same willingness to pay for some attributes (e.g., colour, alcohol content, place of origin or grape varietal composition), but it is also vertically differentiated in the sense that these attributes can together generate quality differentials, usually reflected in the prices (Boccard, 2010).
[50]
Does Wine Quality Have a Bearing on Exports?
the impact of quality on wine exports are presented by Agostino and Trivieri (2014, 2016) and Crozet et al. (2012), the former using the gravity model to estimate an export surplus for the wines of France, Spain and Italy with geographical indications, and the latter matching firm-level export data with expert assessments of quality to suggest that, for champagne producers, quality increases firm-level prices, the probability of market entry, and export values.
This study aims to contribute to the debate on the impact of quality on international trade by means of testing if an increment of quality within a Protected Designation of Origin (PDO) generates an export surplus. Additionally, it is also a goal of this study to determine whether quality differences are homogeneously interpreted across world regions. To do this, PDO Douro wine (henceforth Douro wine) is used as an example of a differentiated product with recent success in international markets. Considering 192 partner countries divided into nine world regions, an expanded gravity equation for the period 2006-2015 is estimated through Bonus Vetus OLS (BVOLS). This estimator allows for repeated time values within the panel, as well as controlling for multilateral resistance (MR) terms.
The contribution of this paper is threefold. First, it provides a new perspective to the debate about the relationship between quality and international trade by considering the exports of different categories within a PDO. Second, this study brings to the discussion the role of market segmentation in highly competitive markets and how quality is apprehended by distinct world regions. Third, this paper presents a different methodology from most of the wine trade literature (recently inclined to the Poisson pseudo-maximum likelihood) whilst fitting in well with the question under study, as BVOLS is an estimator capable of considering the trade flows of several categories between two trade partners in each year, while controlling for MR terms.
The rest of the paper is organized as follows. The section Material and Methods provides an overview of the literature about the relationship between product quality and international trade, describes the empirical approach and present the data. The section Results and Discussion shows and analyses the results. Finally, the section Conclusion summarizes the main findings.
Materials and methodsProduct quality and international trade: an overview
Product quality was introduced to the literature on international trade by the seminal work of Linder (1961), where it was proposed that higher quality products are more likely to be traded between rich countries and the more similar the demand structures of countries, the more they will trade with one another. Since then, the relationship between product quality and trade has been the subject of research using different approaches, which can be divided into two main strands: one studying the attributes of exporting and importing countries (e.g., Hummels and Skiba, 2004; Schott, 2004; Hummels and Klenow, 2005; Khandelwal, 2010; Agostino and Trivieri, 2014); and the other, inspired by the seminal paper of Melitz (2003), exploring models with firms heterogeneity and firm-level data (e.g., Verhoogen, 2008; Crozet et al., 2012; Manova and Zhang, 2012).
Among the first strand, Hummels and Skiba (2004) generalize the Alchian and Allen’s (1972) conjecture2 and show empirically that the relative price of high-quality products decreases when transaction cost is applied per unit, which leads to a positive co-variation between high quality and transaction costs. Schott (2004), Hummels and Klenow (2005) and Khandelwal (2010) suggest that quality increase along with higher per capita income of exporting countries due to endowment advantage can, in turn, be used to add further quality to products. Additionally, Hummels and Klenow (2005) highlight the relevance of quality by estimating that a 9 percent difference in real income per worker between countries may ultimately be a reflection of differences in quality between those countries. The study of Khandelwal (2010) has the particularity of inferring quality based on value and quantity information, following the intuition that, conditional on price, higher quality is assigned to products with higher market shares. The author also states that it is misleading to use price alone as a proxy of quality since price also reflects production costs. Agostino and Trivieri (2014), using a gravity equation for wine exports of France, Italy and Spain, find there is a positive pay-off for quality wines produced in specified regions (QWPSR) in terms of greater export value
2 Due to transportation costs, goods of higher quality are exported, while the ones with lower quality are for domestic consumption.
[51]
Does Wine Quality Have a Bearing on Exports?
compared to all other still wines3. They conclude that, despite this designation generating additional costs of compliance, it produces benefit from collective reputation, which acts as a certification of quality.
In the second strand of the literature, Verhoogen (2008) investigates Mexican manufacturing plants and argues that an increase in exports leads to wage inequality through quality upgrading4. The study of Manova and Zhang (2012) using data on Chinese trading firms concludes that trade reforms may lead firms to vary product quality within and across markets5. Ultimately, a common limitation of this strand of the literature is the difficulty in quantifying quality and Crozet et al. (2012) solve this by using experts’ ratings for champagne producers, which lead to the finding that an improvement in quality increases not only firm-level prices, but also the probability of market entry, as well as export values.
The gravity equation of wine exports
In the literature, gravity models have established themselves as key tools for the analysis of international trade. This is also true for wine trade studies, which have highlighted the influence on trade between two countries of factors such as gross domestic product (GDP) per capita, distance, contiguity, common language, common currency and trade agreements (e.g. Dascal et al., 2002; Olper et al., 2012; Castillo et al., 2016; Dal Bianco et al., 2016; Lombardi et al., 2016; Dal Bianco et al., 2017; Gouveia et al., 2018). GDP per capita represents purchasing power, therefore it is expected that countries with higher purchasing power should import more Douro wine as happens with other wines (e.g., Dascal et al., 2002; Gouveia et al., 2018). Distance between trade partners is a common proxy variable for transport costs and has a negative impact on trade in several
3 Agostino and Trivieri (2016) corroborate with this result providing also empirical evidence on the performance of geographically designated and indicated wines in emerging economies. 4 In the model of Verhoogen (2008) with heterogeneous plants and quality differentiation, more productive plants produce higher-quality goods than less productive plants, and they pay higher wages to maintain a higher-quality workforce. Only the most productive plants enter the export market, so if there is any bilateral reduction in trade costs (e.g., trade agreement, declining transport cost or exchange-rate devaluation) it will increase the differential in the export share as well as the within industry differentials in quality and, consequently, wages.5 The research of Manova and Zhang (2012) has two main implications: i) successful exporters have products of better quality because they use higher-quality inputs, and; ii) by using different levels of quality in inputs, firms can export products with different quality across destinations.
studies (e.g., Castillo et al., 2016; Dal Bianco et al., 2016, 2017; Lombardi et al., 2016). Cultural and historical proximity can benefit the trade relationship between two countries and contiguity and common language are two typical proxies for it; the positive impact of sharing the same language on wine trade having been proved in some studies (e.g. Castillo et al., 2016; Dal Bianco et al., 2016; Lombardi et al., 2016; Gouveia et al., 2018). Trade agreements, generally, are designed to create better trading opportunities and reduce costs, thus, such an agreement being established between two countries is expected to enhance trade. In wine trade literature, it is common to test the effect on trade of two trade partners being members of specific regional trade agreements (e.g., Dascal et al., 2002; Castillo et al., 2016) and/or sharing the same currency (e.g., Agostino and Trivieri, 2014, 2016; Castillo et al., 2016).
To identify the main factors influencing Douro wine exports, the following gravity equation is estimated with continuous variables log-transformed:
ln exportsijkt = β0 + β1 ln gdppcjt + β2 ln distij + β3 langij + β4 currijt + β5 rtaijt + β6 contij + β7 reservekt + β8 grandkt + ∑tγt Tt + uijt (1)
Equation (1) is based on Agostino and Trivieri (2014, 2016), so that the main difference in this work is that the dependent variable exportsijkt stands only for the exports of one country i (Portugal) to several countries j over time t. Another particularity of this model is that k distinguishes three qualities of Douro wine, but all with PDO: standard, reserve and grand reserve. Regarding the explanatory variables: gdppc is the GDP per capita of the importing country; dist is the distance between exporting and importing countries; lang is equal to 1 if the official language is common to both trade partners, and 0 otherwise; curr is 1 if the same currency is shared by both trade partners, and 0 otherwise; rta is 1 if both trade partners are members of the same RTA, and 0 otherwise; cont is 1 if there is contiguity between the importer and the exporter, and 0 otherwise; reserve is equal to 1 if the export flow of line k and time t is a wine with reserve category; grand is equal to 1 if the export flow of line k and time t is a wine with grand reserve category. Finally, a set of time fixed effects is considered through T and u is the error term.
Regarding the econometric methodology, the BVOLS is used following Baier and Bergstrand (2009). Based upon the model of Anderson

[52]
Does Wine Quality Have a Bearing on Exports?
and van Wincoop (2003), trade between countries i and j is not only determined by their own trade barriers, but also by the relative trade costs of these countries with the rest-of-the-world. Baier and Bergstrand (2009) introduce these theoretically-motivated exogenous multilateral resistance terms in a simple reduced-form gravity equation that can be estimated with OLS. This estimator seems to be the most appropriate for this study because, besides controlling for MR terms, it allows for repeated time values within a panel, that is, it can consider the three export flows in the study (standard, reserve and grand reserve Douro wines) between Portugal and its trade partners in each year t. To approximate MR terms, Baier and Bergstrand (2009) suggest a first-order log-linear Taylor-series expansion of the system of nonlinear price equations terms in Anderson and van Wincoop (2003), as follows:
(2)
where X are proxies of bilateral trade costs and k and m are trade partners of i and j, respectively. Therefore, the gravity equation (1) can be estimated through OLS if dist, lang, curr, rta and cont are transformed by subtracting the exogenous terms (2).
Data
In order to estimate the determinants of wine exports and the impact of quality, this paper considers the Douro wine as an example. Douro wine is produced in the Demarcated Douro Region (DDR)
which fits the typical terroir model and is the largest and the most heterogeneous wine mountain region in the world (Rebelo and Muhr, 2012). Different from Port wine, also produced in the DDR and with more than two centuries of having been sold in external markets, Douro wine started to leave its mark on international markets only at the beginning of the 21st century (which explains why there is no record of exports before 2006). From 2006 to 2015, exports have grown rapidly at an average annual rate of 12% and 10% in value and volume, respectively. A contributory factor to this success has been a strategy of searching for market niches and focusing on differentiation through product and process innovation, and marketing (Rebelo and Muhr, 2012).
The Port and Douro Wines Institute (IVDP) is the regulator responsible for the quality control of Douro wine, recognizing three main categories with the following ascending order of quality: standard, reserve and grand reserve (see Gouveia and Macedo, 2017). The regulator assigns wines into these respective categories by organoleptic evaluation and sensorial analysis through expert wine tasting (Regulations n.º 242/2010 and n.º 82/2010, IVDP).
Figure 1 shows the continuous growth of total Douro wine exports in value between 2006 and 2015. The standard category exports remained stable until 2010. However, in the following five years they more than doubled. Regarding the evolution of exports of the reserve and grand reserve categories, these have been positive since 2006:
Source: Own computation based on IVDP data (www.ivdp.pt)Figure 1: Evolution of Douro wine exports by category, in value, 2006-2015.

[53]
Does Wine Quality Have a Bearing on Exports?
the average annual rates of growth being 16% and 25%, both of which are higher than for the standard category (10%). This has led to a growing awareness of the importance of the reserve and grand reserve categories. From 2006 to 2015, their shares in total Douro wine exports increased 6 percentage points each.
The main destinations of Douro wine exports are most high-income countries (e.g. Belgium, Canada, France, Germany, Poland, Switzerland, United Kingdom and United States of America), economies with advanced development (Brazil and China) or former Portuguese colonies (Angola and Macao). In Table 1 it can be observed that most of the main importing countries are common for each Douro wine category, despite presenting a different order. The ten main importers of Douro wine represented 80% of total exports in value (in volume the share was 81%) in 2015 (in 2006 it was 82% in value). This means that Douro wine exports have a high level of concentration toward a small number of destinations, which is also a sign of dependence on these markets.
Data on exports of bottled Douro wine was extracted in value (euro) and volume (litres) from the website of IVDP, while all the data for GDP per capita, distance, language, RTA’s, common currency and contiguity was collected from the CEPII Gravity Dataset (descriptive statistics of all the variables are presented in Table A1 of Appendix). GDP per capita from the CEPII dataset is presented in US dollars, so a conversion to euro is done using the official exchange rates from World Bank’s dataset World Development Indicators. The distance
between trade partners is based on bilateral distance between the biggest cities of those countries and weighted by the share of population of that city in terms of the country’s overall population.
The dataset used in the next section covers 192 partner countries over the period 2006-20156. Around 65% of the export flows are zeros, which leads to the loss of several observations due to the undefined logarithm of zero. Therefore, adding a constant of 1 to the value/volume of exports before transforming them into log form allows for an increase in the number of observations.
Results and discussionTable 2 presents the results estimated for the exports of Douro wine, in value and volume. Columns (1) and (3) refer to estimations using as dependent variables the log form of exports in euro and litres, respectively, while in columns (2) and (4) a constant of 1 is added to exports before transforming them into log form. In order to achieve robust standard errors, i.e. heteroscedasticity consistent, and to allow for the correlation of the idiosyncratic error terms of the same country-pairs over time, the models are estimated considering clusters at the country-pair level (Agostino and Trivieri, 2014, 2016). Moreover, the graphical analysis of the distribution of residuals suggests that there are no problems of normality (see the Figure A1 of Appendix). In addition, time effects were globally
6 Only 5589 of 5760 potential observations (= 192 countries, * 10 years, * 3 categories of wine), are available for estimations because of missing data in CEPII dataset.
Notes: Switz.= Switzerland; UK = United Kingdom; USA = United States of America Source: IVDP (www.ivdp.pt)
Table 1: Top 10 destinations of Douro wine exports, by category, in 2015.
Total Douro Standard (64%) Reserve (27%) Grand Reserve (9%)
Country 1 000 € % Country 1 000 € % Country 1 000 € % Country 1 000 € %
1 Canada 7666 15 Canada 5977 18 Switz. 1826 13 USA 663 14
2 Angola 5627 11 Angola 3630 11 USA 1615 12 Brazil 637 13
3 USA 5513 11 Brazil 3319 10 Angola 1496 11 Switz. 576 12
4 Brazil 5037 10 USA 3234 10 Canada 1465 10 Angola 500 10
5 Switz. 4815 9 Germany 2752 8 UK 1157 8 Germany 276 6
6 Germany 3856 7 Switz. 2409 7 Brazil 1078 8 Macao 273 6
7 UK 3142 6 UK 1751 5 Germany 827 6 China 252 5
8 France 2390 5 France 1705 5 Belgium 599 4 UK 231 5
9 Belgium 2166 4 Belgium 1409 4 France 544 4 Canada 223 5
10 China 1270 2 Poland 1058 3 China 462 3 Belgium 158 3
Top 10 41481 80 Top 10 27243 82 Top 10 11069 79 Top 10 3932 81
World 51865 100 World 33033 100 World 13978 100 World 4827 100
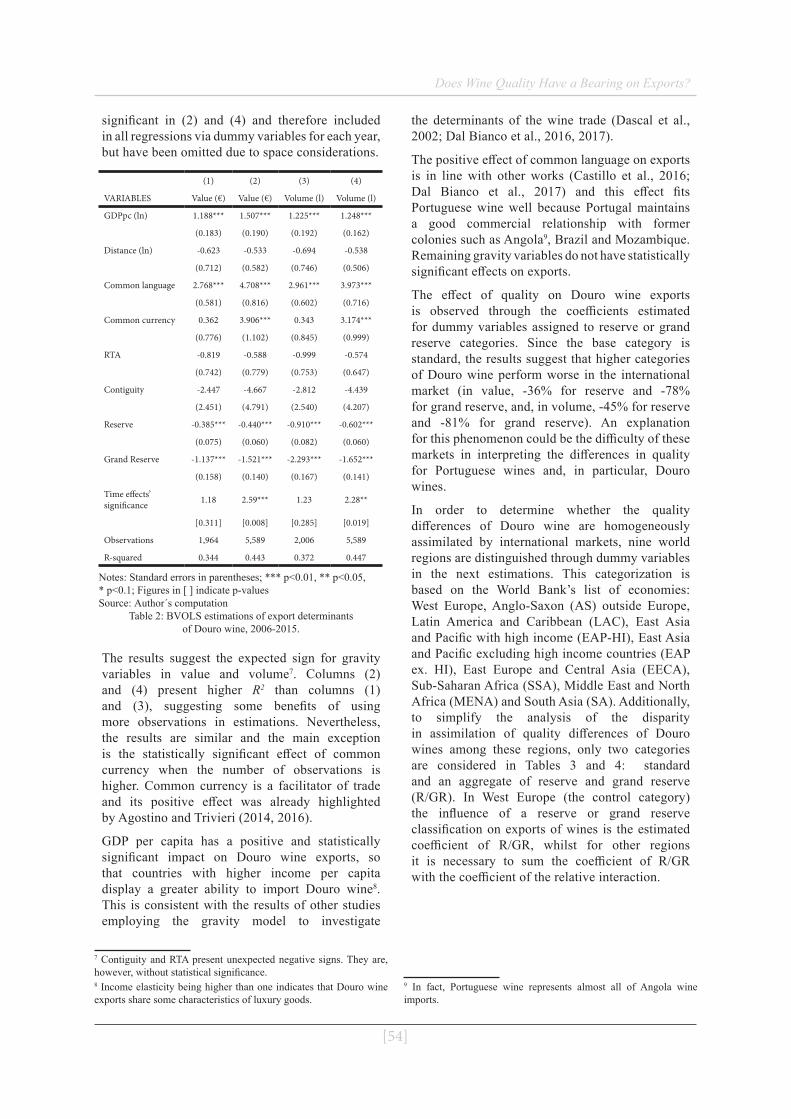
[54]
Does Wine Quality Have a Bearing on Exports?
significant in (2) and (4) and therefore included in all regressions via dummy variables for each year, but have been omitted due to space considerations.
Notes: Standard errors in parentheses; *** p<0.01, ** p<0.05, * p<0.1; Figures in [ ] indicate p-values Source: Author´s computation
Table 2: BVOLS estimations of export determinants of Douro wine, 2006-2015.
(1) (2) (3) (4)
VARIABLES Value (€) Value (€) Volume (l) Volume (l)
GDPpc (ln) 1.188*** 1.507*** 1.225*** 1.248***
(0.183) (0.190) (0.192) (0.162)
Distance (ln) -0.623 -0.533 -0.694 -0.538
(0.712) (0.582) (0.746) (0.506)
Common language 2.768*** 4.708*** 2.961*** 3.973***
(0.581) (0.816) (0.602) (0.716)
Common currency 0.362 3.906*** 0.343 3.174***
(0.776) (1.102) (0.845) (0.999)
RTA -0.819 -0.588 -0.999 -0.574
(0.742) (0.779) (0.753) (0.647)
Contiguity -2.447 -4.667 -2.812 -4.439
(2.451) (4.791) (2.540) (4.207)
Reserve -0.385*** -0.440*** -0.910*** -0.602***
(0.075) (0.060) (0.082) (0.060)
Grand Reserve -1.137*** -1.521*** -2.293*** -1.652***
(0.158) (0.140) (0.167) (0.141)
Time effects’ significance 1.18 2.59*** 1.23 2.28**
[0.311] [0.008] [0.285] [0.019]
Observations 1,964 5,589 2,006 5,589
R-squared 0.344 0.443 0.372 0.447
The results suggest the expected sign for gravity variables in value and volume7. Columns (2) and (4) present higher R2 than columns (1) and (3), suggesting some benefits of using more observations in estimations. Nevertheless, the results are similar and the main exception is the statistically significant effect of common currency when the number of observations is higher. Common currency is a facilitator of trade and its positive effect was already highlighted by Agostino and Trivieri (2014, 2016).
GDP per capita has a positive and statistically significant impact on Douro wine exports, so that countries with higher income per capita display a greater ability to import Douro wine8. This is consistent with the results of other studies employing the gravity model to investigate
7 Contiguity and RTA present unexpected negative signs. They are, however, without statistical significance.8 Income elasticity being higher than one indicates that Douro wine exports share some characteristics of luxury goods.
the determinants of the wine trade (Dascal et al., 2002; Dal Bianco et al., 2016, 2017).
The positive effect of common language on exports is in line with other works (Castillo et al., 2016; Dal Bianco et al., 2017) and this effect fits Portuguese wine well because Portugal maintains a good commercial relationship with former colonies such as Angola9, Brazil and Mozambique. Remaining gravity variables do not have statistically significant effects on exports.
The effect of quality on Douro wine exports is observed through the coefficients estimated for dummy variables assigned to reserve or grand reserve categories. Since the base category is standard, the results suggest that higher categories of Douro wine perform worse in the international market (in value, -36% for reserve and -78% for grand reserve, and, in volume, -45% for reserve and -81% for grand reserve). An explanation for this phenomenon could be the difficulty of these markets in interpreting the differences in quality for Portuguese wines and, in particular, Douro wines.
In order to determine whether the quality differences of Douro wine are homogeneously assimilated by international markets, nine world regions are distinguished through dummy variables in the next estimations. This categorization is based on the World Bank’s list of economies: West Europe, Anglo-Saxon (AS) outside Europe, Latin America and Caribbean (LAC), East Asia and Pacific with high income (EAP-HI), East Asia and Pacific excluding high income countries (EAP ex. HI), East Europe and Central Asia (EECA), Sub-Saharan Africa (SSA), Middle East and North Africa (MENA) and South Asia (SA). Additionally, to simplify the analysis of the disparity in assimilation of quality differences of Douro wines among these regions, only two categories are considered in Tables 3 and 4: standard and an aggregate of reserve and grand reserve (R/GR). In West Europe (the control category) the influence of a reserve or grand reserve classification on exports of wines is the estimated coefficient of R/GR, whilst for other regions it is necessary to sum the coefficient of R/GR with the coefficient of the relative interaction.
9 In fact, Portuguese wine represents almost all of Angola wine imports.

[55]
Does Wine Quality Have a Bearing on Exports?
Notes: Standard errors in parentheses; *** p<0.01, ** p<0.05, * p<0.1; Figures in [ ] indicate p-values; The categorization for world regions follows World Bank list of economies, except for three new regions proposed by Agostino and Trivieri (2014): Anglo-Saxon outside Europe (Australia, Canada, New Zealand and USA), East Asia and Pacific with high income (Hong Kong, Japan, Korea Rep., Macao and Singapore) and West Europe (Aus-tria, Belgium, Croatia, Cyprus, the Czech Republic, Denmark, Estonia, Finland, France, Germany, Greece, Greenland, Hungary, Iceland, Ireland, Italy, Luxembourg, Malta, the Netherlands, Norway, Poland, San Marino, Slovak Republic, Slovenia, Spain, Sweden, Switzerland, United Kingdom). Source: Author´s computation
Table 3: BVOLS estimations of export determinants of Douro wine and the disparity in assimilation of its quality differences
among world regions, 2006-2015.
(5) (6)
VARIABLES Value (€) Volume(€)
GDPpc (ln) 1.581*** 1.374***
(0.175) (0.155)
Distance -0.867 -0.835
(0.587) (0.536)
Common language 5.660*** 4.933***
(0.746) (0.682)
Common currency 2.867** 2.412**
(1.121) (1.056)
RTA -0.236 -0.270
(0.762) (0.643)
Contiguity -5.056 -5.007
(4.328) (4.023)
R/GR 1.190** 0.567
(0.538) (0.466)
R/GR*AS 4.752*** 4.220***
(1.233) (1.209)
R/GR*LAC -1.896** -1.515**
(0.775) (0.651)
R/GR*EAP-HI 0.265 0.252
(1.705) (1.425)
R/GR*EAP ex. HI -1.148 -0.671
(0.723) (0.619)
R/GR*EECA -2.939*** -2.364***
(0.884) (0.731)
R/GR*SSA -0.883 -0.438
(0.709) (0.604)
R/GR*MENA -4.336*** -3.494***
(0.883) (0.732)
R/GR*SA -2.129** -1.471**
(0.821) (0.720)
Time effects’ significance 1.95** 1.62
[0.047] [0.111]
Observations 3,726 3,726
R-squared 0.501 0.502
The results in Table 4 suggest that quality differences of Douro wine are not homogeneously
interpreted across world regions. Anglo-Saxon and West European countries are the world regions where the quality of Douro wine is a greater influence on exports. On the other hand, it is possible to observe that the negative influence of quality estimated in Table 2 is mainly due to two regions: Middle East and North Africa, and East Europe and Central Asia. These results show that these two markets do not differentiate the quality of Douro wine.
Notes: Standard errors in parentheses; The standard errors are calculated using the formula
*** p<0.01, ** p<0.05, * p<0.1. Source: Author´s computation
Table 4: Influence of quality on Douro wine exports by world regions, 2006-2015.
(5) (6)
VARIABLES Value (€) Volume(€)
Anglo-Saxon (outside Europe): R/GR + R/GR*AS 5.943*** 4.786***
(1.130) (1.128)
Latin America and Caribbean: R/GR + R/GR*LAC -0.706 -0.948**
(0.486) (0.389)
East Asia and Pacific with high income: R/GR + R/GR*EAP-HI 1.455 0.819
(1.607) (1.340)
East Asia and Pacific excl. high income: R/GR + R/GR*EAP ex. HI 0.042 -0.105
(0.522) (0.449)
East Europe and Central Asia: R/GR + R/GR*EECA -1.748*** -1.797***
(0.577) (0.461)
Sub-Saharan Africa: R/GR + R/GR*SSA 0.307 0.129
(0.368) (0.306)
Middle East and North Africa: R/GR + R/GR*MENA -3.145*** -2.927***
(0.621) (0.508)
South Asia: R/GR + R/GR*SA -0.939 -0.904
(0.642) (0.574)
ConclusionVertical differentiation is of fundamental importance for a large number of products, of which wine is a typical case. For that reason this study considers the performance of three different categories of Douro wine in international trade over time and world regions. To accomplish this, a gravity model considering 192 of Portugal’s trading partners between 2006 and 2015 is estimated using the BVOLS estimator.
The results of this study suggest that only some

[56]
Does Wine Quality Have a Bearing on Exports?
world regions reward quality when they choose between distinct categories of Douro wines. West Europe and Anglo-Saxon countries (outside Europe) are two world regions associated with significant value premiums for reserve and grand reserve categories of Douro wine. However, the Middle East and North Africa, and East Europe and Central Asia are two world regions where the value premium is associated to the standard category, illustrating the difficulties of Douro wine in imposing quality differentiation in some markets.
The robustness of the empirical results is enhanced by taking vertical differentiation into consideration, thereby providing accurate information that should be noted both by policymakers in designing effective trade policies, and by managers whose intention is to promote products in line with international
market trends. This is especially true for the wine industry.
For future research, it would be fruitful to extend this analysis to other industries characterised by both vertical and horizontal differentiation. Moreover, the use of longer time series – currently not available for Douro wine – in such analyses would allow macroeconomic shocks to be studied.
AcknowledgementsThis work is supported by the project NORTE -01-0145-FEDER-000038 (INNOVINE & WINE – Innovation Platform of Vine & Wine) and national funds, through the FCT – Portuguese Foundation for Science and Technology under the project UID/SOC/04011/2019.
Corresponding authorsAnthony Macedo Department of Economics, Sociology and Management, Centre for Transdisciplinary Development StudiesUniversity of Trás-os-Montes and Alto Douro, Quinta de Prados, 5001-801 Vila Real, PortugalE-mail: [email protected]
References[1] Agostino, M. and Trivieri, F. (2014) “Geographical indication and wine exports. An empirical
investigation considering the major European producers”, Food Policy, Vol. 46, pp. 22-36. ISSN 0306-9192. DOI 10.1016/j.foodpol.2014.02.002.
[2] Agostino, M. and Trivieri, F. (2016) “European wines exports towards emerging markets. The role of geographical identity”, Journal of Industry, Competition and Trade, Vol. 16, pp. 233-256. ISSN 1573-7012. DOI 10.1007/s10842-015-0210-z.
[3] Alchian, A. A. and Allen, W. R. (1972) “University economics: Elements of inquiry”, Belmont CA, Wadsworth. ISBN 0534000304.
[4] Anderson, J. E. (1979) “A theoretical foundation for the gravity equation”, The American Economic Review, Vol. 69, No. 1, pp. 106-116. ISSN 0002-8282.
[5] Anderson, J. E. and van Wincoop, E. (2003) “Gravity with gravitas: A solution to the border puzzle”, The American Economic Review, Vol. 93, No. 1, pp. 170-192. ISSN 0002-8282. DOI 10.1257/000282803321455214.
[6] Balogh, J. M. and Jámbor, A. (2018) “The role of culture, language and trade agreements in global wine trade", AGRIS on-line Papers in Economics and Informatics, Vol. 10, No. 3, pp. 17-29. ISSN 1804-1930. DOI 10.7160/aol.2018.100302.
[7] Baier, S. L. and Bergstrand, J. H. (2009) “Bonus vetus OLS: a simple method for approximating international trade-cost effects using the gravity equation”, Journal of International Economics, Vol. 77, pp. 77-85. ISSN 0022-1996. DOI 10.1016/j.jinteco.2008.10.004.
[8] Bergstrand, J. H. (1985) “The gravity equation in international trade: some microeconomic foundations and empirical evidence”, The Review of Economics and Statistics, Vol. 67, No. 3, pp. 474-481. E-ISSN 15309142, ISSN 00346535. DOI 10.2307/1925976.
[57]
Does Wine Quality Have a Bearing on Exports?
[9] Bergstrand, J. H. (1989) “The generalized gravity equation, monopolistic competition, and factor proportions theory in international trade”, The Review of Economics and Statistics, Vol. 71, No. 1, pp. 143-153. ISSN 00346535. DOI 10.2307/1928061.
[10] Boccard, N. (2010) “Industrial organization: A contract-based approach”, Girona, Univ. of Girona. ISBN 84-609-9337-X.
[11] Brentari, E., Levaggi, R. and Zuccolotto, P. (2011) “Pricing strategies for Italian red wine”, Food Quality and Preference, Vol. 22, pp. 725-732. ISSN 0950-3293. DOI 10.1016/j.foodqual.2011.06.001.
[12] Cardebat, J. and Figuet, J. (2004) “What explains Bordeaux wine prices?”, Applied Economics Letters, Vol. 11, pp. 293-296. ISSN 1350-4851. DOI 10.1080/1350485042000221544.
[13] Castillo, J. S., Villanueva, E. C. and García-Cortijo, M. C. (2016) “The international wine trade and its new export dynamics (1988-2012): A gravity model approach”, Agribusiness, Vol. 32, No. 4, pp. 466-481. DOI 10.1002/agr.21463.
[14] Church, J. and Ware, R. (2000) “Industrial Organization: A Strategic Approach”, New York NY, Irwin McGraw Hill. ISBN 0-256-20571-X.
[15] Crozet, M., Head, K. and Mayer, T. (2012) “Quality sorting and trade: firm-level evidence for French wine”, The Review of Economic Studies, Vol. 79, No. 2, pp. 609-644. E-ISSN 1467-937X, ISSN 0034-6527 DOI 10.1093/restud/rdr030.
[16] Dal Bianco, A., Boatto, V. L., Caracciolo, F. and Santeramo, F. G. (2016) “Tariffs and non-tariff frictions in the world wine trade”, European Review of Agricultural Economics, Vol. 43, No. 1, pp. 31-57. ISSN 0165-1587. DOI 10.1093/erae/jbv008.
[17] Dal Bianco, A., Estrella-Orrego, M. J., Boatto, V. L. and Gennari, A. J. (2017) “Is Mercosur promoting trade? Insights from Argentinean wine exports”, Spanish Journal of Agricultural Research, Vol. 15, No. 1. E-ISSN 2171-9292. DOI 10.5424/sjar/2017151-9270.
[18] Dascal, D., Mattas, K. and Tzouvelekas, V. (2002) “An analysis of EU wine trade: A gravity model approach”, International Advances in Economic Research, Vol. 8, No. 2, pp. 135-147. ISSN 1083-0898. DOI 10.1007/bf02295344.
[19] Eaton, J. and Kortum, S. (2002) “Technology, geography, and trade”, Econometrica, Vol. 70, No. 5, pp. 1741-1779. ISSN 1468-0262. DOI 10.1111/1468-0262.00352.
[20] Gouveia, S. and Macedo, A. (2017) “Principais mercados de destino dos vinhos do Porto e Douro”, In: Rumo estratégico para o setor dos vinhos do Porto e Douro, Relatório Final - Estudo de Base, Porto, IVDP/UTAD, pp. 172-212.
[21] Gouveia, S., Rebelo, J. and Lourenço-Gomes, L. (2018) “Port wine exports: A gravity model approach”, International Journal of Wine Business Research, Vol. 30, No. 2, pp. 218-242. ISSN 1751-1062. DOI 10.1108/IJWBR-02-2017-0008.
[22] Helpman, E. (1984) “Increasing returns, imperfect markets, and trade theory”, In: Jones R. W. and Kenen P. B. (eds): Handbook of international economics, Amsterdam, North-Holland, pp. 325-365. DOI 10.1016/S1573-4404(84)01010-8.
[23] Helpman, E. (1987) “Imperfect competition and international trade: Evidence from fourteen industrial countries”, Journal of the Japanese and International Economies, Vol. 1, No. 1, pp. 62-81. ISSN 0889-1583. DOI 10.1016/0889-1583(87)90027-X.
[24] Helpman, E. and Krugman, P. R. (1985) “Market structure and foreign trade; increasing returns, imperfect competition and the international economy”, Cambridge, MIT Press. ISBN 9780262580878.
[25] Hummels, D. and Klenow, P. J. (2005) “The variety and quality of a nation’s exports”, American Economic Review, Vol. 95, No. 3, pp. 704-723. E-ISSN 1944-7981. ISSN 0002-8282. DOI 10.1257/0002828054201396.

[58]
Does Wine Quality Have a Bearing on Exports?
[26] Hummels, D. and Skiba, A. (2004) “Shipping the good apples out? An empirical confirmation of the Alchian-Allen conjecture”, Journal of Political Economy, Vol. 112, No.6, pp. 1384-1402. E-ISSN 1537534X, ISSN 00223808. DOI 10.1086/422562.
[27] Khandelwal, A. (2010) “The long and short (of) quality ladders”, The Review of Economic Studies, Vol. 77, No. 4, pp. 1450-1476. E-ISSN 1467-937X, ISSN 0034-6527. DOI 10.1111/j.1467-937X.2010.00602.x.
[28] Linder, S. B. (1961) “An essay on trade and transformations”, Stockholm, Almqvist & Wiksell, New York NY, Wiley and Sons.
[29] Lombardi, P., Dal Bianco, A., Freda, R., Caracciolo, F. and Cembalo, L. (2016) “Development and trade competitiveness of the European wine sector: A gravity analysis of intra-EU flows”, Wine Economics and Policy, Vol. 5, No. 2, pp. 50-59. ISSN 2212-9774. DOI 10.1016/j.wep.2015.12.002.
[30] Manova, K. and Zhang, Z. (2012) “Export prices across firms and destinations”, The Quarterly Journal of Economics, Vol. 127, No. 1, pp. 379-436. E-ISSN 1531-4650, ISSN 0033-5533. DOI 10.1093/qje/qjr051.
[31] Melitz, M. J. (2003) “The impact of trade on intra-industry reallocations and aggregate industry productivity”, Econometrica, Vol. 71, No. 6, pp. 1695-1725. E-ISSN 1468-0262. DOI 10.1111/1468-0262.00467.
[32] Olper, A., Curzi, D., Frisio, D. and Raimondi, V. (2012) “Home bias in consumption: a comparison between wine and beer”, German Journal of Agricultural Economics, Vol. 61, No. 4, pp. 223-234. ISSN 00021121.
[33] Pomarici, E. (2016) “Recent trends in the international wine market and arising research questions”, Wine Economics and Policy, Vol. 5, No. 1, pp. 1-3. ISSN 2212-9774. DOI 10.1016/j.wep.2016.06.001.
[34] Rebelo, J. and Muhr, D. (2012) “Innovation in wine SMEs: the Douro Boys informal network”, Studies in Agricultural Economics, Vol. 114, pp. 1-15. E-ISSN 2063-0476, ISSN 1418-2106. DOI 10.7896/j.1118.
[35] Schamel, G. (2006) “Geography versus brands in a global wine market”, Agribusiness, Vol. 22, No. 3, pp. 363-374. E-ISSN 1520-6297. DOI 10.1002/agr.20091.
[36] Schott, P. K. (2004) “Across-product versus within-product specialization in international trade”, The Quarterly Journal of Economics, Vol. 119, No. 2, pp. 647-678. E-ISSN 1531-4650, ISSN 0033-5533. DOI 10.1162/0033553041382201.
[37] Silva J. S. and Tenreyro, S. (2006) “The log of gravity”, The Review of Economics and Statistics, Vol. 88, pp. 641-658. ISSN 00346535. DOI 10.1162/rest.88.4.641.
[38] Tinbergen, J. (1962) “An Analysis of World Trade Flows", In: "Shaping the World Economy", New York NY, Twentieth Century Fund, Vol. 5, No. 1, pp. 27-30.
[39] Verhoogen, E. A. (2008) “Trade, quality upgrading, and wage inequality in the Mexican manufacturing sector”, The Quarterly Journal of Economics, Vol. 123, No. 2, pp. 489-530. E-ISSN 1531-4650, ISSN 0033-5533. DOI 10.1162/qjec.2008.123.2.489.

Does Wine Quality Have a Bearing on Exports?
[59]
Appendix
Notes: For the binary variables lang, curr, rta and cont the mean represents the percentage of observations equal to one Source: Authors’ computation
Table A1: Descriptive statistics.
Variables Obs. Mean Med. Std. Dev. Min Max
exports (euro) 5589 59678.7 0.0 293215.1 0.0 5977109.0
Standard 1863 109569.5 0.0 451585.7 0.0 5977109.0
Reserve 1863 54020.3 0.0 213610.3 0.0 2156674.0
Grand reserve 1863 15446.4 0.0 63075.8 0.0 663436.0
exports (litres) 5589 14823.9 0.0 84157.4 0.0 1637610.0
Standard 1863 33385.1 0.0 138287.0 0.0 1637610.0
Reserve 1863 9719.9 0.0 39380.5 0.0 608127.0
Grand reserve 1863 1366.7 0.0 5377.2 0.0 59222.0
gdppc (euro) 5589 10449.0 3659.9 14960.2 124.8 91887.9
dist (km) 5589 6503.1 5926.0 3918.6 680.0 19539.0
lang 5589 0.0 0.0 0.0 1.0
curr 5589 0.1 0.0 0.0 1.0
rta 5589 0.3 0.0 0.0 1.0
cont 5589 0.0 0.0 0.0 1.0
Source: Authors’ computationFigure A1: Distribution of the residuals of BVOLS estimations of export determinants of Douro wine.

[60]
Agris on-line Papers in Economics and Informatics

[61]
Agris on-line Papers in Economics and Informatics
Volume XI Number 4, 2019
Competitiveness in Dairy Trade – the Case of EU and the Visegrad Group CountriesJudit Nagy, Zsófia Jámbor
Corvinus University of Budapest, Hungary
AbstractThe European Union (EU) produces 15% of its agricultural production in the dairy industry. The article focuses on the European Union and Visegrad Group’s (VG) dairy export and analyses it with Balassa’s (Revealed Comparative Advantage, RCA) index. Our aim is to explore the foundations of EU's competitiveness and the role and opportunities of the dairy sector in VG countries.
The analysis is based on EU dairy export data for the period 2000-2017. The main result of the analysis is that the most competitive countries in terms of export performance (Denmark, France, Ireland and Belgium) do not fully align with the order of the largest dairy producing and processing countries (Germany, France, the United Kingdom, the Netherlands) or the largest dairy exporters (Germany, the Netherlands, France and Belgium). We have discovered that some EU countries have a really strong, dominant competitive advantage. The reason for this is that the highest customer value can be achieved through the production of highly processed products, and the most competitive countries specialize in the production of one or a few of these products.
KeywordsDairy industry, revealed comparative advantage, export, competitiveness.
Nagy, J. and Jámbor, Z. (2019) “Competitiveness in Dairy Trade – the Case of EU and the Visegrad Group Countries", AGRIS on-line Papers in Economics and Informatics, Vol. 11, No. 4, pp. 61-74. ISSN 1804-1930. DOI 10.7160/aol.2019.110406.
Introduction170 million tons of milk is produced in the EU annually, and 45 tons of processed dairy product is sold to consumers. 87% of dairy products produced in the EU are delivered to consumers within the EU (Lemoine, 2016; Bojnec and Ferto, 2014). In world trade, dairy products represent a low proportion, as typically produced and processed goods are consumed within the country, but their share of consumption is steadily increasing with the expansion of a healthy lifestyle and their role is expected to continue to grow further. The biggest annual growth is expected in developing countries, India and China (4-5%), while the developed world expects only 0.8-1% growth in the coming decades (OECD-FAO, 2018). In order to increase EU competitiveness, achieving economies of scale, high value-added products and innovation, as well as knowledge accumulation play key roles (Poppe, 2008). Since the paper analyses the competitiveness of dairy trade, it is important to discuss the concept of competitiveness, the specifications of dairy trade and the factors
influencing the competitiveness in dairy industry.
1. Interpretation of competitiveness
There are several approaches and definitions for interpreting competitiveness. The levels of competitiveness are most often interpreted as micro, mezo and macro competitiveness. The micro-level interpretation examines competitiveness at the level of the corporate sphere, which can be defined as: "the ability of a company to produce products or services that customers prefer more to buy than those of their competitors’" (Wijnands et al., 2008, 3). According to Domazet (2012, 294-295), competitiveness is the ability of a company to "produce products that meet the requirements of the open market in a continuous and profitable manner, with prices, quality, etc. respect".
Mezo-level competitiveness can be interpreted at a regional level, according to Kitson et al. (2004, 992). Gorton et al. (2013, 4) use a different approach to understand the competitiveness of a region because they believe that its task is
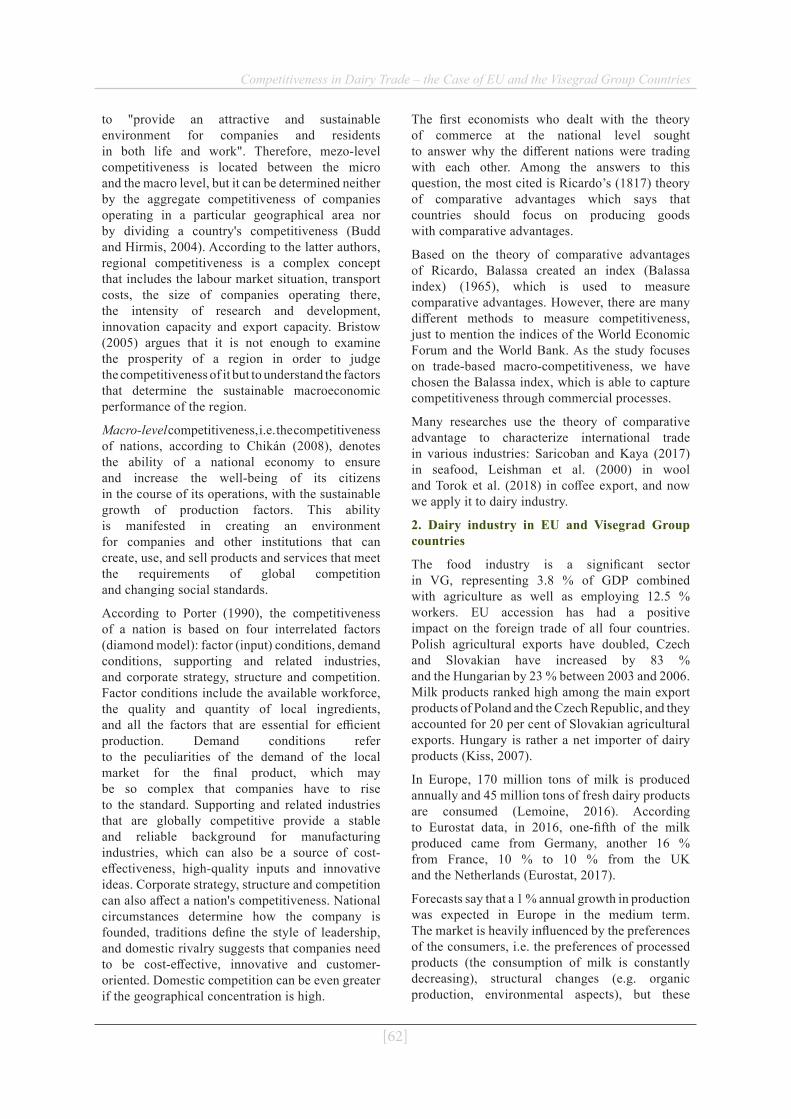
[62]
Competitiveness in Dairy Trade – the Case of EU and the Visegrad Group Countries
to "provide an attractive and sustainable environment for companies and residents in both life and work". Therefore, mezo-level competitiveness is located between the micro and the macro level, but it can be determined neither by the aggregate competitiveness of companies operating in a particular geographical area nor by dividing a country's competitiveness (Budd and Hirmis, 2004). According to the latter authors, regional competitiveness is a complex concept that includes the labour market situation, transport costs, the size of companies operating there, the intensity of research and development, innovation capacity and export capacity. Bristow (2005) argues that it is not enough to examine the prosperity of a region in order to judge the competitiveness of it but to understand the factors that determine the sustainable macroeconomic performance of the region.
Macro-level competitiveness, i.e. the competitiveness of nations, according to Chikán (2008), denotes the ability of a national economy to ensure and increase the well-being of its citizens in the course of its operations, with the sustainable growth of production factors. This ability is manifested in creating an environment for companies and other institutions that can create, use, and sell products and services that meet the requirements of global competition and changing social standards.
According to Porter (1990), the competitiveness of a nation is based on four interrelated factors (diamond model): factor (input) conditions, demand conditions, supporting and related industries, and corporate strategy, structure and competition. Factor conditions include the available workforce, the quality and quantity of local ingredients, and all the factors that are essential for efficient production. Demand conditions refer to the peculiarities of the demand of the local market for the final product, which may be so complex that companies have to rise to the standard. Supporting and related industries that are globally competitive provide a stable and reliable background for manufacturing industries, which can also be a source of cost-effectiveness, high-quality inputs and innovative ideas. Corporate strategy, structure and competition can also affect a nation's competitiveness. National circumstances determine how the company is founded, traditions define the style of leadership, and domestic rivalry suggests that companies need to be cost-effective, innovative and customer-oriented. Domestic competition can be even greater if the geographical concentration is high.
The first economists who dealt with the theory of commerce at the national level sought to answer why the different nations were trading with each other. Among the answers to this question, the most cited is Ricardo’s (1817) theory of comparative advantages which says that countries should focus on producing goods with comparative advantages.
Based on the theory of comparative advantages of Ricardo, Balassa created an index (Balassa index) (1965), which is used to measure comparative advantages. However, there are many different methods to measure competitiveness, just to mention the indices of the World Economic Forum and the World Bank. As the study focuses on trade-based macro-competitiveness, we have chosen the Balassa index, which is able to capture competitiveness through commercial processes.
Many researches use the theory of comparative advantage to characterize international trade in various industries: Saricoban and Kaya (2017) in seafood, Leishman et al. (2000) in wool and Torok et al. (2018) in coffee export, and now we apply it to dairy industry.
2. Dairy industry in EU and Visegrad Group countries
The food industry is a significant sector in VG, representing 3.8 % of GDP combined with agriculture as well as employing 12.5 % workers. EU accession has had a positive impact on the foreign trade of all four countries. Polish agricultural exports have doubled, Czech and Slovakian have increased by 83 % and the Hungarian by 23 % between 2003 and 2006. Milk products ranked high among the main export products of Poland and the Czech Republic, and they accounted for 20 per cent of Slovakian agricultural exports. Hungary is rather a net importer of dairy products (Kiss, 2007).
In Europe, 170 million tons of milk is produced annually and 45 million tons of fresh dairy products are consumed (Lemoine, 2016). According to Eurostat data, in 2016, one-fifth of the milk produced came from Germany, another 16 % from France, 10 % to 10 % from the UK and the Netherlands (Eurostat, 2017).
Forecasts say that a 1 % annual growth in production was expected in Europe in the medium term. The market is heavily influenced by the preferences of the consumers, i.e. the preferences of processed products (the consumption of milk is constantly decreasing), structural changes (e.g. organic production, environmental aspects), but these

[63]
Competitiveness in Dairy Trade – the Case of EU and the Visegrad Group Countries
often pose a challenge to producers (European Commission, 2017 and 2018).
The EU accounts for one quarter of the world's dairy production and 30% of its commercial growth, mainly with highly processed products (cheese, milk powder, butter) (OECD-FAO, 2018). Behind this, the main competitors have been able to increase their production to a greater extent, so European countries are entering the market with highly processed products: nearly half of the world's cheese is made in Europe. In addition, marketing and product innovation opportunities are important: new products, new flavours, new ingredients appear on the market (Tacken et al., 2009; Lemoine, 2016 and Jansik et al., 2014).
In Visegrad Group regional dairy sector faces many difficulties. One of these is the abolition of the milk quota system, which favours more efficient and competitive farming. As Salou (2017) points out, an elementary pillar of the Common Agricultural Policy was abolished on 1st April 2015. The measure expects growth in competitiveness and market orientation of the industry. In addition to the increase in domestic supply due to the end of the quota system, the introduction of the Russian embargo and the appearance of cheap imported dairy products also had a negative effect: prices dropped significantly (Zdráhal et al., 2016; Zdráhal et al., 2018 Hanisch et al., 2013). The industry is also significantly influenced by local consumer habits, the rapidly deteriorating, difficult-to-transport products are therefore mainly consumed locally. Another critical issue is the development of technology to reduce production costs.
The dairy industry in Hungary can be characterized as oligopsonistic (Čehura et al., 2015). It is moderately concentrated, the sector is dominated by small individual and large industrial dairy farms (Bakucs et al., 2012). In general, the sector's strategic focus is to increase competitiveness and efficiency, and to halt and stabilize the decline in current livestock, and to increase the value of milk content (particularly fat). Another important goal is to get more raw milk for processing in Hungary and not to export as a low value-added product. The dairy trade is characterized by exports of raw milk and imports of processed products, but the proportions are improving (Perekhozhuk et al., 2013).
In the Czech Republic, the dairy industry is responsible for the 17 % of sales and 10 % of employers in the food industry. Czech dairy producers face with low profitability and a high debt-to-equity ratio (Spicka, 2013). Spicka et al.
(2015) consider vertical integration, innovation, and technological improvement as the main focuses of development of the sector. The industry structure is oligopolistic, slightly concentrated with relatively low entry barriers, which allows to small producers to enter a local market and sell their milk and processed products there (Spicka, 2013).
Kubicova et al. (2014) report on concentration in Slovak dairy industry. Plenty of foreign companies entered the market and carried out modernization and economically stabilized the dairy sector. Food expenditure is at the top of household consumption which of dairy is the second one. However, Slovakia significantly lags the other EU member states in dairy consumption.
Bakucs et al. (2012) described the Polish dairy industry as a successful sector within the food industry. 95% of milk is produced by family farms and concentration is very low. The share of foreign companies on the market is also low (10%) in comparison with the regional standard. Modernization has been carried out, not only in product assortment and production technology but also in marketing channels (Fałkowski, 2012).
3. Competitiveness in dairy industry
The dairy industry is a significant sector of the manufacturing industry, with strong competition between players on both national and international markets. The competitiveness of the dairy industry in a country is largely determined by the structure of the industry, the number, size and geographical distribution of competitors, the level of ownership structure and the cost of production resources (Jansik et al., 2014; Viira et al., 2015 and Zdráhal et al., 2018), which is almost identical to Porter’s (1990) theory. The competitiveness of the dairy industry can also be measured through market performance, which should be distinguished in two directions: domestic demand and exports (Bojnec and Ferto, 2014). The stability of market positions occupied by companies in the domestic market predicts the ability to compete with imports in both price and product range. Generally speaking, the larger internal market allows companies to achieve economies of scale and financial stability, which increases the likelihood of foreign market success (Jansik et al., 2014). Smaller dairy companies in smaller countries are constantly struggling to achieve economies of scale, which either intensify competition and lead to high concentration on the market or force operators to export.
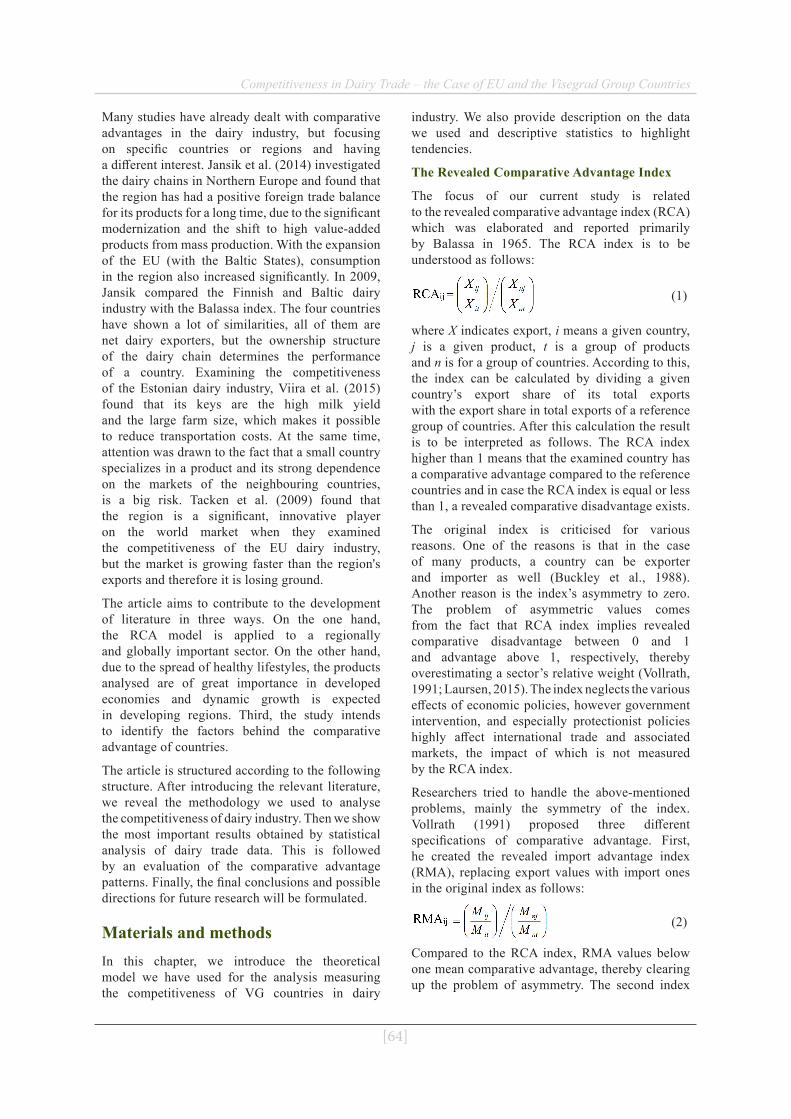
[64]
Competitiveness in Dairy Trade – the Case of EU and the Visegrad Group Countries
Many studies have already dealt with comparative advantages in the dairy industry, but focusing on specific countries or regions and having a different interest. Jansik et al. (2014) investigated the dairy chains in Northern Europe and found that the region has had a positive foreign trade balance for its products for a long time, due to the significant modernization and the shift to high value-added products from mass production. With the expansion of the EU (with the Baltic States), consumption in the region also increased significantly. In 2009, Jansik compared the Finnish and Baltic dairy industry with the Balassa index. The four countries have shown a lot of similarities, all of them are net dairy exporters, but the ownership structure of the dairy chain determines the performance of a country. Examining the competitiveness of the Estonian dairy industry, Viira et al. (2015) found that its keys are the high milk yield and the large farm size, which makes it possible to reduce transportation costs. At the same time, attention was drawn to the fact that a small country specializes in a product and its strong dependence on the markets of the neighbouring countries, is a big risk. Tacken et al. (2009) found that the region is a significant, innovative player on the world market when they examined the competitiveness of the EU dairy industry, but the market is growing faster than the region's exports and therefore it is losing ground.
The article aims to contribute to the development of literature in three ways. On the one hand, the RCA model is applied to a regionally and globally important sector. On the other hand, due to the spread of healthy lifestyles, the products analysed are of great importance in developed economies and dynamic growth is expected in developing regions. Third, the study intends to identify the factors behind the comparative advantage of countries.
The article is structured according to the following structure. After introducing the relevant literature, we reveal the methodology we used to analyse the competitiveness of dairy industry. Then we show the most important results obtained by statistical analysis of dairy trade data. This is followed by an evaluation of the comparative advantage patterns. Finally, the final conclusions and possible directions for future research will be formulated.
Materials and methodsIn this chapter, we introduce the theoretical model we have used for the analysis measuring the competitiveness of VG countries in dairy
industry. We also provide description on the data we used and descriptive statistics to highlight tendencies.
The Revealed Comparative Advantage Index
The focus of our current study is related to the revealed comparative advantage index (RCA) which was elaborated and reported primarily by Balassa in 1965. The RCA index is to be understood as follows:
(1)
where X indicates export, i means a given country, j is a given product, t is a group of products and n is for a group of countries. According to this, the index can be calculated by dividing a given country’s export share of its total exports with the export share in total exports of a reference group of countries. After this calculation the result is to be interpreted as follows. The RCA index higher than 1 means that the examined country has a comparative advantage compared to the reference countries and in case the RCA index is equal or less than 1, a revealed comparative disadvantage exists.
The original index is criticised for various reasons. One of the reasons is that in the case of many products, a country can be exporter and importer as well (Buckley et al., 1988). Another reason is the index’s asymmetry to zero. The problem of asymmetric values comes from the fact that RCA index implies revealed comparative disadvantage between 0 and 1 and advantage above 1, respectively, thereby overestimating a sector’s relative weight (Vollrath, 1991; Laursen, 2015). The index neglects the various effects of economic policies, however government intervention, and especially protectionist policies highly affect international trade and associated markets, the impact of which is not measured by the RCA index.
Researchers tried to handle the above-mentioned problems, mainly the symmetry of the index. Vollrath (1991) proposed three different specifications of comparative advantage. First, he created the revealed import advantage index (RMA), replacing export values with import ones in the original index as follows:
(2)
Compared to the RCA index, RMA values below one mean comparative advantage, thereby clearing up the problem of asymmetry. The second index
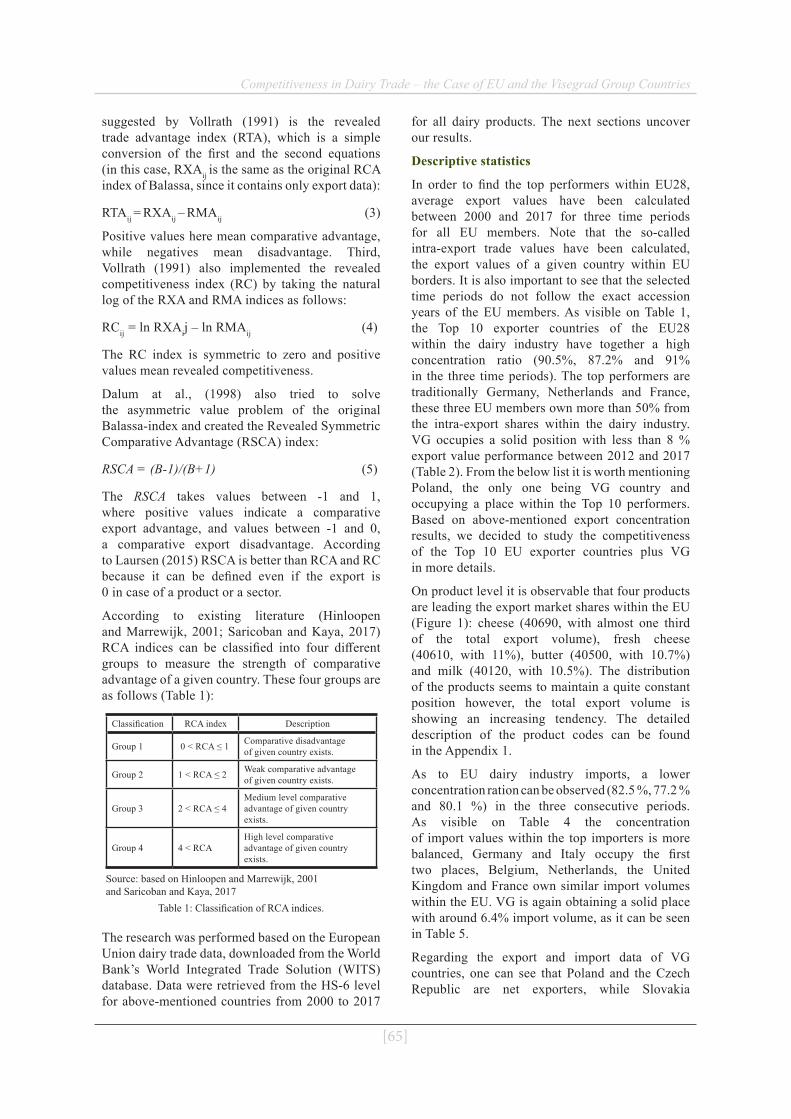
[65]
Competitiveness in Dairy Trade – the Case of EU and the Visegrad Group Countries
suggested by Vollrath (1991) is the revealed trade advantage index (RTA), which is a simple conversion of the first and the second equations (in this case, RXAij is the same as the original RCA index of Balassa, since it contains only export data):
RTAij = RXAij – RMAij (3)
Positive values here mean comparative advantage, while negatives mean disadvantage. Third, Vollrath (1991) also implemented the revealed competitiveness index (RC) by taking the natural log of the RXA and RMA indices as follows:
RCij = ln RXAij – ln RMAij (4)
The RC index is symmetric to zero and positive values mean revealed competitiveness.
Dalum at al., (1998) also tried to solve the asymmetric value problem of the original Balassa-index and created the Revealed Symmetric Comparative Advantage (RSCA) index:
RSCA = (B-1)/(B+1) (5)
The RSCA takes values between -1 and 1, where positive values indicate a comparative export advantage, and values between -1 and 0, a comparative export disadvantage. According to Laursen (2015) RSCA is better than RCA and RC because it can be defined even if the export is 0 in case of a product or a sector.
According to existing literature (Hinloopen and Marrewijk, 2001; Saricoban and Kaya, 2017) RCA indices can be classified into four different groups to measure the strength of comparative advantage of a given country. These four groups are as follows (Table 1):
Classification RCA index Description
Group 1 0 < RCA ≤ 1 Comparative disadvantage of given country exists.
Group 2 1 < RCA ≤ 2 Weak comparative advantage of given country exists.
Group 3 2 < RCA ≤ 4Medium level comparative advantage of given country exists.
Group 4 4 < RCAHigh level comparative advantage of given country exists.
Source: based on Hinloopen and Marrewijk, 2001 and Saricoban and Kaya, 2017
Table 1: Classification of RCA indices.
The research was performed based on the European Union dairy trade data, downloaded from the World Bank’s World Integrated Trade Solution (WITS) database. Data were retrieved from the HS-6 level for above-mentioned countries from 2000 to 2017
for all dairy products. The next sections uncover our results.
Descriptive statistics
In order to find the top performers within EU28, average export values have been calculated between 2000 and 2017 for three time periods for all EU members. Note that the so-called intra-export trade values have been calculated, the export values of a given country within EU borders. It is also important to see that the selected time periods do not follow the exact accession years of the EU members. As visible on Table 1, the Top 10 exporter countries of the EU28 within the dairy industry have together a high concentration ratio (90.5%, 87.2% and 91% in the three time periods). The top performers are traditionally Germany, Netherlands and France, these three EU members own more than 50% from the intra-export shares within the dairy industry. VG occupies a solid position with less than 8 % export value performance between 2012 and 2017 (Table 2). From the below list it is worth mentioning Poland, the only one being VG country and occupying a place within the Top 10 performers. Based on above-mentioned export concentration results, we decided to study the competitiveness of the Top 10 EU exporter countries plus VG in more details.
On product level it is observable that four products are leading the export market shares within the EU (Figure 1): cheese (40690, with almost one third of the total export volume), fresh cheese (40610, with 11%), butter (40500, with 10.7%) and milk (40120, with 10.5%). The distribution of the products seems to maintain a quite constant position however, the total export volume is showing an increasing tendency. The detailed description of the product codes can be found in the Appendix 1.
As to EU dairy industry imports, a lower concentration ration can be observed (82.5 %, 77.2 % and 80.1 %) in the three consecutive periods. As visible on Table 4 the concentration of import values within the top importers is more balanced, Germany and Italy occupy the first two places, Belgium, Netherlands, the United Kingdom and France own similar import volumes within the EU. VG is again obtaining a solid place with around 6.4% import volume, as it can be seen in Table 5.
Regarding the export and import data of VG countries, one can see that Poland and the Czech Republic are net exporters, while Slovakia

[66]
Competitiveness in Dairy Trade – the Case of EU and the Visegrad Group Countries
Country2000 - 2005 2006 – 2011 2012 – 2017
EX value % EX value %. EX value %
Germany 4 353 299 24.1 % 7 544 942 23.6 % 8 250 854 24.0 %
Netherlands 2 727 854 15.1 % 4 358 132 13.6 % 5 479 209 15.9 %
France 3 165 138 17.5 % 5 227 206 16.3 % 5 298 903 15.4 %
Belgium 1 686 882 9.3 % 2 556 782 8.0 % 2 907 799 8.4 %
Italy 836 030 4.6 % 1 636 039 5.1 % 2 233 209 6.5 %
Ireland 904 080 5.0 % 1 522 021 4.8 % 1 655 563 4.8 %
Denmark 980 409 5.4 % 1 569 584 4.9 % 1 587 249 4.6 %
Poland 287 549 1.6 % 1 164 796 3.6 % 1 388 714 4.0 %
United Kingdom 759 368 4.2 % 1 172 683 3.7 % 1 380 236 4.0 %
Austria 643 477 3.6 % 1 146 324 3.6 % 1 160 190 3.4 %
EU28 total 18 066 667 100.0 % 31 983 333 100.0 % 34 433 333 100.0 %
Concentration (of the top 10) 90.5 % 87.2 % 91.0 %
Note: Countries are listed in decreasing order based on their 2012-2017 averagesSource: Based on own calculations on WITS (2018)
Table 2: Top 10 exporter countries of the EU between 2000 and 2017 (Export values in 1000 US$) in dairy industry.
Country2000 - 2005 2006 – 2011 2012 – 2017
EX value % EX value %. EX value %
Poland 287549 1.6% 1164796 3.6% 1388714 4.0%
Czech Republic 163663 0.9% 649578 2.0% 738366 2.1%
Slovakia 99599 0.6% 332085 1.0% 335814 1.0%
Hungary 35705 0.2% 166060 0.5% 244366 0.7%
VG total and concentration (of the VG)
586516 3.2% 2312519 7.2% 2707260 7.9%
Note: Countries are listed in decreasing order based on their 2012-2017 averagesSource: Based on own calculations on WITS (2018)
Table 3: VG countries between 2000 and 2017 (Export values in 1000 US$) in dairy industry.
Note: See detailed product codes and its descriptions in the Appendix.Source: Own calculations based on WITS (2018) data
Figure 1. Export distribution of dairy products within EU between 2000-2017.

[67]
Competitiveness in Dairy Trade – the Case of EU and the Visegrad Group Countries
Country2000 - 2005 2006 – 2011 2012 – 2017
IM value % IM value % IM value %
Germany 3 390 992 18.6 % 5 849 751 18.4 % 6 520 851 18.8 %
Italy 2 723 832 14.9 % 4 249 990 13.4 % 4 207 822 12.1 %
Belgium 2 156 478 11.8 % 3 171 240 10.0 % 3 605 880 10.4 %
Netherlands 1 853 440 10.1 % 2 884 482 9.1 % 3 600 988 10.4 %
United Kingdom 2 017 794 11.0 % 3 288 210 10.4 % 3 591 909 10.4 %
France 1 920 886 10.5 % 3 046 680 9.6 % 3 486 555 10.1 %
Austria 376 914 2.1 % 686 184 2.2 % 821 716 2.4 %
Poland 58 477 0.3 % 388 868 1.2 % 817 209 2.4 %
Denmark 296 359 1.6 % 493 270 1.6 % 589 913 1.7 %
Ireland 283 905 1.6 % 451 969 1.4 % 524 214 1.5 %
EU28 total 18 266 667 100.0 % 31 766 667 100.0 % 34 683 333 100.0 %
Concentration (of the top 10) 82.5 % 77.2% 80.1 %
Note: Countries are listed in decreasing order based on their 2012-2017 averagesSource: Based on own calculations on WITS (2018)
Table 4. Top 10 importer countries of the EU between 2000 and 2017 (Import values in 1000 US$) in dairy industry.
Country2000 - 2005 2006 – 2011 2012 – 2017
IM value % IM value %. IM value %
Poland 287549 1.6 % 1164796 3.6 % 1388714 4.0 %
Czech Republic 163663 0.9 % 649578 2.0 % 738366 2.1 %
Slovakia 99599 0.6 % 332085 1.0 % 335814 1.0 %
Hungary 35705 0.2 % 166060 0.5 % 244366 0.7 %
VG total and concentration (of the VG)
586516 3.2 % 2312519 7.2% 2707260 7.9 %
Note: Countries are listed in decreasing order based on their 2012-2017 averagesSource: Based on own calculations on WITS (2018)
Table 5. VG countries between 2000 and 2017 (Import values in 1000 US$) in dairy industry.
and Hungary are rather net importers. It is also interesting, that although the Czech Republic, Slovakia and Hungary are similar size countries in terms of area, GDP/capita and population, the Czech’s export and import is almost double of the latter two countries’ performance.
Results and discussionAnalysis of comparative advantages
After the descriptive statistics, in this section, the different comparative advantage indices calculated for the selected 9+4 EU members will be presented for the same time period comparing their results.
Table 6 is showing the original Balassa indices for the selected 13 countries (top 10 EU dairy product exporters and VG) calculated for the period between 2000-2017. As visible on the table, Denmark, France and Ireland have
the highest revealed comparative advantages, compared to other countries, but Belgium, Austria, Netherlands and Poland also possess comparative advantages. On the other side, Germany, United Kingdom, Italy, Czech Republic, Slovak Republic have revealed comparative disadvantages, and so has Hungary with a lowest Balassa index (0.29) result. Comparing the VG countries, only Poland possesses comparative advantage within the members for the given time period.
Applying Hinloopen and Marrwijk’s (2001) and Saricoban and Kaya’s (2017 classification, in our analysis, none of the analysed countries has a high-level comparative advantage and only Denmark achieved a medium level comparative advantage. Some other countries (France, Ireland, Belgium, Austria, Netherlands and Poland) have weak comparative advantages.
To get a whole picture, the following indices also have been calculated: revealed trade advantages
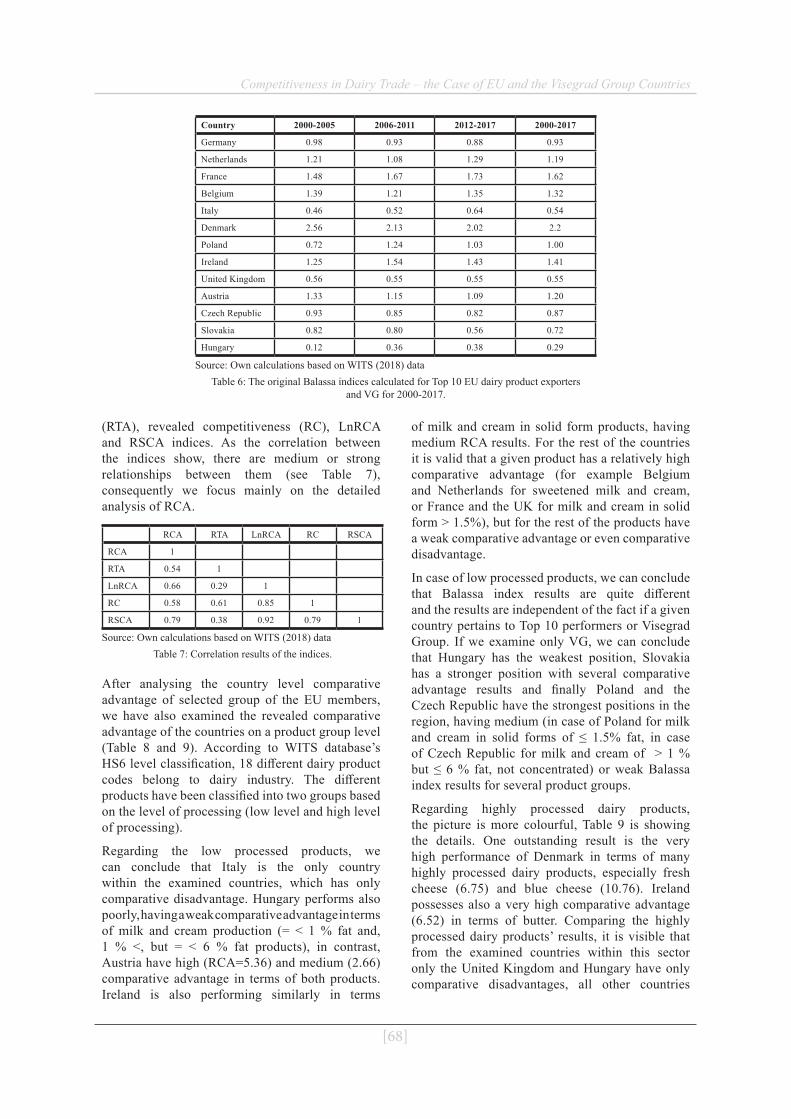
[68]
Competitiveness in Dairy Trade – the Case of EU and the Visegrad Group Countries
Country 2000-2005 2006-2011 2012-2017 2000-2017
Germany 0.98 0.93 0.88 0.93
Netherlands 1.21 1.08 1.29 1.19
France 1.48 1.67 1.73 1.62
Belgium 1.39 1.21 1.35 1.32
Italy 0.46 0.52 0.64 0.54
Denmark 2.56 2.13 2.02 2.2
Poland 0.72 1.24 1.03 1.00
Ireland 1.25 1.54 1.43 1.41
United Kingdom 0.56 0.55 0.55 0.55
Austria 1.33 1.15 1.09 1.20
Czech Republic 0.93 0.85 0.82 0.87
Slovakia 0.82 0.80 0.56 0.72
Hungary 0.12 0.36 0.38 0.29
Source: Own calculations based on WITS (2018) dataTable 6: The original Balassa indices calculated for Top 10 EU dairy product exporters
and VG for 2000-2017.
(RTA), revealed competitiveness (RC), LnRCA and RSCA indices. As the correlation between the indices show, there are medium or strong relationships between them (see Table 7), consequently we focus mainly on the detailed analysis of RCA.
Source: Own calculations based on WITS (2018) dataTable 7: Correlation results of the indices.
RCA RTA LnRCA RC RSCA
RCA 1
RTA 0.54 1
LnRCA 0.66 0.29 1
RC 0.58 0.61 0.85 1
RSCA 0.79 0.38 0.92 0.79 1
After analysing the country level comparative advantage of selected group of the EU members, we have also examined the revealed comparative advantage of the countries on a product group level (Table 8 and 9). According to WITS database’s HS6 level classification, 18 different dairy product codes belong to dairy industry. The different products have been classified into two groups based on the level of processing (low level and high level of processing).
Regarding the low processed products, we can conclude that Italy is the only country within the examined countries, which has only comparative disadvantage. Hungary performs also poorly, having a weak comparative advantage in terms of milk and cream production (= < 1 % fat and, 1 % <, but = < 6 % fat products), in contrast, Austria have high (RCA=5.36) and medium (2.66) comparative advantage in terms of both products. Ireland is also performing similarly in terms
of milk and cream in solid form products, having medium RCA results. For the rest of the countries it is valid that a given product has a relatively high comparative advantage (for example Belgium and Netherlands for sweetened milk and cream, or France and the UK for milk and cream in solid form > 1.5%), but for the rest of the products have a weak comparative advantage or even comparative disadvantage.
In case of low processed products, we can conclude that Balassa index results are quite different and the results are independent of the fact if a given country pertains to Top 10 performers or Visegrad Group. If we examine only VG, we can conclude that Hungary has the weakest position, Slovakia has a stronger position with several comparative advantage results and finally Poland and the Czech Republic have the strongest positions in the region, having medium (in case of Poland for milk and cream in solid forms of ≤ 1.5% fat, in case of Czech Republic for milk and cream of > 1 % but ≤ 6 % fat, not concentrated) or weak Balassa index results for several product groups.
Regarding highly processed dairy products, the picture is more colourful, Table 9 is showing the details. One outstanding result is the very high performance of Denmark in terms of many highly processed dairy products, especially fresh cheese (6.75) and blue cheese (10.76). Ireland possesses also a very high comparative advantage (6.52) in terms of butter. Comparing the highly processed dairy products’ results, it is visible that from the examined countries within this sector only the United Kingdom and Hungary have only comparative disadvantages, all other countries
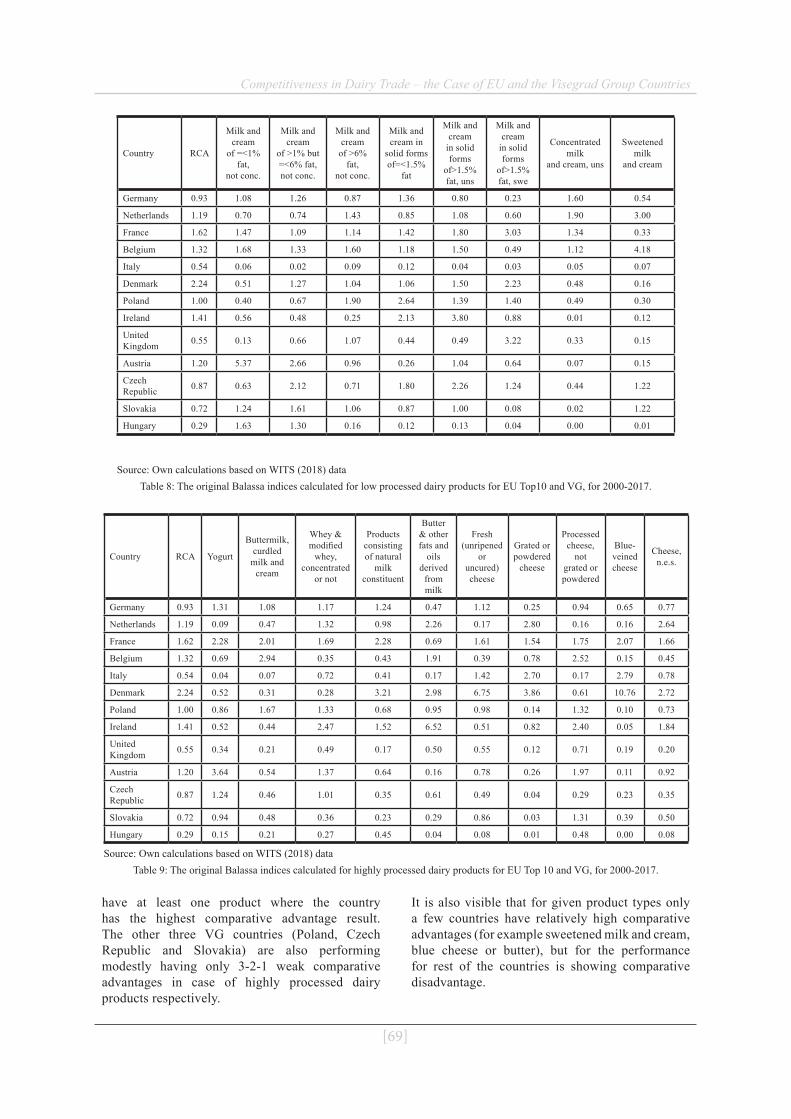
[69]
Competitiveness in Dairy Trade – the Case of EU and the Visegrad Group Countries
Source: Own calculations based on WITS (2018) dataTable 8: The original Balassa indices calculated for low processed dairy products for EU Top10 and VG, for 2000-2017.
Country RCA
Milk and cream
of =<1% fat,
not conc.
Milk and cream
of >1% but =<6% fat, not conc.
Milk and cream
of >6% fat,
not conc.
Milk and cream in
solid forms of=<1.5%
fat
Milk and cream
in solid forms
of>1.5% fat, uns
Milk and cream
in solid forms
of>1.5% fat, swe
Concentrated milk
and cream, uns
Sweetened milk
and cream
Germany 0.93 1.08 1.26 0.87 1.36 0.80 0.23 1.60 0.54
Netherlands 1.19 0.70 0.74 1.43 0.85 1.08 0.60 1.90 3.00
France 1.62 1.47 1.09 1.14 1.42 1.80 3.03 1.34 0.33
Belgium 1.32 1.68 1.33 1.60 1.18 1.50 0.49 1.12 4.18
Italy 0.54 0.06 0.02 0.09 0.12 0.04 0.03 0.05 0.07
Denmark 2.24 0.51 1.27 1.04 1.06 1.50 2.23 0.48 0.16
Poland 1.00 0.40 0.67 1.90 2.64 1.39 1.40 0.49 0.30
Ireland 1.41 0.56 0.48 0.25 2.13 3.80 0.88 0.01 0.12
United Kingdom 0.55 0.13 0.66 1.07 0.44 0.49 3.22 0.33 0.15
Austria 1.20 5.37 2.66 0.96 0.26 1.04 0.64 0.07 0.15
Czech Republic 0.87 0.63 2.12 0.71 1.80 2.26 1.24 0.44 1.22
Slovakia 0.72 1.24 1.61 1.06 0.87 1.00 0.08 0.02 1.22
Hungary 0.29 1.63 1.30 0.16 0.12 0.13 0.04 0.00 0.01
Source: Own calculations based on WITS (2018) dataTable 9: The original Balassa indices calculated for highly processed dairy products for EU Top 10 and VG, for 2000-2017.
Country RCA Yogurt
Buttermilk, curdled
milk and cream
Whey & modified
whey, concentrated
or not
Products consisting of natural
milk constituent
Butter & other fats and
oils derived
from milk
Fresh (unripened
or uncured) cheese
Grated or powdered
cheese
Processed cheese,
not grated or powdered
Blue-veined cheese
Cheese, n.e.s.
Germany 0.93 1.31 1.08 1.17 1.24 0.47 1.12 0.25 0.94 0.65 0.77
Netherlands 1.19 0.09 0.47 1.32 0.98 2.26 0.17 2.80 0.16 0.16 2.64
France 1.62 2.28 2.01 1.69 2.28 0.69 1.61 1.54 1.75 2.07 1.66
Belgium 1.32 0.69 2.94 0.35 0.43 1.91 0.39 0.78 2.52 0.15 0.45
Italy 0.54 0.04 0.07 0.72 0.41 0.17 1.42 2.70 0.17 2.79 0.78
Denmark 2.24 0.52 0.31 0.28 3.21 2.98 6.75 3.86 0.61 10.76 2.72
Poland 1.00 0.86 1.67 1.33 0.68 0.95 0.98 0.14 1.32 0.10 0.73
Ireland 1.41 0.52 0.44 2.47 1.52 6.52 0.51 0.82 2.40 0.05 1.84
United Kingdom 0.55 0.34 0.21 0.49 0.17 0.50 0.55 0.12 0.71 0.19 0.20
Austria 1.20 3.64 0.54 1.37 0.64 0.16 0.78 0.26 1.97 0.11 0.92
Czech Republic 0.87 1.24 0.46 1.01 0.35 0.61 0.49 0.04 0.29 0.23 0.35
Slovakia 0.72 0.94 0.48 0.36 0.23 0.29 0.86 0.03 1.31 0.39 0.50
Hungary 0.29 0.15 0.21 0.27 0.45 0.04 0.08 0.01 0.48 0.00 0.08
have at least one product where the country has the highest comparative advantage result. The other three VG countries (Poland, Czech Republic and Slovakia) are also performing modestly having only 3-2-1 weak comparative advantages in case of highly processed dairy products respectively.
It is also visible that for given product types only a few countries have relatively high comparative advantages (for example sweetened milk and cream, blue cheese or butter), but for the performance for rest of the countries is showing comparative disadvantage.

[70]
Competitiveness in Dairy Trade – the Case of EU and the Visegrad Group Countries
Discussion
The comparative advantages of the European Union and the Visegrad Group have revealed a number of important phenomena already discussed in the literature.
The European Union supplies one-quarter of the world's dairy production and adds 30 % of its commercial growth, mainly with highly processed products (cheese, milk powder, butter). Behind this, the main competitors have been able to increase their production to a greater extent, so European countries are entering the market with highly processed products. In addition, they can devote significant resources to product innovation and technology development (Tacken et al., 2009; Lemoine, 2016; Jansik et al., 2014). A significant part of EU dairy production is realized in Germany and in the Baltic Sea countries, with a production volume of 37.4 %, and 31.4 % of sales in 2012 (Jansik et al., 2014). 42 % to 43 % of the world's cheese production is linked to the European Union, which is the market leader in the world, as it was proved by the strong comparative advantage indices in Denmark, Italy and the Netherlands. The share of EU products in other segments is declining due to the dynamically growing dairy production in developing countries (Tacken et al., 2009). The ending of the milk quota system favoured the more competitive countries because they could export their surplus on a good price. In VG countries the elimination of milk quotas together with the Russian embargo and the cheap import products, resulted in price drop and decreasing competitiveness (Zdráhal et al. 2016; Hanisch et al. 2013). In contrast, Polish dairy sector was able to develop the technology and increase the milk production per animal as well as its effectiveness. The results of analyses based on statistical data are also consistent with the literature.
Jansik et al., (2014) and Viira et al. (2015) identified industry structure, the number, size and geographical distribution of competitors, the level of ownership structure and the cost of production resources as main determinants of competitiveness in the dairy sector. The examples of France, Germany and Poland prove that strong internal demand for the dairy products can be a basis of export success. Poland, however contradicts the above-mentioned competitiveness factors: its dairy sector is fragmented, 95 % of milk is produced in family farms, concentration is low, while technology is developing. In Poland’s case, low level of concentration and fragmented
ownership do not impede export success. However, in Slovakia and Hungary the dominance of foreign-owned milk production and processing, the more concentrated industry and the FDI flowed into the sector during the transition period do not result in export success. The geographically close, big markets (e.g. Germany) are advantageous for the Polish and Czech dairy producers, as it can be seen in their export volume.
To be able to save or improve market positions, VG countries need to develop their competitiveness and join forces (Zdráhal et al., 2018). It might worth to study and benchmark such success stories like those of the Baltic countries which were able to build up comparative advantages, as well as make deep market analyses to understand the specialities, needs and customer expectation of VG region.
ConclusionsIn order to ensure the stable development of milk processing in the coming years and to serve the higher growth in developing countries, dairy companies should be prepared to increase their capacities. Increasing customer expectations on the market also mean that products are highly processed, and our results show that highly processed products are key to competitiveness.
The study can be concluded with a number of useful, forward-looking, thought-provoking conclusions.
On the one hand, when examining the export of milk and dairy products in the European Union, it was found that large quantities of milk production did not clearly lead to the export market success of the country concerned. Germany, France and the United Kingdom have been identified as the largest milk producing countries in the EU, but Denmark, Ireland and France have been the most successful in exports, based on the Balassa index calculations. Even more surprisingly, large dairy countries do not have a really strong comparative advantage in the export of dairy products, only either weak or medium. On the other hand, we have discovered that some countries have a really strong, dominant competitive advantage for highly processed products, which confirms the literature's view that the industry is developing towards these products, which can be the key of success in international trade. Thirdly, we have shown that there are not any strong, dominant country in the export of low-processed dairy products, such as, for example in the case of highly processed products (Denmark - blue cheese, fresh cheese; Ireland - butter). This suggests that countries
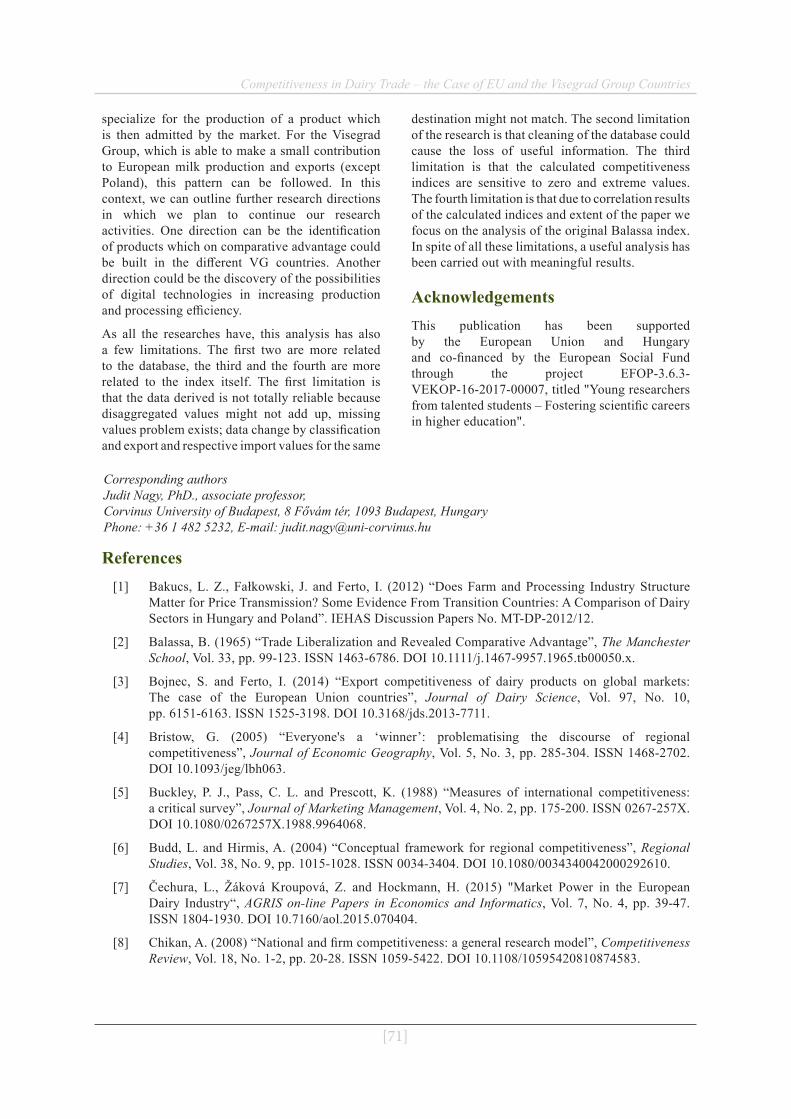
[71]
Competitiveness in Dairy Trade – the Case of EU and the Visegrad Group Countries
specialize for the production of a product which is then admitted by the market. For the Visegrad Group, which is able to make a small contribution to European milk production and exports (except Poland), this pattern can be followed. In this context, we can outline further research directions in which we plan to continue our research activities. One direction can be the identification of products which on comparative advantage could be built in the different VG countries. Another direction could be the discovery of the possibilities of digital technologies in increasing production and processing efficiency.
As all the researches have, this analysis has also a few limitations. The first two are more related to the database, the third and the fourth are more related to the index itself. The first limitation is that the data derived is not totally reliable because disaggregated values might not add up, missing values problem exists; data change by classification and export and respective import values for the same
destination might not match. The second limitation of the research is that cleaning of the database could cause the loss of useful information. The third limitation is that the calculated competitiveness indices are sensitive to zero and extreme values. The fourth limitation is that due to correlation results of the calculated indices and extent of the paper we focus on the analysis of the original Balassa index. In spite of all these limitations, a useful analysis has been carried out with meaningful results.
AcknowledgementsThis publication has been supported by the European Union and Hungary and co-financed by the European Social Fund through the project EFOP-3.6.3-VEKOP-16-2017-00007, titled "Young researchers from talented students – Fostering scientific careers in higher education".
Corresponding authorsJudit Nagy, PhD., associate professor, Corvinus University of Budapest, 8 Fővám tér, 1093 Budapest, HungaryPhone: +36 1 482 5232, E-mail: [email protected]
References[1] Bakucs, L. Z., Fałkowski, J. and Ferto, I. (2012) “Does Farm and Processing Industry Structure
Matter for Price Transmission? Some Evidence From Transition Countries: A Comparison of Dairy Sectors in Hungary and Poland”. IEHAS Discussion Papers No. MT-DP-2012/12.
[2] Balassa, B. (1965) “Trade Liberalization and Revealed Comparative Advantage”, The Manchester School, Vol. 33, pp. 99-123. ISSN 1463-6786. DOI 10.1111/j.1467-9957.1965.tb00050.x.
[3] Bojnec, S. and Ferto, I. (2014) “Export competitiveness of dairy products on global markets: The case of the European Union countries”, Journal of Dairy Science, Vol. 97, No. 10, pp. 6151-6163. ISSN 1525-3198. DOI 10.3168/jds.2013-7711.
[4] Bristow, G. (2005) “Everyone's a ‘winner’: problematising the discourse of regional competitiveness”, Journal of Economic Geography, Vol. 5, No. 3, pp. 285-304. ISSN 1468-2702. DOI 10.1093/jeg/lbh063.
[5] Buckley, P. J., Pass, C. L. and Prescott, K. (1988) “Measures of international competitiveness: a critical survey”, Journal of Marketing Management, Vol. 4, No. 2, pp. 175-200. ISSN 0267-257X. DOI 10.1080/0267257X.1988.9964068.
[6] Budd, L. and Hirmis, A. (2004) “Conceptual framework for regional competitiveness”, Regional Studies, Vol. 38, No. 9, pp. 1015-1028. ISSN 0034-3404. DOI 10.1080/0034340042000292610.
[7] Čechura, L., Žáková Kroupová, Z. and Hockmann, H. (2015) "Market Power in the European Dairy Industry“, AGRIS on-line Papers in Economics and Informatics, Vol. 7, No. 4, pp. 39-47. ISSN 1804-1930. DOI 10.7160/aol.2015.070404.
[8] Chikan, A. (2008) “National and firm competitiveness: a general research model”, Competitiveness Review, Vol. 18, No. 1-2, pp. 20-28. ISSN 1059-5422. DOI 10.1108/10595420810874583.
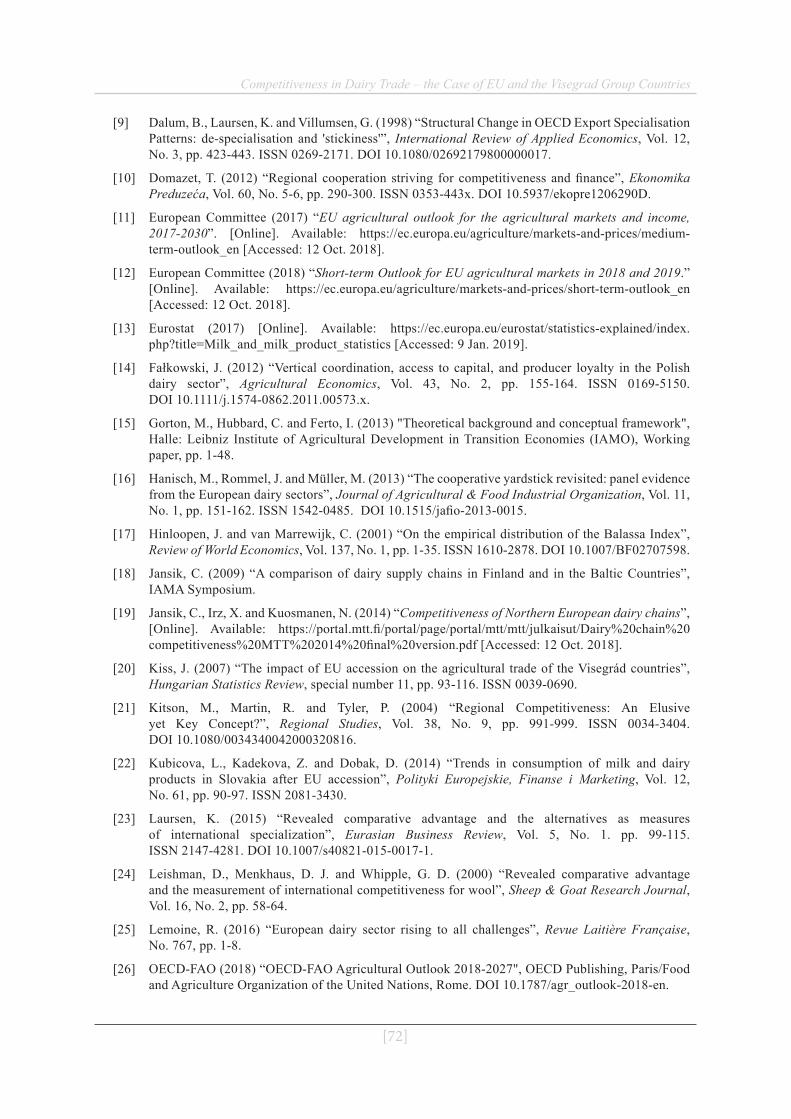
Competitiveness in Dairy Trade – the Case of EU and the Visegrad Group Countries
[72]
[9] Dalum, B., Laursen, K. and Villumsen, G. (1998) “Structural Change in OECD Export Specialisation Patterns: de-specialisation and 'stickiness'”, International Review of Applied Economics, Vol. 12, No. 3, pp. 423-443. ISSN 0269-2171. DOI 10.1080/02692179800000017.
[10] Domazet, T. (2012) “Regional cooperation striving for competitiveness and finance”, Ekonomika Preduzeća, Vol. 60, No. 5-6, pp. 290-300. ISSN 0353-443x. DOI 10.5937/ekopre1206290D.
[11] European Committee (2017) “EU agricultural outlook for the agricultural markets and income, 2017-2030”. [Online]. Available: https://ec.europa.eu/agriculture/markets-and-prices/medium-term-outlook_en [Accessed: 12 Oct. 2018].
[12] European Committee (2018) “Short-term Outlook for EU agricultural markets in 2018 and 2019.” [Online]. Available: https://ec.europa.eu/agriculture/markets-and-prices/short-term-outlook_en [Accessed: 12 Oct. 2018].
[13] Eurostat (2017) [Online]. Available: https://ec.europa.eu/eurostat/statistics-explained/index.php?title=Milk_and_milk_product_statistics [Accessed: 9 Jan. 2019].
[14] Fałkowski, J. (2012) “Vertical coordination, access to capital, and producer loyalty in the Polish dairy sector”, Agricultural Economics, Vol. 43, No. 2, pp. 155-164. ISSN 0169-5150. DOI 10.1111/j.1574-0862.2011.00573.x.
[15] Gorton, M., Hubbard, C. and Ferto, I. (2013) "Theoretical background and conceptual framework", Halle: Leibniz Institute of Agricultural Development in Transition Economies (IAMO), Working paper, pp. 1-48.
[16] Hanisch, M., Rommel, J. and Müller, M. (2013) “The cooperative yardstick revisited: panel evidence from the European dairy sectors”, Journal of Agricultural & Food Industrial Organization, Vol. 11, No. 1, pp. 151-162. ISSN 1542-0485. DOI 10.1515/jafio-2013-0015.
[17] Hinloopen, J. and van Marrewijk, C. (2001) “On the empirical distribution of the Balassa Index”, Review of World Economics, Vol. 137, No. 1, pp. 1-35. ISSN 1610-2878. DOI 10.1007/BF02707598.
[18] Jansik, C. (2009) “A comparison of dairy supply chains in Finland and in the Baltic Countries”, IAMA Symposium.
[19] Jansik, C., Irz, X. and Kuosmanen, N. (2014) “Competitiveness of Northern European dairy chains”, [Online]. Available: https://portal.mtt.fi/portal/page/portal/mtt/mtt/julkaisut/Dairy%20chain%20competitiveness%20MTT%202014%20final%20version.pdf [Accessed: 12 Oct. 2018].
[20] Kiss, J. (2007) “The impact of EU accession on the agricultural trade of the Visegrád countries”, Hungarian Statistics Review, special number 11, pp. 93-116. ISSN 0039-0690.
[21] Kitson, M., Martin, R. and Tyler, P. (2004) “Regional Competitiveness: An Elusive yet Key Concept?”, Regional Studies, Vol. 38, No. 9, pp. 991-999. ISSN 0034-3404. DOI 10.1080/0034340042000320816.
[22] Kubicova, L., Kadekova, Z. and Dobak, D. (2014) “Trends in consumption of milk and dairy products in Slovakia after EU accession”, Polityki Europejskie, Finanse i Marketing, Vol. 12, No. 61, pp. 90-97. ISSN 2081-3430.
[23] Laursen, K. (2015) “Revealed comparative advantage and the alternatives as measures of international specialization”, Eurasian Business Review, Vol. 5, No. 1. pp. 99-115. ISSN 2147-4281. DOI 10.1007/s40821-015-0017-1.
[24] Leishman, D., Menkhaus, D. J. and Whipple, G. D. (2000) “Revealed comparative advantage and the measurement of international competitiveness for wool”, Sheep & Goat Research Journal, Vol. 16, No. 2, pp. 58-64.
[25] Lemoine, R. (2016) “European dairy sector rising to all challenges”, Revue Laitière Française, No. 767, pp. 1-8.
[26] OECD-FAO (2018) “OECD-FAO Agricultural Outlook 2018-2027", OECD Publishing, Paris/Food and Agriculture Organization of the United Nations, Rome. DOI 10.1787/agr_outlook-2018-en.

Competitiveness in Dairy Trade – the Case of EU and the Visegrad Group Countries
[73]
[27] Perekhozhuk, O., Hockmann, H., Ferto, I. and Bakucs, L. Z. (2013) “Identification of market power in the Hungarian dairy industry: A plant-level analysis”, Journal of Agricultural & Food Industrial Organization, Vol. 11, No. 1, pp. 1-13. ISSN 1542-0485. DOI 10.1515/jafio-2012-0005.
[28] Poppe, K. J. (2008) “Regulation and competitiveness in the European dairy industry”, [Online]. Available: https://ec.europa.eu/docsroom/documents/3363/attachments/1/translations/en/renditions/pdf [Accessed: 12 Oct. 2018].
[29] Porter, M.E. (1990) “Competitive advantage of nations”, Harvard Business Review, Vol. 68, No. 2, pp. 73-93. ISSN 0017-8012.
[30] Ricardo, D. (1817) "On the principles of political economy and taxation", New York: Macmillan, 1909.
[31] Salou, T., van der Werf, H. M., Levert, F., Forslund, A., Hercule, J. and Le Mouël, C. (2017) “Could EU dairy quota removal favour some dairy production systems over others? The case of French dairy production systems”, Agricultural Systems, Vol. 153, No. May 2017, pp. 1-10. ISSN 0308-521X. DOI 10.1016/j.agsy.2017.01.004.
[32] Saricoban, K. and Kaya, E. (2017) “Determination of the seafood export competitiveness: the comparative analysis of top ten countries having lion share from seafood export”, Journal of Business, Economics and Finance, Vol. 6, No. 2, pp. 112-124. ISSN 2146-7943. DOI 10.17261/Pressacademia.2017.500.
[33] Spicka, J. (2013) “The Competitive Environment in the Dairy Industry and its Impact on the Food Industry”, AGRIS On-Line Papers in Economics and Informatics, Vol. 5, No. 2, pp. 89-102. ISSN 1804-1930.
[34] Spicka, J., Smutka, L. and Selby, R. (2015) “Recent areas of innovation activities in the Czech dairy industry”, Agricultural Economics, Vol. 61, No. 6, pp. 249-264. ISSN 0139-570X. DOI 10.17221/128/2014-AGRICECON.
[35] Tacken, G. M. L., Batowska, A., Gardebroek, C., Turi, K. N., Banse, M., Wijnands, J. H. M. and Poppe, K. (2009) “Competitiveness of the EU dairy industry”. [Online]. Available: http://edepot.wur.nl/10766 [Accessed: 12 Oct. 2018].
[36] Torok, A., Mizik, T. and Jambor, A. (2018) “The Competitiveness of Global Coffee Trade”, International Journal of Economics and Financial Issues, Vol. 8, No. 5, pp. 1-6. ISSN 2146-4138.
[37] Viira, A. H., Omel, R., Värnik, R., Luik, H., Maasing, B. and Põldaru, R. (2015) “Competitiveness of the Estonian dairy sector, 1994–2014”, Journal of Agricultural Science, Vol. 26, No. 2, pp. 84-105. ISSN 1469-5146.
[38] Vollrath, T. L. (1991) “A theoretical evaluation of alternative trade intensity measures of revealed comparative advantage”, Weltwirtschaftliches Archiv, Vol. 130, No. 2, pp. 263-279. ISSN 1610-2878. DOI 10.1007/BF02707986.
[39] Wijnands, J. H. M., Bremmers, H. J., van Der Meulen, M. and Poppe, K. J. (2008) “An economic and legal assessment of the EU food industry's competitiveness”, Agribusiness, Vol. 24, No. 4, pp. 417-439. ISSN 0742-4477. DOI 10.1002/agr.20167.
[40] World Integrated Trade Solution (WITS) database (2018) World bank. Open databases. [Online]. Available: https://wits.worldbank.org/ [Accessed: 5 Oct. 2018].
[41] Zdráhal, I., Chmelíková, G., Blažková, I. and Bečvářová, V. (2016) “Differences in the Performance of the Dairy Industries within the Visegrad Group Countries”, The International Scientific Conference INPROFORUM 2016, November 3-4, 2016, České Budějovice, 132-136 p.
[42] Zdráhal, I., Chmelíková, G. and Blažková, I. (2018) “Sector-Wide and Country-Specific Drivers of Firm Performance in the Visegrad Group Dairy Industry", AGRIS on-line Papers in Economics and Informatics, Vol. 10, No. 4, pp. 89-100. ISSN 1804-1930. DOI 10.7160/aol.2018.100410.

Competitiveness in Dairy Trade – the Case of EU and the Visegrad Group Countries
[74]
Appendix
Product code Descriptions
40110 Milk and cream of =<1% fat, not concentrated
40120 Milk and cream of >1% but =<6% fat, not concentrated
40130 Milk and cream of >6% fat, not concentrated
40210 Milk and cream in solid forms of =<1.5% fat
40221 Milk and cream in solid forms of>1.5% fat, unsweetened
40229 Milk and cream in solid forms of>1.5% fat, sweetened
40291 Concentrated milk and cream, unsweetened
40299 Sweetened milk and cream (excl. in solid form)
40310 Yogurt
40390 Buttermilk, curdled milk and cream
40410 Whey & modified whey concentrated or not
40490 Products consisting of natural milk constituent
40500 Butter & other fats and oils derived from milk
40610 Fresh (unripened or uncured) cheese
40620 Grated or powdered cheese
40630 Processed cheese not grated or powdered
40640 Blue-veined cheese
40690 Cheese (not elsewhere specified)
[75]
Agris on-line Papers in Economics and Informatics
Volume XI Number 4, 2019
User Experience and Usability in Agriculture – Selected Aspects for Design SystemsJakub Štěpán Novák1, Jan Masner1, Jiří Vaněk1, Pavel Šimek1, Klára Hennyeyová2
1 Department of Information Technologies, Faculty of Economics and Management, Czech University of Life Sciences Prague, Czech Republic
2 Department of Informatics, Faculty of Economics and Management, Slovak University of Agriculture in Nitra, Slovak Republic
AbstractThe paper focuses on the analysis of the applicability of usability and UX methods in the development of applications intended for use in the agrarian sector. In addition to an overview of methods and approaches suitable for this purpose, the process of advanced adoption of the UX methods in the development of agrarian software products is also described. The article also discusses ways to enable partially automated, time-efficient, and cost-effective solutions for the creation of interfaces for agricultural applications. Possibilities of future development and technologies related to the usability of products in agriculture are also outlined. The article thus covers the concept for optimizing the development of agricultural products. The main contribution is the input analysis for the future development of the agrarian design system. From such a synthesized system design, it is then possible to create application interfaces that should have seamless usability and good UX.
KeywordsUX, Usability, Agriculture, Design System, Automation, UI, SW, Digital product.
Novák, J. Š., Masner, J., Vaněk, J., Šimek, P. and Hennyeyová, K. (2019) “User Experience and Usability in Agriculture - Selected Aspects for Design Systems", AGRIS on-line Papers in Economics and Informatics, Vol. 11, No. 4, pp. 75-83. ISSN 1804-1930. DOI 10.7160/aol.2019.110407.
IntroductionUser Experience
User Experience (UX) is a phenomenon currently emerging in connection with any product intended for consumption and control by users (Hassenzahl and Tractinsky, 2006). The term UX and its use does not have a long history, but the true core of this new scientific discipline dates back to times when there were no computers, let alone the sophisticated software products that UX is currently dealing with (Getto, et al., 2013). Now, this term is primarily related to the optimization of application development, specifically their user interface (Saavedra, et al., 2019). Thanks to this connection, UX now stands for application development, which greatly limits the domain of this industry. At the core, UX deals with everything that somehow affects users during product interaction, especially at the emotional level (Kuusinen, et al., 2012). It does not have to be just a software product interface. For example, a coffee shop may also have a good UX where the entire process
from ordering coffee to consumption to exiting the establishment leaves a pleasant feeling in the customer (Pauls, 2013). A bad user experience can be associated with unpleasant and unnecessary bureaucracy and inconvenient processes when visiting the office. In a similar way, a user can take away any user experience, for example from a software product, whether positive, when the product does exactly what the user expects without unnecessary hurdles and intuitively helps him achieve the goal (Ceccacci and Giraldi, 2016). Or, on the contrary, an application can be remembered due to its painful logic even years after its last use. In all these cases we can talk about user experience. However, in order to be able to effectively monitor, measure and effectively apply this information to product development and subsequent iterations, many specialized disciplines are required. It is these different disciplines that are covered by one overarching term, called UX (Sivaji, et al., 2016).
Basically, UX combines the fields of information architecture, psychology, analytics, design,

[76]
User Experience and Usability in Agriculture – Selected Aspects for Design Systems
and testing (Rosenberg, 2018). Variable aspects of these disciplines are utilized across the UX process cycle, which has the most general form of discovery - identifying needs, facts and additional information, followed by a design process using various design methods, completing the process with testing of created designs and validating hypotheses. This process is repeated in iterations until an ideal result is obtained as a seamlessly usable product (Hartson and Pyla, 2012). The UX process is shown in Figure 1.
Source: theblog.adobe.comFigure1: UX process.
Usability
One of the building blocks of UX is usability, which is often confused with UX. However, the fact remains that usability is only one aspect of UX (Tullis and Albert, 2013). Usability describes how well, intuitively the product can be used, while usability also monitors how the product interaction side meets the standards and requirements of disabled users (Finstad, 2010) (Pétrie and Bevan, 2009). The overall rememberability and teachability of the interface is also strongly influenced by the overall usability of the product (Rusu, et al., 2015).
Usability and UX in agriculture
In recent years, the usability of products as well as the focus of companies on UX has greatly improved and this trend of adaptation to product quality and usability has been increasing (Šimek, et al., 2015). The evolution of interest over ten years is shown in Figure 2. However, agriculture and agricultural software products, in particular, are still lagging behind in terms of usability and quality compared to other specialized products, mainly due to the lack of acceptance of modern SW and UX developments the industry (Ranasinghe, et al., 2019).
In order to satisfy the high interest in UX, it is necessary to define various methodologies, which will help to anchor UX and allow for the associated higher product quality. As already illustrated in Figure 1, the UX process has many phases, with a plethora of methods applicable in each phase. The list below captures the commonly used method groups including both old and modern methods:
- Questionnaire surveys. The fastest, cheapest, and the most convenient way to receive feedback. In the agricultural sector, due to the geographical size of the user group, this method is very suitable for the initialization of development bases (Hinderks, et al., 2019).
- Deep-dive interviews. A method that relies heavily on psychology. The main task is not to test but to identify the needs of the user that are not obvious at first sight (Wilson, 2014).
- Laboratory testing. Specific application test data is best obtained from laboratory
Source: Authors @ GoogleTrendsFigure 2: Development of UX and usability interest between 2009-2019.
[77]
User Experience and Usability in Agriculture – Selected Aspects for Design Systems
testing. The laboratory alternative is an adequately equipped PC. From this kind of testing, data is obtained primarily through eye movement, eye and click heatmap, user's facial expressions and different biometric indicators (Wittenberg, et al., 2019).
- Design Systems. A method of creating AI that excels in achieving perfect consistency of the user interface and thus strongly supports the usability of the whole product (Churchill, 2019).
Poor product usability in agriculture often results in confusing information for businesses, inefficient production, and resource management, and finally, a strong negative financial impact (Hussein, et al., 2014). Smaller firms of any kind are also facing this problem. These problems are greatly reduced thanks to newly applied methods and procedures that support UX adaptation and the associated higher product quality. Moreover, by keeping UX application costs low and usable, they make them more accessible and, above all, better graspable (Kujala, et al., 2011). UX in agriculture currently works well, for example, with physical controls and instruments (Trivelli, et al., 2019). However, agricultural software solutions lack UX. This is mainly due to the very narrow focus of this direction, the target user group and the resources allocated to the development of these products (Witteveen, et al., 2017). For example, automation of development processes or open and accessible libraries containing ready-made components and proven solutions to problematic aspects of agricultural system AIs can help improve this situation. One option could be to create an agrarian design system.
Development possibilities for usability and UX in agriculture
In addition to conventional applications, the agricultural sector can also benefit from virtual and augmented reality technologies. Cases where an agricultural worker can receive relevant information in real time through smart glasses allow for new applications and with them new challenges in the usability testing and development of these solutions (Huuskonen and Oksanen, 2018).
Prominent areas of augmented reality in agriculture:
- Field monitoring and detection of pests and insects
- Soil analysis, recommendation of specific crops for specific parts of the field
- Virtual tours without the use of physical agricultural equipment
These technologies lead to an ideal usability scenario. Thus, to an interface that the user is not even aware of, the interface intuitively transmits value to it in the form of readily available relevant information. Testing of these devices relies heavily on monitoring eye movement and gyroscopic movement indicators of the user (Barricelli, et al., 2018).
Materials and methodsThe article focuses on the analysis of methods and procedures in the field of using UX for the development of agrarian sector SW products and relies heavily on existing long-term research of the Department of Information Technologies of the CULS Prague in areas of testing, automation and creation of usability support systems. The aim of this article is to identify appropriate methods, describe the prerequisites for the creation of a high quality UX product page, and also to define a methodology that would allow the rapid and efficient deployment of UX and SW usability as a common part of agricultural solutions. Consequently, the agricultural sector could also reach the level of others in application usability, and it would be possible to develop application interfaces in a cost-effective and high-quality environment in any farm size environment.
The article builds upon the knowledge obtained from scientific literature and the study of behavioural patterns of the agrarian user base. Furthermore, the methods of user needs determination and rapid verification of hypotheses were used. The article serves as an introductory study for the future methodology of creating an agrarian design system.
The research analysed data from the following methods and procedures:
- Methods of testing the usability of applications focusing on agriculture
- Demographic investigation of behaviour and requirements
- Concept and creation of design systems
Usability testing
As part of the long-term research activity of DIT in the creation of various agrarian applications, the target group was presented with various scenarios and versions of agrarian-oriented portals with different levels of usability. This means
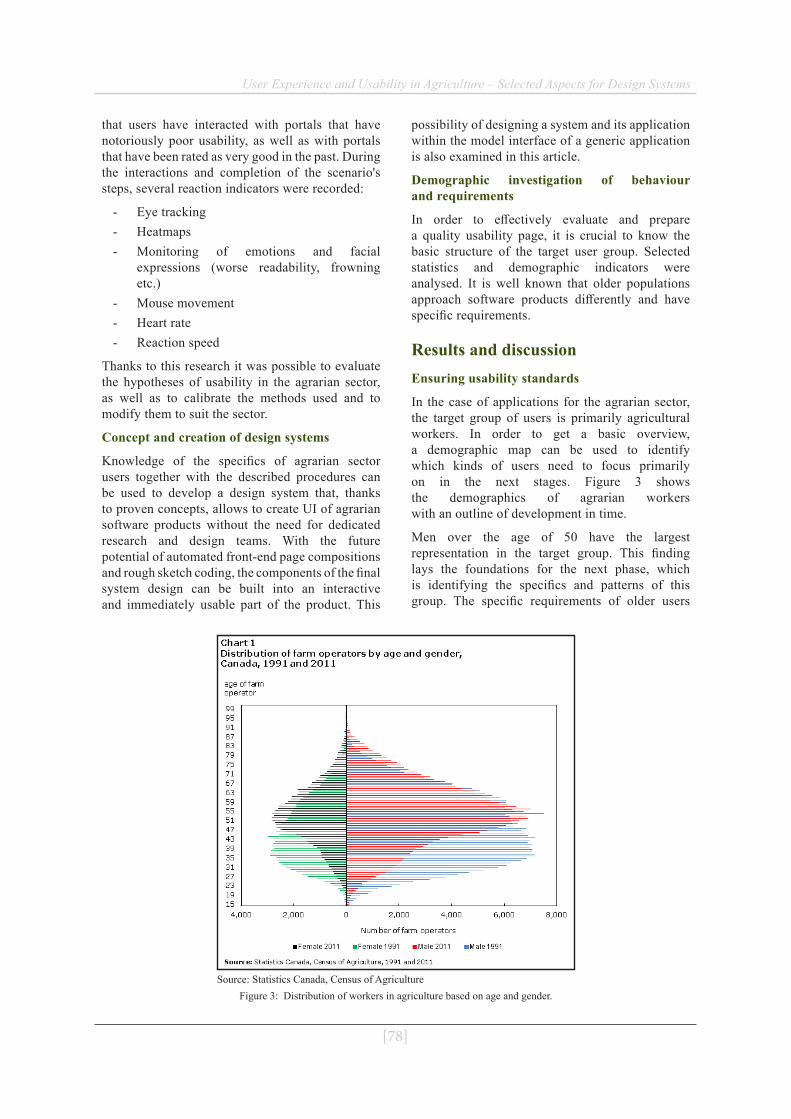
[78]
User Experience and Usability in Agriculture – Selected Aspects for Design Systems
that users have interacted with portals that have notoriously poor usability, as well as with portals that have been rated as very good in the past. During the interactions and completion of the scenario's steps, several reaction indicators were recorded:
- Eye tracking - Heatmaps - Monitoring of emotions and facial
expressions (worse readability, frowning etc.)
- Mouse movement - Heart rate - Reaction speed
Thanks to this research it was possible to evaluate the hypotheses of usability in the agrarian sector, as well as to calibrate the methods used and to modify them to suit the sector.
Concept and creation of design systems
Knowledge of the specifics of agrarian sector users together with the described procedures can be used to develop a design system that, thanks to proven concepts, allows to create UI of agrarian software products without the need for dedicated research and design teams. With the future potential of automated front-end page compositions and rough sketch coding, the components of the final system design can be built into an interactive and immediately usable part of the product. This
possibility of designing a system and its application within the model interface of a generic application is also examined in this article.
Demographic investigation of behaviour and requirements
In order to effectively evaluate and prepare a quality usability page, it is crucial to know the basic structure of the target user group. Selected statistics and demographic indicators were analysed. It is well known that older populations approach software products differently and have specific requirements.
Results and discussionEnsuring usability standards
In the case of applications for the agrarian sector, the target group of users is primarily agricultural workers. In order to get a basic overview, a demographic map can be used to identify which kinds of users need to focus primarily on in the next stages. Figure 3 shows the demographics of agrarian workers with an outline of development in time.
Men over the age of 50 have the largest representation in the target group. This finding lays the foundations for the next phase, which is identifying the specifics and patterns of this group. The specific requirements of older users
Source: Statistics Canada, Census of AgricultureFigure 3: Distribution of workers in agriculture based on age and gender.
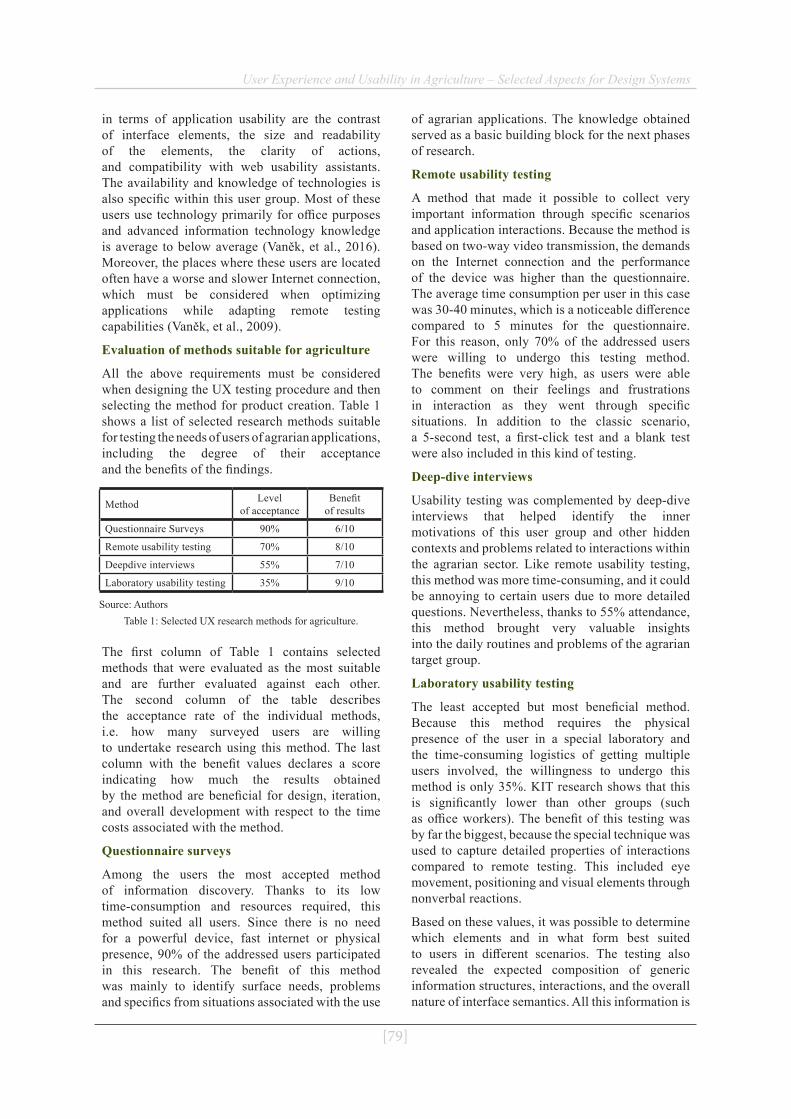
[79]
User Experience and Usability in Agriculture – Selected Aspects for Design Systems
in terms of application usability are the contrast of interface elements, the size and readability of the elements, the clarity of actions, and compatibility with web usability assistants. The availability and knowledge of technologies is also specific within this user group. Most of these users use technology primarily for office purposes and advanced information technology knowledge is average to below average (Vaněk, et al., 2016). Moreover, the places where these users are located often have a worse and slower Internet connection, which must be considered when optimizing applications while adapting remote testing capabilities (Vaněk, et al., 2009).
Evaluation of methods suitable for agriculture
All the above requirements must be considered when designing the UX testing procedure and then selecting the method for product creation. Table 1 shows a list of selected research methods suitable for testing the needs of users of agrarian applications, including the degree of their acceptance and the benefits of the findings.
Source: AuthorsTable 1: Selected UX research methods for agriculture.
Method Level of acceptance
Benefit of results
Questionnaire Surveys 90% 6/10
Remote usability testing 70% 8/10
Deepdive interviews 55% 7/10
Laboratory usability testing 35% 9/10
The first column of Table 1 contains selected methods that were evaluated as the most suitable and are further evaluated against each other. The second column of the table describes the acceptance rate of the individual methods, i.e. how many surveyed users are willing to undertake research using this method. The last column with the benefit values declares a score indicating how much the results obtained by the method are beneficial for design, iteration, and overall development with respect to the time costs associated with the method.
Questionnaire surveys
Among the users the most accepted method of information discovery. Thanks to its low time-consumption and resources required, this method suited all users. Since there is no need for a powerful device, fast internet or physical presence, 90% of the addressed users participated in this research. The benefit of this method was mainly to identify surface needs, problems and specifics from situations associated with the use
of agrarian applications. The knowledge obtained served as a basic building block for the next phases of research.
Remote usability testing
A method that made it possible to collect very important information through specific scenarios and application interactions. Because the method is based on two-way video transmission, the demands on the Internet connection and the performance of the device was higher than the questionnaire. The average time consumption per user in this case was 30-40 minutes, which is a noticeable difference compared to 5 minutes for the questionnaire. For this reason, only 70% of the addressed users were willing to undergo this testing method. The benefits were very high, as users were able to comment on their feelings and frustrations in interaction as they went through specific situations. In addition to the classic scenario, a 5-second test, a first-click test and a blank test were also included in this kind of testing.
Deep-dive interviews
Usability testing was complemented by deep-dive interviews that helped identify the inner motivations of this user group and other hidden contexts and problems related to interactions within the agrarian sector. Like remote usability testing, this method was more time-consuming, and it could be annoying to certain users due to more detailed questions. Nevertheless, thanks to 55% attendance, this method brought very valuable insights into the daily routines and problems of the agrarian target group.
Laboratory usability testing
The least accepted but most beneficial method. Because this method requires the physical presence of the user in a special laboratory and the time-consuming logistics of getting multiple users involved, the willingness to undergo this method is only 35%. KIT research shows that this is significantly lower than other groups (such as office workers). The benefit of this testing was by far the biggest, because the special technique was used to capture detailed properties of interactions compared to remote testing. This included eye movement, positioning and visual elements through nonverbal reactions.
Based on these values, it was possible to determine which elements and in what form best suited to users in different scenarios. The testing also revealed the expected composition of generic information structures, interactions, and the overall nature of interface semantics. All this information is
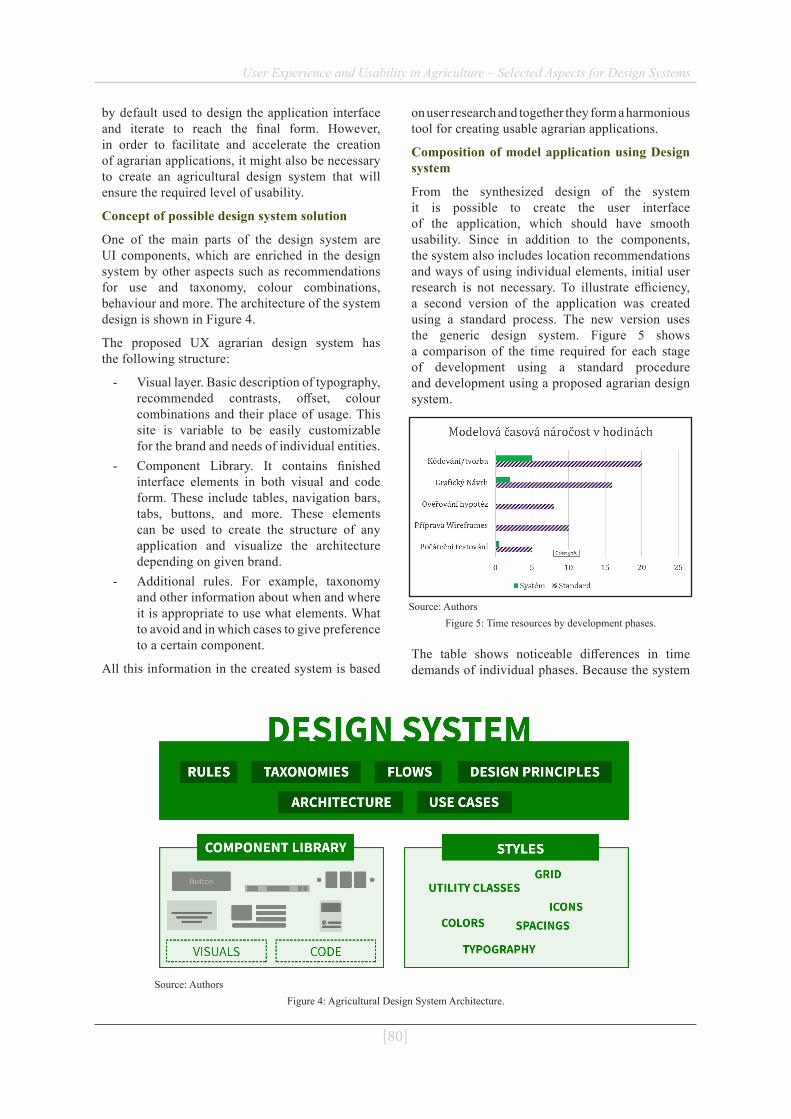
[80]
User Experience and Usability in Agriculture – Selected Aspects for Design Systems
by default used to design the application interface and iterate to reach the final form. However, in order to facilitate and accelerate the creation of agrarian applications, it might also be necessary to create an agricultural design system that will ensure the required level of usability.
Concept of possible design system solution
One of the main parts of the design system are UI components, which are enriched in the design system by other aspects such as recommendations for use and taxonomy, colour combinations, behaviour and more. The architecture of the system design is shown in Figure 4.
The proposed UX agrarian design system has the following structure:
- Visual layer. Basic description of typography, recommended contrasts, offset, colour combinations and their place of usage. This site is variable to be easily customizable for the brand and needs of individual entities.
- Component Library. It contains finished interface elements in both visual and code form. These include tables, navigation bars, tabs, buttons, and more. These elements can be used to create the structure of any application and visualize the architecture depending on given brand.
- Additional rules. For example, taxonomy and other information about when and where it is appropriate to use what elements. What to avoid and in which cases to give preference to a certain component.
All this information in the created system is based
on user research and together they form a harmonious tool for creating usable agrarian applications.
Composition of model application using Design system
From the synthesized design of the system it is possible to create the user interface of the application, which should have smooth usability. Since in addition to the components, the system also includes location recommendations and ways of using individual elements, initial user research is not necessary. To illustrate efficiency, a second version of the application was created using a standard process. The new version uses the generic design system. Figure 5 shows a comparison of the time required for each stage of development using a standard procedure and development using a proposed agrarian design system.
Source: Authors Figure 5: Time resources by development phases.
The table shows noticeable differences in time demands of individual phases. Because the system
Source: AuthorsFigure 4: Agricultural Design System Architecture.

[81]
User Experience and Usability in Agriculture – Selected Aspects for Design Systems
design is based on the lessons learned from verifying usability hypotheses, there is no need to spend any time in the phases associated with testing and initial conception. Thanks to the finished components, the implementation phases of the design system process are also significantly shorter. In this case, the most demanding is the composition of the interface and the coding of the additional functions. Subsequent adjustments such as interface colouring are very fast due to usage of variables. In the traditional procedure, the components must first be drawn and coded from scratch. Creating a model interface using a design system took less than 8 hours, while the traditional process took almost 60 hours. The application of this procedure can therefore, thanks to its low resource requirements, help to develop more and better usable applications for the agrarian sector.
ConclusionResearch has shown that the most suitable methods for testing UX and usability in the agrarian sector are questionnaire survey, remote usability testing, deep-dive interviews, and laboratory usability testing. Using these methods, it is possible not only to create good quality agrarian applications, but also to build the foundations of an agrarian design system, which in the future has the potential to elevate the development of these applications to a higher level. Mainly thanks to the potential of system design based on the usability standards of the agrarian sector, it is possible to create user
interfaces with very good UX very effectively. The strong point is that this system can be used by anyone without the necessary expertise in the field of usability and UX. The combination of time efficiency, ease of grasping, and the foundations of proven hypotheses make this tool a force that has the potential to stir the applicability of agrarian sector applications in the right direction.
The potential future combination of this agrarian design system together with the automated composition of UI interfaces could be a breakthrough in creating not only interfaces of agrarian applications. The detailed impact on the perceived quality of usability of the interfaces created this way, together with the economic implications in more complex scenarios, will be the subject of future research. The main benefit should be to simplify the creation of agrarian applications in any environment while achieving high usability and quality.
AcknowledgmentsThe results and knowledge included herein have been obtained owing to support from the following institutional grants. Internal grant agency of the Faculty of Economics and Management, Czech University of Life Sciences in Prague, grant no. 2019A0011 – “Automated classification of user action within laboratory usability testing and UX.
Corresponding authorsJakub Štěpán NovákDepartment of Information Technologies, Faculty of Economics and Management Czech University of Life Sciences Prague, Kamýcká 129, 165 00 Prague-Suchdol, Czech RepublicE-mail: [email protected]
References[1] Barricelli, B. R., de Bonis, A., Di Gaetano, S. and Valtolina. (2018) “Semiotic framework for virtual
reality usability and ux evaluation: A pilot study”, CEUR Workshop Proceedings. ISSN 16130073.
[2] Ceccacci, S. and Giraldi, L. (2016) “Product usability: Is it a criterion to measure "Good UX" or a prerequisite?”, Proceedings of the ASME Design Engineering Technical Conference. ISSN 00002008. DOI 10.1115/DETC2016-59500.
[3] Finstad, K. (2010) “The Usability Metric for User Experience”, Interacting with Computers, pp. 323-327. E-ISSN 1873-7951. ISSN 0953-5438 DOI 10.1016/j.intcom.2010.04.004.
[4] Getto, G., Potts, L., Salvo , M. J. and Gossett, K. (2013) “Teaching UX: designing programs to train the next generation of UX experts”, Proceedings of the 31st ACM international conference on Design of communication, pp. 65-70. ISBN 978-1-4503-2131-0. DOI 10.1145/2507065.2507082.
[5] Hartson, R. and Pyla, P. S. (2012) “The UX Book”, Morgan Kaufmann. ISBN-13 978-0123852410.
[82]
User Experience and Usability in Agriculture – Selected Aspects for Design Systems
[6] Hassenzahl, M. and Tractinsky, N. (2006) “User experience - A research agenda”, Behaviour and Information Technology, pp. 91-97. ISSN 13623001. DOI 10.1080/01449290500330331.
[7] Hinderks, A., Schrepp, M., Mayo, F. J. D., Escalona, M. J. and Thomachewski, J. (2019) “Developing a UX KPI based on the user experience questionnaire”, Computer Standards and Interfaces, Vol. 65, pp. 38-44. ISSN 0920-5489. DOI 10.1016/j.csi.2019.01.007.
[8] Hussein, I., Mahmud, M. and Md Tap, A. O. (2014) “HCI Knowledge for UX Practices in the Web Development Process”, International Conference of Design, User Experience, and Usability, pp. 116-126. DOI 10.1007/978-3-319-07626-3_11.
[9] Huuskonen, J. and Oksanen, T. (2018) “Soil sampling with drones and augmented reality in precision agriculture”, Computers and Electronics in Agriculture, Vol. 154, pp. 25-35. ISSN 0168-1699. DOI 10.1016/j.compag.2018.08.039.
[10] Churchill, E. (2019) “Scaling UX with design systems”, Interactions, pp. 22-23. E-ISSN 1558-3449, ISSN 1072-5520. DOI 10.1145/3352681.
[11] Kujala, S., Roto, V., Väänänen-Vainio-Mattila, K., Karapanos, E., Sinnelä, A. (2011) “UX Curve: A method for evaluating long-term user experience”, Interacting with Computers, Vol. 23, No. 5, pp. 473-483. DOI 10.1016/j.intcom.2011.06.005.
[12] Kuusinen, K., Mikkonen, T. and Pakarinen, S. (2012) “Agile user experience development in a large software organization: Good expertise but limited impact”, In: Winckler M., Forbrig P., Bernhaupt R. (eds) Human-Centered Software Engineering. HCSE 2012. Lecture Notes in Computer Science, vol 7623. Springer, Berlin, Heidelberg, pp. 94-111. ISBN 978-3-642-34346-9. DOI 10.1007/978-3-642-34347-6_6.
[13] Pauls, J. (2013) “The pathology of everyday things - Stairways – Revisted”, Proceedings of the Human Factors and Ergonomics Society Annual Meeting, pp. 580-584. E-ISSN 1071-1813, ISSN 2169-5067. DOI 10.1177/1541931213571124.
[14] Pétrie, H. L. and Bevan, N. (2009) “The evaluation of accessibility, usability, and user experience”, In: The Universal Access Handbook, CRC Press, pp. 20-1-20-16. ISBN 9780805862805.
[15] Ranasinghe, C., Pfeiffer, M., Heitmann, S. and Kray, C. (2019) “Evaluating User Experience under Location Quality Variations: A Framework for in-the-wild Studies”, Proceedings of the 21st International Conference on Human-Computer Interaction with Mobile Devices and Services. ISBN 978-1-4503-6825-4. DOI 10.1145/3338286.3344392.
[16] Rosenberg, D. (2018) “The business of UX strategy”, Interactions, pp. 26-32. E-ISSN 1558-3449, ISSN 1072-5520. DOI 10.1145/3181372.
[17] Rusu, C., Rusu, V., Roncagliolo, S. and González, C. (2015) “Usability and User Experience: What Should We Care About?”, International Journal of Information Technologies and Systems Approach, Vol. 8, No. 2, pp. 1-12. ISSN 1935-570X. DOI 10.4018/IJITSA.2015070101.
[18] Saavedra, M.-J., Rusu, C., Quiñones, D. and Roncagliolo, S. (2019) “A Set of Usability and User eXperience Heuristics for Social Networks”, Conference paper In book series Lecture Notes in Computer Science, pp. 128-139. DOI 10.1007/978-3-030-21902-4_10.
[19] Sivaji, A., Nielsen, S. F. and Clemmensen, T. (2016) “A Textual Feedback Tool for Empowering Participants in Usability and UX Evaluations”, International Journal of Human–Computer Interaction, Vol. 33, No. 5 pp. 357-370. E- ISSN 1532-7590, ISSN 1044-7318. DOI 10.1080/10447318.2016.1243928.
[20] Šimek P., Vaněk J., Pavlík J. (2015) "Usability of UX Methods in Agrarian Sector – Verification“, AGRIS on-line Papers in Economics and Informatics, Vol. 7, No. 3, pp. 49 – 56. ISSN 1804-1930. DOI 10.7160/aol.2015.070305.
[21] Trivelli, L., Apicella, A., Chiarello, F., Rana, R., Fantoni, G. and Tarabella, A. (2019) “From precision agriculture to Industry 4.0: Unveiling technological connections in the agrifood sector”, British Food Journal, Vol. 121, No. 8, pp. 1730-1743. ISSN 0007-070X. DOI 10.1108/BFJ-11-2018-0747.

[83]
User Experience and Usability in Agriculture – Selected Aspects for Design Systems
[22] Tullis, T. and Albert, B. (2013) “Measuring the User Experience”, Morgan Kaufmann, 320 p. ISBN-13 978-0124157811.
[23] Vaněk, J., Očenášek, V., Stočes, M., Masner, J. (2016) “Adoption of modern ICT in regional perspective – situation in the Czech Republic”, Proceedings of the 16th International Scientific Conference Globalization and its socio-economic consequences 05.10.2016, GEORG, Zilina, Slovak Republic, pp. 2291-2298. ISSN 2454-0943. ISBN 978-80-8154-191-9.
[24] Vaněk, J., Jarolímek, J. and Šimek, P. (2009). “Information Services and ICT Development in Agriculture of the Czech Republic”, Agris on-line Papers in Economics and Informatics, Vol. 1, No. 1., pp. 1-5. ISSN 1804-1930.
[25] Wilson, C. (2013) “Interview Techniques for UX Practitioners: A User-Centered Design Method”, Morgan Kaufmann, 122 p. ISBN 9780124103931.
[26] Wittenberg C., Bauer B., Stache N. (2019) A Smart Factory in a Laboratory Size for Developing and Testing Innovative Human-Machine Interaction Concepts. In: Ahram T., Falcão C. (eds) Advances in Usability and User Experience, AHFE 2019, Advances in Intelligent Systems and Computing, Vol. 972, Springer, Cham. E-ISBN 978-3-030-19135-1, ISBN 978-3-030-19134-4. DOI 10.1007/978-3-030-19135-1_16.
[27] Witteveen, L., Lie, R., Goris, M. and Ingram, V. (2017) “Design and development of a digital farmer field school. Experiences with a digital learning environment for cocoa production and certification in Sierra Leone”, Telematics and Informatics, Vol. 34, No. 8., pp. 1673-1684. ISSN 0736-5853. DOI 10.1016/j.tele.2017.07.013.

[84]
Agris on-line Papers in Economics and Informatics
[85]
Agris on-line Papers in Economics and Informatics
Volume XI Number 4, 2019
Monitoring of Movement on the Farm Using WiFi TechnologyVojtěch Novák, Michal Stočes, Eva Kánská, Jan Pavlík, Jan Jarolímek
Faculty of Economics and Management, Czech University of Life Sciences in Prague, Czech Republic
AbstractThe paper deals with using commercial WiFi solutions that provide wireless connection to computer networks to monitor the movement of devices within that network. Current technologies, in particular in the IoT area, make it possible to place a battery sensory device on individual objects used on the farm. These sensors, in addition to their primary ability to provide connectivity, can also be used to monitor the movement of the devices they are attached to. Indirectly, it is therefore possible to monitor the movement of objects, people and animals that are associated with this WiFi or Bluetooth device. An example could be the monitoring of the feed wagon's movement on the farm, while obtaining information about the actual amount of cargo. This allows for optimizing logistics operations or track the movement of employees with fitness bracelets. The aim of the paper is to verify the possibilities of currently available commercial wifi systems and their use for monitoring movement on the farm.
KeywordsWi-Fi, Cloud, protocols, networks, position, Meraki, Aruba, Precision Agriculture, Smart Agriculture.
Novák, V., Stočes, M., Kánská, E., Pavlík, J. and Jarolímek, J. (2019) “Monitoring of Movement on the Farm Using WiFi Technology", AGRIS on-line Papers in Economics and Informatics, Vol. 11, No. 4, pp. 85-92. ISSN 1804-1930. DOI 10.7160/aol.2019.110408.
IntroductionFarms are increasingly starting to build a communication infrastructure for wireless Internet access (WiFi). This paper acknowledges that fact and tries to find further possible uses for such networks and determine potential negative implications resulting from building these networks. For example, farmers can ensure better monitoring of the environment by using IoT sensors, offering better tools for employee collaboration, or helping to save lives and property. Mainly thanks to localization and monitoring of movement of specific objects, assuming that the objects in question are tied to a specific WiFi or Bluetooth device.
One of the core technologies for disaster management is the indoor positioning system, which can help rescue more people and prevent property loss due to the accurate and rapid localization of people and assets at the beginning of a disaster (Li et al., 2019; Kola-Bezka et al., 2016).
Internet of Things (IoT) issues are increasingly more important and experience dramatic development in many areas. Such development brings many new technological innovations as well as generates new problems. Vast quantities of IoT devices in use
or still in development need to be categorized based on their usage, type, internet connection, place of implementation etc. One of the important places of usage is agrarian sector and countryside in general. It belongs to one of the more “traditional” areas of IoT implementation, but there is still a lot of room for further development (Stočes et al., 2016).
Underground mine locomotive monitoring and tracking management system expands mining rail net existing capacity, to increase traffic density of mining locomotive, real-time provide the position information, avoid traffic accidents and greatly enhance the transportation safety and production efficiency (Song and Liu, 2011).
Experimental results show that location system has accuracy about of 96% within 2.5 metres. However, this is only when three access point are available for establishing the position; in other cases, the accuracy is reduced. It is possible to combine the triangulation method with probability distributions of received signal strength to improve these results as shown by (Sanchez et al., 2006).
(Vasisht et al., 2016) presents Chronos, a system that measures sub-nanosecond time-of-flight on commercial WiFi radios. Chronos uses these
[86]
Monitoring of Movement on the Farm Using WiFi Technology
measurements to enable WiFi device-to-device positioning at state-of-the-art accuracy, without support of additional WiFi infrastructure or non-WiFi sensors. By doing so, Chronos opens up WiFi-based positioning to new applications where additional infrastructure and sensors may be unavailable or inaccessible, e.g., geo-fencing, home occupancy measurements, finding lost devices, maintaining robotic formations, etc.
Most authors are more concerned with the issue from the perspective of the technological possibilities, and most solutions presented use proprietary systems, for example (Longo et al., 2019; Jermolajeva et al., 2017; Zelazny, 2017). While the aim of this article is to verify the possibilities of currently available commercial systems, or to compare them with each other.
Materials and methodsThe following principles, methods and technologies were used in the research at the Faculty of Economics and Management at Czech University of Life Sciences Prague. We focused on methods of monitoring the movement of logistic elements within the farm using commercial solutions for management of WiFi networks.
1. Signal attenuation (RSSI method)
RSSI was considered as a metric in most of the distance measurement algorithms. Even though the ineffectiveness of RSSI is mentioned in the literature, not many attempts were made to implement it in a practical environment and verify it. (Elnahrawy et al., 2004; Parameswaran et al., 2009) have explored the idea of using RSSI in localization algorithms conducted in indoor environments and determined that more complex models and algorithms are required to improve accuracy of RSSI based methods when used indoors.
The advantage of using the signal attenuation is that no specialized hardware is required as the transmitter module measures the signal strength anyway. Imprecision in the distance estimation can occur though, caused by signal attenuation that is introduced by obstacles or reflections. This raises a major problem for indoor environments, where no simple signal propagation model can be applied unlike in a free space environment. For this reason, in indoor setups the signal attenuation is usually only used as an attribute for the subsequently described fingerprinting technique where the signal strength is measured in advance at different locations of the site (Fuchs et al., 2011).
Algorithms based on matching and signal-to distance functions are unable to capture the myriad of effects on signal propagation in an indoor environment. While many of the algorithms can explore the space of this uncertainty in useful ways, e.g., by returning likely areas and rooms, they cannot provide precise position. Still, the localization accuracy is significant and useful, as showed when mapping the objects into rooms (Elnahrawy et al., 2004).
2. Fingerprinting
A different technique for localization called fingerprinting uses in-advance mapped properties of the environment for position estimation. For example, the received signal strength of a WLAN signal is measured at as many different locations as possible within the target area. This information is saved including its spatial mapping. A sensor that wants to locate itself measures its current signal strength pattern and compares it to the pre-generated signal map. The closest match in the map is then assumed as the actual position.
The disadvantage of this method is the high initial effort that is caused by the mapping of the attributes of the environment. Consequently, this technique is not suited for unknown sites as there is no information available on the property used for the pattern matching. For this reason, fingerprinting does not comply to the requirements for the intended use case in mission-critical scenarios, because it requires a site-specific training and doesn’t provide consistent results when structural changes happen in the environment. Tracking systems that use this technique can therefore be excluded from further consideration for the use in mission critical networking (Fuchs et al., 2011). However, combining fingerprinting methods with RSSI using machine learning AI (artificial intelligence) has the potential to yield good results.
Given our large training sets, it is unlikely that additional sampling will increase accuracy. Adding additional hardware and altering the model are the only alternatives. For example, ray-tracing models that account for walls and other obstacles have been employed. Pursuing the modelling strategy, however, we are left with a trade-off in model complexity vs. accuracy, and such questions are not easily answered. For example, it is unclear if building models at the level of detail where one must model all items impacting signal propagation (walls, large bookshelves, etc.) would be worth the improvements in localization accuracy (Elnahrawy et al., 2004; Schaubach et al., 1992).

[87]
Monitoring of Movement on the Farm Using WiFi Technology
Some of these localization methods are now used in commercially available solutions. With regards to the availability of technologies, two representatives from traditional manufacturers with long-term experience in the field were chosen for the purposes of our research.
3. Cisco Meraki
In the Meraki architecture, there is only one hardware component: the access points. All control, configuration, optimization, and mobility controls are centralized and delivered as service by the Meraki Cloud Controller (MCC) from Meraki’s data centres. By eliminating separate controllers, and moving intelligence into the cloud, hosted wireless LANs reduce deployment time and complexity while enabling multi-site, scalable wireless LANs. In this configuration administrator logs into the controller system through web browser and provide access to wireless network of his account. All management is done remotely through a Web browser. The bottleneck due to centralized approach is avoided in case of Meraki Cloud Controller. Meraki’s cloud-based architecture provides significant advantages over legacy hardware-based solutions. This configuration provides opportunity for cost reduction for WLAN management (Dalvi et al., 2011).
Cisco Meraki Access Points generate a presence signature from any WiFi-enabled device by detecting probe requests and 802.11 data frames from any device that is associated to the network. WiFi devices typically emit a probe request at regular intervals based on the device state. Smartphones send probe requests to discover surrounding wireless networks, so that they can make the networks available to the user. Meraki cloud aggregates raw client location data reported and provides a real-time estimate on the location of WiFi (associated and non-associated) and Bluetooth Low Energy (BLE) devices in real-time. The Scanning API delivers this data to your real-time location application, data warehouse, or business intelligence systems (Cisco Meraki, 2018).
4. Aruba central
Aruba Central is a unified cloud-based network operations, assurance and security platform that simplifies the deployment, management, and optimization of wireless, wired and WAN environments. With continuous monitoring, AI-based analytics provide real-time visibility and insight into what is happening in the WiFi network. The insights utilize machine learning that leverage a growing pool of network data,
and deep domain experience. The result is a consistent, reliable, and timely flow of information about the RF environment, that helps IT work smarter to deliver an optimal WiFi experience, despite increasing demands and the complexity that a growing network often brings. Presence Analytics offers a value added service for Instant AP based networks to get an insight into user presence and loyalty. The Presence Analytics dashboard allows you to view the presence of users at a specific site and the frequency of user visits at a given location or site. Using this data, you can make business decisions to improve customer engagement (HPE-Aruba, 2019).
5. WiFi client
The IoT device associated with a particular logistics element can be any electronics that is using WiFi or Bluetooth technology. Representatives of these technologies were chosen for the experiment: Bluetooth beacon EMBC01 (Subhan et al., 2019) (Figure 1) and the development module ESP-8266 (IEEE Electron Devices Society et al., 2019) (Figure 2).
Source: own processingFigure 1: EMBC01.
Source: own processingFigure 2: ESP-8266.
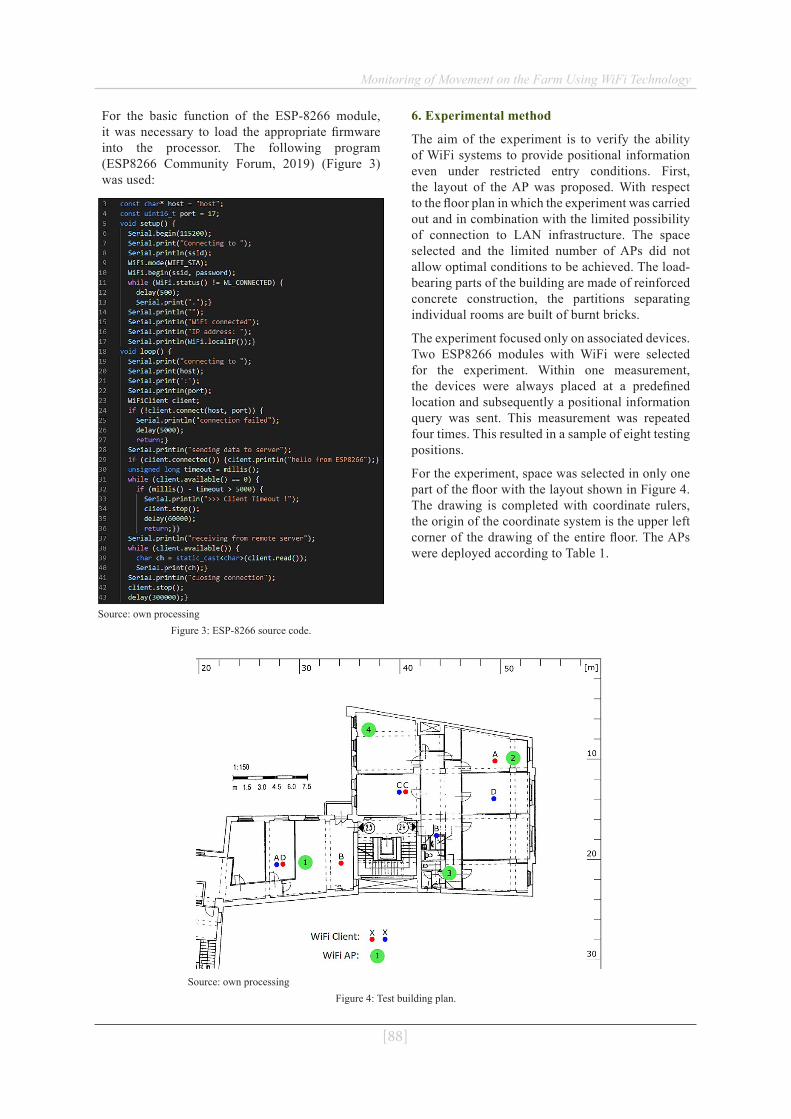
[88]
Monitoring of Movement on the Farm Using WiFi Technology
For the basic function of the ESP-8266 module, it was necessary to load the appropriate firmware into the processor. The following program (ESP8266 Community Forum, 2019) (Figure 3) was used:
Source: own processingFigure 3: ESP-8266 source code.
6. Experimental method
The aim of the experiment is to verify the ability of WiFi systems to provide positional information even under restricted entry conditions. First, the layout of the AP was proposed. With respect to the floor plan in which the experiment was carried out and in combination with the limited possibility of connection to LAN infrastructure. The space selected and the limited number of APs did not allow optimal conditions to be achieved. The load-bearing parts of the building are made of reinforced concrete construction, the partitions separating individual rooms are built of burnt bricks.
The experiment focused only on associated devices. Two ESP8266 modules with WiFi were selected for the experiment. Within one measurement, the devices were always placed at a predefined location and subsequently a positional information query was sent. This measurement was repeated four times. This resulted in a sample of eight testing positions.
For the experiment, space was selected in only one part of the floor with the layout shown in Figure 4. The drawing is completed with coordinate rulers, the origin of the coordinate system is the upper left corner of the drawing of the entire floor. The APs were deployed according to Table 1.
Source: own processingFigure 4: Test building plan.

[89]
Monitoring of Movement on the Farm Using WiFi Technology
Source: own processingTable 1: AP deployment coordinates
AP position
AP1 AP2 AP3 AP4
X [m] 29.92 50.07 44.77 36.20
Y [m] 21.00 10.61 21.64 7.79
Results and discussionBased on the experience gained in the experiment, we provide a comparison of HPE and CISCO systems in terms of quality parameters. Four operating parameters were chosen as criteria for evaluation of WiFi solution, considering (Perez-Castillo et al., 2018):
1. Security
From the security point of view, the solutions are very similar. The factor most significantly affecting security is the technological solution, where the configuration of the AP is carried out through the cloud platform, so any compromise of this platform can endanger the networks themselves. Both external access solutions provide a secure API.
The security of WiFi technology itself and its physical effect in the 2.4GHz band was for example elaborated by (Fernández et al., 2019).
2. Usability
Cisco Meraki is more usable, especially due to the complexity of the offered solution that works better with individual clients' location, providing approximate location information in the form of a geographic coordinate with a sufficient number of APs. The second solution is only able to provide information about presence / absence of an object.
3. Sustainability
The sustainability of both solutions is very good, thanks to the cloud centralized message. In addition, Meraki's solution offers a better graphical representation of the location of each AP in the form of a map. And both the web portal and the API offer more configuration options.
4. Interoperability
The Meraki API is more extensive and provides more information. This makes it easier to connect this system to other systems. Important factor is also the format and complexity of the data itself. Data sources in the farm environment can be divided between the data acquired by the farm from its own internal, private data source and data
obtained externally. External data can be used from public open data databases or purchased (Stočes et al., 2018).
An example of reading data from Aruba Central using the GET API is shown in Figure 5.
Source: own processingFigure 5: Aruba Central API.
The result of this experiment aimed at verifying the possibility of using commercially available APs to monitor the movement of the WiFi client is shown in Table 2. It shows the different locations of the WiFi client (blue and red dots in the plan) versus to which APs were associated.
Device Position A B C D
Blue point Meraki AP Presence info
AP1 AP3 AP4 AP2
Aruba AP Presence info
AP1 AP2 AP2 AP2
Red point Meraki AP Presence info
AP2 AP1 AP2 AP2
Aruba AP Presence info
AP2 AP1 AP2 AP1
Source: own processingTable 2: AP positioning experiment results.
These results show that Meraki AP was able to better determine the location of client devices. Both solutions provided a basic orientation about the movement of objects.
ConclusionEven though the Aruba solution performed generally worse in our comparison, it offers sufficient functionality. The intention to monitor the movement of objects, especially in agricultural enterprises, was sufficiently addressed by both
[90]
Monitoring of Movement on the Farm Using WiFi Technology
investigated solutions. However, we recommend choosing the CISCO Meraki solution. If there is already a WiFi solution installed within the agricultural enterprise, there should be no problem monitoring the movement of WiFi clients on other systems in a similar way as described in this article.
Any commonly used devices that communicate via WiFi, such as mobile phones, computers, sensors, etc., can be used as client devices. In the experiment, the development device ESP8266 (Syed Ali et al., 2016) was used, its added value is that it is possible to create a sensory / control device on this platform. All that at low cost of tens of dollars or so. Other possible devices that can be used are those with Bluetooth technology, especially Bluetooth beacon, which is primarily intended for these purposes. Even with its small size it can operate on batteries for a long time, at a low purchase price of about 5-10 $. For Bluetooth solutions however, it is necessary to have the appropriate infrastructure technology. Based on the research, it can be concluded that the currently available Wifi Systems can be used to monitor movement on the farm.
It is necessary securing the appropriate workforce for the task. If a subject does not employ the proper workers already, it is unfeasible to hire an entire team just for this task alone. Therefore, it is most efficient to hire the employees for a short time from a specialized agency or to outsource the whole project to a company that already has the required employees (Stočes et al., 2018).
It is commonly known that crop yield depends on crop growth variability, which is related to multiple factors that can be time-independent (e.g. substrate, topography, soil type and depth)
or time-dependent. Annually linked factors may include anomalies in planting, emergence, or weather conditions. Seasonally linked factors can include plant diseases, weed development, severe climatic events, or irrigation system malfunctions (Bégué et al., 2008; Kumhálová and Matějková, 2017).
Another possible direction of research is the area of presenting the data obtained to employees of an agricultural enterprise. Alternatively, with the support of artificial intelligence, the data can be used to optimize logistics processes.
Another usage would be in BIM (building information modelling) which promises significantly advancing the architecture, engineering, and construction (AEC) market worldwide, however the low spread and adoption of BIM is still an issue. From a technology diffusion perspective, this paper proposes a game theory-based model including two firms who both are potential BIM adopters under support from the government (Yuan and Yang, 2020).
Application of this research can be, for example, monitoring of storage boxes and pallets, monitoring of machines and tools, employees, breeding animals such as cows, horses, etc.
AcknowledgementsThe results and knowledge included herein have been obtained owing to support from the following institutional grant. Internal grant agency of the Faculty of Economics and Management, Czech University of Life Sciences in Prague, grant no. 20181005 – “Processing of precision agriculture and IoT data in regards to big data in agriculture “.
Corresponding authorsIng. Vojtěch NovákDepartment of Economics, Faculty of Economics and Management Czech University of Life Sciences Prague, Kamycka 129, Prague - Suchdol, 165 00, Czech Republic Phone: +420777714484, E-mail: [email protected]
References[1] Bégué, A., Todoroff, P. and Pater, J. (2008) "Multi-time scale analysis of sugarcane within-field
variability: Improved crop diagnosis using satellite time series?", Precision Agriculture, Vol. 9, No. 3, pp. 161-171. E-ISSN 1573-1618, ISSN 1385-2256. DOI 10.1007/s11119-008-9063-3.
[2] Cisco Meraki (2018) "Location Analytics Introduction" [Online]. Available: https://documentation.meraki.com/MR/Monitoring_and_Reporting/Location_Analytics [Accessed: Nov. 29,. 2019].
[3] Dalvi, A., Swamy, P. and Meshram, B. B. (2011) "Centralized management approach for WLAN", In: Das V.V., Stephen J., Chaba Y. (eds) Computer Networks and Information Technologies. CNC 2011. Communications in Computer and Information Science, vol 142. Springer, Berlin, Heidelberg, pp. 578-580. ISBN 978-3-642-19541-9. DOI 10.1007/978-3-642-19542-6_113.
[91]
Monitoring of Movement on the Farm Using WiFi Technology
[4] Elnahrawy, E., Li, X. and Martin, R. P. (2004) "The limits of localization using signal strength: A comparative study", 2004 First Annual IEEE Communications Society Conference on Sensor and Ad Hoc Communications and Networks, IEEE SECON 2004. IEEE Xplore, Santa Clara, CA, USA. ISBN 0-7803-8796-1. DOI 10.1109/SAHCN.2004.1381942.
[5] ESP8266 Community Forum (2019) "WiFiClient.ino". [Online]. Available: https://github.com/esp8266/Arduino/blob/master/libraries/ESP8266WiFi/examples/WiFiClient/WiFiClient.ino [Accessed: April 4, 2019].
[6] Fernández, M., Guerra, D., Gil, U., Trigo, I., Peña, I. and Arrinda, A. (2019) "Measurements and analysis of temporal and spatial variability of WiFi exposure levels in the 2.4 GHz frequency band", Measurement, Vol. 149, ISSN 0263-2241. DOI 10.1016/j.measurement.2019.106970.
[7] Fuchs, C., Aschenbruck, N., Martini, P. and Wieneke, M. (2011) "Indoor tracking for mission critical scenarios: A survey", Pervasive and Mobile Computing, Vol. 7, Vol. 1, pp. 1-15. ISSN 1574-1192. DOI 10.1016/j.pmcj.2010.07.001.
[8] HPE-Aruba (2019) "ARUBA CENTRAL" [Online]. Available: https://www.arubanetworks.com/ [Accessed: No. 29, 2019].
[9] Jermolajeva, E., Rivža, B., Aleksejeva, L., Šipilova, V., Ostrovska I. (2017) "Smart Growth as a Tool for Regional Convergence: Evidence from Latgale Region of Latvia", Economics and Sociology, Vol. 10, No. 4, 203-224. ISSN 2071-789X. DOI 10.14254/2071-789X.2017/10-4/16.
[10] Kola-Bezka M., Czupich M., Ignasiak-Szulc A. (2016), "Smart cities in Central and Eastern Europe: viable future or unfulfilled dream?", Journal of International Studies, Vol. 9, No. 1, pp. 76-87. E-ISSN 2306-3483, ISSN 2071-8330. DOI 10.14254/2071-8330.2016/9-1/6.
[11] Kumhálová, J. and Matějková, Š. (2017) "Yield variability prediction by remote sensing sensors with different spatial resolution", International Agrophysicsm, Vol. 31, pp. 195-202. E-ISSN 2300-8725, ISSN 0236-8722. DOI 10.1515/intag-2016-0046.
[12] Li, F., Liu, M., Zhang, Y. and Shen, W. (2019) "A two-level WiFi fingerprint-based indoor localization method for dangerous area monitoring", Sensors, Vol. 19, No. 19, pp. 42-43. ISSN 1424-822. DOI 10.3390/s19194243.
[13] Longo, E., Redondi, A. E. C. and Cesana, M. (2019) "Accurate occupancy estimation with WiFi and bluetooth/BLE packet capture", Computer Networks, 163, ISSN 1389-1286. DOI 10.1016/j.comnet.2019.106876.
[14] Parameswaran, A. T., Husain, M. I. and Upadhyaya, S. (2009) "Is RSSI a reliable parameter in sensor localization algorithms - an experimental study", IEEE International Symposium on Reliable Distributed Systems.
[15] Perez-Castillo, R., Carretero, A. G., Rodriguez, M., Caballero, I., Piattini, M., Mate, A., Kim, S. and Lee, D. (2018) "Data quality best practices in IoT environments", In: Proceedings - 2018 International Conference on the Quality of Information and Communications Technology, QUATIC 2018, Institute of Electrical and Electronics Engineers Inc., pp. 272-275.
[16] Sanchez, D., Afonso, S., Macias, E. M. and Suarez, A. (2006) "Devices location in 802.11 infrastructure networks using triangulation", Lecture Notes in Engineering and Computer Science. pp. 938-942. E-ISSN ISSN: 2078-0966
[17] Schaubach, K. R., Davis, N. J., Rappaport, T. S. (1992) "A ray tracing method for predicting path loss and delay spread in microcellular environments", IEEE Vehicular Technology Conference 1992-May, pp. 932-935. DOI 10.1109/VETEC.1992.245274.
[18] Song, J. X., Liu, Y. F. (2011) "Design of underground mine locomotive monitoring and tracking management system", Procedia, Environmental Sciences, Vol. 10, pp. 484-490. ISSN 1878-0296.
[19] Stočes, M., Masner, J., Kánská, E. and Jarolímek, J. (2018) "Big Data in Internet of Things and Precision Agriculture", PROCEEDINGS - of the 27th International Scientific Conference Agrarian Perspectives XXVII. Food Safety – Food Security, Czech University Of Life Sciences Prague, Prague, pp. 353-358. ISBN 978-80-213-2890-7. E-ISSN 2464-4781, ISSN 1213-7960.

[92]
Monitoring of Movement on the Farm Using WiFi Technology
[20] Stočes, M., Šilerová, E., Vanĕk, J., Jarolímek, J.and Šimek, P. (2018) "Možnosti využití otevřených dat v sektoru cukr - Cukrová řepa" (in Czech), Listy cukrovarnické a řeparské, Vol. 134, pp. 117-121. E-ISSN 1805-9708, ISSN 1210-3306.
[21] Stočes, M., Vaněk, J., Masner, J. and Pavlík, J. (2016) "Internet of things (IoT) in agriculture - Selected aspects", Agris On-line Papers in Economics and Informatics, Vol. 8, No. 1, pp. 83-88. ISSN 1804-1930. DOI 10.7160/aol.2016.080108.
[22] Subhan, F., Khan, A., Saleem, S., Ahmed, S., Imran, M., Asghar, Z. and Bangash, J. I. (2019) "Experimental analysis of received signals strength in Bluetooth Low Energy (BLE) and its effect on distance and position estimation. Transactions on Emerging Telecommunications Technologies". Transaction on Energing Telecommunications Technologies. E- ISSN 2161-3915. DOI 10.1002/ett.3793.
[23] Syed Ali, A., Zanzinger, Z., Debose, D. and Stephens, B. (2016) "Open Source Building Science Sensors (OSBSS): A low-cost Arduino-based platform for long-term indoor environmental data collection", Building and Environment, Vol. 100, pp. 114-126, ISSN 0360-1323. DOI 10.1016/j.buildenv.2016.02.010.
[24] Thakare, S. and Bhagat, P. H. (2019) "Arduino-Based Smart Irrigation Using Sensors and ESP8266 WiFi Module", Proceedings of the 2nd International Conference on Intelligent Computing and Control Systems, ICICCS 2018. DOI 10.1109/ICCONS.2018.8663041.
[25] Vasisht, D., Kumar, S. and Katabi, D. (2016) "Decimeter-Level Localization with a Single WiFi Access Point", Nsdi 2016, 13th USENIX Symposium on Networked Systems Design and Implementation, Santa Clara, CA, USA.
[26] Yuan, H. and Yang, Y. (2020) "BIM Adoption under Government Subsidy: Technology Diffusion Perspective", Journal of Construction Engineering and Management, Vol. 146, No. 1. E-ISSN 1943-7862, ISSN 0733-9364. DOI 10.1061/(ASCE)CO.1943-7862.0001733.
[27] Żelazny, R. (2017) "Determinants and measurement of smart growth: evidence from Poland", Journal of International Studies, Vol. 10, No. 1, pp. 34-45. E-ISSN 2306-3483, ISSN 2071-8330. DOI 10.14254/2071-8330.2017/10-1/2
[93]
Agris on-line Papers in Economics and Informatics
Volume XI Number 4, 2019
Investments, Technical Change and Efficiency: Empirical Evidence from Czech Food ProcessingTamara Rudinskaya1, Elena Kuzmenko2
1 Institute of Agricultural Economics and Information, Prague, Czech Republic2 Faculty of Economics and Management, Czech University of Life Sciences in Prague, Czech Republic
AbstractThis empirical study aims to shed light on the dynamic linkages among investments, technical efficiency and productivity of food processing at a sectoral level. We use data obtained from meat and milk processing firms operating in the Czech Republic. The data set covers a period from 2011 to 2015. Being based on a production function frontier framework and the Divisia index our study is focuses on the estimation of technical efficiency and productivity of Czech Food processing firms in connection with the received investments. The results of the conducted analysis have shown that investments, directed to a production process of meat and milk processing firms operating in the Czech Republic, do have a positive effect on their technical efficiency. Moreover, it provides an opportunity to increase the capacity of raw milk processing. Higher TFP in food processing industry may result in higher TFP in agriculture.
KeywordsTechnical efficiency, Technical change, Investments, Czech food processing, Divisia index.
Rudinskaya, T. and Kuzmenko, E. (2019) “Investments, Technical Change and Efficiency: Empirical Evidence from Czech Food Processing", AGRIS on-line Papers in Economics and Informatics, Vol. 11, No. 4, pp. 93-103. ISSN 1804-1930. DOI 10.7160/aol.2019.110409.
IntroductionRecent years a growing interest have been observed in empirical studies aimed at analysing productivity and efficiency of firms that can be increased thanks to investment support. The most frequently used methodology for impact assessment is based on the Data Envelopment Analysis (DEA) and Stochastic Frontier Analysis (SFA). Difficulties with the estimation of effects stemming from investment support on efficiency and productivity of firms in EU Member States were discussed by Bergschmidt et al. (2006), Coelli et al. (2006), Bergschmidt (2009), Forstner et al. (2009), Bernini a Pellegrini (2011) and others. Beck and Dogot (2006) proposed the impact indicators of investment support for assessment possible effects. They found that in the short run there were no connections between investments and firms’ income growth. However, in the long run investments did have a positive effect on both farm’s competitiveness and sustainability. Špicka and Machek (2015) analysed changes in efficiency resulted from investment activity and allocation of subsidies to firms specializing on milk processing in 100 EU regions over the period 2007 to 2011.
They found that investment subsidies per livestock unit are slightly higher in regions with a negative change in the production efficiency. Thus, such investment subsidies continuously helped them to mitigate the decline in their technical efficiency. The impact of Rural Development Program (RDP) subsidies on food industry was analysed by Mezera and Špicka (2013). According to their results, subsidies positively affect not just financial stability, but also increase labour productivity. According to Ferto et al. (2012) subsidized producers can invest in farm development and achieve higher technical progress since they are less credit constrained. Ratinger et al. (2014) analysed factors of Czech farm participation in investment support scheme. They found significant positive effects of investment support on gross value added and improvement of labour productivity.
Most studies analysed investment impact through the analysis of the subsidies effect, which was substituted by investment support policies granted under the EU RDP (Ciaian et al., 2015; Hurňáková et al., 2016). However, the subsidies on investment do not cover all sources of investment. Besides these subsidies themselves, investments

[94]
may be funded by a firm’s own sources. In this paper we assume to analyse the total investment without separation of financing sources.
Note: NACE (Nomenclature des Activités Économiques dans la Communauté Européenne) is a European industry standard classification system similar in function to Standard Industry Classification (SIC) and North American Industry Classification System (NAICS) for classifying business activities.CZ-NACE 10.1- Preserved meat and meat products, CZ-NACE 10.2 – Preserved fish and fish products, CZ-NACE 10.3- Processed and preserved fruit and vegetables, CZ-NACE 10.4- Vegetable and animal oils and fats, CZ-NACE 10.5- Dairy products, CZ-NACE 10.6- Grain mill products, starches and starch products, CZ-NACE 10.7- Bakery and farinaceous products, CZ-NACE 10.8 -Other food products, CZ-NACE 10.9- Prepared animal feedsSource: authors’ processing based on “Panorama of Food Processing Industry” (2017)
Table 1: The share of the groups of NACE in the total sector turnover and total number of employees in 2016.
CZ-NACE group Share in turnover, %
Share in number of employees, %
10.1 23.2 24.4
10.2 0.9 0.9
10.3 3.0 3.5
10.4 4.8 1.0
10.5 14.4 9.6
10.6 4.3 3.2
10.7 13.3 34.4
10.8 20.8 17.7
10.9 15.3 5.4
According to the numbers provided in Table 1, the highest shares in total turnover had the following NACE groups: Preserved meat and meat products, Dairy products, Other food products and Prepared animal feeds. For further analysis the following two groups of NACE were chosen: Preserved meat and meat products and Dairy products (Table 2).
In the last years the chosen sectors obtained a substantial financial investment support (from EU). The amount of investments to NACE 10.1 had been growing during the considered period, i.e. from 2011 to 2016. The investments to NACE 10.5 were increasing until 2014, however,
later it was declining. This fact has appeared interesting for us, which eventually motivated us to analyse the impact of investments on technical efficiency of food processing companies.
Food processing efficiency and total-factor productivity (TFP) growth in Czech food processing industry was investigated, for instance by Čechura and Hockmann (2017), Čechura and Malá (2014). These authors concluded that the most important and distinguish characteristic of Czech food processing is heterogeneity among firms as well as among sectors. Moreover, the differences in intra-sectoral heterogeneity suggest that the food processing industry will be the subject of accelerated structural change in the future. Another research that was conducted by Rudinskaya and Náglová (2018) was aimed at the analysis of the effects produced by subsidies of the EU Rural Development Programme (RDP) on meat processing firms. The results indicate a positive impact of subsidies on technical efficiency of meat processing firms, which, however, decreases over time.
Considering the lack of empirical studies focusing on the impact of subsidies on technical efficiency namely in the Czech Republic, the main objective of this paper is to assess the effect of investments on productivity and technical efficiency of Czech food processing companies, specifically, that focus on Preserved meat and meat products along with Dairy products.
Materials and methodsStochastic Frontier Analysis (SFA)
Following Farrell (1957) many different methods have been considered for the estimation of efficiency. The two widely used approaches are the Data Envelopment Analysis (DEA), which is nonparametric and deterministic, and the Stochastic Frontier Analysis (SFA), which is, on the contrary, parametric and stochastic. The great advantage of SFA is the possibility
Investments, Technical Change and Efficiency: Empirical Evidence from Czech Food Processing
Note: CZ-NACE 10.1- Preserved meat and meat products, CZ-NACE 10.2 – Preserved fish and fish products, CZ-NACE 10.3- Processed and preserved fruit and vegetables, CZ-NACE 10.4- Vegetable and animal oils and fats, CZ-NACE 10.5- Dairy products, CZ-NACE 10.6- Grain mill products, starches and starch products, CZ-NACE 10.7- Bakery and farinaceous products, CZ-NACE 10.8 -Other food products, CZ-NACE 10.9- Prepared animal feedsSource: authors’ processing based on “Panorama of the food industry” (2017).
Table 2: Total investments in food processing industry in the Czech Republic in CZK.
Sector 2011 2012 2013 2014 2015 2016
Preserved meat and meat products 1 997 863 1 508 190 2 462 674 1 654 850 2 405 313 2 412 208
Dairy products 1 051 070 1 058 409 1 341 208 1 632 203 1 554 808 1 393 530

[95]
Investments, Technical Change and Efficiency: Empirical Evidence from Czech Food Processing
that it offers of decomposing productivity change into parts that have straightforward economic interpretation. The focus of SFA is to obtain an estimator for one of the components of TFP, the degree of technical efficiency (Pires and Garcia, 2012).
To study the determinants of technical efficiency we used the SFA methodology developed by Aigner et al. (1977). The SFA method is based on an econometric (i.e. parametric) specification of a production frontier. Using a generalized production function and panel data this method can be formalized by the following general mathematical notation:
(1)
where y represents output, x is a vector of inputs, β is a vector of unknown parameters, and ε is the error term. The subscripts i and j denote the firm and inputs, respectively, t stands for time.
In this specific formulation, the error term is farm specific and is composed of two independent components, εit = vit - uit. The first element, vit is a random variable reflecting noise and other stochastic shocks entering into the definition of the frontier, such as shocks manifested in various unpredictable circumstances, such as employees’ strikes, deteriorations of weather conditions, natural disasters etc. This term is assumed to be an independent and identically distributed normal random variable with zero mean and constant variance iid [N~(0,σv
2 )].
The second component, uit, captures technical inefficiency relative to the stochastic frontier. The inefficiency term uit is nonnegative and it is assumed to follow a half-normal, truncated-normal, gamma or exponential distribution (Kumbhakar and Lovell, 2000).
An index for technical efficiency (TE) can be defined as the ratio of the observed output (y) and maximum feasible output (y*):
(2)
Because y ≤ y*, the TE index is bounded between 0 and 1; TE achieves its upper bound when a firm is producing the maximum output feasible level (i.e., y = y*), given the input quantities. Jondrow et al. (1982) demonstrated that firm-level TE can be calculated from the error term εi as the expected value of −ui conditional on εi, which is given by
(3)
where ϕ(∙) represent the standard normal density and Φ(∙) the standard normal cumulative density functions; and for halfnormal distribution of inefficiency term;
and for truncated-
normal distribution of inefficiency term.
Thus, the TE measure for each farm is equal toTEi = exp(-E[ui|εi]) (4)
SFA and heterogeneity
It is possible to take heterogeneity factors into account by including these effects (management level, access to investments etc.) in the mean and/or variance of the distribution of inefficiency (observed heterogeneity) or by randomizing of the parameters of the stochastic frontier model (unobserved heterogeneity).
Unobserved heterogeneity
During the past two decades various forms of econometric methods were developed that enable, especially using panel data, identify the unobserved heterogeneity. Unobserved heterogeneity can be taken into account by randomising some parameters of a model; in this case it is assumed that such a randomisation captures all time invariant unobserved heterogeneity. For example, the listed below models are models that able to introduce unobserved heterogeneity: True Fixed and Random Effects Model (Greene, 2005), Random Parameters Model (Greene, 2005) and Fixed-Management Model (Alvarez et al., 2006).
Observed heterogeneity
Observed heterogeneity can be introduced into a model specification by several methods. A common approach deals with incorporating a vector of variables zi that contains the information about heterogeneity directly into a model. In this case zi appears to be a goal function itself.
yi = β' xi + α' zi + vi - ui (5)
Two other methods of examining the heterogeneity factors impact to technical inefficiency is the capturing heterogeneity factors by the variance parameter and the mean of the technical inefficiency term.

[96]
Investments, Technical Change and Efficiency: Empirical Evidence from Czech Food Processing
The model for empirical study is based on Battese and Coelli (1995). It is supposed that the inefficiency terms u_it are non-negative random variables capturing firm-specific and time-specific deviations from the frontier, associated with technical inefficiency. In equation (5) u_it is specified as:
uit = zitδ + wit (6)
where zit is a vector of firm-specific time-variant variables (exogenous factors or variables explaining inefficiency) exogenous to the production process, and δ is an unknown vector of J parameters to be estimated. The error term wit~N(0,σw
2 ) is truncated by the variable truncation point -zitδ.
Battese and Coelli model (1995) allows for estimation of impact of different factors on technical inefficiency. Therefore, technical efficiency corresponding to the production frontier and inefficiency effects is defined as:
TEit = exp(-uit) = exp{-zitδ - wit} (7)
According to Färe (1975), for estimation a production function in the translogarithmic (transcendental logarithmic) form we used three production factors and a time variable. This translogarithmic production function can be written as follows:
ln(Yit) = ln(A) + αKln(Kit) + αLln(Lit) + αMln(Mit) + + αT T + 0.5βKKln(Kit)ln(Kit) + + 0.5βLLln(Lit)ln(Lit) + 0.5βMMln(Mit)ln(Mit) + + 0.5αTTTT + BKLln(Kit)ln(Lit) + + βKMln(Kit)ln(Mit) + βLM ln(Lit)ln(Mit) + + αKTln(Kit)T + αLT ln(Lit)T + αMTln(Mit)T + vit - uit (8)
where A is total factor productivity, L is a labour variable, K is a capital variable, M is a material variable, Y is an output variable, T is a time trend variable representing technical change.
The difference in technical efficiency among firms can be explained by different factors. These factors are exogenous variables that are neither inputs to the production process nor outputs of the firm. Nonetheless, these factors can influence farm’s performance. In this research it is assumed that exogenous variables impact technical efficiency and hence these factors are modelled in the inefficiency term. Empirical model for the research is based on Battese and Coelli (1995) model.
Specification developed by Battese and Coelli (1995) incorporates vector of explanatory variables zit
', which influences technical efficiency of a firm i at time t:
uit = zit' δ + wit (9)
where δ is a vector of unknown parameters, wit is a random term defined by truncated-normal distribution, zit
' - is a transposed vector of data upon amortization.
The latter variable is used in the present analysis as a proxy of investments to a production process. It is done the following way: having collected data upon amortization per each firm, we considered an increase in this time series (between two neighbouring observations) as a presence of investment. On the contrary, if the difference between the two neighbouring observations is negative, it is considered as its absence. In the further analysis instead of zit
' variable we used a dummy variable (1 stands for investment; 0 – no investment).
TFP decomposition
The ways of measuring the growth in total factor productivity (TFP) along with its decomposition have been a matter of concern for a number of researchers in various empirical studies on industrial productivity (Jorgenson, 1995, Kumbhakar and Knox Lovell, 2000). The main contribution of Pires and Garcia paper (2012) consisted in showing that a suitable decomposition of TFP can be applied to a fairly large sample for an extensive period of time in order to evaluate not just the role of technical progress and technical efficiency change, but also scale and allocative efficiency change as determinants of long-term growth. “The Divisia index has been widely used as a convenient measure of TFP growth over time and space” (Kumbhakar and Knox Lovell, 2000). Productivity change, when there are multiple inputs, is measured by, what is popularly known as, TFP change and is defined as:
(10)
where sja = wjxj/C
a and Ca = ∑jwjxj, with wj being the price of input xj.
Having differentiated (equation (1)) totally and using the definition of TFP change in equation (10), we obtain:
(11)
where ,
[97]
Investments, Technical Change and Efficiency: Empirical Evidence from Czech Food Processing
is the measure of returns to scale and εj are input elasticities defined at the production frontier, f(x, t). At the same time λj = {fjxj/∑kfkxk} = εj/RTS when fj is the marginal product of input xj.
The ratio in (11), thus, decomposes TFP change into several components:
- scale component (RTS-1)
- technical change (TC) =
- technical efficiency change (TEC)
- allocative component ∑j{λj - sja , which capture
either deviations of input prices from the value of their marginal rate of technical substitution from the ration of input prices (fj/fk ≠ wj/wk).
Having done the decomposition, we thus can study the impact of each of the components of TFP.
In the expressions that follow, εK and εL are output elasticities, RTS denotes returns to scale with RTS = εK + εL, sK and sK are the shares of capital and material in aggregate income, gK is the growth rate of capital and gL is the growth rate of labor ; λK = εK/RTS and λL = εL/RTS are defined as normalized shares of capital and labor in income. TFP change then can be estimated as follows (Kumbhakar and Knox Lovell (2000)):
gTFP = TP - + (RTS - 1)∙[λK∙gK + λL∙gL] + [(λK - sK)∙gK + (λL - sL )∙gL] (12)
That is, total factor productivity growth can be split into four elements:
- technical progress, measured by TP = ∂ ln f (t, K, L)/∂t;
- change in technical efficiency, denoted by - ; - change in the scale of production, given by
(RTS - 1)∙[λK∙gK + λL∙gL ] - change in allocative efficiency, measured by
[(λK - sK )∙gK + (λL - sL )∙gL ].
Data set
The panel data set was collected from the Albertina database. For the analysis we used the information from the final accounts of companies, the main activity of which is food processing. Study covers the period from 2011 till 2015. The whole database represents 9 branches of food processing industries. For the present analysis two of them (meat and milk) were chosen. After excluding the companies with numerous missing observations, the unbalanced panel data set contains 2 854 observations received from 607 food
processing Czech companies.
The following variables were used in the analysis: Output, Labour, Capital and Material. Output is represented by the total sales of goods, products and services of the food processing company. In order to avoid price changes, Output was deflated by the price index of food processing companies according to the branch (2015 = 100). The Labour input is used in the form of total personnel costs per company, divided by the average annual wage. The data on annual wages were taken from the Czech Statistical Office. The Capital variable is represented by the value of tangible assets. Material variable is represented by total costs of material and energy consumption per company. Capital and Material variables were deflated by the price index of industrial sector (2015=100). Output, Capital, Material variables are measured in thousand CZK. Since Labour variable is a coefficient (above-mentioned Labour variable definition), there is no necessity to deflate the variable to eliminate price changes.
According to the purpose of the study, an Investment variable was chosen for the analysis of investments value on technical efficiency. The variable is represented by the following way: having collected data upon amortization per each firm, we considered an increase in this time series (between two neighbouring observations) as a presence of investment (dummy “1”). On the contrary, if the difference between the two neighbouring observations is negative, it is considered as its absence (dummy “0”).
Results and discussionTechnical efficiency estimation
Table 3 and Table 4 provide an estimate of parameters of the production function for meat and milk processing firms correspondingly. The first-order estimated parameters are significant at 1% level of significance under z-test (see Table 3). The assumption of monotonicity and quasi-concavity is fulfilled for all production factors except for the Labour variable. Since the values of production factors were normalised by their arithmetic means after logarithmic transformation, in translogarithmic model these coefficients denote the variation or possible percentage change in aggregate output as a result of one per cent change in the input, that is, production elasticities.
All production elasticities are positive (βK,βL,βM > 0); the highest elasticity displays production factor

[98]
Investments, Technical Change and Efficiency: Empirical Evidence from Czech Food Processing
Material (0.7699). The production factor Capital, in opposite, has low impact on firms’ output (0.0591). Curvature assumption (quasi-concavity in inputs) is fulfilled in the case of all production factors, except Labour. The parameter λ is
the relation between the variance of uit and vit. Thus, the parameter indicates the significance of technical inefficiency in the residual variation. A value larger than one suggests that variation in uit prevails the variation in the random component vit. Technical
Source: authors’ elaboration in STATATable 3: The estimation of production function parameters for meat processing firms (preserved meat and meat products).
Parameters Coef. Std. Err. z P>z
First-order parameters
βK 0.0591 0.0181 3.26 0.001
βL 0.1761 0.0481 9.72 0.000
βM 0.7699 0.0132 58.40 0.000
βT -0.0532 0.0119 -4.46 0.000
Constant 0.0058 0.0152 0.38 0.704
Second-order parameters
βKK 0.0334 0.0190 1.76 0.079
βLL 0.1730 0.0426 4.06 0.000
βMM 0.1472 0.0122 12.10 0.000
βTT 0.0863 0.0147 5.87 0.000
βLK -0.0293 0.0219 -1.34 0.180
βKM 0.0094 0.0072 1.30 0.193
βLM -0.1577 0.0218 -7.22 0.000
βKT 0.0025 0.0112 0.22 0.824
βLT 0.0258 0.0127 2.03 0.042
βMT -0.0331 0.0092 -3.61 0.000
Parameters of variance (mean) in uit
Investment -91.6040 33.452 -2.74 0.006
Constant -92.8100 31.859 -2.91 0.004
lambda 70.1560 0.6790 103.31 0.000
Source: authors’ elaboration in STATATable 4: The estimation of production function parameters for milk processing firms (Dairy product).
Parameters Coef. Std. Err. z P>z
First-order parameters
βK 0.0284 0.0098 2.88 0.004
βL 0.1879 0.0173 10.87 0.000
βM 0.7577 0.0129 58.56 0.000
βT 0.0049 0.0144 0.34 0.735
Constant 0.2122 0.0205 10.34 0.000
Second-order parameters
βKK 0.0273 0.0070 3.88 0.000
βLL 0.1763 0.0177 9.94 0.000
βMM 0.1752 0.0108 16.29 0.000
βTT -0.0003 0.0196 -0.01 0.989
βLK -0.0373 0.0112 -3.11 0.002
βKM -0.0151 0.0075 -2.02 0.043
βLM -0.1229 0.0067 -18.23 0.000
βKT 0.0078 0.0073 1.07 0.287
βLT -0.0240 0.0130 -1.84 0.066
βMT 0.0127 0.0095 1.34 0.181
Parameters of variance (mean) in uit
Investment -65.262 19.7500 -3.30 0.001
Constant -93.970 25.2500 -3.72 0.000
lambda 26.19462 0.570143 45.94 0.000
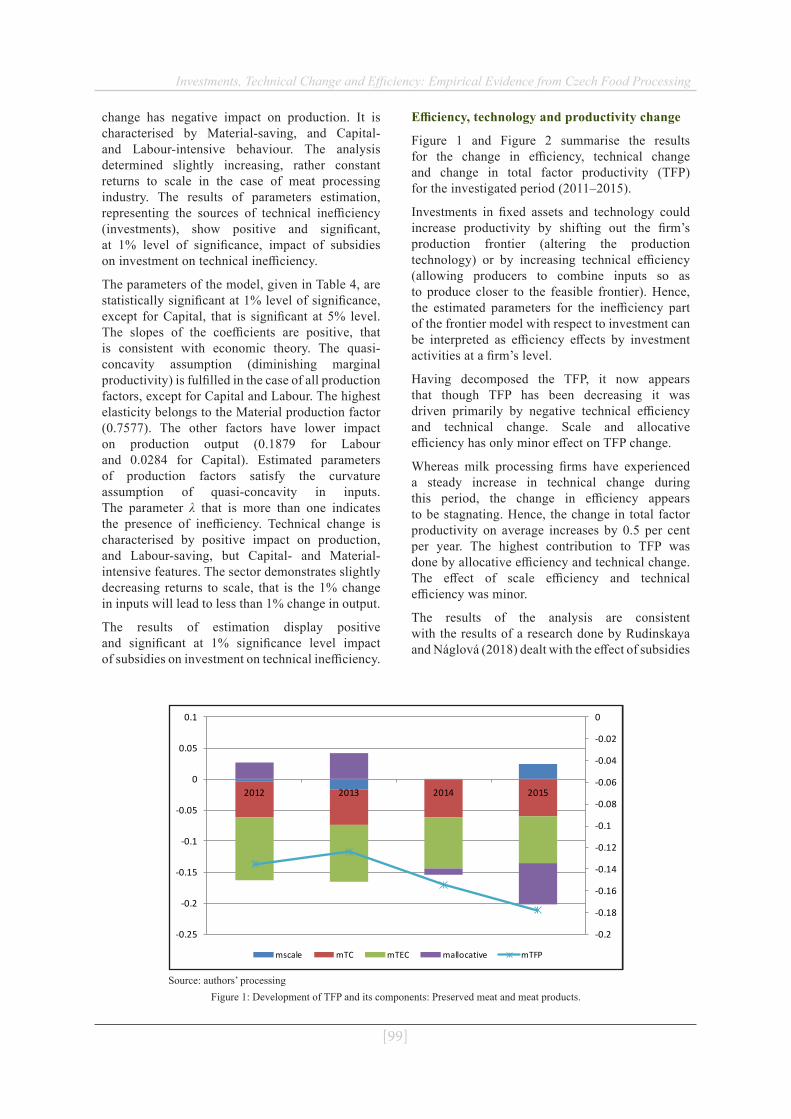
[99]
Investments, Technical Change and Efficiency: Empirical Evidence from Czech Food Processing
change has negative impact on production. It is characterised by Material-saving, and Capital- and Labour-intensive behaviour. The analysis determined slightly increasing, rather constant returns to scale in the case of meat processing industry. The results of parameters estimation, representing the sources of technical inefficiency (investments), show positive and significant, at 1% level of significance, impact of subsidies on investment on technical inefficiency.
The parameters of the model, given in Table 4, are statistically significant at 1% level of significance, except for Capital, that is significant at 5% level. The slopes of the coefficients are positive, that is consistent with economic theory. The quasi-concavity assumption (diminishing marginal productivity) is fulfilled in the case of all production factors, except for Capital and Labour. The highest elasticity belongs to the Material production factor (0.7577). The other factors have lower impact on production output (0.1879 for Labour and 0.0284 for Capital). Estimated parameters of production factors satisfy the curvature assumption of quasi-concavity in inputs. The parameter λ that is more than one indicates the presence of inefficiency. Technical change is characterised by positive impact on production, and Labour-saving, but Capital- and Material-intensive features. The sector demonstrates slightly decreasing returns to scale, that is the 1% change in inputs will lead to less than 1% change in output.
The results of estimation display positive and significant at 1% significance level impact of subsidies on investment on technical inefficiency.
Efficiency, technology and productivity change
Figure 1 and Figure 2 summarise the results for the change in efficiency, technical change and change in total factor productivity (TFP) for the investigated period (2011–2015).
Investments in fixed assets and technology could increase productivity by shifting out the firm’s production frontier (altering the production technology) or by increasing technical efficiency (allowing producers to combine inputs so as to produce closer to the feasible frontier). Hence, the estimated parameters for the inefficiency part of the frontier model with respect to investment can be interpreted as efficiency effects by investment activities at a firm’s level.
Having decomposed the TFP, it now appears that though TFP has been decreasing it was driven primarily by negative technical efficiency and technical change. Scale and allocative efficiency has only minor effect on TFP change.
Whereas milk processing firms have experienced a steady increase in technical change during this period, the change in efficiency appears to be stagnating. Hence, the change in total factor productivity on average increases by 0.5 per cent per year. The highest contribution to TFP was done by allocative efficiency and technical change. The effect of scale efficiency and technical efficiency was minor.
The results of the analysis are consistent with the results of a research done by Rudinskaya and Náglová (2018) dealt with the effect of subsidies
Source: authors’ processingFigure 1: Development of TFP and its components: Preserved meat and meat products.
-0.2
-0.18
-0.16
-0.14
-0.12
-0.1
-0.08
-0.06
-0.04
-0.02
0
-0.25
-0.2
-0.15
-0.1
-0.05
0
0.05
0.1
2012 2013 2014 2015
mscale mTC mTEC mallocative mTFP

[100]
Investments, Technical Change and Efficiency: Empirical Evidence from Czech Food Processing
from EU Rural Development Programme (RDP). The results indicate positive impact of subsidies on meat processors’ technical efficiency, which, though, decreases over time.
In general, we can say, that subsidies have a positive impact on technical efficiency. Nevertheless, the development of TFP in meat processing industry is decreasing with negative impact of technical efficiency. Apparently, meat processors did not use inputs effectively. The explanation of the reasons is discussible. Firms could increase their inputs through the higher cost due to investments, but their outputs remain the same. Submitted project and the implementation of investment did not reach adequate outputs. This was also found by Bergström (1998) and Rudinskaya and Naglova (2018). Subsidies can make firms less productive, because they give firms an inducement to change the mix of capital and labour and it can lead to inefficiencies. The subsidised firms might be over-invested in capital. According to Bergström (1998), subsidisation is positively correlated with growth of value added, and productivity of the subsidised firms seems to increase in the first year. However, after first year, the more subsidies a farm receives, the less productivity growths development was observed.
ConclusionThe present analysis makes use of a panel dataset to investigate empirically the impact of investments on productivity and efficiency of food processing firms in the Czech Republic. The two NACE groups with the highest share in total food processing
sector revenue were chosen for the present analysis, namely, preserved meat and meat products and dairy products.
The empirical analysis was based on the estimation of production function using stochastic frontier approach. Thereafter using TFP decomposition based on Divisia index the change in efficiency, technical change and change in total factor productivity was calculated for the investigated period from 2011 till 2015. The empirical results made evident that investments in fixed assets increase technical efficiency of meat and milk processing companies.
In the case of meat processing companies TFP has been decreasing, driven primarily by negative technical efficiency and technical change. Scale and allocative efficiency has only minor effect on TFP change.
Milk processing firms have experienced an increase in technical change within the considered period, their technical efficiency was stagnating. Hence, the change in total factor productivity on average increased by 0.5 per cent per year. The allocative efficiency and technical change have contributed to TFP most of all. The effect of scale efficiency and technical efficiency was minor.
A number of studies of studies done by Špička and Machek (2015), Mezera and Špička (2013), Rudinskaya and Naglova (2018) evidenced that subsidies supporting investment and innovation activities have positive effect to overall competitiveness of subsidised companies in food processing sector.
Source: authors’ processingFigure 2: Development of TFP and its components: Dairy products.
-0.06
-0.04
-0.02
0
0.02
0.04
0.06
0.08
0.1
0.12
0.14
-0.08
-0.06
-0.04
-0.02
0
0.02
0.04
0.06
0.08
0.1
0.12
0.14
2012 2013 2014 2015
mscale mTC mTEC mallocative mTFP

[101]
Investments, Technical Change and Efficiency: Empirical Evidence from Czech Food Processing
Investments, that induce the modernization of food industry production, positively contribute to the growth of technical efficiency. According to recent surveys (see Boudný and Janotová, 2015), higher labour productivity in Western EU countries is due to a higher level of organization, modernization and automation, which is associated with a relatively high investment intensity. In the Czech Republic, labour productivity is relatively low compared to other Member States. In this context, subsidies to modernization of food industry production are an important source of growth in technical efficiency. Moreover, it provides the opportunity to increase the processed capacity of raw milk. This implies that increased
TFP in food processing may trigger positive change in agricultural TFP.
This finding is an important message for policy makers with respect to the setting of CAP subsidies for the next programming period. However, more attention must be paid to effectiveness of investment facilities utilization.
AcknowledgementsThe paper is a part of the solution of project QK1920398 supported by the Ministry of Agriculture of the Czech Republic – NAZV - program ZEMĚ.
Corresponding authorsMgr. Elena Kuzmenko, Ph.D. Department of Economics, Faculty of Economics and ManagementCzech University of Life Sciences in Prague Kamýcká 129, 165 00 Prague - Suchdol, Czech RepublicE-mail: [email protected]
References[1] Aigner, D., Lovell, C. K. and Schmidt, P. (1977) "Formulation and estimation of stochastic frontier
production function models“, Journal of Econometrics, Vol. 6, No. 1, pp. 21-37. ISSN 0304-4076. DOI 10.1016/0304-4076(77)90052-5.
[2] Alvarez A., Arias C. and Greene W. (2003) "Fixed Management and time invariant technical efficiency in a random coefficient model“, Working Paper, Department of Economics, Stern School of Business, New York University
[3] Battese, G. E. and Coelli, T. J. (1995) "A model for technical inefficiency effects in a stochastic frontier production function for panel data“, Empirical Economics, Vol. 20, No. 2, pp. 325-332. E-ISSN 1435-8921, ISSN 0377-7332. DOI 10.1007/BF01205442.
[4] Beck, M. and Dogot, T. (2006) "The Use of Impact Indicators for the Evaluation of Farm Investment Support – A Case Study Based on the Rural Development Programme for Wallonia 2000 – 2006“, Working Papers in Agricultural Economics, No. 3, pp. 69-77.
[5] Bergschmidt, A. Dirksmeyer, W., Efken J, Forstner, B. and Uetrecht, I. (2006) "Proceedings of the European Workshop on the Evaluation of Farm Investment Support, Investment Support for Improvement of Processing and Marketing of Agricultural Products", Braunschweig: FAL, 266 p, Working Paper Agric Econ 2006/03
[6] Bergschmidt, A. (2009) “Powerless Evaluation”, EuroChoices, No. 8, pp. 37–42. ISSN 1746-692X. DOI 10.1111/j.1746-692X.2009.00137.x.
[7] Bergström, F. (1998) “Capital subsidies and the performance of firm”, SSE/EFI Working Paper Series in Economics and Finance, No. 258.
[8] Bernini, C. and Pellegrini, G. (2011) “How are growth and productivity in private firms affected by public subsidy? Evidence from a regional policy”, Regional Science and Urban Economics, Vol. 41, No 3, pp. 253-265. ISSN: 0166-0462. DOI 10.1016/j.regsciurbeco.2011.01.005.
[9] Boudný, J. and Janotová, B. (2015) “Ekonomika výroby vepřového masa – postavení ČR v Evropě” (In Czech), Náš chov, Vol. 75, pp. 73-78. ISSN 0027-8068.
[10] Ciaian, P., Kancs, d'A., Michalek, J. (2015) “Investment Crowding-Out: Firm-Level Evidence from Germany (July 2015)”, LICOS Discussion Paper 370/2015. DOI 10.2139/ssrn.2634922.
[102]
Investments, Technical Change and Efficiency: Empirical Evidence from Czech Food Processing
[11] Coelli, T., Perelman, S. and Van Lierde, D. (2006) “CAP Reforms and Total Factor Productivity Growth in Belgian Agriculture: A Malmquist Index Approach”, International Association of Agricultural Economists (IAAE), Annual Meeting, Queensland, Australia.
[12] Čechura L. and Hockmann H. (2017) “Heterogeneity in Production Structures and Efficiency: An Analysis of the Czech Food Processing Industry”, Pacific Economic Review, Vol. 22, No. 4, pp. 702-719. ISSN 1468-0106. DOI 10.1111/1468-0106.12217.
[13] Čechura, L. and Malá, Z. (2014) “Technology and Efficiency Comparison of Czech and Slovak Processing Companies”, Procedia Economics and Finance, Vol. 12, pp. 93-102, ISSN 2212-5671. DOI 10.1016/S2212-5671(14)00324-4.
[14] Färe, R. (1975) "Efficiency and the production function“, Journal of Economics, Vol. 35, No. 3, pp. 317-324. E-ISSN 1617-7134, ISSN 0931-8658. DOI 10.1007/BF01284619.
[15] Farrell, M. J. (1957) "The measurement of productive efficiency“, Journal of the Royal Statistical Society. Series A (General), Vol. 120, No. 3, pp. 253-290. DOI 10.2307/2343100.
[16] Ferto, I., Bakucz, Z., Bojnec, S. and Latruffe, L. (2012) "Investment and Financial Constraints in European Agriculture: Evidence from France, Hungary and Slovenia“, IEHAS Discussion Papers 1213. [Online]. Available: https://ideas.repec.org/p/ags/eaae11/114357.html [Accessed: 15 August, 2019].
[17] Forstner, B., Bergschmidt, A., Dirksmeyer, W., Ebers, H., Fitschen-Lischewski A., Margarian, A. and Heuer, J. (2009) "Ex-post evaluation of the German farm-investment support programme from 2000–2006“, Länderübergreifender Bericht 98, Thünen Institut, Braunschweig
[18] Greene, W. (2005) "Reconsidering heterogeneity in panel data estimators of the stochastic frontier mode“, Journal of Econometrics, Vol. 126, No. 2, pp. 269-303. ISSN 0304-4076. DOI 10.1016/j.jeconom.2004.05.003.
[19] Hurňáková, J., Bartová, L. and Fandel, P. (2016) “Efficiency and productivity of the Slovak agricultural investment support beneficiaries”, International Scientific Days 2016, The Agri-Food Value Chain: Challenges for Natural Resources Management and Society, June, 2016, pp. 923-930. ISBN 978-80-552-1503-7. DOI 10.15414/isd2016.s12.03.
[20] Jondrow, J., Lovell, C. K., Materov, I. S. and Schmidt, P. (1982) "On the estimation of technical inefficiency in the stochastic frontier production function model“, Journal of Econometrics, Vol. 19, No, 2-3, pp. 233-238. ISSN 0304-4076. DOI 10.1016/0304-4076(82)90004-5.
[21] Jorgenson, D. (1995) “Productivity: Postwar U.S. Economic Growth“. Cambridge: MIT Press. ISBN 9780262512893.
[22] Kumbhakar, S. C. and Knox Lovell, C.A. (2000) "Stochastic Frontier Analysis", Cambridge University Press, Cambridge. ISBN 978-0521666633. DOI 10.1017/CBO9781139174411.
[23] Mezera, J. and Špička, J. (2013) “Economic Effects of Investment Support of Adding Value to Food”, Agris on-line Papers in Economics and Informatics, Vol. 5, No.1, pp. 39-49. ISSN 1804-1930. DOI 10.22004/ag.econ.148102.
[24] Ministry of Industry and Trade Czech Republic (2017) "Panorama of the food industry". [Online]. Available: https://www.mpo.cz/assets/en/industry/manufacturing-industry/panorama-of-the-manufacturing-industry/2018/9/Panorama-2017-en.pdf [Accessed: 10 Julz, 2019].
[25] Pires, J. O. and Garcia, F. (2012) "Productivity of nations: a stochastic frontier approach to TFP decomposition", Economics Research International, Vol. 2012, 19 p. DOI 10.1155/2012/584869.
[26] Ratinger, T., Medonos, T. and Hruska, M. (2014) "The Assessment of the effects of the investment support scheme in the Czech Republic“, Poster paper prepared for presentation at the EAAE 2014 Congress Agri-Food and Rural Innovations for Healthier Societies.
[103]
Investments, Technical Change and Efficiency: Empirical Evidence from Czech Food Processing
[27] Rudinskaya, T. and Náglová, Z. (2018) “Impact of Subsidies on Technical Efficiency of Meat Processing Companies”, AGRIS on-line Papers in Economics and Informatics, Vol. 10, No. 1, pp. 61-70. ISSN 1804-1930. DOI 10.7160/aol.2018.100106.
[28] Špička, J. and Machek, O. (2015) “Change in the production efficiency of European specialized milk farming”, Agricultural Economics, Vol. 61, No 1, pp. 1-13. E-ISSN 1805-9295, ISSN 0139-570X. DOI 10.17221/112/2014-AGRICECON.

Agris on-line Papers in Economics and Informatics
[104]
[105]
Sabou, J. P., Cihelka, P., Ulman, M. and Klimešová, D. (2019) “Measuring the Similarities of Twitter Hashtags for Agriculture in the Czech Language ", AGRIS on-line Papers in Economics and Informatics, Vol. 11, No. 4, pp. 105-112. ISSN 1804-1930. DOI 10.7160/aol.2019.110410.
Agris on-line Papers in Economics and Informatics
Volume XI Number 4, 2019
Measuring the Similarities of Twitter Hashtags for Agriculture in the Czech Language John Phillip Sabou1, Petr Cihelka1, Miloš Ulman1, Dana Klimešová2
1 Department of Information Technology, Faculty of Economics and Management, Czech University of Life Sciences, Prague, Czech Republic
2 Department of Information Engineering, Faculty of Economics and Management, Czech University of Life Sciences in Prague, Czech Republic
AbstractOur paper presents first analysis of Czech Twitter content within the agriculture context. We deployed textual analysis of more than 240,000 tweets over 2014-2019 hashtags that were, according to Google Trends, most trending and related to Czech agriculture such as #dotace, #repka, or #bionafta – both in Czech and English language. Besides descriptive statistics of the tweet dataset, we visualized keyword correlations which revealed strong focus of the discourse on rapeseed, biofuel and the prime minister Andrej Babiš. Owing to inherent political context of the given hashtags, we found spikes in topics which followed the public attention to the topics in mass media. We also found several accounts that produces high traffic for certain hashtags in Czech, yet those accounts were located abroad. Consistent with other studies, a high proportion of tweets was generated by unverified accounts that might be bots – automated accounts. We propose to conduct semantic analysis of a broader dataset over the main social media platforms in the Czech Republic.
KeywordsAgriculture, Twitter, Czech language, word occurrence, descriptive statistics.
IntroductionThis paper explores the semantic similarity of Czech Twitter messages by using Descriptive Statistics to calculate the number of times a hashtag is repeated in a Twitter corpus in the Czech language. These are classically reduced to their frequency of co-occurrence in language: the more frequently two words appears together, the higher is their similarity. The goal of this paper is to discern which topics in the Czech language seem to be artificially diffused via Twitter. We will do this by computing the similarity and co-occurrence data in a large corpus using descriptive statistical analysis.
Online news is a well-researched field, with many good reasons why artificial intelligence (AI) techniques have the potential to improve the way we consume news online (Orhan, 2017; Mazurek et al., 2019). At the same time, news is a biased form of media that is increasingly driven by content that can sell advertising. Some
stories that may be of interest often get buried, while other content may receive greater exposure in seemingly artificial ways. For example, Google News is a topically segregated mashup of feeds, with automatic ranking strategies based on user interactions (click-histories).
There is considerable research attention being paid to Twitter and the internet in general. These services provide access to new types of information and the real-time nature of these data streams provide as many opportunities as they do challenges. In addition, companies like Twitter have adopted a very open approach to making their data available and Twitter’s developer API provides researchers with access to a huge volume of information.
Studies on large corpora have given examples of words that have strong associations with one another, although they never co-occur in paragraphs. For instance, Lund & Burgess (1996) mentioned the two words road and street that almost never cooccur in together. However, both words
[106]
Measuring the Similarities of Twitter Hashtags for Agriculture in the Czech Language
are strongly associated. The correlation between co-occurrence and similarity has been found by several researchers (Spence and Owens, 1990). This relation can be viewed as a simplification of Miller and Charles’ (1991) hypothesis: “Two words are semantically similar to the extent that their contextual representations are identical”.
Czech Agricultural Sector
The emergence of social media has generated renewed attention to rhetoric via online tweets, blogs, and comments on public issues. Social media users are not demographically representative and diverse social media platforms undoubtedly develop local cultures of expressive style that influence the character of what people choose to say. Nonetheless digital contents are an important, instantiation of public opinion (Watrobski et al., 2016). We are interested in how this instantiation plays out with the Czech Agricultural Sector.
Researchers at the Czech University of Life Sciences have been forming a multifunctional understanding of the Czech agricultural sector and its relationship to the EU Common Agricultural Policy, which is focused on keeping farmers in rural areas with cost-efficient technology adaptations ((Svatoš and Smutka, 2009; Vaněk et al., 2010; Kołodziejczak and Kossowski, 2011; Věžník, Král, and Svobodová, 2013; Reiff et al., 2016). In this respect, it is important to understand the underlying issues that form around Czech agricultural issues. That includes any influences, whether internal or external, that affect how the various stakeholders of the sector interact with one another and engage the public in general.
Problem Statement
We explore whether Twitter hashtags have a high order of co-occurrences, and whether that plays an important role in the construction of word similarities in the Czech language via Twitter. The work of this paper follows on previous research regarding the flow of information on platforms such as Facebook and Twitter. These dealt with how information proliferates through networks and how topics artificially dominate the discourse space (Wald et al., 2013; Xu et al., 2011; Ozdikis et al., 2012; Jansen et al., 2009). Our key questions include:
RQ1: Which hashtags occur the most frequently in the Czech agricultural sector?
RQ2: What proportion of Twitter accounts are verified versus non-verified in the Czech agricultural discourse?
Materials and methodsDescriptive statistics are brief coefficients that summarize a given data set, which can be either a representation of the entire or a sample of a population. All descriptive statistics are either measures of central tendency or measures of variability, also known as measures of dispersion. For our analytical framework we will measure the spread or dispersion of the data points.
Estimating Word Occurrences
Turney (2001) defines a method for estimating word similarity based on Church and Hanks’ (1990) pointwise mutual information. The mutual information between x and y is defined as the comparison between the probability of observing x and y together and observing them independently:
I(x,y) = log(p(x,y) / p(x).p(y)).
By extension, this model provides a way to measure the degree of co-occurrence of two words by comparing the number of co-occurrences to the number of individual occurrences (Bordag, 2018). In our case, a Twitter hashtag in the Czech language is accompanied with similar hashtags that supposedly have different meanings, yet lead to the same information, then we may deduce what topics users are clustering around related to Czech agriculture.
A central question in text mining and natural language processing is how to quantify what a document is about. One measure of how important a word may be is its term frequency (tf), how frequently a word occurs in a document. Another approach is to look at a term’s inverse document frequency (idf), which decreases the weight for commonly used words and increases the weight for words that are not used very much in a collection of documents (Chaudari et al., 2011). We can use this approach to the analysis to quantify how important various terms are in a document that is part of a collection.
Input Criteria
The Twitter dataset was collected from an archive of hashtags between December 1st, 2014 to November 1st, 2019. All tweets had at least one of the selected hashtags: #babis, #agrofert, #capihnizdo, #dotace, #repka. The English equivalents of those selected hashtags were also used. In total, 10 hashtags were monitored and 194,716 tweets were retrieved from Twitter.
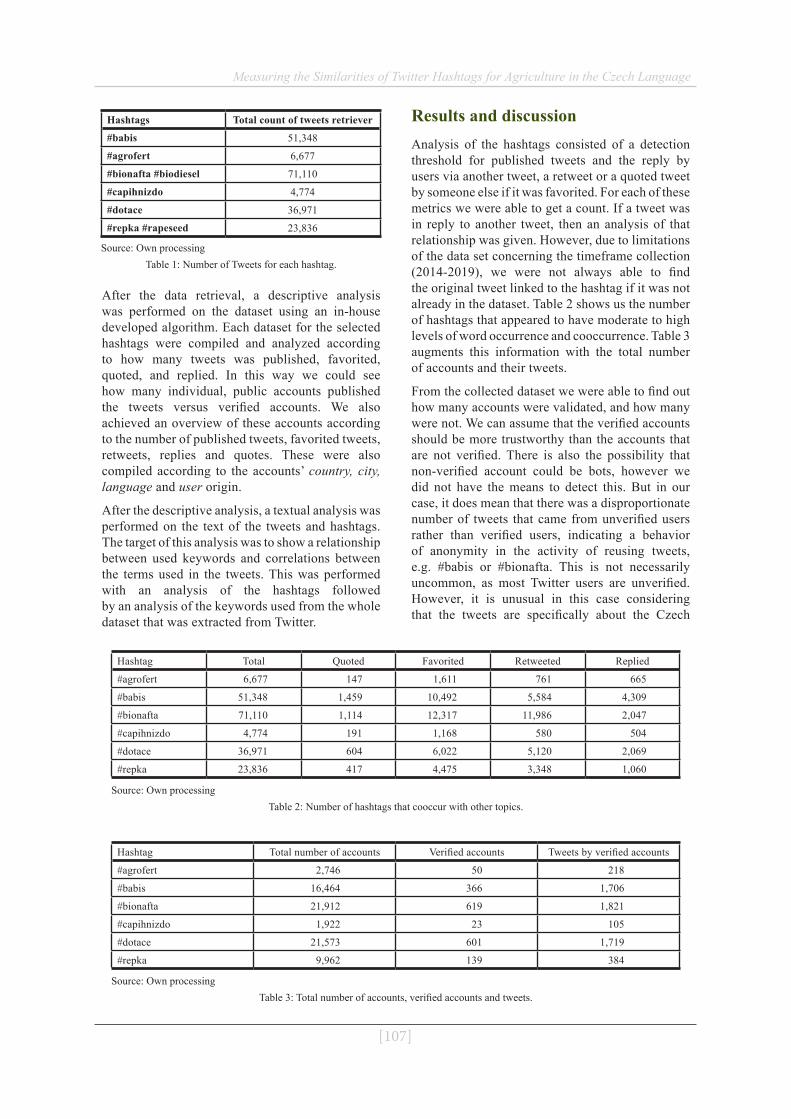
[107]
Measuring the Similarities of Twitter Hashtags for Agriculture in the Czech Language
Hashtags Total count of tweets retriever
#babis 51,348
#agrofert 6,677
#bionafta #biodiesel 71,110
#capihnizdo 4,774
#dotace 36,971
#repka #rapeseed 23,836
Source: Own processingTable 1: Number of Tweets for each hashtag.
After the data retrieval, a descriptive analysis was performed on the dataset using an in-house developed algorithm. Each dataset for the selected hashtags were compiled and analyzed according to how many tweets was published, favorited, quoted, and replied. In this way we could see how many individual, public accounts published the tweets versus verified accounts. We also achieved an overview of these accounts according to the number of published tweets, favorited tweets, retweets, replies and quotes. These were also compiled according to the accounts’ country, city, language and user origin.
After the descriptive analysis, a textual analysis was performed on the text of the tweets and hashtags. The target of this analysis was to show a relationship between used keywords and correlations between the terms used in the tweets. This was performed with an analysis of the hashtags followed by an analysis of the keywords used from the whole dataset that was extracted from Twitter.
Results and discussionAnalysis of the hashtags consisted of a detection threshold for published tweets and the reply by users via another tweet, a retweet or a quoted tweet by someone else if it was favorited. For each of these metrics we were able to get a count. If a tweet was in reply to another tweet, then an analysis of that relationship was given. However, due to limitations of the data set concerning the timeframe collection (2014-2019), we were not always able to find the original tweet linked to the hashtag if it was not already in the dataset. Table 2 shows us the number of hashtags that appeared to have moderate to high levels of word occurrence and cooccurrence. Table 3 augments this information with the total number of accounts and their tweets.
From the collected dataset we were able to find out how many accounts were validated, and how many were not. We can assume that the verified accounts should be more trustworthy than the accounts that are not verified. There is also the possibility that non-verified account could be bots, however we did not have the means to detect this. But in our case, it does mean that there was a disproportionate number of tweets that came from unverified users rather than verified users, indicating a behavior of anonymity in the activity of reusing tweets, e.g. #babis or #bionafta. This is not necessarily uncommon, as most Twitter users are unverified. However, it is unusual in this case considering that the tweets are specifically about the Czech
Hashtag Total Quoted Favorited Retweeted Replied
#agrofert 6,677 147 1,611 761 665
#babis 51,348 1,459 10,492 5,584 4,309
#bionafta 71,110 1,114 12,317 11,986 2,047
#capihnizdo 4,774 191 1,168 580 504
#dotace 36,971 604 6,022 5,120 2,069
#repka 23,836 417 4,475 3,348 1,060
Source: Own processingTable 2: Number of hashtags that cooccur with other topics.
Hashtag Total number of accounts Verified accounts Tweets by verified accounts
#agrofert 2,746 50 218
#babis 16,464 366 1,706
#bionafta 21,912 619 1,821
#capihnizdo 1,922 23 105
#dotace 21,573 601 1,719
#repka 9,962 139 384
Source: Own processingTable 3: Total number of accounts, verified accounts and tweets.
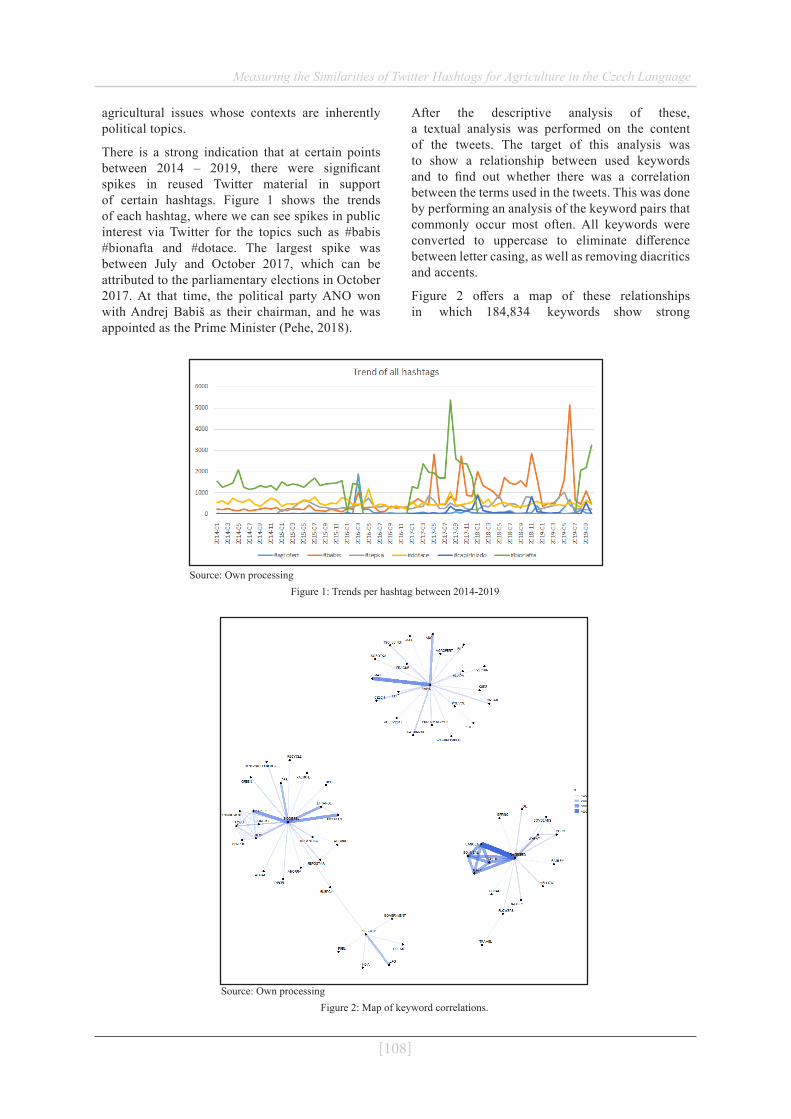
[108]
Measuring the Similarities of Twitter Hashtags for Agriculture in the Czech Language
agricultural issues whose contexts are inherently political topics.
There is a strong indication that at certain points between 2014 – 2019, there were significant spikes in reused Twitter material in support of certain hashtags. Figure 1 shows the trends of each hashtag, where we can see spikes in public interest via Twitter for the topics such as #babis #bionafta and #dotace. The largest spike was between July and October 2017, which can be attributed to the parliamentary elections in October 2017. At that time, the political party ANO won with Andrej Babiš as their chairman, and he was appointed as the Prime Minister (Pehe, 2018).
After the descriptive analysis of these, a textual analysis was performed on the content of the tweets. The target of this analysis was to show a relationship between used keywords and to find out whether there was a correlation between the terms used in the tweets. This was done by performing an analysis of the keyword pairs that commonly occur most often. All keywords were converted to uppercase to eliminate difference between letter casing, as well as removing diacritics and accents.
Figure 2 offers a map of these relationships in which 184,834 keywords show strong
Source: Own processingFigure 1: Trends per hashtag between 2014-2019.
Source: Own processingFigure 2: Map of keyword correlations.

[109]
Measuring the Similarities of Twitter Hashtags for Agriculture in the Czech Language
correlations that are used in Twitter hashtags. These keywords essentially denote the most popular topics concerning Czech agriculture around which users cluster. The blue lines indicate the strength of the relationship, whereby users are pushing those hashtags to bring attention to the topic(s). In this case, the strongest relationship is apparent between the keyword’s “rapeseed”, “canola” and “soymeal”. For the graphic output we displayed only keyword pairs with occurrence over 500 counts. Detailed figures on the top 20 keyword pair occurrences are presented in Table 4.
# Keyword pair No of occurrences
1 RAPESEED - CANOLA 4,731
2 BABIS - ZEMAN 3,381
3 BIOFUEL - BIODIESEL 2,962
4 RAPESEED - MATIF 2,822
5 BIOFUELS - BIODIESEL 2,811
6 SOYOIL - SOYMEAL 2,750
7 RAPESEED - SOYMEAL 2,725
8 RAPESEED - SOYOIL 2,724
9 CANOLA - SOYOIL 2,723
10 CANOLA - SOYMEAL 2,717
11 BIODIESEL - ETHANOL 2,475
12 MATIF - SOYMEAL 2,386
13 CANOLA - MATIF 2,385
14 SOYOIL - MATIF 2,385
15 ANO - BABIS 2,133
16 RAPESEED - WHEAT 2,033
17 BIODIESEL - RFS 2,030
18 LPG - SUBSIDY 1,882
19 BIODIESEL - HEMP 1,683
20 BABIS - CAPIHNIZDO 1,419Source: Own processing
Table 4: Top 20 keyword pair occurrences.
In contrast to the past work there has been interest in the detection of fake users from both online social networks and computer networking communities (Dickerson et al., 2014). The openness of Twitter’s platform allows for, and even promotes, programs called “bots” that automatically post content. These bots post content ranging from helpful (e.g." recent news stories or public service announcements) to malicious spam or phishing links. Such bots on Twitter have become a nuisance, even triggering a long diatribe, particularly around political figures such as Andrej Babiš.
Similarly, Campoy (2019) reported that 60%, 33 million followers on Twitter were suspiciously inactive for longer than 120 days following his
election in 2016. Yet these same accounts have been observed to become active during highly publicized issues important to his administration. In short, there is now a widespread belief that bots constitute a significant part of the social media world - and that many of them can be identified by the frequency of how often they reuse content through word occurrence. While this is only a piece of the puzzle, measuring word occurrence allows a glimpse of what is happening at a surface level. A further semantic analysis of the actual tweets would be needed to triangulate the veracity of suspicious accounts.
In relation to our results, it would seem that there was significant public discussion around rapeseed, which is a principal agricultural export in the Czech Republic (Carré, 2014). Social media represents one of the most important informational mediums that rural communities in the Czech Republic utilize to engage in public discussions (Červenková et al., 2008). It is not a surprise that rapeseed production, especially if subsidized by the EU Commission, would account for significant Twitter activity. Our analysis shows which keywords are more likely to occur together with other topics in Twitter concerning Czech agriculture.
What is unusual, is that we also found that several accounts producing high-level traffic for #dotace and #babis originated from other countries, such as Italy and India. Following this trend, we reframed our utility to include the “user verified” attribute, which details the reliability of the user as a consistent account. The Levenstein distance for each tweet was computed to find potential duplicates from the originating accounts. In the case of #babis, some duplicates were found, however those originated from multiple sources and it was difficult to discern an original source. None of the analyzed tweets appeared to be duplicates, however there was strong indication that other users reused the content material from older tweets concerning #babis, #dotace, #repka.
What the data tells us, is that the majority of Twitter traffic in the Czech agricultural sector is significantly oriented around rapeseed or related biofuel topics and the prime minister, Andrej Babiš (see Table 5). Also, there is a loose correlation with topics concerning government subsidies (#dotace) for rapeseed production, presumably from the European Union. With this in mind, we can refine our understanding of the Czech agricultural sector and the most relevant issues concerning rural communities and agricultural
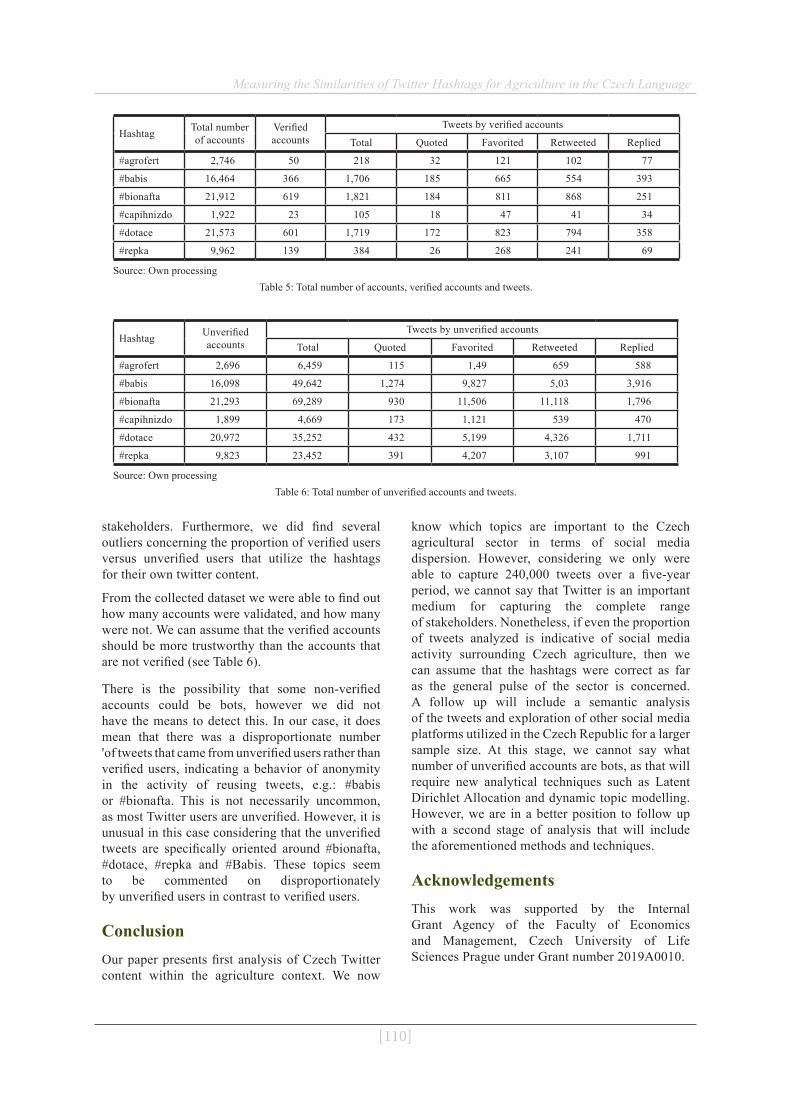
[110]
Measuring the Similarities of Twitter Hashtags for Agriculture in the Czech Language
stakeholders. Furthermore, we did find several outliers concerning the proportion of verified users versus unverified users that utilize the hashtags for their own twitter content.
From the collected dataset we were able to find out how many accounts were validated, and how many were not. We can assume that the verified accounts should be more trustworthy than the accounts that are not verified (see Table 6).
There is the possibility that some non-verified accounts could be bots, however we did not have the means to detect this. In our case, it does mean that there was a disproportionate number 'of tweets that came from unverified users rather than verified users, indicating a behavior of anonymity in the activity of reusing tweets, e.g.: #babis or #bionafta. This is not necessarily uncommon, as most Twitter users are unverified. However, it is unusual in this case considering that the unverified tweets are specifically oriented around #bionafta, #dotace, #repka and #Babis. These topics seem to be commented on disproportionately by unverified users in contrast to verified users.
ConclusionOur paper presents first analysis of Czech Twitter content within the agriculture context. We now
know which topics are important to the Czech agricultural sector in terms of social media dispersion. However, considering we only were able to capture 240,000 tweets over a five-year period, we cannot say that Twitter is an important medium for capturing the complete range of stakeholders. Nonetheless, if even the proportion of tweets analyzed is indicative of social media activity surrounding Czech agriculture, then we can assume that the hashtags were correct as far as the general pulse of the sector is concerned. A follow up will include a semantic analysis of the tweets and exploration of other social media platforms utilized in the Czech Republic for a larger sample size. At this stage, we cannot say what number of unverified accounts are bots, as that will require new analytical techniques such as Latent Dirichlet Allocation and dynamic topic modelling. However, we are in a better position to follow up with a second stage of analysis that will include the aforementioned methods and techniques.
AcknowledgementsThis work was supported by the Internal Grant Agency of the Faculty of Economics and Management, Czech University of Life Sciences Prague under Grant number 2019A0010.
Hashtag Total number of accounts
Verified accounts
Tweets by verified accounts
Total Quoted Favorited Retweeted Replied
#agrofert 2,746 50 218 32 121 102 77
#babis 16,464 366 1,706 185 665 554 393
#bionafta 21,912 619 1,821 184 811 868 251
#capihnizdo 1,922 23 105 18 47 41 34
#dotace 21,573 601 1,719 172 823 794 358
#repka 9,962 139 384 26 268 241 69
Source: Own processingTable 5: Total number of accounts, verified accounts and tweets.
Hashtag Unverified accounts
Tweets by unverified accounts
Total Quoted Favorited Retweeted Replied
#agrofert 2,696 6,459 115 1,49 659 588
#babis 16,098 49,642 1,274 9,827 5,03 3,916
#bionafta 21,293 69,289 930 11,506 11,118 1,796
#capihnizdo 1,899 4,669 173 1,121 539 470
#dotace 20,972 35,252 432 5,199 4,326 1,711
#repka 9,823 23,452 391 4,207 3,107 991
Source: Own processingTable 6: Total number of unverified accounts and tweets.
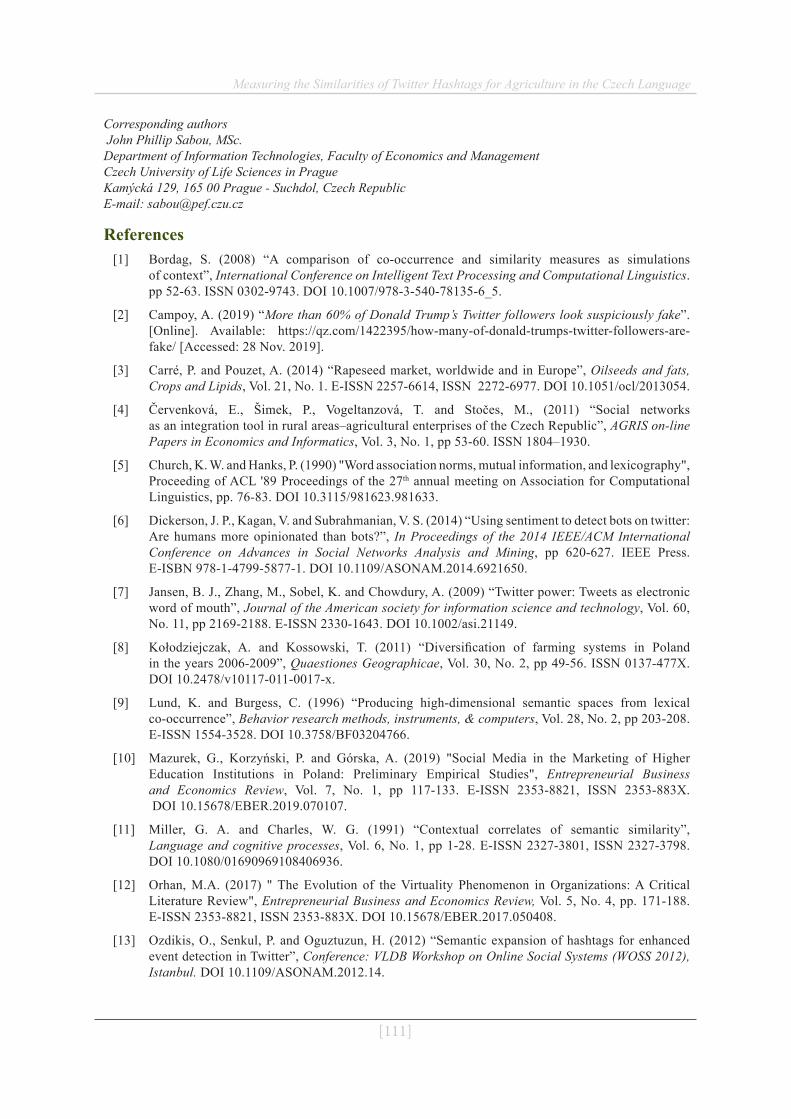
[111]
Measuring the Similarities of Twitter Hashtags for Agriculture in the Czech Language
Corresponding authors John Phillip Sabou, MSc.Department of Information Technologies, Faculty of Economics and ManagementCzech University of Life Sciences in Prague Kamýcká 129, 165 00 Prague - Suchdol, Czech RepublicE-mail: [email protected]
References[1] Bordag, S. (2008) “A comparison of co-occurrence and similarity measures as simulations
of context”, International Conference on Intelligent Text Processing and Computational Linguistics. pp 52-63. ISSN 0302-9743. DOI 10.1007/978-3-540-78135-6_5.
[2] Campoy, A. (2019) “More than 60% of Donald Trump’s Twitter followers look suspiciously fake”. [Online]. Available: https://qz.com/1422395/how-many-of-donald-trumps-twitter-followers-are-fake/ [Accessed: 28 Nov. 2019].
[3] Carré, P. and Pouzet, A. (2014) “Rapeseed market, worldwide and in Europe”, Oilseeds and fats, Crops and Lipids, Vol. 21, No. 1. E-ISSN 2257-6614, ISSN 2272-6977. DOI 10.1051/ocl/2013054.
[4] Červenková, E., Šimek, P., Vogeltanzová, T. and Stočes, M., (2011) “Social networks as an integration tool in rural areas–agricultural enterprises of the Czech Republic”, AGRIS on-line Papers in Economics and Informatics, Vol. 3, No. 1, pp 53-60. ISSN 1804–1930.
[5] Church, K. W. and Hanks, P. (1990) "Word association norms, mutual information, and lexicography", Proceeding of ACL '89 Proceedings of the 27th annual meeting on Association for Computational Linguistics, pp. 76-83. DOI 10.3115/981623.981633.
[6] Dickerson, J. P., Kagan, V. and Subrahmanian, V. S. (2014) “Using sentiment to detect bots on twitter: Are humans more opinionated than bots?”, In Proceedings of the 2014 IEEE/ACM International Conference on Advances in Social Networks Analysis and Mining, pp 620-627. IEEE Press. E-ISBN 978-1-4799-5877-1. DOI 10.1109/ASONAM.2014.6921650.
[7] Jansen, B. J., Zhang, M., Sobel, K. and Chowdury, A. (2009) “Twitter power: Tweets as electronic word of mouth”, Journal of the American society for information science and technology, Vol. 60, No. 11, pp 2169-2188. E-ISSN 2330-1643. DOI 10.1002/asi.21149.
[8] Kołodziejczak, A. and Kossowski, T. (2011) “Diversification of farming systems in Poland in the years 2006-2009”, Quaestiones Geographicae, Vol. 30, No. 2, pp 49-56. ISSN 0137-477X. DOI 10.2478/v10117-011-0017-x.
[9] Lund, K. and Burgess, C. (1996) “Producing high-dimensional semantic spaces from lexical co-occurrence”, Behavior research methods, instruments, & computers, Vol. 28, No. 2, pp 203-208. E-ISSN 1554-3528. DOI 10.3758/BF03204766.
[10] Mazurek, G., Korzyński, P. and Górska, A. (2019) "Social Media in the Marketing of Higher Education Institutions in Poland: Preliminary Empirical Studies", Entrepreneurial Business and Economics Review, Vol. 7, No. 1, pp 117-133. E-ISSN 2353-8821, ISSN 2353-883X. DOI 10.15678/EBER.2019.070107.
[11] Miller, G. A. and Charles, W. G. (1991) “Contextual correlates of semantic similarity”, Language and cognitive processes, Vol. 6, No. 1, pp 1-28. E-ISSN 2327-3801, ISSN 2327-3798. DOI 10.1080/01690969108406936.
[12] Orhan, M.A. (2017) " The Evolution of the Virtuality Phenomenon in Organizations: A Critical Literature Review", Entrepreneurial Business and Economics Review, Vol. 5, No. 4, pp. 171-188. E-ISSN 2353-8821, ISSN 2353-883X. DOI 10.15678/EBER.2017.050408.
[13] Ozdikis, O., Senkul, P. and Oguztuzun, H. (2012) “Semantic expansion of hashtags for enhanced event detection in Twitter”, Conference: VLDB Workshop on Online Social Systems (WOSS 2012), Istanbul. DOI 10.1109/ASONAM.2012.14.
[112]
Measuring the Similarities of Twitter Hashtags for Agriculture in the Czech Language
[14] Pehe, J. (2018) “Czech Democracy Under Pressure”, Journal of Democracy, Vol. 29, No. 3, pp. 65-77. E-ISSN 1045-5736, ISSN 1086-3214. DOI 10.1353/jod.2018.0045.
[15] Reiff M., Surmanová K., Balcerzak A. P. and Pietrzak M. B. (2016) "Multiple Criteria Analysis of European Union Agriculture", Journal of International Studies, Vol. 9, No 3, pp. 62-74. E-ISSN 2071-8330, ISSN 2306-3483. DOI 10.14254/2071-8330.2016/9-3/5.
[16] Spence, D. P. and Owens, K. C. (1990) “Lexical co-occurrence and association strength”, Journal of Psycholinguistic Research, Vol. 19, No. 5, pp. 317-330. E-ISSN 1573-6555, ISSN 0090-6905. DOI 10.1007/BF01074363.
[17] Svatoš, M. and Smutka, L. (2009) “Influence of the EU enlargement on the agrarian foreign trade development in member states”, Agricultural Economics (AGRICECON), Vol. 55, No. 5, pp. 233-249. ISSN 0139-570X. DOI 10.17221/34/2009-AGRICECON.
[18] Turney, P. D. (2001) “Mining the web for synonyms: PMI-IR versus LSA on TOEFL”, Proceedings of the 12ve European Conference on Machine Learning, pp. 491-502. Springer, Berlin, Heidelberg. DOI 10.1007/3-540-44795-4_42.
[19] Vaněk, J., Šimek, P., Vogeltanzová, T., Červenková, E. and Jarolímek, J. (2010) “ICT in Agricultural Enterprises in the Czech Republic–Exploration 2010”, Agris on-line Papers in Economics and Informatics, Vol. 2, No. 3, pp 69-75. ISSN 1804–1930
[20] Wald, R. and Khoshgoftaar, T. M., Napolitano, A. and Sumner, C. (2013) “Predicting susceptibility to social bots on twitter”, 14th International Conference on Information Reuse & Integration (IRI), IEEE Computer Society, pp. 6-13.
[21] Wątróbski, J., Jankowski, J. and Ziemba, P. (2016) "Multistage Performance Modelling in Digital Marketing Management", Economics and Sociology, Vol. 9, No. 2, pp. 101-125. ISSN 2071-789X. DOI 10.14254/2071-789X.2016/9-2/7.
[22] Xu, Z., Ru, L., Xiang, L. and Yang, Q. (2011) “Discovering user interest on twitter with a modified author-topic model”, Proceedings of the 2011 IEEE/WIC/ACM International Conferences on Web Intelligence and Intelligent Agent Technology, , Vol. 1, pp. 422-429. DOI 10.1109/WI-IAT.2011.47.

[113]
Agris on-line Papers in Economics and Informatics

[114]
Agris on-line Papers in Economics and Informatics
Agris on-line Papers in Economics and Informatics
Volume XI Number 4, 2019
Editorial board President of Editorial Board Prof. Ing. Miroslav Svatoš, CSc., Czech University of Life Sciences Prague
Members of Editorial Board Prof. Dr. Ulrich Bodmer, Weihenstephan-Triesdorf University of Applied SciencesProf. Philippe Burny, Walloon Center for Agricultural Research, GemblouxProf. J. Stephen Clark, Ph.D., Dalhousie University, HalifaxProf. Ing. Lukáš Čechura, Ph.D., Czech University of Life Sciences PragueProf. Dr. Miklós Herdon, University of DebrecenProf. Dr. Heinrich Hockmann, Leibniz Institute of Agricultural Development in Transition Economies (IAMO), HalleProf. Ing. Jan Hron, CSc., DrSc., dr.h.c., Czech University of Life Sciences PragueAssoc. prof. Ing. Milan Kučera, CSc., Slovak University of Agriculture in NitraAssoc. prof. PhDr. Michal Lošťák, CSc., Czech University of Life Sciences PragueAssoc. prof. Ing. Zuzana Pálková, Ph.D., Slovak University of Agriculture in NitraAssoc. prof. Ing. Mansoor Maitah, Ph.D. et Ph.D., Czech University of Life Sciences PragueAssoc. prof. Ing. Ivana Rábová, Ph.D., Mendel University in BrnoIng. Helena Rezbová, Ph.D., Czech University of Life Sciences PragueDerek Shepherd BSc, MSc, MTS, Plymouth University, PlymouthProf. RNDr. PhDr. Antonín Slabý, CSc., University of Hradec KrálovéProf. Ing. Luboš Smutka, Ph.D., Czech University of Life Sciences PragueIng. Pavel Šimek, Ph.D., Czech University of Life Sciences PragueIng. Jiří Vaněk, Ph.D., Czech University of Life Sciences PragueProf. Krzysztof Wach, PhD., Cracow University of Economics
Agris on-line Papers in Economics and Informatics
The international reviewed scientific journal issued by the Faculty of Economics and Management of the Czech University of Life Sciences Prague.

http://online.agris.cz
ISSN 1804-1930