
CZECH TECHNICAL UNIVERSITY IN PRAGUE FACULTY OF ...
71
CZECH TECHNICAL UNIVERSITY IN PRAGUE FACULTY OF CIVIL ENGINEERING Department of Construction Management and Economics MASTER THESIS May 2019 Bc. Victoria Nabatova
-
Upload
khangminh22 -
Category
Documents
-
view
0 -
download
0
Transcript of CZECH TECHNICAL UNIVERSITY IN PRAGUE FACULTY OF ...

CZECH TECHNICAL UNIVERSITY IN PRAGUE
FACULTY OF CIVIL ENGINEERING
Department of Construction Management and Economics
MASTER THESIS
May 2019 Bc. Victoria Nabatova


Statement of Authorship
I hereby certify that the thesis I am submitting is entirely my own original work except
where otherwise indicated. I am aware of the Czech Technical University's regulations
concerning plagiarism, including those regulations concerning disciplinary actions that
may result from plagiarism. Any use of the works of any other author, in any form, is
properly acknowledged at their point of use.
Prague, 19.5.2019 ……………………..
Bc. Victoria Nabatova

Acknowledgement
I would like to express my sincere gratitude to my advisor Ing. Josef Žák, Ph.D. for the
continuous support he provided towards this research work, for his patience, enthusiasm,
and immense knowledge. His guidance was very valuable and helpful.
I would also like to thank my work colleagues for sharing their knowledge and advice.
Last but not least, I would like to thank my family for their great support.

Shromažďování dat infrastrukturních projektů v BIM
Infrastructure project data harvesting in BIM

Abstrakt:
Tato diplomová práce je zaměřena na využití dat v infrastrukturních projektech. Práce je
rozdělena na teoretickou a praktickou část. První část je věnována rešerši zahraniční a
české literatury, která vysvětluje základní pojmy BIM, týkající se managementu a
výměny dat. Druhá část je zaměřena na tvorbu a přenos dat mezi různými softwary s
cílem zlepšení viditelnosti a rozhodování projektových manažerů v infrastrukturních
projektech.
Klíčová slova: BIM, management dat, výměna dat, Společné datové prostředí, viditelnost,
AutoCAD, Navisworks, Power BI, COBie
Abstract:
This diploma thesis is focused on data utilization in infrastructure projects. The thesis is
divided into a theoretical part and a practical part. The first part is devoted to the Czech
and foreign literature search which explains the basic concepts of BIM related to data
management and data exchange. The second part is focused on the data creation and
transfer across different computer programs with the aim of enabling improved visibility
and decision making for Project Managers for infrastructure projects.
Key words: BIM, data management, data exchange, Common Data Environment,
visibility, AutoCAD, Navisworks, Power BI, COBie

Table of Contents
Glossary .................................................................................................................................9
1. Introduction ................................................................................................................... 11
2. Related literature and theoretical focus .......................................................................... 12
2.1 What is BIM – brief introduction ............................................................................ 12
2.2 BIM Maturity Levels .............................................................................................. 14
2.3 BIM uses for a construction project – general ......................................................... 16
2.4 BIM Uses for infrastructure projects ....................................................................... 18
2.5 Information requirements and information models .................................................. 19
2.5.1 Organizational information requirements (OIR)............................................... 20
2.5.2 Asset information requirements (AIR) ............................................................. 20
2.5.3 Project ............................................................................................................. 21
2.5.4 Exchange information requirements (EIR) ....................................................... 21
2.5.5 Asset information model (AIM) and Project information model (PIM) ............ 21
2.6 The information delivery cycle ............................................................................... 22
2.7 CDE (Common Data Environment) ........................................................................ 23
2.7.1 Work in progress ............................................................................................. 24
2.7.2 Shared ............................................................................................................. 24
2.7.3 Published......................................................................................................... 24
2.8 Suitability Codes .................................................................................................... 24
2.9 Information and data exchange ............................................................................... 25
2.9.1 How the data is exchanged .............................................................................. 26
2.9.2 Industry Foundation Classes ............................................................................ 27
2.9.3 Construction Operations Building information exchange (COBie) ................... 28
2.9.3.1 Brief COBie introduction ................................................................................ 28
2.9.4 COBie as a deliverable .................................................................................... 29
2.9.5 The relation between IFC and COBie .............................................................. 30
2.10 Software used ......................................................................................................... 31
2.10.1 AutoCAD Civil 3D.......................................................................................... 31
2.10.2 Navisworks ..................................................................................................... 31
2.10.3 Microsoft Excel ............................................................................................... 32
2.10.4 Power BI ......................................................................................................... 32
3. The practical part ........................................................................................................... 34

3.1 About the chosen project ........................................................................................ 34
3.1.1 Basic information ............................................................................................ 34
3.1.2 BIM objectives and deliverables ...................................................................... 36
3.2 Project design ......................................................................................................... 37
3.3 Scope of work in thesis ........................................................................................... 38
3.4 Considered workflow ............................................................................................. 38
3.5 Proposed workflow................................................................................................. 39
3.6 Project assumptions ................................................................................................ 40
3.7 Process ................................................................................................................... 41
3.7.1 Data and extended data in Civil 3D ................................................................. 41
3.7.2 Suitability Codes used for the project .............................................................. 43
3.7.3 Navisworks and COBie processes ................................................................... 44
3.7.4 Power BI ......................................................................................................... 47
4. Conclusion .................................................................................................................... 64
List of references .................................................................................................................. 65
List of figures ....................................................................................................................... 69
List of tables ......................................................................................................................... 71

Glossary
AIM Asset Information Model
AIM Architects Information Model
AIR Asset information requirements
BEP BIM Execution Plan
BIM Building Information Modelling
BrIM Bridge Information Model
BS British Standard
BSI British Standard Institution
BSIM Building Services Information Model
CAD Computer Aided Design
CADD Computer Aided Design and Drafting
CDE Common Data Environment
COBie Construction Operations Building Information Exchange
CSA Czech Standardization Agency
D-B Design and Build
DAX Data Analysis Expressions
EIR Exchange information requirements or Employer’s Information
Requirements
IDM Information Delivery Manual
IFC Industry Foundation Classes
IFD International Framework for Dictionaries
ISO International Organization for Standardization
FIM Facilities Information Model
LTA Land Transport Authority
MBD Model-Based Design
NBS National Building Specification
OIR Organizational information requirements
PAS Publicly Available Specification
PBJV Penta-Ocean Construction Co Ltd – Bachy Soletanche
Singapore Pte Ltd Joint Venture
PIM Project information model

PIR Project information requirements
RIBA Royal Institute of British Architects
SIM Structural Information Model
SQL Structured Query Language
WIP Work in Progress
XML Extensible Markup Language

11
1. Introduction
Designers and builders, from the very earliest buildings, needed to communicate with
each other to establish the requirements and agree what was satisfactory and acceptable.
For hundreds of years, the drawing board, pens and papers remained the main means of
passing the information, then computers began to widely spread out in the 1970s and
people started using them for computer aided design and drafting (CADD / CAD).
Additional information coming along with the drawings has also evolved over time. At
first it was printed in catalogues, then CD-ROM based catalogues. Each party,
furthermore, had their own information, which was passed onto each other and often lead
to costly mistakes due to different ways of processing information. (Construction
Products Association and NBS, 2013)
Nowadays, in the era of digitalization, it is possible to store all shared data in one place
that is accessible to each party and this is where BIM takes its role. Common Data
Environment (CDE), being an inseparable part of BIM, can be understood as storage for
all data related to the specific project presented in a structured and smart way so there is
no misunderstanding between the stakeholders.
This thesis is devoted to data creation, exchange and utilization processes in infrastructure
projects. The main goal of the thesis is to improve the visibility of BIM models to enable
better decision making, using current engineering software design and analysis platforms.
I will describe the method I have developed to extract relevant attribute data from a BIM
authoring software and represent it into a web-based dashboard, providing greater
visibility to the project controls team or any relevant construction party.

12
2. Related literature and theoretical focus
Information management, understandably, is highly important for the successful delivery
of any construction project, because it involves enormously complex information flows.
Undoubtedly, it causes a lot of problems in the industry – time and money loss on claims,
increased costs and schedules – due to very complicated and unstructured nature of
information flows and exchanges in a typical construction project. The information
management problem should be treated with appropriate standards, processes and
technologies.
The first part of this thesis focuses on information flows and data management, data
exchange and utilization problematics.
2.1 What is BIM – brief introduction
Building Information Modelling (BIM) is an acronym, in which more and more people
in the construction industry are becoming increasingly interested. It involves the process
of creating, using and managing building data during its lifecycle. BIM is also sometimes
referred to as Building Information Management or Better Information Management,
because it might better reflect the essence of the whole concept. BIM can be spread out
to all sectors: building structures, transportation engineering, water structures and civil
engineering in general. It is necessary to distinguish BIM as a process, which covers the
generation and management of the physical and functional information of a project, and
BIM as a model, which is the output and the main product of the process (Koncepce
zavádění metody BIM v České republice, 2017).
BIM is closely connected to Model-based Design (MBD), which is “a mathematical and
visual method of addressing problems associated with designing complex systems such
as buildings, plants or indeed any other product” (Kumar, 2015). A considerable
advantage of using MBD is cost-effective and efficient approach of making
communication and integration between players easier throughout the whole process.
There are many various definitions of BIM. For example, the National Institute of
Building Sciences defines BIM as following:
13
“Building Information Modeling (BIM) is a digital representation of physical and
functional characteristics of a facility. A BIM is a shared knowledge resource for
information about a facility forming a reliable basis for decisions during its life-cycle;
defined as existing from earliest conception to demolition.”
According to Eastman, BIM is “a modelling technology and associated set of processes
to produce, communicate and analyse building models.” These building models have
such characteristics, as smart building components (which “know” what they are and can
understand parametric rules); components with data describing how they behave (for
analyses), coordinated data (so the change would be reflected in all views) and consistent
and non-redundant data (so the change in the component would be reflected in all views
of the component). (Eastman et al., 2011)
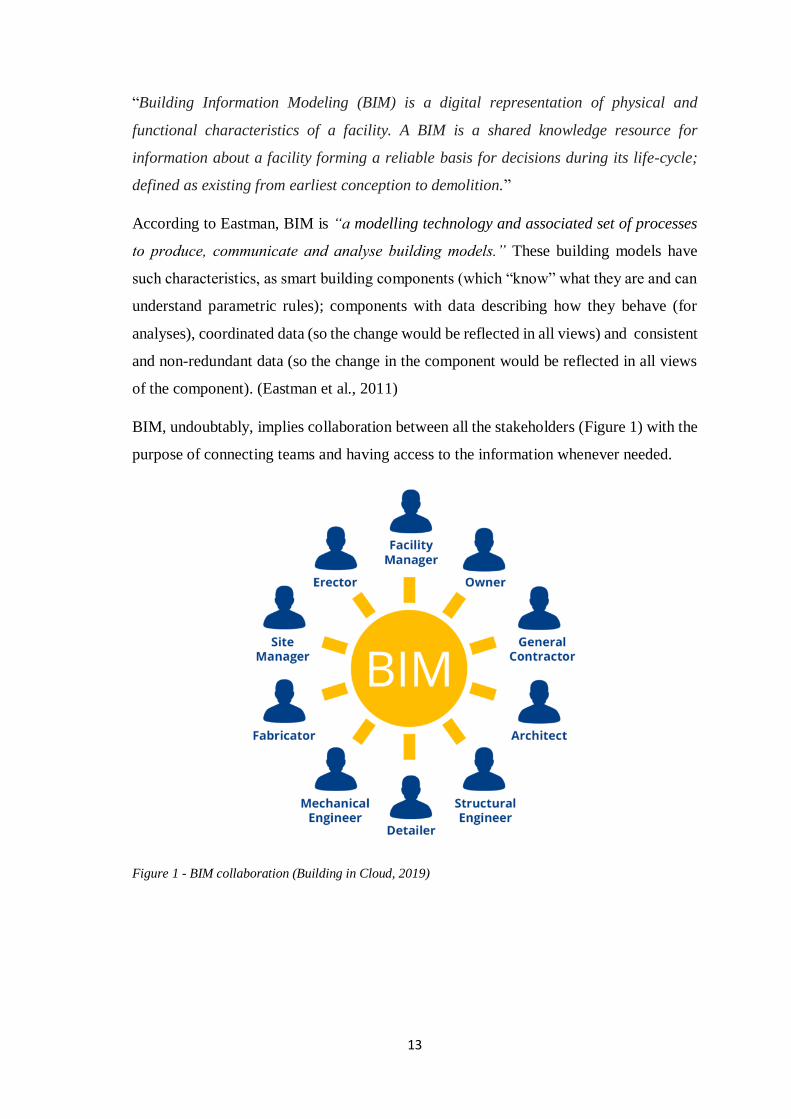
BIM, undoubtably, implies collaboration between all the stakeholders (Figure 1) with the
purpose of connecting teams and having access to the information whenever needed.
Figure 1 - BIM collaboration (Building in Cloud, 2019)

14
2.2 BIM Maturity Levels
In the industry it is often talked about BIM with the reference to its maturity levels. They
come from the widely used BIM Maturity Diagram developed by Mervyn Richards and
Mark Bew in 2008. These levels are illustrated in figure 2 below.
Figure 2 - BIM Maturity Diagram (RIBA,2012)
According to the Maturity Diagram, also called wedge diagram, there are levels 0,1,2 and
3 and they are used as measures of BIM maturity. The complexity and development are
increasing with each next level.
Level 0
It is the simplest form of maturity. Level 0 can be defined by no collaboration and the use
of 2D CAD drafting only. There is no differentiation between data management and
process management – it starts only from level 1. Output (construction drawings) and its
distribution is mainly via paper – the whole process as it has been known and used for
many years.
Level 1
Level 1 is often referred to as “lonely BIM”. The increased use of 2D information is
followed by non-federated 3D models and only one party takes advantage of utilizing the
model – meaning there is no collaboration between different disciplines at this stage of
BIM maturity.

15
As for processes, there is a need of having process management and there are advisories,
guides and standards to help with that.
Level 2
Level 2 BIM is demanding different Building Information Models (BIMs), such as:
- AIM - Architects Information Model;
- SIM - Structural Information Model;
- FIM - Facilities Information Model;
- BSIM - Building Services Information Model;
- BrIM - Bridge Information Model;
These are being placed in a single shared online area - Common Data Environment. At
this stage, originators are using other models as a source for creating their models, which
they control. For this level, there should be a discussed and agreed digital information
exchange process, which might be based on guides such as PAS 1192-2 or newer. Further
requirements include BIM Execution Plan, BIM Protocol, clear definition of EIR
(Employer’s Information Requirements or Exchange Information Requirements1) and
delivery of relevant information and digital models for asset management to the Client.
Level 3
In the last level of BIM maturity, BIM model is seen as a single shared model which is
held at centralized depository. iBIM in the graph stands for “integrated Building
Information Modelling”. The BIM model represents full collaboration combining all
disciplines. Any party can access it and edit the same model, which reduces the risk of
conflicting information. The main challenge will not be the collaborative use of
information, but data harnessing with the aim of greater use. This level will also require
software interoperability: using standards as Industrial Foundation Class (IFC),
International Framework for Dictionaries (IFD), The Information Delivery Manual
(IDM). In addition to 3D information of the project, there can be attribute data included
at level 2 and 3, defined in terms of the multi-dimensional functions (McPartland,2017):
1 Employer’s Information Requirements were changed to Exchange Information Requirements according to BS EN ISO 19650, released in the first quarter of 2019.

16
- 3D – creating graphical and non-graphical information; parametric design models
– use of spatial dimensions (height, width, length) to represent an object, make
visualizations and detect clashes;
- 4D – adding a time parameter to link the individual 3D parts with the timeline of
the project, including quantities and resources scheduling;
- 5D – adding costs to models, integration with design, estimations and scheduling;
- 6D – expanding the model with project assets information, supporting facilities
management and operational side.
2.3 BIM uses for a construction project – general
When BIM is applied to a project, it is essential to identify its uses for the project
according to the targets that the client intends to reach. Each project is unique, but there
are some common goals, which may include better process management, design
improving, time and money saving due to better coordination and change management.
Later the objectives and uses should be stated in BIM Execution Plan so all involved
parties have the clear understanding of what to focus on.
There is no single list of uses which is universal and applicable to every project and
country, but there are some created by different organizations and agencies.
According to BIM Project Execution Planning Guide (Computer Integrated Construction
Research Program, 2011), there are twenty-five benefits or BIM Uses identified
throughout the building lifecycle for consideration on a project. These benefits are
organized by project phase of project development (Plan, Design, Construct, Operate)
and divided into primary and secondary BIM Uses and can be seen in the following figure:

17
Figure 3 - BIM Uses for a construction project (Computer Integrated Construction Research Program,
2011)
Every use has potential values to bring in, for example, for 3D Coordination it is “Reduced
construction cost; potentially less cost growth (i.e. less change orders); increase
productivity on site; coordinate building project through a model” and others (Penn State
CIC, 2018)
For a comparison, Czech Standardization Agency (CSA) made a broader research on BIM
Uses in 2018 and described sixty-two (62) BIM Uses that they found (some of them are
based on BIM Project Execution Planning Guide, mentioned above). CSA findings are
adapted to the Czech Republic project phases, which are eleven – from preparation works
and feasibility study to the demolition of the object. Here are some examples of the uses:
- Surveying
- Virtual Reality Simulation (VR)
- 2D, 3D documentation
- Code Checking & Validation
- Quantity take-offs
- Simulation of a construction process
- Space Management
- Collision Detection

18
- Lighting Analysis
- Visualizations and others.
2.4 BIM Uses for infrastructure projects
The State Fund for Transport Infrastructure (SFDI) in cooperation with Ministry of
Industry and Trade of the Czech Republic and other institutions (2018) developed a
document on the BIM Uses particularly for infrastructure projects, based on the research
mentioned above.
In this document they defined forty (40) BIM applicable Use cases, divided into eight (8)
construction phases. Each use was then evaluated for each phase and as a result the matrix
with the overall benefit for each use in each phase was created. A cut-out can be seen in
figure 4:
Figure 4 - Uses of BIM for infrastructure projects (SFDI et al., 2018)
The BIM Use cases include:
- Terrain modelling
- Generation of a maintenance plan
- Spatial analysis
- 3D utilities model
- Quantity take-offs
- Concrete Precasting
- Construction Logistics
- Urban Planning
Číslo Úžití dat BIM buildingSMART BIMDictionary_A Studiepozná
mkyDUR
pozná
mkyDSP
pozná
mkyPDPS
pozná
mkyRDS
pozná
mkyZBV
pozná
mkyDSPS
pozná
mky
Provozn
í
dokum
entace
pozná
mky
Celko
vá
pozná
mka
Průměr
užitečnosti
Průměr
proveditel
nosti
Počet
výskytůUžitek
Užitek s
významn
ostí
1Trasa, niveleta 10 10 10 10 10 10 10 10 10.0 1.8 8 8 65
2Tvorba návrhu ve 3D - Tvorba návrhu stavby 8 8 9 10 10 10 9 9
Projekt
ová
příprav
9.0 6.0 8 3 24
33D model stávajícího stavu Tereain modeling 8 9
Inženýr
ské
sítě,
9 9 9 9Inženýr
ské
sítě,
9Propoj
ení se
stávají
Vytvoř
ení
(nebo
9.0 1.9 7 7 50
4
Společné datové prostředí (CDE) a
integrace s podnikovými systémy- Integrace BIM a ERP 9 9 9 9 9 9 9
Propoj
ení
inform
9.0 4.0 7 5 35
5
Integrace se systémy pro správu a
údržbu (doplnění údajů)
Make FM
documentationIntegrace BIM/FM 9 9
Propoj
ení
inform
9.0 4.0 2 5 10
6Automatizace a robotizace výstavby Control machinery Logistika výstavby 9 9 9.0 6.5 2 3 5
7
Údaje o výrobcích / elementech,
specifikace vlastností7 10 10 10 8 8
Specifi
kace
elemen
8.8 3.0 6 6 35
8
Vytváření výkresové dokumentace z
modelůMake production doc. 2D dokumentace 5 8 9 9 9 9 9
Vytvoř
ení 2D
výkres
8.2 4.0 7 4 30
93D model stávajících inženýrských sítí 5 9
vzniká
v
tomto
9 9 9 8Vytvoř
ení
(nebo
8.2 3.9 6 4 25
10Výkaz množství Make quantity take-off Výkaz výměr 7 8 8 9 9
v
podro
bnosti
9Finanč
ní
sledov
9 6
Podkla
d pro
sestav
8.1 4.9 8 3 26
11Prohlídky, údržby, revize 8 8
Revize
k
dotčen
8.0 2.3 2 6 11
12Záruky 8 8
záruka
koneč
ného
Záruky
k
elemen
8.0 2.3 2 6 11
13Detekce kolizí
Perform consistency
controlDetekce kolizí 5 7 9 9 9 8 7.8 2.0 6 6 35
14Vytvoření konstrukčního modelu Make Struc. BIM model - 8 8 8 7.8 5.4 3 2 7
15Pozemkové vazby (KN) 2 9
stanov
í se
pozem
9
stanoví
se
nejen 9
Jen v
případ
ě změn
9Prokáz
ání
vztahu
7.7 3.0 5 5 23
16
Distribuce informací a řízení dat v
rámci povolování a realizace projektu- - 5 6 8 9 9 9 8 7.6 4.2 7 3 24
17Generování plánu údržby a prohlídek Schedule maintenance - 7
Autom
atické
genero
7.3 4.3 1 3 3

19
- Risk and Hazard Assessment and so on.
2.5 Information requirements and information models
It is necessary to mention that in the first quarter of 2019 there were two international
standards of the ISO 19650 series published. The new BS EN ISO 19650-1 and BS EN
ISO 19650-2 have superseded BS 1192:2007 + A2:2016 and PAS 1192-2:2013.
Nevertheless, they are founded on these standards with just some changes in terminology
(BSI, 2018). Although the ISO 19650 is now the recognised latest version, it will take
some years for the industry and client to adopt this new standard so in this thesis they are
both referred to.
All projects should have a strategy regarding asset management. This brings companies
optimization of the whole life cost of managing assets’ portfolios, better understanding
and awareness of the operational and maintenance needs of assets, better decision-making
regarding projects or assets, better planning on different levels and other advantages.
Initially, the Client (can be also called the appointing party) should have a vision of what
information will be needed to meet goals and objectives of their assets within the project
using BIM technology. These requirements would be passed on the delivery teams and
can be justified by the following purposes:
• A register of assets – to support reporting and auditing
• Risk management support: e.g. for analysing the exposure to natural hazards,
adverse weather events, etc.
• Business questions support: questions concerning ownership and operation of the
asset – information for maintenance and repairs, information needed for day to
day operations of the asset, renovation information, capacity and utilization
management, security and surveillance management.

20
There are different information types and models for the Client to pay attention to. They
are specified in following figure 5 from the new BS EN ISO 19650-1:
Figure 5 - Information models and types (BSI, 2018)
2.5.1 Organizational information requirements (OIR)
According to PAS 1192-3, organizational information requirements (OIR) explain the
information required by an organisation for asset management systems and other
organisational functions (BSI, 2014). These requirements, for example, might include
strategic business operations analysis, asset management strategy, policy-making,
portfolio planning and others. (BSI, 2018)
2.5.2 Asset information requirements (AIR)
Asset information requirements (AIR) are generated based on Organizational Information
Requirements. AIR state the requirements of producing asset information. These
requirements can be divided into three categories: managerial, commercial and technical.
Managerial information might include asset types, identification numbers, location,
warranties periods, inspection schedules, emergency plans and other; commercial
information might contain supplier details, key performance indicators, performance
targets, etc. Technical information is, for example, engineering data, operational data,
interdependencies, parameters. (BSI, 2018)

21
2.5.3 Project information requirements (PIR)
PIR are based on high-level objectives in relation to particular project. It helps the Client
to make further decisions during the key points of the project. For that, a proper set of
information requirements should be prepared for each such point. PIR newly appears in
BS EN ISO 19650, but essentially is an equivalent of Plain Language Questions (PLQ)
from PAS 1192-3, according to the definition of PLQ (BSI, 2014). Both terms pursue the
same goal.
2.5.4 Exchange information requirements (EIR)
The new BS EN ISO 19650 brought a new EIR abbreviation: if before it stood for
Employer’s Information Requirements in PAS 1192-2 (BSI, 2013), in the new standard
it stands for Exchange information requirements. Same as in 2.5.3 these terms correspond
and can be seen as equal.
EIR is a tender document stating the requirements of producing projects information and
can be divided (same as AIR) into managerial, commercial and technical information in
a way that is realistic, achievable, specific and measurable. It serves as the basis for the
Contractor to develop the initial BIM Execution Plan (BEP) (Ashworth,2017). EIR takes
into account OIR, AIR and PIR and these form the basis of the IER.
2.5.5 Asset information model (AIM) and Project information model (PIM)
These models are deliverables of the whole information requirements’ chain. The AIM
and PIM represents repositories of information, which is important for decision making
during the whole life cycle of an asset. Both models can contain structured and
unstructured information. Structural information can be represented by geometrical
models, databases and schedules. Unstructured information would be documentation or
voice recordings.
The AIM is about supporting day-to-day operations and asset management processes, it
can also contribute to the start of the project delivery process (in case of already existing
asset, which is often the case). An example of information contained in the AIM would
be cumulative maintenance costs, ownership details, equipment registers and other
details.

22
The PIM is about supporting the project delivery and the AIM activities. The PIM can
include such information, as project geometry, equipment location, construction method,
costing, scheduling.
2.6 The information delivery cycle
The figure below (figure 6) represents the project and asset information life cycle in the
context of international standards (BSI, 2018):
• ISO 19650 - Organization and digitization of information about buildings and
civil engineering works, including building information modelling (BIM) --
Information management using building information modelling, which has
superseded BS 1192:2007+A2:2016 and PAS 1192‑2:2013;
• ISO 55000 – asset management standards;
• ISO 21500 - guidance for project management;
• ISO 9001 – quality management.
Figure 6 - Generic project and asset information management life cycle (BSI, 2018)
The green circle in the middle is the life cycle for delivery and operational phases of an
asset. Point A would mean start of delivery phase, point B – development of the design

23
intent model into the virtual model; point C – delivery phase end – transfer of meaningful
information to operational phase.
2.7 CDE (Common Data Environment)
It is necessary to set up efficient cooperation between the different parties in construction
projects in order to deliver facilities effectively. A lot of organizations nowadays are
switching to working in new collaborative environments to reach better quality and better
re-use of existing experience. Benefits include higher project teams’ productivity and
accuracy, more effective communication, data sharing without contradictions and loss.
Common Data Environment (CDE) can be used throughout the whole project lifecycle -
design, construction, operation, deconstruction.
BIM dictionary defines Common Data Environment as “a single source of information
which collects, manages and disseminates relevant, approved project documents for
multidisciplinary teams in a managed process” and also “Information within a CDE need
to carry one of four labels (or reside within one of four areas): Work In Progress Area,
Shared Area, Published Area, and Archive Area”
The following figure 7 shows the areas and the workflow of Common Data Environment:
Figure 7 - Common data environment (CDE) schema (BSI, 2018)

24
According to BS EN ISO 19650‑1:2018 each data container should include following
metadata:
- A revision code;
- A status code, which shows the permitted uses of information.
2.7.1 Work in progress
Work in progress, often abbreviated to WIP, is the first area of CDE, which contains
design work that is being developed and has not yet been completed, checked or
approved. It is important that this information is not available to other teams, especially
if a shared system serves as the CDE (e.g. shared server or portal). (BSI, 2018)
2.7.2 Shared
Shared area of CDE represents information, which has been shared with other members
of the delivery team. The main goal of the shared area is to make the information model
development collaborative and productive. The shared data should be visible, but it is not
recommended to make it editable. It is also needed to make sure that one should not
upload the models several times to avoid misleading information as it is being used as
background information by others. If it is necessary to edit the model, it should be
returned to the WIP area for its author to review and reupload. The revision code in that
case would be changed as well. Adequate appointed parties should check and consult
information containers in this state.
The shared area is also being used for sharing data with the appointing party and data
waiting for authorization.
2.7.3 Published
Published container can hold information such as validated design outputs to be further
used for actual construction or asset management. Documents get published status after
being approved or partially approved by the client and can be used for construction.
2.8 Suitability Codes
Suitability Codes or Status Codes are codes that define the purpose of the information
being shared as metadata. The information has a particular status depending on the
container within the CDE: WIP, Shared, Published or Archived. According to BS
1192:2007+A2:2016, the Suitability Codes list is the following (table 1):

25
Code Short description
S0 Work in progress (not for sharing)
S1 For coordination
S2 For information
S3 For review and comment
S4 For stage approval
S6 For PIM Authorization
S7 For AIM Authorization
D1 For costing
D2 For tender
D3 For Contractor design
D4 For manufacturer / procurement
A1, A2, A3, An… Approved and accepted by the client
B1, B2, B3, Bn… Partial client sign-off with comments
CR As Construction Record
Table 1 - Suitability Codes from BS 1192:2007+A2:2016 (BSI, 2016)
BS EN ISO 19650:2, which superseded BS 1192:2007+A2:2016, gives similar status
codes list, except that it does not contain D-codes and contains S5 code – meaning
Withdrawn. Despite that, the new standard states that “This list can be expanded for
project-specific codes and fixed within the project information standard.” These
suitability codes are not only implemented in the CDE, but also can be found in software,
as for example, in Civil 3D UKIE 2 where it can be adapted or used as it is.
2.9 Information and data exchange
The next chapter describes the information exchange on a BIM project and the ways it
could be done effectively. It explains the native and Industry Foundation Classes formats
and structured data (as COBie files).
2 Civil 3D Country Kit for United Kingdom & Ireland. Provides access to country-specific reports and templates.
26
2.9.1 How the data is exchanged
In order to exchange data on a construction project using BIM, each member of the
process that provides information – contractor or subcontractor – needs to clearly know
what is requested from him to provide, when it is requested and how this information will
be used.
During its lifecycle, each construction project will require certain information to be
delivered to the client in certain formats at key points. Key points – sometimes called
“data drops” – represent milestones of the project, that are important for the Client for
analysing of the available information and further decision-making and project
controlling.
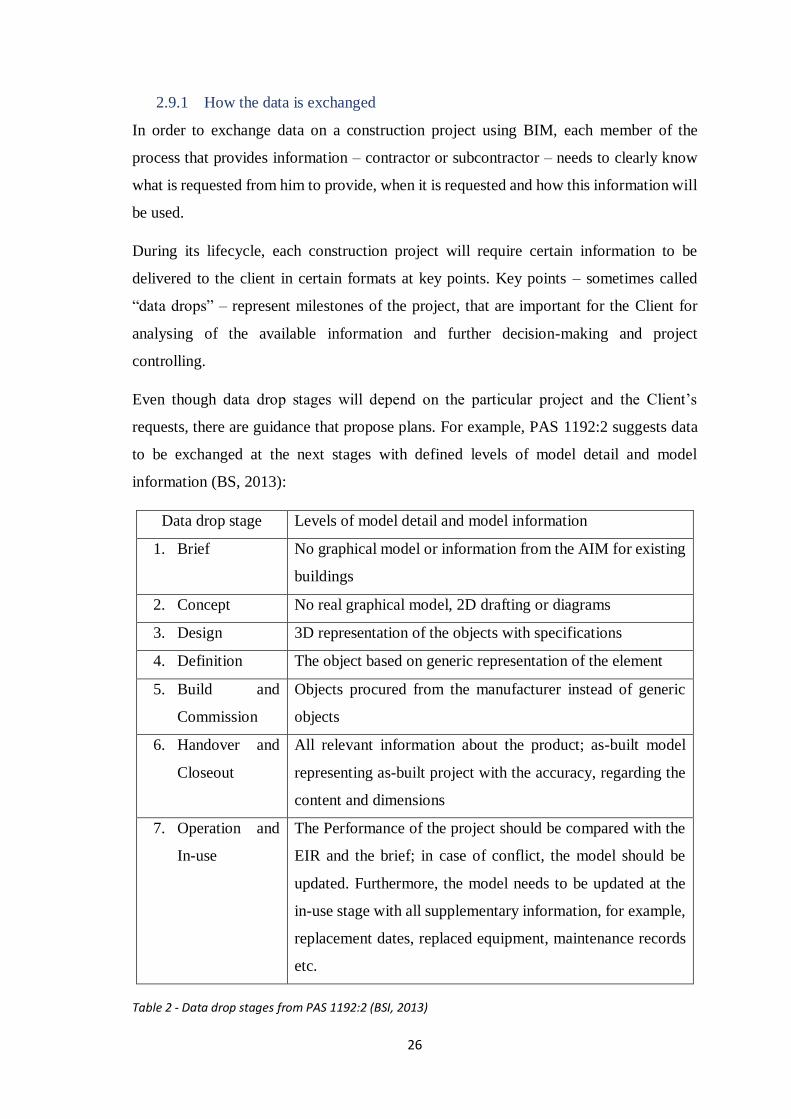
Even though data drop stages will depend on the particular project and the Client’s
requests, there are guidance that propose plans. For example, PAS 1192:2 suggests data
to be exchanged at the next stages with defined levels of model detail and model
information (BS, 2013):
Data drop stage Levels of model detail and model information
1. Brief No graphical model or information from the AIM for existing
buildings
2. Concept No real graphical model, 2D drafting or diagrams
3. Design 3D representation of the objects with specifications
4. Definition The object based on generic representation of the element
5. Build and
Commission
Objects procured from the manufacturer instead of generic
objects
6. Handover and
Closeout
All relevant information about the product; as-built model
representing as-built project with the accuracy, regarding the
content and dimensions
7. Operation and
In-use
The Performance of the project should be compared with the
EIR and the brief; in case of conflict, the model should be
updated. Furthermore, the model needs to be updated at the
in-use stage with all supplementary information, for example,
replacement dates, replaced equipment, maintenance records
etc.
Table 2 - Data drop stages from PAS 1192:2 (BSI, 2013)
27
Via data drop the Client might require models in a native and Industry Foundation Classes
(IFC) formats, structured data (such as COBie files at the relevant stages with data
available) and other timely documents. Both IFC and COBie are described in the further
sections. The Client’s detailed requirements on a project should be specified in EIR,
which was discussed in chapter 2.5
2.9.2 Industry Foundation Classes
Industry Foundation Classes (IFC) is a global standard developed by the buildingSMART
organization with aim of facilitating interoperability in the building industry. In its
common form IFC is a text ASCII file3 (buildingSMART, 2019). IFC can be represented
as:
- An exchange format;
- A data-model;
- Alternative file formats: e.g. IFCXML, IFCZIP
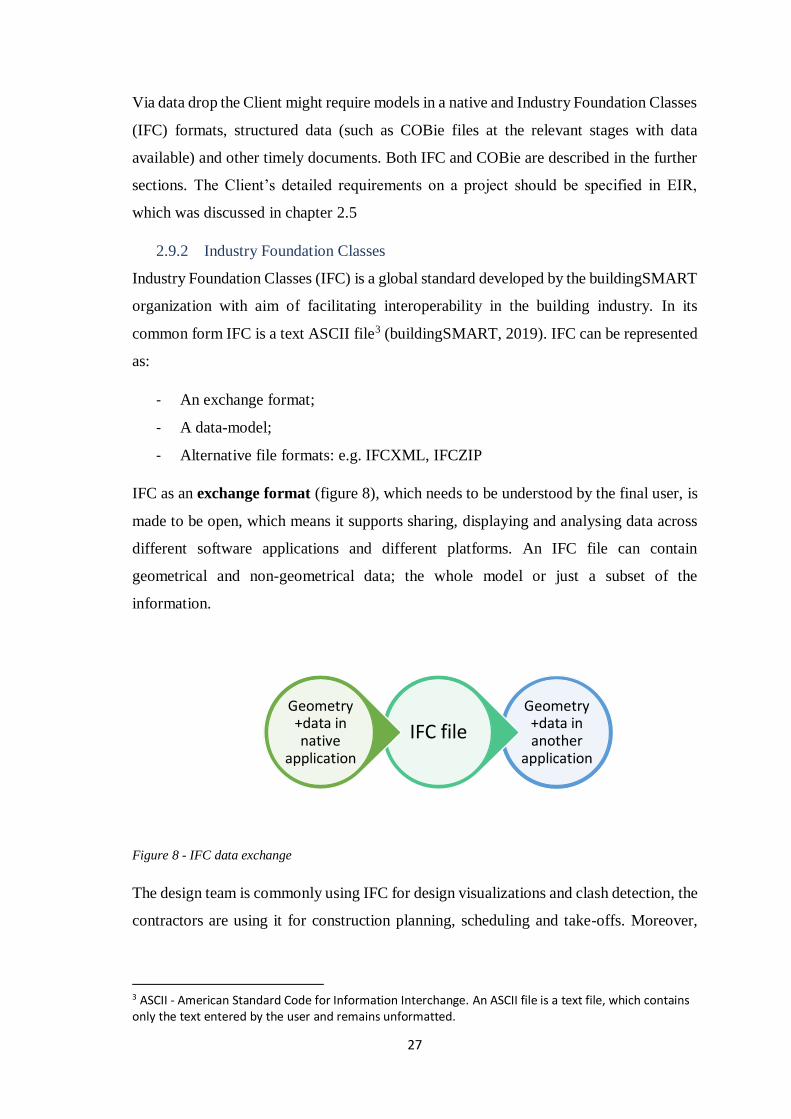
IFC as an exchange format (figure 8), which needs to be understood by the final user, is
made to be open, which means it supports sharing, displaying and analysing data across
different software applications and different platforms. An IFC file can contain
geometrical and non-geometrical data; the whole model or just a subset of the
information.
Figure 8 - IFC data exchange
The design team is commonly using IFC for design visualizations and clash detection, the
contractors are using it for construction planning, scheduling and take-offs. Moreover,
3 ASCII - American Standard Code for Information Interchange. An ASCII file is a text file, which contains only the text entered by the user and remains unformatted.
Geometry+data in another
application
IFC file
Geometry+data in native
application
28
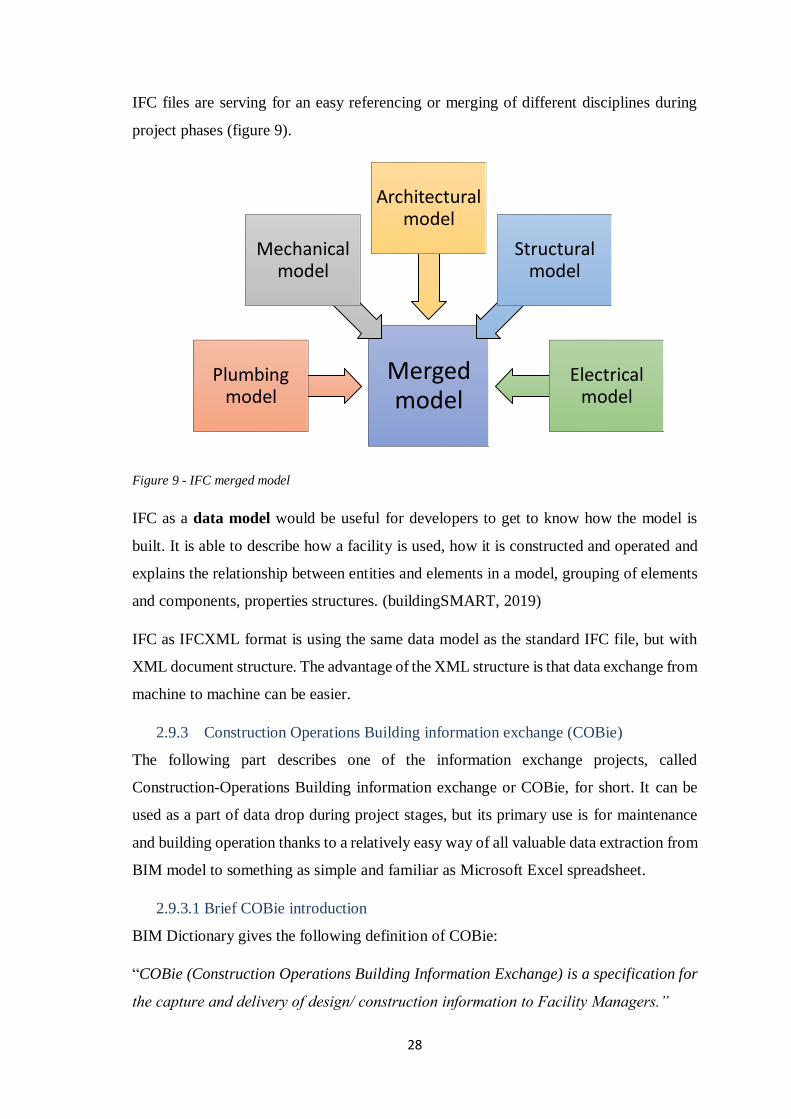
IFC files are serving for an easy referencing or merging of different disciplines during
project phases (figure 9).
Figure 9 - IFC merged model
IFC as a data model would be useful for developers to get to know how the model is
built. It is able to describe how a facility is used, how it is constructed and operated and
explains the relationship between entities and elements in a model, grouping of elements
and components, properties structures. (buildingSMART, 2019)
IFC as IFCXML format is using the same data model as the standard IFC file, but with
XML document structure. The advantage of the XML structure is that data exchange from
machine to machine can be easier.
2.9.3 Construction Operations Building information exchange (COBie)
The following part describes one of the information exchange projects, called
Construction-Operations Building information exchange or COBie, for short. It can be
used as a part of data drop during project stages, but its primary use is for maintenance
and building operation thanks to a relatively easy way of all valuable data extraction from
BIM model to something as simple and familiar as Microsoft Excel spreadsheet.
2.9.3.1 Brief COBie introduction
BIM Dictionary gives the following definition of COBie:
“COBie (Construction Operations Building Information Exchange) is a specification for
the capture and delivery of design/ construction information to Facility Managers.”
Merged model
Plumbing model
Mechanical model
Architectural model
Structural model
Electrical model

29
Facility Managers in this definition are implied to be the last link in the chain as they are
the ones who are operating, maintaining and tracking assets within the building. The
information, that they need in order to do things mentioned above is given by the
construction project participants – designers and manufacturers – and even though it is
developed by highly skilled engineers, it is mostly never used, because it often comes
months or years after the building has been completed and because the data is not in the
easy usable way (e.g. paper boxes, CDs…). In order to ease the data maintenance, COBie
specification was created. COBie allows to transmit the important information from each
significant project participant in required structure in accordance with internationally
recognized standards. (East, E. William, 2012)
But before this information reaches Facility Manager or the Client, it is passed between
construction parties during different project phases and can be also used for various
purposes. Examples of applications of COBie for the Designer can be data and schedules,
for the Contractor – procurement of materials, project controlling and tracking.
2.9.4 COBie as a deliverable
How to maintain COBie is explained and well-defined in BS 1192-4:2014 “Collaborative
production of information. Part 4: Fulfilling employer’s information exchange
requirements using COBie – Code of practice” in a form of guidance.
The advantage of COBie is that it provides structured data. The scope of exchange should
be always defined by the Client, when the data exchange is required and by whom it
should be delivered.
COBie can be used both for infrastructure and building with several changes in terms. In
both cases there is asset (spatial + physical), operational and supplementary information.
Asset information consists of such segments as:
• Component – both for buildings and infrastructure;
• Facility – both for buildings and infrastructure;
• Floor (region) – the first one for buildings, the second one for infrastructure;
• Space (location) – the first one for buildings, the second one for infrastructure;
• System – both for buildings and infrastructure;
• Type – both for buildings and infrastructure;
• Zone – both for buildings and infrastructure;

30
Operational information includes as follows:
• Job – both for buildings and infrastructure;
• Resource – both for buildings and infrastructure;
• Spare – both for buildings and infrastructure;
Supplementary information includes as follows:
• Assembly – both for buildings and infrastructure;
• Attribute – both for buildings and infrastructure;
• Connection – both for buildings and infrastructure;
• Contact – both for buildings and infrastructure;
• Coordinate – both for buildings and infrastructure;
• Document – both for buildings and infrastructure;
• Impact – both for buildings and infrastructure;
• Issue – both for buildings and infrastructure.
For the greatest efficiency and benefitting from COBie, it is recommended to integrate it
to the whole life cycle (as part of data drops). To generate such a data drop, several ways
exist: manual, which can be suitable for manufacturers, but hardly for the whole project;
directly from the native model – the most exact information; and indirectly from the native
model via IFC – should be possible to produce a COBie dataset from an IFC model.
2.9.5 The relation between IFC and COBie
COBie might be understood as a subset of the buildingSMART data model, known as
IFC. Both formats contain the relevant data about an asset, the difference is that COBie
has data more focused on the operational phase of a project and therefore the data is more
limited.
Thus, IFC files can be used for the generation of COBie “data drops”, however, there are
many challenges related to that. A trial held by National Building Specification (NBS) in
the UK in 2012 showed several issues that need to be resolved. The purposes of the trial
were to find out whether the IFC file is suitable for making a “data drop”, whether there
are data losses and whether it can work in the real life. The test involved four phases:
receiving and validating the IFC files; giving a report on the outcome; revalidating the
corrected IFC file; producing the COBie spreadsheet out of the corrected file. The
feedback given by the participants (such as VINCI Construction UK Ltd, Skanska, BAM,

31
Carillion and other contractors) showed the positive attitude towards this way of data
exchange with several questions regarding COBie, like clearance in required level of
detail, object naming, a single classification scheme, and a data storage. The participants
described weak moments of the process that should be strengthened: IFC import/export,
which causes the manual checking; the absence of well-defined model view definition for
each COBie data drop; a lot of manual work with MS Excel output.
2.10 Software used
2.10.1 AutoCAD Civil 3D
AutoCAD Civil 3D is a computer program developed by the American software
corporation called Autodesk. It is highly used for civil engineering projects and supports
Building Information Modelling workflows. Civil 3D is built on AutoCAD’s base and
has all its features.
What is possible to create with Civil 3D:
- Highways, tunnels, solid structures;
- Utilities networks;
- Surfaces;
- Storm analysis;
and other infrastructure designs.
How it is used for the thesis project: it is the starting point of the workflow, which is
discussed in the practical part of the thesis. The project represents the civil linear structure
and different parts are modelled in this software. Civil 3D plays an important role in the
process as it is not only used for designing, but also for adding the important data for
construction, planning and maintenance.
2.10.2 Navisworks
Navisworks is another program developed by Autodesk corporation. It is primarily used
for 3D models’ viewings and coordination, allowing to add mark-ups, comments,
measurements and save viewpoints, so later it can be shared with another project party.
Navisworks is notable for its support of a broad range of file formats, including DWG
(AutoCAD), DGN (MicroStation), RVT (Revit), 3DS (3D Studio Max), IFC (IFC – open
format) (Autodesk, 2017).

32
Some other features Navisworks has:
- Clash detection – is a very used feature of the program. Allows to find clashes
within the same model or by testing out different models;
- TimeLiner – brings in 4D simulation of the process of construction or demolition
with using time frames and activities;
- Animator – allows to create animations in the model (e.g. walk-through);
- Quantification – quantity take-offs and estimations.
How it is used for the thesis project: the program is not used for any of its primarily
functions, but as a provider for a COBie extension.
2.10.3 Microsoft Excel
Microsoft Excel is a well-known and used spreadsheet application by Microsoft
Corporation serving for data creation, calculations, organizing, formatting, visualizations
and other data management processes.
How it is used for the thesis project: it plays a role of a conductor between COBie and
Power BI, which is the last point of the whole workflow. Excel spreadsheet contains all
data that Power BI „looks” into and as soon as it is renewed or changed, Power BI will
reflect it.
2.10.4 Power BI
Power BI is a cloud-based business analytic service developed by Microsoft Corporation
enabling to make analysis and interactive visualizations to most kinds of data. It is aimed
to be simple, so the users can interact with it and create their own dashboards and reports.
The service consists of different components:
- Power BI Desktop (used for designing and publishing reports);
- Power BI Service (used mainly for sharing reports within the company
environment);
- Power BI Mobile (an application) and several others. (Microsoft, 2019)
In many ways Power BI looks like Excel, but they have some core differences (EDUCBA,
2019):
- Power BI is intended to be easy to use comparing to Excel – it has more user-
friendly interface;

33
- While staying simple, Power BI is focused on building potentially complex data
models easily;
- Power BI is providing many visualization tools and customized dashboards for
sharing, while Excel is not primarily used for these purposes;
- Power BI is capable of handling bigger datasets, comparing to Excel;
- Power BI allows to make a cross-filtering between charts, while Excel does not –
data analysis becomes more understandable for the final user
How it is used for the thesis project: only Power BI Desktop was used as it is base for
data construction. It consisted of the following processes shown in figure 10 (Lorenz,
2019):
Figure 10 - Workflow within Power BI (Lorenz, 2019)
Data preparation
•Editing data according to the targets
Data modelling
•Establishing relationships between data, additinal
calculations and data view
Data Vizualization
• Creating dashboard and reports

34
3. The practical part
The second part of this thesis focuses on data creation, transferring and harvesting across
different project parties in infrastructure projects. It is based on a real project of an
engineering consulting company with partly simulated data with the aim of establishing
workflows, better data control and increasing their visibility. This part represents a
proposal for a discussed below project which is very big on its scale and about to be
considered to be applied in reality.
3.1 About the chosen project
3.1.1 Basic information
- Name: North-South Corridor (NSC)
- Location: Singapore
- The Client: The Land Transport Authority (LTA)
- The Contractor: Penta-Ocean Construction Co Ltd – Bachy Soletanche Singapore
Pte Ltd Joint Venture (PBJV)
- Budget for N105 segment: about S$795 million
- Works commencement: the first quarter of 2019
The chosen project located in Singapore is called North-South Corridor (NSC) and
approximately 21.5 km in length, of which approximately 12.5 km is underground cut-
and-cover tunnel. It is an expressway, mainly underground, with bus and cycling lanes
created to connect towns in the northern region (starting from Admiralty Road) to the
city centre (ending at East Coast Parkway) (LTA, 2018). On the following pictures there
are several visualizations of the NSC (figure 11 and 12):

35
Figure 11 - North-South Corridor – Visualization 1 (LTA, 2018)
Figure 12 - North-South Corridor – Visualization 2 (LTA, 2018)
The whole project has been divided between different parties to construct and this thesis
focuses on one part of the Corridor – N105, which can be seen below in figure 13. It is
a 1.04 km-long tunnel and commuter facilities project along Thompson Road. The thesis
makes an accent on variety of pipe networks going along with the tunnel.

36
Figure 13 - Location map of NSC alignment (LTA, 2018)
The closer alignment of N105 contract is on the picture below (figure 14):
Figure 14 - Location map of NSC tunnel between Suffolk Walk and Novena Rise (LTA, 2018)
3.1.2 BIM objectives and deliverables
The project delivery system chosen is Design-Build (D-B), which means that both
design and construction are delivered by the same party. One of the main D-B system
advantages in this case is that it allows the contractor to create a design with the
application of experience gained before, so that the Client carries less risks.

37
The project is also using BIM technologies, as it is very hard to coordinate and control
all the various disciplines using just traditional 2D drawings, as there are tunnel and road
structures, electrical and utilities networks to be designed, including abandoned and
existing. Using BIM models will allow to make it easier to control and detect collisions
of different networks and change it on time.
Among further key objectives are the design improvement, improving communications
with the client, working in collaborative environment, better control of the design
through the CDE and safe construction.
3.2 Project design
The project design consists of several disciplines and for each of them there was a
separate 3D model created to be later combined into one Building Information Model –
so called federated model. This model for NSC N105 includes architectural, electrical,
geotechnical, drainage, gas, tunnel & structural models. Below, in figures 15 and 16,
there are snapshots of the designed model:
Figure 15 - Project Layout (Autodesk Navisworks)

38
Figure 16 - Federated Model (Autodesk Navisworks)
3.3 Scope of work in thesis
In the thesis I have chosen to take the utilities model and apply the appropriate workflow
to it in order to achieve the better visibility of the data leading to the better construction
control for the Project Manager. The important point of my practical part is that COBie
is used for the continuous following of the project. It should be noted that COBie is not
used for an asset management, which is the most common practice. The reason behind
that is the lack of information for asset management for this moment.
3.4 Considered workflow
At the beginning, there was a question of which programs and software to use for the
project process. As the model was created natively in Civil 3D and the company has its
license, I have decided to keep it as a starting point.
The next step was to choose where to transfer data. I was considering InfraWorks and
Navisworks, both developed by Autodesk. A big advantage of Infraworks is its
capability of processing large amounts of data and being suitable for linear structures.
But as it is not compatible with COBie, which is an important element of the workflow,
I have chosen to work with Navisworks over InfraWorks.
Another reason for choosing these programs is that the company employees – especially
draftsman and designers – constantly attend trainings and courses aimed at improving
the workers’ efficiency and understanding of the software.

39
Furthermore, the CDE should be taken into consideration. ProjectWise is an established
CDE within the project and it is better to use programs, which are already being used by
the project team. CDE is not mentioned in the workflow as it is a pillar of the process.
The company is equipped with all programs mentioned above, so it is not a problem to
use them. Company equipped software licences are not bound to any data limit.
3.5 Proposed workflow
As a result of previous considerations, the final workflow is as follows (figure 17):
Figure 17 - Proposed workflow for this thesis
Basic data, which can be useful for managing the project during construction phases and
asset management phase will be taken from Civil 3D – e.g. pipe ID, material, length,
network and others. Additional data, which varies for every project and cannot be
measured by software (e.g. pipe network owner, installation date planned and actual,
cost and more), will be created and added manually as extended data in order to be filled
by any construction party related.
All data needed for the project then will be transferred to Navisworks software, which
is primarily used for 3D design simulation and coordination.
COBie extension, which is originally not part of the software needs to be installed and
integrated into Navisworks, so all data from Civil 3D can be transferred to it. The
Civil 3D
•Model
•Data + extended data
Navisworks
•Transferring C3D model
COBie
•Extracting data to COBie extention
.xls format
•Data transfer to Excel
Power BI
•Data transfer to Power BI

40
following step would be to export it to .xls format document and finally to put the data
into Power BI business analytics service.
Understandably, the suggested workflow has its pros and cons and can be adopted as
needed according to different project arrangements. As one of examples, there might be
no extended data added in the Civil 3D and the COBie input data could be filled on the
side by the contractor/subcontractor/any other party involved and then imported to
COBie. The following steps would remain the same (figure 18):
Figure 18 - Alternative workflow
3.6 Project assumptions
The following assumptions were taken for the practical part of the thesis:
- The project data will be updated monthly by the awarded Contractor;
- The project progress will be tracked and updated monthly by the Project Manager
via Power BI;
- The abandoned networks are not assumed to be pulled out of the ground or to be
interacted with in any way – they are modelled for the purpose of project
coordination;
- The existing networks are not intended to be interacted with – they are modelled
for the purpose of project coordination;
- The main focus will be on existing networks data;
Civil 3D
•Model
Navisworks
•Transferring C3D model
COBie
•Extracting data to COBie extention
.xls format
•Data transfer to Excel
Power BI
•Data transfer to Power BI
Data filled
by the
project party
by using the
template

41
- The construction will start with the proposed sewer as it is the deepest one to
build
3.7 Process
3.7.1 Data and extended data in Civil 3D
The model I have chosen for analysis has been originally created in Civil 3D. There were
several pipe networks modelled and then referenced into the separate drawing for the
thesis’ purpose (figure 19):
Figure 19 - Pipe networks considered in this thesis3D pipe network model (AutoCAD)
The pipe networks have the relevant layer colour (agreed with the Client in advance),
according to the type of network. Yellow was picked for the abandoned networks, for
the existing it is blue and red for the proposed. The following networks on this part of
the NSC project were requested to be modelled (figure 20):

42
Figure 20 - Pipe networks considered in this thesis (AutoCAD)
All data from the properties in Civil 3D are going to be imported into Autodesk
Navisworks, but not all of them are important for the Project Manager or the Client.
There are also non-geometrical data that needed to be received from the
Contractor/Subcontractor for the project control and further asset management and as
can be seen in the chosen workflow, these additional non-geometrical data will be added
right in the Civil 3D model, as the software allows to do it easily.
There is an “extended data” tab in the properties section and this is where the additional
data is added. At first, I added such custom data, as cost, planned installation date: day,
month, year; real installation date: day, month, year; planned and actual finish dates. The
table can be further extended with any other data that might be required (figure 21).
Figure 21 - Extended data in AutoCAD (AutoCAD)

43
Besides the supplementary data, there is already existing property set called “Suitability
Codes”4, which is going to be used for tracking down the networks’ parts status (figure
22).
Figure 22 - Suitability Codes in AutoCAD (AutoCAD)
3.7.2 Suitability Codes used for the project
For the project purpose I have decided not to use all codes given in the Civil 3D software
due to extra complexity it may bring. Also, I modified codes S1 and B1 description for
this thesis purpose. these are the codes (table 3) I used for the progress tracking:
Code Description Note
S0 Initial status or WIP Design ongoing, pre-approval
(either from designer or authority)
S3 Delivered to Client Waiting for the Client’s approval
A1 Approved Approved by relevant authority
and can be built
B1 Being constructed In the process of construction
CR As Construction Record Asset has been built and verified
that it is built in accordance with
design
Table 3 - Suitability Codes used for thesis purpose
4 UKIE Template is used - Civil 3D Country Kit for United Kingdom & Ireland.

44
3.7.3 Navisworks and COBie processes
After all extended data property sets are prepared in Civil 3D, the Contractor can fill up
the data available after the first month and a data drop for the Client can be created.
The updated utilities model can now be exported from Civil 3D as solid objects and
imported to Autodesk Navisworks. The Navisworks solid object model retains its
intelligence and this data can be extracted using a COBie plug-in developed by Autodesk
(figure 23).
Figure 23 - The model in Navisworks (Autodesk Navisworks)
The initial problem with COBie is that COBie was designed mainly for structural,
mechanical and electrical disciplines where software and processes have been developed
to provide automated COBie format exports from Revit models. In other words, COBie
was developed for use on buildings, rather than infrastructure and, therefore, the
information is needed to fit into the structural data drop format, even though COBie
might not always be aligned with the structure of such infrastructure projects. It is
important for the real application of this workflow to the case.
For a simulation I used only Type segment. At first, it was necessary to decide which
information is required, or in case of this thesis, wanted to be extracted to COBie
spreadsheet for further needs and amendments. I decided to extract the following
geometrical basic information:
- Item name
- Description

45
- Layer
- Length
- Material
Also, I decided to take the following non-geometrical information:
- Status (Suitability code);
- Planned and actual start day;
- Planned and actual start month;
- Planned and actual start year;
- Planned and actual finish day;
- Planned and actual finish month;
- Planned and actual finish year.
I created and configured a new data drop template by filling in the relevant asset
properties from the model data into each data section of the template (figure 24).
Figure 24 - COBie template (Autodesk Navisworks)
As I mentioned before, I used only Type segment of the template as I do not need much data
exported for the further work (figure 25):

46
Figure 25 - COBie template configuration (Autodesk Navisworks)
When it was completed, the data were loaded from the model into the COBie format
spreadsheet (figure 26).
Figure 26 - COBie spreadsheet in Navis (Autodesk Navisworks)
Finally, the COBie spreadsheet was extracted to Excel for checking (figure 27). It is
important to mention, that as it is a simulation for the thesis, the columns can easily be

47
renamed after the data are imported into the COBie format spreadsheet (if there are no
relevant columns in COBie configuration template) without an agreement with the
Client, in reality it would need to be discussed and agreed in advance.
Figure 27 - COBie spreadsheet in Excel (Microsoft Excel)
The further step is to transfer data from Excel to Power BI service. As Power BI is the
final point of the workflow, I decided to make all data modifications there rather than in
Excel spreadsheet.
3.7.4 Power BI
Power BI is a relatively new program. As was mentioned before it has a lot of analytical
functions and data visibility tools. The possibilities Power BI provides are immense and
diversified. I mainly focused on visualising two significant points which matter during
the construction phase of the project: time and costs.
I have intended to create several dashboards with different content:
1) One with the project overview – for informative purposes;
2) Another with the project time and costs tracking – for control purposes;
3) A final one with the data status tracking – for control purposes.
3.7.4.1 Data preparation
Data preparation is the first out of three steps to go through in Power BI application. It
is about importing and modifying data in order to make further work with data smoother.

48
It allows to take data from many different sources, like Excel, SQL Server, Web, Power
BI datasets and so on. I, in this thesis, use only Excel files as a source.
At first, I linked to Power BI an Excel file containing the full dataset for the project
overview (for the first dashboard). This data is organised in a data table in Power BI and
I only left the necessary columns: pipe name, description, network, length and material.
Such a table in Power BI is called a query – it requests information from the source, in
this case it is the Excel file, and returns the result as a table.
The query looks as follows (figure 28):
Figure 28 - Basic information query (Power BI)
For the overview I decided to leave all pipe networks data. It means that I included
abandoned and existing networks, in spite of the fact that they have been modelled for
coordination purpose only. It is mentioned on the dashboard, named “Overview”.
For the next dashboard this information is irrelevant, so as a following step I deleted the
abandoned and existing networks data from the Excel file and reuploaded it into Power
BI. The main table contains such data as a pipe name, description, network, lengths, start

49
dates planned and actual, finish dates planned and actual (January through May), cost
per given length. Some data needed to be modified – it is important for further work.
For example, dates added in AutoCAD extended data resulted in three different columns
(day, months, year) for each of the following: planned start date, actual start date,
planned and actual finish dates. In Power BI I needed to merge the day, month and year
columns to create one and mark it as “date” data type (figure 29).
Figure 29 - Proposed networks query (Power BI)
Next, I imported the table from Excel with all project suitability codes for five months
to show the changes in statuses timewise and moneywise. The query snapshot is shown
in figure 30:
Figure 30 - Suitability codes query (Power BI)
I also created a date parameter to make reports dynamic. As my work is focused on time
and costs tracking, I created a list of five dates, which are supposed to show the state of
the project according to the chosen date. The project has started in the first quarter of

50
2019 and five months have passed until the moment of writing the thesis (May 2019).
The parameter list is shown in figure 31 below:
Figure 31 - Parameter configuration (Power BI)
After these modifications I considered data ready for the next step, which is a data
modelling.
3.7.4.2 Data modelling
Data modelling is an important and probably the most complex stage of Power BI
program as it involves additional calculations, measurements, data relationship
establishment and coding (using DAX language, which is a library of functions and
operations that can build the formulas). The complexity of modelling stage depends on
what is required to be shown in a report.
For the first query “BasicInfo”, which contains data for the first dashboard (Overview)
only, I added a measure of the total length of each pipe network or the sum of all
networks, which can be seen in figure 32:

51
Figure 32 - Formula correcting the length format (Power BI)
The reason to that is the wrong format that Power BI was showing by default. There is
a comparison below (figure 33). On the left, there is a format that is by default, and, on
the right, there is a format needed:
Figure 33 - Default format versus the right format (Power BI)
This is the only thing that I added in this table.
Next, the main data query which I called “ProjectData”, required more modelling. As
there is a time factor, several columns were added:
• Parameter date column – represents the added earlier parameter with a date
which I want to use as a milestone to track the progress and costs;
• Logical test 1, which says: if a compared date greater or equals planned finish
date, then put 1 in a cell, if not – 0;
• Logical test 2, which says: if a compared date greater or equals actual finish date,
then put 1 in a cell, if not – 0.
An example can be seen below in figure 34:
Figure 34 - Data modelling: logical tests (Power BI)

52
After that I created the table which represents the project completion and refers to the
main data table. I named it “ProjectCompletionTable”. The first columns are about a
date (figure 35). They return the earliest planned start, actual start, latest planned and
actual end. Later, it is easy to construct the simple schedule out of these data.
Figure 35 - Project completion table: part 1 (Power BI)
Next five columns refer to the “ProjectData” table as well (figure 36). Thanks to that,
the percentage of planned and actual completion can be seen and analyzed.
Figure 36 - Project completion table: part 2 (Power BI)
The last five columns are about the project costs (figure 37). It gives the total value of
each network costs and compares planned and actual costs. Two last columns show the
percentage of the whole project completion planned and actual.
Figure 37 - Project completion table: part 3 (Power BI)
Regarding the “Statuses” query, I added several formulas to take the relevant length
and cost value when the parameter date equals the relevant date in the table (figure 38
and 39).

53
Figure 38 - Data modelling: adding the formula to return the value of length (Power BI)
Figure 39 - Data modelling: adding the formula to return the value of costs (Power BI)
The data modelling is finished, and the data is prepared for the next step which is the
visualization.
3.7.4.3 Data visualization
Data visualization is the last step of working with Power BI. It is about revealing insights
that have been found in the data and constructing dashboards and reports in a way that
is easy to navigate, analyse and understand. There are a lot of useful visuals that are built
into the program and can be used directly from Power BI pane. Visuals are the tools
helping to create various charts, schemas and graphs (figure 40).
Figure 40 - Power BI visualizations (Power BI)
In the first page I constructed a simple project overview dashboard and visualized the
pipe networks information. There are four visualizations:
• Each pipe network length chart (“clustered column chart”);

54
• A list with all the networks (“table”);
• A card, which sums up each pipe network length (“card”);
• Material (“pie chart”).
The snapshot below (figure 41) contains all visualizations mentioned above:
Figure 41 - Project overview dashboard (Power BI)
Closer snapshots (figure 42 and 43):
Figure 42 - Project overview: pipe networks and lengths (Power BI)
Length sorted by pipe network pipe network pipe network length
pipe material

55
Figure 43 - Project overview: pipe materials and the note (Power BI)
The visualizations are interactive, and by pressing on any network on the list or in the
graph the relevant information will be highlighted. In the case below, N105 Gas Existing
pipe network is chosen (figure 44). Therefore, all other visualizations are showing the
relevant values:
Figure 44 - Project overview dashboard interactions (Power BI)

56
The second dashboard of the project is called “The main dashboard”. The content of
the board is the following:
• a card, which shows the date – parameter;
• a simple Gantt chart from the table created during the data modelling phase
(“ProjectCompletionTable”);
• Clustered bar chart, where I put the percentage of planned and actual completion
as values; the advantage of this chart is that it allows to add and visualize two
values at the same time;
• A clustered column chart, with actual and planned costs as added values. As well
as a clustered bar chart, it allows to add more than one value to the same chart
and hence to better visualize the differences;
• Several cards showing the percentage of completion and costs changes.
The overall dashboard is shown below (figure 45):
Figure 45 - Main project dashboard (Power BI)
On the top, there is a visual called Gantt Chart (figure 46). Gantt chart represents a
simple orientation planned schedule of each proposed pipe network. The indicator in
the schedule always shows the actual date.
Gantt chart
Completion
information
Date = parameter
Completion
chart
Costs chart
Costs information

57
Figure 46 - Gantt Chart (Power BI)
On the next chart there is a percentage of completion shown for each network (figure
47). Up to the February 1 of 2019, there was only sewer started:
Figure 47 - Clustered bar chart (Power BI)
However, if one will change the date, the chart will change accordingly. Unfortunately,
there is no method in Power BI to change it by the user input directly from the dashboard
at the moment. To choose another date is possible through editing the parameter(figure
48):
Figure 48 - Editing the parameter (Power BI)
actual
planned

58
The list of dates which I was creating as part of the data preparation stage will drop
down so the needed date can be selected (figure 49):
Figure 49 - Parameter’s drop-down (Power BI)
Now, after I have selected a different date and applied changes, the clustered bar chard
has changed and shows the completion up to April 1 of 2019, which is shown in figure
50:
Figure 50– Completion chart (Power BI)
Change of a date shows
changes in completion

59
The next important chart represents costs of the project – according to planned
expenditures and according to actual. Same as completion, it changes with every
month passed (figure 51).
Figure 51 - Costs chart (Power BI)
The user can interact with the chart on the dashboard thanks to all the relationships
within the database (figure 52). The dashboards are therefore dynamic.
Figure 52 - Data relationships (Power BI)
Change of a date shows
changes in costs

60
In figure 53 below there is an example of how relationships work. When the user presses
any entity on one of the charts, in this case N105 Raw Water Proposed DN150, it
highlights the relevant data, the others are faded. Gantt Chart is changed – now it is
showing only schedule for the chosen pipe network. The costs are changed as well,
according to what is relating to the chosen pipe network.
Figure 53 - An example of values' changing (Power BI)
The third dashboard is called “Statuses” and it contains the information about suitability
codes. There are such visualizations as:
• A card with the date – parameter;

61
• Pie chart, which represents all statuses in relevant proportions;
• Clustered chart, which shows the costs equivalent for each pie chart proportion;
• Clustered chart showing the amount of statuses for the relevant months;
• Clustered chart showing the correlation between status and the network length;
• A table with pipe network name, costs and length for better structuring and
information.
The overall dashboard is shown below (figure 54):
Figure 54 - Suitability Codes dashboard (Power BI)
The suitability codes (which were described in part 3.7.2 Suitability Codes) are used in
this work for showing the status of each pipe, so it is possible to track the changes and
control if everything is going according to the schedule. The status change might show
the efficiency and signalize a possible stoppage or possible problems. As in previous
dashboards, the data are interacting with each other in a dynamic way and changing
relevantly according to the chosen date parameter.
On the example below, the chart shows the count of codes up to April 1,2019 (figure
55). I have chosen one suitability code for demonstration – A1-Approved (figure 56).
Pie chart with count of statuses
Count of each
status
Date =
parameter
Costs by each
pipe network
Each network length
Information table

62
Figure 55 – Suitability Codes state by April 1,2019 (Power BI)
Figure 56 – A1-Approved Suitability Code chosen (Power BI)
When chosen, the corresponding data is highlighted. The table on the right now contains
different data in figure 56. The bar charts below are also showing the corresponding
data.
Costs chart was changed according to A1-Approved status and is showing how much
costs in each pipe network have A1-Approved status (figure 57). The total sum can be
seen on the table in figure 56.
Figure 57 – Cost chart before and after choosing A1-Approver Suitability Code (Power BI)
Chosen code – A1-
Approved

63
The next bar in figure 58 chart represents the count of each Suitability Code. The sum,
therefore, would show the total number of pipes in the project. When A1-Approved status
is chosen, the chart will only highlight the appropriate bar, because this chart already
contains statuses only for chosen month.
Figure 58 – Statuses chart before and after choosing A1-Approver Suitability Code (Power BI)
The last chart in figure 59 shows each pipe network length and how it is reflecting the
chosen A1-Approved status. It can be seen, for example, that for April 1 of 2019, 1758m
out of 2153m of Raw Water Proposed DN700 network contains A1 status.
Figure 59 - Lengths chart before and after choosing A1-Approver Suitability Code (Power BI)

64
4. Conclusion
In the last part of the thesis I would like to share the conclusions I came to while working
on this project. I was exploring the proposed workflow which I developed in a way
which enables data creation and data transfer from a BIM authoring software to the
Power BI analytics service in order to achieve greater visibility and better decision-
making. The workflow was validated on the infrastructure project with a mix between
real and simulated data.
The process requires quite a lot of manual work: it is needed to constantly update data,
whether it is every day, week or month (or otherwise depending on the agreement). One
can be required to update the data in a BIM model software and then it is necessary to
repeat the whole process up to the Excel spreadsheet stage. The latter is linked to Power
BI and to complete the process one has to press a refresh button in Power BI to transfer
all newly updated data. In a simpler version of the process, data can be updated directly
in an Excel file. However, this way is not as straightforward as the previous as the Excel
file contains many spreadsheets with thousands of lines.
The whole process needs to be discussed with all involved project parties before the
project commencement, so that they have a clear understanding of what they should
focus on and at what stage the data is required to be transferred to another party – e.g.
from subcontractor to the general contractor.
I used the data simulation for the construction stage of the project, however, data for
asset management can also be added into Power BI for better facility management and
assets maintenance. Visualised maintenance data would provide easier orientation and
tracking rather than standard COBie spreadsheet.
The main advantage that this workflow brings, is a great overview and knowledge about
data for the Project Manager, that one could not have before. Thanks to the greater
visibility and data tracking, Power BI is enabling to control project costs, schedule and
completion, to anticipate potential problems, reduce risks and apply appropriate actions.
In the end, as far as I am concerned, it would definitely be worth going beyond
simulation and applying the process to the case.

65
List of references
ASHWORTH, Simon and Matthew TUCKER. Employer’s information requirements
(EIR). Template and Guidance: Facilities management and client operating requirements
in the Building Information Modelling (BIM) process. The UK: The British Institute of
Facilities Management, 2017. ISBN 978-1-909761-27-8.
AUTODESK INC. AutoCAD [software]. Available:
https://www.autodesk.com/products/autocad/overview
AUTODESK, INC. Autodesk Navisworks 2017 Solutions [online]. [cited 2019-04-01].
Available:
https://knowledge.autodesk.com/sites/default/files/Navisworks%202017%20-
%20Supported%20Formats%20and%20Applications_V3.1.pdf
AUTODESK INC. Autodesk Navisworks Manage 2018 [software]. Available:
https://www.autodesk.com/products/navisworks/overview
AUTODESK INC. COBie Extension for Navisworks [software extension]. Available:
https://www.biminteroperabilitytools.com/cobieextensionnavis.php
Building in Cloud [online]. [cited 2019-05-16]. Available:
https://www.buildingincloud.net/en/bim-collaboration-2/
BuildingSMART. IFC Technology [online]. [cited 2019-03-17]. Available:
http://www.buildingsmart-tech.org/specifications/ifc-overview/ifc-technology
BuildingSMART. Industry Foundation Classes [online]. [cited 2019-03-17]. Available:
http://www.buildingsmart-tech.org/ifc/
COMPUTER INTEGRATED CONSTRUCTION RESEARCH PROGRAM. (2011).
BIM Project Execution Planning Guide – Version 2.1. The Pennsylvania State University,
University Park, PA, USA.
CONSTRUCTION PRODUCTS ASSOCIATION and NBS. BIM for the terrified. A
guide for manufacturers. The UK, 2013. ISBN 978-1-909415-03-4.
EAST, E. William (2012) Construction-Operations Building information exchange
(COBie), buildingSMART alliance, National Institute of building Sciences, Washington,
DC. [cited 2019-04-25]. Available: http://www.nibs.org/?page=bsa_cobie

66
EASTMAN, Charles M. BIM handbook: a guide to building information modelling for
owners, managers, designers, engineers and contractors. 2nd ed. Hoboken, NJ: Wiley,
2011. ISBN 978-0-470-54137-1.
EDUCBA. Power BI vs Excel [online]. [cited 2019-04-01]. Available:
https://www.educba.com/power-bi-vs-excel/
KUMAR, Bimal. A practical guide to adopting BIM in construction projects. Dunbeath:
Whittles Publishing, 2015. ISBN 978-184995-146-3.
LAND TRANSPORT AUTHORITY. North-South Corridor [online]. 2018 [cited 2019-
04-05]. Available: https://www.lta.gov.sg/content/ltaweb/en/roads-and-
motoring/projects/north-south-corridor.html
LAND TRANSPORT AUTHORITY. LTA Awards Contract for North-South Corridor
Tunnel between Suffolk Walk and Novena Rise [online]. 2018 [cited 2019-04-05].
Available:
https://www.lta.gov.sg/data/apps/news/press/2018/20180731_NSC_tunnel_loc_map_A
nnexA.pdf
LAND TRANSPORT AUTHORITY. LTA Awards Contract for North-South Corridor
Tunnel between Suffolk Walk and Novena Rise [online]. 2018 [cited 2019-04-05].
Available:
https://www.lta.gov.sg/data/apps/news/press/2018/20180731_NSC_alignment_loc_map
%20_AnnexB.pdf
LORENZ, Manuel. Microsoft Power BI - A Complete Introduction [video], 2019. [cited
2019-04-01]. Available: https://www.udemy.com/powerbi-complete-introduction/
MCPARTLAND, Richard. BIM dimensions - 3D, 4D, 5D, 6D BIM explained [online].
2017 [cited 2019-03-22]. Available: https://www.thenbs.com/knowledge/bim-
dimensions-3d-4d-5d-6d-bim-explained
MICROSOFT CORPORATION. Power BI [online]. [cited 2019-04-25]. Available:
https://powerbi.microsoft.com/en-us/
MICROSOFT CORPORATION. Power BI Desktop [software]. Available:
https://powerbi.microsoft.com/en-us/
MINISTRY OF INDUSTRY AND TRADE. Koncepce zavádění metody BIM v České
republice [online]. Czech Republic, 2017 [cit. 2019-04-17]. Available:
https://www.mpo.cz/assets/cz/stavebnictvi-a-suroviny/bim/2017/10/Koncepce-
zavadeni-metody-BIM-v-CR.pdf

67
NATIONAL BUILDING SPECIFICATION. The IFC/COBie Report 2012 [online].
[cited 2019-03-20].
NATIONAL INSTITUTE OF BUILDING SCIENCES. Frequently asked questions
about the National BIM Standard – United States [online]. [cit. 2019-04-18]. Available:
https://nationalbimstandard.org/faqs
NATIONAL INSTITUTE OF BUILDING SCIENCES. National Institute of Building
Sciences: National BIM standard - United States [online]. [cited 2019-03-15]. Available:
https://www.nationalbimstandard.org/
PENN STATE COMPUTER INTEGRATED CONSTRUCTION RESEARCH GROUP.
BIM Uses [online]. [cited 2019-03-19]. Available: https://www.bim.psu.edu/bim_uses/
ROYAL INSTITUTE OF BRITISH ARCHITECTS. BIM Overlay to the RIBA Outline
Plan of Work [online]. RIBA Publishing, 2012 [cit. 2019-02-10]. ISBN 978-1-85946-
467-0. Available: https://www.architecture.com/-/media/gathercontent/riba-plan-of-
work/additional-documents/bimoverlaytotheribaoutlineplanofworkpdf.pdf
THE BIM DICTIONARY TEAM. BIM Dictionary [online]. [cited 2019-03-16].
Available: https://bimdictionary.com/en/common-data-environment/1/
THE BIM DICTIONARY TEAM. BIM Dictionary [online]. [cited 2019-03-16].
Available: https://bimdictionary.com/en/cobie/1/
THE BRITISH STANDARDS INSTITUTION 2019. BS EN ISO 19650-1:2018:
Organization and digitization of information about buildings and civil engineering works,
including building information modelling (BIM) - Information management using
building information modelling. Part 1: Concepts and principles. The UK, 2019. ISBN
978-0-580-92466-8.
THE BRITISH STANDARDS INSTITUTION 2019. BS EN ISO 19650-1:2018:
Organization and digitization of information about buildings and civil engineering works,
including building information modelling (BIM) - Information management using
building information modelling. Part 2: Delivery phase of the assets. The UK, 2019.
ISBN 978-0-580-92467-5.
THE BRITISH STANDARDS INSTITUTION. PAS 1192-2:2013: Specification for
information management for the capital/delivery phase of construction projects using
building information modelling. The UK: BSI Standards Limited, 2013. ISBN 978-0-580-
82666-5.
THE BRITISH STANDARDS INSTITUTION. PAS 1192-3:2014: Specification for
information management for the operational phase of assets using building information
modelling. The UK: BSI Standards Limited, 2014. ISBN 978-0-580-86674-6.

68
THE BRITISH STANDARDS INSTITUTION. BS 1192:2007+A2:2016. BRITISH
STANDARD: Collaborative production of architectural, engineering and construction
information – Code of practice. The UK: BSI Standards Limited, 2016. ISBN 978-0-580-
92817-8.
THE BRITISH STANDARDS INSTITUTION. BS 1192-4:2014: Collaborative
production of information. Part 4: Fulfilling employer’s information exchange
requirements using COBie – Code of practice. The UK: BSI Standards Limited, 2014.
ISBN 978-0-580-85255-8.
THE STATE FUND FOR TRANSPORT INFRASTRUCTURE and MINISTRY OF
INDUSTRY AND TRADE OF THE CZECH REPUBLIC. Analýza užití informačního
modelování staveb (BIM) pro infrastrukturní stavby. 2018.

69
List of figures
Figure 1 - BIM collaboration (Building in Cloud, 2019) .............................................. 13
Figure 2 - BIM Maturity Diagram (RIBA,2012) .......................................................... 14
Figure 3 - BIM Uses for a construction project (Computer Integrated Construction
Research Program, 2011)............................................................................................. 17
Figure 4 - Uses of BIM for infrastructure projects (SFDI et al., 2018).......................... 18
Figure 5 - Information models and types (BSI, 2018) .................................................. 20
Figure 6 - Generic project and asset information management life cycle (BSI, 2018) ... 22
Figure 7 - Common data environment (CDE) schema (BSI, 2018) ............................... 23
Figure 8 - IFC data exchange ....................................................................................... 27
Figure 9 - IFC merged model....................................................................................... 28
Figure 10 - Workflow within Power BI (Lorenz, 2019) ............................................... 33
Figure 11 - North-South Corridor – Visualization 1 (LTA, 2018) ................................ 35
Figure 12 - North-South Corridor – Visualization 2 (LTA, 2018) ................................ 35
Figure 13 - Location map of NSC alignment (LTA, 2018) ........................................... 36
Figure 14 - Location map of NSC tunnel between Suffolk Walk and Novena Rise (LTA,
2018) ........................................................................................................................... 36
Figure 15 - Project Layout (Autodesk Navisworks) ..................................................... 37
Figure 16 - Federated Model (Autodesk Navisworks) .................................................. 38
Figure 17 - Proposed workflow for this thesis .............................................................. 39
Figure 18 - Alternative workflow ................................................................................ 40
Figure 19 - Pipe networks considered in this thesis3D pipe network model (AutoCAD)
.................................................................................................................................... 41
Figure 20 - Pipe networks considered in this thesis (AutoCAD) ................................... 42
Figure 21 - Extended data in AutoCAD (AutoCAD) .................................................... 42
Figure 22 - Suitability Codes in AutoCAD (AutoCAD) ............................................... 43
Figure 23 - The model in Navisworks (Autodesk Navisworks) .................................... 44
Figure 24 - COBie template (Autodesk Navisworks) ................................................... 45
Figure 25 - COBie template configuration (Autodesk Navisworks).............................. 46
Figure 26 - COBie spreadsheet in Navis (Autodesk Navisworks) ................................. 46
Figure 27 - COBie spreadsheet in Excel (Microsoft Excel) .......................................... 47
Figure 28 - Basic information query (Power BI) .......................................................... 48

70
Figure 29 - Proposed networks query (Power BI) ........................................................ 49
Figure 30 - Suitability codes query (Power BI) ............................................................ 49
Figure 31 - Parameter configuration (Power BI) .......................................................... 50
Figure 32 - Formula correcting the length format (Power BI) ...................................... 51
Figure 33 - Default format versus the right format (Power BI) ..................................... 51
Figure 34 - Data modelling: logical tests (Power BI) ................................................... 51
Figure 35 - Project completion table: part 1 (Power BI) ............................................... 52
Figure 36 - Project completion table: part 2 (Power BI) ............................................... 52
Figure 37 - Project completion table: part 3 (Power BI) ............................................... 52
Figure 38 - Data modelling: adding the formula to return the value of length (Power BI)
.................................................................................................................................... 53
Figure 39 - Data modelling: adding the formula to return the value of costs (Power BI)
.................................................................................................................................... 53
Figure 40 - Power BI visualizations (Power BI) ........................................................... 53
Figure 41 - Project overview dashboard (Power BI)..................................................... 54
Figure 42 - Project overview: pipe networks and lengths (Power BI) ........................... 54
Figure 43 - Project overview: pipe materials and the note (Power BI) .......................... 55
Figure 44 - Project overview dashboard interactions (Power BI) .................................. 55
Figure 45 - Main project dashboard (Power BI) ........................................................... 56
Figure 46 - Gantt Chart (Power BI) ............................................................................. 57
Figure 47 - Clustered bar chart (Power BI) .................................................................. 57
Figure 48 - Editing the parameter (Power BI) .............................................................. 57
Figure 49 - Parameter’s drop-down (Power BI) ........................................................... 58
Figure 50– Completion chart (Power BI) ..................................................................... 58
Figure 51 - Costs chart (Power BI) .............................................................................. 59
Figure 52 - Data relationships (Power BI) .................................................................... 59
Figure 53 - An example of values' changing (Power BI) .............................................. 60
Figure 54 - Suitability Codes dashboard (Power BI) .................................................... 61
Figure 55 – Suitability Codes state by April 1,2019 (Power BI) ................................... 62
Figure 56 – A1-Approved Suitability Code chosen (Power BI) .................................... 62
Figure 57 – Cost chart before and after choosing A1-Approver Suitability Code (Power
BI)............................................................................................................................... 62
Figure 58 – Statuses chart before and after choosing A1-Approver Suitability Code
(Power BI) .................................................................................................................. 63

71
Figure 59 - Lengths chart before and after choosing A1-Approver Suitability Code
(Power BI) .................................................................................................................. 63
List of tables
Table 1 - Suitability Codes from BS 1192:2007+A2:2016 (BSI, 2016) ........................ 25
Table 2 - Data drop stages from PAS 1192:2 (BSI, 2013) ............................................ 26
Table 3 - Suitability Codes used for thesis purpose ...................................................... 43