2021 Medical Malpractice Annual Report
56
OIC WA | 360-725-7009 | P.O. Box 40255 Olympia, WA 98504-0255 2021 Medical Malpractice Annual Report Claims closed from Jan. 1, 2016 through Dec. 31, 2020 October 2021 Mike Kreidler, Insurance Commissioner www.insurance.wa.gov
-
Upload
khangminh22 -
Category
Documents
-
view
1 -
download
0
Transcript of 2021 Medical Malpractice Annual Report

OIC WA | 360-725-7009 | P.O. Box 40255 Olympia, WA 98504-0255
2021 Medical Malpractice Annual Report
Claims closed from Jan. 1, 2016 through Dec. 31,
2020
October 2021
Mike Kreidler, Insurance Commissioner www.insurance.wa.gov

Medical Malpractice Annual Report | October 2021 2
Table of contents
2021 Medical Malpractice Annual Report ................................................................................. 1
About this report .......................................................................................................................... 4
Key statistics ................................................................................................................................. 5 About the medical professional liability insurance market .............................................................. 5 About claim data submitted by insurers and self-insurers ............................................................... 6
Total claims ............................................................................................................................................................................. 6 Payments to claimants........................................................................................................................................................ 6 Defense costs ......................................................................................................................................................................... 6 Method of settlement ......................................................................................................................................................... 6 Payments by type of medical provider ........................................................................................................................ 7 Payments and defense costs by age of claim ............................................................................................................ 7 Regional comparisons ........................................................................................................................................................ 7 Allegations .............................................................................................................................................................................. 7
About lawsuits filed and settled by attorneys .................................................................................... 8 Compensation to claimants .............................................................................................................................................. 8 How lawsuits settled ............................................................................................................................................................ 8 Gender of claimant .............................................................................................................................................................. 8 Age of claimant ..................................................................................................................................................................... 8 Regional comparisons ........................................................................................................................................................ 8
Introduction .................................................................................................................................. 9 Market analysis ...................................................................................................................................... 9 Summary data for closed claims reported by insurers, risk retention groups and self-insurers 10 Summary data for lawsuits reported by attorneys .......................................................................... 10 Closed claim and lawsuit statistics are different .............................................................................. 11
Snapshot of the medical professional liability insurance market ........................................ 12 Impact of COVID-19 ............................................................................................................................ 12 Market participants ............................................................................................................................. 13 Loss history........................................................................................................................................... 15 Lower claim reserves ........................................................................................................................... 18 Washington state market in 2020...................................................................................................... 19 National market in 2020 ..................................................................................................................... 20
Information about medical malpractice claims ...................................................................... 22 Related claims ...................................................................................................................................... 23 Lawsuit status ...................................................................................................................................... 24 Method of settlement ......................................................................................................................... 25 Size of indemnity payments ............................................................................................................... 26 Claim duration ..................................................................................................................................... 27 Type of reporting entity ..................................................................................................................... 28

Medical Malpractice Annual Report | October 2021 3
Injury outcome..................................................................................................................................... 29 Type of health care organization ....................................................................................................... 31 Location within the facility ................................................................................................................. 32 Type of medical provider .................................................................................................................... 33 Claim allegations ................................................................................................................................. 36 Counties ................................................................................................................................................ 40 Age of claimant .................................................................................................................................... 41 Gender of claimant .............................................................................................................................. 42 Trends ................................................................................................................................................... 43
Information about medical malpractice lawsuits ................................................................... 44 How lawsuits were settled .................................................................................................................. 45 Gender of claimant .............................................................................................................................. 46 Age of claimant .................................................................................................................................... 47 Counties ................................................................................................................................................ 48
Report limitations ...................................................................................................................... 49
Appendices .................................................................................................................................. 50 Appendix A: Profitability .................................................................................................................... 51 Appendix B: Reserve development .................................................................................................... 53 Appendix C: Rate filing information ................................................................................................. 54 Appendix D: 2019 NAIC profitability of medical professional liability insurance ........................ 55

Medical Malpractice Annual Report | October 2021 4
About this report Early in the 2000s, a “hard market” emerged nationally for most types of insurance. During this period, medical professional liability insurance became expensive and hard to find for many types of medical providers and facilities.
In 2006, the Legislature enacted comprehensive health care liability reform legislation (2SHB 2292) to address a number of concerns, including the cost and availability of medical professional liability insurance. This law also created reporting requirements for medical malpractice claims that are resolved and closed, with the intent to collect data to support policy decisions. The Office of the Insurance Commissioner (OIC) began publishing annual reports in 2010 that summarize the data.
This is the 12th annual report. It includes a snapshot of the medical malpractice marketplace and summary data for closed claims and lawsuit settlements.
This report has three sections:
1. The current condition of the medical professional liability insurance market.
2. Summary data for closed claims reported by insurers, risk retention groups and self-insurers. 1
3. Summary data for lawsuits reported by attorneys.
1 For simplicity, we will use the term “insurers” when referring to admitted insurers, surplus line insurers and risk retention groups.

Medical Malpractice Annual Report | October 2021 5
Key statistics This section includes premium, loss and defense cost data reported by insurers and self-insurers to the National Association of Insurance Commissioners (NAIC), closed claim data reported by insurers and self-insurers to the Office of the Insurance Commissioner (OIC), and lawsuit data reported by attorneys to the OIC.
About the medical professional liability insurance market
• The pure loss ratio2 for 2020 was 67.3%. This represents a significant reduction from the 78.9% pure loss ratio for 2019.
• Defense costs were 18.2% of premium for 2020. This represents a significant reduction from the 27.8% defense cost ratio for 2019.
• Following a large increase in 2019, direct written premiums decreased by 2.7% to $186 million in 2020.
• Favorable loss development fueled profitability. Insurers lowered their reserves for older claims, leading to lower incurred loss and defense costs in recent years.3 For example, Physicians Insurance lowered its reserves by $143 million over its original estimates. Reserves released from prior years translate to profit for the current year.
• Profitability continued declining. The operating ratio for Physicians Insurance, the admitted insurer with the largest market share in Washington, was 105.5% in 2020, compared to 91.4% for the prior five years. 4
2 Pure loss ratio means incurred losses divided by direct earned premium. Incurred losses include paid claims and the change in reserves for pending and unknown claims. A pure loss ratio does not include defense and cost containment expenses, which are a significant part of the cost to resolve claims. 3 Claim reserves are money set aside to meet future payments associated with claims incurred but not settled on a given date. If a claim reserve is too high or an investigation shows there is no legal responsibility to pay the claim, the insurer either lowers the reserve or removes the claim reserve from its books. If an insurer lowers total claim reserves for past years, incurred losses are lower in the current year. 4 Operating ratios measure overall profitability from underwriting and investment activities. Operating ratios are calculated using countrywide data.

Medical Malpractice Annual Report | October 2021 6
About claim data submitted by insurers and self-insurers
Total claims
Insurers and self-insurers reported closing 3,833 claims between 2016 and 2020 with indemnity payments, defense costs, or both types of payments.5 6 Commercial insurers reported 2,293 claims, self-insured entities reported 1,491 claims, and risk retention groups reported 49 claims.7
Payments to claimants
Insurers and self-insurers closed 45% of all claims with an indemnity payment to a claimant.
• Indemnity payments totaled $754 million on 1,726 claims over the five-year period, or $437,040 per paid claim. The median indemnity payment for the five-year period was $85,000.
• Economic loss payments totaled $520 million, an average of $301,213 per paid claim. On average, insurers and self-insurers attributed 68.9% of each claim payment to economic loss.
• Of the claims closed with an indemnity payment, 11.8% closed with a payment of $1 million or more. These claims account for 68.9% of total paid indemnity over the five-year period.
Defense costs
Insurers and self-insurers paid $246 million to defend 3,375 claims, an average of $72,971 per claim. Average defense costs increased during the five-year period, reaching a high of $96,951 in 2020.
Method of settlement
Insurers and self-insurers settled most claims with paid indemnity by negotiation between the claimant and the insurer. For claims with an indemnity payment, insurers and self-insurers settled:
• 68.9% of claims by negotiation, comprising 56% of the total paid indemnity.
• 22.7% of claims by alternative dispute resolution – arbitration, mediation or private trial. These settlements comprised 38.8% of the total paid indemnity over the five-year period.
5 This report includes claims data reported and edited through April 11, 2021. 6 For simplicity, this report substitutes “defense costs” for the technical phase “defense and cost containment expenses.” Defense and cost containment expenses are expenses allocated to a specific claim to defend an insured, including court costs, fees paid to defense attorneys, and fees for expert witnesses. These expenses do not include the internal costs to operate a claims department. 7 Commercial insurers include both admitted and surplus line insurers.

Medical Malpractice Annual Report | October 2021 7
Payments by type of medical provider
The insurer or self-insurer identified the type of medical provider in 74.4% of the closed claim reports.8 Claimants made the remaining claims against an organization, not an individual medical provider.
• Nursing resulted in the most closed claims at 402. Of these claims, 259 resulted in paid indemnity averaging $216,308.
• For physician specialties, family practice had the most claims at 219, with 91 paid claims resulting in paid indemnity averaging $463,303. Pediatrics had the highest average paid indemnity at $2.5 million, and the highest average defense cost at $234,219.
Payments and defense costs by age of claim
• The data shows that the longer a claim takes to be settled, the higher the paid claims tend to be. Claims closed within the first year had average paid indemnity of $109,357. Claims that took at least four years to settle had average indemnity payments of $993,038.
• Defense costs also increased with the age of the claim. Claims that took less than one year to close had average defense costs of $9,583. Claims that took at least four years had average defense costs of $198,706.
Regional comparisons
• King County had the most closed claims with 1,122. • Pierce County had the highest paid indemnity, averaging $623,774.
Allegations
• “Vicarious liability” was the most common allegation, with 759 claims and 288 indemnity payments that averaged $619,676.
• “Improper performance” was the second-most common allegation, with 651 claims and 241 indemnity payments that averaged $256,640.
• “Failure to report on patient condition” was the allegation with the highest paid indemnity, averaging $2 million.
8 Physician specialties, dental specialties and other types of medical providers.

Medical Malpractice Annual Report | October 2021 8
About lawsuits filed and settled by attorneys
If an attorney files a lawsuit to resolve a medical malpractice incident, they should report data about the lawsuit to the Office of the Insurance Commissioner (OIC) once the litigation is resolved. For settlements resolved between 2016 and 20209:
Compensation to claimants
Attorneys reported claimants received $151 million in total compensation on 120 claims, an average of $1.3 million per settlement. Attorney fees were $56 million, an average of $467,352 per reported settlement. On average, attorney fees were 37.1% of the total compensation paid to the claimant.
How lawsuits settled
Lawsuits settled by negotiations between parties had the highest average paid indemnity at $1.4 million per lawsuit. Lawsuits resolved by jury verdicts in favor of the plaintiff had the lowest average paid indemnity at $730,000 per lawsuit.
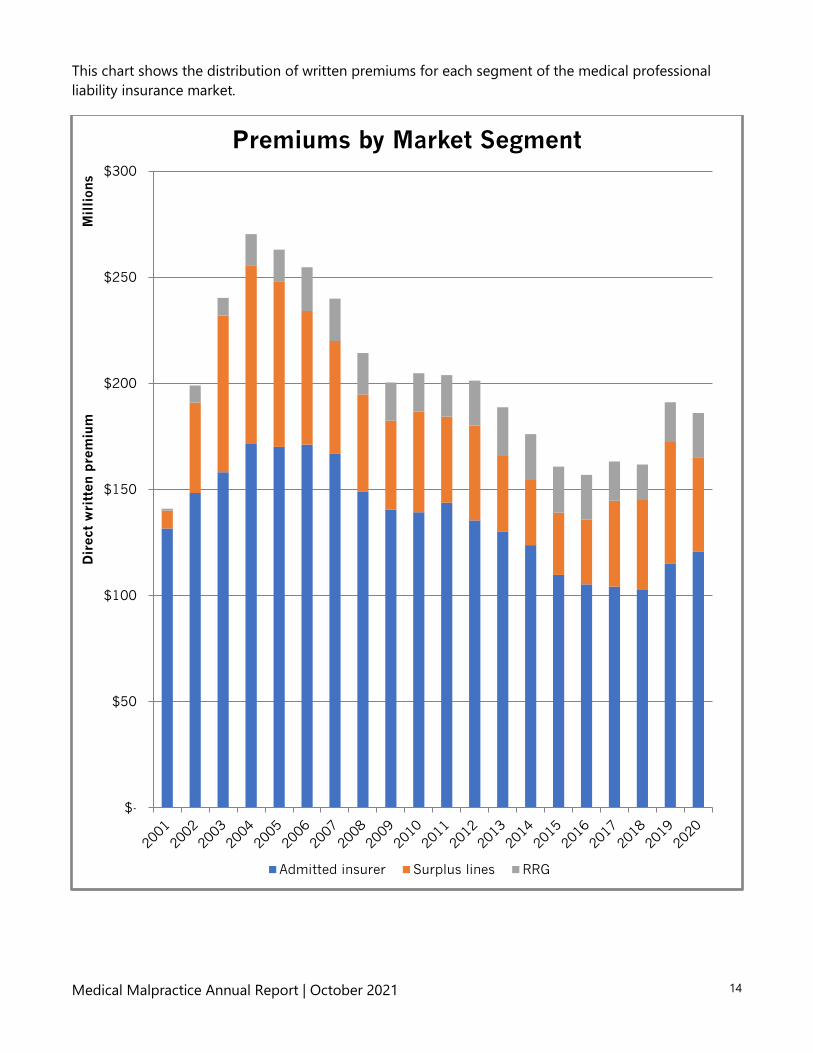
Gender of claimant
Settlements for male claimants were significantly more costly than settlements for female claimants. Average indemnity payments to male claimants were 2.4 times higher than payments to female claimants and average legal expenses were 2.7 times higher.
Age of claimant
Settlements involving claimants 41 to 50 years old had the highest average paid indemnity at $1.7 million and the highest average defense costs at $624,684.
Regional comparisons
King County had the largest number of lawsuits filed, with 54 lawsuits or 42.2% of the statewide total. Spokane County had the highest average indemnity payment of $1.8 million per settlement.
9 This report includes data reported by attorneys through May 12, 2021.

Medical Malpractice Annual Report | October 2021 9
Introduction Under chapter 48.140 Revised Code of Washington (RCW), insurers, risk retention groups (collectively “insurers”) and self-insurers must submit a report to the insurance commissioner every time they close a medical malpractice claim.10 Under RCW 7.70.140, attorneys must report aggregate settlement data from all defendants after they resolve all claims related to a medical malpractice lawsuit. This report includes data submitted by insurers, self-insurers and attorneys in summary form that protects the confidentiality of people and organizations involved in the claim or settlement process.11
Insurers, self-insurers and attorneys must report claim data for the prior year to the Office of the Insurance Commissioner (OIC) by March 1 each year.12 Attorneys’ compliance with the reporting law has been low, and the Insurance Commissioner does not have enforcement mechanisms to improve compliance.13 As a result, this report provides very few summary exhibits for settlement data reported by attorneys, since the data is incomplete. Most of the exhibits in this report focus on data reported by insurers and self-insurers.14
This report has three sections:
Market analysis
This section is an overview of the medical professional liability insurance market in Washington and around the country that includes:
• An analysis of the profitability of the largest authorized medical malpractice insurers in Washington.
• Information about premiums, incurred losses and defense costs for medical professional liability insurance.
10 A risk retention group (RRG) is an owner-controlled insurance company authorized by the Federal Risk Retention Act of 1986. An RRG provides liability insurance to members who are in similar or related business or activities. The federal act allows one state to charter an RRG and allows the RRG to engage in the business of insurance in all states. The federal act pre-empts state law in many significant ways. See RCW 49.92.030(1). For simplicity, and to protect the confidentiality of data, we include them with all other insurers in this report. 11 RCW 48.140.040(3) says the OIC must take steps to protect the confidentiality of claim data, and RCW
48.140.060 required the OIC to adopt rules to achieve this result. 12 See RCW 48.140.020(2) and WAC 284-24E-090. 13 In 2010, the OIC proposed legislation, which the Legislature did not enact, that would have added enforcement mechanisms to the existing law. These bills were introduced as SB 6412 and HB 2963. 14 RCW 48.140.050 lists information that must be provided by this report.

Medical Malpractice Annual Report | October 2021 10
Summary data for closed claims reported by insurers, risk retention groups and self-insurers
Insurers and self-insurers report claims with an indemnity payment and/or defense costs.15 16 Each closed claim report is associated with one defendant.17 Claims can be made for a variety of allegations. People can make allegations against an organization, a medical provider or both.
Insurers and self-insurers reported three primary types of closed claim data:
1. Defense costs: These are expenses paid to defend claims, and include expenses allocated to a specific claim, such as court costs and fees paid to defense attorneys or expert witnesses. They do not include internal costs to settle claims, such as salaries for claims staff or operating overhead for a claims department.18
2. Economic damages: Most of these amounts are estimates of the claimant’s economic damages made by the insurer or self-insurer when it makes a payment to settle the claim.19 In a few cases, a court itemized economic damages when it issued a verdict.
3. Paid indemnity: The amount the insurer or self-insurer paid to the claimant to resolve the claim.
Summary data for lawsuits reported by attorneys
If an attorney files a lawsuit alleging medical malpractice, the attorney must report data after the lawsuit is resolved. Many attorneys, however, do not comply with RCW 7.70.140, so data in this report is incomplete. Therefore, this section of the report is less detailed than the closed claim section.
Attorneys reported two primary types of settlement data:
1. Total paid indemnity: Total compensation paid by all defendants to the claimant. Indemnity payments may come from several defendants if a lawsuit named more than one party.20
2. Legal expenses: All sums paid by the claimant to the attorney, including attorney fees, expert witness fees, court costs and all other legal expenses.21 22
15 RCW 48.140.010(1) defines a claim. 16 Under WAC 284-24D-060, if an insurer or self-insurer closes a claim without an indemnity payment or defense costs, it is not required to report the claim to the OIC. 17 RCW 48.140.010(3) defines a closed claim. 18 See WAC 284-24D-020(1), WAC 284-24D-330 and WAC 284-24D-340. 19 See RCW 4.56.250(1)(a), WAC 284-24D-350, WAC 284-24D-360, WAC 284-24D-362, WAC 284-24D-364, and WAC 284-24D-370. 20 WAC 284-24E-150. 21 Attorney fees for legal representation are generally contingent fees that are payable if indemnity payments are made by one or more defendants. 22 RCW 7.70.140(2)(b)(v).

Medical Malpractice Annual Report | October 2021 11
Closed claim and lawsuit statistics are different
One cannot compare data reported by insurers and self-insurers to the data reported by attorneys because insurers and self-insurers:
• Report all closed claims if the insurer or self-insurer makes payments or incurs expenses to defend the claim. Attorneys report data only if they filed a lawsuit against one or more defendants.
• Report data separately for each defendant. Attorneys submit one final settlement report that includes payments made by all defendants they sued.
• Insurers, self-insurers and risk retention groups are more diligent in reporting closed claim data.
Example: If an attorney sues several medical providers for their actions related to an incident with a poor medical outcome, some providers may resolve the litigation early, while others may be involved in the dispute resolution process for years. Insurers and self-insurers report claims as they resolve the claims against their customers, while an attorney waits until claims against all defendants are resolved to report the settlement.

Medical Malpractice Annual Report | October 2021 12
Snapshot of the medical professional liability insurance market This is an overview of the medical malpractice market in Washington primarily using calendar year premium and loss data from the National Association of Insurance Commissioners (NAIC).
Impact of COVID-19
Because a significant portion of medical malpractice claims develop slowly over the course of multiple years, the full impact of the COVID-19 pandemic cannot be determined at this time. However, the pandemic is expected to impact the market in a variety of ways.
In the short term, the pandemic caused a reduction in claim frequency due to temporary bans on elective procedures and other nonessential care. As shown on the chart on page 14, the resulting decrease in health care utilization appears to have delayed the market premium growth that began in 2019. Owing to temporary court closures, the pandemic has also slowed the pace at which high-value claims are closed. These reductions are expected to reverse over time now that elective procedures have resumed and court backlogs are beginning to unwind. However, the full extent of this reversal cannot be predicted at this time, partly because some elective procedures may have been cancelled rather than delayed and because the economic impact of the pandemic may pressure some claimants to settle out of court for unfavorable amounts.23 24
In future years, we may see an increase in claim frequency due to diagnosing and treating patients with COVID-19. However, such claims could be mitigated by the Coronavirus Aid, Relief, and Economic Security (CARES) Act, which limits liability for unpaid health care volunteers for harm caused to patients relating to the diagnosis, prevention, and treatment of COVID-19.25 We may also see claims relating to failure to protect patients from exposure to the virus, and denial of care by health care facilities that were overwhelmed during the early stages of the pandemic.
Additional uncertainty arose due to the rapid expansion of telemedicine during the pandemic. Security breaches and other Health Insurance Portability and Accountability (HIPPA) concerns are inherent risks in virtual care. Moreover, it is widely believed that in-person visits are superior for diagnosing serious medical conditions. Issues such as communication problems, lack of continuity, and unfamiliarity with a patient’s medical history could increase the probability of misdiagnosis in a virtual setting.26
23 https://www.fmglaw.com/business-litigation/changes-in-the-landscape-of-civil-litigation-in-the-covid-19-era/ 24 https://www.americanbar.org/groups/litigation/committees/solo-small-firm/articles/2021/winter2021-why-early-settlement-should-be-considered-during-the-pandemic/ 25 https://www.jw.com/news/insights-cares-act-healthcare-provisions-covid19/ 26 Best’s Market Segment Report – Continued Uncertainty Clouds the Horizon for MPL Insurers (May 12, 2021).

Medical Malpractice Annual Report | October 2021 13
Market participants
The medical professional liability insurance market has three primary participants:
1. Admitted insurers regulated by the insurance commissioner.
2. Unregulated surplus line insurers.
3. Risk retention groups regulated by their home state.
In 2000, admitted insurers wrote 95.4% of medical professional liability insurance premiums in Washington state. Physicians Insurance Group led the market with 52.7% of the admitted market share and 50.3% of total market share.27 In 2020, admitted insurers wrote only 64.8% of premium, and the remainder of the market was written by surplus line insurers and risk retention groups. Physicians Insurance still had more than half of the admitted market share at 61.7%, but its share of the overall market was much lower, at 40%.
Medical professional liability insurance has been a profitable line of business for insurers in Washington, but profits have declined in recent years. For Physicians Insurance, the operating ratio for 2011-2015 was 87.5%, compared to its 2016-2020 ratio of 95.1%, and reached a high of 105.5% in 2020. As shown in Appendix C, Physicians Insurance recently addressed this deterioration by filing rate increases for two of its programs.
27 In 2000, Physicians Insurance Group sold insurance through three companies: Physicians Insurance, A Mutual Company; Western Professional Insurance Company; and Northwest Dentists Insurance Company. Western Professional Insurance Company is no longer actively writing insurance, and a group including the ODS Companies and the Washington State Dental Association purchased Northwest Dentists Insurance Company in 2007.
Medical Malpractice Annual Report | October 2021 14
This chart shows the distribution of written premiums for each segment of the medical professional liability insurance market.
$-
$50
$100
$150
$200
$250
$300
Dir
ect
wri
tten
pre
miu
mM
illi
ons
Premiums by Market Segment
Admitted insurer Surplus lines RRG

Medical Malpractice Annual Report | October 2021 15
Loss history
After increasing significantly to 106.7% in 2019, the overall incurred loss and defense cost ratio for medical professional liability insurance in Washington decreased to 85.6% in 2020. The following table shows data for the total market, which includes admitted insurers, surplus line insurers and risk retention groups.
Year Direct written
premium Direct earned
premium Direct incurred
losses
Pure loss
ratio
Direct incurred
defense costs
Incurred losses & defense
costs
Incurred loss &
defense cost
ratio 2001 $140,929,627 $134,008,616 $112,729,787 84.1% $32,745,710 $145,475,497 108.6% 2002 $198,969,671 $181,843,628 $164,372,251 90.4% $43,275,166 $207,647,417 114.2% 2003 $240,251,605 $234,439,488 $149,126,311 63.6% $40,242,563 $189,368,874 80.8% 2004 $270,352,631 $258,075,781 $139,822,747 54.2% $36,610,655 $176,433,402 68.4% 2005 $263,090,674 $258,403,214 $118,070,079 45.7% $45,446,560 $163,516,639 63.3% 2006 $254,759,071 $253,104,467 $98,628,303 39.0% $39,005,295 $137,633,598 54.4% 2007 $239,959,432 $241,654,054 $92,960,987 38.5% $35,676,308 $128,637,295 53.2% 2008 $214,357,164 $218,726,595 $85,445,904 39.1% $36,841,513 $122,287,417 55.9% 2009 $200,445,437 $202,466,303 $62,633,183 30.9% $34,721,641 $97,354,824 48.1% 2010 $204,786,151 $199,165,328 $70,634,175 35.5% $17,701,695 $88,335,870 44.4% 2011 $203,869,400 $201,195,699 $69,646,648 34.6% $36,923,847 $106,570,495 53.0% 2012 $201,288,240 $193,926,182 $69,871,999 36.0% $39,070,682 $108,942,681 56.2% 2013 $188,761,301 $187,007,042 $86,745,683 46.4% $32,432,507 $119,178,190 63.7% 2014 $176,091,879 $182,705,913 $125,854,675 68.9% $40,501,079 $166,355,754 91.1% 2015 $160,752,756 $164,616,659 $71,518,739 43.4% $37,195,911 $108,714,650 66.0% 2016 $156,825,836 $158,126,354 $76,761,700 48.5% $25,678,427 $102,440,127 64.8% 2017 $163,187,482 $157,522,013 $109,863,807 69.7% $38,378,783 $148,242,590 94.1% 2018 $161,729,313 $164,641,866 $86,829,886 52.7% $25,828,741 $112,658,627 68.4% 2019 $191,108,177 $192,612,461 $151,898,275 78.9% $53,535,200 $205,433,475 106.7% 2020 $186,040,296 $176,978,799 $119,193,320 67.3% $32,261,953 $151,455,273 85.6% Total $4,017,556,143 $3,961,220,462 $2,062,608,459 52.1% $724,074,236 $2,786,682,695 70.3%

Medical Malpractice Annual Report | October 2021 16
This chart shows statewide industry incurred losses and defense costs by calendar year.
$0
$25
$50
$75
$100
$125
$150
$175
$200
$225
Mil
lion
s
Incurred Losses and Defense Costs
Direct incurred losses Direct incurred defense costs

Medical Malpractice Annual Report | October 2021 17
This chart compares loss and defense cost ratios for Physicians Insurance, The Doctors Company and Medical Protective Company to industrywide data obtained from A.M. Best.28 The Doctors Company and Medical Protective Company are two of the largest writers of medical professional liability insurance in the United States. The loss and defense cost ratio for Physicians Insurance continues to be a bit higher than for the market overall.
28 Best’s Market Segment Report – Continued Uncertainty Clouds the Horizon for MPL Insurers (May 12, 2021)
0
25
50
75
100
2016 2017 2018 2019 2020
Loss and Loss Adjustment Expense Ratios
Physicians Insurance The Doctors Company
Medical Protective AM Best Industry Composite

Medical Malpractice Annual Report | October 2021 18
Lower claim reserves
Incurred losses and defense costs reported to the NAIC by Physicians Insurance, The Doctors Company, and The Medical Protective Company show generally favorable loss development trends. Loss development is the change in the estimated cost of a particular group of claims between the beginning and end of a period in time. Favorable loss development means losses and defense costs decreased from the beginning to the end of the period.29 Reserves released from prior years translate into profit for the current year.
Appendix B shows data from the 2020 annual statement for Physicians Insurance.30 This table shows the change in incurred loss and defense cost reserves over time. Overall, Physicians Insurance had favorable incurred loss development and returned some of its profits to policyholders in the form of dividends totaling $50 million from 2011 to 2020.
Appendix B also shows development for The Doctors Company and Medical Protective Company. Loss development was also generally favorable for both companies.
29 Insurers compile the first estimate of incurred losses three months after the end of the year. Medical malpractice claims often take a long time to resolve and the first estimate of incurred losses may be very inaccurate and subject to revisions in later years. There will be changes to total incurred losses from one period to the next, as more claims are paid and the insurer revises reserves for other claims using new information. “Loss development” is the technical term for the change in incurred losses from period to period. 30 Consolidated data from Schedule P, part 2, sections 1 and 2 for medical professional liability occurrence and claims made policies written in all states. Washington-specific information is not available.

Medical Malpractice Annual Report | October 2021 19
Washington state market in 2020
Physicians Insurance dominates the admitted medical professional liability insurance market in Washington. The Doctors Company and Medical Protective are also important participants in the market due to both their premium volume and their strong position in the national medical professional liability marketplace. Premiums written by Physicians Insurance best indicate the profitability of this type of insurance in Washington state, whereas premiums written by The Doctors Company and Medical Protective Company indicate profitability nationwide.
2020 direct written premiums (millions)
Insurer Washington Nationwide WA % of
Nationwide Physicians Insurance $74.4 $95.0 78.3% The Doctors Company $9.5 $634.3 1.5% Medical Protective Company $6.2 $619.9 1.0%
This table shows the 10 largest admitted writers in Washington in 2020.
Admitted insurer
Washington direct
written premiums (millions)
Admitted market
share Physicians Insurance $74.4 61.7% The Doctors Co. $9.5 7.9% Medical Protective Co. $6.2 5.1% ProSelect Insurance Co. $5.5 4.6% American Casualty Co. of Reading, PA $4.7 3.9% Dentists Insurance Co. $4.5 3.7% NCMIC Insurance Co. $2.7 2.3% Church Mutual Insurance Co. SI $2.1 1.8% Aspen American Insurance Co. $2.0 1.6% ProAssurance Insurance Co. of America $1.7 1.4% All other admitted insurers $7.3 6.0% Total $120.6 100.0%

Medical Malpractice Annual Report | October 2021 20
National market in 2020
Appendix A shows the profitability for Physicians Insurance, The Doctors Company and Medical Protective Company for the 10-year period ending Dec. 31, 2020 using two ratios:
• The operating ratio, which is the combined ratio minus the net investment income ratio.31 32
• The combined ratio, which is the sum of the expense ratio, loss ratio, and dividend ratio.33 34 35
This table summarizes overall profitability by operating ratios.36 Operating ratios for Physicians Insurance and Medical Protective Company increased significantly over the last year.
Operating ratio
Year Physicians Insurance
The Doctors Company
Medical Protective Company
2011 86.2% 61.6% 41.9% 2012 86.2% 76.8% 65.8% 2013 89.7% 83.8% 42.6% 2014 85.7% 102.7% 128.5% 2015 89.5% 98.1% 37.2% 2016 90.6% 101.6% 49.3% 2017 88.7% 93.6% 46.7% 2018 90.8% 95.7% 47.9% 2019 96.0% 99.3% 48.8% 2020 105.5% 94.1% 60.9%
31 The operating ratio measures a company’s overall operational profitability from underwriting and investment activities. If an operating ratio is below 100%, the company is making a profit from its underwriting and investment activities. 32 The net investment income ratio is calculated by dividing net investment income by net earned premiums. 33 The expense ratio is calculated by dividing incurred underwriting expenses by net written premiums. 34 The loss ratio is calculated by dividing losses and defense costs by net earned premiums. 35 The dividend ratio is calculated by dividing policyholder dividends by net earned premiums. 36 Loss portfolio transfers between Medical Protective and its affiliates distorted its operating ratios in 2012, 2014, and 2015.

Medical Malpractice Annual Report | October 2021 21
This chart compares combined ratios from Physicians Insurance, The Doctors Company and Medical Protective Company to cumulative data obtained from A.M. Best.37 38
37 Best’s Market Segment Report – Continued Uncertainty Clouds the Horizon for MPL Insurers (May 12, 2021) 38 The combined ratio measures how well an insurance company is performing in its daily operations. A ratio below 100% means the company is making an underwriting profit. A company can make an operating profit if the combined ratio is above 100%, because the ratio does not include investment income.
0
50
100
150
2016 2017 2018 2019 2020
Combined Ratios
Physicians Insurance The Doctors Company
Medical Protective AM Best Industry Composite

Medical Malpractice Annual Report | October 2021 22
Information about medical malpractice claims
Year closed
2016 2017 2018 2019 2020 Claims closed 898 814 834 677 610 Number of indemnity payments 391 361 412 302 260 Paid indemnity $110,088,350 $119,624,942 $186,978,969 $186,438,929 $151,199,179 Average indemnity payment $281,556 $331,371 $453,832 $617,347 $581,535 Median indemnity payment $75,000 $35,000 $100,000 $117,500 $125,000 Economic loss $76,913,851 $84,214,632 $110,899,936 $152,520,859 $95,344,378 Average economic loss $196,711 $233,282 $269,175 $505,036 $366,709 Median economic loss $45,000 $20,000 $44,600 $82,500 $75,000 Number of claims with defense costs 804 681 720 607 563 Defense costs $52,597,149 $42,198,930 $51,770,661 $45,127,091 $54,583,427 Average defense cost $65,419 $61,966 $71,904 $74,344 $96,951 Median defense cost $16,645 $14,108 $15,170 $22,003 $16,231
From 2016 through 2020, insurers and self-insurers paid $754 million on 1,726 claims, or $437,040 per paid claim.39 The total economic loss was $520 million, or $301,213 per paid claim. On average, insurers and self-insurers attributed 68.9% of indemnity payments to economic loss.
Claims reported by insurers and self-insurers included defense costs 88.1% of the time. Insurers and self-insurers paid $246 million to defend 3,375 claims, or an average defense cost of $72,971 per claim. The table above shows the annual average defense cost has increased since 2017 and increased by 30.4% from 2019 to 2020. However, the median defense cost decreased by 26.2% from 2019 to 2020.
39 These amounts differ from what we reported in prior reports, because reporting entities can edit their data. For example, a reporting entity can re-open a claim, make additional payments, and edit the report to show it closed a year later than earlier reported.

Medical Malpractice Annual Report | October 2021 23
Related claims
Insurers and self-insurers identified medical incidents for which they defended more than one claim. This happens if a claimant alleges more than one medical provider or facility is responsible for their injury and the insurer covers both parties. About half of the 1,375 reported multiclaim incidents resulted in indemnity payments. From 200840 to 2020, the aggregate average indemnity payment per incident was $654,168, which is 2.2 times the average per-claim indemnity payment for the same period.
Often, related claims from a single incident are resolved at the different times, so there can be a lag between the insurer’s or self-insurer’s first claim report related to an incident and its final report that closes the series of related claims. This means average indemnity payments at the incident level will increase over time as additional claims related to previously reported incidents are resolved.
40 Because claims related to the same incident can be closed on different dates, this discussion of incident-level information uses all available closed claim data, which insurers started reporting to the OIC in 2008. The remainder of our analysis of closed claim data uses information related to claims closed between 2016 and 2020.

Medical Malpractice Annual Report | October 2021 24
Lawsuit status
This table summarizes litigation data.41
Five-year period ending December 31, 2020
Lawsuit status Number
of claims
Claims with paid
indemnity Paid
indemnity Average paid
indemnity Claims with
defense costs Defense
costs Average
defense cost Lawsuit filed 2,079 849 $623,463,817 $734,351 2,067 $208,604,284 $100,921 No lawsuit filed 1,754 877 $130,866,552 $149,221 1,308 $37,672,974 $28,802 Total 3,833 1,726 $754,330,369 $437,040 3,375 $246,277,258 $72,971
Of the 3,833 claims reported, claimants filed lawsuits 54.2% of the time. Insurers and self-insurers incurred defense costs in 99.4% of the claims in which the plaintiff filed a lawsuit. Lawsuits resulted in indemnity payments 40.8% of the time, whereas 50% of claims without litigation resulted in indemnity payments.
41 These amounts are not comparable to lawsuit settlement data reported by attorneys. Insurers and self-insurers report data separately for each defendant. Attorneys submit one settlement report that includes payments made by all defendants named in the lawsuit.
$0
$100,000
$200,000
$300,000
$400,000
$500,000
$600,000
$700,000
$800,000
Lawsuit filed No lawsuit filed
Average costs by lawsuit status
Average paid indemnity Average defense cost

Medical Malpractice Annual Report | October 2021 25
Method of settlement
Five-year period ending December 31, 2020
Method of settlement Number
of claims
Claims with paid
indemnity Paid
indemnity
Average paid
indemnity
Claims with
defense costs
Defense costs
Average defense
costs Settled by parties 1,374 1,189 $422,161,625 $355,056 1,025 $98,806,070 $96,396 Abandoned by claimant 1,243 123 $460,087 $3,741 1,142 $26,366,518 $23,088 Court disposed claim 766 23 $38,981,157 $1,694,833 766 $69,143,389 $90,266 Alternative dispute resolution 450 391 $292,727,500 $748,664 442 $51,961,281 $117,559 Total 3,833 1,726 $754,330,369 $437,040 3,375 $246,277,258 $72,971
Plaintiff verdicts or judgments were few in number. Insurers and self-insurers reported 22 claims resolved by plaintiff verdict or judgment, 20 of which resulted in an indemnity payment averaging $1.9 million.42 The courts ruled in favor of defendants in the vast majority of cases.
42 In cases where a lawsuit has more than one defendant, some defendants may not be responsible to compensate the claimant.
0%
10%
20%
30%
40%
50%
60%
70%
80%
90%
100%
Number of claims Total paid indemnity Total defense costs
Distributions by Method of Settlement
Settled by parties Abandoned by claimantCourt disposed claim Alternative dispute resolution

Medical Malpractice Annual Report | October 2021 26
Size of indemnity payments
This table shows that insurers and self-insurers settled 55% of claims without making an indemnity payment, and 55.3% of the remaining claims had indemnity payments of $100,000 or less.
Five-year period ending December 31, 2020
Range of paid indemnity Number of
claims % of claims Paid
Indemnity % of paid Average paid
indemnity $0 2,107 55.0%
$1 - $100,000 954 24.9% $27,757,875 3.7% $29,096 $100,001 - $200,000 183 4.8% $28,809,447 3.8% $157,429 $200,001 - $300,000 117 3.1% $29,657,157 3.9% $253,480 $300,001 - $400,000 70 1.8% $25,537,132 3.4% $364,816 $400,001 - $500,000 78 2.0% $37,414,970 5.0% $479,679 $500,001 - $600,000 36 0.9% $20,653,628 2.7% $573,712 $600,001 - $700,000 30 0.8% $19,790,000 2.6% $659,667 $700,001 - $800,000 29 0.8% $21,971,876 2.9% $757,651 $800,001 - $900,000 19 0.5% $16,441,771 2.2% $865,356 $900,001 - $999,999 7 0.2% $6,690,000 0.9% $955,714
$1 million or more 203 5.3% $519,606,513 68.9% $2,559,638 Total 3,833 100.0% $754,330,369 100.0% $437,040
This next table shows how defense costs are related to the size of the indemnity payment.
Five-year period ending December 31, 2020
Range of paid indemnity
Number of claims with
defense costs
% of total claims with
defense costs Defense costs % of total
defense costs Average
defense cost $0 2,107 62.4% $98,760,065 40.1% $46,872
$1 - $100,000 528 15.6% $22,433,541 9.1% $42,488 $100,001 - $200,000 169 5.0% $13,849,580 5.6% $81,950 $200,001 - $300,000 113 3.3% $9,821,317 4.0% $86,914 $300,001 - $400,000 69 2.0% $7,538,889 3.1% $109,259 $400,001 - $500,000 74 2.2% $8,877,351 3.6% $119,964 $500,001 - $600,000 36 1.1% $7,698,637 3.1% $213,851 $600,001 - $700,000 28 0.8% $3,442,354 1.4% $122,941 $700,001 - $800,000 28 0.8% $3,894,821 1.6% $139,101 $800,001 - $900,000 19 0.6% $2,238,347 0.9% $117,808 $900,001 - $999,999 7 0.2% $1,600,944 0.7% $228,706
$1 million or more 197 5.8% $66,121,412 26.8% $335,642 Total 3,375 100.0% $246,277,258 100.0% $72,971

Medical Malpractice Annual Report | October 2021 27
Claim duration
This table shows claims by age on the date they were closed. Average indemnity and average defense costs tend to increase with the age of the claim.
Five-year period ending December 31, 2020
Notice date to closed date
Number of claims
% of total
claims
Claims with paid
indemnity Paid
indemnity Average paid
indemnity
Claims with
defense costs Defense costs
Average defense
costs 0-12 months 1,221 31.9% 517 $56,537,613 $109,357 901 $8,634,549 $9,583
12-24 months 1,210 31.6% 503 $227,336,705 $451,962 1,142 $53,946,452 $47,239 24-36 months 722 18.8% 393 $210,334,485 $535,202 666 $76,247,867 $114,486 36-48 months 333 8.7% 155 $103,221,493 $665,945 325 $39,689,718 $122,122 48-60 months 170 4.4% 81 $54,260,822 $669,887 169 $19,132,425 $113,210 60-72 months 82 2.1% 39 $29,367,582 $753,015 81 $20,075,110 $247,841
Over 72 months 95 2.5% 38 $73,271,669 $1,928,202 91 $28,551,137 $313,749 Total 3,833 100.0% 1,726 $754,330,369 $437,040 3,375 $246,277,258 $72,971
For the 3,833 claims, the average length of time between the notice date and the date closed was 23 months and the median length of time was 18.1 months. Insurers and self-insurers closed 82.3% of all claims within 36 months. Overall, claims closed within 36 months account for 65.5% of total paid indemnity and 56.4% of total defense costs.
$0
$500
$1,000
$1,500
$2,000
$2,500
$0
$50,000
$100,000
$150,000
$200,000
$250,000
0-12months
12-24months
24-36months
36-48months
48-60months
60-72months
Over 72months A
vera
ge p
aid i
ndem
nity
(th
ousa
nds)
Tot
al p
aid i
ndem
nity
(th
ousa
nds)
Number of months claims were open
Indemnity Payments by Claim Duration
Paid indemnity Average paid indemnity

Medical Malpractice Annual Report | October 2021 28
Type of reporting entity
Commercial insurers reported the highest number of claims and had the highest average paid indemnity.43 Risk retention groups reported the highest average defense costs.
Five-year period ending December 31, 2020
Reporting entity Number
of claims
Claims with paid
indemnity Paid
indemnity Average paid
indemnity
Claims with
defense costs Defense costs
Average defense
costs Commercial insurer 2,293 817 $369,795,813 $452,626 2,175 $152,949,785 $70,322 Self-insured organization 1,491 885 $377,352,806 $426,387 1,154 $89,698,012 $77,728 Risk retention group 49 24 $7,181,750 $299,240 46 $3,629,461 $78,901 Total 3,833 1,726 $754,330,369 $437,040 3,375 $246,277,258 $72,971
43 Commercial insurers include admitted (licensed) and surplus line insurers.
0.0%
15.0%
30.0%
45.0%
60.0%
75.0%
% of total claims % of total paid indemnity % of total defense costs
Distributions by reporting entity
Commercial insurer Self-insured organization Risk retention group

Medical Malpractice Annual Report | October 2021 29
Injury outcome
This exhibit shows compensation and defense costs by severity of injury.44 Injuries were most often classified as minor and temporary, but these claims comprised only 3.5% of total paid indemnity and 9.1% of total defense costs. Grave permanent injuries45 had the highest average paid indemnity and average defense costs, followed by major permanent injuries in both respects.
Five-year period ending December 31, 2020
Injury outcome Number
of claims
Claims with paid
indemnity Paid
indemnity
Average paid
indemnity
Claims with
defense costs
Defense costs
Average defense
costs Emotional injury only 264 93 $9,148,567 $98,372 228 $7,529,564 $33,024 Insignificant injury 242 69 $859,593 $12,458 196 $2,854,937 $14,566 Minor temporary injury 1,025 501 $26,134,281 $52,164 774 $22,429,703 $28,979 Major temporary injury 536 269 $54,147,892 $201,293 472 $25,441,479 $53,901 Minor permanent injury 340 130 $33,912,513 $260,865 315 $16,854,413 $53,506 Significant permanent injury 358 147 $90,994,404 $619,010 349 $26,269,324 $75,270 Major permanent injury 280 146 $177,700,432 $1,217,126 274 $39,200,542 $143,068 Grave permanent injury 132 70 $169,985,606 $2,428,366 129 $22,721,383 $176,135 Death 656 301 $191,447,081 $636,037 638 $82,975,913 $130,056 Total 3,833 1,726 $754,330,369 $437,040 3,375 $246,277,258 $72,971
44 For a description of each type of injury outcome, see WAC 284-24D-220. 45 Grave permanent injuries include quadriplegia and severe brain damage, requiring lifelong dependent care.
0.0%
10.0%
20.0%
30.0%
40.0%
Distributions by Severity of Injury
% of total paid indemnity % of total defense costs % of total claims

Medical Malpractice Annual Report | October 2021 30
If they made an indemnity payment, insurers and self-insurers reported the economic loss related to the injury.46 The insurer or self-insurer either estimated the economic loss or reported the amount of economic loss awarded by a court. Patient death claims had lower average economic loss than claims for significant permanent injury, major permanent injury, or grave permanent injury. If a patient dies, compensation for economic loss is largely calculated based on lost income and services the patient would have provided. This chart shows the relationship between injury outcome, average paid indemnity and average economic loss.
46 Economic damages are defined in RCW 4.56.250, and the components of economic losses are described in WAC 284-24D-360.
0
250,000
500,000
750,000
1,000,000
1,250,000
1,500,000
1,750,000
2,000,000
2,250,000
2,500,000
Average Economic Loss and Indemnity by Severity of Injury
Average economic loss Average indemnity payment

Medical Malpractice Annual Report | October 2021 31
Type of health care organization
This exhibit shows data segmented by the type of health care organization or provider group.47
Five-year period ending December 31, 2020
Health care organization
Number of
claims
Claims with paid
indemnity Paid indemnity
Average paid
indemnity
Claims with
defense costs
Defense costs
Average defense
costs
General or acute care hospital 1,687 864 $480,532,284 $556,172 1,421 $121,459,630 $85,475
Medical group or practice 1,208 420 $160,043,354 $381,056 1,129 $67,388,878 $59,689
Dental group or practice 302 140 $10,410,537 $74,361 248 $7,563,677 $30,499
Nursing or skilled nursing facility 100 73 $21,285,962 $291,589 90 $5,142,427 $57,138
Local or state correctional facility 91 28 $4,468,048 $159,573 82 $21,948,653 $267,666
Podiatric group or practice 46 14 $2,574,990 $183,928 46 $3,107,596 $67,556
Ambulatory surgical center 43 15 $6,360,000 $424,000 41 $2,548,271 $62,153
Chiropractic group or practice 35 18 $5,250,500 $291,694 35 $2,308,922 $65,969
Ambulatory clinic or center 20 10 $7,443,116 $744,312 20 $935,878 $46,794
Physical/occupational therapy 20 10 $535,775 $53,578 19 $463,199 $24,379
All other organizations 281 134 $55,425,803 $413,625 244 $13,410,127 $54,960
Total 3,833 1,726 $754,330,369 $437,040 3,375 $246,277,258 $72,971
47 Under RCW 48.140.060 and RCW 42.56.400(10), the Insurance Commissioner must protect the identify of each insuring entity, self-insurer, claimant, health care provider, or health care facility involved in a particular claim or collection of claims. For this reason, types of organizations with few claims are grouped together.
0.0%
15.0%
30.0%
45.0%
60.0%
75.0%
General oracute carehospital
Medical groupor practice
Dental groupor practice
Nursing orskilled nursing
facility
Local or statecorrectional
facility
All other
Distributions by Type of Health Care Organization
% of total paid indemnity % of total defense costs % of total claims

Medical Malpractice Annual Report | October 2021 32
Location within the facility
This exhibit shows data by location within the facility where the incident leading to the claim occurred.
Five-year period ending December 31, 2020
Location within facility Number
of claims
Claims with paid
indemnity Paid
indemnity Average paid
indemnity
Claims with
defense costs Defense costs
Average defense
costs
Operating room 874 366 $151,513,401 $413,971 779 $50,378,477 $64,671
Office 755 246 $106,337,914 $432,268 726 $44,246,099 $60,945
Emergency department 492 206 $96,848,229 $470,137 445 $31,304,106 $70,346
Patient room 469 268 $92,213,757 $344,081 405 $28,516,793 $70,412
Outpatient department 246 138 $48,194,379 $349,235 189 $9,315,115 $49,286
Other - not an inpatient facility 191 71 $24,825,361 $349,653 176 $7,227,994 $41,068
Labor or delivery room 187 94 $103,473,648 $1,100,783 173 $26,668,482 $154,153
Special procedure room 129 78 $5,689,384 $72,941 77 $3,293,309 $42,770
Radiology department 103 45 $19,336,079 $429,691 86 $4,180,387 $48,609
Walk-in clinic 72 40 $16,112,521 $402,813 58 $3,178,095 $54,795
Laboratory 49 33 $34,365,973 $1,041,393 36 $1,940,678 $53,908
Physical therapy department 38 23 $2,170,012 $94,348 36 $1,679,713 $46,659
Critical care unit 38 21 $11,785,605 $561,219 34 $2,489,778 $73,229
All other locations 190 97 $41,464,106 $427,465 155 $31,858,232 $205,537
Total 3,833 1,726 $754,330,369 $437,040 3,375 $246,277,258 $72,971
0.0%
5.0%
10.0%
15.0%
20.0%
25.0%
Operatingroom
Office Emergencydepartment
Patientroom
Outpatientdepartment
Other - notan
inpatientfacility
Labor ordeliveryroom
Specialprocedure
room
Radiologydepartment
All other
Distributions by Location in Facility
% of total paid indemnity % of total defense costs % of total claims

Medical Malpractice Annual Report | October 2021 33
Type of medical provider
This exhibit shows data by type of medical provider. The “physician” specialty includes surgeons, general practice physicians, radiologists, neurologists, psychiatrists, and many more. The “other type of medical provider” category includes nursing, physician assistants, technicians, pharmacy, podiatry and psychology, among others.
Five-year period ending December 31, 2020
Provider type
Number of
claims
Claims with paid
indemnity Paid
indemnity
Average paid
indemnity
Claims with
defense costs Defense costs
Average defense
cost
Physician specialty 1,833 724 $382,427,882 $528,215 1,696 $141,056,790 $83,170
Claim against an organization 983 441 $255,042,624 $578,328 863 $67,707,155 $78,456
Other type of medical provider 713 417 $105,516,806 $253,038 566 $29,722,386 $52,513
Dental specialty 304 144 $11,343,057 $78,771 250 $7,790,927 $31,164
Total 3,833 1,726 $754,330,369 $437,040 3,375 $246,277,258 $72,971
0.0%
10.0%
20.0%
30.0%
40.0%
50.0%
60.0%
70.0%
Physician Specialty Claim Against anOrganization
Other type of MedicalProvider
Dental Specialty
Distributions by Type of Provider
% of total paid indemnity % of total defense costs % of total claims

Medical Malpractice Annual Report | October 2021 34
This table shows claim data for physician specialties that had the largest number of claims.48
Five-year period ending December 31, 2020
Provider specialty
Number of
claims
Claims with paid
indemnity Paid
indemnity
Average paid
indemnity
Claims with
defense costs
Defense costs
Average defense
cost
Family practice 219 91 $42,160,608 $463,303 196 $15,105,735 $77,070
Obstetrics and gynecology 208 93 $48,299,107 $519,345 196 $22,315,014 $113,852
Emergency medicine 206 70 $25,720,900 $367,441 190 $13,154,166 $69,232
General surgery 198 87 $34,750,732 $399,434 185 $13,451,293 $72,710
Orthopedic surgery 170 59 $17,611,007 $298,492 156 $14,051,287 $90,072
Radiology 123 41 $23,383,869 $570,338 118 $7,915,190 $67,078
Internal medicine 95 28 $13,761,647 $491,487 90 $6,180,175 $68,669
Anesthesiology 91 55 $12,312,214 $223,858 64 $5,300,666 $82,823
Neurological surgery 79 32 $53,190,661 $1,662,208 78 $8,203,405 $105,172
Hospitalist 46 17 $13,700,000 $805,882 46 $3,344,201 $72,700
Urological surgery 46 21 $6,676,377 $317,923 43 $1,915,006 $44,535
Cardiovascular diseases 44 21 $6,587,549 $313,693 40 $3,952,715 $98,818
Gastroenterology 43 10 $4,543,265 $454,326 40 $2,383,181 $59,580
Pediatrics 38 12 $30,282,525 $2,523,544 34 $7,963,450 $234,219
Otolaryngology 25 12 $4,416,500 $368,042 25 $2,351,004 $94,040
Neurology 20 11 $6,635,275 $603,207 20 $2,915,800 $145,790
Diagnostic radiology 16 10 $4,305,093 $430,509 15 $663,424 $44,228
All other physician types 166 54 $34,090,553 $631,307 160 $9,891,078 $61,819
Total 1,833 724 $382,427,882 $528,215 1,696 $141,056,790 $83,170
The largest number of claims against physician specialties were for family practice. The most common allegations against family practice physicians were “failure to diagnose” with 58 claims, “delay in diagnosis” with 25 claims, and “improper management” with 21 claims. Pediatrics ranked highest among specialties in average paid indemnity and average defense costs. The most common allegation against pediatrics was “failure to diagnose” with nine claims.
48 Under RCW 48.140.060 and RCW 42.56.400(10), some specialties are grouped together to maintain confidentiality.

Medical Malpractice Annual Report | October 2021 35
This table shows claim data for other types of medical providers.49 Nursing staff accounted for the majority of these claims. The most common allegations against nursing staff were “failure to ensure patient safety” with 43 claims, followed by “failure to monitor” with 39 claims, and “improper technique” with 36 claims. Physician assistants had the second-highest number of claims, and the most common allegation against this type was “failure to diagnose” with 17 claims.
Five-year period ending December 31, 2020
Provider type
Number of
claims
Claims with paid
indemnity Paid
indemnity
Average paid
indemnity
Claims with defense
costs Defense
costs Average
defense cost
Nursing 402 259 $56,023,824 $216,308 304 $15,429,783 $50,756
Physician assistant 82 40 $13,301,290 $332,532 68 $3,458,260 $50,857
Podiatry 55 17 $3,772,490 $221,911 55 $3,583,621 $65,157
Chiropractic 35 17 $5,215,500 $306,794 35 $2,246,537 $64,187
Physical therapy 24 14 $1,180,487 $84,321 22 $1,236,327 $56,197
Emergency medicine 20 10 $3,481,294 $348,129 15 $524,545 $34,970
All other types 95 60 $22,541,921 $375,699 67 $3,243,313 $48,408
Total 713 417 $105,516,806 $253,038 566 $29,722,386 $52,513
49 Under RCW 48.140.060 and RCW 42.56.400(10), some types of providers are grouped together to maintain confidentiality.

Medical Malpractice Annual Report | October 2021 36
Claim allegations
Insurers and self-insurers identified the primary complaint that led to the medical malpractice claim. This table shows the most common classes of allegations.
Five-year period ending December 31, 2020
Allegation group
Number of
claims
Claims with paid
indemnity Paid
indemnity
Average paid
indemnity
Claims with
defense costs
Defense costs
Average defense
cost
Error / improper performance 1,556 720 $247,958,800 $344,387 1,337 $89,719,027 $67,105
Behavior / legal 1,005 430 $211,639,458 $492,185 888 $48,520,890 $54,641
Failure to take appropriate action 736 320 $170,011,450 $531,286 692 $74,277,142 $107,337
Delay in performance 214 93 $40,347,888 $433,848 186 $14,724,861 $79,166
Communication / supervision 204 121 $73,568,587 $608,005 169 $10,295,433 $60,920
Continuity of care / care management 64 21 $6,859,858 $326,660 54 $4,445,790 $82,329
Other class of allegation 54 21 $3,944,328 $187,825 49 $4,294,115 $87,635
Total 3,833 1,726 $754,330,369 $437,040 3,375 $246,277,258 $72,971
0.0%
5.0%
10.0%
15.0%
20.0%
25.0%
30.0%
35.0%
40.0%
45.0%
Distributions by allegation group
% of total paid indemnity % of total defense costs % of claims

Medical Malpractice Annual Report | October 2021 37
This table shows the most common specific allegations for each major class of allegation.
Five-year period ending December 31, 2020
Error / improper performance
Total number
of claims
Claims with paid
indemnity Total paid indemnity
Average paid
indemnity
Claims with
defense costs
Total defense
costs
Average defense
cost
Improper performance 651 241 $61,850,330 $256,640 599 $33,385,212 $55,735
Improper management 203 90 $55,139,726 $612,664 185 $16,811,541 $90,873
Improper technique 202 127 $39,053,692 $307,509 146 $8,792,125 $60,220
Patient history, exam, or workup problem 69 24 $8,189,030 $341,210 63 $3,364,182 $53,400
Surgical or other foreign body retained 46 29 $2,577,808 $88,890 39 $1,385,960 $35,537
Patient monitoring problem 37 24 $10,940,266 $455,844 33 $2,265,764 $68,660
Wrong medication administered 30 16 $688,038 $43,002 22 $603,285 $27,422
Wrong dosage administered 29 13 $19,261,371 $1,481,644 28 $2,858,684 $102,096
Equipment utilization problem 28 20 $1,719,026 $85,951 20 $1,004,088 $50,204
Wrong diagnosis or misdiagnosis 24 12 $11,907,773 $992,314 22 $1,427,941 $64,906
Intubation problem 21 12 $6,436,211 $536,351 16 $1,951,398 $121,962
Behavior / legal
Vicarious liability 759 288 $178,466,684 $619,676 671 $37,165,020 $55,388
Failure to ensure patient safety 125 89 $23,346,705 $262,323 106 $4,792,405 $45,211
Sexual misconduct 15 11 $1,555,000 $141,364 15 $984,262 $65,617
Failure to take appropriate action
Failure to diagnose 415 171 $87,516,461 $511,792 394 $32,023,129 $81,277
Failure to treat 98 34 $9,184,180 $270,123 95 $6,463,837 $68,040
Failure to monitor 85 54 $20,520,231 $380,004 76 $25,165,954 $331,131
Failure to recognize a complication 36 17 $11,090,371 $652,375 33 $2,193,669 $66,475
Failure to order appropriate test 28 12 $8,508,589 $709,049 24 $1,374,154 $57,256
Delay in performance
Delay in diagnosis 108 43 $25,521,718 $593,528 105 $8,413,363 $80,127
Delay in treatment 79 41 $9,609,126 $234,369 56 $2,994,861 $53,480
Communication / supervision
Failure to instruct or communicate w/patient 77 39 $27,773,716 $712,147 60 $2,927,396 $48,790
Communication problem between practitioners 48 30 $10,928,243 $364,275 36 $2,550,907 $70,859
Improper supervision 34 25 $12,549,927 $501,997 31 $2,502,950 $80,740
Failure to supervise 19 12 $2,083,847 $173,654 18 $810,520 $45,029
Failure to report on patient condition 16 10 $19,692,500 $1,969,250 16 $1,425,524 $89,095
Continuity of care / care management
Premature discharge from institution 21 10 $2,087,595 $208,760 16 $2,243,620 $140,226

Medical Malpractice Annual Report | October 2021 38
This table shows the most common allegations against physician specialties.
Five-year period ending December 31, 2020
Allegation made against physician specialty
Total number
of claims
Claims with paid
indemnity Total paid indemnity
Average paid
indemnity
Claims with
defense costs
Total defense
costs
Average defense
cost
Failure to diagnose 358 147 $77,141,154 $524,770 342 $29,430,906 $86,055
Improper performance 345 116 $49,377,808 $425,671 326 $23,047,387 $70,698
Improper technique 135 74 $34,958,953 $472,418 104 $6,076,093 $58,424
Improper management 132 48 $47,024,263 $979,672 129 $14,156,902 $109,743
Delay in diagnosis 84 30 $21,384,218 $712,807 82 $7,413,744 $90,412
Failure to instruct or communicate w/patient 59 28 $4,757,328 $169,905 49 $2,328,982 $47,530
Failure to treat 54 17 $5,746,105 $338,006 52 $5,305,303 $102,025
Patient history, exam or workup problem 53 15 $6,411,997 $427,466 51 $2,957,115 $57,983
Delay in treatment 38 12 $6,021,810 $501,818 36 $2,564,568 $71,238
Surgical or other foreign body retained 38 22 $2,387,136 $108,506 35 $1,358,082 $38,802
Failure to recognize a complication 27 10 $8,805,326 $880,533 25 $1,821,518 $72,861
Unnecessary procedure 20 11 $2,755,000 $250,455 19 $1,719,024 $90,475
Communication problem between practitioners 19 10 $7,994,714 $799,471 16 $944,911 $59,057
Wrong diagnosis 18 11 $11,589,773 $1,053,616 16 $1,175,344 $73,459
This table shows the most common allegations made against dental specialties.
Five-year period ending December 31, 2020
Allegation made against dental provider
Total number
of claims
Claims with paid
indemnity Total paid indemnity
Average paid
indemnity
Claims with
defense costs
Total defense
costs
Average defense
cost
Improper performance 205 81 $6,898,408 $85,166 184 $5,297,336 $28,790
Improper technique 13 11 $1,089,000 $99,000 12 $906,835 $75,570

Medical Malpractice Annual Report | October 2021 39
This table shows the most common allegations made against other types of medical providers.
Five-year period ending December 31, 2020
Allegation made against other type of provider
Total number
of claims
Claims with paid
indemnity Total paid indemnity
Average paid
indemnity
Claims with
defense costs
Total defense
costs
Average defense
cost
Improper performance 99 42 $5,500,752 $130,970 88 $5,023,407 $57,084
Failure to ensure patient safety 55 37 $6,231,074 $168,407 46 $1,626,460 $35,358
Improper technique 54 42 $3,005,739 $71,565 30 $1,809,197 $60,307
Failure to diagnose 51 23 $10,351,557 $450,068 46 $2,319,345 $50,421
Failure to monitor 42 31 $13,070,040 $421,614 37 $2,992,072 $80,867
Improper management 38 23 $2,819,392 $122,582 33 $1,182,420 $35,831
Failure to treat 27 11 $2,355,575 $214,143 26 $813,923 $31,305
Communication problem between practitioners 22 16 $2,321,476 $145,092 14 $1,160,233 $82,874
Patient monitoring problem 19 13 $4,264,575 $328,044 18 $1,212,372 $67,354
Delay in diagnosis 19 11 $4,050,000 $368,182 18 $891,072 $49,504
This table shows the most common allegations made against an organization. The most common allegation, “vicarious liability,” is secondary liability in which the organization becomes responsible for the acts of an employee or another third party when it had the right, ability or duty to control those actions.
Five-year period ending December 31, 2020
Allegation made against an organization
Total number
of claims
Claims with paid
indemnity Total paid indemnity
Average paid
indemnity
Claims with
defense costs
Total defense
costs
Average defense
cost Vicarious liability 725 283 $178,369,797 $630,282 638 $36,197,437 $56,736 Failure to ensure patient safety 59 47 $16,672,191 $354,727 51 $2,722,062 $53,374 Improper supervision 26 21 $11,674,874 $555,946 24 $1,912,840 $79,702 Failure to monitor 19 13 $2,830,751 $217,750 16 $20,206,073 $1,262,880 Failure to supervise 15 10 $2,057,347 $205,735 14 $740,272 $52,877

Medical Malpractice Annual Report | October 2021 40
Counties
Insurers and self-insurers reported the county where the medical incident occurred.50 To provide information about differences by location, we divided the state into 10 regions.51 A few claims were reported as occurring outside of Washington state (not shown).
Five-year period ending December 31, 2020
Region Number
of claims
Claims with paid
indemnity Paid
indemnity
Average paid
indemnity
Average economic
loss
Claims with
defense costs
Defense costs
Average defense
costs King 1,122 558 $290,925,791 $521,372 $363,278 922 $88,415,789 $95,896 Pierce 468 226 $140,972,895 $623,774 $386,788 414 $38,887,512 $93,931 Spokane 445 174 $47,636,985 $273,776 $228,371 391 $27,106,561 $69,326 Puget Sound Metro 313 120 $57,590,919 $479,924 $396,927 293 $21,526,309 $73,469 Yakima-Tri Cities 291 117 $30,225,972 $258,342 $206,640 271 $8,159,456 $30,109 East Balance 272 123 $46,118,704 $374,949 $242,831 242 $9,783,922 $40,429 Clark 249 124 $52,464,352 $423,100 $276,545 220 $15,369,314 $69,861 Snohomish 231 90 $25,407,905 $282,310 $221,148 213 $11,180,543 $52,491 West Balance 228 96 $24,126,308 $251,316 $126,130 213 $10,399,825 $48,825 North Sound 204 95 $38,121,519 $401,279 $224,372 186 $14,296,252 $76,862
50 Under RCW 48.140.060 and RCW 42.56.400(10), some counties are grouped together to maintain confidentiality. 51 Yakima-Tri Cities includes Benton, Franklin and Yakima counties. East balance includes Adams, Asotin, Chelan, Columbia, Douglas, Ferry, Garfield, Grant, Kittitas, Lincoln, Okanogan, Pend Oreille, Stevens, Walla Walla and Whitman counties. Puget Sound Metro includes Kitsap and Thurston counties. West balance includes Clallam, Cowlitz, Grays Harbor, Jefferson, Klickitat, Lewis, Mason, Pacific, Skamania and Wahkiakum counties. North Sound includes Island, San Juan, Skagit and Whatcom counties.
0.0%
10.0%
20.0%
30.0%
40.0%
Distributions by Region
% of total paid indemnity % of total defense costs % of claims

Medical Malpractice Annual Report | October 2021 41
Age of claimant
Insurers and self-insurers reported the age group of the claimant.
Five-year period ending December 31, 2020
Age group
Total number
of claims
Claims with paid
indemnity
Average paid
indemnity
Average economic
loss
Claims with
defense costs
Average defense
cost Newborn 150 67 $1,393,391 $1,244,736 141 $194,946 Infant less than 1 year 46 27 $2,081,591 $1,968,295 40 $150,026 1-10 65 34 $1,099,625 $890,023 53 $74,749 11-20 114 63 $648,142 $581,229 85 $66,091 21-30 316 145 $459,114 $223,969 271 $141,945 31-40 527 222 $361,995 $232,562 467 $67,415 41-50 621 255 $430,962 $300,222 558 $59,466 51-60 838 320 $322,471 $231,082 753 $61,378 61-70 653 327 $350,499 $189,135 578 $52,833 71-80 311 148 $212,703 $81,380 275 $47,288 81-90 161 98 $174,725 $62,481 130 $68,876 over 90 31 20 $165,677 $94,642 24 $56,824
Total 3,833 1,726 $437,040 $301,213 3,375 $72,971
$0
$500,000
$1,000,000
$1,500,000
$2,000,000
$2,500,000
Payment Averages by Age Group
Average paid indemnity Average economic loss

Medical Malpractice Annual Report | October 2021 42
Gender of claimant
This exhibit shows data by gender. For a few claims, the gender was reported as unknown (not shown).
Five-year period ending December 31, 2020
Gender
Total number
of claims
Claims with paid
indemnity Total paid indemnity
Average paid
indemnity
Average economic
loss
Claims with
defense costs
Total defense
costs
Average defense
costs Female 2,109 964 $352,317,742 $365,475 $229,546 1,839 $126,033,761 $68,534
Male 1,714 761 $401,812,627 $528,006 $392,131 1,526 $119,671,101 $78,421
The following charts show how injury outcomes52 and claimant ages were distributed by gender.
52 See page 29 for a more detailed breakdown of the injury outcome categories.

Medical Malpractice Annual Report | October 2021 43
Trends
This chart shows estimates of trends in frequency and severity.53 Average claim costs continued to increase.
Year closed Average paid
indemnity
Average limited
indemnity Average
defense costs
Average of limited
indemnity + defense costs
Number of claims closed
2011 $215,145 $174,386 $40,930 $113,385 1,207 2012 $169,887 $144,012 $50,081 $113,480 1,182 2013 $231,292 $179,372 $47,612 $127,190 1,126 2014 $269,353 $236,575 $58,177 $156,593 1,044 2015 $379,443 $222,156 $65,487 $147,684 1,020 2016 $281,556 $219,297 $65,419 $154,056 898 2017 $331,371 $195,488 $61,966 $138,538 814 2018 $453,832 $275,128 $71,904 $197,990 834 2019 $617,347 $285,945 $74,344 $194,213 677 2020 $581,535 $314,229 $96,951 $223,415 610 Annual trend 14.0% 7.3% 8.1% 7.4% -7.2%
Average limited indemnity amounts were calculated by restricting individual claims to a maximum of $1 million, which is a way to reduce volatility in the trend estimate. The estimated trend in the number of claims closed is low due to late-reported claims; there will likely be more claims than the 610 already reported for 2020. These trends in medical malpractice insurance costs are not reliable estimates of changes over time for several reasons. Medical malpractice claims can take several years to close and the averages shown for each closed-year include data from incidents that occurred over many years. Thus, trends estimated using closed-year data can be distorted by changes in claim settlement rates. Because of these distortions, the trend in the number of claims closed is a poor estimate of frequency trend. A frequency is calculated as the number of claims per exposure (e.g., per policy or per physician). Since insurers do not report policy counts, physician counts or other exposure data, we cannot calculate a true frequency trend. These trend estimates could also be distorted by changes in data reporting compliance over time.
53 An analysis of trends in frequency and severity is required by RCW 48.140.050(1)(a)(i). Trends shown are based on exponential least squares regression.

Medical Malpractice Annual Report | October 2021 44
Information about medical malpractice lawsuits This section of the report presents data submitted by plaintiffs’ attorneys following the resolution of lawsuits filed against health care providers and facilities.
Year settled
2016 2017 2018 2019 2020 Settlements reported by attorneys 42 34 31 12 9 Number of settlements with paid indemnity 40 31 31 9 9 Total paid indemnity $61,564,825 $27,239,000 $42,872,870 $7,890,000 $11,670,000 Average payment to claimant $1,539,121 $878,677 $1,382,996 $876,667 $1,296,667 Median payment to claimant $450,000 $475,000 $750,000 $500,000 $650,000 Total legal expenses $25,273,923 $11,347,914 $18,714,718 $3,540,712 $4,687,136 Total attorney fees $22,847,061 $9,520,746 $16,574,797 $2,915,485 $4,224,181 Average legal expense $601,760 $333,762 $603,701 $295,059 $520,793
Average fee paid to attorney $571,177 $307,121 $534,671 $323,498 $469,353 From January 1, 2016 through December 31, 2020, claimants received $151 million in compensation on 120 settlements, averaging $1.3 million per settlement. Claimants paid $64 million for legal expenses, averaging $496,597 per lawsuit. Claimants paid $56 million in attorney fees, or an average of $467,352 per settlement.54 On average, the attorney fee was 37.1% of the total compensation paid to the claimant. The average indemnity payment per settlement reported by attorneys was much higher than the average indemnity payment reported by insurers on a per-defendant basis. Per-lawsuit averages are expected to be higher than per-defendant averages, since settlements reported by attorneys can involve multiple defendants. Averages reported by attorneys may be biased high; attorneys might be less likely to report data to the OIC for lawsuits resulting in small indemnity payments.
54 Attorneys in this area of litigation typically work on a contingency basis, and receive fees if one or more defendants compensate the claimant.

Medical Malpractice Annual Report | October 2021 45
How lawsuits were settled
This exhibit shows data segmented by lawsuit settlement method.
Five-year period ending December 31, 2020
Lawsuit settlement method
Average legal
expense paid by claimant
Average paid indemnity to
claimant
Attorney fees per
settlement with
indemnity
Attorney fee as % of
indemnity Settled by parties $574,987 $1,373,600 $512,303 37.3% Alternative dispute resolution $441,803 $1,114,389 $407,019 36.5% Verdicts $203,218 $730,000 $292,200 40.0%
$0
$300,000
$600,000
$900,000
$1,200,000
$1,500,000
Settled by parties Alternative dispute resolution Verdicts
Average costs by settlement method
Average legal expense paid by claimant
Average paid indemnity to claimant
Attorney fees per settlement with indemnity
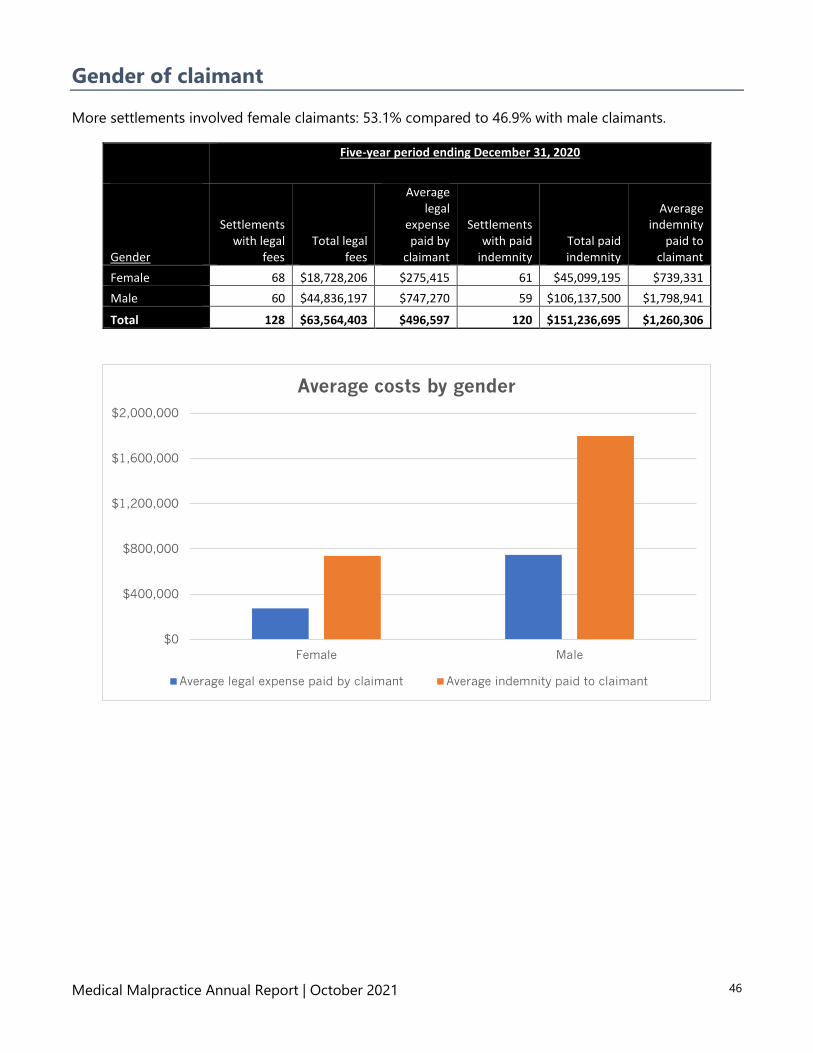
Medical Malpractice Annual Report | October 2021 46
Gender of claimant
More settlements involved female claimants: 53.1% compared to 46.9% with male claimants.
Five-year period ending December 31, 2020
Gender
Settlements with legal
fees Total legal
fees
Average legal
expense paid by
claimant
Settlements with paid
indemnity Total paid indemnity
Average indemnity
paid to claimant
Female 68 $18,728,206 $275,415 61 $45,099,195 $739,331 Male 60 $44,836,197 $747,270 59 $106,137,500 $1,798,941
Total 128 $63,564,403 $496,597 120 $151,236,695 $1,260,306
$0
$400,000
$800,000
$1,200,000
$1,600,000
$2,000,000
Female Male
Average costs by gender
Average legal expense paid by claimant Average indemnity paid to claimant

Medical Malpractice Annual Report | October 2021 47
Age of claimant
This exhibit shows data segmented by the age of the claimant.
Five-year period ending December 31, 2020
Age group
Settlements with legal expenses
Total legal expenses
Average legal expenses
Settlements with paid
indemnity Total paid indemnity
Average paid indemnity
Ages 0-20 15 $8,158,568 $543,905 15 $19,630,000 $1,308,667 Ages 21-30 9 $2,993,209 $332,579 9 $7,580,000 $842,222 Ages 31-40 16 $5,652,641 $353,290 16 $15,058,000 $941,125 Ages 41-50 23 $14,367,737 $624,684 20 $34,158,162 $1,707,908 Ages 51-60 18 $11,239,016 $624,390 16 $24,477,500 $1,529,844 Ages 61-70 24 $13,300,064 $554,169 24 $32,663,033 $1,360,960 Over 70 23 $7,853,168 $341,442 20 $17,670,000 $883,500 Total 128 $63,564,403 $496,597 120 $151,236,695 $1,260,306
$0
$400,000
$800,000
$1,200,000
$1,600,000
$2,000,000
Ages 0-20 Ages 21-30 Ages 31-40 Ages 41-50 Ages 51-60 Ages 61-70 Over 70
Average costs by age of claimant
Average legal expenses Average paid indemnity
Medical Malpractice Annual Report | October 2021 48
Counties
Attorneys reported settlement data by county where the medical incident occurred. To provide meaningful information regarding differences by location, we divided the state into eight regions.55
Five-year period ending December 31, 2020
Region
Settlements with legal expenses
Total legal expenses
Average legal expense
Settlements with paid
indemnity Total paid indemnity
Average paid indemnity
King 54 $37,319,292 $691,098 52 $87,423,370 $1,681,219 Clark 15 $2,834,955 $188,997 14 $7,356,163 $525,440 Puget Sound Metro 11 $5,391,169 $490,106 10 $13,655,000 $1,365,500 Yakima-Tri Cities 11 $1,735,138 $157,740 11 $3,950,000 $359,091 Pierce 10 $4,524,595 $452,460 10 $10,227,162 $1,022,716 Spokane 9 $4,795,320 $532,813 7 $12,375,000 $1,767,857 Snohomish 8 $5,498,406 $687,301 8 $13,050,000 $1,631,250 Remainder of state 10 $1,465,528 $146,553 8 $3,200,000 $400,000 Total 128 $63,564,403 $496,597 120 $151,236,695 $1,260,306
55 Under RCW 48.140.060 and RCW 42.56.400(10), some counties are grouped together to maintain confidentiality. Yakima-Tri Cities includes Benton, Franklin and Yakima counties. Puget Sound Metro includes Kitsap and Thurston counties.
$0
$400,000
$800,000
$1,200,000
$1,600,000
$2,000,000
King Clark PugetSoundMetro
Yakima-TriCities
Pierce Spokane Snohomish Remainderof state
Average costs by region
Average legal expense Average paid indemnity

Medical Malpractice Annual Report | October 2021 49
Report limitations Analysis based on historical closed claim data has multiple limitations:
1. There is a natural mismatch between premiums and losses used to calculate loss ratios and profitability ratios for commercial insurers. Premiums used for loss ratios are earned during the calendar year, but the amounts booked as incurred loss during the same calendar year are from claims from various accident years. As a result, most losses do not correspond to the same policies that the premium comes from.
2. Claims are reported based on the year in which they reach final resolution. Some arose from recent medical incidents, but many arose from incidents that occurred several years prior.
3. This report contains claims that closed during a limited period.
4. The Office of the Insurance Commissioner (OIC) cannot use data in this report to evaluate past or current medical professional liability insurance rates. Insurers develop medical malpractice rates using an analysis of open and closed claims, and develop rates based on an estimate of expected future claim costs and expenses.
5. In producing this report, the OIC relied upon data submitted by insurers, self-insurers, and attorneys. Data may contain anomalies. The OIC audits data and has adopted administrative rules that contain data definitions and reporting instructions, but the accuracy of the report still depends largely on the accuracy of the data reported by others. People who report data may interpret data fields differently or make errors.
6. The OIC did not adjust the data for economic differences occurring during the report period, such as inflation and the cost of medical care.
7. Insurers and self-insurers do not report policy limits, so the report does not analyze the data by type of policy, whether coverage is primary or excess, limits of coverage, or size of deductibles or retentions to determine if coverage limits affect the frequency or severity of claims.
8. Insurers and self-insurers reported data separately for each defendant. This reporting method may overstate the frequency of “incidents” and understate the severity of an “incident,” but it reduces inconsistencies and inaccuracies by limiting the amount of incomplete reporting.
9. This report analyzes only closed claims. Any claims that are still open, such as claims that are in settlement negotiations or on trial, are not included in this study. The analysis of closed claim information is valuable; however, open claims information may be more indicative of the current claims environment. For example, the impact of recent legislation or judicial decisions will not be reflected in a closed claim database.
10. Although insurers and self-insurers report data only after the claim has been closed, they occasionally re-open claims that were previously closed. Amounts reported may not be the true, ultimate amounts.

Medical Malpractice Annual Report | October 2021 50
Appendices

Medical Malpractice Annual Report | October 2021 51
Appendix A: Profitability
Physicians Insurance, a Mutual Company
(a) (b) (c) (d) (e) (f) (g) (h)
Year Net premium
written Net premium
earned Underwriting expense ratio
Loss and LAE ratio Dividend ratio
Combined ratio
[c+d+e]
Net investment
income ratio
Operating ratio [f-g]
2011 73,321,941 70,370,781 15.3% 82.7% 7.2% 105.1% 19.0% 86.2%
2012 67,765,626 65,640,184 17.9% 80.0% 7.7% 105.7% 19.4% 86.2%
2013 72,889,552 69,671,138 16.9% 85.2% 7.3% 109.3% 19.6% 89.7%
2014 76,701,101 75,121,138 16.6% 82.1% 6.7% 105.5% 19.8% 85.7%
2015 76,301,471 71,271,073 18.9% 84.4% 7.0% 110.3% 20.8% 89.5%
2016 78,240,313 78,437,989 20.9% 82.2% 6.4% 109.5% 18.8% 90.6%
2017 81,130,272 79,275,075 19.9% 81.0% 6.3% 107.3% 18.5% 88.7%
2018 94,256,910 93,442,936 20.5% 81.0% 5.4% 106.9% 16.1% 90.8%
2019 110,476,767 104,381,324 20.4% 88.5% 4.8% 113.7% 17.6% 96.0%
2020 115,217,227 109,632,385 26.4% 85.9% 4.6% 116.8% 11.3% 105.5%
Total 846,301,180 817,244,023 19.8% 83.6% 6.2% 109.5% 17.7% 91.8%
Five-year period-to-period results 2011-2015 366,979,691 352,074,314 17.1% 82.9% 7.2% 107.2% 19.7% 87.5%
2016-2020 479,321,489 465,169,709 21.9% 84.0% 5.4% 111.3% 16.2% 95.1%

Medical Malpractice Annual Report | October 2021 52
The Doctors Company, an Interinsurance Exchange
(a) (b) (c) (d) (e) (f) (g) (h)
Year Net premium
written Net premium
earned Underwriting expense ratio
Loss and LAE ratio Dividend ratio
Combined ratio
[c+d+e]
Net investment
income ratio
Operating ratio [f-g]
2011 564,467,114 536,671,691 21.4% 63.0% 3.3% 87.7% 26.1% 61.6%
2012 596,528,843 584,386,263 19.8% 69.1% 3.2% 92.1% 15.3% 76.8%
2013 675,729,455 641,792,914 21.2% 75.1% 3.1% 99.4% 15.5% 83.8%
2014 644,037,543 659,903,069 23.1% 78.3% 2.8% 104.2% 1.4% 102.7%
2015 622,861,093 628,266,492 24.2% 74.5% 3.8% 102.5% 4.4% 98.1%
2016 602,359,134 610,408,597 25.0% 77.7% 4.6% 107.3% 5.7% 101.6%
2017 595,891,924 600,702,260 24.9% 77.0% 3.8% 105.7% 12.0% 93.6%
2018 620,395,036 620,335,603 25.3% 85.7% 2.2% 113.2% 17.5% 95.7%
2019 627,555,678 623,780,051 28.2% 81.0% 1.4% 110.7% 11.3% 99.3%
2020 654,774,790 652,428,039 28.2% 73.6% 0.1% 101.9% 7.8% 94.1%
Total 6,204,600,610 6,158,674,979 24.2% 75.7% 2.8% 102.7% 11.4% 91.2%
Five-year period-to-period results 2011-2015 3,103,624,048 3,051,020,429 22.0% 72.4% 3.2% 97.6% 12.0% 85.6%
2016-2020 3,100,976,562 3,124,757,335 26.4% 79.0% 2.4% 107.7% 10.9% 96.9%
The Medical Protective Company
(a) (b) (c) (d) (e) (f) (g) (h)
Year Net premium
written Net premium
earned Underwriting expense ratio
Loss and LAE ratio Dividend ratio
Combined ratio
[c+d+e]
Net investment
income ratio
Operating ratio [f-g]
2011 327,172,569 302,854,289 24.6% 48.7% 0.0% 73.3% 31.5% 41.9%
2012 643,824,861 616,894,746 14.9% 71.7% 0.0% 86.6% 20.8% 65.8%
2013 366,900,050 371,799,546 24.1% 51.3% 0.0% 75.3% 32.8% 42.6%
2014 -680,001,929 -575,282,426 -3.1% 114.5% 0.0% 111.5% -17.0% 128.5%
2015 226,451,495 214,665,128 23.7% 59.5% 0.0% 83.2% 46.1% 37.2%
2016 255,837,377 228,980,322 23.7% 65.0% 0.0% 88.8% 39.5% 49.3%
2017 239,978,122 251,862,659 26.0% 58.0% 0.0% 84.0% 37.2% 46.7%
2018 260,421,768 260,308,096 24.0% 64.2% 0.0% 88.1% 40.2% 47.9%
2019 288,139,624 274,597,913 22.1% 72.5% 0.0% 94.6% 45.7% 48.8%
2020 347,993,367 349,375,371 19.9% 76.9% 0.0% 96.8% 35.9% 60.9%
Total 2,276,717,304 2,296,055,644 28.9% 51.3% 0.0% 80.2% 47.1% 33.1%
Five-year period-to-period results 2011-2015 884,347,046 930,931,283 38.4% 26.7% 0.0% 65.1% 58.2% 6.9%
2016-2020 1,392,370,258 857,057,316 22.9% 68.1% 0.0% 91.0% 39.5% 51.4%

Medical Malpractice Annual Report | October 2021 53
Appendix B: Reserve development
Physicians Insurance, a Mutual Company
Incurred net losses and defense and cost containment expenses ($000 omitted)
Year in which losses occurred 2011 2012 2013 2014 2015 2016 2017 2018 2019 2020
One-year dev.
Cumulative dev.
Prior 110,278 93,729 86,893 80,174 72,447 73,106 69,940 71,164 70,924 71,310 386 -38,968 2011 68,571 61,519 54,457 50,314 48,425 47,268 46,997 46,497 45,400 45,083 -317 -23,488 2012 64,479 58,836 60,309 54,902 49,046 48,009 47,525 47,022 46,361 -661 -18,118 2013 65,630 56,757 49,966 44,418 37,641 36,266 35,511 36,066 555 -29,564 2014 65,379 63,625 59,703 55,647 49,941 49,884 48,820 -1,064 -16,559 2015 67,830 64,651 65,694 62,944 64,173 62,406 -1,767 -5,424 2016 66,696 62,982 53,921 52,100 53,946 1,846 -12,750 2017 66,331 68,246 69,232 69,300 68 2,969 2018 72,676 71,001 78,728 7,727 6,052 2019 77,955 70,307 -7,648 -7,648 2020 73,508 Total -875 -143,498
The Doctors Company, an Interinsurance Exchange
Incurred net losses and defense and cost containment expenses ($000 omitted)
Year in which losses occurred 2011 2012 2013 2014 2015 2016 2017 2018 2019 2020
One-year dev.
Cumulative dev.
Prior 531,063 469,938 434,032 382,784 364,135 360,035 356,733 356,506 349,631 349,611 -20 -181,452 2011 402,382 401,470 401,593 398,810 359,691 350,613 350,850 350,954 347,894 339,682 -8,212 -62,700 2012 437,363 421,491 420,738 407,422 369,422 332,719 327,824 322,939 316,038 -6,901 -121,325 2013 478,868 479,267 475,791 475,791 458,008 457,972 433,614 410,681 -22,933 -68,187 2014 523,776 523,475 523,475 520,327 519,162 425,875 394,734 -31,141 -129,042 2015 499,160 499,644 498,925 495,904 483,729 461,959 -21,770 -37,201 2016 467,527 465,811 467,528 499,157 504,310 5,153 36,783 2017 466,642 466,886 490,691 490,901 210 24,259 2018 474,260 496,802 503,509 6,707 29,249 2019 463,018 470,539 7,521 7,521 2020 456,428 Total -71,386 -502,095
The Medical Protective Company
Incurred net losses and defense and cost containment expenses ($000 omitted)
Year in which losses occurred 2011 2012 2013 2014 2015 2016 2017 2018 2019 2020
One-year dev.
Cumulative dev.
Prior 962,616 989,863 871,303 514,225 470,897 443,066 420,519 405,425 401,141 400,014 -1,127 -562,602 2011 282,074 314,451 301,159 169,322 154,949 146,890 136,678 129,861 125,390 126,770 1,380 -155,304 2012 322,195 315,585 163,486 159,471 152,546 135,840 127,642 124,086 124,535 449 -197,660 2013 322,225 157,295 155,514 149,149 139,670 129,103 122,557 121,004 -1,553 -201,221 2014 174,469 177,627 172,179 162,275 153,700 140,992 134,612 -6,380 -39,857 2015 186,030 183,767 175,535 168,667 160,859 152,707 -8,152 -33,323 2016 185,285 184,199 180,654 175,884 175,177 -707 -10,108 2017 187,661 185,686 182,851 186,928 4,077 -733 2018 193,274 193,409 197,958 4,549 4,684 2019 199,180 200,850 1,670 1,670 2020 211,449 Total -5,794 -1,194,454

Medical Malpractice Annual Report | October 2021 54
Appendix C: Rate filing information
Company Description Approved
Change
Filed Loss & LAE
Trend Effective
Date Medical Mutual Ins. Co. of N.C. Physicians and Surgeons New Program 0.0% 7/1/2021
Physicians Ins. A Mutual Co. Hospitals and Employed Physicians 2.1% 0.0% 7/1/2021
ProSelect Ins. Co. Hospitals 8.0% 2.4% 7/1/2021
Ins. Services Office Inc. Physicians, Surgeons and Dentists -20.0% -2.0% 5/1/2021
Doctors Co. An Interins. Exchange Physicians, Surgeons, Ancillary Health Care Providers 6.1% 2.0% 1/16/2021
Physicians Ins. A Mutual Co. Physicians and Surgeons 8.0% 1.5% 1/1/2021
ProAssurance Ins. Co. of America Chiropractors 17.0% 1.7% 12/1/2020
Cincinnati Ins. Co. Home Health Care and Health Care Facilities 15.8% 2.5% 9/1/2020
Ins. Services Office Inc. Physicians, Surgeons and Dentists -8.1% 0.0% 5/1/2020
MAG Mutual Ins. Co. Physicians and Surgeons New Program 0.0% 4/14/2020
Doctors Co. An Interins. Exchange Physicians, Surgeons, Ancillary Health Care Providers 7.3% 2.0% 1/1/2020
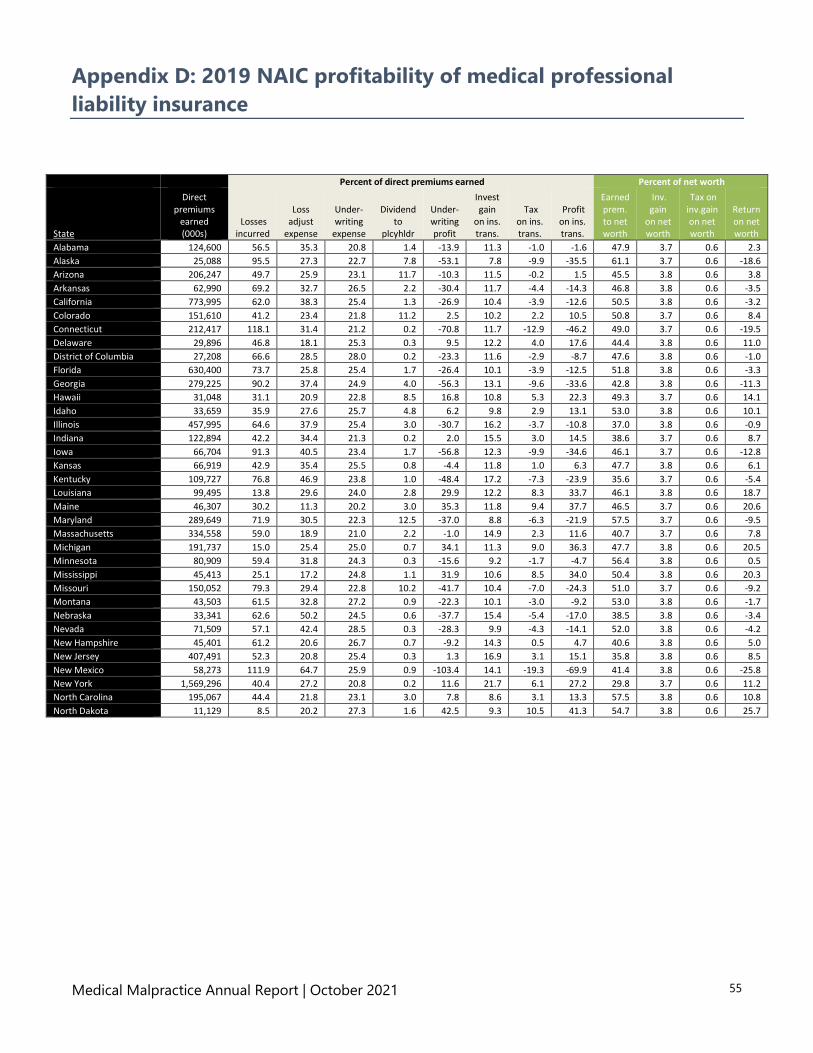
Medical Malpractice Annual Report | October 2021 55
Appendix D: 2019 NAIC profitability of medical professional liability insurance
Percent of direct premiums earned Percent of net worth
State
Direct premiums
earned (000s)
Losses incurred
Loss adjust
expense
Under-writing
expense
Dividend
to plcyhldr
Under-writing profit
Invest gain
on ins. trans.
Tax on ins. trans.
Profit on ins. trans.
Earned prem. to net worth
Inv. gain
on net worth
Tax on inv.gain on net worth
Return on net worth
Alabama 124,600 56.5 35.3 20.8 1.4 -13.9 11.3 -1.0 -1.6 47.9 3.7 0.6 2.3 Alaska 25,088 95.5 27.3 22.7 7.8 -53.1 7.8 -9.9 -35.5 61.1 3.7 0.6 -18.6 Arizona 206,247 49.7 25.9 23.1 11.7 -10.3 11.5 -0.2 1.5 45.5 3.8 0.6 3.8 Arkansas 62,990 69.2 32.7 26.5 2.2 -30.4 11.7 -4.4 -14.3 46.8 3.8 0.6 -3.5 California 773,995 62.0 38.3 25.4 1.3 -26.9 10.4 -3.9 -12.6 50.5 3.8 0.6 -3.2 Colorado 151,610 41.2 23.4 21.8 11.2 2.5 10.2 2.2 10.5 50.8 3.7 0.6 8.4 Connecticut 212,417 118.1 31.4 21.2 0.2 -70.8 11.7 -12.9 -46.2 49.0 3.7 0.6 -19.5 Delaware 29,896 46.8 18.1 25.3 0.3 9.5 12.2 4.0 17.6 44.4 3.8 0.6 11.0 District of Columbia 27,208 66.6 28.5 28.0 0.2 -23.3 11.6 -2.9 -8.7 47.6 3.8 0.6 -1.0 Florida 630,400 73.7 25.8 25.4 1.7 -26.4 10.1 -3.9 -12.5 51.8 3.8 0.6 -3.3 Georgia 279,225 90.2 37.4 24.9 4.0 -56.3 13.1 -9.6 -33.6 42.8 3.8 0.6 -11.3 Hawaii 31,048 31.1 20.9 22.8 8.5 16.8 10.8 5.3 22.3 49.3 3.7 0.6 14.1 Idaho 33,659 35.9 27.6 25.7 4.8 6.2 9.8 2.9 13.1 53.0 3.8 0.6 10.1 Illinois 457,995 64.6 37.9 25.4 3.0 -30.7 16.2 -3.7 -10.8 37.0 3.8 0.6 -0.9 Indiana 122,894 42.2 34.4 21.3 0.2 2.0 15.5 3.0 14.5 38.6 3.7 0.6 8.7 Iowa 66,704 91.3 40.5 23.4 1.7 -56.8 12.3 -9.9 -34.6 46.1 3.7 0.6 -12.8 Kansas 66,919 42.9 35.4 25.5 0.8 -4.4 11.8 1.0 6.3 47.7 3.8 0.6 6.1 Kentucky 109,727 76.8 46.9 23.8 1.0 -48.4 17.2 -7.3 -23.9 35.6 3.7 0.6 -5.4 Louisiana 99,495 13.8 29.6 24.0 2.8 29.9 12.2 8.3 33.7 46.1 3.8 0.6 18.7 Maine 46,307 30.2 11.3 20.2 3.0 35.3 11.8 9.4 37.7 46.5 3.7 0.6 20.6 Maryland 289,649 71.9 30.5 22.3 12.5 -37.0 8.8 -6.3 -21.9 57.5 3.7 0.6 -9.5 Massachusetts 334,558 59.0 18.9 21.0 2.2 -1.0 14.9 2.3 11.6 40.7 3.7 0.6 7.8 Michigan 191,737 15.0 25.4 25.0 0.7 34.1 11.3 9.0 36.3 47.7 3.8 0.6 20.5 Minnesota 80,909 59.4 31.8 24.3 0.3 -15.6 9.2 -1.7 -4.7 56.4 3.8 0.6 0.5 Mississippi 45,413 25.1 17.2 24.8 1.1 31.9 10.6 8.5 34.0 50.4 3.8 0.6 20.3 Missouri 150,052 79.3 29.4 22.8 10.2 -41.7 10.4 -7.0 -24.3 51.0 3.7 0.6 -9.2 Montana 43,503 61.5 32.8 27.2 0.9 -22.3 10.1 -3.0 -9.2 53.0 3.8 0.6 -1.7 Nebraska 33,341 62.6 50.2 24.5 0.6 -37.7 15.4 -5.4 -17.0 38.5 3.8 0.6 -3.4 Nevada 71,509 57.1 42.4 28.5 0.3 -28.3 9.9 -4.3 -14.1 52.0 3.8 0.6 -4.2 New Hampshire 45,401 61.2 20.6 26.7 0.7 -9.2 14.3 0.5 4.7 40.6 3.8 0.6 5.0 New Jersey 407,491 52.3 20.8 25.4 0.3 1.3 16.9 3.1 15.1 35.8 3.8 0.6 8.5 New Mexico 58,273 111.9 64.7 25.9 0.9 -103.4 14.1 -19.3 -69.9 41.4 3.8 0.6 -25.8 New York 1,569,296 40.4 27.2 20.8 0.2 11.6 21.7 6.1 27.2 29.8 3.7 0.6 11.2 North Carolina 195,067 44.4 21.8 23.1 3.0 7.8 8.6 3.1 13.3 57.5 3.8 0.6 10.8 North Dakota 11,129 8.5 20.2 27.3 1.6 42.5 9.3 10.5 41.3 54.7 3.8 0.6 25.7

Medical Malpractice Annual Report | October 2021 56
Percent of direct premiums earned Percent of net worth
State
Direct premiums
earned (000s)
Losses incurred
Loss adjust
expense
Under-writing
expense
Dividend
to plcyhldr
Under-writing profit
Invest gain
on ins. trans.
Tax on ins. trans.
Profit on ins. trans.
Earned prem. to net worth
Inv. gain
on net worth
Tax on inv.gain on net worth
Return on net worth
Ohio 234,541 24.2 19.8 25.9 1.4 28.6 15.1 8.5 35.2 39.0 3.8 0.6 16.8 Oklahoma 97,263 51.2 33.2 25.9 0.2 -10.5 12.8 -0.1 2.4 44.0 3.8 0.6 4.2 Oregon 92,084 97.3 30.8 23.3 1.4 -52.8 9.9 -9.4 -33.4 52.5 3.8 0.6 -14.4 Pennsylvania 697,906 54.8 27.6 20.1 0.2 -2.7 13.8 1.7 9.3 42.7 3.7 0.6 7.1 Rhode Island 30,080 81.1 44.4 23.6 0.2 -49.1 26.5 -5.9 -16.7 25.0 3.7 0.6 -1.1 South Carolina 76,639 60.0 28.9 26.4 3.8 -19.2 13.0 -1.8 -4.3 43.5 3.8 0.6 1.3 South Dakota 15,950 81.4 22.1 28.5 0.2 -32.1 9.6 -5.1 -17.4 54.4 3.8 0.6 -6.3 Tennessee 225,339 70.6 39.0 20.4 2.7 -32.7 15.9 -4.2 -12.5 37.8 3.7 0.6 -1.6 Texas 337,319 48.3 30.6 26.5 0.3 -5.6 10.3 0.5 4.1 51.3 3.8 0.6 5.3 Utah 56,472 54.0 42.5 23.9 2.6 -22.9 12.1 -2.8 -8.0 46.9 3.8 0.6 -0.6 Vermont 16,167 117.2 39.7 36.0 1.8 -94.5 12.8 -17.7 -64.0 43.0 3.9 0.6 -24.3 Virginia 188,541 42.7 17.8 26.6 2.6 10.5 9.9 3.9 16.5 52.5 3.8 0.6 11.8 Washington 192,612 78.8 37.1 22.4 2.6 -40.8 9.8 -6.9 -24.1 54.2 3.7 0.6 -9.9 West Virginia 97,507 57.0 21.3 22.2 3.8 -4.2 7.7 0.4 3.0 64.2 3.7 0.6 5.1 Wisconsin 75,009 48.0 33.9 22.1 0.3 -4.3 12.5 1.2 7.0 45.0 3.7 0.6 6.3 Wyoming 19,407 19.3 16.1 26.7 2.1 35.9 10.9 9.4 37.4 49.8 3.8 0.6 21.8 Guam 852 -26.0 -11.0 29.0 0.1 108.0 9.5 24.3 93.2 53.0 3.8 0.6 52.6 Puerto Rico 68,523 35.3 22.5 25.0 0.0 17.3 9.2 5.2 21.4 55.9 3.8 0.6 15.1 U.S. Virgin Islands 271 -57.1 15.7 35.2 0.7 105.6 5.5 23.1 88.0 74.4 3.9 0.7 68.7 N Mariana Islands 5 68.4 14.2 30.0 0.0 -12.5 8.2 -1.3 -3.1 63.0 3.8 0.6 1.2 Countrywide 9,608,241 56.9 29.6 23.4 2.2 -12.0 13.8 -0.2 2.0 42.0 3.7 0.6 4.0