The effects of mine waste contamination at multiple levels of biological organization
19
Ecological Engineering 24 (2005) 101–119 The effects of mine waste contamination at multiple levels of biological organization Daniel Peplow ∗ , Robert Edmonds University of Washington, College of Forestry, Center for Streamside Studies, 3841 42nd Avenue, NE Seattle, WA 98105, USA Accepted 1 November 2004 Abstract This study shows that metal-contaminated sediments cause adverse biological effects at all levels of biological organization, from cellular to ecosystem-level responses, even where the corresponding surface water meets water-quality-based criteria. We studied the effects of contamination from the abandoned Alder Mine, Alder Mill, and Red Shirt Mill located near the town of Twisp on the eastern slopes of the north Cascade Mountains in Okanogan County, Washington (U.S.A.) on fish and wildlife habitat in the Methow River. Ore deposits in the area were mined for gold, silver, copper and zinc until the early 1950s. An up-gradient and down-gradient approach was used to compare impacted sites to control sites. Although the dissolved metal concentrations in the Methow River were below the limits of detection, eight elements were identified as contaminants of potential environmental concern (COPECs) in sediments. Results revealed contamination impacts at ecosystem, community, population, individual, cellular, subcellular, and molecular levels. Metal contaminants in forest soils around the mines were present at concentrations toxic to soil bacteria suggesting that functional properties related to nutrient cycling and energy flow have been effected. Exposed trout in the Methow River showed reduced growth compared to controls. Histopathological evidence is consistent with copper-induced metabolic disease. Glycogen bodies were present in trout hepatocyte cytosol and nuclei and the presence of glycogen inclusions was pathognomic of Type IV glycogen storage disease (GSD IV). This condition suggests food is being converted into glycogen and stored in the liver and that the glycogen is not being converted back normally into glucose for distribution to other tissues in the body, which is a likely cause for the poor growth and development observed in fish and macroinvertebrates. Glycogen storage disease is caused by either a deficiency or inactivation of the glycogen branching enzyme, which results in the synthesis of an abnormal glycogen molecule that is insoluble due to a decreased number of branch points and increased chain length. Further examination of hepatocytes by transmission electron microscopy also revealed the accumulation of electron-dense metal-granules in the mitochondrial matrix. © 2005 Elsevier B.V. All rights reserved. Keywords: Abandoned mines; Trace element contamination; Sediment; Bioindicators; Ecological risk; Molecular to ecosystem risk; Glycogen storage disease ∗ Corresponding author. Tel.: +1 206 524 4652; fax: +1 206 543 3254. E-mail address: [email protected] (D. Peplow). 1. Introduction The effects of contamination from abandoned mine waste occur at all levels of biological organization and 0925-8574/$ – see front matter © 2005 Elsevier B.V. All rights reserved. doi:10.1016/j.ecoleng.2004.12.011
-
Upload
independent -
Category
Documents
-
view
3 -
download
0
Transcript of The effects of mine waste contamination at multiple levels of biological organization
Ecological Engineering 24 (2005) 101–119
The effects of mine waste contamination at multiplelevels of biological organization
Daniel Peplow∗, Robert Edmonds
University of Washington, College of Forestry, Center for Streamside Studies, 3841 42nd Avenue, NE Seattle, WA 98105, USA
Accepted 1 November 2004
Abstract
This study shows that metal-contaminated sediments cause adverse biological effects at all levels of biological organization,from cellular to ecosystem-level responses, even where the corresponding surface water meets water-quality-based criteria. Westudied the effects of contamination from the abandoned Alder Mine, Alder Mill, and Red Shirt Mill located near the town ofTwisp on the eastern slopes of the north Cascade Mountains in Okanogan County, Washington (U.S.A.) on fish and wildlifehabitat in the Methow River. Ore deposits in the area were mined for gold, silver, copper and zinc until the early 1950s. Anup-gradient and down-gradient approach was used to compare impacted sites to control sites. Although the dissolved metalconcentrations in the Methow River were below the limits of detection, eight elements were identified as contaminants ofpotential environmental concern (COPECs) in sediments. Results revealed contamination impacts at ecosystem, community,population, individual, cellular, subcellular, and molecular levels. Metal contaminants in forest soils around the mines werepresent at concentrations toxic to soil bacteria suggesting that functional properties related to nutrient cycling and energy flowh l evidencei nuclei andt suggestsf ally intog served infi branchinge r of branchp vealed thea©
K Glycogens
f ineand
0
ave been effected. Exposed trout in the Methow River showed reduced growth compared to controls. Histopathologicas consistent with copper-induced metabolic disease. Glycogen bodies were present in trout hepatocyte cytosol andhe presence of glycogen inclusions was pathognomic of Type IV glycogen storage disease (GSD IV). This conditionood is being converted into glycogen and stored in the liver and that the glycogen is not being converted back normlucose for distribution to other tissues in the body, which is a likely cause for the poor growth and development obsh and macroinvertebrates. Glycogen storage disease is caused by either a deficiency or inactivation of the glycogennzyme, which results in the synthesis of an abnormal glycogen molecule that is insoluble due to a decreased numbeoints and increased chain length. Further examination of hepatocytes by transmission electron microscopy also reccumulation of electron-dense metal-granules in the mitochondrial matrix.2005 Elsevier B.V. All rights reserved.
eywords:Abandoned mines; Trace element contamination; Sediment; Bioindicators; Ecological risk; Molecular to ecosystem risk;torage disease
∗ Corresponding author. Tel.: +1 206 524 4652;ax: +1 206 543 3254.
E-mail address:[email protected] (D. Peplow).
1. Introduction
The effects of contamination from abandoned mwaste occur at all levels of biological organization
925-8574/$ – see front matter © 2005 Elsevier B.V. All rights reserved.doi:10.1016/j.ecoleng.2004.12.011
102 D. Peplow, R. Edmonds / Ecological Engineering 24 (2005) 101–119
there are potential indicators at each level (Hodson,1990; Clements, 2000; Clements and Kiffney, 1994).Reduced nutrient cycling and energy flow at the ecosys-tem level, reduced diversity and abundance at the com-munity level, and reduced growth and increased mortal-ity among individual members of endangered speciesat the population level are more relevant to resourcemanagers and ecologists than effects at lower levels ofbiological organization. However, the degree to whichcause and effect are related (i.e., specificity) and knowl-edge of the mechanisms of toxicity is less completeat higher levels of organization (Hodson, 1990). Al-though indicators of toxicity such as morphologicalchanges at the tissue level, ultrastructural changes at thecellular level, and biochemical changes at the molec-ular level reveal cause-and-effect relationships, im-pact on ecologically relevant processes are not easy torecognize.
When ecological studies focus on the comparisonof groups rather than individuals, direct links betweencause-and-effect are often tenuous (Clements, 2000)and susceptible to biases that pertain to the lack of in-dividual data on exposure, outcomes, and confoundingvariables that contribute to the measured effect. Thesebiases, referred to as the ecological fallacy bySelvin(1958), have been discussed byMorgenstern (1995)andHopenhayn-Rich et al. (2000).
At lower levels of organization, endpoints maybe more easily linked to cause, occur more rapidly,and may provide early warnings of toxicological ef-f 0D ande velso nif-i logi-c og-i ina-t alo
ful-n thea or-d evi-da asei n ofc tivem -
tion of the liver storage capacity results in the distri-bution of copper to extrahepatic tissues with multipleorgan dysfunction. It was found that the diagnosis ofWilson’s disease can be made based on the presenceof glycogen nuclei, glycogen bodies, copper storagein lysosomes, and especially mitochondrial changesincluding changes in electron density (Phillips et al.,1987).
Electron microscopy was also used to observe theeffect of divalent cations on in vitro cell cultures bathedin media containing calcium, strontium, lead, man-ganese, barium, and magnesium.Peachy (1964)andWalton (1973)showed that divalent cations accumu-late as spherical electron-dense granules in the ma-trix of mitochondria. The lighter elements (e.g., cal-cium) produced less dense granules and the heavierelements (e.g., lead and barium) produced denser gran-ules 200–800 nm in diameter, some of these with lessdense cores.
The presence of submitochondrial granules accu-mulating heavy metals was also found to coincide withthe toxicity data for aquatic organisms (Argese et al.,1996). The effective concentration to cause a 50% de-crease in the measured response (i.e., EC50) data forsubmitochondrial granules in in vitro cultures, com-pared to in vitro toxicity data from a variety of otherbioassays, suggested the matrix granules are indica-tors of metal toxicity for fish and aquatic invertebratespecies. It is not known, however, whether these resultsare relevant to field conditions.
s oft oft 0.6o e-t nkr ltiplel illh ededt ndw
ast dr a-t rwa-t 8 tois trout
ects on populations (Hodson, 1990; Clements, 200).espite the greater mechanistic understandingndpoint-response specificity, effects at lower lef organization may be limited because the sig
cance of a biochemical response at the ecoal level is not obvious. The usefulness of biolcal indicators depends, therefore, on the examion of indicators at multiple levels of biologicrganization.
At the subcellular level, the specificity and useess of electron microscopy is evident based onbility to diagnose toxicological and metabolic disers even when effects at higher levels are notent (Phillips et al., 1987). In white perch (Moronemericana), hepatic copper storage (Wilson’s) dise
s characterized by the progressive accumulatioopper in hepatic lysosomes bound to cytoprotecetallothioneins (Bunton and Frazier, 1994). Satura
This study, conducted along the middle reachehe Methow River, extending from the confluencehe Chewuch River at Winthrop (River Kilometer 8r River Mile 50.1) to the town of Carlton (Kilom
er 43.3 26.8 or River Mile River), attempted to liesponses to trace element contamination at muevels of organization. The results of this study welp describe the kinds of ecological changes ne
o improve the survival and productivity of fish aildlife populations.Chinook salmon (Oncorhynchus tshawytsch),
teelhead/rainbow trout (Salmo gairdneri) and bullrout (Salvelinus confluentus) migration, spawning anearing occur in this portion of the Methow River wershed. A survey was conducted by direct undeer observation (snorkeling) on 4 September 199dentify salmonids in Alder Creek (Peplow, 1998). Thepecies identified were native steelhead/rainbow
D. Peplow, R. Edmonds / Ecological Engineering 24 (2005) 101–119 103
(S. gairdneri) and Chinook salmon (O. tshawytscha).Two redds (gravel nests of salmon eggs) in the MethowRiver at the Red Shirt Mill were identified on 10 and23 October 2000. Two coho (O. kisutch), parr (i.e., lifestage between fry and smolt stages, generally reachedby the end of the first summer) were observed on 27 Jan-uary 2001 in the last pond on Alder Creek after ice meltand before water levels and runoff were sufficientlyhigh to provide surface flow and an outlet from the pondto the Methow River. Upper Columbia River summersteelhead (O.mykiss), including the Methow River run,were listed under the Endangered Species Act (ESA)as “endangered” on 18 August 1997. Upper ColumbiaRiver spring Chinook salmon (O. tshawytscha), in-cluding the Methow River run, were listed under theESA as “Endangered” on 16 March 1999. Bull troutin the Methow River were listed under the ESA as“threatened” on 10 June 1998. Although not an ESAlisted species, summer Chinook (O. tshawytscha) alsospawn in the Methow River and have experienced asevere decline in numbers of returning adults. Sum-mer Chinook are identified as “depressed” by theWashington Department of Fish and Wildlife. Whileit is clear that tributaries to the Methow River havebeen impaired by heavy metals from abandoned minewaste, the impact of metals from abandoned mines onsalmonid habitat in the Methow River has not beendetermined.
The study estimated the risk and measured the ac-tual impacts on biological endpoints from trace elementc ands ion.T teml soiln m-i ess-m ts ofd uaticm t thep c inb cen-t lar-v velso es ins cur-r evel,u atorso
2. Methods
2.1. Site description
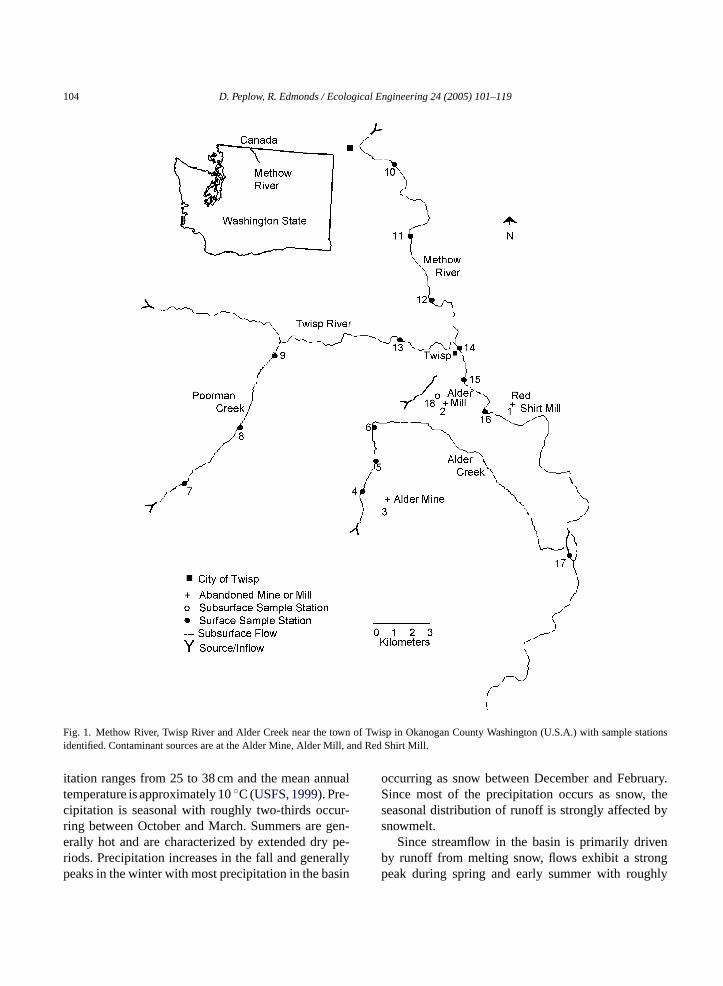
The study site is located near the town of Twisp inOkanogan County, Washington (Fig. 1). The MethowRiver basin is located in north central Washington eastof the Cascade mountains and is bordered by Canada onthe north. Draining nearly 4662 km2, the Methow Riverflows southward through western Okanogan Countyand empties into the Columbia River at River Kilo-meter 843 (River Mile 523.9) near the town of Pateros.The Methow watershed extends approximately 140 km(87 mile) from the confluence with the Columbia Riverto its headwaters located along the Cascade Crest andthe Canadian border.
Topography within the Methow River basin rangesfrom mountainous terrain along the Cascade Crest toa gently sloping, wide valley found along the middlereaches. Elevation ranges from 2600 m in the headwa-ters of the basin to approximately 240 m at the con-fluence of the Methow and Columbia Rivers. Soils inthe valley consist of sandy loams that are underlain byalluvium and glacial outwash with very rapid perme-ability (Waitt, 1972). The major groundwater aquifersof the Methow Valley exist in layers of unconsolidatedsediments underlain by bedrock. Groundwater occur-rence, movement and availability are primarily relatedto recharge sources and the configuration of deposi-tional sediments.
sil-v em-i neo ouss cks( db d at1O em-pb d thes f bi-c inityo7 byb
byC cip-
ontamination in soil, surface water, groundwater,ediments at various levels of biological organizathe objectives of this study were (1) at the ecosys
evel, estimate the risk of metal contamination onutrient cycling and energy flow by comparing conta
nant levels to benchmarks for ecological risk assent, (2) at the community level, estimate the effecissolved and sediment metal contamination on aqacroinvertebrate diversity and abundance, (3) aopulation level, use the accumulation of arseniear hair and copper in Aspen leaves and the con
ration of copper in the bodies of aspen leaf minerae as indicators of exposure to potentially toxic lef contaminants, (4) at the tissue level, use changtained sections of fish liver tissue to detect the ocence of specific diseases, and (5) at the cellular lse ultrastructural changes in hepatocytes as indicf disease.
The ore deposits that were mined for gold,er, copper and zinc are composed largely of chcally precipitated silica in a 4.6–22.9 m wide zof Cretaceous-Jurassic plutonic (intrusive) ignetock (granite) in the Newby Group of volcanic roBarksdale, 1975). The Newby Group was intrudey the Alder Creek stock, which has been date37± 3 million years (Burnet, 1976; Bunning, 1990).re minerals were deposited possibly during thelacement of the Alder stock (Barksdale, 1975). Car-onate rocks are found in the drainage basin antreams and rivers contain high concentrations oarbonate and are thus hardwater in nature. Alkalf the Methow River is 103± 14 mg L−1 and the pH is.2± 0.5, which is typical of a system dominatedicarbonate (Stumm and Morgan, 1996).
The climate in the Methow Valley is dominatedascade Mountain rain shadow. Mean annual pre
104 D. Peplow, R. Edmonds / Ecological Engineering 24 (2005) 101–119
Fig. 1. Methow River, Twisp River and Alder Creek near the town of Twisp in Okanogan County Washington (U.S.A.) with sample stationsidentified. Contaminant sources are at the Alder Mine, Alder Mill, and Red Shirt Mill.
itation ranges from 25 to 38 cm and the mean annualtemperature is approximately 10◦C (USFS, 1999). Pre-cipitation is seasonal with roughly two-thirds occur-ring between October and March. Summers are gen-erally hot and are characterized by extended dry pe-riods. Precipitation increases in the fall and generallypeaks in the winter with most precipitation in the basin
occurring as snow between December and February.Since most of the precipitation occurs as snow, theseasonal distribution of runoff is strongly affected bysnowmelt.
Since streamflow in the basin is primarily drivenby runoff from melting snow, flows exhibit a strongpeak during spring and early summer with roughly

D. Peplow, R. Edmonds / Ecological Engineering 24 (2005) 101–119 105
60% of the mean annual discharge occurring duringMay and June (Milhous et al., 1976). Streamflow re-mains relatively high during July, but decreases sub-stantially from August to October in response to a re-duced snowpack, low precipitation, and decreased soilmoisture. Streamflow in the Methow River reaches anannual low during late September and early October,with some sections going subsurface during dry years.Conversely, during wetter years, autumn precipitationmay cause a slight increase in surface stream flows.Winter flows typically remain low in response to lowautumn precipitation and freezing winter temperatures.Freezing temperatures retain moisture in the snowpack and freeze soil moisture. Brief warming trendsin the winter months can melt snow or cause precipi-tation to fall as rain, slightly increasing stream flows.Runoff between years is highly variable and maximumand minimum flows for the Methow River at Twispwas 1155 m3 s−1 (May 1948) and 4 m3 s−1 (September1926).
2.2. Mine and Mill site descriptions
The locations of Alder Mine, Alder Mill, and RedShirt Mill are shown inFig. 1. Alder Mine is locatedapproximately 4.8 km southwest of Twisp (Fig. 1).The site consists of two adits (i.e., tunnels open atone end), an adit-discharge retention pond, an openpit, and waste rock dumps. The site is on the northslope of a north-trending ridge. Slopes at the siter ho-t . Thefl om0s(
tho esto erM -s ts,a tail-i roxi-m sup-p entc Thep entv be-
low the surface depending on time of year and snowmelt.
The Red Shirt Mill is also located approximately1 km south of Twisp at River Kilometer 63 km (RiverMile 39) from the Columbia River but approximately100 m east of the Methow River. The mill consistsof a single building and a tailings pile. The tail-ings pile, which extends to the east bank of theMethow River, is estimated to cover 1 ha of surfacearea.
2.3. Sampling
Ten domestic drinking water wells located adja-cent to the Alder Mill, near Alder Creek below AlderMine, and adjacent to the Red Shirt Mill (Fig. 2, num-bers 1–10), and one reference well that was isolatedfrom mine impacts (Fig. 2, number 11) was sam-pled between October 1999 and June 2001. Samplesof water from private domestic wells were collectedfrom well casings using disposable Teflon bailers andstored in pre-cleaned 50-mL polypropylene centrifugetubes.
All other surface water and groundwater sampleswere collected in pre-cleaned Teflon bottles. Sub-
F ereg ami-n ncew
ange from 50 to 80%. Estimates from aerial pographs indicate that waste rock covers over 15 haow rate of drainage from the north adit ranges fr.14 to 0.42 m3 s−1 (5–15 L min−1). South adit flow iseasonal and ranges from 0 to less than 0.14 m3 s−1
5 L min−1).The Alder Mill is located approximately 1 km sou
f Twisp, Washington, and approximately 500 m wf the Methow River at River Kilometer 63 km (Rivile 39) from the Columbia River. The Mill con
ists of two buildings, two tailings impoundmennd scattered waste rock and ore piles. The
ngs impoundments are estimated to cover appately 4 ha of surface area. Inputs and springslied by Alder Creek feed the upper impoundmreating a contaminated wetlands environment.hreatic surface in the upper tailings impoundmaries spatially and temporally between 0 and 4 m
ig. 2. Location of private drinking water wells and locations whroundwater samples were collected in the vicinity of the contant sources at Alder Mine, Alder Mill and Red Shirt Mill. Refereells number 11 and 12 are also identified.
106 D. Peplow, R. Edmonds / Ecological Engineering 24 (2005) 101–119
samples were filtered (Gellman, Inc. 0.45�m, dis-posable 25 mm sterile disposable Acrodisc® filter)and preserved to pH < 2 with 0.15% nitric acid andstored at 5◦C. Sediment samples were collected us-ing plastic scoops at a shallow depth (<5 cm) andimmediately wet sieved in ambient water through a63�m sieve. Samples were dried to constant weight at90◦C.
All analyses were performed within 30 days of sam-ple collection. Samples of water and sediment were an-alyzed at the University of Washington, College of For-est Resources Analytical Laboratory in Seattle, Wash-ington. The concentrations of metals in water and sedi-ment samples were determined by inductively coupledplasma atomic emission spectrophotometry (ICP-AES;Thermo Jarrell Ash® ICAP 61E). Samples were an-alyzed for arsenic by hydride generated atomic fluo-rescence spectrophotometry (HG-AFS). All water andsediment sampling equipment was cleaned by wash-ing with Liquinox® detergent and sequential rinseswith distilled water, dilute nitric acid, and deionizedwater.
2.4. Contaminants of potential ecological concern(COPECs)
Fig. 1 shows the location of sampling stations fortailings, acid mine drainage, and Methow River waterand sediments. A total of 34 grab samples were col-lected from the waste piles at the three mine sites. Sed-i g them pli-c eachs thea sedi-m –16)d ites.S cteda
ern( en-t nds ered y,
inw -tt om-
munities; and byOpresko et al. (1994)for the exposureof wildlife to food, water, and soil.
2.5. Ecosystem level response to contaminants
It was assumed there was an ecosystem-level riskwhen a contaminant exceeded a toxicity benchmarkvalue for the exposure of soil invertebrates and mi-crobial communities (Will and Suter, 1994) and if thefunctional property of a community or population isof interest and not the community or population itself(e.g., soil bacteria and nutrient cycling).
Respiration was also measured to provide evidenceof ecosystem impacts from trace metal contamination.These measurements were taken along a transect withthree sites in a 1-year old clear-cut on the west side ofAlder Creek across from the mine, three sites in theconifer forest north and adjacent to the mine and threesites in the conifer forest impacted by mine tailings.Respiration was measured three times each in July andOctober 1999.
Soil respiration was determined using the soda-limetrap method (Edwards, 1982). The diameter of eachrespirometer was 10 cm. Thirty grams of soda-lime wasweighed into four jars 7 cm in diameter (47% of therespirometer). The open jars of soda-lime were dried8 h at 100◦C, capped and the initial dry weight wasrecorded. In the field, the jars of soda-lime were openedand placed over sample sites located in the forest belowthe Alder Mine tailings pile, in the forest adjacent to thet her trolu ludedw osedf thel ed,tt ded.R to-td
2
ver-t ldera dt reek
ments were sampled at each sample station alonainstem of the Methow and Twisp Rivers. Four re
ates of water and sediments were collected atample station (10–12) upstream from Twisp andbandoned mine sites. Ten replicates of water andents were collected from each sample station (14ownstream from Twisp and the abandoned mine seven replicates of acid mine drainage were collet station 3.
Contaminants of potential ecological concCOPECs) were identified by comparing the concrations of metals in tailings, AMD, groundwater, aediments to ecotoxicological benchmarks, which werived from primary literature (Suter and Mabre
1994) for the exposure of aquatic life to chemicalsater;Hull and Suter (1994)for the exposure of ben
hic organisms to sediments;Will and Suter (1994)forhe exposure of soil invertebrates and microbial c
ailings pile, in a clear-cut opposite the tailings pile. Tespirometers were installed over the jars. A consing a respirometer capped at both ends was incith each set of samples. The soda-lime was exp
or 24 h then the jars were capped and returned toaboratory. Gross weight before drying was recordhe jars were then opened and dried for 8 h at 100◦C,hen the final dry weight was determined and recorespiration rates of controls were subtracted from
al mass and respiration was expressed as g m−2 CO2ay−1.
.6. Community level response to contaminants
Surface water, sediment, and benthic macroinebrate samples were collected at stations along And Poorman Creeks (Fig. 1). Sample stations include
hree stations (4–6) on Alder Creek and Poorman C
D. Peplow, R. Edmonds / Ecological Engineering 24 (2005) 101–119 107
(7–9). Station 4 was located directly below the mineoutfall. Two stations (5 and 6) were spaced approx-imately 0.5 km apart below the mine. All chemicalanalyses for heavy metals were performed by ICPatomic emission spectrophotometry (Thermo JarrellAsh® ICAP 61E).
Biological assessments were accomplished us-ing a 0.09-m2 Surber sampler (15 meshes cm−1,0.66 mm mesh−1), and samples at the six sites (4–9)were collected in triplicate twice, once near high-flowand again near low-flow conditions (June and Septem-ber 1998). Benthic invertebrate samples were collectedfrom riffles in the same general vicinity as the water andsediment samples. At each of the sample sites, Surbersamples were taken and sorted following standard pro-cedures for the analysis of benthic macroinvertebratecommunity structure. Taxonomic identifications weremade primarily usingMerritt and Cummins (1996). Or-ganism genera were identified using a 7-65X stereo mi-croscope, except for Diptera and Chloroperlidae, whichwere identified to the family level. Taxa richness andabundance were determined. Triplicate surface waterand sediment samples were also collected at the samegeneral locations and time as the Surber samples.
2.7. Population level response to contaminants
Five populations were evaluated for exposure tomine waste contamination. First, health risks to hu-mans (Homo sapiens) in the vicinity of the abandonedm r ex-p romd allyt ackb ono ccu-mcp rem , int on-tw ight,a tinge
ic-i cal-c and
on an estimate of water consumption rates. This studyused the default drinking water intake rate of 2 L day−1
for adults (70 kg body mass) (EPA, 1980). To estimatethe average daily dose, the daily water intake rate wasmultiplied by the arithmetic mean concentration of thecontaminant in well water, in�g L−1, then divided by70 kg for adults.
Exposure was expressed in terms of both the non-carcinogenic toxicity and carcinogenic risks. Noncar-cinogenic toxicity risk (hazard quotient). Noncarcino-genic hazard quotient was calculated by dividing theaverage daily dose (�g kg-body-weight−1 day−1) bythe chronic reference dose (RfD; 0.3�g As kg-body-weight−1 day−1) (Calow, 1998; IRIS, 2001). Carcino-genic risks associated with arsenic were statementsof probability and were calculated by multiplying theaverage daily dose by a cancer slope factor (1/1500�g kg−1 day−1) (Calow, 1998; IRIS, 2001).
The exposure of resident bears (U. americanus) toarsenic was determined using a bear-hair capture tech-nique and a non-consumable liquid lure. Scent attrac-tant was placed on a log enclosed by a strand of barbedwire stretched approximately 50-cm above the groundto snag hair. The use of scent to attract bears ensuredthere was no possibility of food reward. Six samples ofhair from a single station in the vicinity of the AlderMine were collected for analysis over a 2-year pe-riod between 2000 and 2001. Arsenic concentrations inhair were measured by hydride generated atomic fluo-rescence spectrophotometry and compared to concen-t onef aisedi n)a d tob
-l derM as-p s-t shed( eafmd -l cteda lar-v ried,g ledp rvae
ine and mill sites were determined based on theiosure to arsenic in contaminated groundwater frinking water wells. Second, exposure to potenti
oxic levels of arsenic was also determined in blears (Ursus americanus) based on the accumulatif arsenic in the hair of these animals. Copper aulation in aspen leaves (Populus tremuloides) and its
oncentration in aspen leaf miner larvae (Phyllocnistisopuliella Cham. (Lepidoptera: Gracillaridae)) weeasured as third and fourth populations. Finally
he Methow River, the impacts of sediment metal camination on the caddisfly larva (Ecclesomyiaspp.)as determined based on differences in size, wend instar (i.e., the individual between insect molvents) development.
In this study, the risks of toxicity and carcinogenty to humans from arsenic in groundwater wereulated based on the concentration in the water
rations in reference samples from one male andemale bear, each 10-years-old, that had been rn captivity (Northwest Trek, Eatonville, Washingtond fed controlled diets in an environment assumee free of arsenic.
Samples of leaves from six aspen (Populus tremuoides) trees growing on the waste rock at the Al
ine (Fig. 1, site 3) and samples of leaves from fouren (Populus tremuloides) trees growing on the undi
urbed slope on the opposite side of the waterFig. 1, west of site 4) were collected. Aspen liner larvae (Phyllocnistis populiellaCham. [Lepi-optera: Gracillaridae]) from aspen (Populus tremuoides) leaves at the same locations were collend pooled to provide 0.5 g wet weight (80–100ae). Leaves were rinsed in deionized water, dround, and analyzed for metals by inductively couplasma atomic adsorption spectrophotometry. La
108 D. Peplow, R. Edmonds / Ecological Engineering 24 (2005) 101–119
were rinsed in deionized water, dried, ground, and an-alyzed for metals by inductively coupled plasma massspectrophotometry. The Student’st-test was used tocompare the metal concentrations in leaves and larvaefrom site 3 to concentrations in the reference samplesfrom trees west of site 4. Statistical significance wascomputed using SigmaPlot 2001, version 7.0 for Win-dows. Bioconcentration factors (BCFs) were calculatedfor the elements in which the body concentrations weresignificantly different from leaf metal concentrationsaccording to the equation:
BCF = [metal]Leaf miner larvae
[metal]Aspen leaf(1)
where BCF is the bioconcentration factor (dimen-sionless), [metal]Leaf miner larvae the total metal con-centration in the worm (�g kg−1 dry weight), and[metal]Aspen leafthe total metal concentration in aspenleaves (�g kg−1 dry weight).
Two hundred larvae from each of three sample siteson the Methow River (sites 14–16,Fig. 1) were col-lected and compared to one hundred larvae from eachof four sample sites (10–13) upstream from the aban-doned mine sites. Within 1 h following collection, lar-vae were transported to the laboratory, removed fromcases, blotted dry using Whatman #40 filter paper toremove surface water, and weighed. After weighing,the larva were preserved in 70% ethyl alcohol. Headcapsule widths were measured using a slide microm-e andc on af idthd cap-s s ofg oupsa o bet acht starg
2
m tch-e di-v ishp on a
polyvinyl chloride pipe frame. One pen was located in aMethow River side channel downstream from the aban-doned mine site (station 17,Fig. 1) and the other penwas located upstream from the abandoned mine sites(station 13). Fish, maintained in the pens from 7 May2001 to 11 June 2001, were fed (Rangen 3/32 EXTR400 Slow Sink® food #4974) once daily in the morning(07:00–08:00) at 4% of their body weight day−1. Visualexamination during feeding revealed that the fish weresatiated daily. Each pen was monitored daily for mor-bidity and mortality throughout the exposure period.At the end of exposure, fish were euthanized (0.1%MS-222, pH 7) weighed and the final body weightsmeasured.
Temperature, dissolved oxygen, and alkalinity werealso measured daily at each site. Temperature was mea-sured using Hobo model H8 temperature data loggers.A YSI model 85 meter was employed for the measure-ment of dissolved oxygen and total dissolved solids.Alkalinity was measured in the field using the LaM-otte Direct Read® Titration Kit (Model 221780). APiccolo Model HI 1295 temperature compensated dig-ital meter was used to measure pH. Conductivity, pH,and dissolved oxygen were standardized daily beforeand after use. Current velocity was measured followingthe method described byHauer and Lamberti (1996).The Student’st-test was used to compare averageweight of fish from the pens upstream and downstreamfrom the abandoned mines. Statistical significancewas computed using SigmaPlot 2001, version 7.0 forW
2 ts
n att 2 mmifi e in0 ns-f reda ra-t t ofH ratedi bed-d Re-i nc leadc anyl
ter and a dissecting microscope. Instar groupsorresponding size ranges were identified basedrequency distribution histogram of headcapsule wata, which were ranked in ascending order. Headule widths that comprised the horizontal portionraph were assumed to be from the same instar grnd vertical portions of the graph were assumed t
ransitions between instar groups. The midpoint of eransition range defined the size range for each inroup.
.8. Individual level response to contaminants
Eighty-four hatchery-raised triploid trout (O.ykiss, <35 g) were transferred from a nearby hary (Trout Lodge, Quincy, Washington) and equallyided into two pens approximately 1 m on a side. Fens were constructed from aquaculture netting
indows.
.9. Tissue and cell level response to contaminan
Liver samples were excised from five fish per pehe end of the exposure period. Samples less thann diameter were fixed for 12 h at 4◦C in Karnovsky’sxative (5% glutaraldehyde and 4% formaldehyd.1 M cacodylate buffer). Materials were then tra
erred to 0.1 M sodium cacodylate buffer and stot 5◦C until transfer to the histopathology labo
ory at the University of Washington, Departmenealth Sciences. Tissue samples were then dehyd
n a graded concentration series of ethanol and emed in eponate. Ultrathin sections obtained with a
chert/Jung Ultra-cut E microtome® were collected oopper grids, contrasted with uranyl acetate anditrate. Duplicate samples not contrasted with ur
D. Peplow, R. Edmonds / Ecological Engineering 24 (2005) 101–119 109
acetate and lead citrate were also prepared to control forthe effects of staining on the presence of electron-densegranules in mitochondria. Specimens were observedwith a Phillips CM 100® transmission electron micro-scope. The diagnosis of specific hepatic diseases wasdetermined based on the criteria outlined byPhillipset al. (1987).
Tissue concentrations of metals were measured inresident trout from a farm pond fed by water fromAlder Creek (station 6). Four-year-old triploid trout(O. mykiss) were euthanized by an overdose of MS-222 (0.1%, pH 7.0) and liver samples were collectedfrom three fish. Samples were assayed by ICP-AESfor metals and results were compared to metal concen-trations in tissue samples from three fish in the TwispRiver (station 13) that had not been exposed to minewaste.
3. Results
3.1. Trace element contaminants of potentialecological concern
Table 1lists the eight trace elements that are contam-inants of potential ecological concern (COPEC) basedon the comparison of metal concentrations to toxico-logical benchmarks. Trace elements in tailings and acidmine drainage, which are the suspected sources of minewaste contamination, and in Methow River sediment,w na-
TC tentiale ill,A ),g
C
ACCCPNSZ
C it andb
tion, were compared to benchmarks for toxic effects ofminor elements on plants, soil heterotrophic processes,wildlife, human health, and aquatic biota.
In mine tailings, metal concentrations were com-pared to soil benchmarks that were derived from toxi-city studies conducted on plants in the field. This com-parison identified eight trace elements that are contam-inants of potential ecological concern. Six trace ele-ments that were contaminants of potential ecologicalconcern (COPEC) exceeded benchmarks for soil het-erotrophic processes. Only four minor elements in acidmine drainage exceeded wildlife benchmarks. In theMethow River, dissolved metal concentrations wereless than the limits of detection by inductively cou-pled plasma atomic adsorption spectrophotometry (i.e.,ICP-AES) but in the sediments, five elements (i.e., As,Cd, Cu, Pb, and Ni) exceeded toxicity benchmarks foraquatic biota.
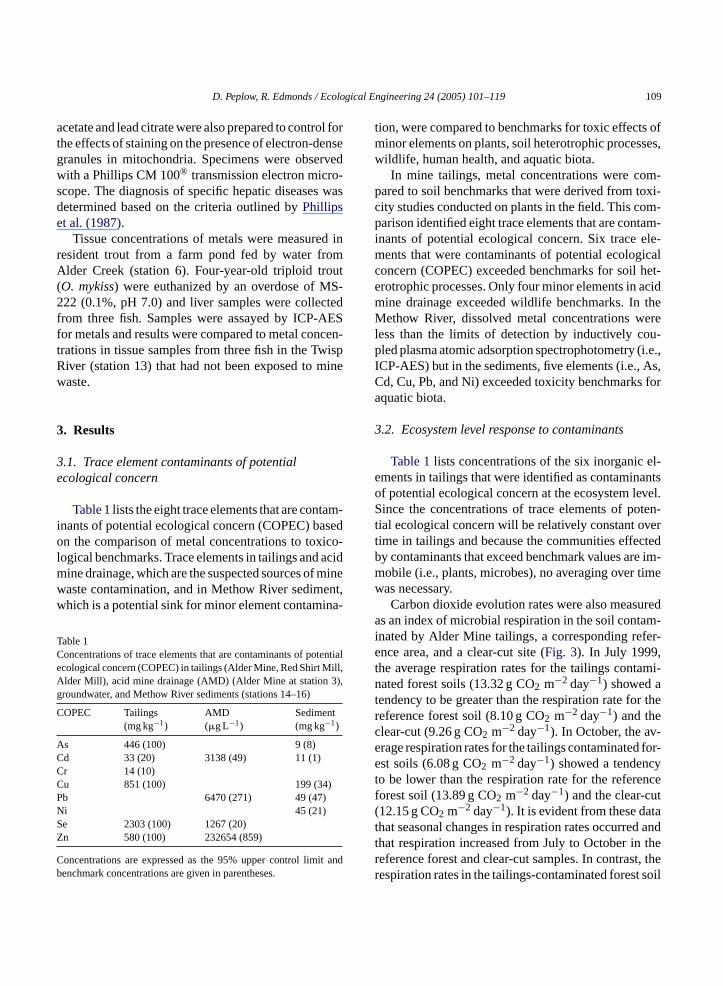
3.2. Ecosystem level response to contaminants
Table 1lists concentrations of the six inorganic el-ements in tailings that were identified as contaminantsof potential ecological concern at the ecosystem level.Since the concentrations of trace elements of poten-tial ecological concern will be relatively constant overtime in tailings and because the communities effectedby contaminants that exceed benchmark values are im-mobile (i.e., plants, microbes), no averaging over timewas necessary.
ureda m-i fer-e ,t ami-nt r therc -e for-e yt ncef t( tat d andt ther t, ther soil
hich is a potential sink for minor element contami
able 1oncentrations of trace elements that are contaminants of pocological concern (COPEC) in tailings (Alder Mine, Red Shirt Mlder Mill), acid mine drainage (AMD) (Alder Mine at station 3roundwater, and Methow River sediments (stations 14–16)
OPEC Tailings(mg kg−1)
AMD(�g L−1)
Sediment(mg kg−1)
s 446 (100) 9 (8)d 33 (20) 3138 (49) 11 (1)r 14 (10)u 851 (100) 199 (34)b 6470 (271) 49 (47)i 45 (21)e 2303 (100) 1267 (20)n 580 (100) 232654 (859)
oncentrations are expressed as the 95% upper control limenchmark concentrations are given in parentheses.
Carbon dioxide evolution rates were also meass an index of microbial respiration in the soil conta
nated by Alder Mine tailings, a corresponding rence area, and a clear-cut site (Fig. 3). In July 1999
he average respiration rates for the tailings contated forest soils (13.32 g CO2 m−2 day−1) showed a
endency to be greater than the respiration rate foeference forest soil (8.10 g CO2 m−2 day−1) and thelear-cut (9.26 g CO2 m−2 day−1). In October, the avrage respiration rates for the tailings contaminatedst soils (6.08 g CO2 m−2 day−1) showed a tendenc
o be lower than the respiration rate for the refereorest soil (13.89 g CO2 m−2 day−1) and the clear-cu12.15 g CO2 m−2 day−1). It is evident from these dahat seasonal changes in respiration rates occurrehat respiration increased from July to October ineference forest and clear-cut samples. In contrasespiration rates in the tailings-contaminated forest
110 D. Peplow, R. Edmonds / Ecological Engineering 24 (2005) 101–119
Fig. 3. Average respiration rates for forest soils in July and October1999. The reference forest soil was adjacent and 100 m north of theAlder Mine and the clear-cut was at the same altitude on the opposingslope of the Alder Creek valley. Error bars indicate S.D.
samples decreased from July and October. It should benoted, however, that when the one-way ANOVA wasused these means were not significantly different at the95% probability level.
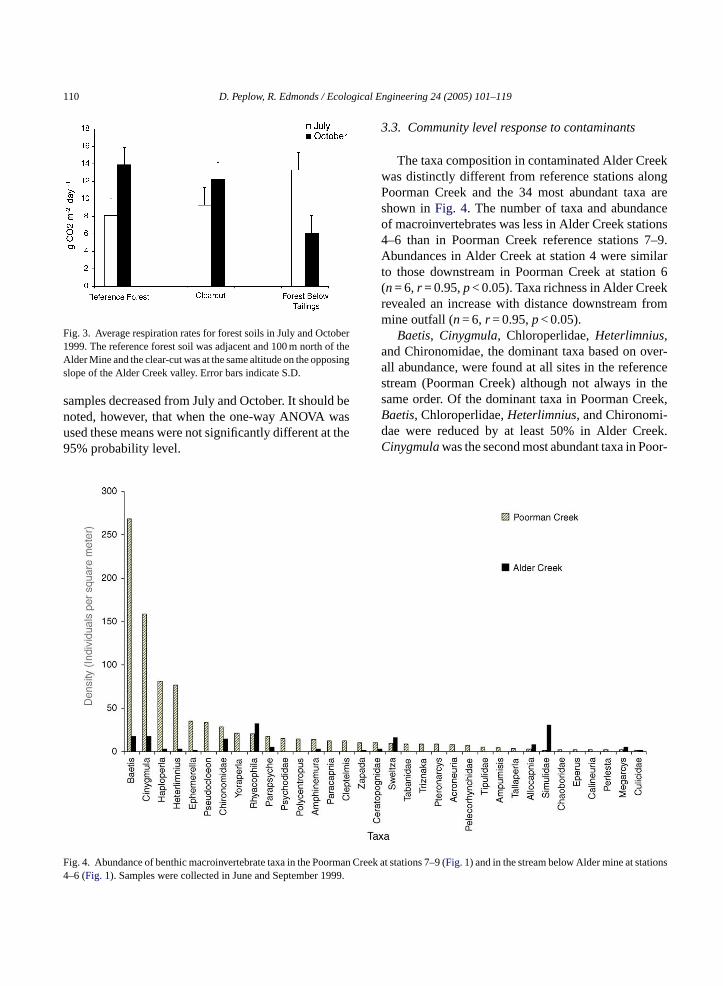
3.3. Community level response to contaminants
The taxa composition in contaminated Alder Creekwas distinctly different from reference stations alongPoorman Creek and the 34 most abundant taxa areshown inFig. 4. The number of taxa and abundanceof macroinvertebrates was less in Alder Creek stations4–6 than in Poorman Creek reference stations 7–9.Abundances in Alder Creek at station 4 were similarto those downstream in Poorman Creek at station 6(n= 6, r = 0.95,p< 0.05). Taxa richness in Alder Creekrevealed an increase with distance downstream frommine outfall (n= 6, r = 0.95,p< 0.05).
Baetis, Cinygmula, Chloroperlidae,Heterlimnius,and Chironomidae, the dominant taxa based on over-all abundance, were found at all sites in the referencestream (Poorman Creek) although not always in thesame order. Of the dominant taxa in Poorman Creek,Baetis, Chloroperlidae,Heterlimnius, and Chironomi-dae were reduced by at least 50% in Alder Creek.Cinygmulawas the second most abundant taxa in Poor-
Fig. 4. Abundance of benthic macroinvertebrate taxa in the Poorman C ons4 999.
–6 (Fig. 1). Samples were collected in June and September 1reek at stations 7–9 (Fig. 1) and in the stream below Alder mine at stati
D. Peplow, R. Edmonds / Ecological Engineering 24 (2005) 101–119 111
man Creek and in Alder Creek it was the second leastabundant. Of the 48 taxa found in Poorman Creek, 17taxa (35%) were absent from Alder Creek. Simulidae,which occurred infrequently in Poorman creek, was thedominant taxa in Alder Creek.
For all stations on Alder Creek, 10 taxa (i.e.,Baetis,Pelecorhynchidae,Amphinemura, Zapada, Heterlim-ius, Simulidae, Chironomidae, Gammaridae,Polypec-tropus, Ryacophila) accounted for 80% of the total in-dividuals, which is similar to reference stations 7–9 inwhich 11 taxa comprised 80% of the total individualssampled (i.e.,Baetis, Cinygmula, Haploperla, Heter-limnius, Ephemerella, Pseudocloeon, Chironomidae,Yoraperla, Rhyacophila, Parapsyche, and Psychodi-dae). At station 4, below the mine outfall, the inverte-brate community was dominated by 5 taxa, Simulidae,Baetis,Zapada,Heterlimnius, andMalenka, which ac-counted for 80% of the individuals. At station 6, sixtaxa comprised 80% of total individuals identified in-cluding Simulidae,Heterlimnus, Amphinemura, Lim-nocharidae,Gammarus, andZapada.
3.4. Population level response to contaminants
The average arsenic concentration in water samplestaken between October 1999 and June 2001 from 10 do-mestic drinking water wells located adjacent to AlderMill, near Alder Creek below Alder Mine, and adjacentto the Red Shirt Mill ranged from <1 to 298�g L−1.The calculated average daily dose for arsenic rangedf -g 10r esh-
Table 2Arsenic concentration (�g kg−1) in hair of bears in vicinity of AlderMine at station 5
Bear number Alder MineBear Hair
NorthwestTrek Bear Hair
1.66 0.051.29 0.040.780.740.480.37
Average 0.89 0.05
Hair was collected using a bear-hair capture technique and a non-consumable liquid lure.
olds of concern for adverse health effects. Carcino-genic risk estimates were also high. On average, oneexcess death from cancer per 909 adults (1.1E−03) isexpected to develop among people drinking water fromthe wells tested. Carcinogenic risk from drinking wa-ter from well 1 was 1-in-77 for adults. No arsenic wasdetected in the ten samples from reference well 11.
Arsenic was found accumulating in the hair col-lected from black bears (U. americanus) in the vicinityof the Alder Mine (Table 2). Two out of the six samplesanalyzed from the exposure area exceeded 1�g kg−1
and the maximum concentration was 1.7�g kg−1. Re-maining hair samples from exposure area were 0.37,0.48, 0.74, and 0.78�g kg−1 compared to referencehair samples that were 0.04 and 0.05�g kg−1.
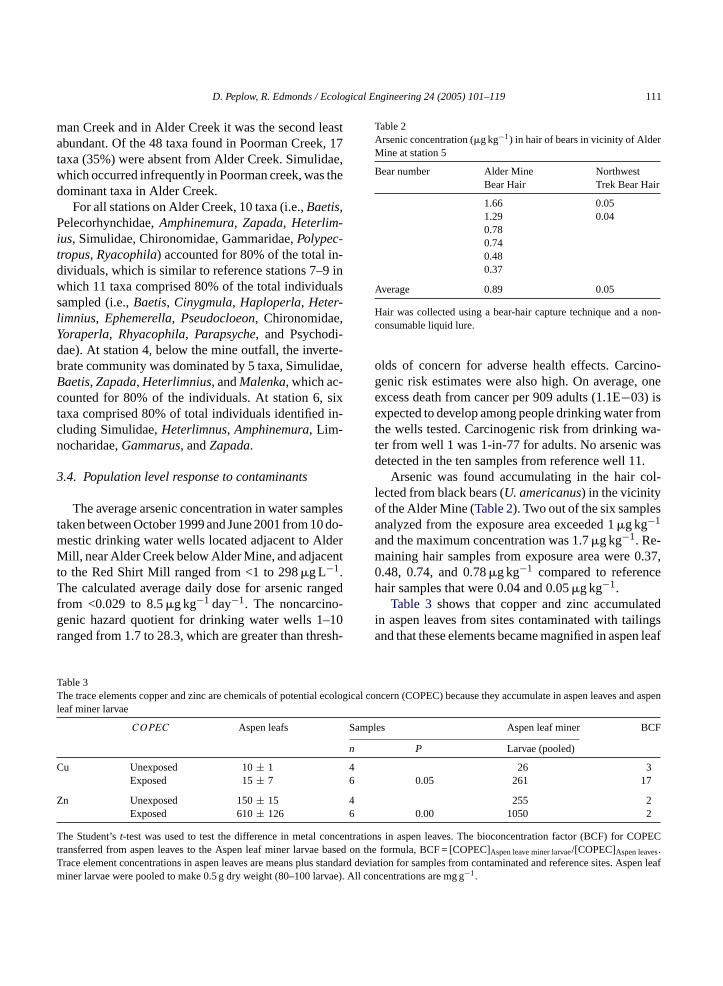
Table 3shows that copper and zinc accumulatedin aspen leaves from sites contaminated with tailingsand that these elements became magnified in aspen leaf
TT ecological concern (COPEC) because they accumulate in aspen leaves and aspenl
Samples Aspen leaf miner BCF
n P Larvae (pooled)
C 4 26 36 0.05 261 17
Z 4 255 26 0.00 1050 2
T oncent r COPECt basedT standa es. Aspen leafm vae). A
rom <0.029 to 8.5�g kg−1 day−1. The noncarcinoenic hazard quotient for drinking water wells 1–anged from 1.7 to 28.3, which are greater than thr
able 3he trace elements copper and zinc are chemicals of potential
eaf miner larvae
COPEC Aspen leafs
u Unexposed 10± 1Exposed 15± 7
n Unexposed 150± 15Exposed 610± 126
he Student’st-test was used to test the difference in metal cransferred from aspen leaves to the Aspen leaf miner larvaerace element concentrations in aspen leaves are means plusiner larvae were pooled to make 0.5 g dry weight (80–100 lar
rations in aspen leaves. The bioconcentration factor (BCF) foon the formula, BCF = [COPEC]Aspen leave miner larvae/[COPEC]Aspen leaves.rd deviation for samples from contaminated and reference sitll concentrations are mg g−1.
112 D. Peplow, R. Edmonds / Ecological Engineering 24 (2005) 101–119
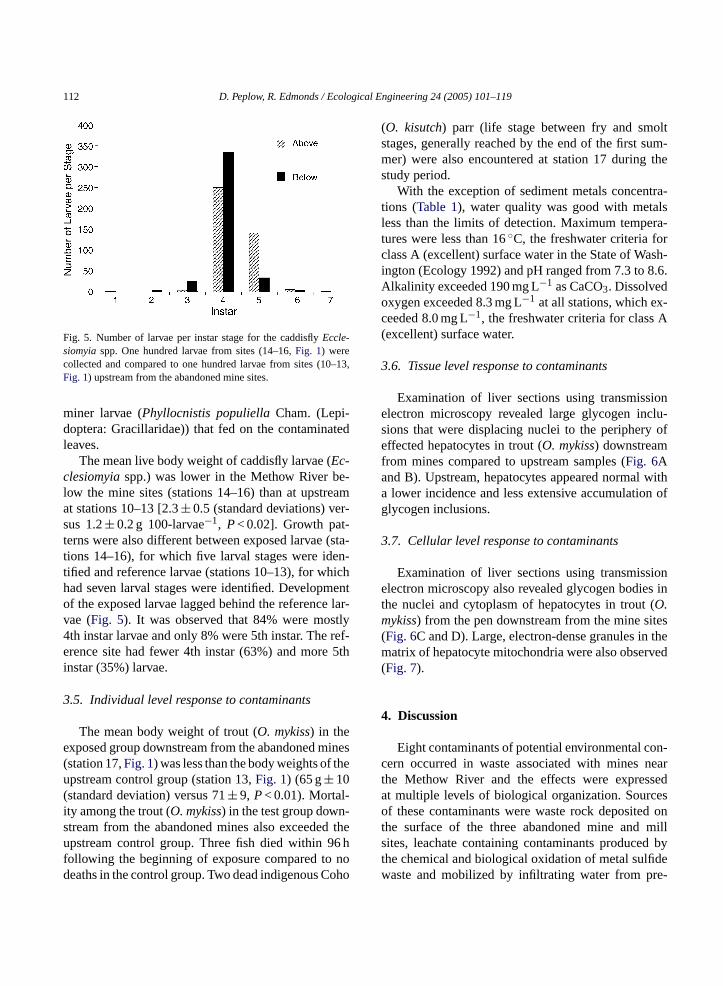
Fig. 5. Number of larvae per instar stage for the caddisflyEccle-siomyiaspp. One hundred larvae from sites (14–16,Fig. 1) werecollected and compared to one hundred larvae from sites (10–13,Fig. 1) upstream from the abandoned mine sites.
miner larvae (Phyllocnistis populiellaCham. (Lepi-doptera: Gracillaridae)) that fed on the contaminatedleaves.
The mean live body weight of caddisfly larvae (Ec-clesiomyiaspp.) was lower in the Methow River be-low the mine sites (stations 14–16) than at upstreamat stations 10–13 [2.3± 0.5 (standard deviations) ver-sus 1.2± 0.2 g 100-larvae−1, P< 0.02]. Growth pat-terns were also different between exposed larvae (sta-tions 14–16), for which five larval stages were iden-tified and reference larvae (stations 10–13), for whichhad seven larval stages were identified. Developmentof the exposed larvae lagged behind the reference lar-vae (Fig. 5). It was observed that 84% were mostly4th instar larvae and only 8% were 5th instar. The ref-erence site had fewer 4th instar (63%) and more 5thinstar (35%) larvae.
3.5. Individual level response to contaminants
The mean body weight of trout (O. mykiss) in theexposed group downstream from the abandoned mines(station 17,Fig. 1) was less than the body weights of theupstream control group (station 13,Fig. 1) (65 g± 10(standard deviation) versus 71± 9, P< 0.01). Mortal-ity among the trout (O. mykiss) in the test group down-stream from the abandoned mines also exceeded theupstream control group. Three fish died within 96 hfollowing the beginning of exposure compared to nodeaths in the control group. Two dead indigenous Coho
(O. kisutch) parr (life stage between fry and smoltstages, generally reached by the end of the first sum-mer) were also encountered at station 17 during thestudy period.
With the exception of sediment metals concentra-tions (Table 1), water quality was good with metalsless than the limits of detection. Maximum tempera-tures were less than 16◦C, the freshwater criteria forclass A (excellent) surface water in the State of Wash-ington (Ecology 1992) and pH ranged from 7.3 to 8.6.Alkalinity exceeded 190 mg L−1 as CaCO3. Dissolvedoxygen exceeded 8.3 mg L−1 at all stations, which ex-ceeded 8.0 mg L−1, the freshwater criteria for class A(excellent) surface water.
3.6. Tissue level response to contaminants
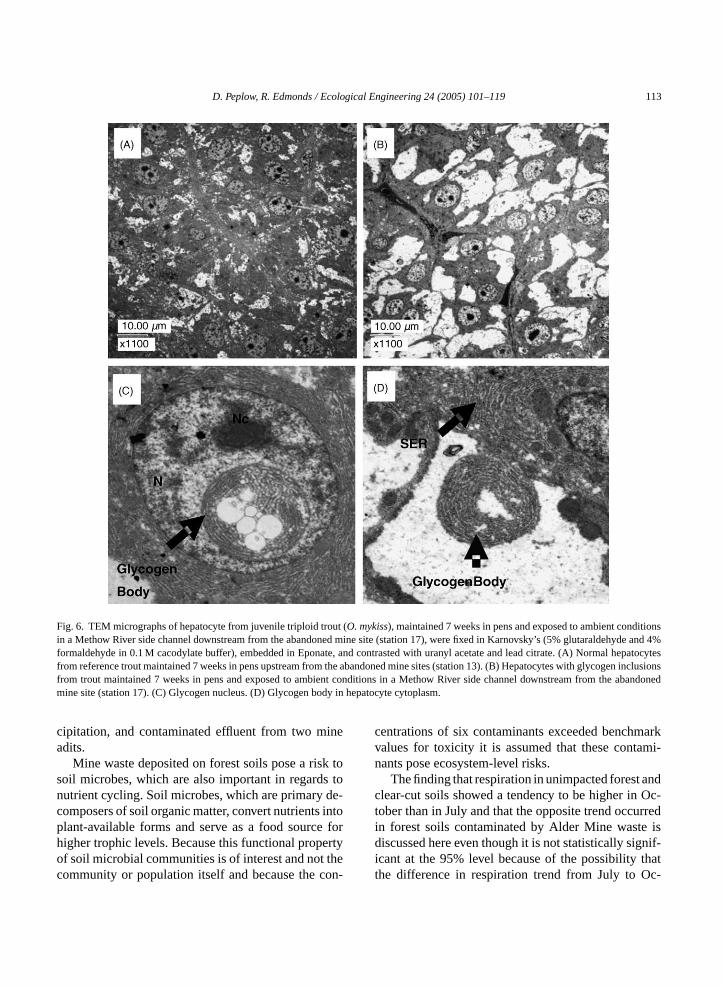
Examination of liver sections using transmissionelectron microscopy revealed large glycogen inclu-sions that were displacing nuclei to the periphery ofeffected hepatocytes in trout (O. mykiss) downstreamfrom mines compared to upstream samples (Fig. 6Aand B). Upstream, hepatocytes appeared normal witha lower incidence and less extensive accumulation ofglycogen inclusions.
3.7. Cellular level response to contaminants
Examination of liver sections using transmissionelectron microscopy also revealed glycogen bodies int (m ites( them rved(
4
on-c neart seda ceso d ont mills d byt dew re-
he nuclei and cytoplasm of hepatocytes in troutO.ykiss) from the pen downstream from the mine s
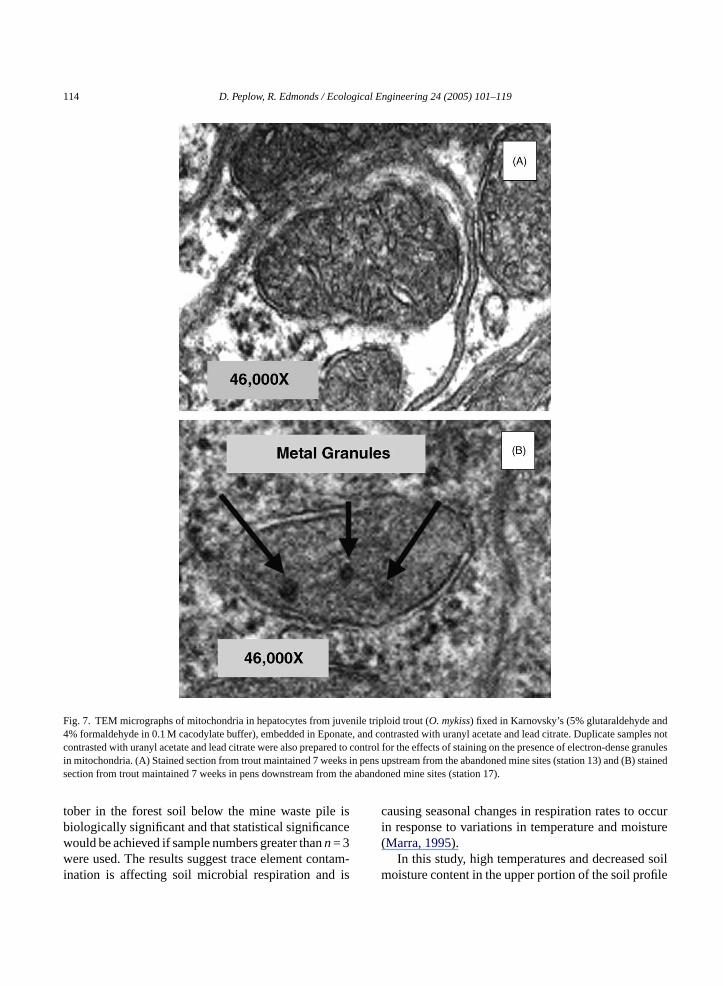
Fig. 6C and D). Large, electron-dense granules inatrix of hepatocyte mitochondria were also obse
Fig. 7).
. Discussion
Eight contaminants of potential environmental cern occurred in waste associated with mineshe Methow River and the effects were exprest multiple levels of biological organization. Sourf these contaminants were waste rock deposite
he surface of the three abandoned mine andites, leachate containing contaminants producehe chemical and biological oxidation of metal sulfiaste and mobilized by infiltrating water from p
D. Peplow, R. Edmonds / Ecological Engineering 24 (2005) 101–119 113
Fig. 6. TEM micrographs of hepatocyte from juvenile triploid trout (O. mykiss), maintained 7 weeks in pens and exposed to ambient conditionsin a Methow River side channel downstream from the abandoned mine site (station 17), were fixed in Karnovsky’s (5% glutaraldehyde and 4%formaldehyde in 0.1 M cacodylate buffer), embedded in Eponate, and contrasted with uranyl acetate and lead citrate. (A) Normal hepatocytesfrom reference trout maintained 7 weeks in pens upstream from the abandoned mine sites (station 13). (B) Hepatocytes with glycogen inclusionsfrom trout maintained 7 weeks in pens and exposed to ambient conditions in a Methow River side channel downstream from the abandonedmine site (station 17). (C) Glycogen nucleus. (D) Glycogen body in hepatocyte cytoplasm.
cipitation, and contaminated effluent from two mineadits.
Mine waste deposited on forest soils pose a risk tosoil microbes, which are also important in regards tonutrient cycling. Soil microbes, which are primary de-composers of soil organic matter, convert nutrients intoplant-available forms and serve as a food source forhigher trophic levels. Because this functional propertyof soil microbial communities is of interest and not thecommunity or population itself and because the con-
centrations of six contaminants exceeded benchmarkvalues for toxicity it is assumed that these contami-nants pose ecosystem-level risks.
The finding that respiration in unimpacted forest andclear-cut soils showed a tendency to be higher in Oc-tober than in July and that the opposite trend occurredin forest soils contaminated by Alder Mine waste isdiscussed here even though it is not statistically signif-icant at the 95% level because of the possibility thatthe difference in respiration trend from July to Oc-
114 D. Peplow, R. Edmonds / Ecological Engineering 24 (2005) 101–119
Fig. 7. TEM micrographs of mitochondria in hepatocytes from juvenile nd4% formaldehyde in 0.1 M cacodylate buffer), embedded in Eponate, samples notcontrasted with uranyl acetate and lead citrate were also prepared to c nse granulesin mitochondria. (A) Stained section from trout maintained 7 weeks in (B) stainedsection from trout maintained 7 weeks in pens downstream from the a
tober in the forest soil below the mine waste pile isbiologically significant and that statistical significancewould be achieved if sample numbers greater thann= 3were used. The results suggest trace element contam-ination is affecting soil microbial respiration and is
c occuri ture(
soilm file
triploid trout (O. mykiss) fixed in Karnovsky’s (5% glutaraldehyde aand contrasted with uranyl acetate and lead citrate. Duplicateontrol for the effects of staining on the presence of electron-de
pens upstream from the abandoned mine sites (station 13) andbandoned mine sites (station 17).
ausing seasonal changes in respiration rates ton response to variations in temperature and moisMarra, 1995).
In this study, high temperatures and decreasedoisture content in the upper portion of the soil pro
D. Peplow, R. Edmonds / Ecological Engineering 24 (2005) 101–119 115
in July appears to have decreased microbial respira-tion in the reference forest and clear-cut sites whereasincreased soil temperatures in the contaminated forestsoils resulted in increased CO2 evolution in July andreduced CO2 evolution in October. This would occur ifacidic mine drainage (AMD) flows from station 3 alonga subsurface path characterized by extensive faultingand calcite-filled fractures. Carbon dioxide will be re-leased if the calcite fracture fillings are being dissolvedby the sulfuric acid in acid mine waters, which are in-filtrating from the surface.
Respiration rates increased from 8.0 g CO2m−2 day−1 in July to 13.9 g CO2 m−2 day−1 in Octoberin the reference soil adjacent to (but not contaminatedby) waste from Alder Mine. Others have noted sea-sonal fluctuations in soil respiration rates in the clear-cuts in Western Washington were from 9.3 to 12.2 gCO2 m−2 day−1, apparently in response to an increasein precipitation (Marra, 1995). Gordon et al. (1986)found a higher summer maximum respiration rate of15.9 g CO2 m−2 day−1 in a clear-cut site in a whitespruce forest in interior Alaska. Respiration rates inthe forest floor below the Alder Mine tailings pile de-creased from 13.3 in July to 6.1 g CO2 m−2 day−1 inOctober. It is likely that cooler fall temperatures arereducing the abiotic production of CO2 that occurs dueto the reaction between AMD and CaCO3 in the forestsoil and bedrock.
The effects of contaminants on plants at the com-munity level are of similar importance because the pro-d bona anda ne ofs rnedb par-t andp ula-t ace-e ns ofc as-p erl :G ndb lsop
ayf ans-
port in surface water and shallow groundwater. Runoffwaters carry dissolved, colloidal, and suspended con-taminants from hillslopes. Likely pathways of trans-port from source involves leachates that mix with shal-low groundwater and emerge as seeps or enter streamsthrough gaining reaches. If rainfall or snowfall exceedsthe infiltration capacity then overland flow is produced.However, in the semi-arid study area where soil perme-ability is high and precipitation is low, subsurface flowis assumed to be the dominant process.
Reduction in the abundance and diversity of ben-thic invertebrates in Alder Creek below Alder mineshow community level effects. In the reference streamcommunity, it is the relatively small set of abundantspecies that are functionally important because theycontribute the most to the biomass of macroinverte-brates and are doing the bulk of nutrient uptake andtransfer. The numerous other species that make up asmall percentage of the biomass are functionally equiv-alent to the dominant species but have different en-vironmental requirements and tolerances (Walker etal., 1999). These minor species provide ecosystemswith resiliency by maintaining ecosystem function un-der changing environmental conditions. When condi-tions change following contamination, metal-sensitivespecies are replaced by metal-tolerant species, whichreduces diversity and abundance, lowers resiliency andaffects the capability of an ecosystem to maintainproductivity.
In polluted aquatic ecosystems the transfer of metalst in in-v ,1 lim-i omed bilityt sedd
ele-m ity,c con-t sig-n att antlylF oft cen-t of
uction of plant matter influences the cycling of carnd is a primary source of organic carbon for soilsquatic ecosystems. Regression equations byJansset al. (1997a,b)that predict BCFs values as a functionoil characteristics suggest that BCFs may be govey the same factors that determine the equilibrium
itioning coefficients between the soil solid phaseore water and that the rates of trace element accum
ion may be related to the magnitude of ambient trlement concentration. However, the concentratioopper, and zinc that were observed in this study inen leaves (Populus tremuloides) and aspen leaf min
arvae (Phyllocnistis populiellaCham. [Lepidopteraracillaridae]) indicate that food-chain transfer aiomagnification from metal-contaminated soils is aossible.
Pathways for the migration of contaminants awrom the source at abandoned mine sites involve tr
hrough food webs can cause high concentrationsertebrates and toxicity in fish (Dallinger and Kautzky985). When susceptible invertebrate species are e
nated, metal-tolerant food organisms may becominant. The tolerance may be based on the capa
o accumulate metals, which would lead to increaietary exposure among fish predators (Timmermans
et al., 1989).Although the concentration of dissolved trace
ents in water is important with respect to toxiconcern over the oral uptake of trace elementsained in contaminated sediments and food is alsoificant (Spry et al., 1988). It is generally believed th
he uptake of adsorbed trace elements is significess than the absorption of dissolved forms (Tamaki andrankenberger, 1992). While the relative importance
he routes of exposure remains unclear, at high conrations the bioavailability of even a small fraction

116 D. Peplow, R. Edmonds / Ecological Engineering 24 (2005) 101–119
adsorbed trace elements from the diet would be impor-tant supporting the proposition that diet is a significantroute of exposure (Dallinger and Kautzky, 1985; Hare,1992).
At the population level, the calculated risk of mor-tality from cancer in people exposed to As at averageconcentrations as low as 8�g L−1 was greater than 1 in10 000. It has been concluded on the basis of epidemi-ological studies that arsenic at or above several hun-dred�g L−1 causes increased rates of mortality fromskin, bladder, and lung cancer (Cebrian et al., 1983;Hindmarsh et al., 1977; Southwick et al., 1981; Tseng,1977; Tseng et al., 1968). Other studies have noted anincreased risk of liver and kidney cancer (NAS, 2001).
Also, the live body weights per 100 caddisfly larvae(Ecclesiomyiaspp.) downstream from the mine siteswere approximately 48% lower than larvae sampledupstream. In both upstream and downstream samplesets, the larvae were comprised mostly of third andforth instar stages. This indicates thatEcclesiomyiaspp. has a slow-seasonal life-style characterized bydistinct changes of larval size with time (Merritt andCummins, 1996; Irons, 1987). Our observation that lar-vae in the Methow River downstream from the mineswere predominantly stage 4 instars while upriver stage4 and 5 instars dominated suggesting that developmentbelow the mine may be delayed by as much as 1-month using life-history histograms forEcclesiomyiaspp. and other slow-seasonal caddisflies (e.g.,Ana-gapetus bernea) (Merritt and Cummins, 1996; Irons,1 ofe stec ver-s
a fort torsa d inbK sfc da pre-c nai st nceb n-
taminated site had an arsenic concentration as high as1.66 mg kg−1. Since the pattern of arsenic metabolismin bears is unknown and may not be similar to hu-mans, the normal concentration of arsenic in humanhair (<1 mg kg−1) was used as a reference (DHHS,2000). Although elevated levels of arsenic indicatesexposure, the calculation or risk and carcinogenicityamong bear (U. americanus) or other exposed animalsis not possible unless more is known about the tim-ing and duration of exposure and the species specificresponse to arsenic.
Elevated levels of trace elements in certain animalsinduce the production of the cytokine-rich protein met-allothionein that chelates trace elements, which thenaccumulates in organs such as the liver (Ow, 1996). Atypical host response to metals is a progressive accu-mulation of the contaminant bound to metallothioneinin hepatic lysosomes (Bunton and Frazier, 1994). Re-duced growth and increased mortality was noted in in-dividual trout (O.mykiss) in pens downstream from themines compared to upstream control trout (O. mykiss).The source of toxic mine waste contaminants may bedue either to episodic exposures to contaminants thatwere not detected during sampling and analysis (Marret al., 1995; Hanson et al., 2002) or due to dietary
uptake of metal-rich sediments (Mount et al., 1994;Dallinger and Kautzky, 1985). While it is not obviouswhich of these two pathways is responsible for the ef-fects seen, exposure to sediments that are known to beenriched with metals from the abandoned mines is am hichw udyp
gesi cura xinsca se-f rlys um-b icatea ,
thef cells( c-t lentc forc -
987). Growth inhibition suggests either a diversionnergy from growth to tissue repair or that mine waontaminants are influencing the rate of food conion into usable energy.
Arsenic accumulation in bear (U. americanus) hairnd cadmium in fish liver suggest a potential
ransfer of mine waste contaminants to top predand indicate that contaminant stress has occurreoth aquatic and terrestrial ecosystems (Dallinger andautzky, 1985; Hodson, 1990). Arsenic, which wa
ound to accumulate in the hair of bears (U. ameri-anus) in the vicinity of the Alder Mine, is considereuseful indicator of exposure to arsenic over the
eding 6–12 months (DHHS, 2000). We detected average concentration in the exposed bears (U. amer-canus) equal to 0.89 mg kg−1, which was 18 timehe average for arsenic in the hair of the refereears (0.05 mg kg−1). One hair sample from the co
ore likely cause rather than dissolved metals, were less than the limits of detection during the steriod.
Toxins are known to induce biochemical chann the liver. More drastic systemic dysfunctions ocfter the capability of the liver to sequester the toeases (Bunton and Frazier, 1994). Monitoring of theppropriate biochemical parameter in the liver is u
ul, therefore, for the detection of toxicity at an eatage of exposure. In mitochondria, decreased ners and increased sizes of matrical granules indtoxin-induced change has occurred (Phillips et al.
1987). Divalent cations have been shown to induceormation of electron dense granules in exposedPeachy, 1964). Metal uptake by mitochondria is by aive transport, which causes the deposition of divaations on or in pre-existing granules in exchangealcium. According toArgese et al. (1996), the appear
D. Peplow, R. Edmonds / Ecological Engineering 24 (2005) 101–119 117
ance of electron-dense matrical granules, when com-pared to in vitro toxicity data from a variety of otherbioassays, indicated that the decreased number and in-creased size of matrical granules is a good general indi-cator of metal toxicity for several fish and invertebratespecies.
Glycogen bodies in the cytosol and nuclei of hepa-tocytes also are indicators of toxin-induced metabolicdisease and are sometimes associated with Wilson’sdisease, a genetic disorder of copper metabolism inhumans (Phillips et al., 1987; Glodblatt and Gunning,1984; Ostrakhovitch et al., 2002). The accumulation ofglycogen inclusions in hepatocytes is pathognomic oftype IV glycogen storage disease (GSD IV, Anderson’sdisease, amylopectinosis) (Sherlock and Dooley, 1997;Ishak and Sharp, 1987). Type IV glycogen storage dis-ease is caused by a deficiency of the branching enzymeamylo-1,4,1,6-transglucosidase that results in the syn-thesis of an abnormal glycogen molecule having de-creased branch points and increased chain length. Bio-chemically the unbranched glycogen, similar to amy-lopectin, becomes less soluble and glycogenolysis isreduced (Goodman and Ishak, 1999).
Glycogen storage disease, generally an inheritedmetabolic condition, may also be a part of a toxicprocess (Goodman and Ishak, 1999). The metals lead,mercury, cadmium, chromium, manganese, molybde-num, nickel, and cobalt are known to cause hepaticglycogenolysis (Goodman and Ishak, 1999; Gill andPant, 1981). In our study, the occurrence of glycogeni mi-n ss ine sed-i usesa tedi thel ingc iont
5
ex-p cel-l re-s latedt llu-
lar level. Energy flow from cells, to tissues, organ-isms, populations, and communities ultimately affectecosystem function. Toxicity, which begins as a chem-ical reaction involving contaminants and enzymes re-lated to carbon metabolism, resulted in cellular andtissue level changes that indicate a disease processsimilar to Type IV glycogen storage disease in fishin the Methow River. Aquatic and terrestrial inver-tebrate, plant, mammalian populations were also ef-fected. Among aquatic invertebrates, contaminants re-duced metal-intolerant species, which were replacedby metal-tolerant taxa and resulted in changes in com-munity structure. Changes at the ecosystem level wereinferred when contaminants exceeded benchmark lev-els that are toxic to soil bacteria, which suggest thattheir functional properties related to nutrient cyclingand energy flow have been affected.
Acknowledgements
The University of Washington, College of ForestResources in Seattle, Washington, is being funded bythe Bonneville Power Administration (Project 1998-035-01) to conduct a 3-year research project to measurethe dispersion of metals from abandoned mines and theeffects on fish and wildlife habitat in the Methow Riverbasin.
R
A 96.etal
B gantural
B ispl Re-
B con-Fish
B n theash-.
C t and
C ing
nclusions in the liver suggests that metals contaated sediments may be causing biochemical strexposed fish. Elevated concentrations of copper in
ments downstream from the abandoned mines cametabolic disorder in which food is first conver
nto glucose, then to glycogen, and finally stored iniver. It appears, however, that glycogen is not beonverted back into glucose normally for distributo the tissues.
. Conclusion
The effects of mine waste contaminants wereressed at all levels of organization, from the
ular to ecosystem level. Linkages that integrateponses across levels of organization were reo the disruption of carbon metabolism at the ce
eferences
rgese, E., Bettiol, C., Miana, P., Iuzzolino, L., Giurin, G., 19Submitochondrial particles as in vitro biosensors of heavy mtoxicity. J. Aquat. Ecosyst. Health 5, 125–134.
arksdale, J.D., 1975. Geology of the Methow Valley, OkanoCounty, Washington. State of Washington Department of NaResources, Olympia, WA.
unning, B.B., 1990. Geologic Map of the East half of the Tw1:100,000 Quadrangle, Washington. Department of Naturasources, Olympia, WA.
unton, T.E., Frazier, J.M., 1994. Extrahepatic tissue coppercentrations in white perch with hepatic copper storage. J.Biol. 45 (4), 627–640.
urnet, F.W., 1976. Felsic volcanic rocks and mineral deposits iBuck Mountain formation andesites, Okanogan County, Wington. In: Geology. University of Washington, Seattle, p. 26
alow, P., 1998. Handbook of Environmental Risk AssessmenManagement. Blackwell Science, Oxford.
ebrian, M.E., Albores, A., Aguilar, M., 1983. Chronic as poisonin the north of Mexico. Hum. Toxicol. 2, 121–133.
118 D. Peplow, R. Edmonds / Ecological Engineering 24 (2005) 101–119
Clements, W.H., 2000. Integrating effects of contaminants acrosslevels of biological organization: an overview. J. Aquat. Ecosyst.Stress Recovery 7, 113–116.
Clements, W.H., Kiffney, P.M., 1994. Assessing contaminant im-pacts at higher levels of biological organization. Environ. Toxi-col. Chem. 13, 397–404.
Dallinger, R., Kautzky, H., 1985. The importance of contaminatedfood for the uptake of heavy metals by rainbow trout (Salmogairdneri): a field study. Oewcologia 67, 82–89.
DHHS, 2000. Toxicological Profile for Arsenic (Update). Agencyfor Toxic Substances and Disease Registry (ATSDR). Atlanta,Georgia.
Edwards, N.T., 1982. The use of soda-lime for measuring res-piration rates in terrestrial systems. Pedobiologia 23, 321–330.
EPA, 1980. Water quality criteria documents: availability. FederalRegister (November 28) 45 (231), 79318–79379.
Gill, T.S., Pant, J.C., 1981. Toxicity of nickel to the fishPuntusconchonius(Ham.) and its effects on blood glucose and liverglycogen. Comp. Physiol. Ecol. 6 (2), 99–102.
Glodblatt, P.J., Gunning, W.T., 1984. Ultrastructure of the liver andbiliary tract in health and disease. Ann. Clin. Laboratory Sci. 14(2), 159–167.
Goodman, Z.D., Ishak, K.G., 1999. Hepatic histopathology:metabolic diseases. In: Schiff, E.R., Sorrell, M.F., Maddrey, W.C.(Eds.), Schiff’s Diseases of the Liver. Lippincott-Raven, NewYork.
Gordon, A.M., Schlentner, R.E., Van Cleve, K., 1986. Seasonal pat-terns of soil respiration and CO2 evolution following harvestingin the white spruce forests of interior Alaska. Can. J. For. Res.17, 304–310.
Hanson, J.A., Welsh, P.G., Lipton, J., Suedkamp, M.J., 2002. The ef-fects of long-term cadmium exposure on the growth and survivalof juvenile bull trout (Salvelinus confluentus). Aquat. Toxicol.58, 163–174.
H abil-6),
H Aca-
H lec-eni-
H eciesonit.
H cio,and
lth
H foron
/R1.
I En-001.
Irons, J.G., 1987. Life history patterns and trophic ecology of Tri-choptera in two Alaskan (U.S.A.) subarctic streams. Can. J. Zool.66, 1258–1265.
Ishak, K.G., Sharp, H.L., 1987. Metabolic errors and liver disease. In:MacSween, R.N.M., Anthony, P.P., Scheuer, P.J. (Eds.), Pathol-ogy of the Liver. Churchill Livingstone, New York.
Janssen, R.P.T., Peijnenburg, W.J.G.M., Posthuma, L., Van DenHoop, M.A.G.T., 1997a. Equilibrium partitioning of heavy met-als in Dutch field soils. I. Relationship between metal partitioncoefficients and soil characteristics. Environ. Toxicol. Chem. 16(12), 2470–2478.
Janssen, R.P.T., Posthuma, L., Baerselman, R., Hollander, H.A.D.,Van Veen, R.P.M., Peijnenburg, W.J.G.M., 1997b. Equilibriumpartitioning of heavy metals in Dutch field soils. II. Prediction ofmetal accumulation in earthworms. Environ. Toxicol. Chem. 16(12), 2479–2488.
Marr, J.C.A., Bergman, H.L., Parker, M., Lipton, J., Cacela, D., Erik-son, W., Phillips, G.R., 1995. Relative sensitivity of brown andrainbow trout to pulsed exposures of an acutely lethal mixtureof metals typical of the Clark Fork River, Montana. Can. J. Fish.Aquat. Sci. 52, 2005–2015.
Marra, J.L., 1995. Coarse woody debris respiration and inverte-brate diversity on old-growth and clear-cut sites on the OlympicPeninsula. Ph.D. Dissertation. University of Washington, Seattle,Washington.
Merritt, R.W., Cummins, K.W. (Eds.), 1996. An Introduction to theAquatic Insects, 3rd ed. Kendall/Hunt, Dubuque.
Milhous, R.T., Sorlie, G., Richardson, D., 1976. Water resourcesof the Methow Basin. Office Report No. 56. Water ResourcesAnalysis and Information Section, WA Department of Ecology,Olympia, WA.
Morgenstern, H., 1995. Ecologic studies in epidemiology: concepts,principles, and methods. Annu. Rev. Public Health 16, 61–81.
Mount, D.R., Barth, A.K., Garrison, T.D., Barten, K.A., Hockett,J.R., 1994. Dietary and waterborne exposure of rainbow trout
ing
N itteecol-y ofress,
O icalnal
O lotz,itide-eac-32–
O ls for
P e ac-s. J.
P ef-ains,
are, L., 1992. Aquatic insects and trace metals: bioavaility, bioaccumulation, and toxicity. Crit. Rev. Toxicol. 22 (5/327–369.
auer, F.R., Lamberti, G.A., 1996. Methods in Stream Ecology.demic Press, San Diego.
indmarsh, J.T., McLetchie, O.R., Heffernan, L.P.M., 1977. Etromyographic abnormalities in chronic environmental arscalism. J. Anal. Toxicol. 1, 270–276.
odson, P.V., 1990. Indicators of ecosystem health at the splevel and the example of selenium effects on fish. Environ. MAssess. 15, 241–254.
openhayn-Rich, C., Browning, S.R., Hertz-Picciotto, I., FerrecC., Peralta, C., Gibb, H., 2000. Chronic arsenic exposurerisk of infant mortality in two areas of Chile. Environ. HeaPerspect. 108 (7), 667–673.
ull, R.N., Suter II, G.W., 1994. Toxicological benchmarksscreening potential contaminants of concern for effectssediment-associated biota: 1994 Revision. ES/ER/TM-95Oak Ridge National Laboratory, Oak Ridge, TN.
RIS, 2001. Arsenic. Integrated Risk Information System. U.S.vironmental Protection Agency. Last Update 19 October 2http://www.epa.gov/iris/subst/index.html.
(Oncorhynchus mykiss) to copper, cadmium, lead and zinc usa live diet. Environ. Toxicol. Chem. 13 (12), 2031–2041.
AS, 2001. Arsenic in Drinking Water 2001 Update. Subcommon Toxicology, Board on Environmental Studies and Toxiogy, Division on Earth and Life Sciences, National AcademSciences-National Research Council. National Academy PWashington, DC.
presko, D.M., Sample, B.E., Suter II, G.W., 1994. Toxicologbenchmarks for wildlife, ES/ER/TM86/R1. Oak Ridge NatioLaboratory, Oak Ridge, TN.
strakhovitch, E.A., Lordnejad, M.R., Schliess, F., Sies, H., KL.O., 2002. Copper ions strongly activate the phosphoinos3-kinase/Akt pathway independent of the generation of rtive oxygen species. Arch. Biochem. Biophy. 397 (2), 2239.
w, D.W., 1996. Heavy metal tolerance genes: prospective toobioremediation. Resourc. Conserv. Recyc. 18, 135–149.
eachy, L.D., 1964. Electron microscopic observations on thcumulation of divalent cations in intramitochondrial granuleCell Biol. 20, 95–109.
eplow, D., 1998. Chemical and biological indicators of minefluent impacts on Alder Creek in the North Cascade Mount
D. Peplow, R. Edmonds / Ecological Engineering 24 (2005) 101–119 119
Washington. Masters Thesis. University of Washington, Seattle,Washington.
Phillips, M.J., Poucell, S., Patterson, J., Valencia, P., 1987. The Liver:An Atlas and Text of Ultrastructural Pathology. Raven Press, NewYork.
Selvin, H.C., 1958. Durkheim’s “suicide” and problems of empiricalresearch. Am. J. Sociol. 63, 607–619.
Sherlock, S., Dooley, J., 1997. Diseases of the Liver and BiliarySystem, 10th ed. Blackwell Science, Oxford.
Southwick, J.W., Western, A.E., Beck, M.M., 1981. Communityhealth associated with arsenic in drinking water in MillardCounty, Utah. EPA-600/1-81-064. NTIS no. PB82-108374. U.S.Environmental Protection Agency, Health Effects Research Lab-oratory, Cincinnati, OH.
Spry, D.J., Hodson, P.V., Wood, C.M., 1988. Relative contributionsof dietary and waterborne zinc in the rainbow trout,Salmo gaird-neri. Can. J. Fish. Aquat. Sci. 45, 32–41.
Stumm, W., Morgan, J.J., 1996. Aquatic Chemistry, 3rd ed. Wiley.Suter, G.W., Mabrey, J.B., 1994. Toxicological benchmarks for
screening potential contaminants of concern for effects on aquaticbiotic: 1994 revision. ES/ER/TM-96/R1. Oak Ridge NationalLaboratory, Oak Ridge, TN.
Tamaki, S., Frankenberger Jr., W.T., 1992. Environmental biochem-istry of arsenic. Rev. Environ. Contam. Toxicol. 124, 79–109.
Timmermans, K.R., Van Hattum, B., Draak, M.H.S., Davids, C.,1989. Trace metals in a littoral foodweb: concentrations in or-ganisms, sediment and water. Sci. Total Environ. 87/88, 477–494.
Tseng, W.P., Chu, H.M., How, S.W., 1968. Prevalence of skin cancerin an endemic area of chronic arsenicism in Taiwan. J. Natl.Cancer Inst. 40, 453–463.
Tseng, W.P., 1977. Effects and dose–response relationships of skincancer and Blackfoot disease with arsenic. Environ. Health Per-spect. 19, 109–119.
USFS, 1999. ArcInfo export files, in stateplane. GIS Section,Okanogan National Forest, Okanogan, WA.
Waitt Jr., R.B., 1972. Geomorphology and glacial geology of theMethow Drainage Basin, Eastern North Cascade Range, Wash-ington. Ph.D. Dissertation, University of Washington, Seattle.
Walker, B., Kinzig, A., Langridge, J., 1999. Plant attribute diversity,resilience, and ecosystem function: the nature and significanceof dominant and minor species. Ecosystems 2, 95–113.
Walton, J.R., 1973. Granules containing lead in isolated mitochon-dria. Nature 243 (5402), 100–101.
Will, M.E., Suter II, G.W., 1994. Toxicological benchmarks forscreening potential contaminants of concern for effects on soiland litter invertebrates and heterotrophic processes, ES/ER/TM-126. Oak Ridge National Laboratory, Oak Ridge, TN.