
Monitor Min Faro Mine Complex ne Waste Rock Trial Covers
175
Monitor Min Faro Mine Complex ne Waste Rock Trial Covers: 2008 Data Summary 2008 Data Summary Prepared for: Indian and Northern Affairs Canada Affaires indiennes et du Nord Canada and Prepared by: Project Reference Number SRK 1CY001.020 May 2009
-
Upload
khangminh22 -
Category
Documents
-
view
0 -
download
0
Transcript of Monitor Min Faro Mine Complex ne Waste Rock Trial Covers

Monitor MinFaro Mine Complex
ne Waste Rock Trial Covers:2008 Data Summary2008 Data Summary
Prepared for:Indian and NorthernAffairs Canada
Affaires indiennes et du Nord Canada
and
Prepared by:
Project Reference Number SRK 1CY001.020
May 2009

Faro Mining Complex
Monitor Mine Waste Rock Trial Covers: 2008 Data Summary
Yukon Territorial Government
On behalf of
Faro Mine Closure Planning Office
SRK Consulting (Canada) Inc.
Suite 2200, 1066 West Hastings Street Vancouver, B.C. V6E 3X2
Tel: 604.681.4196 Fax: 604.687.5532
E-mail: [email protected] Web site: www.srk.com
SRK Project Number 1CY001.020
May 2009

SRK Consulting Monitor Mine Waste Rock Trial Covers – 2008 Data Summary Page i
CCS/JM/sdc FaroVangorda_MonitorMineWasteRockTrialCovers_Report_1CY001.020_JM_20090528_FNL.docx, May. 29, 09, May 2009
Executive Summary
Title: Faro Mining Complex, Monitor Mine Waste Rock Trial Covers: 2008 Data Summary
Consultant: SRK Consulting (Canada) Inc.
Status: Final
Date: May 2009
Size: 28 Pages of text (including cover, introductory and reference list); 76 Pages of Figures (including one flysheet), 6 Appendices containing 71 pages (including 11 flysheets).
Digital File: PDF format; 42.6 MB
Objectives and Primary Findings:
This report summarizes the data collected during the 2008 monitoring season (May to October) from the waste rock cover trials at the Faro Mining Complex. The intent of this report is to document the field results and provide feedback on the quality of the data collected. Where problems with the collected data have been identified, this report provides recommendations for remedying the problem as well as mitigation strategies to prevent similar problems from reoccurring. The scope of this report is simply to confirm that the data collected is following reasonable trends, and that the instrumentation and data acquisition systems are performing as expected.
Detailed information regarding operation, calibration, suitability, and accuracy of the monitoring instrumentation used to collect the data presented in this report is provided in the as-built report (SRK 2006a), and therefore it is not repeated here.
Future Work Recommendations
The report provides a series of recommendations to improve data collection and prevent loss of data during subsequent monitoring years. These range from improved monitoring protocols to installing a second solar panel for the CR1000 datalogger. Also, this report makes recommendations regarding the extent and focus of the in-situ hydraulic conductivity and density testing of the covers.

SRK Consulting Monitor Mine Waste Rock Trial Covers – 2008 Data Summary Page ii
CCS/JM/sdc FaroVangorda_MonitorMineWasteRockTrialCovers_Report_1CY001.020_JM_20090528_FNL.docx, May. 29, 09, May 2009
Table of Contents
Executive Summary ...................................................................................................................... i
1 Introduction and Scope of Report .............................................................................. 1 1.1 General ............................................................................................................................... 1 1.2 Background of the Project ................................................................................................... 1 1.3 Scope of Work ..................................................................................................................... 2 1.4 Methods .............................................................................................................................. 3 1.5 Post Processing .................................................................................................................. 4 1.6 Report Structure .................................................................................................................. 4
2 Automated Instrumentation Data Logger Data .......................................................... 5 2.1 Davis Instruments Vantage Pro (Weather Stations and Satellite Stations) ......................... 5 2.2 Campbell Scientific Data Loggers ....................................................................................... 6
2.2.1 General Setup ......................................................................................................................... 7 2.2.2 Battery Voltage ........................................................................................................................ 7 2.2.3 Soil Matric Suction ................................................................................................................... 8 2.2.4 Soil Temperature ..................................................................................................................... 8 2.2.5 Soil Volumetric Moisture Content ............................................................................................ 8 2.2.6 Tipping Bucket Flow Gauges (Runoff and Interflow) .............................................................. 8
2.3 SeaMetrics DL75 Data Loggers (Surface Runoff and Interflow) ......................................... 9 2.4 Lakewood Systems UL16 Data Logger (Soil Temperature) .............................................. 10
3 Manually Collected Instrumentation Data ................................................................ 11 3.1 M-Squared Thermistor Cables (Soil Temperature) ........................................................... 11 3.2 Sentek Sensor Technologies Diviner 2000 (Soil Volumetric Moisture Content) ............... 11 3.3 HOBO Water Level Meters ............................................................................................... 11
4 In-Situ Geotechnical Testing ..................................................................................... 12 4.1 Saturated Hydraulic Conductivity ...................................................................................... 12 4.2 In-Situ Density Testing ...................................................................................................... 13
5 Action Items ............................................................................................................... 15
6 References .................................................................................................................. 17
List of Tables
Table 1: Summary of Primary Data Collected by Davis Instruments Vantage Pro Weather and Satellite Stations .............................................................................................................. 6
Table 2: Summary of Performed In-situ Saturated Hydraulic Conductivity Tests .......................... 12 Table 3: Summary of In-Situ Density Tests .................................................................................... 14

SRK Consulting Monitor Mine Waste Rock Trial Covers – 2008 Data Summary Page iii
CCS/JM/sdc FaroVangorda_MonitorMineWasteRockTrialCovers_Report_1CY001.020_JM_20090528_FNL.docx, May. 29, 09, May 2009
List of Figures
Figure 1: Location Plan for Trial Covers and Thermistor Strings Figure 2: Aerial View of Trial Cover Layout Figure 3: Trial Covers and Lysimeter Layout Plan Figure 4: Schematic Trial Cover and Lysimeter Layout Showing Automated Soil Suction,
Moisture Instrumentation, and Datalogger, as well as Weather and Satellite Station Locations
Figure 5: Schematic Trial Cover and Lysimeter Layout Showing Diviner 2000 Stations, Surface Runoff and Interflow Measurement Locations
Figure 6: Schematic Instrument Profiles for CT#1 and CT#4 Figure 7: Schematic Instrument Profiles for CT#2A and CT#2B Figure 8: Schematic Instrument Profiles for CT#3A and CT#3B Figure 9: Schematic Instrument Profiles for L#1 and L#2 Figure 10: Location Plan and Schematic Thermistor Layout on Grum Overburden Dump Figure 11: Total Hourly Rainfall on CT#1 & CT#2A, 2B Recorded by the Davis Instruments
Vantage Pro Weather Stations Figure 12: Mean Hourly Air Temperature on CT#1 & CT#2A, 2B Recorded by the Davis
Instruments Vantage Pro Weather Stations and Satellite Stations Figure 13: Mean Hourly Relative Humidity on CT#1 & CT#2A, 2B Recorded by the Davis
Instruments Vantage Pro Weather Stations and Satellite Stations Figure 14: Mean Hourly Solar Radiation on CT#1 & CT2A, 2B Recorded by the Davis
Instruments Vantage Pro Weather Stations Figure 15: Mean Hourly Barometric Pressure on CT#1 & CT#2A, 2B Recorded by the Davis
Instruments Vantage Pro Weather Stations Figure 16: Mean Hourly Wind Speed on CT#1 & CT#2A, 2B Recorded by the Davis
Instruments Vantage Pro Weather Stations Figure 17: Wind Direction Totals (Measured Hourly) on CT#1 & CT#2A, 2B Recorded by the
Davis Instruments Vantage Pro Weather Stations Figure 18: Mean Hourly UV Index on CT#1 & CT#2A, 2B Recorded by the Davis Instruments
Vantage Pro Weather Stations Figure 19: Mean Hourly Matric Suction in CT#1 Recorded by the Davis Instruments Vantage
Pro Satellite Station Figure 20: Mean Hourly Soil Temperature in CT#1 Recorded by the Davis Instruments Vantage
Pro Satellite Station Figure 21: Mean Hourly Matric Suction in CT#2A Recorded by the Davis Instruments Vantage
Pro Satellite Station Figure 22: Mean Hourly Soil Temperature in CT#2A Recorded by the Davis Instruments
Vantage Pro Satellite Station Figure 23: Daily Battery Voltage of the Campbell Scientific CR10X #1 and CR10X #2 Data
Logger (Array 102)

SRK Consulting Monitor Mine Waste Rock Trial Covers – 2008 Data Summary Page iv
CCS/JM/sdc FaroVangorda_MonitorMineWasteRockTrialCovers_Report_1CY001.020_JM_20090528_FNL.docx, May. 29, 09, May 2009
Figure 24: Soil Matric Suction Measurements (taken every six hours) in CT#1 Recorded by CS229 Sensors Connected to Campbell Scientific Data Logger CR10X #2 (Array 168)
Figure 25: Soil Matric Suction Measurements (taken every six hours) in CT#2A Recorded by CS229 Sensors Connected to Campbell Scientific Data Logger CR10X #2 (Array 130)
Figure 26: Soil Matric Suction Measurements (taken daily) in CT#2B Recorded by CS229 Sensors Connected to Campbell Scientific Data Logger CR10X #2 (Array 130)
Figure 27: Soil Matric Suction Measurements (taken every six hours) in CT#3A Recorded by CS229 Sensors Connected to Campbell Scientific Data Logger CR10X #2 (Array 168)
Figure 28: Soil Matric Suction Measurements (taken every six hours) in CT#3B Recorded by CS229 Sensors Connected to Campbell Scientific Data Logger CR10X #2 (Array 168)
Figure 29: Soil Matric Suction Measurements (taken every six hours) in CT#4 Recorded by CS229 sensors Connected to Campbell Scientific Data Logger CR10X #2 (Array 168)
Figure 30: Soil Matric Suction Measurements (taken every six hours) in L#1 Recorded by CS229 Sensors Connected to Campbell Scientific Data Logger CR1000
Figure 31: Soil Matric Suction Measurements (taken every six hours) in L#2 Recorded by CS229 Sensors connected to Campbell Scientific Data Logger CR1000
Figure 32: Soil Temperature Measurements (taken every six hours) in CT#1 Recorded by CS229 Sensors Connected to Campbell Scientific Data Logger CR10X #2 (Array 168)
Figure 33: Soil Temperature Measurements (taken every six hours) in CT#2A Recorded by CS229 Sensors Connected to Campbell Scientific Data Logger CR10X #1 (Array 130)
Figure 34: Soil Temperature Measurements (taken every six hours) in CT#2B Recorded by CS229 Sensors Connected to Campbell Scientific Data Logger CR10X #1 (Array 130)
Figure 35: Soil Temperature Measurements (taken every six hours) in CT#3A Recorded by CS229 Sensors Connected to Campbell Scientific Data Logger CR10X #2 (Array 168)
Figure 36: Soil Temperature Measurements (taken every six hours) in CT#3B Recorded by CS229 Sensors Connected to Campbell Scientific Data Logger CR10X #2 (Array 168)
Figure 37: Soil Temperature Measurements (taken every six hours) in CT#4 Recorded by CS229 Sensors Connected to Campbell Scientific Data Logger CR10X #2 (Array 168)
Figure 38: Soil Temperature Measurements (taken every six hours) in L#1 Recorded by CS229 Sensors Connected to Campbell Scientific Data Logger CR1000
Figure 39: Soil Temperature Measurements (taken every six hours) in L#2 Recorded by CS229 Sensors Connected to Campbell Scientific Data Logger CR1000
Figure 40: Volumetric Moisture Content Measurements (taken every six hours) in CT#1 Recorded by EnviroSCAN Sensors Connected to Campbell Scientific Data Logger CR10X #2 (Array 168)
Figure 41: Volumetric Moisture Content Measurements (taken every six hours) in CT#2A Recorded by EnviroSCAN Sensors Connected to Campbell Scientific Data Logger CR10X #1 (Array 130)
Figure 42: Volumetric Moisture Content Measurements (taken every six hours) in CT#2B Recorded by EnviroSCAN Sensors Connected to Campbell Scientific Data Logger CR10X #1 (Array 130)
Figure 43: Volumetric Moisture Content Measurements (taken every six hours) in CT#3A Recorded by EnviroSCAN Sensors Connected to Campbell Scientific Data Logger CR10X #2 (Array 168)

SRK Consulting Monitor Mine Waste Rock Trial Covers – 2008 Data Summary Page v
CCS/JM/sdc FaroVangorda_MonitorMineWasteRockTrialCovers_Report_1CY001.020_JM_20090528_FNL.docx, May. 29, 09, May 2009
Figure 44: Volumetric Moisture Content Measurements (taken every six hours) in CT#3B Recorded by EnviroSCAN Sensors Connected to Campbell Scientific Data Logger CR10X #2 (Array 168)
Figure 45: Volumetric Moisture Content Measurements (taken every six hours) in CT#4 Recorded by EnviroSCAN Sensors Connected to Campbell Scientific Data Logger CR10X #2 (Array 168)
Figure 46: Volumetric Moisture Content Measurements (taken every six hours) in L#1 Recorded by EnviroSCAN Sensors Connected to Campbell Scientific Data logger CR1000
Figure 47: Volumetric Moisture Content Measurements (taken every six hours) in L#2 Recorded by EnviroSCAN Sensors Connected to Campbell Scientific Data logger CR1000
Figure 48: Interflow Totals in CT#3A Measured by a Tipping Bucket Connected to Campbell Scientific Data Logger CR10X #1
Figure 49: Interflow Totals in CT#3B Measured by a Tipping Bucket Connected to Campbell Scientific Data Logger CR10X #2 (Array 111)
Figure 50: Interflow Totals in CT#4 Measured by a Tipping Bucket Connected to Campbell Scientific Data Logger CR10X #2 (Array 111)
Figure 51: Surface Flow Totals in CT#2A Measured by a Tipping Bucket Connected to Campbell Scientific Data Logger CR10X#2 (Array 111)
Figure 52: Surface Flow Totals in CT#2B Measured by a Tipping Bucket Connected to Campbell Scientific Data Logger CR10X#2 (Array 111)
Figure 53: Surface Flow Totals in CT#3A Measured by a Tipping Bucket Connected to Campbell Scientific Data Logger CR10X#2 (Array 111)
Figure 54: Surface Flow Totals in CT#3B Measured by a Tipping Bucket Connected to Campbell Scientific Data Logger CR10X#2 (Array 111)
Figure 55: Surface Flow Totals in CT#4 Measured by a Tipping Bucket Connected to Campbell Scientific Data Logger CR10X#2 (Array 111)
Figure 56: Peripheral Interflow Totals in L#1 Measured by a Tipping Bucket Connected to Campbell Scientific Data Logger CR1000
Figure 57: Central Interflow Totals in L#1 Measured by a Tipping Bucket Connected to Campbell Scientific Data Logger CR1000
Figure 58:` Surface Flow Totals in L#1 Measured by a Tipping Bucket Connected to Campbell Scientific Data Logger
Figure 59: Peripheral Interflow Totals in L#2 Measured by a Tipping Bucket Connected to Campbell Scientific Data Logger CR1000
Figure 60: Central Interflow Totals in L#2 Measured by a Tipping Bucket Connected to Campbell Scientific Data Logger CR1000
Figure 61: Surface Flow Totals in L#2 Measured by a Tipping Bucket Connected to Campbell Scientific Data Logger CR1000
Figure 62: Surface Runoff (measured every minute) on CT#1 by a Seametrics Flowmeter Connected to a Seametrics DL75 Data Logger (File 0506051)
Figure 63: Surface Runoff (measured every minute) on CT#2A by a Seametrics Flowmeter Connected to a Seametrics DL75 Data Logger (File 0506052)

SRK Consulting Monitor Mine Waste Rock Trial Covers – 2008 Data Summary Page vi
CCS/JM/sdc FaroVangorda_MonitorMineWasteRockTrialCovers_Report_1CY001.020_JM_20090528_FNL.docx, May. 29, 09, May 2009
Figure 64: Surface Runoff (measured every minute) on CT#2B by a Seametrics Flowmeter Connected to a Seametrics DL75 Data Logger (File 0506053)
Figure 65: Surface Runoff (measured every minute) on CT#3A by a Seametrics Flowmeter Connected to a Seametrics DL75 Data Logger (File 0506054)
Figure 66: Interflow (measured every minute) on CT#3A by a Seametrics Flowmeter Connected to a Seametrics DL75 Data Logger (File 02051709)
Figure 67: Interflow (measured every minute) on CT#3B by a Seametrics Flowmeter Connected to a Seametrics DL75 Data Logger (File 02051710)
Figure 68: Surface Runoff (measured every minute) on CT#3B by a Seametrics Flowmeter Connected to a Seametrics DL75 Data Logger (File 0506054)
Figure 69: Surface Runoff (measured every minute) on CT#4 by a Seametrics Flowmeter Connected to a Seametrics DL75 Data Logger (File 0506058)
Figure 70: Surface runoff (measured every minute) on L#1 by a Seametrics flowmeter connected to a Seametrics DL75 Data logger (File 72649)
Figure 71: Surface runoff (measured every minute) in L#2 by a Seametrics flowmeter connected to a Seametrics DL75 Data logger (File 72651)
Figure 72: Soil Temperature (measured every twelve hours) in Grum Overburden Dump by an M-squared Thermistor String Connected to a Lakewood Systems UL16 Data Logger (Thermistor String A). Raw Data Displayed
Figure 73: Soil Temperature (measured every twelve hours) in Grum Overburden Dump by an M-squared Thermistor String Connected to a Lakewood Systems UL16 Data Logger (Thermistor String B). Raw Data Displayed
Figure 74: Monthly soil Temperature Measurements in Grum Overburden Dump by an M-Squared Thermistor String Measured manually (Thermistor String 1). Raw Data expressed as resistances
Figure75: Monthly soil Temperature Measurements in Grum Overburden Dump by an M-Squared Thermistor String Measured manually (Thermistor String 2). Raw Data expressed as resistances
Figure 76: Monthly soil Temperature Measurements in Grum Overburden Dump by an M-Squared Thermistor String Measured manually (Thermistor String 3). Raw Data expressed as resistances
Figure 77: Monthly soil Temperature Measurements in Grum Overburden Dump by an M-Squared Thermistor String Measured manually (Thermistor String 4). Raw Data expressed as resistances
Figure 78: Daily Volumetric Moisture Content in CT#1 (Station #1) Measured manually by a Sentek Diviner 2000
Figure 79: Daily Volumetric Moisture Content in CT#1 (Station #2) Measured manually by a Sentek Diviner 2000
Figure 80: Daily Volumetric Moisture Content in CT#1 (Station #3) Measured manually by a Sentek Diviner 2000
Figure 81: Daily Volumetric Moisture Content in CT#1 (Station #4) Measured manually by a Sentek Diviner 2000
Figure 82: Daily Volumetric Moisture Content in CT#1 (Station #5) Measured manually by a Sentek Diviner 2000

SRK Consulting Monitor Mine Waste Rock Trial Covers – 2008 Data Summary Page vii
CCS/JM/sdc FaroVangorda_MonitorMineWasteRockTrialCovers_Report_1CY001.020_JM_20090528_FNL.docx, May. 29, 09, May 2009
Figure 83: Daily Volumetric Moisture Content in CT#1 (Station #6) Measured manually by a Sentek Diviner 2000
Figure 84: Daily Volumetric Moisture Content in CT#2A (Station #9) Measured manually by a Sentek Diviner 2000
Figure 85: Daily Volumetric Moisture Content in CT#2A (Station #10) Measured manually by a Sentek Diviner 2000
Figure 86: Daily Volumetric Moisture Content in CT#2A (Station #11) Measured manually by a Sentek Diviner 2000
Figure 87: Daily Volumetric Moisture Content in CT#2A (Station #12) Measured manually by a Sentek Diviner 2000
Figure 88: Daily Volumetric Moisture Content in CT#2A (Station #13) Measured manually by a Sentek Diviner 2000
Figure 89: Daily Volumetric Moisture Content in CT#2A (Station #14) Measured manually by a Sentek Diviner 2000
Figure 90: Daily Volumetric Moisture Content in CT#2B (Station #15) Measured manually by a Sentek Diviner 2000
Figure 91: Daily Volumetric Moisture Content in CT#2B (Station #16) Measured manually by a Sentek Diviner 2000
Figure 92: Daily Volumetric Moisture Content in CT#2B (Station #17) Measured manually by a Sentek Diviner 2000
Figure 93: Daily Volumetric Moisture Content in CT#2B (Station #18) Measured manually by a Sentek Diviner 2000
Figure 94: Daily Volumetric Moisture Content in CT#2B (Station #19) Measured manually by a Sentek Diviner 2000
Figure 95: Daily Volumetric Moisture Content in CT#2B (Station #20) Measured manually by a Sentek Diviner 2000
Figure 96: Daily Volumetric Moisture Content in CT#3A (Station #21) Measured manually by a Sentek Diviner 2000
Figure 97: Daily Volumetric Moisture Content in CT#3A (Station #22) Measured manually by a Sentek Diviner 2000
Figure 98: Daily Volumetric Moisture Content in CT#3A (Station #23) Measured manually by a Sentek Diviner 2000
Figure 99: Daily Volumetric Moisture Content in CT#3A (Station #24) Measured manually by a Sentek Diviner 2000
Figure 100: Daily Volumetric Moisture Content in CT#3A (Station #25) Measured manually by a Sentek Diviner 2000
Figure 101: Daily Volumetric Moisture Content in CT#3A (Station #26) Measured manually by a Sentek Diviner 2000
Figure 102: Daily Volumetric Moisture Content in CT#3B (Station #27) Measured manually by a Sentek Diviner 2000
Figure 103: Daily Volumetric Moisture Content in CT#3B (Station #28) Measured manually by a Sentek Diviner 2000
Figure 104: Daily Volumetric Moisture Content in CT#3B (Station #29) Measured manually by a Sentek Diviner 2000
SRK Consulting Monitor Mine Waste Rock Trial Covers – 2008 Data Summary Page viii
CCS/JM/sdc FaroVangorda_MonitorMineWasteRockTrialCovers_Report_1CY001.020_JM_20090528_FNL.docx, May. 29, 09, May 2009
Figure 105: Daily Volumetric Moisture Content in CT#3B (Station #30) Measured manually by a Sentek Diviner 2000
Figure 106: Daily Volumetric Moisture Content in CT#3B (Station #31) Measured manually by a Sentek Diviner 2000
Figure 107: Daily Volumetric Moisture Content in CT#3B (Station #32) Measured manually by a Sentek Diviner 2000
Figure 108: Daily Volumetric Moisture Content in CT#4 (Station #33) Measured manually by a Sentek Diviner 2000
Figure 109: Daily Volumetric Moisture Content in CT#4 (Station #34) Measured manually by a Sentek Diviner 2000
Figure 110: Daily Volumetric Moisture Content in CT#4 (Station #35) Measured manually by a Sentek Diviner 2000
Figure 111: Daily Volumetric Moisture Content in CT#4 (Station #36) Measured manually by a Sentek Diviner 2000
Figure 112: Daily Volumetric Moisture Content in CT#4 (Station #37) Measured manually by a Sentek Diviner 2000
Figure 113: Daily Volumetric Moisture Content in CT#4 (Station #38) Measured manually by a Sentek Diviner 2000
Figure 114: Daily Volumetric Moisture Content in CT#4 (Station #39) Measured manually by a Sentek Diviner 2000
Figure 115: Daily Volumetric Moisture Content in CT#4 (Station #40) Measured manually by a Sentek Diviner 2000
Figure 116: Daily Volumetric Moisture Content in #L1 (Station #41) Measured manually by a Sentek Diviner 2000
Figure 117: Daily Volumetric Moisture Content in #L1 (Station #42) Measured manually by a Sentek Diviner 2000
Figure 118: Daily Volumetric Moisture Content in #L1 (Station #43) Measured manually by a Sentek Diviner 2000
Figure 119: Daily Volumetric Moisture Content in #L1 (Station #44) Measured manually by a Sentek Diviner 2000
Figure 120: Daily Volumetric Moisture Content in #L1 (Station #45) Measured manually by a Sentek Diviner 2000
Figure 121: Daily Volumetric Moisture Content in #L1 (Station #46) Measured manually by a Sentek Diviner 2000
Figure 122: Daily Volumetric Moisture Content in #L1 (Station #47) Measured manually by a Sentek Diviner 2000
Figure 123: Daily Volumetric Moisture Content in #L1 (Station #48) Measured manually by a Sentek Diviner 2000
Figure 124: Daily Volumetric Moisture Content in #L1 (Station #49) Measured manually by a Sentek Diviner 2000
Figure 125: Daily Volumetric Moisture Content in #L1 (Station #50) Measured manually by a Sentek Diviner 2000
Figure 126: Daily Volumetric Moisture Content in #L2 (Station #51) Measured manually by a Sentek Diviner 2000

SRK Consulting Monitor Mine Waste Rock Trial Covers – 2008 Data Summary Page ix
CCS/JM/sdc FaroVangorda_MonitorMineWasteRockTrialCovers_Report_1CY001.020_JM_20090528_FNL.docx, May. 29, 09, May 2009
Figure 127: Daily Volumetric Moisture Content in #L2 (Station #52) Measured manually by a Sentek Diviner 2000
Figure 128: Daily Volumetric Moisture Content in #L2 (Station #53) Measured manually by a Sentek Diviner 2000
Figure 129: Daily Volumetric Moisture Content in #L2 (Station #54) Measured manually by a Sentek Diviner 2000
Figure 130: Daily Volumetric Moisture Content in #L2 (Station #55) Measured manually by a Sentek Diviner 2000
Figure 131: Daily Volumetric Moisture Content in #L2 (Station #56) Measured manually by a Sentek Diviner 2000
Figure 132: Daily Volumetric Moisture Content in #L2 (Station #57) Measured manually by a Sentek Diviner 2000
Figure 133: Daily Volumetric Moisture Content in #L2 (Station #58) Measured manually by a Sentek Diviner 2000
Figure 134: Daily Volumetric Moisture Content in #L2 (Station #59) Measured manually by a Sentek Diviner 2000
Figure 135: Daily Volumetric Moisture Content in #L2 (Station #60) Measured manually by a Sentek Diviner 2000
Figure 136: Hydrostatic Pressure Measured using the HOBO Water Level Logger installed on CT#2A. Only significant values are displayed
Figure 137: Hydrostatic Pressure Measured using the HOBO Water Level Logger installed on CT#2B. Only significant values are displayed
Figure 138: Hydrostatic Pressure Measured using the HOBO Water Level Logger installed on L#1. Only significant values are displayed
Figure 139: Hydrostatic Pressure Measured using the HOBO Water Level Logger installed on L#2. Only significant values are displayed
List of Appendices
Appendix A: Additional Climatic Data Calculated and Stored by Davis Instruments Vantage Pro Data Logger
Appendix B: Summary of Saturated Hydraulic Conductivity and In-situ Density Measurements B.1: Summary of In-Situ Hydraulic Conductivity Testing Results B.2: Summary of In-Situ Density Measurements
Appendix C: Individual Calculation Sheets for Saturated Hydraulic Conductivity Data C.1: Guelph Infiltrometer Field Data Sheets C.2: Ring Infiltrometer Field Data Sheets
Appendix D: Field Measurements of In-Situ Density Appendix E: 2008 Flow Monitoring System Upgrade Appendix F: Field Diagnostic Data Sheets

SRK Consulting Monitor Mine Waste Rock Trial Covers – 2008 Data Summary Page 1
CCS/JM/sdc FaroVangorda_MonitorMineWasteRockTrialCovers_Report_1CY001.020_JM_20090528_FNL.docx, May. 29, 09, May 2009
1 Introduction and Scope of Report 1.1 General
In 1998, the mining activities undertaken by Anvil Range Mining Corporation (ARMC) ceased due to financial problems and Deloitte & Touche Inc. (D&T) was appointed Interim Receiver of the mine site. Included in the Interim Receiver’s role were:
o management of the site’s care and maintenance and
o development of a site closure plan.
D&T was recently released of these obligations. In particular, a new 3-year care and maintenance contract for the Faro Mine Complex (FMC) was awarded to Denison Environmental Services (DES), with the transfer of responsibility for the site’s care and maintenance on March 1, 2009. As regards the Final Closure and Reclamation Plan (the Plan), SRK Consulting (Canada) Inc. (SRK) was retained by D&T, on behalf of the Faro Mine Closure Planning Office (FMCPO), to assist in the development of a closure plan. Following several years of technical studies, public consultation and review by an independent review panel, two closure alternatives were subsequently agreed on by the Federal, Territorial and First Nations Governments as part of the overall closure plan for the Faro Mine Complex, i.e. one for the Vangorda-Grum area and one for the Faro area and the tailings impoundment. The development of the Project Description and the Environmental Impact Statement associated with the Plan is presently ongoing. Based on current expectations, this Plan will be submitted to the relevant regulating authorities by end of July 2009.
Engineering studies continue to be undertaken in the interim to provide the necessary scientific background information required to characterize and estimate costs for the closure methods to be used in the Plan. Soil covers are one of the key components of the remediation strategy. The trial covers constructed in 2004 will provide valuable information regarding the physical stability and infiltration reduction performance of soil covers constructed using locally available soils.
This report summarizes data collected between November 2007 and October 2008. The 2008 Monitoring Report follows 2007/08 Task 18a, “Monitor Mine Waste Rock Trial Covers”(SRK 2008a), 2006/07 Task 17a, “Monitor Mine Waste Rock Trial Covers”(SRK 2007), 2005/06 Task 20a, “Waste Rock Dump Cover Trials” (SRK 2006b), and 2004/05 Task 14a. No report was issued for 2004/05 Task 14a because construction of the cover trials was only completed in September 2004, and there was no data to report. An “as-built” report for the trial covers has been prepared as a separate report under 2004/05 Task 14a (SRK 2006a).
1.2 Background of the Project
The Faro Mining Complex (FMC) has about 185 million cubic meters of waste rock covering about 542 ha of surface area. Detailed geochemical characterization has confirmed that much of this waste rock is acid generating and contains leachable metals. As part of the approved Plan, one of the methods is physical covering of the waste rock piles.

SRK Consulting Monitor Mine Waste Rock Trial Covers – 2008 Data Summary Page 2
CCS/JM/sdc FaroVangorda_MonitorMineWasteRockTrialCovers_Report_1CY001.020_JM_20090528_FNL.docx, May. 29, 09, May 2009
The specific functions that a cover would have to perform have not been defined. However, the most likely functions would include:
• preventing direct exposure and contact with the waste rock;
• reducing, and possibly minimizing infiltration through the waste rock; and
• providing a medium that would allow re-vegetation of the piles.
Other potential functions have not been excluded, but there appears to be consensus within the Work Group responsible for the description and evaluation of the cover methods, that constructing covers to act as oxygen barriers would not be beneficial. Significant oxidation of the waste rock has already occurred, effectively negating benefits offered by oxygen exclusion.
One of the single most challenging aspects of cover design for the site entails designing an infiltration reducing cover that will continue to perform effectively in the very long term, using the locally available till and glacio-fluvial soils. It is standard practice to make use of numerical models to assess the potential performance ranges of different cover configurations. However, the only reliable method to evaluate the physical aspects that determine long-term cover performance is to monitor site specific trial covers.
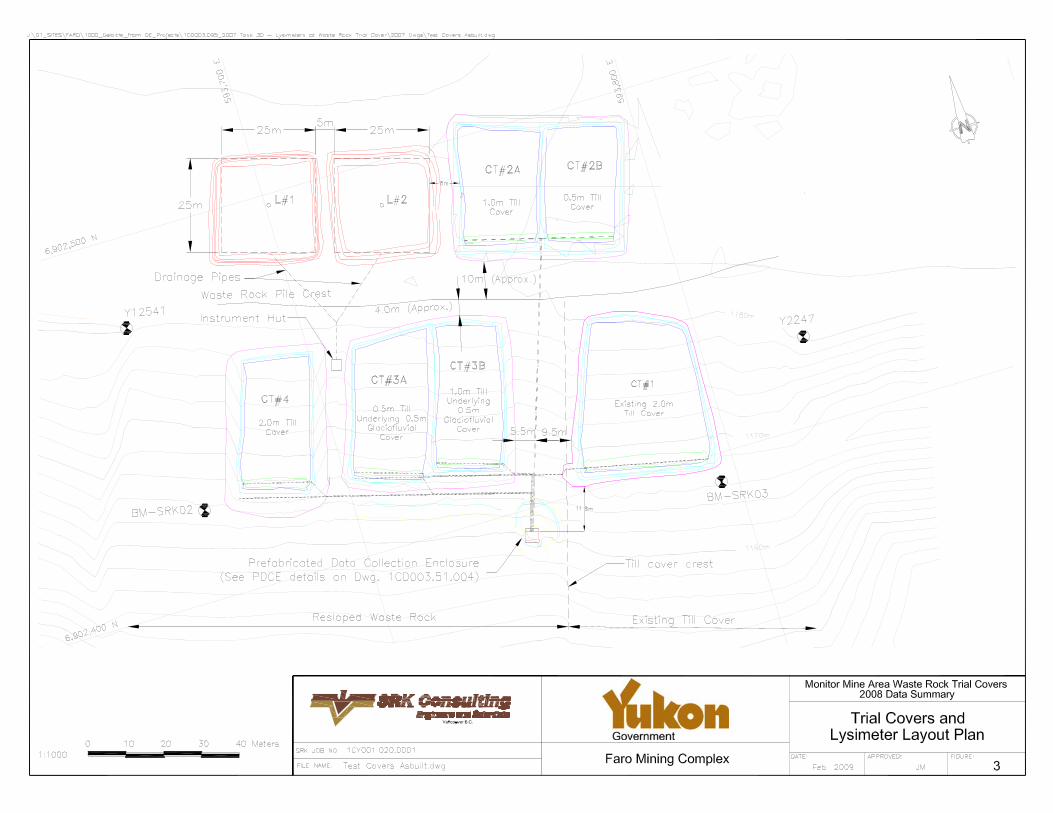
Subsequently, six trial covers (CT#1, CT#2A, CT#2B, CT#3A, CT#3B and CT#4) were constructed on the Vangorda waste rock pile in September 2004, as illustrated in Figures 1, 2 and 3. These trial covers have been designed to test a range of different physical performance criteria for the available materials, specifically focused towards evaluating performance as “infiltration reducing” covers. Detailed water balance instrumentation was installed in the trial covers in June 2005 (see Figures 4 through 8).
In 2007, following the recommendation of the Independent Peer Review Panel a set of two large lysimeters (25 meters by 25 meters) were constructed on the plateau of the Vangorda waste rock dump. As shown in Figure 3, the lysimeters were built immediately west of the existing cover trial plots, adjacent to CT#2A. The lysimeters were instrumented in June 2008, using the same suite of instrumentation installed for the existing cover trials (Figure 9). Details about the location and type of instrumentation can be found in the lysimeters as-built report (SRK 2008b). The first season of collected data is presented in this report.
It is anticipated that the trial covers and lysimeters will be monitored for at least 3 more years, and that the resultant information will be used to optimize final cover designs for the FMC.
1.3 Scope of Work
This report summarizes the data collected from the trial covers during the 2008 monitoring season (November 2007 to October 2008). The intent of this report is to document the basic field results and provide feedback on the quality of data collected. Where data collection problems are identified, this report provides recommendations to remedy the problems as well as propose mitigation

SRK Consulting Monitor Mine Waste Rock Trial Covers – 2008 Data Summary Page 3
CCS/JM/sdc FaroVangorda_MonitorMineWasteRockTrialCovers_Report_1CY001.020_JM_20090528_FNL.docx, May. 29, 09, May 2009
measures that can be implemented to prevent similar problems from occurring again. This report does not contain a technical analysis of the data. Nevertheless, a preliminary performance review was completed based on three years of data.
Instrumentation was re-commissioned by SRK in May 2008. FMC personnel retrieved data from all data loggers every two weeks until September 11, 2008. Some additional, infrequent downloads were performed after that period by FMC personnel, and the last download for the season was performed by Jozsef Miskolczi, EIT of SRK at the time of decommissioning of the instrumentation, on October 3, 2008.
Detailed information regarding the monitoring instrumentation used to collect the data presented in this report, covering their operation, calibration, suitability and accuracy is provided in the respective as-built reports (SRK 2006a, SRK 2008b), and is therefore not repeated here.
1.4 Methods
Six trial covers (Figures 2 and 3) were constructed in September 2004, in accordance with SRK design requirements. Construction was carried out by a local contractor, Tim Moon Construction, supported by FMC staff and equipment. Construction supervision was carried out by two SRK engineers, Maritz Rykaart, P.Eng. and Peter Mikes, E.I.T. The instrumentation was installed in June 2005 by Maritz Rykaart. The instrumentation was commissioned in June 2005, with complete construction and instrumentation details provided in an as-built report (SRK 2006a). Two lysimeters were built in 2007 by the same local contractor, Tim Moon Construction, with support from FMC staff. Supervision of the construction phase was provided by SRK engineer Jozsef Miskolczi, EIT. Instrumentation was installed and commissioned in June 2008 by Jozsef Miskolczi. Detailed construction and instrumentation notes can be found in the as-built report (SRK 2008b).
FMC staff, including two UBC summer students, was trained by SRK to carry out the field monitoring for the 2008 monitoring season (May to October). A written monitoring protocol was provided to FMC. Data was downloaded directly from the different data loggers onto a laptop computer. In addition, a series of readings were collected manually and converted into electronic format. All field data collected by FMC was sent to SRK via e-mail.
SRK used proprietary software linked to each of the data loggers to open and view the data to ensure that the loggers were operating satisfactorily. All data was collated into a master database at the end of the season. This master database converts raw field data into its final usable format by applying material specific calibration information. The figures illustrating the field data presented in this report (Figures 11 through 139) were created using this master database. Figures 11 through 139 do not show all the data collected to date. These figures only present the data collected during the 2008 monitoring season. As a result, figures presenting data as a graph will have lines extending from the end of the 2007 data set to the start of the 2008 data set. The range of the x-axis has been set to obscure this artefact but it can still be observed on the left hand side of the graph. Complete details

SRK Consulting Monitor Mine Waste Rock Trial Covers – 2008 Data Summary Page 4
CCS/JM/sdc FaroVangorda_MonitorMineWasteRockTrialCovers_Report_1CY001.020_JM_20090528_FNL.docx, May. 29, 09, May 2009
of how data is prepared for input into the database and how the database was developed are included in the as-built report (SRK 2006a).
In addition to the data presented in this report, weather data is collected from two on-site weather stations, and annual snow surveys are conducted by staff from the Yukon Territorial Government (Janowicz et al. 2005, 2006, 2007, and 2008). This data is not presented here, but will be used to compare the validity of the trial cover data when detailed data analysis is carried out following future years of monitoring.
1.5 Post Processing
Every year the raw data collected by site personnel and conveyed to SRK by email was post-processed and integrated into a complete database containing all the data, from the beginning of monitoring in 2005, to date. Due to the required application of material-specific calibrations, a dedicated software package was created using the Fortran programming code that would perform the calibration-dependant conversions as well as check for validity of data and outliers. With the addition of the tipping buckets and the lysimeter instrumentation, the post-processing utilities had to be changed to accommodate the altered data structure collected from the CR10X data loggers, as well as the new type of output files generated by the CR1000 data logger.
In an effort to make the new post-processing protocol more simple and more versatile, it was decided to make use of the VBA and SQL programming capabilities of the Microsoft Access database and make the data check and calibration functions resident within the database. The 2008 data was compiled using this new protocol, as well as the integration of the old data (2007 and before). The new post-processing protocol does not change the data download protocols from the field instruments.
1.6 Report Structure
Section 2 contains information associated with the series of automated data loggers which collect field monitoring data for the trial covers. The remainder of the instrumentation data is collected manually, the details of which are presented in Section 4. The in-situ material characterization program carried out in 2008 is summarised in Section 5, while the final section of the report provides a summary of the action items arising from this data summary report.

SRK Consulting Monitor Mine Waste Rock Trial Covers – 2008 Data Summary Page 5
CCS/JM/sdc FaroVangorda_MonitorMineWasteRockTrialCovers_Report_1CY001.020_JM_20090528_FNL.docx, May. 29, 09, May 2009
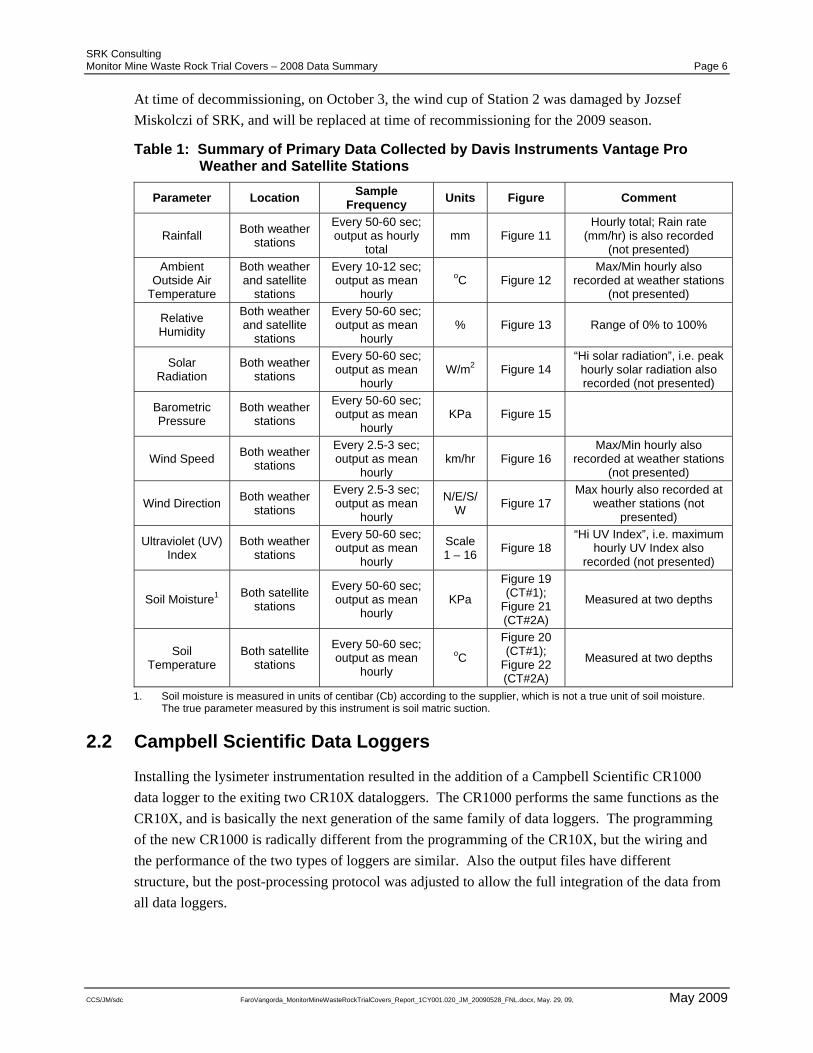
2 Automated Instrumentation Data Logger Data 2.1 Davis Instruments Vantage Pro (Weather Stations and Satellite
Stations)
Complete climatic data is collected at the Vangorda Waste Rock Pile trial cover location using two Davis Instruments Vantage Pro Weather stations. The first station is located on the sloped CT#1 trial cover and the second on the dividing berm between horizontal trial covers CT#2A and CT#2B. Figure 2 schematically illustrates these locations. Additional climatic data (air temperature and relative humidity), as well as shallow soil moisture and temperature data, are collected via two satellite Davis Instruments stations located approximately 25 m from these two primary weather stations, as illustrated in Figure 4. Figures 6 and 7 illustrate the locations of the soil moisture and temperature sensors installed as part of the satellite stations.
At each setup, the data from the weather station and the satellite station is collected by a Vantage Pro data logger housed in the weather-proof enclosure situated beneath the weather station. The data loggers collect and store primary climatic data, as listed in Table 1. This data is measured directly from the suite of climatic sensors. This data is also presented as time-series graphs in Figures 11 through 22, and spans from June through October 2008.
In addition to the sensor data listed in Table 1, the data logger uses this primary data to calculate a series of secondary climatic information. Since this report focuses on the integrity of the primary collected data, this reduced data was not reported. SRK did, however, review all this data to confirm that the data logger was operating satisfactorily, and that the data collected made sense. This data has also been imported into the central database for future use. Appendix A provides a brief summary of this data.
Maintenance or recalibration was not carried out on the weather or satellite stations in 2008; however, regular visual inspections by the monitoring staff concluded that there were no problems. The rechargeable batteries installed in 2007 were replaced at the beginning of the 2008 season. As a precautionary measure, a spare set of batteries were provided on site, but did not have to be used.
Review of the data records revealed a major gap in data collection for Station 2 between June 8 and July 31, during which period no data from any of the sensors external to the weather station console was collected. Figures 11 through 22 show a flat line for the period with no data. The investigation of the incident found all the sensor components in good working order, and the console was working as well. The suspicion is that the problem was caused by radio communication between the sensor suite and the console being disrupted by interference with another more powerful radio source. On July 31 the communication was restored spontaneously, and data recording was resumed in good order, although the plotted time stamps of the recorded data indicate a one-day offset between the two stations. Station 1 also has a short gap in data from September 11 to October 1. The cause of this gap is not known, and data collection resumed spontaneously around 1AM on October 1.
SRK Consulting Monitor Mine Waste Rock Trial Covers – 2008 Data Summary Page 6
CCS/JM/sdc FaroVangorda_MonitorMineWasteRockTrialCovers_Report_1CY001.020_JM_20090528_FNL.docx, May. 29, 09, May 2009
At time of decommissioning, on October 3, the wind cup of Station 2 was damaged by Jozsef Miskolczi of SRK, and will be replaced at time of recommissioning for the 2009 season.
Table 1: Summary of Primary Data Collected by Davis Instruments Vantage Pro Weather and Satellite Stations
Parameter Location Sample Frequency Units Figure Comment
Rainfall Both weather stations
Every 50-60 sec; output as hourly
total mm Figure 11
Hourly total; Rain rate (mm/hr) is also recorded
(not presented) Ambient
Outside Air Temperature
Both weather and satellite
stations
Every 10-12 sec; output as mean
hourly oC Figure 12
Max/Min hourly also recorded at weather stations
(not presented)
Relative Humidity
Both weather and satellite
stations
Every 50-60 sec; output as mean
hourly % Figure 13 Range of 0% to 100%
Solar Radiation
Both weather stations
Every 50-60 sec; output as mean
hourly W/m2 Figure 14
“Hi solar radiation”, i.e. peak hourly solar radiation also recorded (not presented)
Barometric Pressure
Both weather stations
Every 50-60 sec; output as mean
hourly KPa Figure 15
Wind Speed Both weather stations
Every 2.5-3 sec; output as mean
hourly km/hr Figure 16
Max/Min hourly also recorded at weather stations
(not presented)
Wind Direction Both weather stations
Every 2.5-3 sec; output as mean
hourly
N/E/S/W Figure 17
Max hourly also recorded at weather stations (not
presented)
Ultraviolet (UV) Index
Both weather stations
Every 50-60 sec; output as mean
hourly
Scale 1 – 16 Figure 18
“Hi UV Index”, i.e. maximum hourly UV Index also
recorded (not presented)
Soil Moisture1 Both satellite stations
Every 50-60 sec; output as mean
hourly KPa
Figure 19 (CT#1);
Figure 21 (CT#2A)
Measured at two depths
Soil Temperature
Both satellite stations
Every 50-60 sec; output as mean
hourly oC
Figure 20 (CT#1);
Figure 22 (CT#2A)
Measured at two depths
1. Soil moisture is measured in units of centibar (Cb) according to the supplier, which is not a true unit of soil moisture. The true parameter measured by this instrument is soil matric suction.
2.2 Campbell Scientific Data Loggers
Installing the lysimeter instrumentation resulted in the addition of a Campbell Scientific CR1000 data logger to the exiting two CR10X dataloggers. The CR1000 performs the same functions as the CR10X, and is basically the next generation of the same family of data loggers. The programming of the new CR1000 is radically different from the programming of the CR10X, but the wiring and the performance of the two types of loggers are similar. Also the output files have different structure, but the post-processing protocol was adjusted to allow the full integration of the data from all data loggers.

SRK Consulting Monitor Mine Waste Rock Trial Covers – 2008 Data Summary Page 7
CCS/JM/sdc FaroVangorda_MonitorMineWasteRockTrialCovers_Report_1CY001.020_JM_20090528_FNL.docx, May. 29, 09, May 2009
2.2.1 General Setup
Two Campbell Scientific CR10X data loggers collect soil matric suction and temperature data from Campbell Scientific CS229 thermal conductivity sensors, as well as soil volumetric moisture content from Sentek Sensor Technologies EnviroSCAN sensors. Flow volumes from the tipping bucket flow gauges are also monitored by one of the CR10X data loggers. In addition, the data loggers monitor and record the minimum battery voltage each day, for diagnostic purposes. The CR10X are located adjacent to each other in the monitoring hut at the base of CT#3B while the CR1000 is located in the second monitoring hut between CT#4 and CT#3A, as illustrated in Figures 4 and 5.
The first data logger (CR10X #1) collects volumetric moisture content data from CT#2A and 2B, as well as the entire suite of flow data from 9 tipping buckets . The second data logger (CR10X #2) records the soil temperature and suction as well as moisture content data from CT#1, CT#3A, CT#3B, and CT#4. In addition, the CR1000 is collecting soil temperature, suction, moisture content and interflow data from Lysimeters L#1 and L#2. Details of the instrument locations are presented in Figures 4 through 9.
Data collected by the CR10X data loggers is stored in a series of “arrays” (i.e. a summary table of data). The soil matric suction, temperature and volumetric moisture content are recorded every six hours (midnight, 6AM, noon, and 6PM) by CR10X#2 and CR1000 while CR10X #1 outputs moisture content data every 15 minutes. The interflow is continuously monitored by both CR1000 and CR10X#2 and cumulative flow is output every 30 minutes. Daily summary output of all the data is provided, which also includes information about the battery voltage for diagnostic purposes.
The Campbell Scientific data loggers are not decommissioned during winter months and as a consequence data is continuously collected, as opposed to the weather stations that are decommissioned during winter. Data collected using the CR10X data loggers and presented in this report spans from the end of the 2007 monitoring season in November to October 2008.
2.2.2 Battery Voltage
The data loggers and instruments are powered by a 12V battery (one per data logger). These batteries are continuously recharged using solar energy (one solar panel per battery). The data logger has an internal protection circuit that will shut the logger down if the battery voltage drops below 10.5V, or exceeds 15V. For this reason, the data loggers have been programmed to record the battery voltage as part of the daily summary array. Figure 23 presents the graph of daily minimum battery voltages measured for each of the CR data loggers.
As can be observed in Figure 23, the battery voltage of the CR1000 datalogger was often lower than optimum, causing the datalogger to shut down several times for short time periods. Nevertheless the data loss was minimal, as the solar panel would recharge the battery. The cause of the low voltage was the underestimation of the datalogger’s power requirements. To avoid similar situation in the future, SRK recommends the installation of a second solar panel to boost the recharge capacity of the battery.

SRK Consulting Monitor Mine Waste Rock Trial Covers – 2008 Data Summary Page 8
CCS/JM/sdc FaroVangorda_MonitorMineWasteRockTrialCovers_Report_1CY001.020_JM_20090528_FNL.docx, May. 29, 09, May 2009
The written monitoring protocol required a physical diagnostic check on the batteries and solar panels every time that the data is downloaded, which confirmed that both systems were functioning properly. Observation sheets are included as Appendix F.
2.2.3 Soil Matric Suction
Soil matric suction is measured in each trial cover using a series of Campbell Scientific CS229 thermal conductivity sensors. There are three to six sensors in each trial cover and four sensors in each lysimeter, as illustrated in Figures 6 to 9. Soil matric suction is recorded as a voltage differential by the data logger. This voltage differential, through the application of material specific calibration curves, is converted to matric suction, expressed in kPa. This conversion is done by SRK during the process of transferring the raw data to a central database. Figures 24 through 31 illustrate the converted soil matric suction values recorded during the 2008 season.
2.2.4 Soil Temperature
The soil temperature is measured using the same CS229 thermal conductivity sensors. This occurs because the first step in recording the soil matric suction entails taking an in-situ soil temperature reading. Just as with the matric suction data, the raw data is recorded as a voltage and, through application of the material specific calibration curves in the post-processing phase, the soil temperature profiles illustrated in Figures 32 to 39 are produced.
2.2.5 Soil Volumetric Moisture Content
A profile of soil volumetric moisture content is measured in each trial cover using Sentek Senor Technologies EnviroSCAN probes. Each profile contains between seven and thirteen individual beads, as illustrated in Figures 6 to 9. The data recorded by the sensors is relative volumetric moisture content, expressed as a fraction, using a standard calibration curve. During the post-processing, these values are corrected to actual volumetric moisture contents by applying material specific calibration curves. This data is presented in Figures 40 through 47.
As can be seen on Figure 40 and Figures 43 through 45 the data collected from the EnviroScan probes connected to CR10X#2 between July 10 and July 29, 2008 was erratic. The cause of failure was identified in a faulty connection cable between the datalogger and the multiplexer housing box located on CT#3A/B. The buried cable was replaced with a section of armoured cable.
2.2.6 Tipping Bucket Flow Gauges (Runoff and Interflow)
As a result of the instrumentation upgrade program carried out in 2007, the flow (interflow as well as surface flow) data is collected using two methods: tipping bucket flow gauges and SeaMetrics flow gauges. The tipping buckets are continuously monitored by CR10X #1 through two 8-channel SDM-SW8A pulse counter devices connected in series; cumulated totals of tips are recorded every 30 minutes. The tipping bucket flow gauges installed at the lysimeters are monitoring the surface flow and two interflow values on each lysimeter through same type pulse counter device connected

SRK Consulting Monitor Mine Waste Rock Trial Covers – 2008 Data Summary Page 9
CCS/JM/sdc FaroVangorda_MonitorMineWasteRockTrialCovers_Report_1CY001.020_JM_20090528_FNL.docx, May. 29, 09, May 2009
to the CR1000 data logger. The interflow of the lysimeters was separated in order to quantify the purely vertical infiltration separately from the infiltration affected by the cover-liner boundary.
The 2008 monitoring season was unusually wet, with total precipitation from May to October in excess of 322 mm compared to 214 mm, the 30 year (1971 to 2000) annual average. As a result the interflow and surface flow rates exceeded the capacity of the tipping buckets causing them to overflow on several occasions; therefore, the flow volumes recorded using the tipping bucket flow gauges are most likely underestimated. The recorded interflow data for TC#3A/B and TC#4 is presented in Figures 48 to 50, while the interflow for L#1 and L#2 is presented in Figures 56 to 61.
2.3 SeaMetrics DL75 Data Loggers (Surface Runoff and Interflow)
Surface runoff is measured from each trial cover using individual SeaMetrics flowmeters, each connected to an individual SeaMetrics DL75 data logger. Interflow from CT#3A, CT#3B and CT#4 is also measured with a similar setup (in addition to tipping buckets, as discussed in Section 2.2.6). Each of these nine flowmeters is located in a monitoring hut, with the flow directed to them through a series of buried drainage pipes, as illustrated in Figure 5. In addition, a similar setup was installed for the lysimeters, with the SeaMetrics data loggers installed on drainage pipes inside the second monitoring hut.
The flow meters monitoring the lysimeter flow proved to be affected by the organic matter and sediment transported by the water travelling down the drainage pipes to the flow meters. These impurities did, in some cases, block the turbine of the flow meter, thus preventing it from recording the real flow values. To correct this deficiency, a sedimentation or filtration system should be installed upstream of the flow meters that would capture and retain the transported sediment. The same phenomenon was not observed in the case of the nine flow meters installed in the old monitoring hut. This is probably due to the fact that the covers and the drainage pipes were installed several seasons ago, and the free sediments available for transport were already flushed during the previous seasons.
The data loggers recorded an instantaneous flow rate every 60 seconds in the case of the cover trials and every 30 seconds in the case of the lysimeters. This data is used to calculate an incremental flow volume. In addition, each data logger calculates a total volume and flow rate over a user specified timeframe. During the post-processing of the data, the null values (no flow recorded) are removed from the database to save space, thus the graphs in this report show only the non-null values in chronological sequence. This data is presented in Figures 62 through 65 and 68 through 71 and the interflow data is presented in Figures 66 and 67.
All flowmeters were performing as expected. Field staff, who visited the site almost daily throughout the 2007 field season, confirmed that they did not see any discernable runoff collect in the runoff drains at any time.

SRK Consulting Monitor Mine Waste Rock Trial Covers – 2008 Data Summary Page 10
CCS/JM/sdc FaroVangorda_MonitorMineWasteRockTrialCovers_Report_1CY001.020_JM_20090528_FNL.docx, May. 29, 09, May 2009
It should however be noted that the flowmeters will not record very low flows. To correct this situation, a series of six additional tipping bucket flowmeters were installed in 2007, as detailed in Appendix E. In addition, during the 2007 season the written monitoring protocol required a physical examination of the interflow pipes to monitor the presence of water to determine if an additional method of monitoring will be required. A record of these observations is included as Appendix F.
2.4 Lakewood Systems UL16 Data Logger (Soil Temperature)
Two thermistor strings, each with eight M-Squared thermistor beads, have been installed in the Grum Overburden Dump, as illustrated in Figure 10. These two thermistor strings (String A and String B) are monitored by a Lakewood UL16 data logger which records a relative voltage every twelve hours. These raw voltage profiles are presented in Figures 72 and 73, and confirm that the strings are performing as expected.

SRK Consulting Monitor Mine Waste Rock Trial Covers – 2008 Data Summary Page 11
CCS/JM/sdc FaroVangorda_MonitorMineWasteRockTrialCovers_Report_1CY001.020_JM_20090528_FNL.docx, May. 29, 09, May 2009
3 Manually Collected Instrumentation Data 3.1 M-Squared Thermistor Cables (Soil Temperature)
Four thermistor strings each with eight thermistor beads have been installed adjacent to the two strings connected to the Lakewood Systems data logger, in the Grum Overburden Dump. Their installation details are presented in Figure 10. These four thermistor strings are manually read at regular intervals by the site staff and the raw data is reported as resistances. These resistance values are converted to soil temperatures during the post-processing phase. The measured soil temperature profiles for the 2007 season from these four strings are shown in Figures 74 through 77. All thermistor strings performed as expected, although the first set of readings of the 2008 season proved to be erroneous and was discarded.
3.2 Sentek Sensor Technologies Diviner 2000 (Soil Volumetric Moisture Content)
Each trial cover has six to eight vertical PVC access tubes, as illustrated in Figure 5, while the lysimeters have ten access tubes each. A Sentek Senor Technologies Diviner 2000 probe is inserted manually into each of these tubes to record an instantaneous reading of the soil volumetric moisture content profile at 10 cm intervals. Data was collected throughout the 2008 monitoring season from each of the 60 access tubes on a regular schedule. However, for most of the period, daily readings were taken. Data is recorded using a portable data logger, and expresses the results in terms of relative volumetric moisture content. During the post-processing stage, material specific calibration curves are applied. Figures 78 through 135 present the final volumetric moisture content profiles for each access tube. Data collected from these tubes confirm that the instrument performed as expected.
3.3 HOBO Water Level Meters
In an effort to mitigate the difficulty of measuring flow in the beginning and end of each season due to frozen drainage pipes, a series of culverts were installed on CT#2A, CT#2B, and both lysimeters. The culverts consist of a wooden box placed in a gap in the containment berm created by breaching the berm of each of the mentioned covers. The culverts were instrumented with a HOBO water level meter that monitors and samples the pressure every 16 seconds. Changes in recorded pressure will be an indication of water level fluctuations, i.e. flow through the weir. Because of the closed pressure cell of the HOBO instrument, the recorded data has to be reduced by subtracting the atmospheric pressure recorded by the weather stations on site. Due to limited available memory of the HOBO device, the download protocol provided to the site personnel required download every 5 days. Data collected is presented in Figures 136 to 139.
SRK Consulting Monitor Mine Waste Rock Trial Covers – 2008 Data Summary Page 12
CCS/JM/sdc FaroVangorda_MonitorMineWasteRockTrialCovers_Report_1CY001.020_JM_20090528_FNL.docx, May. 29, 09, May 2009
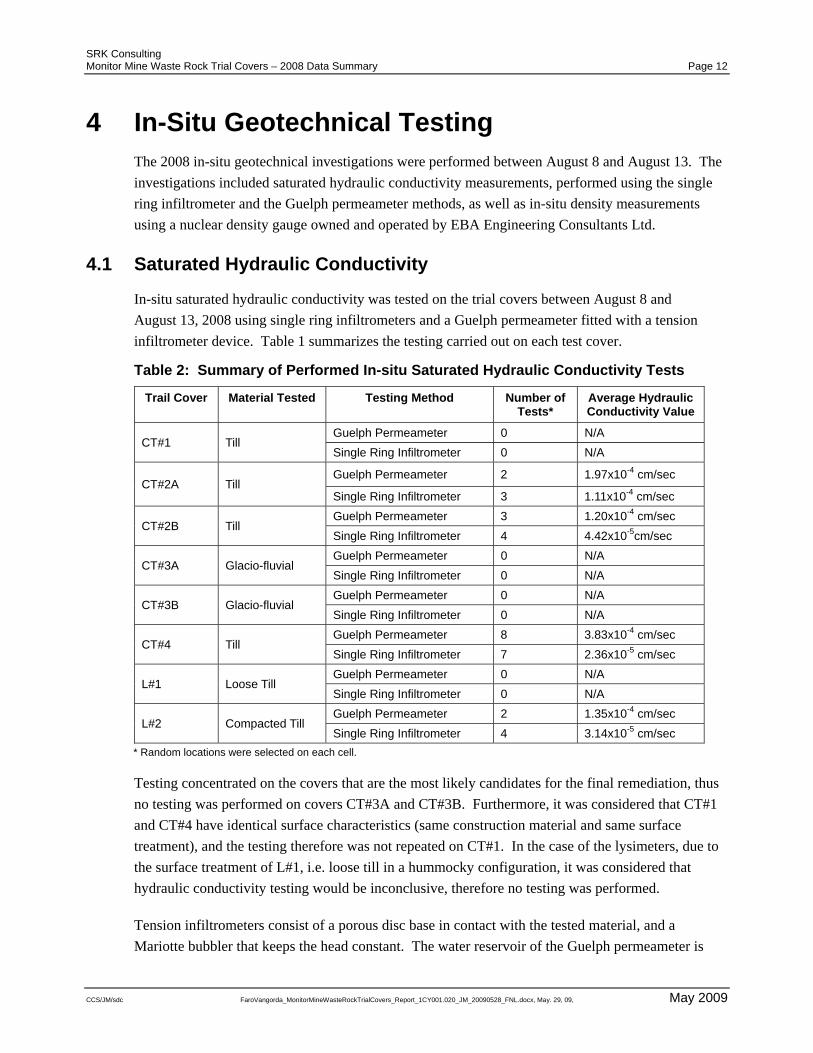
4 In-Situ Geotechnical Testing The 2008 in-situ geotechnical investigations were performed between August 8 and August 13. The investigations included saturated hydraulic conductivity measurements, performed using the single ring infiltrometer and the Guelph permeameter methods, as well as in-situ density measurements using a nuclear density gauge owned and operated by EBA Engineering Consultants Ltd.
4.1 Saturated Hydraulic Conductivity
In-situ saturated hydraulic conductivity was tested on the trial covers between August 8 and August 13, 2008 using single ring infiltrometers and a Guelph permeameter fitted with a tension infiltrometer device. Table 1 summarizes the testing carried out on each test cover.
Table 2: Summary of Performed In-situ Saturated Hydraulic Conductivity Tests
Trail Cover Material Tested Testing Method Number of Tests*
Average Hydraulic Conductivity Value
CT#1 Till Guelph Permeameter 0 N/A Single Ring Infiltrometer 0 N/A
CT#2A Till Guelph Permeameter 2 1.97x10⁻⁴ cm/sec
Single Ring Infiltrometer 3 1.11x10⁻⁴ cm/sec
CT#2B Till Guelph Permeameter 3 1.20x10⁻⁴ cm/sec Single Ring Infiltrometer 4 4.42x10⁻⁵cm/sec
CT#3A Glacio-fluvial Guelph Permeameter 0 N/A Single Ring Infiltrometer 0 N/A
CT#3B Glacio-fluvial Guelph Permeameter 0 N/A Single Ring Infiltrometer 0 N/A
CT#4 Till Guelph Permeameter 8 3.83x10⁻⁴ cm/sec Single Ring Infiltrometer 7 2.36x10⁻⁵ cm/sec
L#1 Loose Till Guelph Permeameter 0 N/A Single Ring Infiltrometer 0 N/A
L#2 Compacted Till Guelph Permeameter 2 1.35x10⁻⁴ cm/sec Single Ring Infiltrometer 4 3.14x10⁻⁵ cm/sec
* Random locations were selected on each cell.
Testing concentrated on the covers that are the most likely candidates for the final remediation, thus no testing was performed on covers CT#3A and CT#3B. Furthermore, it was considered that CT#1 and CT#4 have identical surface characteristics (same construction material and same surface treatment), and the testing therefore was not repeated on CT#1. In the case of the lysimeters, due to the surface treatment of L#1, i.e. loose till in a hummocky configuration, it was considered that hydraulic conductivity testing would be inconclusive, therefore no testing was performed.
Tension infiltrometers consist of a porous disc base in contact with the tested material, and a Mariotte bubbler that keeps the head constant. The water reservoir of the Guelph permeameter is

SRK Consulting Monitor Mine Waste Rock Trial Covers – 2008 Data Summary Page 13
CCS/JM/sdc FaroVangorda_MonitorMineWasteRockTrialCovers_Report_1CY001.020_JM_20090528_FNL.docx, May. 29, 09, May 2009
used as source for replacing the water lost during the test due to suction. The tension infiltrometer device allows the measurement of the saturated hydraulic conductivity without the need of a regular shape hole in the soil to be tested. A smooth and flat (horizontal as much as possible) surface is required instead to ensure a good hydraulic contact between the tension infiltrometer and the soil surface. To enhance the hydraulic contact, fine grained material (fine sand) was used to create a circular base just slightly larger in diameter that the tension infiltrometer disc (215 mm diameter) with thickness in the order of 2 to 3 millimetres.
In cases where the surface of the covers is horizontal (CT#2A, CT#2B, L#2), the tests were performed directly on the surface, while in the case of CT#4 an approximately horizontal pad was created on the inclined surface.
The ring infiltrometer tests were performed using 30 cm sections cut from thick wall pipe (1.3 mm thickness), with the internal diameter of 59 cm. The rings were pushed in the ground to a depth of approximately 7.5 cm using the bucket of the excavator, and then a sealing ring of moist bentonite paste was placed on the outside, at the base of the ring. In the case of the sloped trial covers, a horizontal pad was excavated, and the rings installed as previously described. The measurements were performed as falling head tests, meaning that the rings were filled with water and then left to drain, the draining rate being recorded. To avoid the accumulation of precipitation as well as excessive evaporation, sections of plywood were used to cover the rings.
Summary tables of the Guelph permeameter and ring infiltrometer test results are attached as Appendix B, while complete individual field data calculation sheets can be found in Appendix C.
4.2 In-Situ Density Testing
In-situ density testing was carried out on August 12, 2008, using a nuclear density probe owned and operated by EBA Engineering Consultants Ltd. of Whitehorse, YT. Unlike in the case of hydraulic conductivity testing, the in-situ density was measured on every single cover, as well as on both lysimeters. Table 3 summarizes the test results while field data sheets are attached in Appendix D.
It should be noted that the reference dry density of 2,130 Kg/m3 used to calculate the percentage of standard Proctor compaction reflects the maximum density achievable in laboratory conditions of the glacial till used for the covers, thus it is not representative of the glacio-fluvial material used for the covers on CT#3A and CT#3B. The values of percentage Standard Proctor Compaction could therefore be misleading in the case of the uncompacted glacio-fluvial material and have been excluded from the results summarised in Table 3.

SRK Consulting Monitor Mine Waste Rock Trial Covers – 2008 Data Summary Page 14
CCS/JM/sdc FaroVangorda_MonitorMineWasteRockTrialCovers_Report_1CY001.020_JM_20090528_FNL.docx, May. 29, 09, May 2009
Table 3: Summary of In-Situ Density Tests
Trial Cover Material Tested Number of Tests
Average Moisture
Content (%)
Average Dry Density (kg/m3)
Average Standard Proctor
Compaction (%)
CT#1 Till 18 5.6 2,033 96.4 CT#2A Till 12 5.1 2,141 100.4 CT#2B Till 12 5.3 2,104 98.8 CT#3A Glacio-Fluvial 12 3.0 2,035 N/A CT#3B Glacio-Fluvial 12 2.7 2,015 N/A CT#4 Till 18 7.3 2,071 96.7 L#1 Loose Till 3 5.7 2,067 80.7 L#2 Compacted Till 12 5.3 2,145 100.7
The in-situ density data will be used for relative comparison changes in the soil profile over time, and the absolute values recorded are of less importance. In-situ density testing using a Troxler nuclear density probe alone, although calibrated for the site specific soils, can be fraught with complexities. Therefore, it is recommended that during the 2009 monitoring season suitable backup tests will be carried out, such as sand-cone replacement tests.

SRK Consulting Monitor Mine Waste Rock Trial Covers – 2008 Data Summary Page 15
CCS/JM/sdc FaroVangorda_MonitorMineWasteRockTrialCovers_Report_1CY001.020_JM_20090528_FNL.docx, May. 29, 09, May 2009
5 Action Items This report documents the 2008 season of data collected for the trial covers constructed on the Vangorda waste rock pile. The trial covers were constructed in September 2004, and the instrumentation installation was carried out in June 2005. For the 2008 season, instrumentation was commissioned in May 2008, and shut down on October 3rd 2008. Data collection and instrumentation performance was good, and the partial loss of data experienced for some of the instruments will not significantly affect the overall quality of information. The following is a list of recommendations that should be implemented to ensure that the 2009 monitoring is successful:
• All instrumentation should be re-commissioned in May 2009.
• An updated download protocol will be provided to site personnel at the beginning of the new monitoring season, and site staff will be retrained on the download protocol.
• Install new battery packs for both Davis Instruments weather stations.
• Install new battery pack for the Lakewood datalogger on Grum dump (automated thermistors).
• Install an additional solar panel to support the CR1000 data logger battery.
• Replace the damaged wind cups of the Davis weather station.
• The desiccant packs in each data logger weather enclosure must be replaced every two weeks. The removed desiccant packs must be dried out in the laboratory oven as per the manufacturer’s instructions.
• Install sand trap or filter on all drainage pipes connected to the lysimeters upstream of the SeaMetrics flow meters.
• Water from each Diviner and EnviroScan access tube should be bailed out prior to commencing the 2009 monitoring season.
• The weir design of the HOBO water level monitors will have to be improved to increase accuracy of collected data. The improved design should be developed and implemented ideally before the spring freshet.
• SRK will not only perform basic quality control checks on the raw data received every two weeks, but will post-process the data at that time as well, in order to ensure minimal data loss.
• SRK will evaluate insulation options for the drainage pipes in the monitoring hut during the transition season from October to November.
• Another round of in-situ density and hydraulic conductivity testing should be carried out on the trial covers in July/August 2009. The 2009 hydraulic conductivity testing program should focus on CT#1, CT#3A and CT#3B, while density testing using the sand cone replacement method should be carried out on all test covers.
• A Standard Protocol Density should be completed on the Glacio-fluvial cover material to facilitate interpretation of the in-situ density testing.


SRK Consulting Monitor Mine Waste Rock Trial Covers – 2008 Data Summary Page 17
CCS/JM/sdc FaroVangorda_MonitorMineWasteRockTrialCovers_Report_1CY001.020_JM_20090528_FNL.docx, May. 29, 09, May 2009
6 References Janowicz, J.R., Hedstrom, N.R., Granger, R.J. (2005). Investigation of Anvil Range Mining Corporation (Faro) Waste Dump Water Balances – 2003/04 Water Year – Preliminary Water Balance. Report prepared for SRK Consulting Inc. on behalf of Deloitte & Touche Inc., March.
Janowicz, J.R., Hedstrom, N.R., Granger, R.J. (2006). Investigation of Anvil Range Mining Corporation (Faro) Waste Dump Water Balance – Final Water Balance – Draft. Report prepared for SRK Consulting Inc. on behalf of Deloitte & Touche Inc., May.
Janowicz, J.R., Hedstrom, N.R., Granger, R.J. (2007). Investigation of Anvil Range Mining Corporation (Faro) Waste Dump Water Balance – Vangorda Trial Covers Water balance. Report prepared for SRK Consulting Inc. on behalf of Deloitte & Touche Inc., December.
Janowicz, J.R., Hedstrom, N.R., Granger, R.J. (2008). Investigation of Anvil Range Mining Corporation (Faro) Waste Dump Water Balance – Vangorda Trial Covers Water balance. Report prepared for SRK Consulting Inc. on behalf of Deloitte & Touche Inc., September 2008.
SRK Consulting (Canada) Inc. (2006a). Anvil Range Mining Complex Mine Waste Rock Trial Covers As-Built Report, Faro, Yukon, Canada. Consultants report submitted to Deloitte & Touche Inc. on behalf of the Faro Mine Closure Planning Office, Project No. 1CD003.051, Authored by M. Rykaart, April 2006.
SRK Consulting (Canada) Inc. (2006b). Anvil Range Mining Complex Monitor Mine Waste Rock Trial Covers: 2005 Data Summary, 2005/2006 Task 20a, Faro, Yukon, Canada. Consultants report submitted to Deloitte & Touche Inc. on behalf of the Faro Mine Closure Planning Office, Project No. 1CD003.051, April 2006.
SRK Consulting (Canada) Inc. (2007). Anvil Range Mining Complex Monitor Mine Waste Rock Trial Covers: 2006 Data Summary, 2006/2007 – task 17a, Faro, Yukon, Canada. Consultants report submitted to Deloitte & Touche Inc. on behalf of the Faro Mine Closure Planning Office, Project No. 1CD003.086, July 2007.
SRK Consulting (Canada) Inc. (2008a). Anvil Range Mining Complex Monitor Mine Waste Rock Trial Covers: 2007 Data Summary, 2007/08 – task 18a, Faro, Yukon, Canada. Consultants report submitted to Deloitte & Touche Inc. on behalf of the Faro Mine Closure Planning Office, Project No. 1CD003.093, July 2007.
SRK Consulting (Canada) Inc. (2008b). Faro Mine Complex Vangorda Lysimeter As-built Report, 2007/08 – task 30, Faro, Yukon, Canada. Consultants report submitted to Deloitte & Touche Inc. on behalf of the Faro Mine Closure Planning Office, Project No. 1CD003.095, Authored by J. Miskolczi, November 2008.

Figures


CT #1
CT #2A & 2B
CT #3A & 3B
L #1 L #2
Monitoring Hut(CR1000)
CT #1CT #4
Re-sloped waste rock
1994 Till cover
Monitoring Hut(CR 10X #1, CR10X #2)
Monitor Mine Waste Rock Covers2008 Data Summary
Filename:
Job No:Figure: 2Date: Approved:
VANCOUVER Aerial view of trial cover layout
JMFeb. 2009
1CY001.020.001Faro Mine Complex
2008 Data Summary
Fig2_4-9_Trial covers_20090227.ppt

Legend:
Multiplexer#
J:\01_SITES\FARO\1125_1CY001.020 (Prev015)_Project Description Engineering\110_Task0001_Monitor Mine Area Cover Trials\06_Prelim Trial Cover Report\Report\Figures\Trial covers and profiles.ppt
Multiplexer
Campbell Scientific Datalogger
Satellite Station3(1.5m)
#
#
1
CT#2A CT#2B
Weather Station
EnviroSCAN Probe #(#m rail) & Communication Wire
CS229 Thermal Conductivity Sensor (# sensors in profile)& L d i
3
2(1.0m)x4x4
1(2.5m)
x4
4L#1
7(2.0m)8(2.0m) x4x4L#2
& Lead wires
Multiplexer Communication Wire
4
3
2 3
6(2.5m)
1(2.5m)
5(2.0m)4(1.5m)x6
x3 x4 x4
CT#4 CT#3A CT#3B CT#1
1 2
Monitor Mine Waste Rock Covers2008 Data Summary
Filename:
Job No:Figure: 4Date: Approved:
VANCOUVER
JM
1CY001.020.001
Schematic trial cover and lysimeter layout showing automated soil suction, moisture
instrumentation, datalogger as well as weather and satellite station locations
Feb. 2009Faro Mine Complex
2008 Data Summary
Fig2_4-9_Trial covers_20090227.ppt

Legend:
#
J:\01_SITES\FARO\1125_1CY001.020 (Prev015)_Project Description Engineering\110_Task0001_Monitor Mine Area Cover Trials\06_Prelim Trial Cover Report\Report\Figures\Trial covers and profiles.ppt
L#1 L#2
44
41 48
54
51 58
10
11
12
13
9
16
17
18
19
15Diviner 2000 Stations
Campbell Scientific Datalogger
#
#
42
43
45
48
49
46
47
50
52
53
55
59
56
57
60
CT#2A CT#2B14 20
33
SeaMetrics Flowmeter & Conveyance Pipe plus Tipping
Bucket (Runoff)
SeaMetrics Flowmeter & Conveyance Pipe plus Tipping
Bucket (Interflow)
SeaMetrics Flowmeter & Conveyance Pipe plus Tipping
#
#
3 #
1
2
322
21
28
29
27
34
35
36
37
Bucket (Infiltration)L#1C
L#2
L#2C
L#2P
L#1
L#2P
CT#1
4
5
6
7
8
CT#3A CT#3B
23
24
25
26
30
31
32
CT#4
38
39
40
1 2
2A 1 342A
2B
1
3A
3B
4
3A
3B
Monitor Mine Waste Rock Covers2008 Data Summary
Filename:
Job No:Figure: 5Date: Approved:
VANCOUVER
JM
1CY001.020.001
Schematic trial cover and lysimeter layout showing Diviner 2000 stations, surface runoff,
and interflow measurement locations
Feb. 2009Faro Mine Complex
2008 Data Summary
Fig2_4-9_Trial covers_20090227.ppt

1-1 1.66m
DL75: 0506051CR10X #1 Array 103
J:\01_SITES\FARO\1125_1CY001.020 (Prev015)_Project Description Engineering\110_Task0001_Monitor Mine Area Cover Trials\06_Prelim Trial Cover Report\Report\Figures\Trial covers and profiles.ppt
CT#1 Legend:
EnviroSCAN Probe, s/n and depth
CS229 Thermal Conductivity Sensor, s/n andd th
#-# #.##m
x # #.##m
1491 1.61m
1492 1.24m
1-4 0.91m
1-3 1.19m
1-2 1.47m
1-5 0.63m
SS#1 1.70mSS#2 1.60m
T#2T#1
depth
Satellite Station Soil Temperature probe anddepth
Satellite Station Soil Moisture probe anddepth
T## #.##m
SS## #.##m
1493 0.30m
1494 -0.08m
UNCOMPACTED TILL1-6 0.25m
1-7 -0.12m
1 8 0 0
1.80m
Datum
CT#4
depth
Seametrics Datalogger with Flowmeter andTipping Bucket (Interflow)
Seametrics Datalogger with Flowmeter(Runoff)
DL75: #CR10X #2 Array #
DL75: #
WASTE ROCK
1-8 -0.50m
DL75: 0506058CR10X #1 Array 1036-1 2.15m
Note:Depths measured from Datum- Positive = up- Negative = down
UNCOMPACTED TILL6-4 1.40m6-3 1.68m6-2 1.96m
6-6 0.84m
6-5 1.12m
6-7 0.65m
1518 1.92m
1520 1.08m
1521 0 71m
1519 1.46m
COMPACTED TILL
1.79m6-8 0.56m
6-9 0.46m6-10 0.37m
6-11 0.27m
6-12 -0.01m
1521 0.71m
1522 0.33m
0.50m
DL75: 02051713CR10X #1 Array 103
WASTE ROCK6-13 -0.10m 1523 -0.04m
Datum
Monitor Mine Waste Rock Covers2008 Data Summary
Filename:
Job No:Figure: 6Date: Approved:
VANCOUVER Schematic Instrument Profiles for CT#1 and CT#4
JM
1CY001.020.001
Feb. 2009Faro Mine Complex
2008 Data Summary
Fig2_4-9_Trial covers_20090227.ppt

Legend:DL75: 0506052CR10X #1 Array 103
J:\01_SITES\FARO\1125_1CY001.020 (Prev015)_Project Description Engineering\110_Task0001_Monitor Mine Area Cover Trials\06_Prelim Trial Cover Report\Report\Figures\Trial covers and profiles.ppt
EnviroSCAN Probe with bead s/n and depth
CS229 Thermal Conductivity Sensor bead s/n and depth
S t llit St ti T t b d
#-# #.##m
x # #.##m
T## # ##x
x 1502 0.91m
1504 0.54m
3-1 1.06m
3-3 0.66m
3-2 0.86m
1.11m
SS#1SS#2 T#2 0.91m
T#1 1.01m
Satellite Station Temperature probe anddepth
Satellite Station Soil Moisture probe and depth
Seametrics Datalogger with Flowmeter and
T## #.##m
SS## #.##m
DL75: #
x 1505 0.20m
UNCOMPACTED TILL3-4 0.46m
3-6 0.06m
3-5 0.16m
DatumSeametrics Datalogger with Flowmeter and Tipping Bucket (Interflow)
Seametrics Datalogger with Flowmeter (Runoff)
Note:
DL75: #CR10X #2 Array #
DL75: #
x 1506 -0.20m
WASTE ROCK
3-7 -0.14m
3-8 -0.34m
CT#2ADepths measured from Datum- Positive = up- Negative = down
x 1507 0 55m
2-1 0.70m
2-2 0.60m
DL75: 0506053CR10X #1 Array 103
x
x
1507 0.55m
1508 0.20m
UNCOMPACTED TILL2-4 0.30m
2-3 0.50m
2-6 0.00m
2-5 0.20m
0.75m
Datum
x 1509 -0.20m
WASTE ROCK2-7 -0.20m
CT#2B
Monitor Mine Waste Rock Covers2008 Data Summary
Filename:
Job No:Figure: 7Date: Approved:
VANCOUVER
JMFeb. 2009
1CY001.020.001
Schematic Instrument Profiles forCT#2A and CT#2B
Faro Mine Complex
2008 Data Summary
Fig2_4-9_Trial covers_20090227.ppt

Legend:
EnviroSCAN Probe with bead s/n and depth# # # ##m5-1 1.45m
5 2 1 27
DL75: 0506056CR10X #1 Array 103
J:\01_SITES\FARO\1125_1CY001.020 (Prev015)_Project Description Engineering\110_Task0001_Monitor Mine Area Cover Trials\06_Prelim Trial Cover Report\Report\Figures\Trial covers and profiles.ppt
EnviroSCAN Probe with bead s/n and depth
CS229 Thermal Conductivity Sensor bead s/n and depth
Satellite Station Temperature probe and
#-# #.##m
x # #.##m
T## #.##m
CT#3A 1495 1.36m
5-4 1.08m5-3 1.17m5-2 1.27m
5-6 0.80m
5-5 0.89m
5-7 0.70m
0.45m
GLACIOFLUVIAL MATERIAL
1496 0.89m
DL: 02051709 p pdepth
Satellite Station Soil Moisture probe and depth
Seametrics Datalogger with Flowmeter and Ti i B k t (I t fl )
SS## #.##m
DL75: #CR10X #2 Array #
1497 0.33m
1498 -0.05m
UNCOMPACTED TILL
5-8 0.52m
1.05m
5-9 0.33m
5-10 0.14m
5-11 -0.05m
5-12 -0.23m
DL: 02051709CR10X #1 Array 103
Tipping Bucket (Interflow)
Seametrics Datalogger with Flowmeter (Runoff)
Note:Depths measured from Datum
CR10X #2 Array #
DL75: #
CT#3B
WASTE ROCK
5 12 0.23mDatum
DL75: 0506054C # Depths measured from Datum
- Positive = up- Negative = down
1500 0.82m
4-1 1.05m
4-4 0.77m4-3 0.87m4-2 0.96m
4-6 0.58m4-5 0.68m
4-7 0 49m0.50mGLACIOFLUVIAL MATERIAL
CR10X #1 Array 103
1501 0.44m
1503 -0.12m
UNCOMPACTED TILL
4 7 0.49m4-8 0.40m
0.60m
4-9 0.30m4-10 0.12m
4-11 -0.08m
4-12 -0.26m
DL: 02051710CR10X #1 Array 103
D t
WASTE ROCK
Datum
Monitor Mine Waste Rock Covers2008 Data Summary
Filename:
Job No:Figure: 8Date: Approved:
VANCOUVER
JM
1CY001.020.001
Schematic Instrument Profiles for CT#3A and CT#3B
Feb. 2009Faro Mine Complex
2008 Data Summary
Fig2_4-9_Trial covers_20090227.ppt
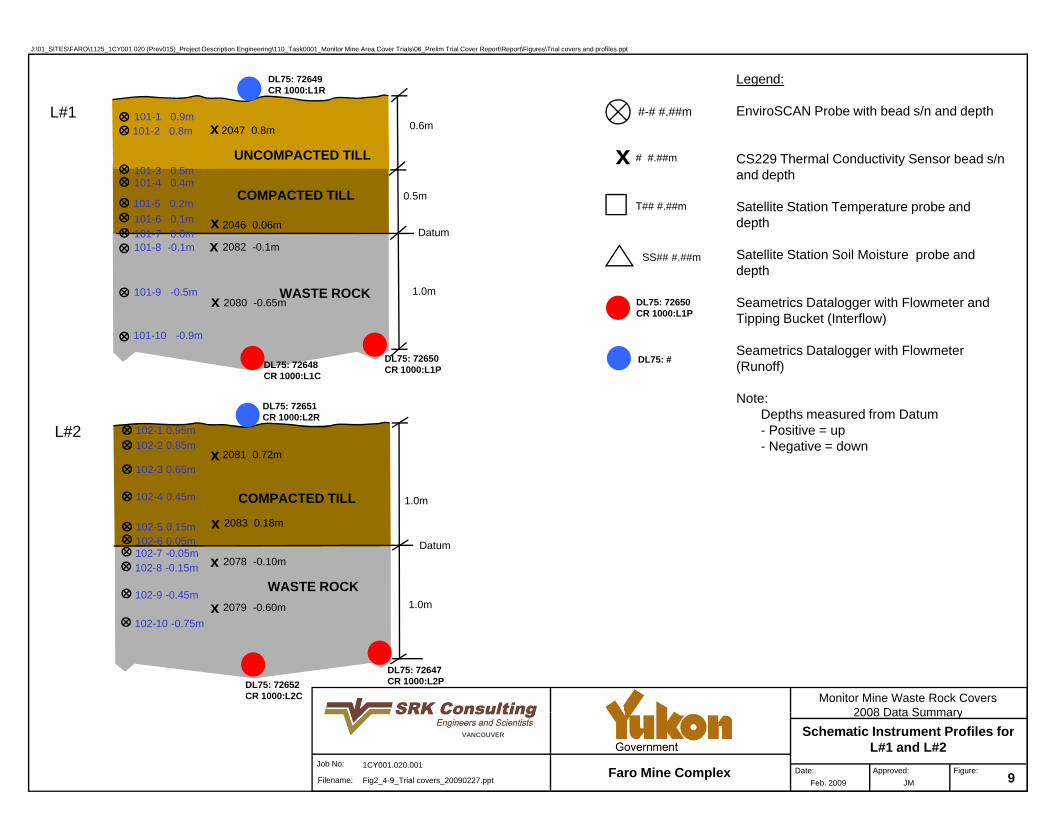
Legend:DL75: 72649CR 1000:L1R
J:\01_SITES\FARO\1125_1CY001.020 (Prev015)_Project Description Engineering\110_Task0001_Monitor Mine Area Cover Trials\06_Prelim Trial Cover Report\Report\Figures\Trial covers and profiles.ppt
EnviroSCAN Probe with bead s/n and depth
CS229 Thermal Conductivity Sensor bead s/n and depth
S t llit St ti T t b d
#-# #.##m
x # #.##m
T## # ##
x 2047 0.8m
UNCOMPACTED TILL
101-1 0.9m101-2 0.8m
0.5m
101-3 0.5m
0.6m
101-4 0.4m
101 5 0 2m
L#1
COMPACTED TILLSatellite Station Temperature probe anddepth
Satellite Station Soil Moisture probe and depth
Seametrics Datalogger with Flowmeter and
T## #.##m
SS## #.##m
x
x
x2046 0.06m
2082 -0.1m
2080 -0.65mWASTE ROCK
Datum
1.0mDL75: 72650
101-5 0.2m101-6 0.1m101-7 0.0m101-8 -0.1m
101-9 -0.5mSeametrics Datalogger with Flowmeter and Tipping Bucket (Interflow)
Seametrics Datalogger with Flowmeter (Runoff)
Note:
DL75: #
x 2080 0.65m
DL75: 72650CR 1000:L1PDL75: 72648
CR 1000:L1C
DL75: 72651
DL75: 72650CR 1000:L1P
101-10 -0.9m
Depths measured from Datum- Positive = up- Negative = downx 2081 0.72m
COMPACTED TILL
102-1 0.95m
102-4 0.45m
102-3 0.65m
102-2 0.85m
1.0m
DL75: 72651CR 1000:L2R
L#2
x
x 2083 0.18m
2079 -0.60m
WASTE ROCK
102-6 0.05m102-5 0.15m
102-7 -0.05mDatum
1.0m
102-8 -0.15m
102-9 -0.45m
x 2078 -0.10m
x 2079 0.60m
Monitor Mine Waste Rock Covers2008 Data Summary
DL75: 72647CR 1000:L2PDL75: 72652
CR 1000:L2C
102-10 -0.75m
Filename:
Job No:Figure: 9Date: Approved:
VANCOUVER
JMFeb. 2009
1CY001.020.001
Schematic Instrument Profiles forL#1 and L#2
Faro Mine Complex
2008 Data Summary
Fig2_4-9_Trial covers_20090227.ppt


Figure 11: Total hourly rainfall on CT#1 & CT#2A, 2B recorded by the Davis Instruments Vantage Pro Weather Stations.
Figure 12: Mean hourly air temperature on CT#1 & CT#2A, 2B recorded by the Davis Instruments Vantage Pro Weather Stations and Satellite Stations.

Figure 13: Mean hourly relative humidity on CT#1 & CT#2A, 2B recorded by the Davis Instruments Vantage Pro Weather Stations and Satellite Stations.
Figure 14: Mean hourly solar radiation on CT#1 & CT2A, 2B recorded by the Davis Instruments Vantage Pro Weather Stations.

Figure 15: Mean hourly barometric pressure on CT#1 & CT#2A, 2B recorded by the Davis Instruments Vantage Pro Weather Stations.
Figure 16: Mean hourly wind speed on CT#1 & CT#2A, 2B recorded by the Davis Instruments Vantage Pro Weather Stations.
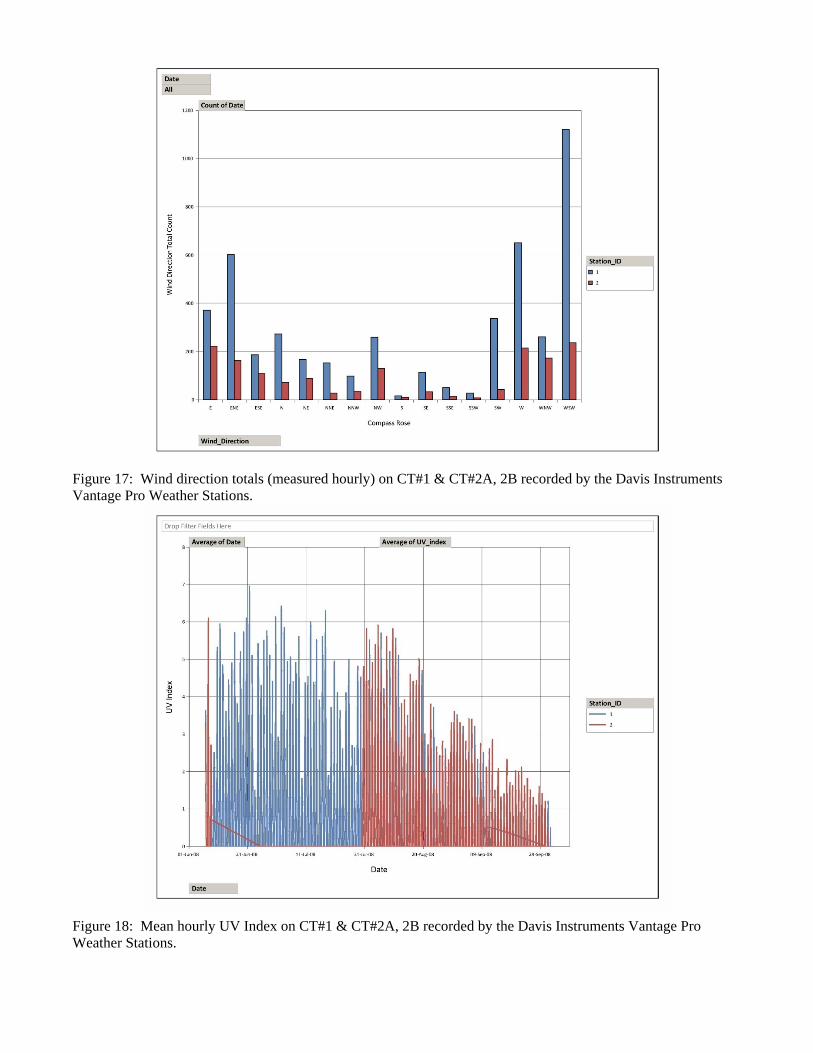
Figure 17: Wind direction totals (measured hourly) on CT#1 & CT#2A, 2B recorded by the Davis Instruments Vantage Pro Weather Stations.
Figure 18: Mean hourly UV Index on CT#1 & CT#2A, 2B recorded by the Davis Instruments Vantage Pro Weather Stations.

Figure 19: Mean hourly Matric Suction in CT#1 recorded by the Davis Instruments Vantage Pro Satellite Station.
Figure 20: Mean hourly soil temperature in CT#1 recorded by the Davis Instruments Vantage Pro Satellite Station.

Figure 21: Mean hourly Matric Suction in CT#2A recorded by the Davis Instruments Vantage Pro Satellite Station.
Figure 22: Mean hourly soil temperature in CT#2A recorded by the Davis Instruments Vantage Pro Satellite Station.

Figure 23: Daily battery voltage of the Campbell Scientific CR10X #1 Data Logger (Array 102).
Figure 24: Soil matric suction measurements (taken every six hours) in CT#1 recorded by CS229 sensors connected to Campbell Scientific Data logger CR10X #2 (Array 168).
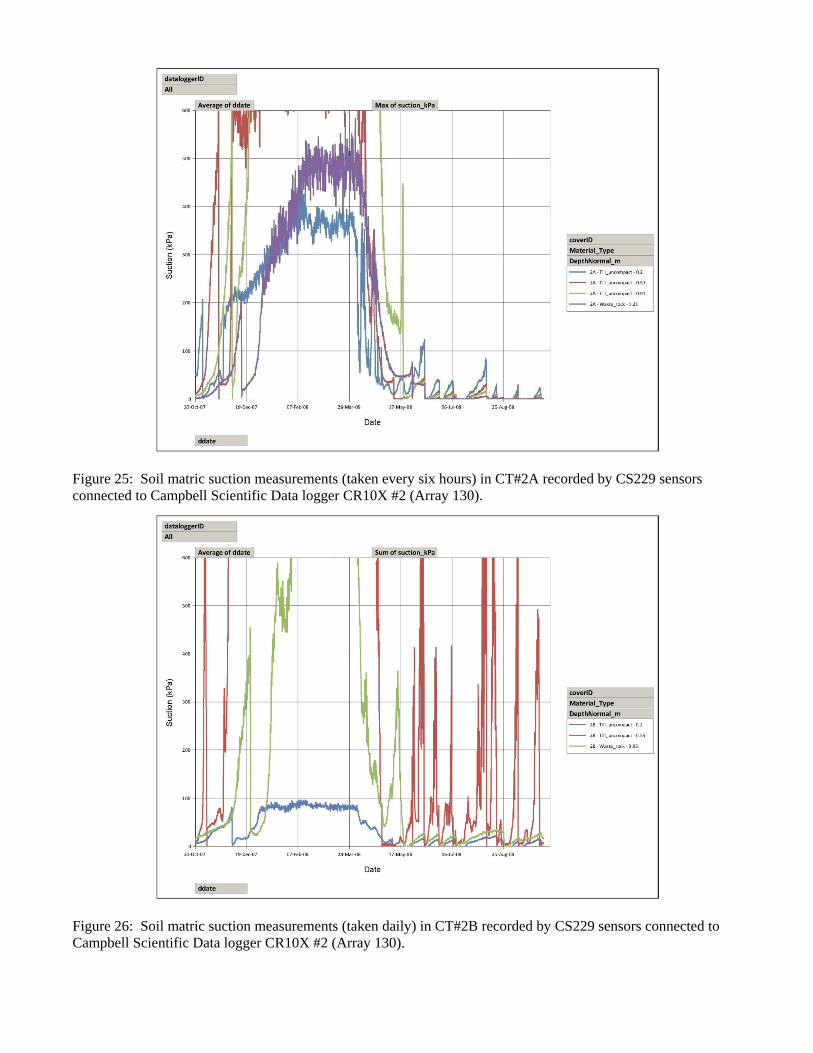
Figure 25: Soil matric suction measurements (taken every six hours) in CT#2A recorded by CS229 sensors connected to Campbell Scientific Data logger CR10X #2 (Array 130).
Figure 26: Soil matric suction measurements (taken daily) in CT#2B recorded by CS229 sensors connected to Campbell Scientific Data logger CR10X #2 (Array 130).

Figure 27: Soil matric suction measurements (taken every six hours) in CT#3A recorded by CS229 sensors connected to Campbell Scientific Data logger CR10X #2 (Array 168).
Figure 28: Soil matric suction measurements (taken every six hours) in CT#3B recorded by CS229 sensors connected to Campbell Scientific Data logger CR10X #2 (Array 168).

Figure 29: Soil matric suction measurements (taken every six hours) in CT#4 recorded by CS229 sensors connected to Campbell Scientific Data logger CR10X #2 (Array 168).
Figure 30: Soil matric suction measurements (taken every six hours) in L#1 recorded by CS229 sensors connected to Campbell Scientific Data logger CR1000.

Figure 31: Soil matric suction measurements (taken every six hours) in L#2 recorded by CS229 sensors connected to Campbell Scientific Data logger CR1000.
Figure 32: Soil temperature measurements (taken every six hours) in CT#1 recorded by CS229 sensors connected to Campbell Scientific Data logger CR10X #2 (Array 168).

Figure 33: Soil temperature measurements (taken every six hours) in CT#2A recorded by CS229 sensors connected to Campbell Scientific Data logger CR10X #1 (Array 130).
Figure 34: Soil temperature measurements (taken every six hours) in CT#2B recorded by CS229 sensors connected to Campbell Scientific Data logger CR10X #1 (Array 130).

Figure 35: Soil temperature measurements (taken every six hours) in CT#3A recorded by CS229 sensors connected to Campbell Scientific Data logger CR10X #2 (Array 168).
Figure 36: Soil temperature measurements (taken every six hours) in CT#3B recorded by CS229 sensors connected to Campbell Scientific Data logger CR10X #2 (Array 168).

Figure 37: Soil temperature measurements (taken every six hours) in CT#4 recorded by CS229 sensors connected to Campbell Scientific Data logger CR10X #2 (Array 168).
Figure 38: Soil temperature measurements (taken every six hours) in L#1 recorded by CS229 sensors connected to Campbell Scientific Data logger CR1000.

Figure 39: Soil temperature measurements (taken every six hours) in L#2 recorded by CS229 sensors connected to Campbell Scientific Data logger CR1000.
Figure 40: Volumetric moisture content measurements (taken every six hours) in CT#1 recorded by EnviroSCAN sensors connected to Campbell Scientific Data logger CR10X #2 (Array 168).
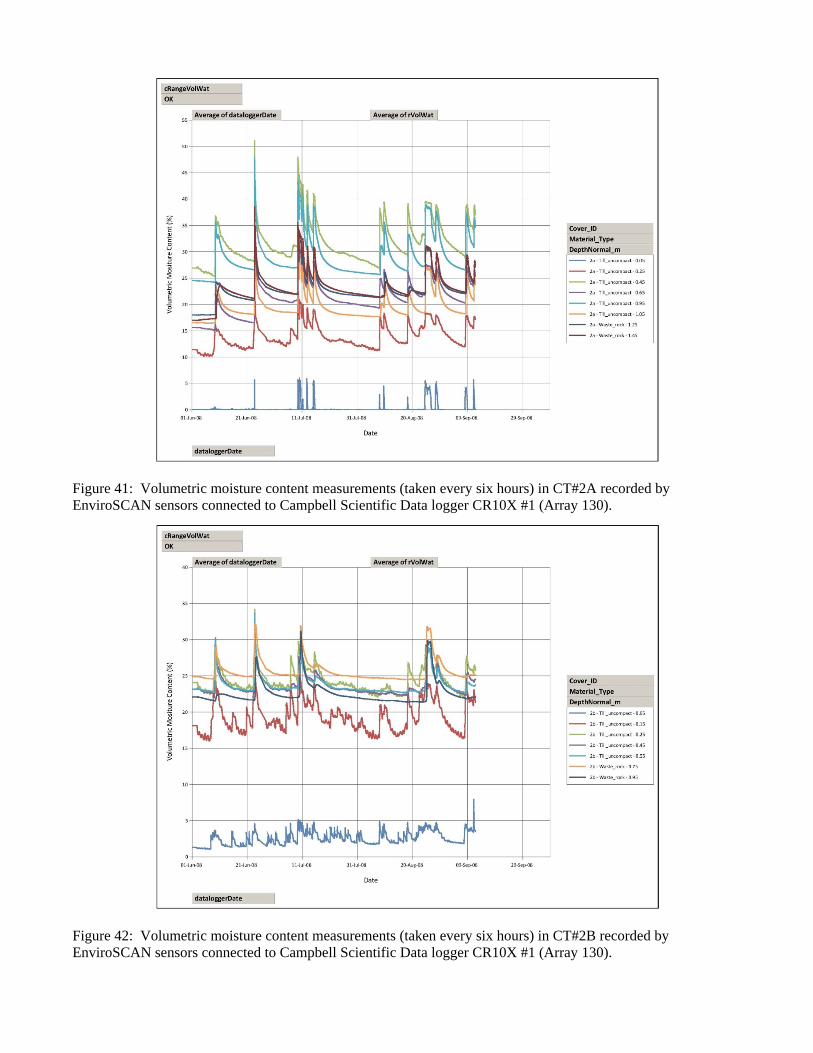
Figure 41: Volumetric moisture content measurements (taken every six hours) in CT#2A recorded by EnviroSCAN sensors connected to Campbell Scientific Data logger CR10X #1 (Array 130).
Figure 42: Volumetric moisture content measurements (taken every six hours) in CT#2B recorded by EnviroSCAN sensors connected to Campbell Scientific Data logger CR10X #1 (Array 130).

Figure 43: Volumetric moisture content measurements (taken every six hours) in CT#3A recorded by EnviroSCAN sensors connected to Campbell Scientific Data logger CR10X #2 (Array 168).
Figure 44: Volumetric moisture content measurements (taken every six hours) in CT#3B recorded by EnviroSCAN sensors connected to Campbell Scientific Data logger CR10X #2 (Array 168).

Figure 45: Volumetric moisture content measurements (taken every six hours) in CT#4 recorded by EnviroSCAN sensors connected to Campbell Scientific Data logger CR10X #2 (Array 168).
Figure 46: Volumetric moisture content measurements (taken every six hours) in L#1 recorded by EnviroSCAN sensors connected to Campbell Scientific Data logger CR1000.
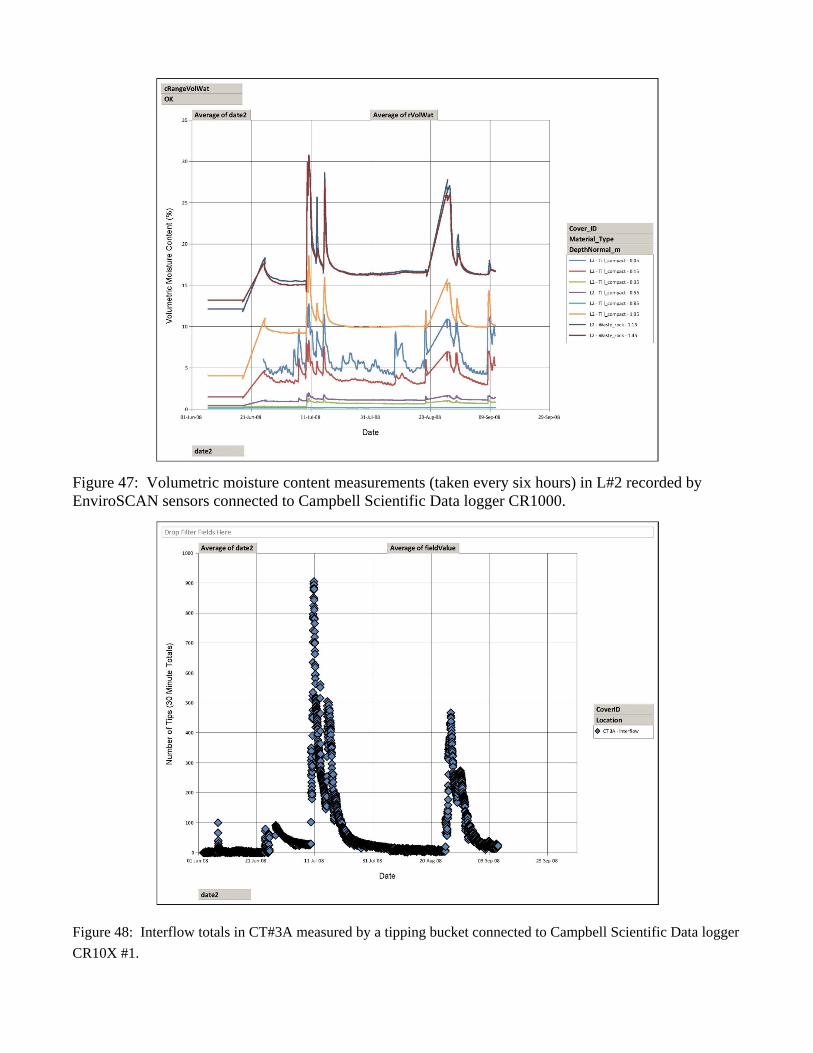
Figure 47: Volumetric moisture content measurements (taken every six hours) in L#2 recorded by EnviroSCAN sensors connected to Campbell Scientific Data logger CR1000.
Figure 48: Interflow totals in CT#3A measured by a tipping bucket connected to Campbell Scientific Data logger CR10X #1.

Figure 49: Interflow totals in CT#3B measured by a tipping bucket connected to Campbell Scientific Data logger CR10X #2 (Array 111).
Figure 50: Interflow totals in CT#4 measured by a tipping bucket connected to Campbell Scientific Data logger CR10X #2 (Array 111).

Figure 51: Surface flow totals in CT#2A measured by a tipping bucket connected to Campbell Scientific Data logger CR10X #2 (Array 111).
Figure 52: Surface flow totals in CT#2B measured by a tipping bucket connected to Campbell Scientific Data logger CR10X #2 (Array 111).

Figure 53: Surface flow totals in CT#3A measured by a tipping bucket connected to Campbell Scientific Data logger CR10X #2 (Array 111).
Figure 54: Surface flow totals in CT#3B measured by a tipping bucket connected to Campbell Scientific Data logger CR10X #2 (Array 111).

Figure 55: Surface flow totals in CT#4 measured by a tipping bucket connected to Campbell Scientific Data logger CR10X #2 (Array 111).
Figure 56: Peripheral interflow totals in L#1 measured by a tipping bucket connected to Campbell Scientific Data logger CR1000.

Figure 57: Central interflow totals in L#1 measured by a tipping bucket connected to Campbell Scientific Data logger CR1000.
Figure 58: Surface flow totals in L#1 measured by a tipping bucket connected to Campbell Scientific CR1000 Data logger.

Figure 59: Peripheral interflow totals in L#2 measured by a tipping bucket connected to Campbell Scientific Data logger CR1000.
Figure 60: Central interflow totals in L#2 measured by a tipping bucket connected to Campbell Scientific Data logger CR1000.

Figure 61: Surface flow totals in L#2 measured by a tipping bucket connected to Campbell Scientific Data logger CR1000.

Figure 62: Surface runoff (measured every minute) on CT#1 by a Seametrics flowmeter connected to a Seametrics DL75 Data logger (File 0506051).
Figure 63: Surface runoff (measured every minute) on CT#2A by a Seametrics flowmeter connected to a Seametrics DL75 Data logger (File 0506052).

Figure 64: Surface runoff (measured every minute) on CT#2B by a Seametrics flowmeter connected to a Seametrics DL75 Data logger (File 0506053).
Figure 65: Surface runoff (measured every minute) on CT#3A by a Seametrics flowmeter connected to a Seametrics DL75 Data logger (File 0506054).
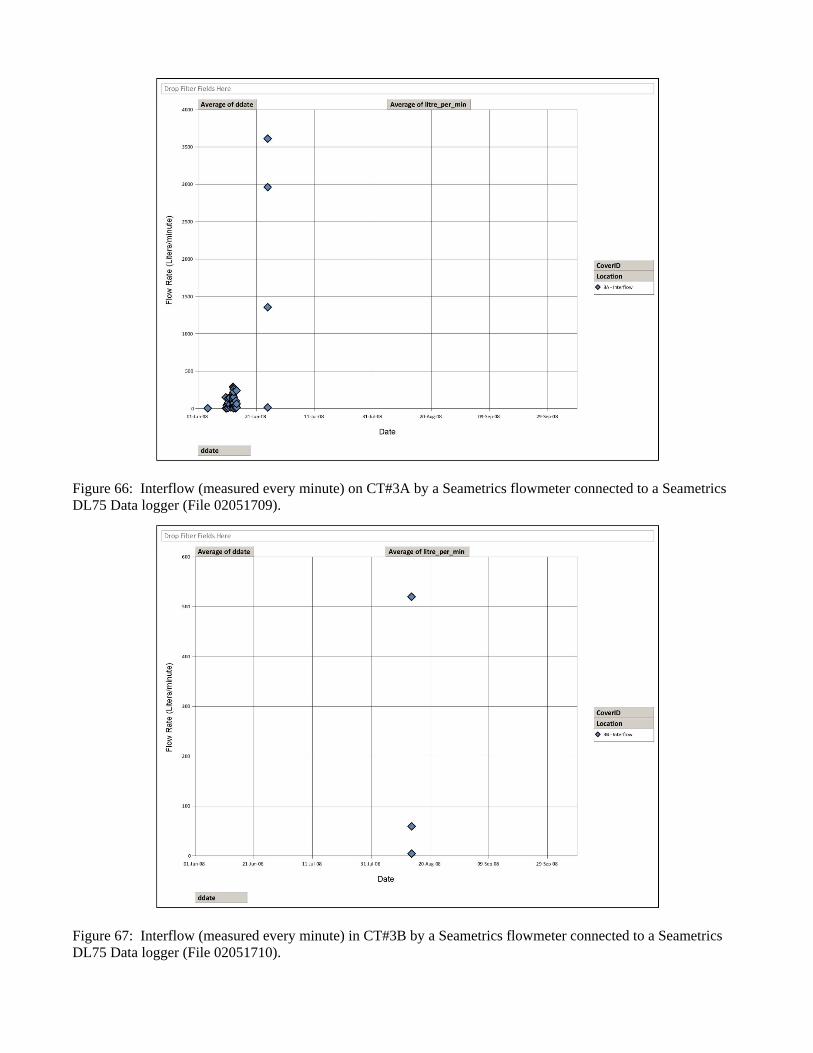
Figure 66: Interflow (measured every minute) on CT#3A by a Seametrics flowmeter connected to a Seametrics DL75 Data logger (File 02051709).
Figure 67: Interflow (measured every minute) in CT#3B by a Seametrics flowmeter connected to a Seametrics DL75 Data logger (File 02051710).

Figure 68: Surface runoff (measured every minute) on CT#3B by a Seametrics flowmeter connected to a Seametrics DL75 Data logger (File 0506054).
Figure 69: Surface runoff (measured every minute) on CT#4 by a Seametrics flowmeter connected to a Seametrics DL75 Data logger (File 0506058).

Figure 70: Surface runoff (measured every minute) on L#1 by a Seametrics flowmeter connected to a Seametrics DL75 Data logger (File 72649).
Figure 71: Surface runoff (measured every minute) in L#2 by a Seametrics flowmeter connected to a Seametrics DL75 Data logger (File 72651).
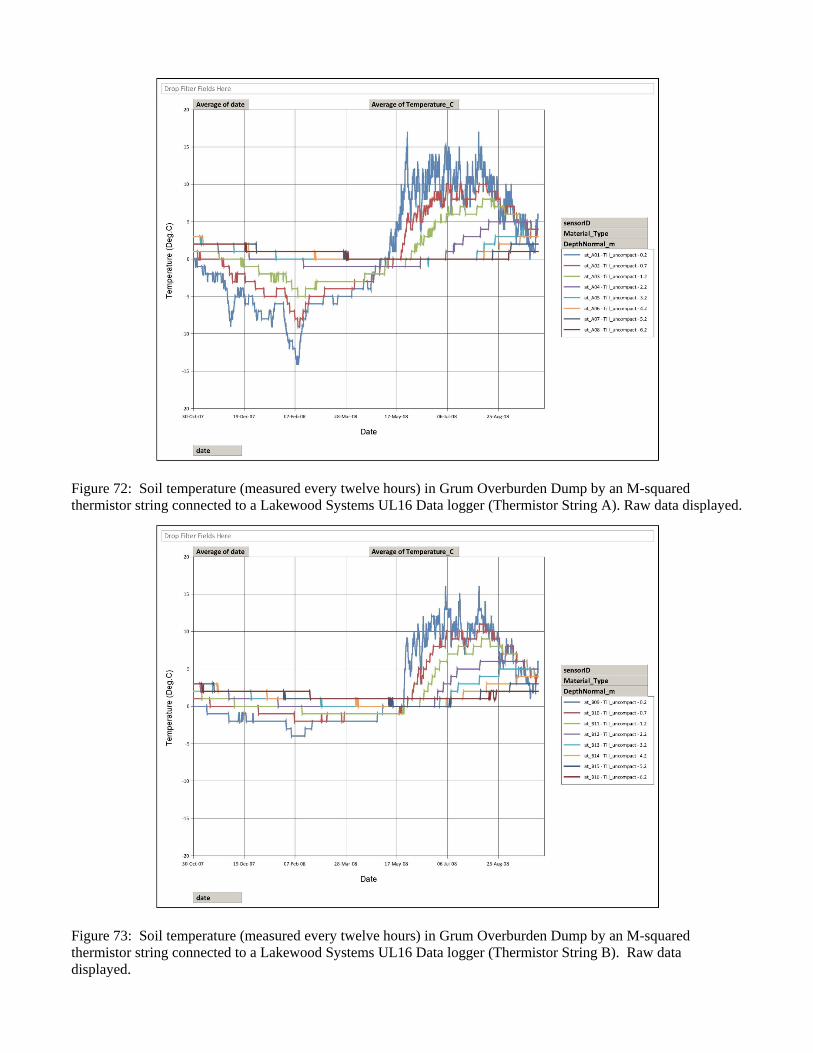
Figure 72: Soil temperature (measured every twelve hours) in Grum Overburden Dump by an M-squared thermistor string connected to a Lakewood Systems UL16 Data logger (Thermistor String A). Raw data displayed.
Figure 73: Soil temperature (measured every twelve hours) in Grum Overburden Dump by an M-squared thermistor string connected to a Lakewood Systems UL16 Data logger (Thermistor String B). Raw data displayed.
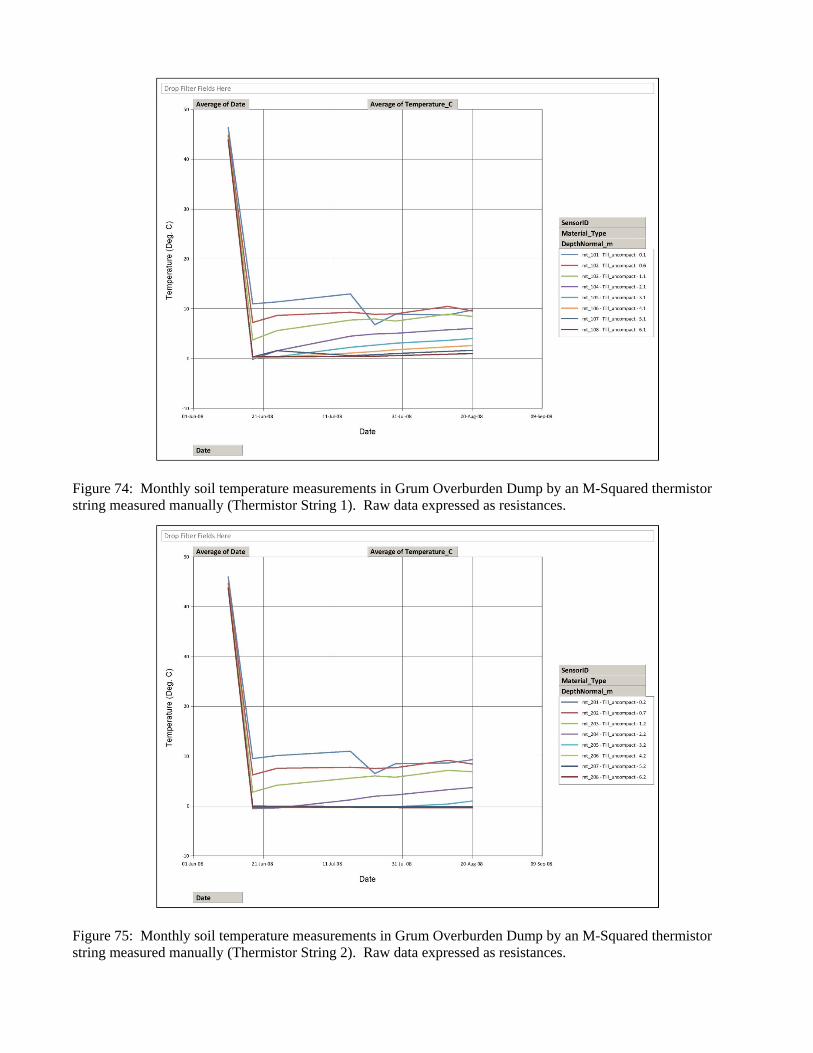
Figure 74: Monthly soil temperature measurements in Grum Overburden Dump by an M-Squared thermistor string measured manually (Thermistor String 1). Raw data expressed as resistances.
Figure 75: Monthly soil temperature measurements in Grum Overburden Dump by an M-Squared thermistor string measured manually (Thermistor String 2). Raw data expressed as resistances.

Figure 76: Monthly soil temperature measurements in Grum Overburden Dump by an M-Squared thermistor string measured manually (Thermistor String 3). Raw data expressed as resistances.
Figure 77: Monthly soil temperature measurements in Grum Overburden Dump by an M-Squared thermistor string measured manually (Thermistor String 4). Raw data expressed as resistances.

Figure 78: Daily volumetric moisture content in CT#1 (Station #1) measured manually by a Sentek Diviner 2000.
Figure 79: Daily volumetric moisture content in CT#1 (Station #2) measured manually by a Sentek Diviner 2000.

Figure 80: Daily volumetric moisture content in CT#1 (Station #3) measured manually by a Sentek Diviner 2000.
Figure 81: Daily volumetric moisture content in CT#1 (Station #4) measured manually by a Sentek Diviner 2000.

Figure 82: Daily volumetric moisture content in CT#1 (Station #5) measured manually by a Sentek Diviner 2000.
Figure 83: Daily volumetric moisture content in CT#1 (Station #6) measured manually by a Sentek Diviner 2000.

Figure 84: Daily volumetric moisture content in CT#2A (Station #9) measured manually by a Sentek Diviner 2000.
Figure 85: Daily volumetric moisture content in CT#2A (Station #10) measured manually by a Sentek Diviner 2000.

Figure 86: Daily volumetric moisture content in CT#2A (Station #11) measured manually by a Sentek Diviner 2000.
Figure 87: Daily volumetric moisture content in CT#2A (Station #12) measured manually by a Sentek Diviner 2000.

Figure 88: Daily volumetric moisture content in CT#2A (Station #13) measured manually by a Sentek Diviner 2000.
Figure 89: Daily volumetric moisture content in CT#2A (Station #14) measured manually by a Sentek Diviner 2000.

Figure 90: Daily volumetric moisture content in CT#2B (Station #15) measured manually by a Sentek Diviner 2000.
Figure 91: Daily volumetric moisture content in CT#2B (Station #16) measured manually by a Sentek Diviner 2000.

Figure 92: Daily volumetric moisture content in CT#2B (Station #17) measured manually by a Sentek Diviner 2000.
Figure 93: Daily volumetric moisture content in CT#2B (Station #18) measured manually by a Sentek Diviner 2000.

Figure 94: Daily volumetric moisture content in CT#2B (Station #19) measured manually by a Sentek Diviner 2000.
Figure 95: Daily volumetric moisture content in CT#2B (Station #20) measured manually by a Sentek Diviner 2000.

Figure 96: Daily volumetric moisture content in CT#3A (Station #21) measured manually by a Sentek Diviner 2000.
Figure 97: Daily volumetric moisture content in CT#3A (Station #22) measured manually by a Sentek Diviner 2000.

Figure 98: Daily volumetric moisture content in CT#3A (Station #23) measured manually by a Sentek Diviner 2000.
Figure 99: Daily volumetric moisture content in CT#3A (Station #24) measured manually by a Sentek Diviner 2000.

Figure 100: Daily volumetric moisture content in CT#3A (Station #25) measured manually by a Sentek Diviner 2000.
Figure 101: Daily volumetric moisture content in CT#3A (Station #26) measured manually by a Sentek Diviner 2000.

Figure 102: Daily volumetric moisture content in CT#3B (Station #27) measured manually by a Sentek Diviner 2000.
Figure 103: Daily volumetric moisture content in CT#3B (Station #28) measured manually by a Sentek Diviner 2000.

Figure 104: Daily volumetric moisture content in CT#3B (Station #29) measured manually by a Sentek Diviner 2000.
Figure 105: Daily volumetric moisture content in CT#3B (Station #30) measured manually by a Sentek Diviner 2000.

Figure 106: Daily volumetric moisture content in CT#3B (Station #31) measured manually by a Sentek Diviner 2000.
Figure 107: Daily volumetric moisture content in CT#3B (Station #32) measured manually by a Sentek Diviner 2000.

Figure 108: Daily volumetric moisture content in CT#4 (Station #33) measured manually by a Sentek Diviner 2000.
Figure 109: Daily volumetric moisture content in CT#4 (Station #34) measured manually by a Sentek Diviner 2000.

Figure 110: Daily volumetric moisture content in CT#4 (Station #35) measured manually by a Sentek Diviner 2000.
Figure 111: Daily volumetric moisture content in CT#4 (Station #36) measured manually by a Sentek Diviner 2000.

Figure 112: Daily volumetric moisture content in CT#4 (Station #37) measured manually by a Sentek Diviner 2000.
Figure 113: Daily volumetric moisture content in CT#4 (Station #38) measured manually by a Sentek Diviner 2000.

Figure 114: Daily volumetric moisture content in CT#4 (Station #39) measured manually by a Sentek Diviner 2000.
Figure 115: Daily volumetric moisture content in CT#4 (Station #40) measured manually by a Sentek Diviner 2000.
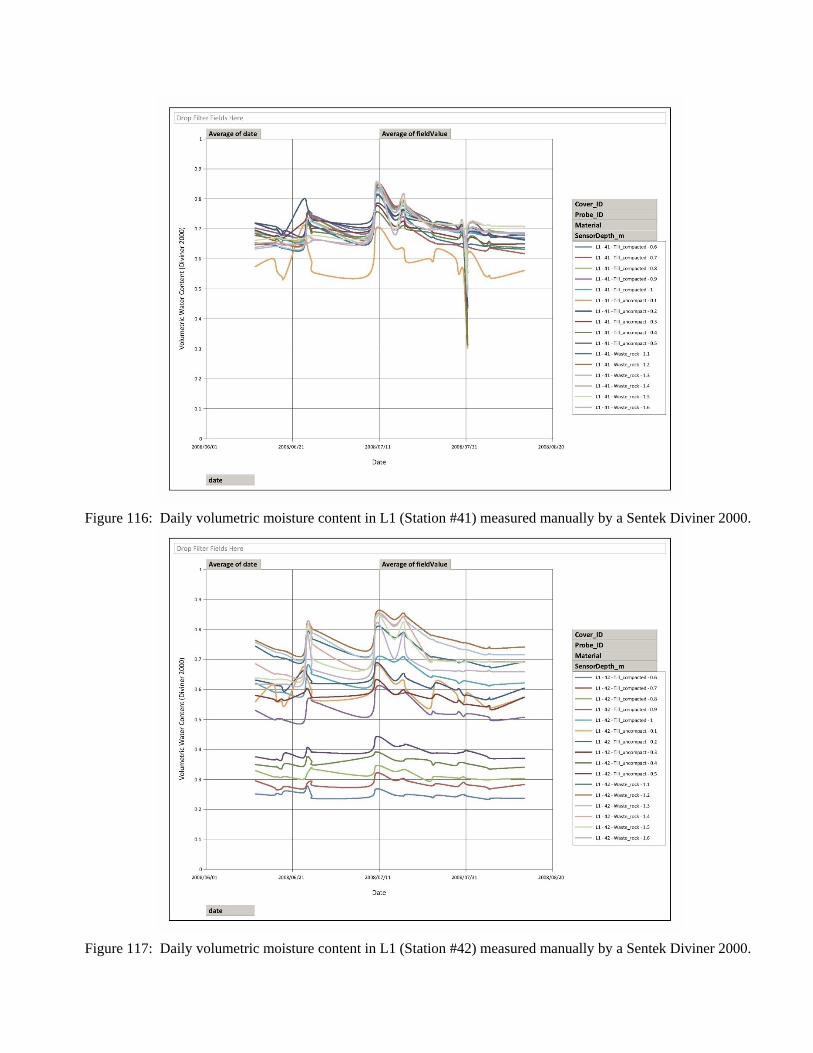
Figure 116: Daily volumetric moisture content in L1 (Station #41) measured manually by a Sentek Diviner 2000.
Figure 117: Daily volumetric moisture content in L1 (Station #42) measured manually by a Sentek Diviner 2000.

Figure 118: Daily volumetric moisture content in L1 (Station #43) measured manually by a Sentek Diviner 2000.
Figure 119: Daily volumetric moisture content in L1 (Station #44) measured manually by a Sentek Diviner 2000.

Figure 120: Daily volumetric moisture content in L1 (Station #45) measured manually by a Sentek Diviner 2000.
Figure 121: Daily volumetric moisture content in L1 (Station #46) measured manually by a Sentek Diviner 2000.

Figure 122: Daily volumetric moisture content in L1 (Station #47) measured manually by a Sentek Diviner 2000.
Figure 123: Daily volumetric moisture content in L1 (Station #48) measured manually by a Sentek Diviner 2000.

Figure 124: Daily volumetric moisture content in L1(Station #49) measured manually by a Sentek Diviner 2000.
Figure 125: Daily volumetric moisture content in L1 (Station #50) measured manually by a Sentek Diviner 2000.

Figure 126: Daily volumetric moisture content in L2 (Station #51) measured manually by a Sentek Diviner 2000.
Figure 127: Daily volumetric moisture content in L2 (Station #52) measured manually by a Sentek Diviner 2000.

Figure 128: Daily volumetric moisture content in L2 (Station #53) measured manually by a Sentek Diviner 2000.
Figure 129: Daily volumetric moisture content in L2 (Station #54) measured manually by a Sentek Diviner 2000.

Figure 130: Daily volumetric moisture content in L2 (Station #55) measured manually by a Sentek Diviner 2000.
Figure 131: Daily volumetric moisture content in L2 (Station #56) measured manually by a Sentek Diviner 2000.

Figure 132: Daily volumetric moisture content in L2 (Station #57) measured manually by a Sentek Diviner 2000.
Figure 133: Daily volumetric moisture content in L2 (Station #58) measured manually by a Sentek Diviner 2000.

Figure 134: Daily volumetric moisture content in L2 (Station #59) measured manually by a Sentek Diviner 2000.
Figure 135: Daily volumetric moisture content in L2 (Station #60) measured manually by a Sentek Diviner 2000.

Figure 136: Hydrostatic pressure measured using the HOBO water level logger installed on CT#2A. Only significant values are displayed.
Figure 137: Hydrostatic pressure measured using the HOBO water level logger installed on CT#2B. Only significant values are displayed.

Figure 138: Hydrostatic pressure measured using the HOBO water level logger installed on L#1. Only significant values are displayed.
Figure 139: Hydrostatic pressure measured using the HOBO water level logger installed on L#2. Only significant values are displayed.

Appendices

Appendix A Additional Climatic Data Calculated and Stored by
Davis Instruments Vantage Pro Data Logger

Appendix A Additional Climatic Data Calculated and Stored by Davis Instruments Vantage Pro Data Logger Page 1
Faro_AppendixA_ClimateDataCalculatedAndStored_1CY001.020_jm_rev01.doc SRK Consulting March 2009
Parameter Description Verification
Dew Point
Dew-point is the temperature to which air must be cooled for saturation (100% relative humidity) to occur, providing there is no change in water content. The dew-point is an important measurement used to predict the formation of dew, frost, and fog. Dew-point is also a good indicator of the air’s actual water vapour content, unlike relative humidity, which takes the air’s temperature into account. High dew-point indicates high vapour content; low dew-point indicates low vapour content. In addition a high dew-point indicates a better chance of rain and severe thunder storms.
Checked
Wind Run
Wind run is measurement of the "amount" of wind passing the station during a given period of time, expressed in either "miles of wind" or "kilometres of wind". WeatherLink calculates wind run by multiplying the average wind speed for each archive record by the archive interval.
Checked
Wind Chill
Wind chill takes into account how the speed of the wind affects our perception of air temperature. Your body warms the surrounding air molecules by transferring heat from your skin. If there’s no air movement, this insulating layer of warm air molecules stays next to your body and offers some protection from cooler air molecules. Wind disperses this layer of warm air, causing the air temperature to "feel" colder. The faster the wind blows, the quicker the layer of warm air is dispersed, and the colder you feel. Above 76.7ºF (24.8ºC), wind movement has no effect on the apparent temperature. WeatherLink versions 5.1 and later use the Osczevski (1995) equation to calculate wind chill. This is the method adopted by the US National Weather Service in September of 2001.
Checked
Heat Index
The Heat Index uses the temperature and the relative humidity to determine how hot the air actually "feels." When humidity is low, the apparent temperature will be lower than the air temperature, since perspiration evaporates rapidly to cool the body. However, when humidity is high (i.e., the air is saturated with water vapour) the apparent temperature "feels" higher than the actual air temperature, because perspiration evaporates more slowly. WeatherLink uses the Steadman (1979 & 1998) formula to calculate Heat Index, which is more accurate than the method used by the Vantage Pro console and is calculated for all temperatures.
Checked
THW Index The THW Index uses humidity, temperature and wind to calculate an apparent temperature that incorporates the cooling effects of wind on our perception of temperature.
Checked
THSW Index The THSW Index uses humidity, temperature, the cooling effects of wind and the heating effects of direct solar radiation to calculate an apparent temperature. Checked
Solar Energy The amount of accumulated solar radiation energy over a period of time is measured in Langleys. Checked
UV Dose
Measured in MED which stands for Minimum Erythemal Dose, defined as the amount of sunlight exposure necessary to induce a barely perceptible redness of the skin within 24 hours after sun exposure. In other words, exposure to 1 MED will result in a reddening of the skin. Because different skin types burn at different rates, 1 MED for persons with very dark skin is different from 1 MED for persons with very light skin.
Checked
Heating DD
One heating degree–day is the amount of heat required to keep a structure at 65ºF when the outside temperature remains one degree below the 65ºF threshold for 24 hours. One heating degree–day is also the amount of heat required to keep that structure at 65ºF when the temperature remains 24ºF below that 65º threshold for 1 hour.
Checked
Cooling DD
One cooling degree–day is the amount of cooling required to keep a structure at 65ºF when the outside temperature remains one degree above the 65ºF threshold for 24 hours. One cooling degree–day is also the amount of cooling required to keep that structure at 65ºF when the temperature remains 24ºF above that 65º threshold for 1 hour.
Checked
Inside Temp The temperature measured inside the console Checked
Inside Humidity The relative humidity measured inside the console Transient problems
ET
Evapotranspiration is the measure of the quantity of moisture transpiring from the leaves of a crop and evaporating from the ground. ET values are calculated from measured data on wind run, air temperature, relative humidity, and solar radiation. The ET value is calculated once each hour using the data averaged over the prior hour
Checked

Appendix B Summary of Saturated Hydraulic Conductivity and In-Situ
Density Measurements

Appendix B.1 Summary of In-Situ Hydraulic Conductivity Testing Results

Appendix B.1 Summary of Saturated Hydraulic Conductivity and In-situ Density Measurements Page 1 of 1
Faro_AppendixB_SummaryOfIn-SituInvestigations_1CY001.020_jm_rev01.docx SRK Consulting March 2009
In‐situ Hydraulic Conductivity Testing Results
TestType
TestSection
Hydraulic Conductivity
[cm/s]
Testedby Comments Average Ksat
[cm/sec]
Guelph w/ tension infiltrometer CT#2A_1 1.93E-04 JMGuelph w/ tension infiltrometer CT#2A_2 2.02E-04 JMGuelph w/ tension infiltrometer CT#2B_1 2.08E-04 JMGuelph w/ tension infiltrometer CT#2B_2 9.74E-05 JMGuelph w/ tension infiltrometer CT#2B_3 5.40E-05 JMGuelph w/ tension infiltrometer CT#4_1 6.60E-04 JMGuelph w/ tension infiltrometer CT#4_2 8.38E-05 JMGuelph w/ tension infiltrometer CT#4_3 6.73E-04 JMGuelph w/ tension infiltrometer CT#4_5 8.62E-04 JMGuelph w/ tension infiltrometer CT#4_6 1.05E-05 JMGuelph w/ tension infiltrometer CT#4_7 2.58E-04 JMGuelph w/ tension infiltrometer CT#4_8 1.32E-04 JMGuelph w/ tension infiltrometer L#2_1 1.42E-04 JMGuelph w/ tension infiltrometer L#2_2 1.28E-04 JM
Single Ring Infiltrometer CT#2A_1 1.53E-04 JMSingle Ring Infiltrometer CT#2A_2 9.70E-05 JMSingle Ring Infiltrometer CT#2A_3 8.19E-05 JMSingle Ring Infiltrometer CT#2B_1 6.65E-06 JMSingle Ring Infiltrometer CT#2B_2 3.11E-06 JMSingle Ring Infiltrometer CT#2B_3 1.04E-04 JMSingle Ring Infiltrometer CT#2B_4 6.29E-05 JMSingle Ring Infiltrometer CT#4_1 2.91E-05 JMSingle Ring Infiltrometer CT#4_2 1.13E-05 JMSingle Ring Infiltrometer CT#4_3 1.79E-05 JMSingle Ring Infiltrometer CT#4_4 7.28E-06 JMSingle Ring Infiltrometer CT#4_5 1.34E-05 JMSingle Ring Infiltrometer CT#4_6 4.93E-05 JMSingle Ring Infiltrometer CT#4_7 3.68E-05 JMSingle Ring Infiltrometer L#2_1 1.13E-05 JMSingle Ring Infiltrometer L#2_2 2.04E-05 JMSingle Ring Infiltrometer L#2_3 4.23E-05 JMSingle Ring Infiltrometer L#2_4 5.15E-05 JM
1.11E-04
4.42E-05
2.36E-05
3.14E-05
1.97E-04
1.20E-04
3.83E-04
1.35E-04

Appendix B.2 Summary of In-Situ Density Measurements

Appendix B.2 Summary of Saturated Hydraulic Conductivity and In-situ Density Measurements Page 1 of 2
Faro_AppendixB_SummaryOfIn-SituInvestigations_1CY001.020_jm_rev01.docx SRK Consulting March 2009
In‐situ Density Testing Results
Test # Probe
depth [mm] Location Moisture
content [%] Dry Density
[kg/m3] Compaction
[%] Observations Cover Row # Column # 1 200 CT#4 1 1 5.5 2,058 96.6 2 200 CT#4 1 2 3.6 2,140 100.5 3 200 CT#4 1 3 4.4 2,209 103.7 4 200 CT#4 2 1 5.1 2,158 101.3 5 200 CT#4 2 2 4.8 2,109 99 6 200 CT#4 2 3 52 2,148 100.8 7 200 CT#4 3 1 5.8 2,067 97 8 200 CT#4 3 2 5 2,089 98.1 9 200 CT#4 3 3 5.4 2,093 98.2
10 200 CT#4 4 1 4.5 1,936 90.9 11 200 CT#4 4 2 5.5 2,111 99.1 12 200 CT#4 4 3 3.7 2,138 100.4 13 200 CT#4 5 1 3.8 2,010 94.3 14 200 CT#4 5 2 4.9 2,195 103.1 15 200 CT#4 5 3 4.5 2,219 104.2 16 200 CT#4 6 1 4.6 2,152 101 17 200 CT#4 6 2 4 2,061 96.8 18 200 CT#4 6 3 4.6 2,165 101.7 19 200 CT#3A 1 1 2.8 2,048 96.2 20 200 CT#3A 1 2 2.5 2,103 98.7 21 200 CT#3A 1 3 2.5 2,001 93.9 22 200 CT#3A 2 1 3.1 2,019 94.8 23 200 CT#3A 2 2 2.5 1,967 92.4 24 200 CT#3A 2 3 3.5 2,074 97.4 25 200 CT#3A 3 1 4.3 2,146 100.7 26 200 CT#3A 3 2 2.3 1,939 91 27 200 CT#3A 3 3 3 2,061 96.8 28 200 CT#3A 4 1 3.1 2,027 92.5 29 200 CT#3A 4 2 3.1 1,984 93.2 30 200 CT#3A 4 3 3 2,046 96.1 31 200 CT#3B 1 1 1.9 1,997 93.8 32 200 CT#3B 1 2 3 2,017 94.7 33 200 CT#3B 1 3 2.7 2,052 96.4 34 200 CT#3B 2 1 2.4 1,947 91.4 35 200 CT#3B 2 2 3.2 1,955 91.8 36 200 CT#3B 2 3 2.7 2,045 96 37 200 CT#3B 3 1 1.9 1,981 93 38 200 CT#3B 3 2 3.5 1,900 89.2 39 200 CT#3B 3 3 2.6 2,050 96.3 40 200 CT#3B 4 1 3 2,249 105.6 41 200 CT#3B 4 2 3.3 1,986 93.2 42 200 CT#3B 4 3 2.5 1,997 93.8 43 200 CT#1 1 1 5.2 2,096 98.4 44 200 CT#1 1 2 4.4 2,088 98 45 200 CT#1 1 3 5 2,073 97.3 46 200 CT#1 2 1 6.2 1,984 93.2 47 200 CT#1 2 2 6.2 2,043 95.9 48 200 CT#1 2 3 5.5 2,053 96.4 49 200 CT#1 3 1 4.9 2,044 96 50 200 CT#1 3 2 6.5 1,997 93.8

Appendix B.2 Summary of Saturated Hydraulic Conductivity and In-situ Density Measurements Page 2 of 2
Faro_AppendixB_SummaryOfIn-SituInvestigations_1CY001.020_jm_rev01.docx SRK Consulting March 2009
Test # Probe
depth [mm] Location Moisture
content [%] Dry Density
[kg/m3] Compaction
[%] Observations Cover Row # Column # 51 200 CT#1 3 3 5.4 1,992 93.5 52 200 CT#1 4 1 4.3 2,155 101.2
53 200 CT#1 4 2 5.9 1,707 80.1* *Void
Encountered 54 200 CT#1 4 3 5.7 1,978 92.9 55 200 CT#1 5 1 5 2,046 96.1 56 200 CT#1 5 2 5.9 1,985 93.2 57 200 CT#1 5 3 5.3 2,082 97.8 58 200 CT#1 6 1 6.7 2,037 95.6 59 200 CT#1 6 2 6.7 2,066 97 60 200 CT#1 6 3 5.3 2,162 101.5 61 200 CT#2B 1 1 4.3 2,131 100.1 62 200 CT#2B 1 2 4.7 2,136 100.3 63 200 CT#2B 1 3 5.4 2,033 95.5 64 200 CT#2B 2 1 5.1 2,106 98.9 65 200 CT#2B 2 2 4 2,181 102.4 66 200 CT#2B 2 3 5.2 2,097 98.4 67 200 CT#2B 3 1 5.2 2,092 98.2 68 200 CT#2B 3 2 5.3 2,137 100.4 69 200 CT#2B 3 3 6.1 2,077 97.5 70 200 CT#2B 4 1 7.3 2,068 97.1 71 200 CT#2B 4 2 5.2 2,083 97.8 72 200 CT#2B 4 3 5.8 2,107 98.9 73 200 CT#2A 1 1 6.3 2,117 99.4 74 200 CT#2A 1 2 5.4 2,109 99 75 200 CT#2A 1 3 4.7 2,150 100.9 76 200 CT#2A 2 1 5.1 2,201 103.3 77 200 CT#2A 2 2 5.1 2,196 101.8 78 200 CT#2A 2 3 4.4 2,190 102.8 79 200 CT#2A 3 1 5.2 2,127 99.8 80 200 CT#2A 3 2 4.8 2,091 98.2 81 200 CT#2A 3 3 5.5 2,151 101 82 200 CT#2A 4 1 5 2,043 95.9 83 200 CT#2A 4 2 4.8 2,147 100.8 84 200 CT#2A 4 3 5.2 2,173 102 85 200 L#2 1 1 5.5 2,206 103.6 86 200 L#2 1 2 5.4 2,149 100.9 87 200 L#2 1 3 5.3 2,222 104.3 88 200 L#2 2 1 5.1 2,203 103.4 89 200 L#2 2 2 4.9 2,102 98.7 90 200 L#2 2 3 5.1 2,060 96.7 91 200 L#2 3 1 5.6 2,129 99.9 92 200 L#2 3 2 4.6 2,192 102.9 93 200 L#2 3 3 6 2,085 97.9 94 200 L#2 4 1 5.4 2,146 100.7 95 200 L#2 4 2 5.5 2,075 97.4 96 200 L#2 4 3 4.8 2,173 102 97 200 L#1 1 1 6.8 1,669 78.4 98 200 L#1 1 2 4.2 1,679 78.8 99 200 L#1 1 3 6 1,805 84.8

Appendix C Individual Calculation Sheets for Saturated Hydraulic
Conductivity Data

Appendix C.1 Guelph Infiltrometer Field Data Sheets

-50 mm -122 mmINNER INNER
ReadingNumber Time Elapsed
Time
TimeInterval(min)
WaterLevel
inReservoir
(cm)
WaterLevel
Change(cm)
Rate of WaterLevel
Change,R1
(cm/min)
ReadingNumber Time Elapsed
Time
TimeInterval(min)
WaterLevel
inReservoir
(cm)
Water Level
Change(cm)
Rate of WaterLevel
Change,R2
(cm/min)
1 14:00 26.80 1 14:42 30.402 14:03 0:03:00 0:03:00 35.30 8.50 2.83 2 14:44 0:02:00 0:02:00 32.70 2.30 1.153 14:06 0:06:00 0:03:00 42.30 7.00 2.33 3 14:47 0:05:00 0:03:00 36.60 3.90 1.304 14:08 0:08:00 0:02:00 46.90 4.60 2.30 4 14:50 0:08:00 0:03:00 40.70 4.10 1.375 14:10 0:10:00 0:02:00 51.20 4.30 2.15 5 14:53 0:11:00 0:03:00 44.80 4.10 1.376 14:12 0:12:00 0:02:00 55.40 4.20 2.10 6 14:57 0:15:00 0:04:00 49.90 5.10 1.287 14:14 0:14:00 0:02:00 59.50 4.10 2.05 7 15:00 0:18:00 0:03:00 53.70 3.80 1.27
Guelph Infiltrometer Calculation Sheet CT#2A_1
Tension Infiltrometer attachment used.
Date: August 11, 2008 Depth of Well Hole:Location: CT#2A_1 Investigator: JM
Dominant Soil Type: Glacial TillTest No: 12
Head = Head = Reservoir(s) used: Reservoir(s) used:
7 14:14 0:14:00 0:02:00 59.50 4.10 2.05 7 15:00 0:18:00 0:03:00 53.70 3.80 1.278 14:16 0:16:00 0:02:00 63.10 3.60 1.80 8 15:03 0:21:00 0:03:00 57.60 3.90 1.309 14:18 0:18:00 0:02:00 67.00 3.90 1.95 9 15:06 0:24:00 0:03:00 61.40 3.80 1.2710 14:20 0:20:00 0:02:00 70.90 3.90 1.95 10 15:10 0:28:00 0:04:00 66.30 4.90 1.2311 14:22 0:22:55 0:02:55 76.00 5.10 1.75 1112 1213 14:25 0:25:00 30.50 1314 14:26 0:26:00 0:01:00 33.00 2.50 2.50 1415 14:28 0:28:00 0:02:00 38.00 5.00 2.50 1516 14:30 0:30:00 0:02:00 43.10 5.10 2.55 1617 14:32 0:32:00 0:02:00 48.10 5.00 2.50 1718 1819 1920 2021 2122 2223 2324 2425 25
2.513 1.267
cm/s
Steady rate for three consecutive readings (R1) Steady rate for three consecutive readings (R2)
Saturated Hydraulic Conductivity, Ks = 1.93E-04

-50 mm -107 mmINNER INNER
ReadingNumber Time Elapsed
Time
TimeInterval(min)
WaterLevel
inReservoir
(cm)
WaterLevel
Change(cm)
Rate of WaterLevel
Change,R1
(cm/min)
ReadingNumber Time Elapsed
Time
TimeInterval(min)
WaterLevel
inReservoir
(cm)
Water Level
Change(cm)
Rate of WaterLevel
Change,R2
(cm/min)
1 15:41 28.10 1 16:07 31.602 15:42 1' 1.0 31.40 3.00 3.00 2 16:09 0:02:00 0:02:00 34.10 2.50 1.253 15:43 2' 1.0 34.40 3.30 3.30 3 16:11 0:04:00 0:02:00 36.80 2.70 1.354 15:44 3' 1.0 37.20 2.80 2.80 4 16:13 0:06:00 0:02:00 39.60 2.80 1.405 15:45 4' 1.0 40.10 2.90 2.90 5 16:15 0:08:00 0:02:00 42.30 2.70 1.356 15:46 5' 1.0 42.90 2.80 2.80 6 16:18 0:11:00 0:03:00 46.60 4.30 1.437 15:47 6' 1 0 45 60 2 70 2 70 7 16:21 0:14:00 0:03:00 50 60 4 00 1 33
Head = Head = Reservoir(s) used: Reservoir(s) used:
Dominant Soil Type: Galcial till
Tension Infiltrometer attachment used.
Test No: 13Date: August 11, 2008 Depth of Well Hole:
Guelph Infiltrometer Calculation Sheet CT#2A_2
Location: CT#2A_2 Investigator: JM
7 15:47 6' 1.0 45.60 2.70 2.70 7 16:21 0:14:00 0:03:00 50.60 4.00 1.338 15:48 7' 1.0 48.40 2.80 2.80 8 16:24 0:17:00 0:03:00 54.70 4.10 1.379 15:49 8' 1.0 51.00 2.60 2.60 9 16:27 0:20:00 0:03:00 58.20 3.50 1.1710 15:50 9' 1.0 53.60 2.60 2.60 10 16:30 0:23:00 0:03:00 62.10 3.90 1.3011 15:51 10' 1.0 56.10 2.50 2.50 11 16:33 0:26:00 0:03:00 65.70 3.60 1.2012 15:52 11' 1.0 58.70 2.60 2.60 12 16:36 0:29:00 0:03:00 69.40 3.70 1.2313 15:53 12' 1.0 60.90 2.20 2.20 13 16:39 0:32:00 0:03:00 73.10 3.70 1.2314 15:54 13' 1.0 63.50 2.60 2.60 1415 15:55 14' 1.0 65.90 2.40 2.40 1516 15:56 15' 1.0 68.20 2.30 2.30 1617 15:57 16' 1.0 70.50 2.30 2.30 1718 15:58 17' 1.0 72.80 2.30 2.30 1819 15:59 18' 1.0 75.00 2.20 2.20 1920 2021 2122 2223 2324 2425 25
2.275 1.222
cm/sSaturated Hydraulic Conductivity, Ks = 2.02E-04
Steady rate for three consecutive readings (R1) Steady rate for three consecutive readings (R2)

-98 mm -46 mmINNER INNER
ReadingNumber Time Elapsed
Time
TimeInterval(min)
WaterLevel
inReservoir
(cm)
WaterLevel
Change(cm)
Rate of WaterLevel
Change,R1
(cm/min)
ReadingNumber Time Elapsed
Time
TimeInterval(min)
WaterLevel
inReservoir
(cm)
Water Level
Change(cm)
Rate of WaterLevel
Change,R2
(cm/min)
1 17:23 27.90 1 18:15 27.802 17:24 0:01:00 0:01:00 28.90 1.00 1.00 2 18:17 0:02:00 0:02:00 31.50 3.70 1.853 17:26 0:03:00 0:02:00 30.80 1.90 0.95 3 18:19 0:04:00 0:02:00 35.10 3.60 1.804 17:28 0:05:00 0:02:00 32.40 1.60 0.80 4 18:22 0:07:00 0:03:00 40.20 5.10 1.705 17:30 0:07:00 0:02:00 34.10 1.70 0.85 5 18:26 0:11:00 0:04:00 47.10 6.90 1.736 17:37 0:14:00 0:07:00 39.50 5.40 0.77 6 18:29 0:14:00 0:03:00 51.90 4.80 1.607 17:45 0:22:00 0:08:00 45 10 5 60 0 70 7 18:33 0:18:00 0:04:00 58 10 6 20 1 55
Tension Infiltrometer attachment used.
Guelph Infiltrometer Calculation Sheet CT#2B_1
Location: CT#2B_1 Investigator: JMDate:
Dominant Soil Type: Glacial Till
Head = Head =
August 10, 2008 Depth of Well Hole:Test No: 9
Reservoir(s) used: Reservoir(s) used:
7 17:45 0:22:00 0:08:00 45.10 5.60 0.70 7 18:33 0:18:00 0:04:00 58.10 6.20 1.558 17:50 0:27:00 0:05:00 48.50 3.40 0.68 8 18:36 0:21:00 0:03:00 62.80 4.70 1.579 17:55 0:32:00 0:05:00 51.60 3.10 0.62 9 18:39 0:24:00 0:03:00 67.20 4.40 1.4710 18:00 0:37:00 0:05:00 55.10 3.50 0.70 10 18:42 0:27:00 0:03:00 71.60 4.40 1.4711 18:05 0:42:00 0:05:00 58.10 3.00 0.60 1112 18:10 0:47:00 0:05:00 60.90 2.80 0.56 1213 1314 1415 1516 1617 1718 1819 1920 2021 2122 2223 2324 2425 25
0.620 1.500
cm/sSaturated Hydraulic Conductivity, Ks = 2.08E-04
Steady rate for three consecutive readings (R1) Steady rate for three consecutive readings (R2)
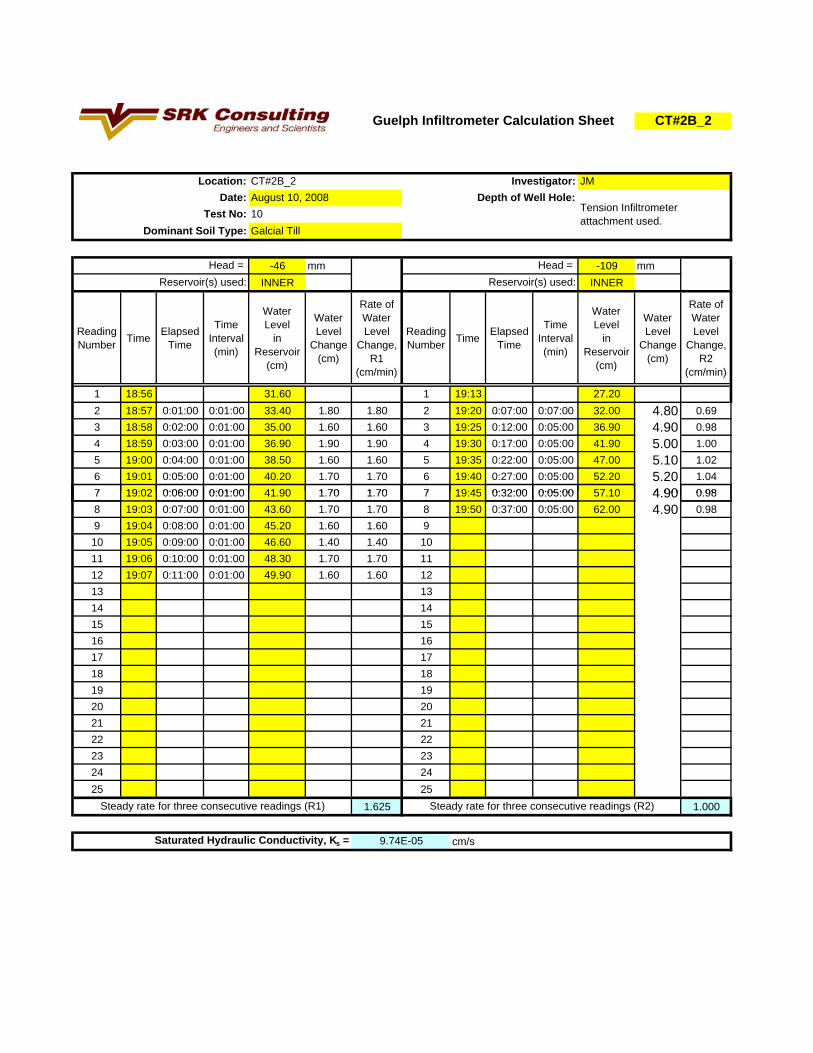
-46 mm -109 mmINNER INNER
ReadingNumber Time Elapsed
Time
TimeInterval(min)
WaterLevel
inReservoir
(cm)
WaterLevel
Change(cm)
Rate of WaterLevel
Change,R1
(cm/min)
ReadingNumber Time Elapsed
Time
TimeInterval(min)
WaterLevel
inReservoir
(cm)
Water Level
Change(cm)
Rate of WaterLevel
Change,R2
(cm/min)
1 18:56 31.60 1 19:13 27.202 18:57 0:01:00 0:01:00 33.40 1.80 1.80 2 19:20 0:07:00 0:07:00 32.00 4.80 0.693 18:58 0:02:00 0:01:00 35.00 1.60 1.60 3 19:25 0:12:00 0:05:00 36.90 4.90 0.984 18:59 0:03:00 0:01:00 36.90 1.90 1.90 4 19:30 0:17:00 0:05:00 41.90 5.00 1.005 19:00 0:04:00 0:01:00 38.50 1.60 1.60 5 19:35 0:22:00 0:05:00 47.00 5.10 1.026 19:01 0:05:00 0:01:00 40.20 1.70 1.70 6 19:40 0:27:00 0:05:00 52.20 5.20 1.047 19:02 0:06:00 0:01:00 41 90 1 70 1 70 7 19:45 0:32:00 0:05:00 57 10 4 90 0 98
Tension Infiltrometer attachment used.
Guelph Infiltrometer Calculation Sheet CT#2B_2
Location: CT#2B_2 Investigator: JMDate:
Dominant Soil Type: Galcial Till
Head = Head =
August 10, 2008 Depth of Well Hole:Test No: 10
Reservoir(s) used: Reservoir(s) used:
7 19:02 0:06:00 0:01:00 41.90 1.70 1.70 7 19:45 0:32:00 0:05:00 57.10 4.90 0.988 19:03 0:07:00 0:01:00 43.60 1.70 1.70 8 19:50 0:37:00 0:05:00 62.00 4.90 0.989 19:04 0:08:00 0:01:00 45.20 1.60 1.60 910 19:05 0:09:00 0:01:00 46.60 1.40 1.40 1011 19:06 0:10:00 0:01:00 48.30 1.70 1.70 1112 19:07 0:11:00 0:01:00 49.90 1.60 1.60 1213 1314 1415 1516 1617 1718 1819 1920 2021 2122 2223 2324 2425 25
1.625 1.000
cm/sSaturated Hydraulic Conductivity, Ks = 9.74E-05
Steady rate for three consecutive readings (R1) Steady rate for three consecutive readings (R2)
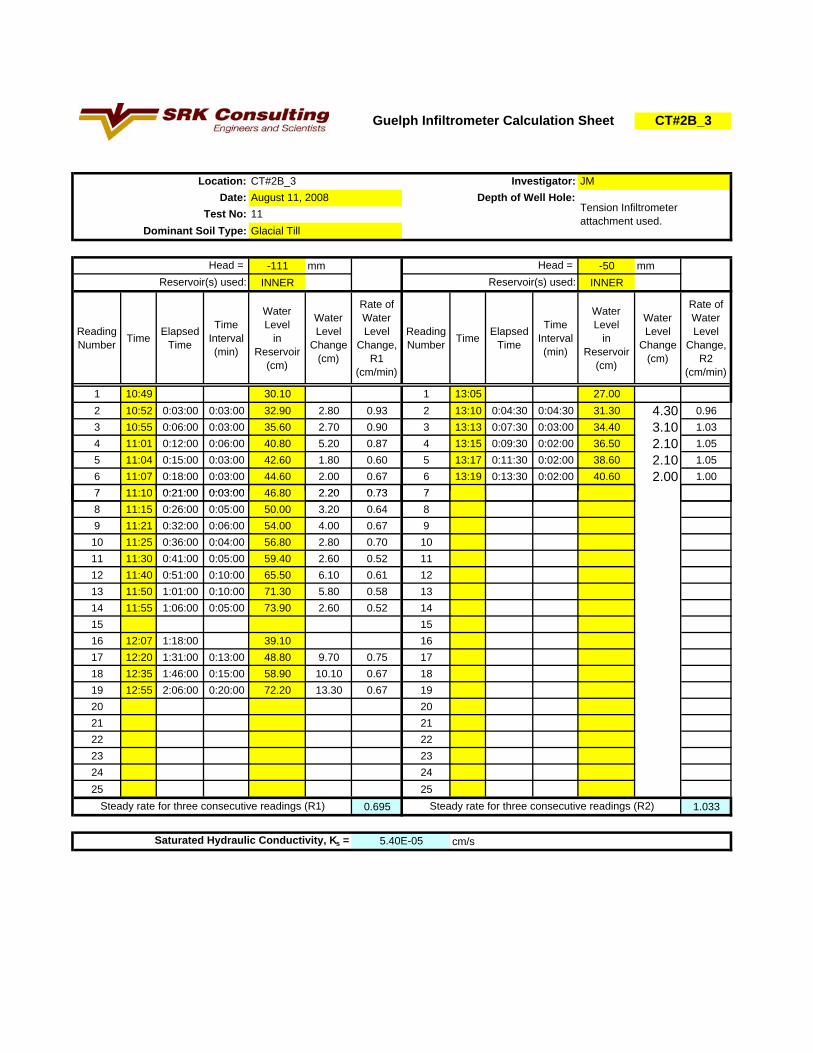
-111 mm -50 mmINNER INNER
ReadingNumber Time Elapsed
Time
TimeInterval(min)
WaterLevel
inReservoir
(cm)
WaterLevel
Change(cm)
Rate of WaterLevel
Change,R1
(cm/min)
ReadingNumber Time Elapsed
Time
TimeInterval(min)
WaterLevel
inReservoir
(cm)
Water Level
Change(cm)
Rate of WaterLevel
Change,R2
(cm/min)
1 10:49 30.10 1 13:05 27.002 10:52 0:03:00 0:03:00 32.90 2.80 0.93 2 13:10 0:04:30 0:04:30 31.30 4.30 0.963 10:55 0:06:00 0:03:00 35.60 2.70 0.90 3 13:13 0:07:30 0:03:00 34.40 3.10 1.034 11:01 0:12:00 0:06:00 40.80 5.20 0.87 4 13:15 0:09:30 0:02:00 36.50 2.10 1.055 11:04 0:15:00 0:03:00 42.60 1.80 0.60 5 13:17 0:11:30 0:02:00 38.60 2.10 1.056 11:07 0:18:00 0:03:00 44.60 2.00 0.67 6 13:19 0:13:30 0:02:00 40.60 2.00 1.007 11:10 0:21:00 0:03:00 46 80 2 20 0 73 7
Tension Infiltrometer attachment used.
Guelph Infiltrometer Calculation Sheet CT#2B_3
Location: CT#2B_3 Investigator: JMDate:
Dominant Soil Type: Glacial Till
Head = Head =
August 11, 2008 Depth of Well Hole:Test No: 11
Reservoir(s) used: Reservoir(s) used:
7 11:10 0:21:00 0:03:00 46.80 2.20 0.73 78 11:15 0:26:00 0:05:00 50.00 3.20 0.64 89 11:21 0:32:00 0:06:00 54.00 4.00 0.67 910 11:25 0:36:00 0:04:00 56.80 2.80 0.70 1011 11:30 0:41:00 0:05:00 59.40 2.60 0.52 1112 11:40 0:51:00 0:10:00 65.50 6.10 0.61 1213 11:50 1:01:00 0:10:00 71.30 5.80 0.58 1314 11:55 1:06:00 0:05:00 73.90 2.60 0.52 1415 1516 12:07 1:18:00 39.10 1617 12:20 1:31:00 0:13:00 48.80 9.70 0.75 1718 12:35 1:46:00 0:15:00 58.90 10.10 0.67 1819 12:55 2:06:00 0:20:00 72.20 13.30 0.67 1920 2021 2122 2223 2324 2425 25
0.695 1.033
cm/sSaturated Hydraulic Conductivity, Ks = 5.40E-05
Steady rate for three consecutive readings (R1) Steady rate for three consecutive readings (R2)
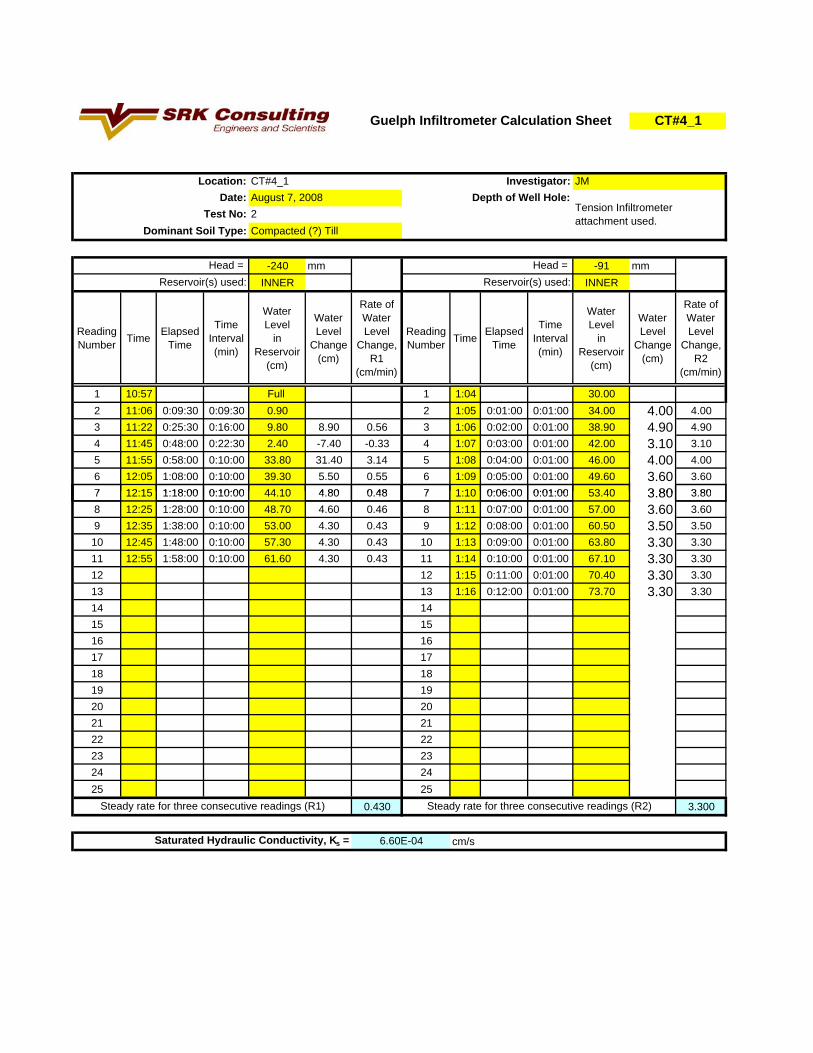
-240 mm -91 mmINNER INNER
ReadingNumber Time Elapsed
Time
TimeInterval(min)
WaterLevel
inReservoir
(cm)
WaterLevel
Change(cm)
Rate of WaterLevel
Change,R1
(cm/min)
ReadingNumber Time Elapsed
Time
TimeInterval(min)
WaterLevel
inReservoir
(cm)
Water Level
Change(cm)
Rate of WaterLevel
Change,R2
(cm/min)
1 10:57 Full 1 1:04 30.002 11:06 0:09:30 0:09:30 0.90 2 1:05 0:01:00 0:01:00 34.00 4.00 4.003 11:22 0:25:30 0:16:00 9.80 8.90 0.56 3 1:06 0:02:00 0:01:00 38.90 4.90 4.904 11:45 0:48:00 0:22:30 2.40 -7.40 -0.33 4 1:07 0:03:00 0:01:00 42.00 3.10 3.105 11:55 0:58:00 0:10:00 33.80 31.40 3.14 5 1:08 0:04:00 0:01:00 46.00 4.00 4.006 12:05 1:08:00 0:10:00 39.30 5.50 0.55 6 1:09 0:05:00 0:01:00 49.60 3.60 3.607 12:15 1:18:00 0:10:00 44 10 4 80 0 48 7 1:10 0:06:00 0:01:00 53 40 3 80 3 80
Location: CT#4_1 Investigator: JM
Guelph Infiltrometer Calculation Sheet CT#4_1
Date: August 7, 2008 Depth of Well Hole:Tension Infiltrometer attachment used.
Test No: 2Dominant Soil Type: Compacted (?) Till
Head = Head = Reservoir(s) used: Reservoir(s) used:
7 12:15 1:18:00 0:10:00 44.10 4.80 0.48 7 1:10 0:06:00 0:01:00 53.40 3.80 3.808 12:25 1:28:00 0:10:00 48.70 4.60 0.46 8 1:11 0:07:00 0:01:00 57.00 3.60 3.609 12:35 1:38:00 0:10:00 53.00 4.30 0.43 9 1:12 0:08:00 0:01:00 60.50 3.50 3.5010 12:45 1:48:00 0:10:00 57.30 4.30 0.43 10 1:13 0:09:00 0:01:00 63.80 3.30 3.3011 12:55 1:58:00 0:10:00 61.60 4.30 0.43 11 1:14 0:10:00 0:01:00 67.10 3.30 3.3012 12 1:15 0:11:00 0:01:00 70.40 3.30 3.3013 13 1:16 0:12:00 0:01:00 73.70 3.30 3.3014 1415 1516 1617 1718 1819 1920 2021 2122 2223 2324 2425 25
0.430 3.300
cm/s
Steady rate for three consecutive readings (R1) Steady rate for three consecutive readings (R2)
Saturated Hydraulic Conductivity, Ks = 6.60E-04

-239 mm -80 mmINNER INNER
ReadingNumber Time Elapsed
Time
TimeInterval(min)
WaterLevel
inReservoir
(cm)
WaterLevel
Change(cm)
Rate of WaterLevel
Change,R1
(cm/min)
ReadingNumber Time Elapsed
Time
TimeInterval(min)
WaterLevel
inReservoir
(cm)
Water Level
Change(cm)
Rate of WaterLevel
Change,R2
(cm/min)
1 1:29 29.40 1 2:37 27.302 1:34 0:05:30 0:05:30 33.80 4.40 0.80 2 2:38 0:01:00 0:01:00 28.80 1.50 1.503 1:42 0:13:30 0:08:00 41.10 7.30 0.91 3 2:39 0:02:00 0:01:00 30.50 1.70 1.704 1:46 0:17:00 0:03:30 44.10 3.00 0.86 4 2:40 0:03:00 0:01:00 32.20 1.70 1.705 1:50 0:21:00 0:04:00 47.20 3.10 0.77 5 2:41 0:04:00 0:01:00 34.10 1.90 1.906 1:55 0:26:00 0:05:00 51.10 3.90 0.78 6 2:42 0:05:00 0:01:007 2:00 0:31:00 0:05:00 54 90 3 80 0 76 7 2:43 0:06:00 0:01:00 37 10
Location: CT#4_2 Investigator: JM
Guelph Infiltrometer Calculation Sheet CT#4_2
Date: August 7, 2008 Depth of Well Hole:Tension Infiltrometer attachment used.
Test No: 3Dominant Soil Type: Till
Head = Head = Reservoir(s) used: Reservoir(s) used:
7 2:00 0:31:00 0:05:00 54.90 3.80 0.76 7 2:43 0:06:00 0:01:00 37.108 2:05 0:36:11 0:05:11 8 2:44 0:07:00 0:01:00 38.70 1.60 1.609 2:08 0:39:00 0:02:49 60.30 60.30 21.41 9 2:46 0:09:00 0:02:00 42.00 3.30 1.6510 2:20 0:51:00 0:12:00 67.90 7.60 0.63 10 2:47 0:10:00 0:01:00 43.30 1.30 1.3011 2:25 0:56:00 0:05:00 71.00 3.10 0.62 11 2:48 0:11:00 0:01:00 44.90 1.60 1.6012 2:30 1:01:00 0:05:00 74.00 3.00 0.60 12 2:49 0:12:00 0:01:00 46.40 1.50 1.5013 13 2:50 0:13:00 0:01:00 47.90 1.50 1.5014 1415 1516 1617 1718 1819 1920 2021 2122 2223 2324 2425 25
0.618 1.533
cm/s
Steady rate for three consecutive readings (R1) Steady rate for three consecutive readings (R2)
Saturated Hydraulic Conductivity, Ks = 8.38E-05

-249 mm -95 mmINNER INNER
ReadingNumber Time Elapsed
Time
TimeInterval(min)
WaterLevel
inReservoir
(cm)
WaterLevel
Change(cm)
Rate of WaterLevel
Change,R1
(cm/min)
ReadingNumber Time Elapsed
Time
TimeInterval(min)
WaterLevel
inReservoir
(cm)
Water Level
Change(cm)
Rate of WaterLevel
Change,R2
(cm/min)
1 3:36 27.60 1 4:38 34.802 3:45 0:09:30 0:09:30 30.70 3.10 0.33 2 4:39 0:01:00 0:01:00 38.10 3.30 3.303 3:55 0:19:00 0:09:30 33.60 2.90 0.31 3 4:41 0:03:00 0:02:00 43.90 5.80 2.904 4:06 0:30:00 0:11:00 36.30 2.70 0.25 4 4:42 0:04:00 0:01:00 46.60 2.70 2.705 4:15 0:39:00 0:09:00 38.60 2.30 0.26 5 4:43 0:05:00 0:01:00 49.10 2.50 2.506 4:25 0:49:00 0:10:00 40.90 2.30 0.23 6 4:44 0:06:00 0:01:00 51.70 2.60 2.607 4:35 0:59:00 0:10:00 43 10 2 20 0 22 7 4:45 0:07:00 0:01:00 54 50 2 80 2 80
Location: CT#4_3 Investigator: JM
Guelph Infiltrometer Calculation Sheet CT#4_3
Date: August 7, 2008 Depth of Well Hole:Tension Infiltrometer attachment used.
Test No: 4Dominant Soil Type: Till
Head = Head = Reservoir(s) used: Reservoir(s) used:
7 4:35 0:59:00 0:10:00 43.10 2.20 0.22 7 4:45 0:07:00 0:01:00 54.50 2.80 2.808 8 4:46 0:08:00 0:01:00 57.00 2.50 2.509 9 4:49 0:11:00 0:03:00 64.10 7.10 2.3710 1011 1112 1213 1314 1415 1516 1617 1718 1819 1920 2021 2122 2223 2324 2425 25
0.238 2.553
cm/s
Steady rate for three consecutive readings (R1) Steady rate for three consecutive readings (R2)
Saturated Hydraulic Conductivity, Ks = 6.73E-04

-72 mm -36 mmINNER INNER
ReadingNumber Time Elapsed
Time
TimeInterval(min)
WaterLevel
inReservoir
(cm)
WaterLevel
Change(cm)
Rate of WaterLevel
Change,R1
(cm/min)
ReadingNumber Time Elapsed
Time
TimeInterval(min)
WaterLevel
inReservoir
(cm)
Water Level
Change(cm)
Rate of WaterLevel
Change,R2
(cm/min)
1 0 0:00:00 0.0 28.50 0.00 0.000 1 0 0:00:00 0.0 36.80 0.00 0.0002 1 0:01:00 1.0 29.30 0.80 0.800 2 0.5 0:00:30 0.5 39.00 2.20 4.4003 2 0:02:00 1.0 30.00 0.70 0.700 3 1 0:01:00 0.5 41.00 2.00 4.0004 3 0:03:00 1.0 30.80 0.80 0.800 4 2 0:02:00 1.0 44.60 3.60 3.6005 5 0:05:00 2.0 32.30 1.50 0.750 5 3 0:03:00 1.0 47.80 3.20 3.2006 7 0:07:00 2.0 34.00 1.70 0.850 6 4 0:04:00 1.0 51.00 3.20 3.2007 9 0:09:00 2.0 35.40 1.40 0.700 7 5 0:05:00 1.0 53.80 2.80 2.8008 11 0:11:00 2.0 37.10 1.70 0.850 8 6 0:06:00 1.0 56.80 3.00 3.000
Reservoir(s) used:Head =
Dominant Soil Type:Test No:
Location:Date:
JMCT#4_5August 9, 2008 Depth of Well Hole:
Tension Infiltrometer attachment used.
CT#4_5
Head =
Guelph Infiltrometer Calculation Sheet
Reservoir(s) used:
6Compacted glacial till
Investigator:
9 12 0:12:00 1.0 37.80 0.70 0.700 9 7 0:07:00 1.0 59.60 2.80 2.80010 13 0:13:00 1.0 38.50 0.70 0.700 10 8 0:08:00 1.0 62.30 2.70 2.70011 1112 1213 1314 1415 1516 1617 1718 1819 1920 2021 2122 2223 2324 2425 25
0.761 2.825
cm/sSaturated Hydraulic Conductivity, Ks =
Steady rate for three consecutive readings (R1) Steady rate for three consecutive readings (R2)
8.62E-04

-113 mm -50 mmINNER INNER
ReadingNumber Time Elapsed
Time
TimeInterval(min)
WaterLevel
inReservoir
(cm)
WaterLevel
Change(cm)
Rate of WaterLevel
Change,R1
(cm/min)
ReadingNumber Time Elapsed
Time
TimeInterval(min)
WaterLevel
inReservoir
(cm)
Water Level
Change(cm)
Rate of WaterLevel
Change,R2
(cm/min)
1 10:25 26.90 1 11:08 26.42 10:30 0:05:00 0:05:00 28.00 1.10 0.22 2 11:16 0:08:00 0:08:00 28.6 2.20 0.273 10:40 0:15:00 0:10:00 30.20 2.20 0.22 3 11:20 0:12:00 0:04:00 29.7 1.10 0.284 10:55 0:30:00 0:15:00 33.30 3.10 0.21 4 11:30 0:22:00 0:10:00 32.6 2.90 0.295 11:05 0:40:00 0:10:00 35.60 2.30 0.23 5 11:40 0:32:00 0:10:00 35.5 2.90 0.296 6 11:50 0:42:00 0:10:00 38.4 2.90 0.297 7
Tension Infiltrometer attachment used.
Guelph Infiltrometer Calculation Sheet CT#4_6
Location: CT#4_6 Investigator: JMDate:
Dominant Soil Type: Glacial Till
Head = Head =
aug 10 2008 Depth of Well Hole:Test No: 7a
Reservoir(s) used: Reservoir(s) used:
7 78 89 910 1011 1112 1213 1314 1415 1516 1617 1718 1819 1920 2021 2122 2223 2324 2425 25
0.219 0.290
cm/sSaturated Hydraulic Conductivity, Ks = 1.05E-05
Steady rate for three consecutive readings (R1) Steady rate for three consecutive readings (R2)

-99 mm -47 mmINNER INNER
ReadingNumber Time Elapsed
Time
TimeInterval(min)
WaterLevel
inReservoir
(cm)
WaterLevel
Change(cm)
Rate of WaterLevel
Change,R1
(cm/min)
ReadingNumber Time Elapsed
Time
TimeInterval(min)
WaterLevel
inReservoir
(cm)
Water Level
Change(cm)
Rate of WaterLevel
Change,R2
(cm/min)
1 12:36 27.40 1 13:12 28.902 12:40 0:04:00 0:04:00 30.40 3.00 0.75 2 13:13 0:01:00 0:01:00 31.70 2.80 2.803 12:47 0:11:00 0:07:00 35.00 4.60 0.66 3 13:14 0:02:00 0:01:00 34.20 2.50 2.504 12:55 0:19:00 0:08:00 40.10 5.10 0.64 4 13:15 0:03:00 0:01:00 36.50 2.30 2.305 13:00 0:24:00 0:05:00 43.10 3.00 0.60 5 13:16 0:04:00 0:01:00 38.90 2.40 2.406 13:05 0:29:00 0:05:00 46.10 3.00 0.60 6 13:17 0:05:00 0:01:00 40.90 2.00 2.007 13:10 0:34:00 0:05:00 49 10 3 00 0 60 7 13:18 0:06:00 0:01:00 43 20 2 30 2 30
Tension Infiltrometer attachment used.
Guelph Infiltrometer Calculation Sheet CT#4_7
Location: CT#4_7 Investigator: JMDate:
Dominant Soil Type: Glacial Till
Head = Head =
August 10, 2008 Depth of Well Hole:Test No: 7b
Reservoir(s) used: Reservoir(s) used:
7 13:10 0:34:00 0:05:00 49.10 3.00 0.60 7 13:18 0:06:00 0:01:00 43.20 2.30 2.308 8 13:20 0:08:00 0:02:00 46.90 3.70 1.859 9 13:21 0:09:00 0:01:00 48.60 1.70 1.7010 10 13:23 0:11:00 0:02:00 52.50 3.90 1.9511 11 13:25 0:13:00 0:02:00 56.00 3.50 1.7512 12 13:28 0:16:00 0:03:00 61.40 5.40 1.8013 13 13:30 0:18:00 0:02:00 64.70 3.30 1.6514 14 13:32 0:20:00 0:02:00 68.10 3.40 1.7015 15 13:34 0:22:00 0:02:00 71.10 3.00 1.5016 16 13:36 0:24:00 0:02:00 74.40 3.30 1.6517 17 13:37 0:25:00 0:01:00 75.90 1.50 1.5018 1819 1920 2021 2122 2223 2324 2425 25
0.600 1.600
cm/sSaturated Hydraulic Conductivity, Ks = 2.58E-04
Steady rate for three consecutive readings (R1) Steady rate for three consecutive readings (R2)

-47 mm -98 mmBOTH INNER
ReadingNumber Time Elapsed
Time
TimeInterval(min)
WaterLevel
inReservoir
(cm)
WaterLevel
Change(cm)
Rate of WaterLevel
Change,R1
(cm/min)
ReadingNumber Time Elapsed
Time
TimeInterval(min)
WaterLevel
inReservoir
(cm)
Water Level
Change(cm)
Rate of WaterLevel
Change,R2
(cm/min)
1 14:18 33.90 1 15:43 26.902 14:25 0:07:00 0:07:00 34.70 0.80 0.114 2 15:56 0:13:00 0:13:00 29.00 2.10 0.163 14:35 0:17:00 0:10:00 35.70 1.00 0.10 3 15:58 0:15:00 0:02:00 30.10 1.10 0.554 14:45 0:27:00 0:10:00 36.60 0.90 0.09 4 16:00 0:17:00 0:02:00 31.50 1.40 0.705 14:55 0:37:00 0:10:00 37.40 0.80 0.08 5 16:02 0:19:00 0:02:00 32.60 1.10 0.556 15:05 0:47:00 0:10:00 38.30 0.90 0.09 6 16:05 0:22:00 0:03:00 34.50 1.90 0.637 7 16:15 0:32:00 0:10:00 41 60 7 10 0 71
Tension Infiltrometer attachment used.
Guelph Infiltrometer Calculation Sheet CT#4_8
Location: CT#4_8 Investigator: JMDate:
Dominant Soil Type: Glacial Till
Head = Head =
August 10, 2008 Depth of Well Hole:Test No: 8
Reservoir(s) used: Reservoir(s) used:
7 7 16:15 0:32:00 0:10:00 41.60 7.10 0.718 8 16:20 0:37:00 0:05:00 45.00 3.40 0.689 9 16:25 0:42:00 0:05:00 48.70 3.70 0.7410 10 16:32 0:49:00 0:07:00 54.30 5.60 0.8011 11 16:40 0:57:00 0:08:00 60.30 6.00 0.7512 12 16:45 1:02:00 0:05:00 64.20 3.90 0.7813 13 16:50 1:07:00 0:05:00 68.30 4.10 0.8214 1415 1516 1617 1718 1819 1920 2021 2122 2223 2324 2425 25
0.087 0.778
cm/sSaturated Hydraulic Conductivity, Ks = 1.32E-04
Steady rate for three consecutive readings (R1) Steady rate for three consecutive readings (R2)

-48 mm -105 mmBOTH INNER
ReadingNumber Time Elapsed
Time
TimeInterval(min)
WaterLevel
inReservoir
(cm)
WaterLevel
Change(cm)
Rate of WaterLevel
Change,R1
(cm/min)
ReadingNumber Time Elapsed
Time
TimeInterval(min)
WaterLevel
inReservoir
(cm)
Water Level
Change(cm)
Rate of WaterLevel
Change,R2
(cm/min)
1 17:13 - - 32.20 1 18:02 28.202 17:25 12' 12.0 35.10 2.90 0.240 2 18:05 2'30" 2.5 32.00 3.80 1.5203 17:35 22' 10.0 36.70 1.60 0.160 3 18:07 4'30" 2.0 35.70 3.70 1.8504 17:45 32' 10.0 38.20 1.50 0.150 4 18:10 7'30" 3.0 40.90 5.20 1.7305 17:50 37' 5.0 39.00 0.80 0.160 5 18:13 10'30" 3.0 46.10 5.20 1.7306 6 18:16 13'30" 3.0 51.30 5.20 1.7307 7 18:19 16'30" 3 0 56 40 5 10 1 700
Location: L#2_1 Investigator: JM
Guelph Infiltrometer Calculation Sheet L#2_1
Date: August 11, 2008 Depth of Well Hole:Tension Infiltrometer attachment used.
Test No: 14Dominant Soil Type: Compacted till
Head = Head = Reservoir(s) used: Reservoir(s) used:
7 7 18:19 16'30" 3.0 56.40 5.10 1.7008 89 910 1011 1112 1213 1314 1415 1516 1617 1718 1819 1920 2021 2122 2223 2324 2425 25
0.157 1.723
cm/s
Steady rate for three consecutive readings (R1) Steady rate for three consecutive readings (R2)
Saturated Hydraulic Conductivity, Ks = 1.42E-04

Appendix C.2 Ring Infiltrometer Field Data Sheets

Location: Vangorda Waste Rock Dump Inner Diameter of Ring: 59 cmDate: 12-Aug-08 Inner Area of Ring: 2734.0 cm2
Test-Pit-No: CT#2A-1 (NW) Lateral Divergence: 5 cmOperator: JM Depth of Wetting Front: 15 cm
Water Entry Value: -1.5 cmAverage Depth of Water in Ring: 8.8 cm
Reference head: 22.2 cm
No. Time t Δt Time Elapsed Level reading Water levelChange in
Water LevelInfiltration
Ratedd/mm/yy hh:mm min min cm cm cm cm/hr
1 12/08/2008 11:13 11.5 10.712/08/2008 14:54 221 221 15.6 6.6 4.1 1.11
2 12/08/2008 14:5412/08/2008 18:36 222 443 17.5 4.7 1.9 0.51
3 12/08/2008 18:3613/08/08 9:15 879 1322 N/A
4
5 13/08/2008 9:30 8.8 13.413/08/08 13:22 232 232 13.5 8.7 4.7 1.22
6 13/08/08 13:2214/08/08 9:15 1193 1425 N/A
7
8
9
10
Average Infiltration Rate: 0.95 cm/hrInfiltration Rate (account for lateral divergence): 0.69 cm/hr
Effective Saturated Hydraulic Conductivity Kfs: 1.53E-04 cm/sec
Ring Infiltrometer Calculation Sheet

Location: Vangorda Waste Rock Dump Inner Diameter of Ring: 59 cmDate: 12-Aug-08 Inner Area of Ring: 2734.0 cm2
Test-Pit-No: CT#2A_2 (MID) Lateral Divergence: 5 cmOperator: JM Depth of Wetting Front: 15 cm
Water Entry Value: -1.5 cmAverage Depth of Water in Ring: 10.3 cm
Reference head: 25.7 cm
No. Time t Δt Time Elapsed Level reading Water levelChange in
Water LevelInfiltration
Ratedd/mm/yy hh:mm min min cm cm cm cm/hr
1 12/08/2008 11:20 14.0 11.712/08/2008 14:55 215 215 15.7 10.0 1.7 0.47
2 12/08/2008 14:5512/08/2008 18:38 223 438 19.2 6.5 3.5 0.94
3 12/08/2008 18:3813/08/08 9:13 875 1313 N/A
4
5 13/08/2008 9:30 9.7 16.013/08/08 13:21 231 231 12.5 13.2 2.8 0.73
6 13/08/08 13:2114/08/08 9:15 1194 1425 21.3 4.4 8.8 0.44
7
8
9
10
Average Infiltration Rate: 0.65 cm/hrInfiltration Rate (account for lateral divergence): 0.47 cm/hr
Effective Saturated Hydraulic Conductivity Kfs: 9.70E-05 cm/sec
Ring Infiltrometer Calculation Sheet

Location: Vangorda Waste Rock Dump Inner Diameter of Ring: 59 cmDate: August 12,2008 Inner Area of Ring: 2734.0 cm2
Test-Pit-No: CT#2A_3 (SW) Lateral Divergence: 5 cmOperator: JM Depth of Wetting Front: 15 cm
Water Entry Value: -1.5 cmAverage Depth of Water in Ring: 9.2 cm
Reference head: 21 cm
No. Time t Δt Time Elapsed Level reading Water levelChange in
Water LevelInfiltration
Ratedd/mm/yy hh:mm min min cm cm cm cm/hr
1 12/08/2008 11:34 8.5 12.512/08/2008 14:56 202 202 11.5 9.5 3.0 0.89
2 12/08/2008 14:5612/08/2008 18:39 223 425 13.4 7.6 1.9 0.51
3 12/08/2008 18:3913/08/08 9:12 873 1298 18.5 2.5 5.1 0.35
4
5 13/08/2008 9:30 7.0 14.013/08/08 13:21 231 231 9.0 12.0 2.0 0.52
6 13/08/08 13:2114/08/08 9:15 1194 1425 15.0 6.0 6.0 0.30
7
8
9
10
Average Infiltration Rate: 0.51 cm/hrInfiltration Rate (account for lateral divergence): 0.38 cm/hr
Effective Saturated Hydraulic Conductivity Kfs: 8.19E-05 cm/sec
Ring Infiltrometer Calculation Sheet

Location: Vangorda Waste Rock Dump Inner Diameter of Ring: 59 cmDate: 09-Aug-08 Inner Area of Ring: 2734.0 cm2
Test-Pit-No: CT#2B_1 (SE) Lateral Divergence: 5 cmOperator: JM Depth of Wetting Front: 15 cm
Water Entry Value: -1.5 cmAverage Depth of Water in Ring: 12.5 cm
Reference head: 20 cm
No. Time t Δt Time Elapsed Level reading Water levelChange in
Water LevelInfiltration
Ratedd/mm/yy hh:mm min min cm cm cm cm/hr
1 08/09/2008 10:23 6.5 13.508/09/2008 15:41 318 318 6.5 13.5 0.0 0.00
2 08/09/2008 15:4108/09/2008 19:48 247 565 6.8 13.2 0.3 0.07
3 08/09/2008 19:4810/08/2008 9:56 -42352 -41787 7.5 12.5 0.7 0.00
4 10/08/2008 9:5610/08/2008 14:31 275 -41512 7.7 12.3 0.2 0.04
5 10/08/2008 14:3110/08/2008 17:29 178 -41334 8.0 12.0 0.3 0.10
6 10/08/2008 17:2910/08/2008 19:58 149 -41185 8.2 11.8 0.2 0.08
7 10/08/2008 19:5811/08/2008 8:52 774 -40411 8.8 11.2 0.6 0.05
8
9
10
Average Infiltration Rate: 0.05 cm/hrInfiltration Rate (account for lateral divergence): 0.04 cm/hr
Effective Saturated Hydraulic Conductivity Kfs: 6.65E-06 cm/sec
Ring Infiltrometer Calculation Sheet

Location: Vangorda Waste Rock Dump Inner Diameter of Ring: 59 cmDate: 09-Aug-08 Inner Area of Ring: 2734.0 cm2
Test-Pit-No: CT#2B_2 (NE) Lateral Divergence: 5 cmOperator: JM Depth of Wetting Front: 15 cm
Water Entry Value: -1.5 cmAverage Depth of Water in Ring: 13.2 cm
Reference head: 17 cm
No. Time t Δt Time Elapsed Level reading Water levelChange in
Water LevelInfiltration
Ratedd/mm/yy hh:mm min min cm cm cm cm/hr
1 08/09/2008 10:22 3.5 13.508/09/2008 15:42 320 320 3.5 13.5 0.0 0.00
2 08/09/2008 15:4208/09/2008 19:47 245 565 3.5 13.5 0.0 0.00
3 08/09/2008 19:4710/08/2008 9:55 -42352 -41787 4.0 13.0 0.5 0.00
4 10/08/2008 9:5510/08/2008 14:32 277 -41510 3.5 13.5 -0.5 -0.11
5 10/08/2008 14:3210/08/2008 17:27 175 -41335 4.0 13.0 0.5 0.17
6 10/08/2008 17:2710/08/2008 19:57 150 -41185 4.2 12.8 0.2 0.08
7 10/08/2008 19:5711/08/2008 8:59 782 -40403 4.5 12.5 0.3 0.02
8
9
10
Average Infiltration Rate: 0.02 cm/hrInfiltration Rate (account for lateral divergence): 0.02 cm/hr
Effective Saturated Hydraulic Conductivity Kfs: 3.11E-06 cm/sec
Ring Infiltrometer Calculation Sheet

Location: Vangorda Waste Rock Dump Inner Diameter of Ring: 59 cmDate: 12-Aug-08 Inner Area of Ring: 2734.0 cm2
Test-Pit-No: CT#2B_3 (NW) Lateral Divergence: 5 cmOperator: JM Depth of Wetting Front: 15 cm
Water Entry Value: -1.5 cmAverage Depth of Water in Ring: 8.6 cm
Reference head: 21.5 cm
No. Time t Δt Time Elapsed Level reading Water levelChange in
Water LevelInfiltration
Ratedd/mm/yy hh:mm min min cm cm cm cm/hr
1 12/08/2008 11:56 11.2 10.312/08/2008 14:53 177 177 15.0 6.5 3.8 1.29
2 12/08/2008 14:5312/08/2008 18:35 222 399 16.3 5.2 1.3 0.35
3 12/08/2008 18:3513/08/08 9:40 905 1304 N/A
4
5 13/08/08 9:45 8 13.513/08/08 13:23 218 218 10.0 11.5 2.0 0.55
6 13/08/08 13:2314/08/08 9:15 1192 1410 17.0 4.5 7.0 0.35
7
8
9
10
Average Infiltration Rate: 0.64 cm/hrInfiltration Rate (account for lateral divergence): 0.46 cm/hr
Effective Saturated Hydraulic Conductivity Kfs: 1.04E-04 cm/sec
Ring Infiltrometer Calculation Sheet

Location: Vangorda Waste Rock Dump Inner Diameter of Ring: 59 cmDate: 12-Aug-08 Inner Area of Ring: 2734.0 cm2
Test-Pit-No: CT#2B_4 (SE) Lateral Divergence: 5 cmOperator: JM Depth of Wetting Front: 15 cm
Water Entry Value: -1.5 cmAverage Depth of Water in Ring: 6.8 cm
Reference head: 22.3 cm
No. Time t Δt Time Elapsed Level reading Water levelChange in
Water LevelInfiltration
Ratedd/mm/yy hh:mm min min cm cm cm cm/hr
1 12/08/2008 12:00 13.0 9.312/08/2008 14:52 172 172 15.5 6.8 2.5 0.87
2 12/08/2008 14:5212/08/2008 18:34 222 394 16.5 5.8 1.0 0.27
3 12/08/2008 18:3413/08/08 9:40 906 1300 19.2 3.1 2.7 0.18
4
5 13/08/2008 9:45 13.1 9.213/08/08 13:24 219 219 14.0 8.3 0.9 0.25
6 13/08/08 13:2414/08/08 9:15 1191 1410 17.3 5.0 3.3 0.17
7
8
9
10
Average Infiltration Rate: 0.35 cm/hrInfiltration Rate (account for lateral divergence): 0.25 cm/hr
Effective Saturated Hydraulic Conductivity Kfs: 6.29E-05 cm/sec
Ring Infiltrometer Calculation Sheet

Location: Vangorda Waste Rock Dump Inner Diameter of Ring: 59 cmDate: 08-Aug-08 Inner Area of Ring: 2734.0 cm2
Test-Pit-No: CT#4_1 (SW) Lateral Divergence: 10 cmOperator: JM Depth of Wetting Front: 15 cm
Water Entry Value: -1.5 cmAverage Depth of Water in Ring: 12.0 cm
Reference head: 23 cm
No. Time t Δt Time Elapsed Level reading Water levelChange in
Water LevelInfiltration
Ratedd/mm/yy hh:mm min min cm cm cm cm/hr
1 08/08/2008 10:50 6.5 16.508/08/2008 14:20 210 210 7.6 15.4 1.1 0.31
2 08/08/2008 14:2008/08/2008 17:16 176 386 8.5 14.5 0.9 0.31
3 08/08/2008 17:1608/08/2008 19:58 162 548 9.0 14.0 0.5 0.19
4 08/08/2008 19:5809/08/2008 9:06 788 1336 11.2 11.8 2.2 0.17
5 09/08/2008 9:0609/08/2008 15:34 388 1724 12.2 10.8 1.0 0.15
6 09/08/2008 15:3409/08/2008 19:54 260 1984 13.0 10.0 0.8 0.18
7 09/08/2008 19:5410/08/2008 9:46 832 2816 14.8 8.2 1.8 0.13
8 10/08/2008 9:4610/08/2008 14:22 276 3092 16.0 7.0 1.2 0.26
9
10
Average Infiltration Rate: 0.21 cm/hrInfiltration Rate (account for lateral divergence): 0.12 cm/hr
Effective Saturated Hydraulic Conductivity Kfs: 2.91E-05 cm/sec
Ring Infiltrometer Calculation Sheet

Location: Vangorda Waste Rock Dump Inner Diameter of Ring: 59 cmDate: 08-Aug-08 Inner Area of Ring: 2734.0 cm2
Test-Pit-No: CT#4_2 (SE) Lateral Divergence: 5 cmOperator: JM Depth of Wetting Front: 15 cm
Water Entry Value: -1.5 cmAverage Depth of Water in Ring: 12.0 cm
Reference head: 16 cm
No. Time t Δt Time Elapsed Level reading Water levelChange in
Water LevelInfiltration
Ratedd/mm/yy hh:mm min min cm cm cm cm/hr
1 08/08/2008 11:15 1.8 14.208/08/2008 14:20 185 185 2.0 14.0 0.2 0.06
2 08/08/2008 14:2008/08/2008 17:15 175 360 2.3 13.7 0.3 0.10
3 08/08/2008 17:1508/08/2008 19:56 161 521 2.5 13.5 0.2 0.07
4 08/08/2008 19:5609/08/2008 9:05 789 1310 3.7 12.3 1.2 0.09
5 09/08/2008 9:0509/08/2008 15:32 387 1697 4.2 11.8 0.5 0.08
6 09/08/2008 15:3209/08/2008 19:54 262 1959 4.5 11.5 0.3 0.07
7 09/08/2008 19:5410/08/2008 9:48 834 2793 5.5 10.5 1.0 0.07
8 10/08/2008 9:4810/08/2008 14:21 273 3066 5.9 10.1 0.4 0.09
9 10/08/2008 14:2111/08/2008 9:09 1128 4194 7.7 8.3 1.8 0.10
10
Average Infiltration Rate: 0.08 cm/hrInfiltration Rate (account for lateral divergence): 0.06 cm/hr
Effective Saturated Hydraulic Conductivity Kfs: 1.13E-05 cm/sec
Ring Infiltrometer Calculation Sheet

Location: Vangorda Waste Rock Dump Inner Diameter of Ring: 59 cmDate: 08-Aug-08 Inner Area of Ring: 2734.0 cm2
Test-Pit-No: CT#4_3 (MID) Lateral Divergence: 5 cmOperator: JM Depth of Wetting Front: 15 cm
Water Entry Value: -1.5 cmAverage Depth of Water in Ring: 6.4 cm
Reference head: 20 cm
No. Time t Δt Time Elapsed Level reading Water levelChange in
Water LevelInfiltration
Ratedd/mm/yy hh:mm min min cm cm cm cm/hr
1 08/08/2008 11:40 11.0 9.008/08/2008 14:21 161 161 11.2 8.8 0.2 0.07
2 08/08/2008 14:2108/08/2008 17:18 177 338 11.5 8.5 0.3 0.10
3 08/08/2008 17:1808/08/2008 20:00 162 500 12.0 8.0 0.5 0.19
4 08/08/2008 20:0009/08/2008 9:07 787 1287 13.4 6.6 1.4 0.11
5 09/08/2008 9:0709/08/2008 15:35 388 1675 14.0 6.0 0.6 0.09
6 09/08/2008 15:3509/08/2008 19:53 258 1933 14.2 5.8 0.2 0.05
7 09/08/2008 19:5310/08/2008 9:49 836 2769 15.7 4.3 1.5 0.11
8 10/08/2008 9:4910/08/2008 14:20 271 3040 15.4 4.6 -0.3 -0.07
9 10/08/2008 14:2011/08/2008 2:20 720 3760 18.0 2.0 2.6 0.22
10
Average Infiltration Rate: 0.10 cm/hrInfiltration Rate (account for lateral divergence): 0.07 cm/hr
Effective Saturated Hydraulic Conductivity Kfs: 1.79E-05 cm/sec
Ring Infiltrometer Calculation Sheet

Location: Vangorda Waste Rock Dump Inner Diameter of Ring: 59 cmDate: 08-Aug-08 Inner Area of Ring: 2734.0 cm2
Test-Pit-No: CT#4_4 (NE) Lateral Divergence: 5 cmOperator: JM Depth of Wetting Front: 15 cm
Water Entry Value: -1.5 cmAverage Depth of Water in Ring: 17.9 cm
Reference head: 23 cm
No. Time t Δt Time Elapsed Level reading Water levelChange in
Water LevelInfiltration
Ratedd/mm/yy hh:mm min min cm cm cm cm/hr
1 08/08/2008 12:00 3.5 19.508/08/2008 14:24 144 144 3.5 19.5 0.0 0.00
2 08/08/2008 14:2408/08/2008 17:20 176 320 3.5 19.5 0.0 0.00
3 08/08/2008 17:2008/08/2008 20:01 161 481 4.0 19.0 0.5 0.19
4 08/08/2008 20:0109/08/2008 9:09 788 1269 4.8 18.2 0.8 0.06
5 09/08/2008 9:0909/08/2008 15:36 387 1656 5.2 17.8 0.4 0.06
6 09/08/2008 15:3609/08/2008 19:52 256 1912 5.7 17.3 0.5 0.12
7 09/08/2008 19:5210/08/2008 9:50 838 2750 6.4 16.6 0.7 0.05
8 10/08/2008 9:5010/08/2008 14:23 273 3023 6.6 16.4 0.2 0.04
9 10/08/2008 14:2311/08/2008 9:20 1137 4160 8.1 14.9 1.5 0.08
10
Average Infiltration Rate: 0.07 cm/hrInfiltration Rate (account for lateral divergence): 0.05 cm/hr
Effective Saturated Hydraulic Conductivity Kfs: 7.28E-06 cm/sec
Ring Infiltrometer Calculation Sheet

Location: Vangorda Waste Rock Dump Inner Diameter of Ring: 59 cmDate: 08-Aug-08 Inner Area of Ring: 2734.0 cm2
Test-Pit-No: CT#4_5 (NW) Lateral Divergence: 5 cmOperator: JM Depth of Wetting Front: 15 cm
Water Entry Value: -1.5 cmAverage Depth of Water in Ring: 4.3 cm
Reference head: 18 cm
No. Time t Δt Time Elapsed Level reading Water levelChange in
Water LevelInfiltration
Ratedd/mm/yy hh:mm min min cm cm cm cm/hr
1 08/08/2008 11:41 12.0 6.008/08/2008 14:23 162 162 12.0 6.0 0.0 0.00
2 08/08/2008 14:2308/08/2008 17:19 176 338 12.5 5.5 0.5 0.17
3 08/08/2008 17:1908/08/2008 20:01 162 500 12.5 5.5 0.0 0.00
4 08/08/2008 20:0109/08/2008 9:08 787 1287 13.5 4.5 1.0 0.08
5 09/08/2008 9:0809/08/2008 15:35 387 1674 14.0 4.0 0.5 0.08
6 09/08/2008 15:3509/08/2008 19:51 256 1930 14.2 3.8 0.2 0.05
7 09/08/2008 19:5110/08/2008 9:49 838 2768 14.6 3.4 0.4 0.03
8 10/08/2008 9:4910/08/2008 14:23 274 3042 15.0 3.0 0.4 0.09
9 10/08/2008 14:2311/08/2008 9:19 1136 4178 16.5 1.5 1.5 0.08
10
Average Infiltration Rate: 0.06 cm/hrInfiltration Rate (account for lateral divergence): 0.05 cm/hr
Effective Saturated Hydraulic Conductivity Kfs: 1.34E-05 cm/sec
Ring Infiltrometer Calculation Sheet

Location: Vangorda Waste Rock Dump Inner Diameter of Ring: 59 cmDate: 12-Aug-08 Inner Area of Ring: 2734.0 cm2
Test-Pit-No: CT#4_6 (NW) Lateral Divergence: 5 cmOperator: JM Depth of Wetting Front: 15 cm
Water Entry Value: -1.5 cmAverage Depth of Water in Ring: 10.1 cm
Reference head: 18.4 cm
No. Time t Δt Time Elapsed Level reading Water levelChange in
Water LevelInfiltration
Ratedd/mm/yy hh:mm min min cm cm cm cm/hr
1 12/08/2008 10:39 5.3 13.112/08/2008 15:04 265 265 7.0 11.4 1.7 0.38
2 12/08/2008 15:0412/08/2008 18:31 207 472 8.5 9.9 1.5 0.43
3 12/08/2008 18:3113/08/2008 9:00 869 1341 11.6 6.8 3.1 0.21
4
5 13/08/2008 9:05 6.0 12.413/08/2008 13:28 263 1604 7.5 10.9 1.5 0.34
6 13/08/2008 13:2814/08/2008 9:20 1192 2796 12.4 6.0 4.9 0.25
7
8
9
10
Average Infiltration Rate: 0.32 cm/hrInfiltration Rate (account for lateral divergence): 0.24 cm/hr
Effective Saturated Hydraulic Conductivity Kfs: 4.93E-05 cm/sec
Ring Infiltrometer Calculation Sheet

Location: Vangorda Waste Rock Dump Inner Diameter of Ring: 59 cmDate: 12-Aug-08 Inner Area of Ring: 2734.0 cm2
Test-Pit-No: CT#4_7 (SW) Lateral Divergence: 5 cmOperator: JM Depth of Wetting Front: 15 cm
Water Entry Value: -1.5 cmAverage Depth of Water in Ring: 7.8 cm
Reference head: 18 cm
No. Time t Δt Time Elapsed Level reading Water levelChange in
Water LevelInfiltration
Ratedd/mm/yy hh:mm min min cm cm cm cm/hr
1 12/08/2008 10:25 8.8 9.212/08/2008 15:05 280 280 10.4 7.6 1.6 0.34
2 12/08/2008 15:0512/08/2008 18:30 205 485 11.0 7.0 0.6 0.18
3 12/08/2008 18:3013/08/2008 9:01 871 1356 13.2 4.8 2.2 0.15
4
5 13/08/2008 9:05 7.5 10.513/08/2008 13:28 263 263 8.5 9.5 1.0 0.23
6 13/08/2008 13:2814/08/2008 9:20 1192 1455 12.0 6.0 3.5 0.18
7
8
9
10
Average Infiltration Rate: 0.21 cm/hrInfiltration Rate (account for lateral divergence): 0.16 cm/hr
Effective Saturated Hydraulic Conductivity Kfs: 3.68E-05 cm/sec
Ring Infiltrometer Calculation Sheet
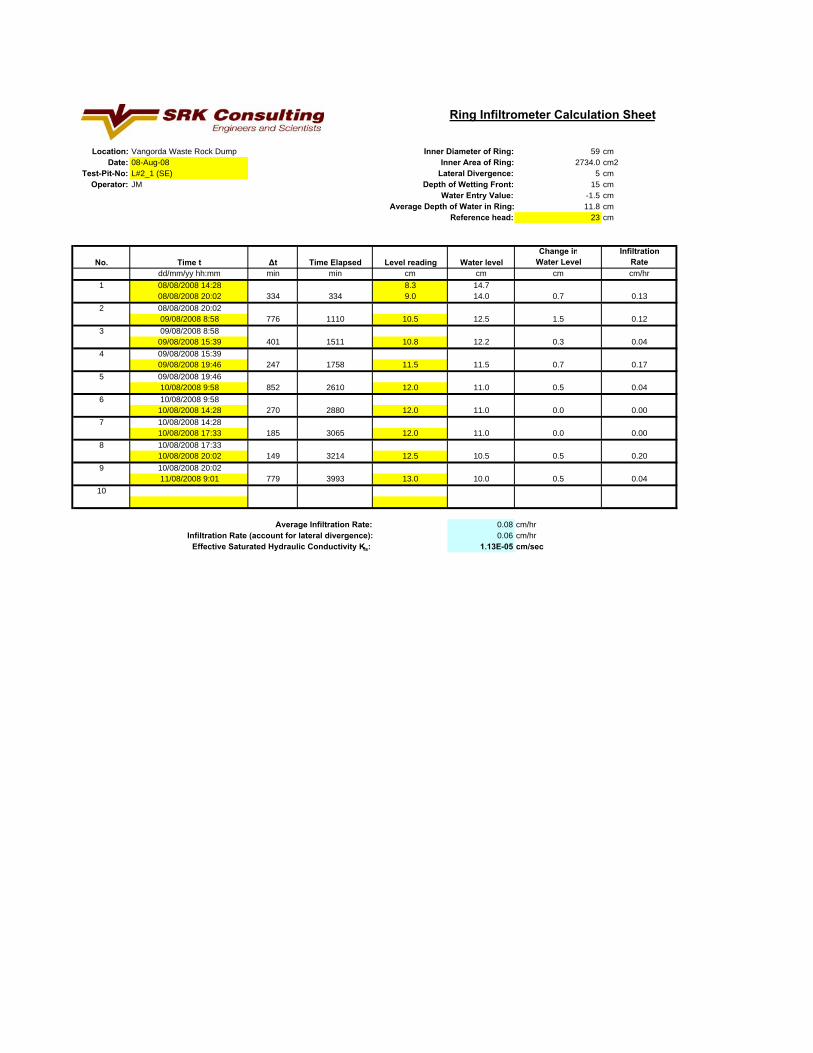
Location: Vangorda Waste Rock Dump Inner Diameter of Ring: 59 cmDate: 08-Aug-08 Inner Area of Ring: 2734.0 cm2
Test-Pit-No: L#2_1 (SE) Lateral Divergence: 5 cmOperator: JM Depth of Wetting Front: 15 cm
Water Entry Value: -1.5 cmAverage Depth of Water in Ring: 11.8 cm
Reference head: 23 cm
No. Time t Δt Time Elapsed Level reading Water levelChange in
Water LevelInfiltration
Ratedd/mm/yy hh:mm min min cm cm cm cm/hr
1 08/08/2008 14:28 8.3 14.708/08/2008 20:02 334 334 9.0 14.0 0.7 0.13
2 08/08/2008 20:0209/08/2008 8:58 776 1110 10.5 12.5 1.5 0.12
3 09/08/2008 8:5809/08/2008 15:39 401 1511 10.8 12.2 0.3 0.04
4 09/08/2008 15:3909/08/2008 19:46 247 1758 11.5 11.5 0.7 0.17
5 09/08/2008 19:4610/08/2008 9:58 852 2610 12.0 11.0 0.5 0.04
6 10/08/2008 9:5810/08/2008 14:28 270 2880 12.0 11.0 0.0 0.00
7 10/08/2008 14:2810/08/2008 17:33 185 3065 12.0 11.0 0.0 0.00
8 10/08/2008 17:3310/08/2008 20:02 149 3214 12.5 10.5 0.5 0.20
9 10/08/2008 20:0211/08/2008 9:01 779 3993 13.0 10.0 0.5 0.04
10
Average Infiltration Rate: 0.08 cm/hrInfiltration Rate (account for lateral divergence): 0.06 cm/hr
Effective Saturated Hydraulic Conductivity Kfs: 1.13E-05 cm/sec
Ring Infiltrometer Calculation Sheet

Location: Vangorda Waste Rock Dump Inner Diameter of Ring: 59 cmDate: 08-Aug-08 Inner Area of Ring: 2734.0 cm2
Test-Pit-No: L#2_2 (NW) Lateral Divergence: 5 cmOperator: JM Depth of Wetting Front: 15 cm
Water Entry Value: -1.5 cmAverage Depth of Water in Ring: 8.4 cm
Reference head: 19 cm
No. Time t Δt Time Elapsed Level reading Water levelChange in
Water LevelInfiltration
Ratedd/mm/yy hh:mm min min cm cm cm cm/hr
1 08/08/2008 14:26 6.0 13.008/08/2008 17:24 178 178 6.5 12.5 0.5 0.17
2 08/08/2008 17:2408/08/2008 20:04 160 338 7.0 12.0 0.5 0.19
3 08/08/2008 20:0409/08/2008 8:57 773 1111 9.6 9.4 2.6 0.20
4 09/08/2008 8:5709/08/2008 15:38 401 1512 10.5 8.5 0.9 0.13
5 09/08/2008 15:3809/08/2008 19:45 247 1759 11.0 8.0 0.5 0.12
6 09/08/2008 19:4510/08/2008 9:59 854 2613 12.3 6.7 1.3 0.09
7 10/08/2008 9:5910/08/2008 14:29 270 2883 13.0 6.0 0.7 0.16
8 10/08/2008 14:2910/08/2008 17:32 183 3066 13.0 6.0 0.0 0.00
9 10/08/2008 17:3210/08/2008 20:00 148 3214 13.3 5.7 0.3 0.12
10 10/08/2008 20:0011/08/2008 9:01 781 3995 14.0 5.0 0.7 0.05
Average Infiltration Rate: 0.12 cm/hrInfiltration Rate (account for lateral divergence): 0.09 cm/hr
Effective Saturated Hydraulic Conductivity Kfs: 2.04E-05 cm/sec
Ring Infiltrometer Calculation Sheet

Location: Vangorda Waste Rock Dump Inner Diameter of Ring: 59 cmDate: 12-Aug-08 Inner Area of Ring: 2734.0 cm2
Test-Pit-No: L#2_3 (SE) Lateral Divergence: 5 cmOperator: JM Depth of Wetting Front: 15 cm
Water Entry Value: -1.5 cmAverage Depth of Water in Ring: 9.0 cm
Reference head: 24 cm
No. Time t Δt Time Elapsed Level reading Water levelChange in
Water LevelInfiltration
Ratedd/mm/yy hh:mm min min cm cm cm cm/hr
1 12/08/2008 10:57 13.2 10.812/08/2008 14:57 240 240 14.8 9.2 1.6 0.40
2 12/08/2008 14:5712/08/2008 18:41 224 464 15.8 8.2 1.0 0.27
3 12/08/2008 18:4113/08/2008 9:08 867 1331 18.7 5.3 2.9 0.20
4
5 13/08/2008 9:12 12.3 11.713/08/08 13:21 249 249 13.5 10.5 1.2 0.29
6 13/08/08 13:2114/08/2008 9:18 1197 1446 16.7 7.3 3.2 0.16
7
8
9
10
Average Infiltration Rate: 0.26 cm/hrInfiltration Rate (account for lateral divergence): 0.19 cm/hr
Effective Saturated Hydraulic Conductivity Kfs: 4.23E-05 cm/sec
Ring Infiltrometer Calculation Sheet

Location: Vangorda Waste Rock Dump Inner Diameter of Ring: 59 cmDate: 12-Aug-08 Inner Area of Ring: 2734.0 cm2
Test-Pit-No: L#2_4 (NW) Lateral Divergence: 5 cmOperator: JM Depth of Wetting Front: 15 cm
Water Entry Value: -1.5 cmAverage Depth of Water in Ring: 8.7 cm
Reference head: 22.5 cm
No. Time t Δt Time Elapsed Level reading Water levelChange in
Water LevelInfiltration
Ratedd/mm/yy hh:mm min min cm cm cm cm/hr
1 12/08/2008 11:01 11.0 11.512/08/2008 14:58 237 237 12.8 9.7 1.8 0.46
2 12/08/2008 14:5812/08/2008 18:46 228 465 14.0 8.5 1.2 0.32
3 12/08/2008 18:4613/08/08 9:10 864 1329 17.5 5.0 3.5 0.24
4
5 13/08/2008 9:12 11.5 11.013/08/08 13:20 248 248 13.0 9.5 1.5 0.36
6 13/08/08 13:2014/08/08 9:18 1198 1446 17.0 5.5 4.0 0.20
7
8
9
10
Average Infiltration Rate: 0.32 cm/hrInfiltration Rate (account for lateral divergence): 0.23 cm/hr
Effective Saturated Hydraulic Conductivity Kfs: 5.15E-05 cm/sec
Ring Infiltrometer Calculation Sheet

Appendix D Field Measurements of In-Situ Density


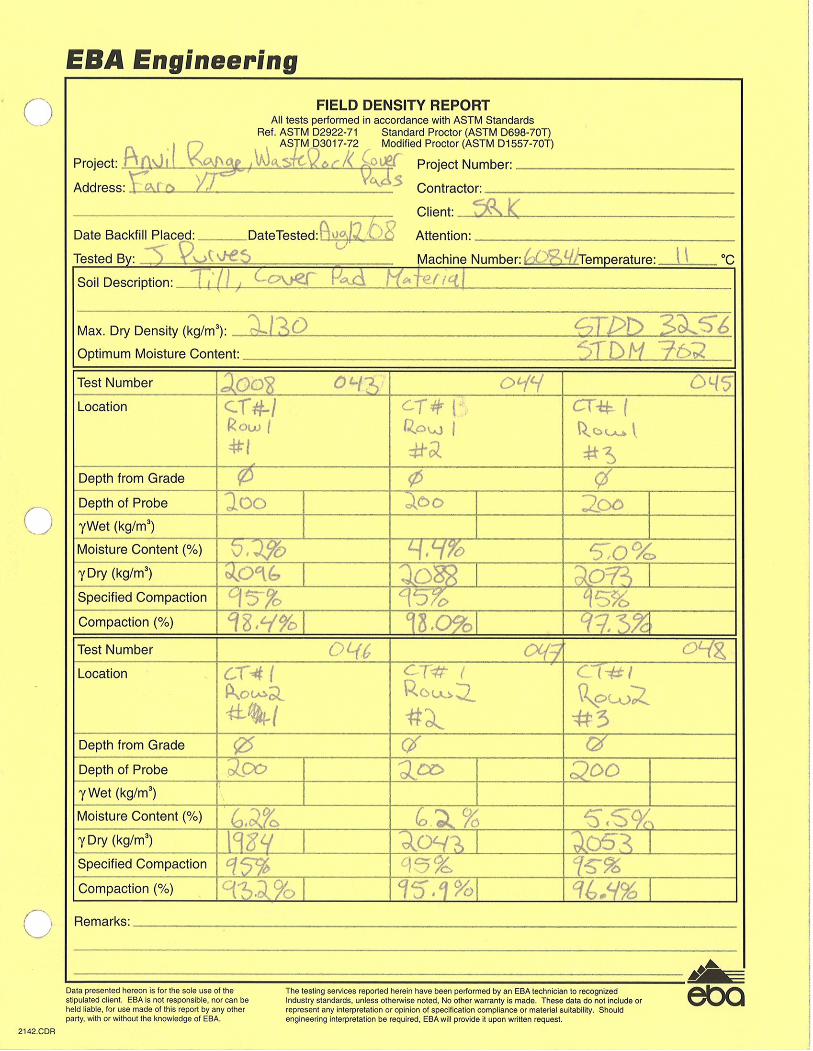
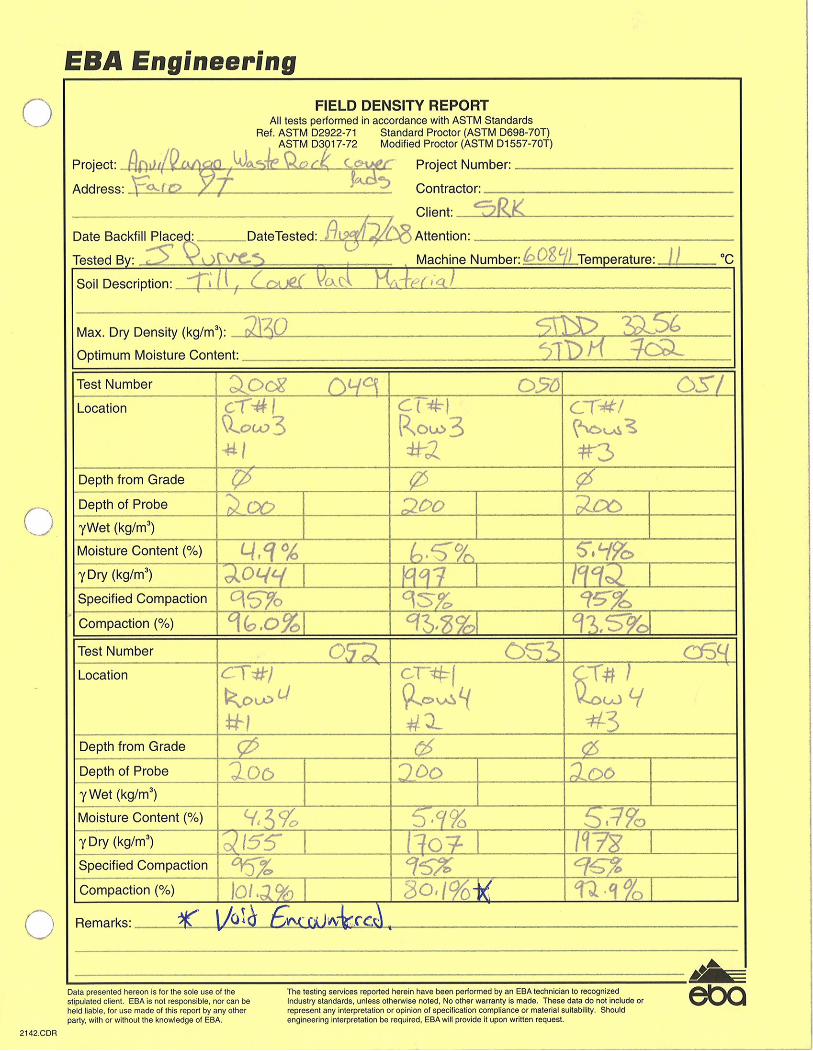


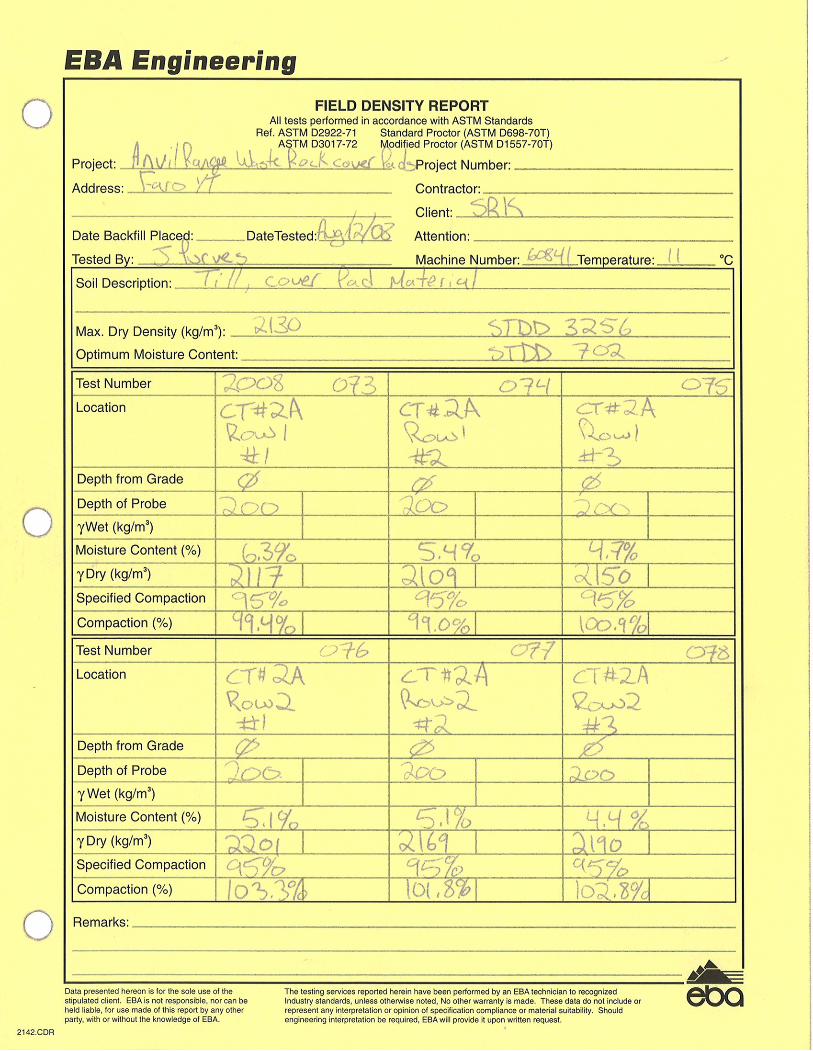


Appendix E 2008 Flow Monitoring System Upgrade

Appendix E Update of Flow Monitoring System Page 1 of 1
Faro_AppendixE_FlowMonitoringSystemUpgrade_1CY001.020_jm_rev01.doc SRK Consulting March 2009
1 Upgrade of the automated data collection system As observed during the 2006 monitoring season (SRK 2007), a significant amount of flow representing run-off was reporting to the flow meters through the drain pipes at very low flow rates (i.e. dripping). These volumes could not be measured by the SeaMetrics flow meters designed for a minimum flow rate of 0.19 L/second (www.seametrics.com). To correct the situation, an upgrade of the run-off monitoring system was included among the tasks to be performed under the 2007/08 Project 17a (Appendix A).
The upgrade was to consist of the installation of six tipping bucket flow gauges as backup low-flow monitoring devices, following the model of the existing interflow monitoring system. In August 2007 six Texas Electronics model TE525M tipping bucket flow gauges were acquired and installed on site on the outside of the Vangorda monitoring hut attached to the south wall of the hut. The flow gauges were designed for measuring rainfall, with resolution of 0.1 mm/tip and accuracy of 5% at a flow rate of 0.39 x 10⁻³ L/second, which insures adequate accuracy for the low flow conditions observed on site.
The 2 inch drainage pipes were re-routed from the inside of the monitoring hut in such way that each pipe intercepts the funnel of one flow gauge. A Tee with a branch diameter of ½ inch and a flow-through diameter of 2 inch was installed at the vertical of each tipping bucket flow gauge, and a short section of ½ inch pipe was attached to the Tee, making the connection between the drainage pipe and the funnel of the flow gauge, to reduce splashing. In this way, at low flow the water would be dripping through the pipe into the funnel, and at high flow the excess water (which can not drain through the ½ inch pipe) would simply discharge straight from the 2 inch PVC drainage pipe after the volume was measured by the SeaMetrics flow meter.
The automated data collection was resolved by employing a Campbell Scientific SDM-SW8A device that allows the simultaneous monitoring of up to 8 tipping bucket flow gauges using one single control port of CR10X #1 data logger. The six TE525 flow gauges were connected to channels 1 through 6 of the SDM device, and the remaining channels were occupied by transferring two of the existing tipping bucket flow gauges (TBR#1 and TBR#2 measuring interflow) from CR10X #2. The total number of channels will be expanded to 15 in 2008 by installing a second SDM-SW8A device in parallel to the first one (15 will be the final number of tipping bucket flow gauges after the monitoring instruments of the lysimeter test will be installed in 2008). The shortcoming of using SDM devices to monitor flow is the fact that flow events are recorded as total flow at a 30 minutes resolution rather than instantaneously (as in the case of flow gauges connected directly to data loggers).
As part of streamlining the automated data collection, the connections of the CS229 Thermal Conductivity sensors pertaining to CT#2A and CT#2B were transferred from CR10X #1 to CR10X #2. The programs controlling data collection and processing by the CR10X data loggers were modified to reflect the changes in the structure and order of the monitored instruments. Monitoring data was collected according to the new structure staring with August 30, 2007.

Appendix F Field Diagnostic Data Sheets

y yy y
DNR DNRSpecial Comments:
y yy y
DNR DNRn/a n/a
y yy yy yy yy yy yy yy yy y
ySpecial Comments:
y
String #1: y String #3: yString #2: y String #4: y
Special Comments:
y
E-mail: yFax:
Special Comments:
Data successfully downloaded:Manual readings taken on:
Diviner 2000 Data Logger (Manual Moisture Content Probe)
Data successfully downloaded:
Has the daily flow check data been attached:
Lakewood Systems Data Logger (Thermistors on Grum O/B Dump)
CT#3A-I (DL#5):CT#3B (DL#6):
CT#3B-I (DL#7):CT#4 (DL#8):
Special Comments:
Seametrics Data Loggers (Flowmeters in Monitoring Hut) Data successfully downloaded Battery O.K.
CT#4-I (DL#9):
Data successfully downloaded:
Solar panel feed voltage if <11v Solar panel feed voltage if <11v
Campbell Scientific CR10X Data Loggers (Located in Monitoring Hut)CR10X-1 CR10X-2
Console battery voltage:Weather Station 2A/2B appears to be missing outside weather parameters,
10-Jun-08
perhaps radio communication not working
Downloaded by:
Davis Instruments Data Loggers (Weather Stations on CT#1 and CT#2A/2B)CT#1 CT#2A/2B
Tailings Trial Cover Survey (Rose Creek Tailings)
Data successfully downloaded:
Data successfully downloaded: Data successfully downloaded:
Date and Time:
Date completed:
Battery Voltage:
Diagnostic test run: Diagnostic test run:Diagnostic test results: Diagnostic test results:
Console battery voltage:
Thermistors Read on June 11, 2008
Diagnostic test run: Diagnostic test run:Diagnoistic Test Results: Diagnoistic Test Results:
Battery Voltage:
CT#1 (DL#1):CT#2A (DL32):CT#2B (DL#3):CT#3A (DL#4):
Special Comments:
SRK Consulting
for Maritz Rykaart
Chris Croy Mike Brewer Lovejoy FultonJune 10, 2008 8:30AM
Completed by: Chris Croy Mike Brewer Lovejoy FultonSurvey Data Forwarded Via:
ARMC Waste Rock and Tailings Trial Covers- Information Data Sheet

y yy y
3.35 V 3.36 VSpecial Comments:
CR10X-1 CR10X-2 CR1000y y yy y y
14.21 V 13.69 V 12.42 Vn/a n/a n/a
y yy yy yy yy yy yy yy yy y
Special Comments:
y
String #1: y String #3: yString #2: y String #4: y
Special Comments:
y
E-mail:Fax:
SRK Consulting
for Jozsef Miskolczi
Chris Croy Mike Brewer Lovejoy Fulton18/06/2008 9:30:00AM
Completed by:
Date and Time:Downloaded by:
Davis Instruments Data Loggers (Weather Stations on CT#1 and CT#2A/2B)
Special Comments:
Survey Data Forwarded Via:
Console battery voltage:
Data successfully downloaded:
Tailings Trial Cover Survey (Rose Creek Tailings)Date completed:
CT#1 (DL#1):CT#2A (DL32):
ARMC Waste Rock and Tailings Trial Covers- Information Data Sheet
Diagnostic test run:Diagnoistic Test Results:
Battery Voltage:
Data successfully downloaded: Data successfully downloaded:CT#1 CT#2A/2B
Campbell Scientific CR10X Data Loggers (Located in Monitoring Hut)
Diagnostic test run: Diagnostic test run:Diagnostic test results: Diagnostic test results:
Console battery voltage:
Data successfully downloaded Battery O.K.
Solar panel feed voltage if <11vSpecial Comments:
Seametrics Data Loggers (Flowmeters in Monitoring Hut)
CT#3B-I (DL#7):CT#4 (DL#8):
CT#4-I (DL#9):
CT#2B (DL#3):CT#3A (DL#4):
CT#3A-I (DL#5):CT#3B (DL#6):
Lakewood Systems Data Logger (Thermistors on Grum O/B Dump)
Special Comments:
Data successfully downloaded:Manual readings taken on:
Diviner 2000 Data Logger (Manual Moisture Content Probe)
Data successfully downloaded:

y yn n
n/a n/aSpecial Comments:
CR10X-1 CR10X-2 CR1000y y yn n n
n/a n/a n/an/a n/a n/a
y yy yy yy yy yy yy yy yy y
Special Comments:
y
String #1: y String #3: yString #2: y String #4: y
Special Comments:
y
E-mail: yFax:
Chris Croy Lovejoy FultonSurvey Data Forwarded Via:
ARMC Waste Rock and Tailings Trial Covers- Information Data Sheet
CT#3B (DL#6):CT#3B-I (DL#7):
CT#4 (DL#8):
CT#2B (DL#3):CT#3A (DL#4):
CT#3A-I (DL#5):
Data successfully downloaded:
Special Comments:
SRK Consulting
for Jozsef Miskolczi
Chris Croy Lovejoy Fulton25/06/2008 10:00AM
Completed by:
Diagnostic test run:Diagnoistic Test Results:
Battery Voltage:
Data successfully downloaded:
Date and Time:Downloaded by:
Davis Instruments Data Loggers (Weather Stations on CT#1 and CT#2A/2B)CT#1 CT#2A/2B
Date completed:
Diagnostic test run: Diagnostic test run:Diagnostic test results: Diagnostic test results:
Console battery voltage: Console battery voltage:
Data successfully downloaded:
24-Jun-08
Campbell Scientific CR10X Data Loggers (Located in Monitoring Hut)
Tailings Trial Cover Survey (Rose Creek Tailings)
Solar panel feed voltage if <11vSpecial Comments:
Seametrics Data Loggers (Flowmeters in Monitoring Hut) Data successfully downloaded Battery O.K.
CT#1 (DL#1):CT#2A (DL32):
CT#4-I (DL#9):
Lakewood Systems Data Logger (Thermistors on Grum O/B Dump)
Special Comments:
Data successfully downloaded:Manual readings taken on:
Diviner 2000 Data Logger (Manual Moisture Content Probe)
Data successfully downloaded:

y yy y
3.32 V 3.35 VSpecial Comments:
CR10X-1 CR10X-2 CR1000y y yy y y
13.68 V 13.31 V 12.11 Vn/a n/a n/a
y yy yy yy yy yy yy yy yy y
Special Comments:
n
String #1: n String #3: nString #2: n String #4: n
Special Comments:
y
E-mail: yFax:
Chris Croy Joy FultonSurvey Data Forwarded Via:
ARMC Waste Rock and Tailings Trial Covers- Information Data Sheet
CT#3B (DL#6):CT#3B-I (DL#7):
CT#4 (DL#8):
CT#2B (DL#3):CT#3A (DL#4):
CT#3A-I (DL#5):
Data successfully downloaded:
Special Comments:
SRK Consulting
for Jozsef Miskolczi
Chris Croy Lovejoy Fulton10/07/2008 10:00AM
Completed by:
Diagnostic test run:Diagnoistic Test Results:
Battery Voltage:
Data successfully downloaded:
Date and Time:Downloaded by:
Davis Instruments Data Loggers (Weather Stations on CT#1 and CT#2A/2B)CT#1 CT#2A/2B
Date completed:
Diagnostic test run: Diagnostic test run:Diagnostic test results: Diagnostic test results:
Console battery voltage: Console battery voltage:
Data successfully downloaded:
10-Jul-08
Campbell Scientific CR10X Data Loggers (Located in Monitoring Hut)
Solar panel feed voltage if <11vSpecial Comments:
Seametrics Data Loggers (Flowmeters in Monitoring Hut) Data successfully downloaded Battery O.K.
CT#1 (DL#1):CT#2A (DL32):
CT#4-I (DL#9):flowmeters in new hut also successfully downloaded
Lakewood Systems Data Logger (Thermistors on Grum O/B Dump)
Special Comments:
Data successfully downloaded:Manual readings taken on:
Diviner 2000 Data Logger (Manual Moisture Content Probe)
Data successfully downloaded:
Could not reach thermistors due to heavy rain and erosion

y yy y
3.35V 3.33VSpecial Comments:
CR10X-1 CR10X-2 CR1000y y yy y y
13.88V 14.45V 12.09Vn/a n/a n/a
y yy yy yy yy yy yy yy yy y
Special Comments:
y
String #1: y String #3: yString #2: y String #4: y
Special Comments:
y
E-mail:Fax:
Manual readings taken on:
Diviner 2000 Data Logger (Manual Moisture Content Probe)
Data successfully downloaded:
Battery O.K.CT#1 (DL#1):
CT#2A (DL32):
CT#4-I (DL#9):flowmeters in new hut also successfully downloaded
Lakewood Systems Data Logger (Thermistors on Grum O/B Dump)
Data successfully downloaded:
Campbell Scientific CR10X Data Loggers (Located in Monitoring Hut)
Solar panel feed voltage if <11vSpecial Comments:
Seametrics Data Loggers (Flowmeters in Monitoring Hut) Data successfully downloaded
Diagnostic test run: Diagnostic test run:Diagnostic test results: Diagnostic test results:
Console battery voltage: Console battery voltage:
CT#3A (DL#4):CT#3A-I (DL#5):CT#3B (DL#6):
Data successfully downloaded: Data successfully downloaded:
Date and Time:Downloaded by:
Davis Instruments Data Loggers (Weather Stations on CT#1 and CT#2A/2B)CT#1 CT#2A/2B
SRK Consulting
for Jozsef Miskolczi
Chris Croy Mike Brewer Joy Fulton16/07/2008 10:00AM
ARMC Waste Rock and Tailings Trial Covers- Information Data Sheet
CT#3B-I (DL#7):
Diagnostic test run:Diagnoistic Test Results:
Battery Voltage:
CT#2B (DL#3):
CT#4 (DL#8):
Special Comments:
Completed by:Survey Data Forwarded Via:
Date completed:
Special Comments:
Data successfully downloaded:

y yn n
Special Comments:
CR10X-1 CR10X-2 CR1000y y yn n n
y yy yy yy yy yy yy yy yy y
Special Comments:
y
String #1: y String #3: yString #2: y String #4: y
Special Comments:
y
E-mail:Fax:
Lakewood Systems Data Logger (Thermistors on Grum O/B Dump)
Special Comments:
Completed by:Survey Data Forwarded Via:
Date completed:
Special Comments:
SRK Consulting
for Jozsef Miskolczi
Mike Brewer Joy Fulton7/23/2008 0:00
ARMC Waste Rock and Tailings Trial Covers- Information Data Sheet
CT#4 (DL#8):
Diagnostic test run:Diagnoistic Test Results:
Battery Voltage:
CT#2B (DL#3):CT#3A (DL#4):
CT#3A-I (DL#5):
Solar panel feed voltage if <11vSpecial Comments:
Data successfully downloaded: Data successfully downloaded:
Data successfully downloaded:
Campbell Scientific CR10X Data Loggers (Located in Monitoring Hut)
Diagnostic test results:
Date:Downloaded by:
Davis Instruments Data Loggers (Weather Stations on CT#1 and CT#2A/2B)CT#1 CT#2A/2B
Console battery voltage: Console battery voltage:
Diagnostic test run: Diagnostic test run:Diagnostic test results:
CT#1 (DL#1):CT#2A (DL32):
CT#4-I (DL#9):flowmeters in new hut also successfully downloaded
Seametrics Data Loggers (Flowmeters in Monitoring Hut) Data successfully downloaded Battery O.K.
CT#3B-I (DL#7):CT#3B (DL#6):
Data successfully downloaded:Manual readings taken on:
Diviner 2000 Data Logger (Manual Moisture Content Probe)
Data successfully downloaded:

y yy y
3.34 V 3.32 VSpecial Comments:
CR10X-1 CR10X-2 CR1000y y yy y y
13.81 V 15.02 V 12.76 Vn/a n/a n/a
y yy yy yy yy yy yy yy yy y
Special Comments:
y
String #1: y String #3: yString #2: y String #4: y
Special Comments:
y
E-mail:Fax:
Lakewood Systems Data Logger (Thermistors on Grum O/B Dump)
Special Comments:
Completed by:Survey Data Forwarded Via:
Date completed:
Special Comments:
SRK Consulting
for Jozsef Miskolczi
Chris Croy Mike Brewer Lovejoy Fulton13/08/2008 9:00AM
ARMC Waste Rock and Tailings Trial Covers- Information Data Sheet
CT#4 (DL#8):
Diagnostic test run:Diagnoistic Test Results:
Battery Voltage:
CT#2B (DL#3):CT#3A (DL#4):
CT#3A-I (DL#5):
Solar panel feed voltage if <11vSpecial Comments:
Data successfully downloaded: Data successfully downloaded:
Data successfully downloaded:
Campbell Scientific CR10X Data Loggers (Located in Monitoring Hut)
Diagnostic test results:
Date and Time:Downloaded by:
Davis Instruments Data Loggers (Weather Stations on CT#1 and CT#2A/2B)CT#1 CT#2A/2B
Console battery voltage: Console battery voltage:
Diagnostic test run: Diagnostic test run:Diagnostic test results:
CT#1 (DL#1):CT#2A (DL32):
CT#4-I (DL#9):flowmeters in new hut also successfully downloaded
Seametrics Data Loggers (Flowmeters in Monitoring Hut) Data successfully downloaded Battery O.K.
CT#3B-I (DL#7):CT#3B (DL#6):
Data successfully downloaded:Manual readings taken on:
Diviner 2000 Data Logger (Manual Moisture Content Probe)
Data successfully downloaded: