
The compositional structure of swirl-stabilised turbulent nonpremixed flames
37
Combustion and Flame 137 (2004) 1–37 www.elsevier.com/locate/jnlabr/cnf The compositional structure of swirl-stabilised turbulent nonpremixed flames A.R. Masri, a,∗ P.A.M. Kalt, a,1 and R.S. Barlow b a School of Aerospace, Mechanical and Mechatronic Engineering, The University of Sydney, Sydney, NSW 2006, Australia b Combustion Research Facility, Sandia National Laboratories, Livermore, CA, USA Received 17 January 2003; received in revised form 13 October 2003; accepted 10 December 2003 Abstract The spontaneous Raman–Rayleigh-LIF (laser–induced fluorescence) technique is used to make detailed, joint, single-point measurements of a range of reactive species in highly swirling, turbulent, nonpremixed flames. Such flows are of practical importance and involve highly complex fluid dynamics, the effects of which on the chemistry remain only vaguely understood. The LIF technique is used to measure the concentrations of OH, NO, and CO. Scatter plots are presented in mixture fraction space where each data point is colour coded to reveal its original radial location. Means and rms fluctuations of the mixing, temperature, composition and reactedness fields are also shown for flames of various fuels covering a range of swirl and Reynolds numbers. The complete data set which includes flow, mixing, temperature, and composition fields is made available on the web. It is found that, with increasing swirl number, the stability limits of the flames are broadened but the scatter plots show locally unburnt fluid samples occurring in flames further from global blow-off than nonswirling bluff-body-stabilised flames of similar fuel mixtures. Another novel feature of swirling flames is the detection of local nonburning or extinction within a recirculation zone which develops, at high swirl numbers, further downstream in the flow. It is found that most of the unburnt fluid samples originate from radial locations closer to the coflow air rather than the fuel jet. The means and rms fluctuations of the mixing fields confirm that swirl enhances mixing, especially in the primary recirculation zone and leads to a broadening of the jet. 2004 The Combustion Institute. Published by Elsevier Inc. All rights reserved. 1. Introduction Many of the outstanding turbulent combustion re- search issues, which remained unresolved because of limited numerical and experimental capabilities, are now being revisited and studied quantitatively. This is made possible due to recent advances in com- puter power and laser diagnostics. Cases that have * Corresponding author. E-mail address: [email protected] (A.R. Masri). 1 Dr P.A.M. Kalt is currently at the Department of Me- chanical Engineering, University of Adelaide, SA 5005, Australia. received considerable recent attention are the piloted and bluff-body-stabilised flames. Detailed measure- ments in these flow configurations have already elu- cidated some of the unresolved issues in turbulent nonpremixed combustion [1,2]. Swirling flames are next in terms of level of difficulty and these are cur- rently being investigated in an attempt to (i) resolve their complex flow structure and stability characteristics; (ii) provide a better understanding of the coupling between the fluid dynamics and the chemical ki- netics; (iii) quantify their emission characteristics and the formation of pollutants, such as nitric oxide and carbon monoxide. 0010-2180/$ – see front matter 2004 The Combustion Institute. Published by Elsevier Inc. All rights reserved. doi:10.1016/j.combustflame.2003.12.004
Transcript of The compositional structure of swirl-stabilised turbulent nonpremixed flames

f
t
stralia
led, joint,s. Suchmistryand CO.
originals are alsoet whicht, with
unburntes ofnctiond thatuel jet.rimary
Combustion and Flame 137 (2004) 1–37www.elsevier.com/locate/jnlabr/cn
The compositional structure of swirl-stabilised turbulennonpremixed flames
A.R. Masri,a,∗ P.A.M. Kalt,a,1 and R.S. Barlowb
a School of Aerospace, Mechanical and Mechatronic Engineering, The University of Sydney, Sydney, NSW 2006, Aub Combustion Research Facility, Sandia National Laboratories, Livermore, CA, USA
Received 17 January 2003; received in revised form 13 October 2003; accepted 10 December 2003
Abstract
The spontaneous Raman–Rayleigh-LIF (laser–induced fluorescence) technique is used to make detaisingle-point measurements of a range of reactive species in highly swirling, turbulent, nonpremixed flameflows are of practical importance and involve highly complex fluid dynamics, the effects of which on the cheremain only vaguely understood. The LIF technique is used to measure the concentrations of OH, NO,Scatter plots are presented in mixture fraction space where each data point is colour coded to reveal itsradial location. Means and rms fluctuations of the mixing, temperature, composition and reactedness fieldshown for flames of various fuels covering a range of swirl and Reynolds numbers. The complete data sincludes flow, mixing, temperature, and composition fields is made available on the web. It is found thaincreasing swirl number, the stability limits of the flames are broadened but the scatter plots show locallyfluid samples occurring in flames further from global blow-off than nonswirling bluff-body-stabilised flamsimilar fuel mixtures. Another novel feature of swirling flames is the detection of local nonburning or extiwithin a recirculation zone which develops, at high swirl numbers, further downstream in the flow. It is founmost of the unburnt fluid samples originate from radial locations closer to the coflow air rather than the fThe means and rms fluctuations of the mixing fields confirm that swirl enhances mixing, especially in the precirculation zone and leads to a broadening of the jet. 2004 The Combustion Institute. Published by Elsevier Inc. All rights reserved.
re-se ofre
hisom-ave
-5,
tedre-lu-
lentrer-
ity
ngki-
hend
1. Introduction
Many of the outstanding turbulent combustionsearch issues, which remained unresolved becaulimited numerical and experimental capabilities, anow being revisited and studied quantitatively. Tis made possible due to recent advances in cputer power and laser diagnostics. Cases that h
* Corresponding author.E-mail address:[email protected]
(A.R. Masri).1 Dr P.A.M. Kalt is currently at the Department of Me
chanical Engineering, University of Adelaide, SA 500Australia.
0010-2180/$ – see front matter 2004 The Combustion Institutdoi:10.1016/j.combustflame.2003.12.004
received considerable recent attention are the piloand bluff-body-stabilised flames. Detailed measuments in these flow configurations have already ecidated some of the unresolved issues in turbunonpremixed combustion [1,2]. Swirling flames anext in terms of level of difficulty and these are curently being investigated in an attempt to
(i) resolve their complex flow structure and stabilcharacteristics;
(ii) provide a better understanding of the couplibetween the fluid dynamics and the chemicalnetics;
(iii) quantify their emission characteristics and tformation of pollutants, such as nitric oxide acarbon monoxide.
e. Published by Elsevier Inc. All rights reserved.

2 A.R. Masri et al. / Combustion and Flame 137 (2004) 1–37
Nomenclature
a flame stretch (1/s)bi reactedness calculated from scalar,i
D,DB diameter of bluff body (50 mm)Le Lewis numberLf visible length of flamer radial location (mm)R,RB radius of bluff body (25 mm)Rejet Reynolds number based on the fuel jet
radius and velocityS swirl numberT temperatureT ′ rms fluctuations in temperatureUe bulk axial velocity in the secondary air
coflowUs bulk axial velocity in the swirl annulusWs bulk tangential velocity in the swirl
annulusUjet bulk axial velocity in the central fuel jetUBO bulk axial velocity at blow-off
Wi molecular weight of elementix axial location (mm)Yi mass fraction of species,i
Zi total mass fraction of elementi
ξs stoichiometric mixture fractionξc mixture fraction on centrelineξ ′ rms fluctuations in mixture fractionχ scalar dissipation rate (1/s)ρf density of the fuel streamρs density of a stoichiometric, fully burnt
mixture
Subscripts
F fuel streamO air streamj fuel jetB bluff bodyb fully burnt limit0 unburnt limit
uc-es.ree-onn
itedea-
ime-andp-chvel-re-s.
foredinthe
ofns
leds,, asre-
15]sityut-ig-
s.
onthed-om-teer-em-isrtstiesd,b-
o-ouson-
ata,of
nlyta-
Ra-is-s of[18].the
ur-sed
The focus of this paper is on the compositional strture of turbulent nonpremixed swirl-stabilised flam
Current knowledge of the compositional structuof turbulent swirling flames remains incomplete dspite the fact that a number of early reviews existthe subject [3,4]. Most of the available informatioon temperature and reactive scalar fields are limto averaged data obtained from intrusive probe msurements. More recently, extensive space- and tresolved measurements of flowfield, temperature,composition fields, including NO, have started to apear for a range of swirl burner designs [5–9]. Sudetailed measurements are imperative for the deopment of advanced numerical tools capable of pdicting the detailed structure of these complex flowEqually important is that the data be providedrepresentative, yet simple, burners with well-definboundary conditions which may be reproducedthe computations. Such are the characteristics ofburner studied in this paper.
Advanced numerical methods are now capableusing realistic chemical kinetics in the computatioof turbulent flames [10,11]. As such, more detaiinformation is now required for model validationand measurements of major and minor specieswell as flame radicals, are now demanded. Thesearch groups of Pope [12,13] and Lindstedt [14,have clearly demonstrated that the probability denfunction (PDF) approach is now capable of comping transient effects, such as local extinction and renition, in pilot-stabilised turbulent diffusion flame
It was also shown that probability density functimethods are potentially capable of computingflow structure of highly swirling flames [16]. Such avances are very promising and indicate that the cputations of complex reacting flows with finite-rachemistry effects are within reach of available numical tools. Achieving this goal is the objective of thInternational Workshops on Measurement and Coputation of Turbulent Nonpremixed Flames, whichbringing together numerical and experimental effoto advance knowledge and computational capabiliin turbulent nonpremixed combustion [17]. Pilotebluff-body, and swirl-stabilised flows are model prolems for these workshops.
One of the objectives of this paper is to prvide a comprehensive picture of the instantaneand mean compositional structure of turbulent, npremixed swirl-stabilised flames. This is part ofcontinuing study aimed at providing benchmark daas well as a thorough quantitative understandingsuch flames. The swirl burner used here is not owell-suited for modelling, but it is also capable of sbilising highly swirling flames, which are free fromsoot, hence enabling the application of complexman, Rayleigh, LIF diagnostics. Stability charactertics and flowfield measurements for selected flamemethane have already been reported elsewhereSingle-point measurements of temperature andmass fraction of CH4, O2, N2, CO, CO2, H2, H2O,OH, and NO are presented here in the form of colocoded scatter plots and averaged profiles. LIF is u

A.R. Masri et al. / Combustion and Flame 137 (2004) 1–37 3
nifi-uidn.d is
s-y aheterl
terisn-
po-nee
thehe
inairelerere,ss
veady
s, asat
gas
m-ne,pure
re-op-vential
m-
f.ichoffthe
neis-nd
lse-
in-ratioheost
ootdi-e
thAllamsesirlhap-able
to measure CO, OH, and NO. In these flames, sigcant interactions occur between chemistry and fldynamics, making them ideal for model validatioThe resulting set of data is posted on the web anmade freely accessible [20].
2. Experimental
2.1. Burner and selected flames
Details of the swirl burner used in these invetigations are reported elsewhere [18,19] and onlbrief description is given here. A schematic of tburner is shown in Fig. 1. It has a 50-mm-diamebluff body (DB = 50 mm) with a 3.6-mm central fuejet. Surrounding the bluff body is a 60-mm-diameannulus for the primary swirling air stream. Swirlintroduced into the primary air stream by three tagential inlets, each 7 mm in diameter, which aresitioned 300 mm upstream of the burner exit plaand inclined 15◦ upward to the horizontal plane. Thswirl number may be easily varied by changingrelative flow rates of tangential and axial air in tprimary stream. The burner assembly is situateda wind tunnel providing a coflowing secondarystream of 20 m/s with a free stream turbulence levof around 2%. The composition measurements wmade at Sandia National Laboratories, LivermoCalifornia, where the wind tunnel has an exit crosection of 310× 310 mm.
The stability characteristics of the burner habeen studied extensively and the results have alrebeen reported elsewhere [18,19]. In these studiewell as in the velocity measurements performedThe University of Sydney, compressed natural(CNG) is used instead of pure CH4. CNG is morethan 90% methane by volume, the remaining coponents being primarily carbon dioxide, propaand ethane. For the composition measurements,CH4 is used with the following fuel mixtures: CH4,CH4/H2 = 1/1 (by vol), and CH4/air = 1/2 (by vol).It is worth noting that the stability limits differ onlyslightly if pure CH4 fuel is used instead of CNG.
Eight flames were selected for further measuments and Table 1 lists some of their physical prerties and characteristics. The swirl numbers giin Table 1 are the ratio of the mean bulk tangento axial velocity in the swirl annulus,S = Ws/Us.The Reynolds number is based on the fuel jet diaeter of 3.6 m. The visible flame lengths,Lf are tabu-lated as well as the blow-off limits,UBO which referto the bulk axial velocity in the fuel jet at blow-ofBase blow-off is defined as the condition under whthe flame extinguishes completely and neck blow-occurs when the flame is almost nonexistent in
Fig. 1. Schematic of the new swirl burner.
neck zone while still burning in the recirculation zoand/or further downstream of the neck region. Dtinction is not made here between base blow-off aneck blow-off and more details are presented ewhere [18].
Images of the eight flames selected for furthervestigations are shown in Fig. 2. The same aspectis used for all images to highlight differences in tphysical appearances of the flames which are almentirely blue in colour, indicating the absence of sand hence their suitability for Raman and Rayleighagnostics. The CH4/H2 flames are longer than thosof CH4 and CH4/air fuels. The issue of flame lengis discussed further in a later section of this paper.flames contract to a necking region just downstreof the bluff body before spreading out except for caSMA2 and SMA3 which have a much higher swnumber ofS = 1.59 and an almost uniform widtacross the entire length of the jet. Flame SMH3pears to be brushy and broad because it is unstand makes a loud rumbling noise.

4 A.R. Masri et al. / Combustion and Flame 137 (2004) 1–37
1218202330374050
40MT
Table 1Investigated swirl-stabilised flame conditions
Flame Fuel ξs Ue Us Ws Ujet Rejet S UBO Lf[m/s] [m/s] [m/s] [m/s] [m/s] [m]
SM1 CH4 0.054 20 38.2 19.1 32.7 7200 0.50 166 0.SM2 CH4 0.054 20 38.2 19.1 88.4 19500 0.50 166 0.SMA1 CH4/Air (1 : 2) 0.25 20 32.9 21.6 66.3 15400 0.66 241 0.SMA2 CH4/Air (1 : 2) 0.25 20 16.3 25.9 66.3 15400 1.59 216 0.SMA3 CH4/Air (1 : 2) 0.25 20 16.3 25.9 132.6 30800 1.59 216 0.SMH1 CH4/H2 (1 : 1) 0.05 20 42.8 13.8 140.8 19300 0.32 267 0.SMH2 CH4/H2 (1 : 1) 0.05 20 29.7 16.0 140.8 19300 0.54 281 0.SMH3 CH4/H2 (1 : 1) 0.05 20 29.7 16.0 226.0 31000 0.54 281 0.
Table 2
Species Excitation wavelength Laser energy/pulse Collection wavelength Collection filtering
OH 287.9 nm 16 µJ 305–320 nm Schott WG295 and Hoya U3NO 226.1 nm 12 µJ 236–280 nm Schott UG5 and solar-blind PCO 230.1 nm 700 µJ 480–488 nm Bandpass at 484±5 nm
eree
cil-li-meri-ereiveHl
beitiescedCOent
twomJhedrgyvol-g a
oute
ffec-e.
er-the
eterdi-
notof
asandteda-
lierthe
igha-anncedyeve-
rainthehe-
turef theeamwasaseceure-and
ofwo-theam.
sto
eis
sig-
2.2. The Raman–Rayleigh-LIF technique
All the multiscalar measurements reported hwere performed at the Turbulent Diffusion FlamLaboratory within the Combustion Research Faity at Sandia National Laboratories, Livermore, Cafornia. A single-point, Raman–Rayleigh-LIF systewhich has been used extensively in earlier expments and which has been fully described elsewh[2,21–23] is employed here. The Raman signals ga simultaneous measure of the concentrations of C4,N2, O2, H2, H2O, CO, and CO2. The Rayleigh signais used to determine temperature which may alsoobtained from the sum of the species number densby assuming ideal gas law behaviour. Laser-indufluorescence is used to measure OH, NO, andhence giving a second, more reliable measuremof CO.
The Raman–Rayleigh measurements usedNd:YAG lasers each of which provided about 600of energy at 532 nm. The laser pulses were stretcfrom 8 ns to about 40 ns to avoid excessive eneand hence gas breakdown in the measurementume. The Nd:YAG beams were reflected back usincollimating lens and a 180◦ turning prism, effectivelydoubling the energy in the probe volume to ab1.2 J/pulse. Beam steering by the turbulent flamcan deflect the return beam and increase the etive diameter of the Raman/Rayleigh probe volumThis effect has not been quantified in detail. Obsvations suggest that the worst case deflections ofreturn beam were less than half the beam diamat the probe volume, so that the average effectiveameter for turbulent flame measurements wouldbe significantly larger that our nominal resolution0.75 mm.
The Raman and Rayleigh scattered light wcollected using a six-element achromatic lensthen collimated with a camera lens. The collimaRayleigh light was reflected, using a holographic Rman edge filter, and focused onto a photomultiptube, whereas the Raman light was focused ontoentrance slit of a 0.75-m polychromator. The Raylelight was prevented from entering the polychromtor to minimise interferences with the weak Ramsignals. Each of the OH, NO, and CO fluorescemeasurements used a separate Nd:YAG-pumpedlaser system tuned respectively to the relevant walength. LIF signals were collected using a Cassegmirror and dichroic beam splitters, which directedsignals to photomultiplier tubes through filters. Tfollowing information is provided for the LIF measurements, see Table 2.
Spatial resolution of the species and temperameasurements were determined by the diameter orespective laser beam and the length along the baxis that was imaged onto the detector. The latter0.75 mm for all measurements. In order to increthe signal while staying within the linear fluorescenregime, the laser beams for the OH and NO measments were focused beyond the probe volume,lenses were adjusted so that approximately 93%the energy passed through an 0.8-mm pinhole. Tphoton LIF measurements of CO were made atfocus (less than 0.3 mm) of the 230.1-nm laser beThe diameter of the multiple Nd:YAG laser beamwas measured by drilling a hole (typically 0.650.75 mm in diameter) through a thin brass sheet.
A full description of the calibration proceduris given elsewhere [1,2] and only a brief outlinegiven here. To calibrate the Rayleigh signal, N2 andhelium gases were used to obtain background

A.R. Masri et al. / Combustion and Flame 137 (2004) 1–37 5
tedme
n.flatidethe
kenc-a-ur-lied
yclicde-lier
aynced tover,f theshotce.al-som-con-fac-IFhot
bed
oc-hethe
ssass
umandisred6]ix-f-
asstnd
os-ng
Fig. 2. Real colour photos of the eight flames investigahere. The magnification is the same for all photos. A frawidth corresponds to 100 mm in real space.
nals and wind tunnel air was used for calibratioMixed gases at room temperature and in laminarflames of known compositions were used to provtemperature-dependent calibration factors for all
monitored Raman lines. Daily measurements tafor N2 and wind tunnel air provided adjustment fators to account for any possible drift in the calibrtions. Corrections for interferences from neighboing Raman lines were also obtained here and appon a single-shot basis. Fluorescence from C2 andother possible broadband sources such as polycaromatic hydrocarbons may interfere, in varyinggrees, with the Raman signals. Two photomultiptubes were placed inside the polychromator awfrom Raman lines. These monitor the fluorescebackground at 587 and 615 nm and are referreas F587 and F615 lines. It should be noted, howethat only F615 was subsequently used with each oRaman lines to generate and apply, on a shot-per-basis, a correction for the fluorescence interferenThis procedure is fully described elsewhere [24]. Cibrations for OH, NO, and CO LIF signals were almade using laminar premixed flames of known copositions. Using the Raman-measured speciescentrations as well as predetermined quenchingtors, corrections for collisional quenching on the Lsignals from OH and NO were made on a shot to sbasis. Details of the LIF-CO technique are describy Frank and Barlow [23].
The data processing procedure is now well dumented and is fully described elsewhere [25]. Ttemperatures presented here are obtained fromRayleigh signal where the effective Rayleigh crosection is determined from the Raman measured mfractions. The temperature determined from the sof species number densities is also documentedtabulated on the web [20]. The mixture fractioncomputed for each data point from the measuspecies mass fractions using Bilger’s formulation [2which preserves the stoichiometric value of the mture fraction regardless of differential diffusion efects,
(1)
ξ =2(ZC−ZC,O)
WC+ (ZH−ZH,O)
2WH− (ZO−ZO,O)
WO2(ZC,F−ZC,O)
WC+ (ZH,F−ZH,O)
2WH− (ZO,F−ZO,O)
WO
,
whereZi is a conserved scalar given by the total mfraction of elementi, andWi is the molecular weighof elementi. Subscripts F and O refer to the fuel aair streams, respectively.
3. Results and discussion
3.1. Spontaneous flame structure
3.1.1. Presentation methodologyOne of the unique advantages of the diagn
tic technique used here is its capability of providi

6 A.R. Masri et al. / Combustion and Flame 137 (2004) 1–37
tionles
4 tolo-A1,dyre-heon
000ns
areachlo-ryrv-n
heass
an-aneredar-eand
9ow
dean-a-ns.solidcal-es,pro-and-to
cu-ntonsandelisea-
es.m-
ine
heityasskc-
Itkdlarislots
red-
esurm
rsw-then-2
steckea-
e isof
at
thetsgehe
rac-m-ix-atain-ea-omCO
istheceayted
simultaneous, space and time-resolved informaabout the compositional structure of flames. Sampof the obtained data are presented here in Figs.9, in the form of scatter plots, for selected axialcations in a range of the methane–air flames, SMSMA2, and SMA3. Some scatter plots have alreabeen published for the SM flames [27] and themaining data for this fuel mixture as well as for tother flames shown in Table 1 are freely availablethe web [20]. Each scatter plot contains about 30,data points collected at a range of radial locatioacross a single axial location. Although the datapresented here with respect to mixture fraction, erealisation is colour coded depending on its radialcation which is shown on the colour bar. This is a vepowerful method of presenting the data while preseing information in physical as well as mixture fractiospace [8].
Each of Figs. 4 to 9 show scatter plots for tsimultaneously measured temperature and the mfractions of O2, H2, H2O, CO, CO2, OH, and NOplotted versus mixture fraction,ξ . The mass fractionof CO shown here is measured using LIF. The Rammeasured CO mass fractions in flames of methfuel mixtures are far less reliable than CO measuby LIF due to strong fluorescence interferences pticularly on the rich side of stoichiometric [21]. ThLIF-measured CO mass fractions are shown hereare tabulated on the web [20].
The curves shown on each plot of Figs. 4 tocorrespond to computations for a steady, counterfllaminar diffusion of the same fuel mixture. The coused for these computations was developed at Sdia [28] and is used here with the GRI2.1 mechnism which consists of 49 species and 279 reactioUnity Lewis number is enforced in all calculationpresented in Figs. 4 to 9. The dotted, dashed, and slines shown on each plot represent steady flameletculations for low, intermediate, and high strain ratrespectively. It should be emphasised that thesefiles are shown as guides for the temperaturecomposition limits of burnt mixtures without any implications on the relevance of flamelet modellingthe flows considered here.
The question as to whether laminar flame callations with full diffusive transport are more relevathan equal mass and thermal diffusivity assumptihas been addressed by Dally et al. [2] and Pitschco-workers [29,30]. It was found that for methane fumixtures, laminar flame calculations with unity Lewnumbers are consistently closer to spontaneous msurements of compositions made in turbulent flamFig. 3 shows two sets of laminar flame profiles coputed for a fuel mixture of CH4–air= 1/2 (by vol-ume), which has a strain rate of 65 s−1 and which isthe same mixture as the SMA flames. The solid l
refers to unity Lewis number calculations while tdashed lines use full diffusion. It is clear that unLewis number calculations result in higher peak mfractions of H2O, OH, H2, CO, and NO with the pealocation shifted slightly toward higher mixture frations. Temperature and the mass fractions of O2 arealmost unaffected while the mass fraction of CO2 isslightly higher for the full diffusive calculations.is worth noting that for this fuel mixture, the peamass fraction of H2 is almost double that obtainewith full transport calculations. The trends are simifor flames with higher strain rates. Only unity Lewnumber calculations are shown on the scatter ppresented in Figs. 4 to 9.
3.1.2. Colour-coded scatter plotsFig. 4 shows colour-coded scatter plots measu
atx = 50 mm in flame SMA2 which has a swirl number,S = 1.59. The colour of each data point indicatits origin on the radial profile as shown on the colobar. The flame has a visible length of about 230 mand is at about 30% of global blow-off which occuat the base of the recirculation zone. Global blooff may occur either at the base of the flame (atexit plane of the burner) or in the neck zone dowstream of the recirculation region [18]. Flame SMAis visibly stable and, due to high swirl, it is almocylindrical in shape and does not have a distinct nregion downstream of the recirculation zone as ftured in the other flames shown in Fig. 2.
The peak measured temperature in this flamabout 2000 K occurring slightly to the rich sidestoichiometric mixture fraction (ξs = 0.25). The mea-sured mass fractions of O2 decrease to almost zeroa slightly rich mixture fraction ofξ ∼ 0.30 before in-creasing again due to the existence of oxygen infuel mixture. The colour coding of the data poinshows that, for burnt samples, there is little leakaof oxygen to the rich side of the reaction zone. Tpeak-measured mass fractions of CO2 and OH occurat stoichiometric, while H2O and NO peak at slightlyricher mixtures ofξ ∼ 0.30. Both CO and H2 peak onthe very rich side atξ ∼ 0.35.
Except for NO, the measured species mass ftions as well as temperature follow closely the coputed laminar flame profiles especially for lean mtures. For very rich mixtures, the scatter in the dbecomes larger and this is mainly due to strongerterferences with the Raman signals. Also, the msured species mass fractions deviate slightly frthose computed for laminar flames especially forand H2. The peak measured mass fraction of NOabout 50% that obtained for laminar flames andpeak is slightly shifted to the rich side. This differenmay be partially due to radiation effects which mbe significant on NO and which were not accoun

A.R. Masri et al. / Combustion and Flame 137 (2004) 1–37 7
Fig. 3. Computed profiles of temperature and species mass fraction for a laminar counterflow diffusion flame of CH4/air = 1/2(by vol) with a stretch rate of 65 s−1. Dotted lines correspond to full diffusive transport and solid lines are forLe= 1.

8 A.R. Masri et al. / Combustion and Flame 137 (2004) 1–37
Fig. 4. Colour-coded scatter plots of temperature and the mass fractions of O2, CO, CO2, H2, H2O, OH, and NO versus mixturefraction for x = 50 mm in flame SMA2. The dotted, dashed, and solid lines represent calculations for laminar flames of low(a = 65 s−1), intermediate (a = 125 s−1), and high (a = 530 s−1) strain rates, respectively.

A.R. Masri et al. / Combustion and Flame 137 (2004) 1–37 9
ichcesandhe
irl
pedoneds
ol--
1 is3thngim-
dis-lo-andandac-in
ints
rnt
ns
ciesnge-ivetsdalds-heayithre-
idon-ra-eptver-dis-e
asse
ar-ff-if-
gas
ero
e-ffe-
g.,ld%
red
areer-hetione-
s-id-
rac-re-ac-e
ere)-
uo-
seofrntn
wn-ts.rtedatatere-
for in the calculations. Other relevant issues whmay contribute to the discrepancy include differenin residence times between the laminar flamesthe current flow configuration; and uncertainty in tchemical mechanisms used in the calculations.
Flame SMA1 is obtained by decreasing the swnumber fromS = 1.59 toS = 0.66 while keeping thefuel jet velocity constant at (Uj = 66.3 m/s). Thisflame is asymmetric, short (200 mm long) and shalike an hourglass as shown in Fig. 2. It has a neck zdownstream of a recirculation zone which extenfrom aboutx/D ∼ 0.8 to x/D ∼ 2.0. Flame SMA3has the same swirl number as SMA2 (S = 1.59) butthe jet velocity is doubled toUj = 132.6 m/s. Figs. 5and 6 show colour coded scatter plots for data clected atx = 50 mm in flames SMA1 and SMA3 respectively. It should be noted here that flame SMAat 27.5% of blow-off while flames SMA2 and SMAare at 30 and 61% of blow-off, respectively. Boflames SMA2 and SMA3 are some 230–300 mm loand they both have the same cylindrical shapeposed by the high swirl number.
Figs. 5 and 6 show the same general featurescussed earlier in relation to Fig. 4. Namely, thecation and values of the peak-measured scalarsthe shape of the measured profiles of temperaturespecies mass fractions, with respect to mixture frtion, are similar. The additional feature observedFigs. 5 and 6 is the increased proportion of data powhich lie away from the fully burnt limits indicatingthe increased presence of unburnt or partially bumixtures. The following points are worth noting:
• Focusing on a small band of mixture fractioaround stoichiometric (ξs = 0.25), Figs. 5 and 6show that the measured temperature and spemass fractions are scattered over a broad rastretching from the fully burnt limits to a mixing asymptote which corresponds to unreactmixtures. However, the distribution of data poinover this range appears to be somewhat bimowith a higher proportion of data points founcloser to either the burnt limit or the mixing aymptote. Fluid samples which are far from tburnt limits may be either extinguished or mhave never been ignited but instead mixed wcombustion products. Such fluid samples areferred to herein as “unburnt.”
• The “mixing asymptote” corresponds to flusamples which are a mixture of reacted and nreacted fluid having moderately high tempetures and nonzero combustion products. Excfor OH, where the nonreactive samples haYOH = 0.0, the mixing asymptotes for tempeature and species mass fractions are quitetinct and follow a linear relationship with mixtur
fraction in the range 0� ξ � 0.5. This leads tolean unburnt fluid samples having nonzero mfractions of CO and H2 as clearly shown on thscatter plots of Figs. 5, 6, and 8.
• Although these trends are consistent with elier measurements reported for piloted and blubody-stabilised flames [1,2], there are subtle dferences: (i) The extent of mixing in swirlinflames is broadband in mixture fraction spaceis apparent in the scatter plots showing nonzmass fractions of CO and H2 in lean, unburntfluid samples. (ii) Unburnt fluid samples are dtected in flames which are further from blow-othan for piloted and bluff-body flames. FlamSMA1, for example, is at 27.5% of the blowoff limit and yet shows significant nonburninFor fuel mixtures with similar stoichiometrypiloted and bluff-body-stabilised flames woustart showing localised extinction at about 50of blow-off.
Fig. 7 shows colour-coded scatter plots measuat x = 20 mm (x/D = 0.4) in flame SMA3 which isat 61% from blow-off. The same general featuresobserved here as for Fig. 4 with the additional obsvation that on the very rich side of stoichiometric, tscatter in the data is a little broader and the deviafrom the flamelet profiles is more significant espcially for temperature and the mass fractions of O2,H2O, CO, and H2. It is postulated that this larger dicrepancy for richer mixtures may be due to high resual fluorescence interferences on O2 and CO2 whichcould also cause a shift in the measured mixture ftions. To test this hypothesis, the raw data wereprocessed for this flame location with the mass frtions of O2 and CO2 set to the flamelet values. Thresulting scatter plots (which are not presented hshowed, for rich mixtures, similar deviations in temperature and the mass fractions of H2O, CO, and H2.This confirms the absence of significant residual flrescence interferences on O2 and CO2.
This axial location ofx = 20 mm (x/D = 0.4)is well within the first, large recirculation zone cloto the face of the bluff-body. The large majorityfluid samples detected at this location are fully buwith little or no sign of localised extinction. This is icontrast to the scatter plots measured atx = 50 mm(x/D = 1.0) in the same flame (Fig. 6) which shothat a significant proportion of fluid samples are uburnt due to profound finite-rate chemistry effecThis feature is consistent with measurements repoearlier for bluff-body-stabilised flames showing ththe recirculation zone is not affected by the finite-rchemical kinetics which may dominate the neckgion further downstream [2].

10 A.R. Masri et al. / Combustion and Flame 137 (2004) 1–37
Fig. 5. Colour-coded scatter plots of temperature and the mass fractions of O2, CO, CO2, H2, H2O, OH, and NO versus mixturefraction for x = 50 mm in flame SMA1. The dotted, dashed, and solid lines represent calculations for laminar flames of low(a = 65 s−1), intermediate (a = 125 s−1), and high (a = 530 s−1) strain rates, respectively.

A.R. Masri et al. / Combustion and Flame 137 (2004) 1–37 11
Fig. 6. Colour-coded scatter plots of temperature and the mass fractions of O2, CO, CO2, H2, H2O, OH, and NO versus mixturefraction for x = 50 mm in flame SMA3. The dotted, dashed, and solid lines represent calculations for laminar flames of low(a = 65 s−1), intermediate (a = 125 s−1), and high (a = 530 s−1) strain rates, respectively.

12 A.R. Masri et al. / Combustion and Flame 137 (2004) 1–37
Fig. 7. Colour-coded scatter plots of temperature and the mass fractions of O2, CO, CO2, H2, H2O, OH, and NO versus mixturefraction for x = 20 mm in flame SMA3. The dotted, dashed, and solid lines represent calculations for laminar flames of low(a = 65 s−1), intermediate (a = 125 s−1), and high (a = 530 s−1) strain rates, respectively.

A.R. Masri et al. / Combustion and Flame 137 (2004) 1–37 13
ec-sure) is-io-atwsndin
isowich
reenest
ealsed
e-O,yif-ar
v-on-gerLIF
nt,id
tsby-les
m
n-o 9rntoi-
rete
ic-M,
isidry
e
reow
e-otsp-een
eamxialm-rvedughwne
areingv-ata-
ein-
araminherdsHnot
mso-
a
-eann-re
on
nra-3
Measurements collected atx = 100 mm (x/D =2.0) in flame SMA3 and atx = 120 mm (x/D = 2.4)in flame SMA1 are shown in Figs. 8 and 9, resptively. The stoichiometric length of all SMA flame(defined as the axial location where the mean mixtfraction reaches stoichiometric on the centrelineshown to be about 120 mm (x/D = 2.4) so the measurements in flame SMA1 are made at the stoichmetric tip of the flame. It is remarkable that eventhese downstream locations, flame SMA3 still shoa significant proportion of unburnt fluid samples athe scatter plots are very similar to those shownFig. 6 for measurements atx = 50 mm (x/D = 1.0).In contrast, flame SMA1 shows fully burnt fluid at thaxial location, indicating that the mixing rates are nrelaxed and the locally extinguished samples whwere shown in Fig. 5 atx = 50 mm (x/D = 1.0) inthis flame are now fully burnt. It is worth noting hethat predicting this difference in behaviour betweflames SMA1 and SMA3 would be an excellent tfor combustion models.
The scatter plots presented in Figs. 4 to 9 revsome very interesting features about swirl-stabiliflames.
• For lean fully burnt mixtures, the measurments show little scatter and, except for Nfollow closely the profiles for laminar steadflames. Richer mixtures, however, show signicantly more scatter and deviate from the laminflamelet behaviour especially for CO and H2.This departure from the laminar flamelet behaiour is genuine since further testing has demstrated that the difference is not due to stroninterferences on the Raman, Rayleigh, andsignals.
• When finite-rate chemistry effects are significaa bimodal behaviour is observed, where flusamples mostly populate the fully burnt limiand a mixing asymptote which is determinedthe mixing of unburnt fluid samples with combustion products. This leads to lean fluid sampwith nonzero mass fractions of CO and H2.
• Most of the unburnt fluid samples originate froouter radial locations withr/R � 0.4. This isevident from histograms (not shown here) geerated from the data presented in Figs. 4 tshowing the frequency of occurrence of unbufluid pockets in the reactive region around stchiometric mixture fraction, (0.2 � ξ � 0.3) ver-sus radial location. Atx = 50 mm (x/D = 1.0),and for methane flames SM1 and SM2, mothan 90% of the unburnt fluid samples originafrom the outer locations withr � 13 mm (r/R �0.52). Although not presented here, a similar pture is obtained at most axial locations in the S
SMA, and SMH flames. The exceptions to thare flames SMA3 and SMH3 where unburnt flusamples may originate from radial locations veclose to the jet centreline.
3.2. Mean mixing fields
In this section radial and axial profiles of thReynolds-averaged, measured mixture fraction,ξ ,and its rms fluctuations,ξ ′, are presented for the entirange of flames shown in Table 1. Figs. 10–12 shradial profiles forξ (LHS) andξ ′ (RHS) at variousaxial locations in the SM, SMA, and SMH flames, rspectively. Different flames are indicated in the plby different symbols, as outlined in the figure cations. Where possible, comparisons are made betwmean profiles measured at the equivalent downstraxial distance. Otherwise, and in cases where the aposition of these features may vary slightly, the copared profiles are taken through the same obsemacroscale features of the flames, such as throthe necking region. The dotted horizontal line shoon each plot ofξ marks the stoichiometric mixturfraction of the fuel.
Results for methane flames SM1 and SM2presented in Fig. 10. It is shown here that doublthe central jet velocity leads to improved mixing leels within the first (or primary) recirculation zonex/D = 0.4. However, the mean stoichiometric loction remains atr = 22 mm (r/R = 0.88), indicatingthat this improved mixing is not sufficient to shift thmean reaction zone from the outer edges to thener side of the reaction zone. Atx/D = 0.4 and 0.8,the rms fluctuations in mixture fraction are similfor both flames SM1 and SM2. Further downstreat x/D > 1.0, flame SM2 shows a slower decaythe mean mixture fraction than flame SM1 and higrms fluctuations. This is inconsistent with the trenshown later in this paper for the SMA and SMflames. The reasons for this delayed mixing areclear and warrant further investigations.
Fig. 11 shows radial profiles of the mean and rfluctuations of mixture fraction at a range of axial lcations in the CH4–air flames (SMA1, SMA2, andSMA3). Increasing the swirl number fromS = 0.66(SMA1) to S = 1.59 (SMA2 and SMA3) leads towider jet for upstream locations down tox/D = 1.0.Further downstream, atx/D = 1.8–2.0, the mean location of the reaction zone represented by the mstoichiometric mixture fraction (the dotted horizotal line) indicates that flames SMA2 and SMA3 anow a little narrower than flame SMA1. In the regix/D = 1.0–2.0, the centreline decay inξ is faster forthe highly swirling flames (SMA2 and SMA3) thafor SMA1. The peak rms fluctuations are compable in all the SMA flames. Flames SMA2 and SMA

14 A.R. Masri et al. / Combustion and Flame 137 (2004) 1–37
Fig. 8. Colour-coded scatter plots of temperature and the mass fractions of O2, CO, CO2, H2, H2O, OH, and NO versus mixturefraction forx = 100 mm in flame SMA3. The dotted, dashed, and solid lines represent calculations for laminar flames of low(a = 65 s−1), intermediate (a = 125 s−1), and high (a = 530 s−1) strain rates, respectively.

A.R. Masri et al. / Combustion and Flame 137 (2004) 1–37 15
Fig. 9. Colour-coded scatter plots of temperature and the mass fractions of O2, CO, CO2, H2, H2O, OH, and NO versus mixturefraction for x = 120 mm in flame SMA1. The dotted, dashed, and solid lines represent calculations for laminar flames of low(a = 65 s−1), intermediate (a = 125 s−1), and high (a = 530 s−1) strain rates, respectively.

16 A.R. Masri et al. / Combustion and Flame 137 (2004) 1–37
Fig. 10. Radial profiles of the mean and rms fluctuations of mixture fraction (ξ , ξ ′) plotted for various axial location in themethane flames (hollow triangle, SM1; square, SM2).

A.R. Masri et al. / Combustion and Flame 137 (2004) 1–37 17
Fig. 11. Radial profiles of the mean and rms fluctuations of mixture fraction (ξ , ξ ′) plotted for various axial location in themethane–air flames (solid triangle, SMA1; hollow triangle, SMA2; square, SMA3).

18 A.R. Masri et al. / Combustion and Flame 137 (2004) 1–37
Fig. 12. Radial profiles of the mean and rms fluctuations of mixture fraction (ξ , ξ ′) plotted for various axial location in themethane–hydrogen flames (solid triangle, SMH1; hollow triangle, SMH2; square, SMH3).

A.R. Masri et al. / Combustion and Flame 137 (2004) 1–37 19
lingelts
,2,redre:herro-rnd-
e.isoft asio-Ittheuello-rlier
ofar-].
ntsca-
e-on-ay
alsocir-e-wsviernsor-fuelthe
x-achel.a-
,e
di-
hetal
s,s,
heownisi-meix-to
re-
notornana
n-th
es
which have the same swirl number show that doubthe jet velocity leads to improved mixing within threcirculation zone. This is consistent with the resushown earlier for SM flames.
The radial profiles ofξ , and its rms fluctuationsξ ′, are shown in Fig. 12 for flames SMH1, SMHand SMH3 (half-radial profiles have been measuin flame SMH3). Similar features are reported heat upstream axial locations, the flames with the higswirl number (SMH2 and SMH3) have broader pfiles of ξ , indicating a wider flame. Also, and foflames with the same swirl numbers (SMH1 aSMH2), increasing the fuel jet velocity leads to improved mixing within the primary recirculation zonRadial profiles ofξ show that as the fuel jet velocitydoubled (from SMH2 to SMH3) the mean locationthe reaction zone shifts closer to the central fuel jeindicated by the radial location of the mean stoichmetric mixture fraction (the dotted horizontal line).should be noted here that the increased mixing inprimary recirculation zone due to increases in the fjet velocity and the subsequent shift in the meancation of the reaction zone have been observed eain nonswirling bluff-body-stabilised flames [2].
The measured profiles of the rms fluctuationsmixture fraction are similar to those measured elier in nonswirling bluff-body-stabilised flames [2Closer to the burner’s exit plane,ξ ′ peaks near thejet centreline, where the mixture fraction gradieare steep, and this peak shifts to outer radial lotions further downstream. Peak values ofξ ′ measurednear the centreline of these swirling jets are somwhat higher than those measured for similar nswirling flames [2]. These excess fluctuations mbe genuine, since higher turbulence levels aremeasured on the centreline even within the first reculation zone [18]. This is also supported by thredimensional, unsteady calculations of these flomade using the standard Reynolds-averaged NaStokes (RANS) approach [33]. These calculatioshow clearly that as the swirl number increases, vtex breakdown occurs and this causes the centraljet to become unstable and precess in tandem withdownstream vortex.
The measured centreline axial profiles ofξc areshown in Fig. 13 for all the flames and fuel mitures studied here. The dotted horizontal line on eplot represents the stoichiometric value of the fuAlso shown in the lower plot of Fig. 13 are the mesured centreline axial profiles ofξc for three non-swirling bluff-body-stabilised flames (HM1, HM2and HM3) [2]. The following observations may bmade from this figure:
• The stoichiometric length of the flames, as incated by the location at whichξc = ξc, is about
Fig. 13. Axial profiles of the mean mixture fraction on tcentreline, (ξc) for all flames studied here. The horizonline locates the stoichiometric mixture fraction.
100 mm (x/D = 2.0) for the methane flame120 mm (x/D = 2.4) for the methane–air flameand about 300 mm (x/D = 6.0) for the CH4–H2 flames. This is generally consistent with tmeasured visible length of these flames as shin Table 1. It should be noted here that the vble flame lengths presented in Fig. 2 show sodifferences between flames of the same fuel mture. However, these may be deceptive duetime averaging over the flame brush at the tipgion.
• The stoichiometric length of the flames doeschange much by increasing the jet velocityswirl number (within the limits of increase showhere). Flame SMA1 is even slightly shorter thflames SMA2 and SMA3 both of which havemuch higher swirl number of 1.59. This is cosistent with the observation that the visible lengof flame SMA1 is shorter than those of flamSMA2 and SMA3.

20 A.R. Masri et al. / Combustion and Flame 137 (2004) 1–37
e-innt
re-ear
nd
n-and
er
m
is-heonto
ofet-A)ure
eseingirlme
ureof
ua-anof
-pre
ca-achrsis-data
er-a-nt-
in
ases
din
esees
s
-ac-ket the
urerightn ofts,onis
r2,rein
ndc-resheakswn
ivecir-r toed
ionsitycu-
anpro-
rac-2ssf
ese
• Increasing the swirl number or the fuel jet vlocity increases the turbulent mixing ratesthe neck region of the flames. This is evidefrom the lower centreline values ofξ shown forflames SMA and SMH. Atx = 80 mm (x/D =1.6), which corresponds to the neck zonegion, flames SMA1, SMA2, and SMA3 havξc = 0.56, 0.45, and 0.39, respectively. A similtrend is also observed for the CH4–H2 flames.
• The axial profiles presented for the swirling anonswirling CH4/H2 flames (SMH1–SMH3 andHM1–HM3) show, as expected, that swirl icreases mixing and leads to faster decayshorter jets. Atx/D = 2.0, the nonswirling,bluff-body-stabilised flames HM1–HM3 havξc ∼ 0.38, while the corresponding value fothe swirling flames SMH1–SMH3 ranges froξc = 0.15 to 0.25.
The differences in the stoichiometric (and vible) flame lengths may not be explained by tstandard correlations for nonbuoyant jet diffusiflames [31] where the flame length is proportional(1/ξs)(ρf/ρs) whereξs is the stoichiometric mixturefraction andρf , ρs are, respectively, the densitiesthe fuel mixture and the burnt mixture at stoichiomric. According to this theory, the methane–air (SMflames should be much shorter than those of pmethane (SM) due to their higherξs; yet the SMAflames are about 20% longer. It appears that in thburner geometries the momentum of the air issufrom the swirling annulus is, along with the swnumber, an important parameter that affects the flalength.
3.3. Mean compositional flame structure
In this section, the mean compositional structis presented in the form of radial profiles for eachthe flames shown in Table 1. Mean and rms flucttions of temperature are plotted while only the meradial profiles are shown for the mass fractionsCO, CO2, H2, H2O, OH, and NO. Only Reynoldsaveraged (as opposed to Favre-averaged) data aresented here. Radial profiles for a range of axial lotions are shown in each of eight plots per figure. Eplot covers the fuel jet velocities or swirl numbeinvestigated for the particular fuel. Results are dcussed here for each fuel separately. The entireset may be accessed on the web [20].
3.3.1. Methane (SM) flamesFig. 14 shows the radial profiles of mean temp
ature and its rms fluctuations for various axial loctions in flames SM1 and SM2. The mean perceage mass fractions,Yi of the species are shown
-
the following order:YCO2 andYCO in Fig. 15; YH2Oand YH2 in Fig. 16; andYOH and YNO in Fig. 17.For flame SM1, the peak mean temperature increfrom about 1500 K up tox/D = 1.1 to 1900 K atx/D = 1.5 implying that the mixing rates are relaxeat this downstream location. The rms fluctuationstemperature are of the order of about 500 K, and thdo not vary by much with axial location. The profilof YCO2 andYH2O follow those ofT fairly faithfully,while those ofYCO andYH2 are narrower with peakon the richer side of stoichiometry.
Down to x/D = 1.1, the OH profiles show narrow peaks, indicating the mean location of the retion zone, while profiles of NO are broader, more lithe mean temperature profiles and also peaking asame radial location asT . For flame SM2, which iscloser to global blow-off, the mean peak temperatand species mass fractions decrease significantlyacross the flame, even at the downstream locatiox/D = 1.5. This is consistent with the scatter plowhich show a significant degree of local extinctioccurring at all the axial locations monitored in thflame.
3.3.2. CH4–air (SMA) flameRadial profiles ofT , T ′, YCO2 andYCO, YH2O and
YH2, andYOH andYNO are shown in Figs. 18–21 foa range of axial locations in flames SMA1, SMAand SMA3. The narrow profiles of flame SMA1 aconsistent with the narrow mixing layer measuredthis flame. The profiles broaden atx/D = 2 to be-come similar to those of high-swirl flames, SMA2 aSMA3. Flame SMA3, which has a higher jet veloity than flame SMA2, has lower peak temperatudown tox/D = 2.5 due to higher stretch rates. Trms fluctuations in temperature show similar pefor all flames. In the first recirculation zone, and doto x/D ∼ 1.0, two peaks are measured forT ′, im-plying that two reaction zones (or layers of reactscalars) may exist: one on the outer edge of the reculating vortex and another on the inner edge closethe fuel jet. A single reactive scalar layer is obtainfurther downstream atx/D = 2.0. It should be notedhere, however that the high measured rms fluctuatclose to the fuel jet may well be due to an instabilin the jet, which arises due to a downstream recirlation zone caused by vortex breakdown.
While the mass fractions of CO2 and H2O fol-low a similar pattern to the temperature profiles,interesting behaviour is observed in the measuredfiles of YCO, YH2, andYNO. In the first recirculationzone close to the jet exit plane, lower peak mass ftions of CO and H2 are measured in flames SMAand SMA3 than in flame SMA1. However, the mafraction of NO in flame SMA1 is almost half that oflame SMA2. The measured peak values for all th

A.R. Masri et al. / Combustion and Flame 137 (2004) 1–37 21
Fig. 14. Radial profiles of the mean measured temperature and its rms fluctuations plotted for various axial location in themethane flames (hollow triangle, SM1; square, SM2).

22 A.R. Masri et al. / Combustion and Flame 137 (2004) 1–37
Fig. 15. Radial profiles of the mean measured mass fractions of CO2 and CO plotted for various axial location in the methaneflames (hollow triangle, SM1; square, SM2).

A.R. Masri et al. / Combustion and Flame 137 (2004) 1–37 23
Fig. 16. Radial profiles of the mean measured mass fractions of H2O and H2 plotted for various axial location in the methaneflames (hollow triangle, SM1; square, SM2).

24 A.R. Masri et al. / Combustion and Flame 137 (2004) 1–37
Fig. 17. Radial profiles of the mean measured mass fractions of OH and NO plotted for various axial location in the methaneflames (hollow triangle, SM1; square, SM2).

A.R. Masri et al. / Combustion and Flame 137 (2004) 1–37 25
Fig. 18. Radial profiles of the mean measured temperature and its rms fluctuations plotted for various axial location in themethane–air flames (solid triangle, SMA1; hollow triangle, SMA2; square, SMA3).

26 A.R. Masri et al. / Combustion and Flame 137 (2004) 1–37
Fig. 19. Radial profiles of the mean measured mass fractions of CO2 and CO plotted for various axial location in the methane–airflames (solid triangle, SMA1; hollow triangle, SMA2; square, SMA3).

A.R. Masri et al. / Combustion and Flame 137 (2004) 1–37 27
Fig. 20. Radial profiles of the mean measured mass fractions of H2O and H2 plotted for various axial location in the methane–airflames (solid triangle, SMA1; hollow triangle, SMA2; square, SMA3).

28 A.R. Masri et al. / Combustion and Flame 137 (2004) 1–37
Fig. 21. Radial profiles of the mean measured mass fractions of OH and NO plotted for various axial location in the methane–airflames (solid triangle, SMA1; hollow triangle, SMA2; square, SMA3).

A.R. Masri et al. / Combustion and Flame 137 (2004) 1–37 29
m atirl
tore-
esH
Theirl
fer-may
heme
rlynd
m-f ax-eownat
H2be
in-es
nothees.his
rac-3irl.eneda-e to
wsrac-e toe.ro-
1inses.
tlyy a
thatto
nd
eistheO
esin
i-ecehisles
ther
s. 4ous
ix-esithre-re-
axisnesssing
idm-ofni-at
ith
theorie,vemayt toot
essisuid
tion
n
species are comparable again further downstreax/D ∼ 2.0. The implication here is that higher swreduces the formation of CO and H2 but leads tohigher levels of NO which may be possibly duelonger residence times induced by stronger flowcirculation.
The profiles of YOH show fairly narrow peaksfor flame SMA1 and much broader peaks for flamSMA2 and SMA3. The location of the peaks in Ocoincide with those of peak mean temperature.wider OH profiles beg the question as to whether swleads to a broadening in the reaction zone. Only inences can be made here and a definite answeronly be obtained from direct planar imaging of treaction zone. It should also be noted here that flaSMA1 shows a slight asymmetry which is particulaobvious in the radial profiles of OH, temperature, aits rms fluctuations.
3.3.3. CH4–H2 (SMH) flameFigs. 22 to 25 show mean radial profiles for te
perature and species mass fractions for a range oial profiles in flames SMH1, SMH2 and SMH3. Thresults are presented here in the same format as shearlier for SM and SMA flames. Fig. 22 shows ththe peak mean temperatures measured atx/D = 1to 1.6 are comparable for flame SMH1 and SMwhile those for flame SMH3 are lower. It shouldnoted here that flame SMH3 develops an acousticstability, which causes a rumbling noise in the flamat about 60 Hz. The scatter plots for this flame (shown here) are distinctly bimodal, indicating that tentire flame fluctuates from burnt to unburnt modThe high rms fluctuations in temperature reflect tintermittency.
In these flames the lower peak mean mass ftions of H2 measured in flames SMH2 and SMHreflect the faster mixing rates induced by higher swProfiles ofYCO2 and YH2O are consistent with thosof temperature and similar peak values are obtaifor flames SMH1 and SMH2, albeit at different rdial locations because flame SMH2 is broader duhigher swirl. The peak levels ofYCO are also simi-lar for flames SMH1 and SMH2. Flame SMH3 shoconsistently lower levels for the measured mass ftions of combustion products and intermediates duthe high level of intermittency observed in this flam
Three points are worth noting about the radial pfiles of YOH andYNO shown in Fig. 25.
• The widths of the OH profiles in flames SMHand SMH2 are similar despite the differencesthe swirl number. This is different to what habeen observed earlier in the methane–air flamThe broadening of flame SMH3 does not directranslate into a wider OH profiles (and possibl
broader reaction zone), but rather indicatesthe whole of the recirculation zone is closestoichiometric mixture fraction (see Fig. 12) aburns intermittently.
• At the downstream location ofx/D = 3.5, flameSMH2 has higher levels of NO than flamSMH1, which has slower levels of swirl. Thisrather consistent with the results obtained formethane–air flames where higher levels of Nhave also been observed at higher swirl.
• The profiles of OH and NO measured in flamSMH1 and SMH2 are generally asymmetricthe range ofx/D less than about 2. A simlar level of asymmetry may also exist in flamSMH3 but this cannot be confirmed here sinonly half-profiles have been measured. Tasymmetry is also observed in measured profipresented earlier for temperature as well as ospecies mass fractions.
3.4. Mean reactedness
The temperature scatter plots presented in Figto 9 may be viewed as a measure of instantanereactedness in the following way: within a given mture fraction band, a fully burnt mixture is one that liclose to the profile computed for a laminar flame wlow strain rate, and this fluid sample would have aactedness of one. Conversely, a fluid sample with aactedness of zero is one that lies on the horizontaland has a temperature of about 300 K. Reactedmay, therefore, be computed for each data point uthe following definition:bT = (T − T0)/(Tb − T0).HereT0 is the ambient temperature andTb is the fullyburnt temperature at the mixture fraction of the flusample. Values ofTb are taken here as those coputed for a laminar flame with a low strain rate33 s−1. It should be noted here that a better defition for bT would use the temperatures observedthe mixing asymptote (which increases linearly wmixture fraction) instead of the fixed values ofT0.This definition, however, is not used here sinceslope of the mixing asymptote is not known a priand it varies slightly with the fuel mixture. Thereforfluid samples along the mixing asymptote would hareactedness larger than zero even though therehave been little or no chemical reaction subsequenthese samples mixing with reacting fluid or with hcombustion products.
A measure of the mean conditional reactedn〈bT | ξ = ξs〉 at a given axial location in the flamecomputed by taking a mean reactedness for the flsamples measured in the a narrow mixture fracband around stoichiometric (in the range 0.95ξs �ξ � 1.05ξs). Fig. 26 shows axial profiles of the meaconditional reactedness at stoichiometric,〈bT | ξ =

30 A.R. Masri et al. / Combustion and Flame 137 (2004) 1–37
Fig. 22. Radial profiles of the mean measured temperature and its rms fluctuations plotted for various axial location in themethane–hydrogen flames (solid triangle, SMH1; hollow triangle, SMH2; square, SMH3).

A.R. Masri et al. / Combustion and Flame 137 (2004) 1–37 31
Fig. 23. Radial profiles of the mean measured mass fractions of CO2 and CO plotted for various axial location in themethane–hydrogen flames (solid triangle, SMH1; hollow triangle, SMH2; square, SMH3).

32 A.R. Masri et al. / Combustion and Flame 137 (2004) 1–37
Fig. 24. Radial profiles of the mean measured mass fractions of H2O and H2 plotted for various axial location in themethane–hydrogen flames (solid triangle, SMH1; hollow triangle, SMH2; square, SMH3).

A.R. Masri et al. / Combustion and Flame 137 (2004) 1–37 33
Fig. 25. Radial profiles of the mean measured mass fractions of OH and NO plotted for various axial location in themethane–hydrogen flames (solid triangle, SMH1; hollow triangle, SMH2; square, SMH3).
34 A.R. Masri et al. / Combustion and Flame 137 (2004) 1–37
et-
his
hann-re-by
y
ncyndure
aln
ally-
).,
A1,.
ng3
3,t-
n-
re-oseed-ofs-ndsrnerd inir-ientralantersantn-fer-rmc-ki-turees,
onsin the
s,ea-ula-xistowtrygh
ob-lesnt.
ex-s,inse
ly
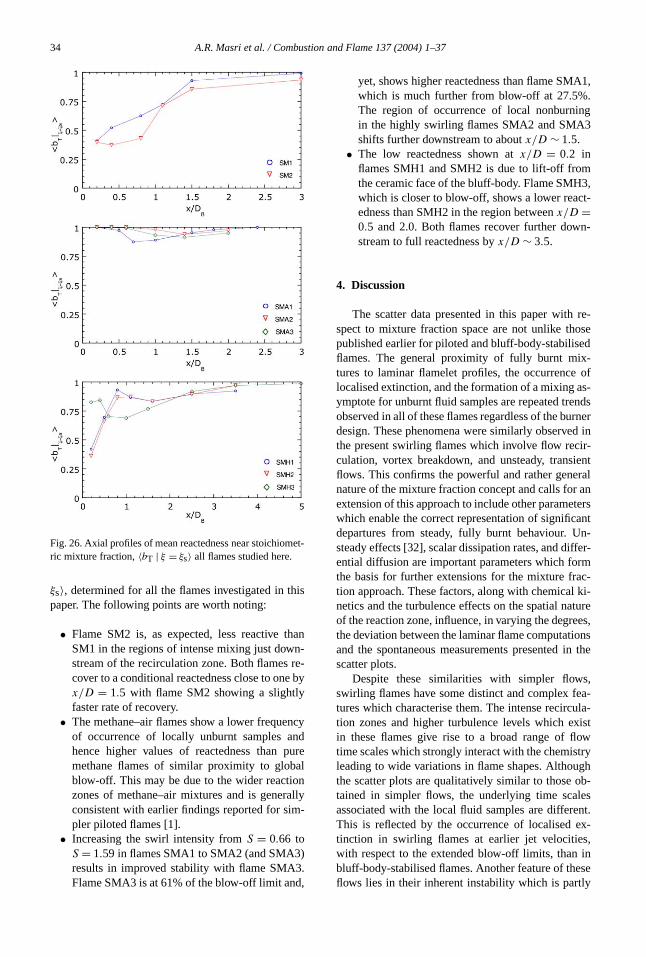
Fig. 26. Axial profiles of mean reactedness near stoichiomric mixture fraction,〈bT | ξ = ξs〉 all flames studied here.
ξs〉, determined for all the flames investigated in tpaper. The following points are worth noting:
• Flame SM2 is, as expected, less reactive tSM1 in the regions of intense mixing just dowstream of the recirculation zone. Both flamescover to a conditional reactedness close to onex/D = 1.5 with flame SM2 showing a slightlfaster rate of recovery.
• The methane–air flames show a lower frequeof occurrence of locally unburnt samples ahence higher values of reactedness than pmethane flames of similar proximity to globblow-off. This may be due to the wider reactiozones of methane–air mixtures and is generconsistent with earlier findings reported for simpler piloted flames [1].
• Increasing the swirl intensity fromS = 0.66 toS = 1.59 in flames SMA1 to SMA2 (and SMA3results in improved stability with flame SMA3Flame SMA3 is at 61% of the blow-off limit and
yet, shows higher reactedness than flame SMwhich is much further from blow-off at 27.5%The region of occurrence of local nonburniin the highly swirling flames SMA2 and SMAshifts further downstream to aboutx/D ∼ 1.5.
• The low reactedness shown atx/D = 0.2 inflames SMH1 and SMH2 is due to lift-off fromthe ceramic face of the bluff-body. Flame SMHwhich is closer to blow-off, shows a lower reacedness than SMH2 in the region betweenx/D =0.5 and 2.0. Both flames recover further dowstream to full reactedness byx/D ∼ 3.5.
4. Discussion
The scatter data presented in this paper withspect to mixture fraction space are not unlike thpublished earlier for piloted and bluff-body-stabilisflames. The general proximity of fully burnt mixtures to laminar flamelet profiles, the occurrencelocalised extinction, and the formation of a mixing aymptote for unburnt fluid samples are repeated treobserved in all of these flames regardless of the budesign. These phenomena were similarly observethe present swirling flames which involve flow recculation, vortex breakdown, and unsteady, transflows. This confirms the powerful and rather genenature of the mixture fraction concept and calls forextension of this approach to include other paramewhich enable the correct representation of significdepartures from steady, fully burnt behaviour. Usteady effects [32], scalar dissipation rates, and difential diffusion are important parameters which fothe basis for further extensions for the mixture fration approach. These factors, along with chemicalnetics and the turbulence effects on the spatial naof the reaction zone, influence, in varying the degrethe deviation between the laminar flame computatiand the spontaneous measurements presentedscatter plots.
Despite these similarities with simpler flowswirling flames have some distinct and complex ftures which characterise them. The intense recirction zones and higher turbulence levels which ein these flames give rise to a broad range of fltime scales which strongly interact with the chemisleading to wide variations in flame shapes. Althouthe scatter plots are qualitatively similar to thosetained in simpler flows, the underlying time scaassociated with the local fluid samples are differeThis is reflected by the occurrence of localisedtinction in swirling flames at earlier jet velocitiewith respect to the extended blow-off limits, thanbluff-body-stabilised flames. Another feature of theflows lies in their inherent instability which is part

A.R. Masri et al. / Combustion and Flame 137 (2004) 1–37 35
the
ar-ingar-x-assatednred0%lots.idex-tednlyn-atstill
m-
x-ofas
dy-chceeretasn
n-ca-
dsamedn-s.lo-
os-
x-].ighy inm-ant.si-velythemesncyionsr-and
iontheed
ured.ga-
herithbil-
texowve-w
ndenthep-ak-al,r a
outwithor-eenthista-re-
eds
thelu-us-irlens
irl,edsofes.
ve-oeenxes
om-s ofm-ear-atfur-to
in
dlingmul-
responsible for the enhanced mixing rates andbroadening of the flame stability limits.
An interesting question which has been raised elier in this paper is whether fluid samples populatthe region below the burnt limit are extinguished, ptially burnt, or have never been ignited. To further eamine this issue, conditional scatter plots for the mfraction of OH and temperature have been generfor data points which lie within a mixture fractioband centred around stoichiometric. Only measufluid samples with temperatures which are below 8of the flamelet temperature are shown on these pThis conditioning is done to restrict the plots to flusamples which may be thought of as potentiallytinguished. The resulting scatter plots (not presenhere) show that some fluid samples, which maioriginate from the lean side of stoichiometric, cotinue to have high levels of OH. This implies ththese samples have indeed been ignited and are(at least) partially reactive. The remaining fluid saples are fully extinguished.
The occurrence of nonburning or localised etinction in the region immediately downstreamthe primary stabilisation zone is not new and hbeen observed extensively in piloted and bluff-bostabilised flames [1]. However, the new finding whiis particular to these swirling flows is the occurrenof localised extinction at downstream locations whreignition would normally occur if swirl was nopresent. This is true for highly swirling flames suchflame SMA3 which still has a significant proportioof locally extinguished samples even atx = 100 mm(x/D = 2.0), some two bluff-body diameters dowstream. It should be noted that this downstream lotion may still part of the large vortex which extendown to about two bluff-body diameters downstreof the jet exit plane [18]. The occurrence of localisextinction in the reacting, recirculation zone is aother feature characteristic of these swirling flame
The actual mechanisms for the occurrence ofcalised extinction remain unclear. It is generally ptulated that high scalar dissipation rates,χ , are themain reason for localised extinction, which is epected to occur whenχ reaches a critical value [34However, the role of shear stresses in inducing hstrain rates cannot be underestimated particularlthe swirling flows considered here, where all coponents of shear stress tensor may be significAlthough joint measurements of flow and compotion are difficult, separate measurements are relatisimple and have indeed been made for most offlames studied here. Results for the methane flaSM1 and SM2 have shown an interesting consistebetween the regions of high shear stresses and regof occurrence of localised extinction [27]. A compaison of the shear stresses measured in the SMA
SMH flames show an existing but weaker correlatbetween the occurrence of local extinction andregions of high shear [35]. This should be qualifiby the fact that, for some flames, only theu′w′ com-ponent of the shear stress tensor has been measThis issue is important and warrants further investitions.
The transient nature of swirling flows adds anotlevel of complication which needs to be dealt wand understood. It should be noted here that instaities are generally driven by the occurrence of vorbreakdown and are not directly induced by the flin the swirling annulus. Time-resolved scans oflocity profiles at the exit plane of the burner shoclearly that the flow issuing from both the fuel athe swirling annulus is steady. However, and whthe swirl number exceeds a certain threshold,jet develops a certain level of instability which apears to be driven by the downstream vortex bredown [33]. This is confirmed by three-dimensionunsteady RANS computations which show that, fogiven axial velocity in the swirl annulus,Us, flow pre-cession sets in at a threshold swirl number of ab0.23 and the frequency of precession increasesswirl to a maximum just before the occurrence of vtex breakdown [33]. Imaging experiments have bconducted to investigate the nature and extent ofinstability and to compare with the RANS computions. Although some results have already beenported [33,36], this issue is very complex and neto be explored further.
The detailed means and rms fluctuations ofmixing and composition fields are extremely vaable for the development and validation of combtion models. It is evident that the introduction of swenhances mixing, shortens the flame, and broadits radial profiles in real space. With increasing swhigher levels of NO appear to be produced. This neto be ascertained by calculating the actual fluxthese species at various axial locations in the flamSuch calculations require joint measurements oflocity and composition which are very difficult tachieve. However, if statistical independence betwvelocity and composition is assumed then these flumay be computed from the separate velocity and cposition data. It is noted that the measured levelrms fluctuations of mixture fraction, as well as teperature, are generally higher than those reportedlier for bluff-body-stabilised flames [2] especiallythe upstream locations but become comparablether downstream. Although this may be partly dueinstabilities, it reflects the improved mixing ratesswirl-stabilised flows.
The availability of composition and flow-fielmeasurements in these swirling flames is reveadespite the fact that such measurements are not si

36 A.R. Masri et al. / Combustion and Flame 137 (2004) 1–37
thee-howio-theoth
ionvehere-isera-ther
t,ereofrvedlourll asarei-x-asw-iontantirl:
lrisofere
shea-
art in
c-ex-ls.herar-ce
uelons
rchceci-
y
r,
3–
m-
roc.
T.oc.
u,27
,
t.
t.
19–
07.28
-
29
st.
nds,
d
e,rl.
r,
t-9–
27
taneous. One issue of relevance to calculations islocation of the mean stoichiometric contour with rspect to the recirculation zones. Measurements sthat for the SM and SMH flames, the mean stoichmetric contours and hence the mean location ofreaction zone lie generally on the outer edges of bthe primary and secondary (if they exist) recirculatregions. However, for the SMA flames which haa larger stoichiometric mixture fraction of 0.25, tmean reaction zone is embedded well within thecirculating vortex. This and other features which arfrom comparing the measured flow, mixing, tempeture, and composition fields are discussed in anopublication [35].
5. Conclusions
A detailed compositional structure of turbulennonpremixed swirl-stabilised flames is presented hin the form of scatter plots and radial profilesmeans and rms fluctuations of reactive and consescalars. Each data point in the scatter plots is cocoded so that its location in physical space as wemixture fraction space is known. The scatter plotsqualitatively similar to those reported earlier for ploted and bluff-body-stabilised flames with locally etinguished fluid samples occurring more frequentlythe flames approach blow-off. This confirms the poerful and representative nature of the mixture fractapproach. There are, however, subtle and impordifferences which arise due to the existence of sw
• At sufficiently higher swirl numbers and fuejet velocities, local extinction is found to occuwithin the secondary recirculating zone whichinduced by vortex breakdown. The predictionthis phenomenon will be an excellent and sevtest for combustion modellers.
• A large proportion of the unburnt fluid sampleoriginate from outer radial locations closer to tcoflow air rather than the fuel jet. The mechnism of inducing local extinction is not yet clebut high tangential shear stresses tend to existhese regions of swirling flows.
The mean mixing fields and compositional struture have been fully mapped and these will betremely useful for the validation of numerical tooThe measured rms fluctuations are generally higthan those measured in nonswirling flows. This is pticularly true at upstream locations where turbulenlevels are high. It is acknowledged that the central fjet may also become unstable at certain conditiand this may contribute to the higher fluctuations.
Acknowledgments
This work is supported by the Australian ReseaCouncil and the US Department of Energy, Offiof Basic Energy Sciences, Division of Chemical Sences.
References
[1] A.R. Masri, R.W. Dibble, R.S. Barlow, Prog. EnergCombust. Sci. 22 (1996) 307–362.
[2] B.B. Dally, A.R. Masri, R.S. Barlow, G.J. FiechtneCombust. Flame 114 (1998) 119–148.
[3] N. Syred, J.M. Ber, Combust. Flame 23 (1974) 14201.
[4] D.G. Sloan, P.J. Smith, L.D. Smoot, Prog. Energy Cobust. Sci. 12 (1986) 163–250.
[5] M.M. Tacke, T.C. Cheng, E.P. Hassel, J. Janicka, PCombust. Inst. 26 (1996) 169–175.
[6] T. Landenfeld, A. Kremer, E.P. Hassel, J. Janicka,Shafer, J. Kazenwadel, C. Schulz, J. Wolfram, PrCombust. Inst. 27 (1998) 1023–1030.
[7] T.S. Cheng, Y.-C. Chao, D.-C. Wu, T. Yuan, C.-C. LC.-K. Cheng, J.-M. Chang, Proc. Combust. Inst.(1998) 1229–1237.
[8] W. Meier, O. Keck, B. Noll, O. Kunz, W. StrickerAppl. Phys. B 71 (2000) 725–731.
[9] O. Keck, W. Meier, W. Stricker, M. Aigner, CombusSci. Technol. 174 (2002) 117–151.
[10] A.Y. Klimenko, R.W. Bilger, Prog. Energy CombusSci. 25 (1999) 595–687.
[11] S.B. Pope, Prog. Energy Combust. Sci. 11 (1985) 1192.
[12] J. Xu, S.B. Pope, Combust. Flame 123 (2000) 281–3[13] Q. Tang, J. Xu, S.B. Pope, Proc. Combust. Inst.
(2000) 133–139.[14] R.P. Lindstedt, S.A. Louloudi, E.M. Vâos, Proc. Com
bust. Inst. 28 (2000) 149–156.[15] R.P. Lindstedt, S.A. Louloudi, Proc. Combust. Inst.
(2002) 2147–2154.[16] A.R. Masri, S.B. Pope, B.B. Dally, Proc. Combu
Inst. 28 (2000) 123–131.[17] The International Workshop on Measurement a
Computation of Turbulent Nonpremixed Flamehttp://www.ca.sandia.gov/tdf/Workshop.html.
[18] Y.M. Al-Abdeli, A.R. Masri, Combust. Theory anModelling 7 (2003) 731–766.
[19] Y.M. Al-Abdeli, A.R. Masri, Exp. Therm. FluidScien. 21 (5) (2003) 655–665.
[20] University of Sydney, Swirl Flame Web Databashttp://www.aeromech.usyd.edu.au/thermofluids/swihtml, 2002.
[21] B.B. Dally, A.R. Masri, R.S. Barlow, G.J. FiechtneCombust. Flame 132 (2003) 272–274.
[22] Q.V. Nguyen, R.W. Dibble, C.D. Carter, G.J. Fiechner, R.S. Barlow, Combust. Flame 105 (1996) 49510.
[23] J.H. Frank, R.S. Barlow, Proc. Combust. Inst.(1998) 759–766.

A.R. Masri et al. / Combustion and Flame 137 (2004) 1–37 37
t.
r-on
80
heofa-of
98)
. 27
ptsw
24
i,ea-ndus-e,
0.
g
-st.
[24] R.W. Dibble, A.R. Masri, R.W. Bilger, CombusFlame 67 (1987) 189–206.
[25] R.W. Dibble, S.H. Stårner, A.R. Masri, R.S. Balow, Appl. Phys. B (Special Issue on CombustiDiagnostics) (1990) 1727–1731.
[26] R.W. Bilger, S.H. Stårner, R.J. Lee, Combust. Flame(1990) 135–149.
[27] P.A.M. Kalt, Y.M. Al-Abdeli, A.R. Masri, R.S. Barlow,Proc. Combust. Inst. 29 (2002) 1913–1919.
[28] J.A. Miller, R.J. Kee, M.D. Smooke, J.F. Grcar, TComputation of the Structure and Extinction Limita Methane–Air Stagnation Point Diffusion Flame, Pper WSS/CI 84-10, 1984, Western States Sectionthe Combustion Institute.
[29] H. Pitsch, N. Peters, Combust. Flame 114 (1926–40.
[30] H. Pitsch, M. Chen, N. Peters, Proc. Combust. Inst(1998) 1057–1064.
[31] S.R. Turns, An Introduction to Combustion, Conceand Applications, second ed., McGraw–Hill, NeYork, 2000.
[32] R.S. Barlow, J.-Y. Chen, Proc. Combust. Inst.(1994) 231–237.
[33] B. Guo, D.F. Fletcher, G. Marquez, Y.M. Al-AbdelS.H. Starner, A.R. Masri, RANS calculations and msurements of instabilities in swirl-stabilised jets aflames, in: 2003 Australian Symposium on Combtion and The 8th Australian Flame Days, MelbournAustralia, 2003, in press.
[34] N. Peters, Proc. Combust. Inst. 21 (1988) 1231–125[35] Y.M. Al-Abdeli, A.R. Masri, P.A.M. Kalt, R.S. Barlow,
Turbulence-chemistry interactions in highly swirlinnonpremixed flames, (2004), in preparation.
[36] Y.M. Al-Abdeli, A.R. Masri, Precession and recirculation in turbulent swirling isothermal jets, CombuSci. Technol. (2004), in press.