SFC 199 - COMBI BOILERS - (Natural Gas or Propane) - INST ...
Upload
independentCategory
view
0download
0
Flame Inhibition by Phosphorus-Containing Compounds over a Range of Equivalence Ratios
T.M. Jayaweera#, C.F. Melius, W.J. Pitz*, C.K. Westbrook
Lawrence Livermore National Laboratory
PO Box 808, Livermore, CA 94551-0808 USA
O.P. Korobeinichev, V.M. Shvartsberg, A.G. Shmakov, I.V. Rybitskaya
Institute of Chemical Kinetics and Combustion
Novosibirsk, 630090 Russia
H. Curran
Department of Chemistry
National University of Ireland, Galway
Galway, Ireland
Paper 04S-43
To be presented at Western States Section of the Combustion Institute
2004 Spring Meeting University of California, Davis
March 29-30, 2004 Shortened Running Title: Effect of Equivalence Ratio on Inhibition *corresponding author
Tel: 925-422-7730
Fax: 925-423-8772
Email: [email protected] #Current address:
FM Global Research, Norwood, MA 02062

Abstract There is much interest in the combustion mechanism of organophosphorus compounds (OPCs) due to their role as potential halon replacements in fire suppression. A continuing investigation of the inhibition activity of organophosphorus compounds under a range of equivalence ratios was performed experimentally and computationally, as measured by the burning velocity. Updates to a previous mechanism were made by the addition and modification of reactions in the mechanism for a more complete description of the recombination reactions. In this work, the laminar flame speed is measured experimentally and calculated numerically for a premixed propane/air flame, under a range of equivalence ratios, undoped and doped with dimethyl methylphosphonate (DMMP). A detailed investigation of the catalytic cycles involved in the recombination of key flame radicals is made for two equivalence ratios, lean and rich. From this, the importance of different catalytic cycles involved in the lean versus rich case is discussed. Although the importance of certain cycles is different under different stoichiometries, the OPCs are similarly effective across the range, demonstrating the robustness of OPCs as flame suppressants. In addition, it is shown that the phosphorus compounds are most active in the high temperature region of the flame. This may, in part, explain their high level of inhibition effectiveness.
1. Introduction
For many years, halogenated hydrocarbons, such as CF3Br, were used as fire
suppressants. However, due to their high ozone depletion potential, they are no longer being
manufactured in industrialized countries, as stipulated in the 1990 Montreal Protocol. The
search for effective replacements has led to a family of organophosphorus compounds (OPCs)
that have shown considerable promise as flame inhibitors [1-3]. Early work of Twarowski [4-6]
demonstrated that phosphine (PH3) accelerated radical recombination in hydrogen oxidation, and
subsequent work by Korobeinichev et al. began to explain how OPCs inhibited hydrogen flames
[7] and hydrocarbon flames [8].
Chemically active flame inhibitors alter flame chemistry by catalytic recombination of
key flame radicals, especially H and O atoms and OH radicals. H atoms are particularly
important in flame propagation, since the principal chain branching reaction in hydrogen and
hydrocarbon flames is H + O2 OH + O. Fast elementary reactions interconnect these small
radical species, and removal of any of them through recombination reduces concentrations of all
of them correspondingly. Therefore, radical recombination leads to fewer H atoms in the
reaction zone, which leads to reduced chain branching and a lower burning velocity in a
premixed flame. This applies to familiar halogenated suppressants such as HBr and CF3Br [9,
10] and OPCs such as dimethyl methylphosphonate (DMMP) [11].
Twarowski [4-6] established that catalytic recombination of radicals by phosphine (PH3)
is accomplished by reactions of small P-containing species produced from the additive,
particularly

H + PO2 + M HOPO + M (1a)
HOPO + H H2 + PO2 (1b)
OH + PO2 (+ M ) HOPO2 (+ M ) (2a)
H + HOPO2 H2O + PO2 (2b)
which consume highly reactive H atoms and OH radicals to produce stable H2 and H2O. In
most kinetic modeling studies of inhibition by OPC additives, an additional reaction between
HOPO and OH to produce PO2 and water is also included. Thus, the species of most interest in
suppression are those phosphorus oxy-acids such as HOPO, PO2, and HOPO2.
Most investigations of inhibition by OPCs have been carried out in flames under
stoichiometric conditions or in static or flow reactors in which diffusional transport is not
important. The present study examines the effect of fuel/oxygen ratios on the chemical kinetics
of inhibition by OPCs in laminar premixed flames and how that inhibition may change for
different equivalence ratios. In lean hydrocarbon flames, OH radicals and O atoms normally
dominate the reacting radical pool while H atoms are most prevalent in rich conditions. Since
the species present will affect which catalytic recombination cycles take place to promote
suppression, it is likely that the mechanism of suppression will be different under different
stoichiometries. In this study, a detailed investigation of the different suppression cycles for the
rich and lean flames is performed.
In the current work, a detailed investigation of the reaction cycles for a range of
equivalence ratios is performed numerically. In doing this, it was determined that the original
formulation of the mechanism used needed significant improvement. The validation of the

mechanism is done by comparing the laminar flame speed to that measured experimentally in a
Mache-Hebra nozzle burner.
2. Experimental Work
The speed of premixed C3H8/air flames was measured using a Mache- Hebra nozzle
burner [12, 13] and the total area method from an image of the flame. Experimental technique is
described in detail elsewhere [8]. To evaluate the influence of a heat loss from the flame to the
burner on the measured values the speed of undoped propane/air flames of various
stoichiometries was measured for T0=298 K (the reactant temperature exiting the burner). The
obtained result of 41.7 cm/sec for a stoichiometric flame is comparable with experimental data
measured by different techniques [14-16]. This gives validity of the method used for
measurement of flame burning velocities.
In addition, the flame speed of DMMP-doped propane/air flames under a range of
equivalence ratios was measured. The fuel/air equivalence ratio was varied from 0.8-1.3 in 0.1
increments. In this case, to minimize condensation of DMMP on the burner surface, the reactant
temperature was increased to 368 K. The loadings tested were: 0, 300, and 600 ppm of DMMP.
The results from these experiments are shown in Fig. 1. Uncertainty in measured values is
included in the figure for the undoped flame. The same percentage error can be applied for the
doped flames. Additionally, the uncertainty in the dopant loading is +/- 40 PPM and the relative
uncertainty in the equivalence ratio is +/- 2 percent.
3. Modeling Approach
3.1. Phosphorus Mechanism

The chemical kinetic mechanism is based on a mechanism previously described by
Korobeinichev [17]. As described there, this mechanism has important updates in the species
thermochemistry and in the reaction mechanism. The thermochemistry for the key phosphorus
species, POxHy, was recalculated using a more accurate method (BAC-G2). In addition, a more
complete analysis of the reaction pathways was performed.
A new reaction pathway by which HOPO2 can be converted to PO2 and H2O,
augmenting the direct reaction 2b above, was developed. Although the basics of these reactions
are described in another paper [17], further details are given here. Reaction 2b is treated as a
multichannel reaction:
HOPO2 + H ↔ HPO(OH)O ↔ PO(OH)2 H2O + PO2 (2c)
HOPO2 + H ↔ PO(OH)2 H2O + PO2 (2d)
The potential energy surface (PES) for this set of reactions is given as Fig. 2. It is very similar to
that obtained by Mackie [18] but includes the additional pathway via HPO(OH)O, reaction 2c.
The addition of a hydrogen atom to the phosphorus atom (reaction 2c) has no barrier and the 1,2
hydrogen shift to PO(OH)2 is only 1.5 kcal/mole above the incoming reactants. Consequently,
reaction 2c is almost 10 times faster at 1500 K than reaction 2d which has a barrier of 8
kcal/mole. Since the contribution of reaction 2d is small, it was omitted from the reaction
mechanism.
The pressure dependence of the HOPO2 + H system was recomputed using the BAC-G2
barrier heights. Rate constants for the reaction paths in Fig. 2 were estimated using Quantum
RRK analysis to obtain k(E) and master equation analysis [19] to evaluate pressure fall-off. For

the master equation analysis, an exponential-down energy-transfer model was used, with a
collisional step-size down (∆Edown) = 142.9 (T/300)1.297 cm−1. These values were based on the
step-size down used by Tsang and Herron for NO2 + OH system [20]. The bath gas was air and
Lennard-Jones parameters for the adduct are a cross section of 5.5 Å and ε/k of 250 K. Our
analysis shows much more stabilization to form the PO(OH)2 adduct that reported by Mackie et
al. [18]. We attribute this difference to our use of a much larger collisional step-size down.
A similar BAC-G2 analysis was also done for HOPO + H, reaction 1b given above,
which is treated as a multichannel reaction:
HOPO + H PO2 + H2 (1c)
HOPO + H ↔ PH(OH)O ↔ P(OH)2 PO + H2O (1d)
HOPO + H ↔ P(OH)2 PO + H2O (1e)
The potential energy surface for this reaction is given in Fig. 3. Because of a high pre-
exponential factor, the abstraction path (1c) dominates and paths 1d and 1e play a minor role. In
this case, the addition of an H atom to the phosphorus atom (1d) did not give an overall barrier to
products lower than the addition to the oxygen atom (path 1e) as was seen in the HOPO2 + H
reaction pathway. Also included on both these PESs are other reactions that go through the same
intermediary species. These reactions are HOPO + OH and HPO2 + OH on Fig. 2 and HPO +
OH on Fig. 3. As one can see in this figure, the phosphorus can start in a variety of forms
(HOPO, HOPO2, HPO, or HPO2), but will eventually end with the PO2 + H2O as products. This
demonstrates how PO2 is a central species in the inhibition cycles, regardless of the oxidation
level of the POxHy species present.

Further modifications were made to various reaction rates, to bring them more aligned
with ab initio calculations. The complete mechanism is available electronically from the
corresponding author.
3.2. Computational Model
In this work, Premix, in the Chemkin 3.7.1 suite of programs [21], was used to calculate
the laminar burning velocity. A freely propagating premixed flame of C3H8/air, with and without
dimethyl methylphosphonate (DMMP), was studied. The equivalence ratio was varied from φ
=0.8-1.3 in 0.1 increments and the DMMP loadings tested were 0 and 600 ppm, to match the
experimental work. For reference, Figs. 4a and 4b give the major species and temperature
profiles for the doped lean (φ=0.8) and rich (φ=1.3) flames, respectively. The reactants were at
atmospheric pressure with an initial temperature of 368 K, again to match the experimental
conditions. In all calculations, the energy equation was solved, and mixture-averaged diffusion
was used. Windward differencing was used and the grid was refined down to a value of
GRAD=0.1 CURV<0.2. These values of GRAD and CURV supplied a sufficient refinement of
the grid such that the flame speed was independent of number of grid points (~200-250).
A recently refined high temperature propane oxidation mechanism [22] was used for the
hydrocarbon species, with updated thermodynamics parameters. At T=300 K, P=1 atm and φ=1,
this mechanism computes a laminar burning velocity of 41.1 cm/sec, in good agreement with our
own experimental values above and other experimental studies. Further validation has been
performed comparing the mechanism with shock-tube studies [23].
4. Results and Discussion

The new mechanism was used to calculate the effect of 600 ppm of DMMP on a
propane/air flame with varying equivalence ratio. Two measures can be used to measure the
effectiveness of an inhibitor on a premixed flame: change in radical concentration and change in
laminar burning velocity. Both shall be discussed here, focusing on the φ=0.8 and φ=1.3 flames.
As described above, a dopant acts to inhibit a flame by radically recombining the key
flame radicals, namely H and OH. Thus, a plot of the concentrations of these two species across
a flame with and without a dopant is a useful tool. Given in Figs. 5a and 5b are the mole
fractions of H and OH with and without 600 ppm of DMMP for the lean and rich flames,
respectively. The solid lines represent the undoped flame, while the dashed lines include the
DMMP. As is apparent in these figures, the DMMP is reducing the concentration of the flame
radicals fairly significantly in the two flames. It appears that in the rich flame, there is a greater
reduction of the radicals, particularly of H, than in the lean flame. This will be explored further
below.
Figure 6 gives the calculated flame speeds for the undoped and 600 ppm DMMP-doped
flames. The curve represents a second-order polynomial fit of the data. As can be seen, the data
fall well onto the line, although there is a small amount of numerical scatter. It appears that there
is little difference in the effectiveness of the lean and rich flame. To further explore this, the
measured and calculated flame speeds for the doped flame were normalized to the undoped
value: (Suo-Su)/Suo. The results of this are given in Fig. 7. Two points can be made from this
figure. Firstly, the mechanism does a reasonable job at predicting the measured inhibition
effectiveness of the DMMP across the range of equivalence ratios. It should be noted that, as
can be observed in Fig. 1, the uncertainty in the experimental measurements are relatively large

in the rich flame, thus making it difficult to make a precise comparison between the experimental
and computational results.
Secondly, according to the calculations, the DMMP appears to be monotonically
increasing in effectiveness with equivalence ratio. This effect also appeared in comparing Figs.
5a and 5b where the rich flame decreased the H concentration more so than the lean flame.
However, this effect is not apparent in the experimental work, and so it may imply the
mechanism needs more refinement. There is still some future work that can be performed,
particularly in the rich flame condition. Most of the emphasis thus far in mechanism refinement
has been focused on the activity of the H and OH radicals with the phosphorus oxy-acids.
However, in a rich flame condition, the interaction of CH3 with those phosphorus compounds
could play a large role and further investigation into their reactions should be performed.
Nonetheless, there is only a relatively minor difference in the effectiveness of the rich
and lean flames. One might actually expect a larger difference in effectiveness in the two
flames, as the radical species present in a lean, or highly oxidized flame, are different than in a
rich flame. To understand how the phosphorus compounds perform under different equivalence
ratios, a detailed investigation of the inhibition cycles of two equivalence ratios (phi=0.8 and 1.3)
was performed.
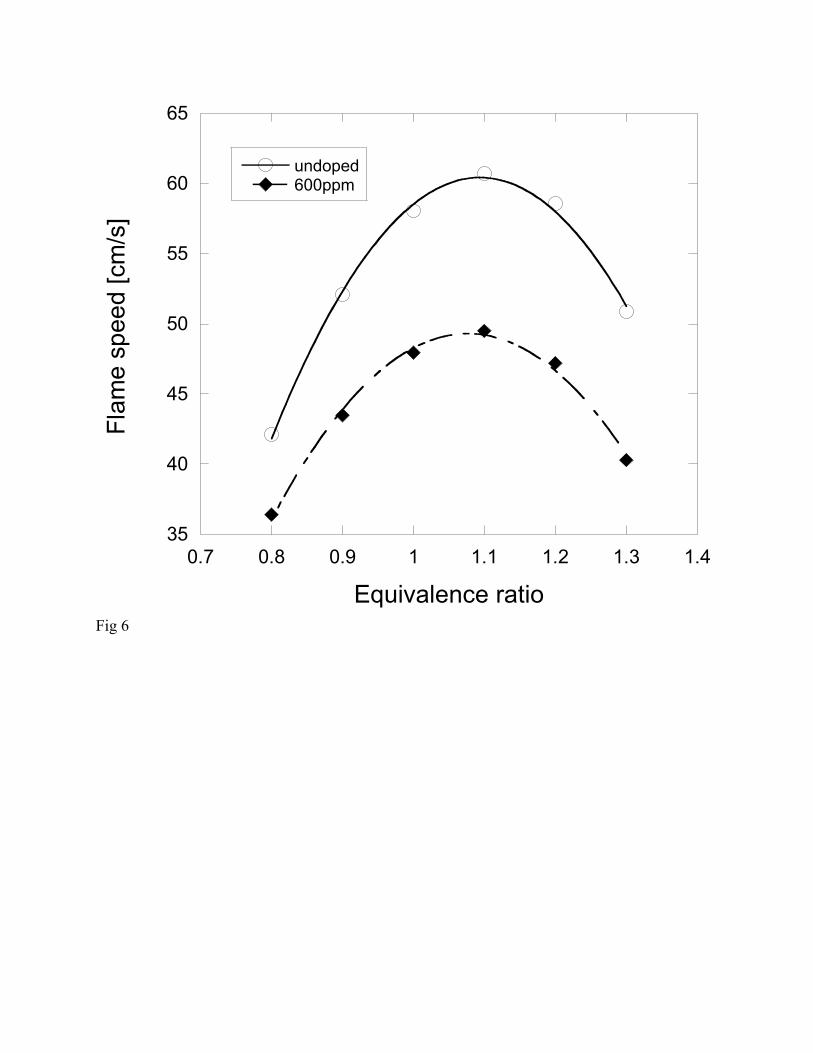
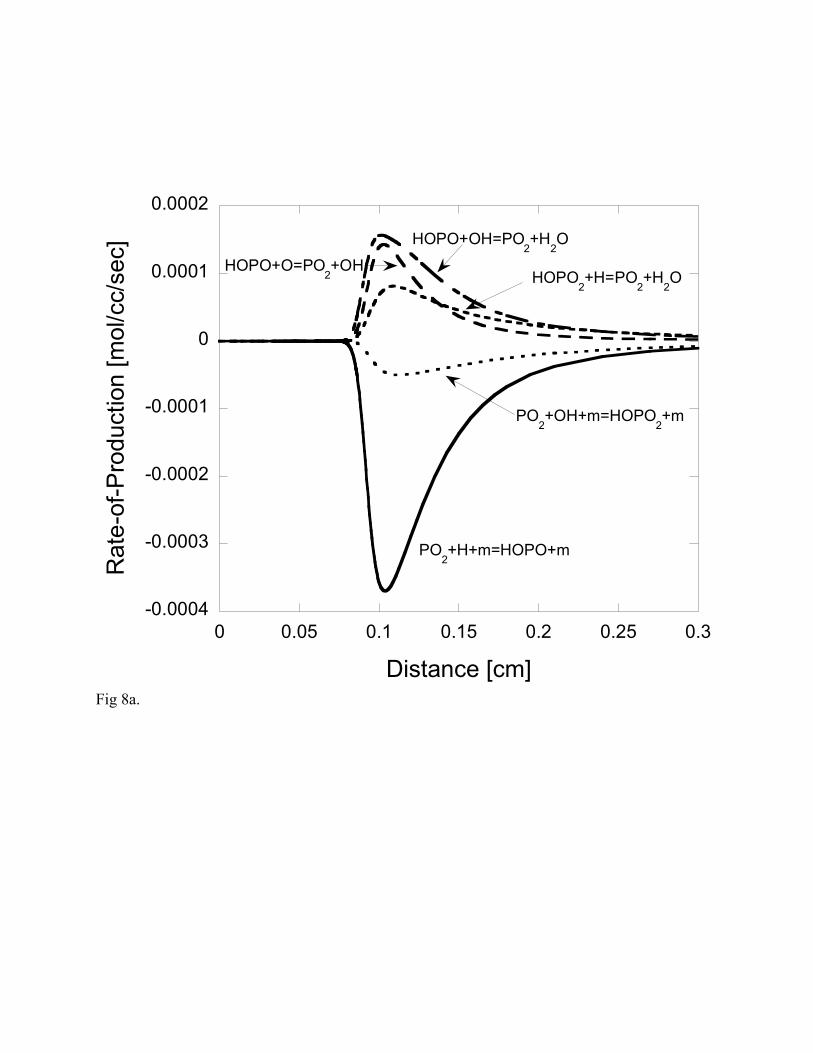
To do this, an evaluation of key phosphorus species involved in the recombination of H
and OH was evaluated using Premix. Figure 8a plots the profiles of the key phosphorus-
containing reactions involved in the production/destruction of PO2 (using rate-of-production,
ROP in moles/cc/sec, values from the post-processor of Premix) across the lean (φ=0.8) flame.
The same plot for the rich flame (φ=1.3) is given in Fig. 8b. For clarity, only the top few
reactions are included. As can be seen in the figure for both flames, the primary reaction for PO2

production is HOPO + OH PO2 + H2O. This is expected for lean flames which usually have
high OH levels. For the rich flame, it is expected that HOPO + H PO2 + H2 plays a
significant role because H-atom concentrations are usually higher and OH concentrations lower
in rich compared to lean flames. However, this reaction does not play a role due to the higher
activation energy of the reaction of HOPO with H (11 kcal/mole) compared to OH (-1.5
kcal/mole). Additionally, in the doped flames, the H-atom concentration is actually lower and
the OH concentration higher in the rich flame than in the lean flame (Fig. 5 a,b).
The same key reaction for PO2 consumption for both flames is PO2 + H +M HOPO
+M. Together, it forms a catalytic cycle with HOPO + OH PO2 + H2O where the net effect is
that H and OH recombine to form H2O. Although this reaction cycle is the most important one
for both lean and rich case, a more detailed evaluation of the key reaction cycles in flame
suppression can be made, as well as an estimate of the location in the flame at which they occur.
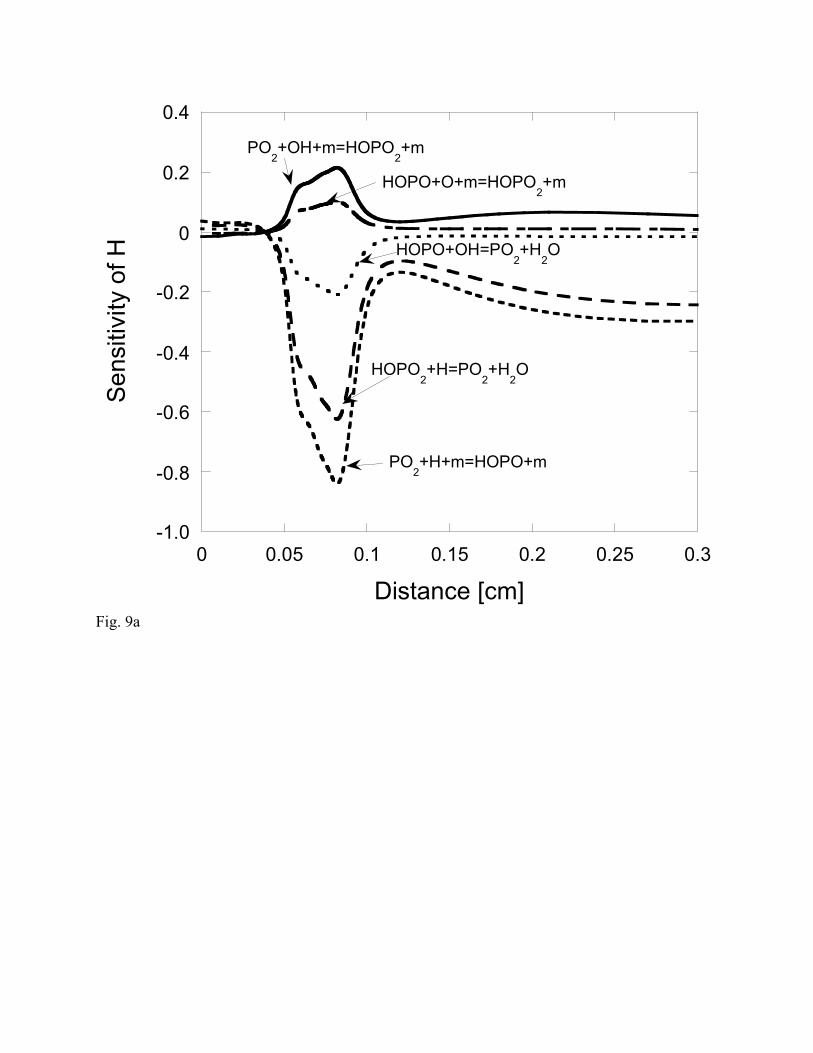
A sensitivity analysis was performed on the effect of a change in reaction rate constants
on H atom concentration. Figures 9a and 9b plot these results, for the lean and rich flame,
respectively, only including the effect of reactions involving POxHy species. Note, the key
radical propagation reaction, H+O2 OH+O is not included on these figures as its magnitude
would overwhelm the other reactions. Results for OH are similar so they are not plotted. The
maximum sensitivity to the various phosphorus reactions occurs in the primary reaction zone of
the flame. However, the phosphorus reactions have their primary activity in the post-flame
region, as seen in the rate-of-production plots. As is apparent in these figures, the chief
phosphorus reaction to which the H atom is sensitive is H+PO2 HOPO. This is also seen in
the rate-of-production plots given above.
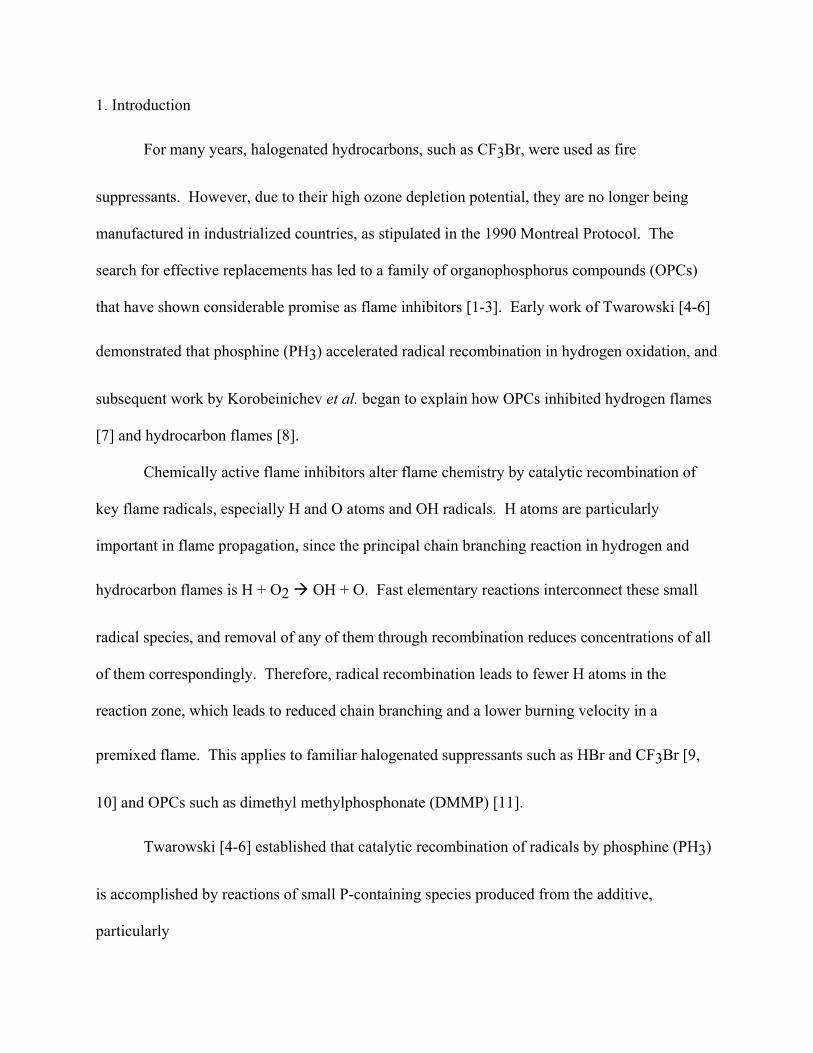
One curious aspect to note is that the H atom has a positive sensitivity to PO2+OH
HOPO2 in the flame. It is shown in the lean flame, and is also present in the rich flame, but at a
level not significant for this plot. One would think that H and OH would be negatively sensitive
to any reaction involved in H/OH recombination, but this reaction has the opposite effect. We
believe that the change in sign is due to the HOPO PO2 cycle being more efficient in
recombination. By introducing HOPO2, the phosphorus is effectively being taken away from the
HOPO cycle and thus, less H and OH are being recombined. This suggests that HOPO is a better
catalyst for recombination than HOPO2. In the lean flame, where HOPO2 is more prevalent than
in the rich flame (as will be discussed below), one might expect phosphorus to be less effective
in the lean flame. As was shown in Fig. 7, the inhibition effectiveness is similar across the range
of equivalence ratios studied, although the numerical results do indeed indicate that the
phosphorus is slightly more effective in a rich flame. This indicates that the difference of HOPO
and HOPO2 in promoting radical recombination is minimal, but still discernable.
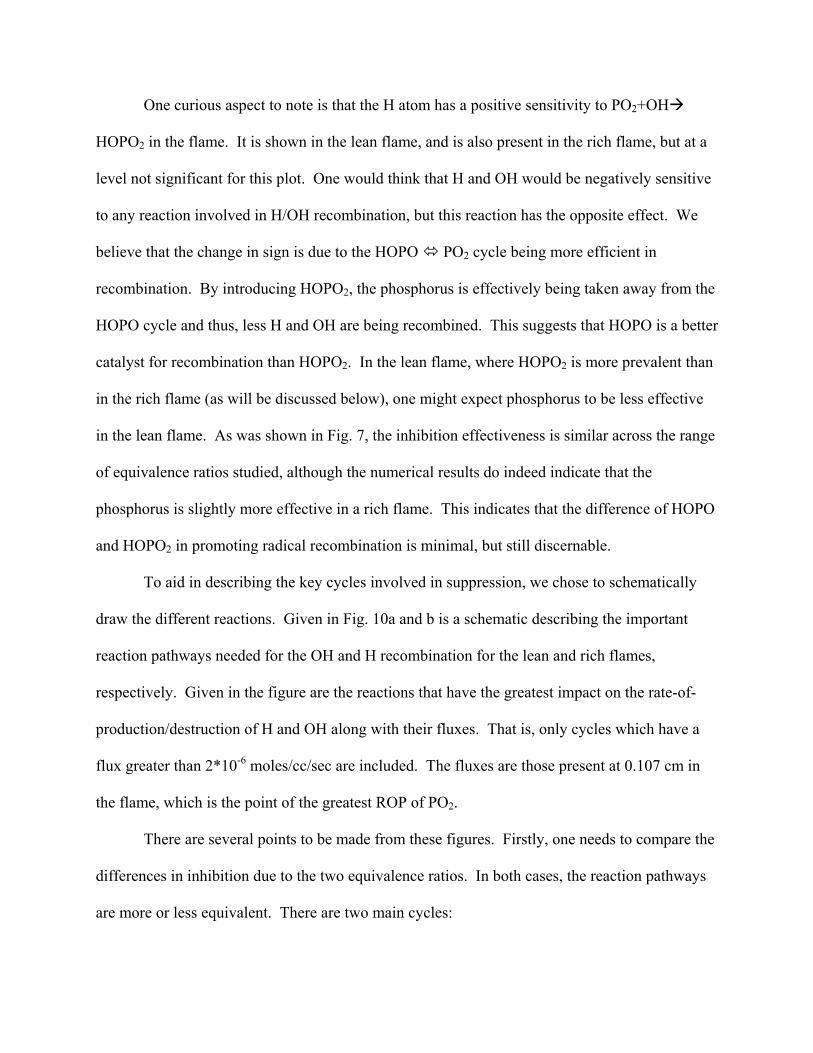
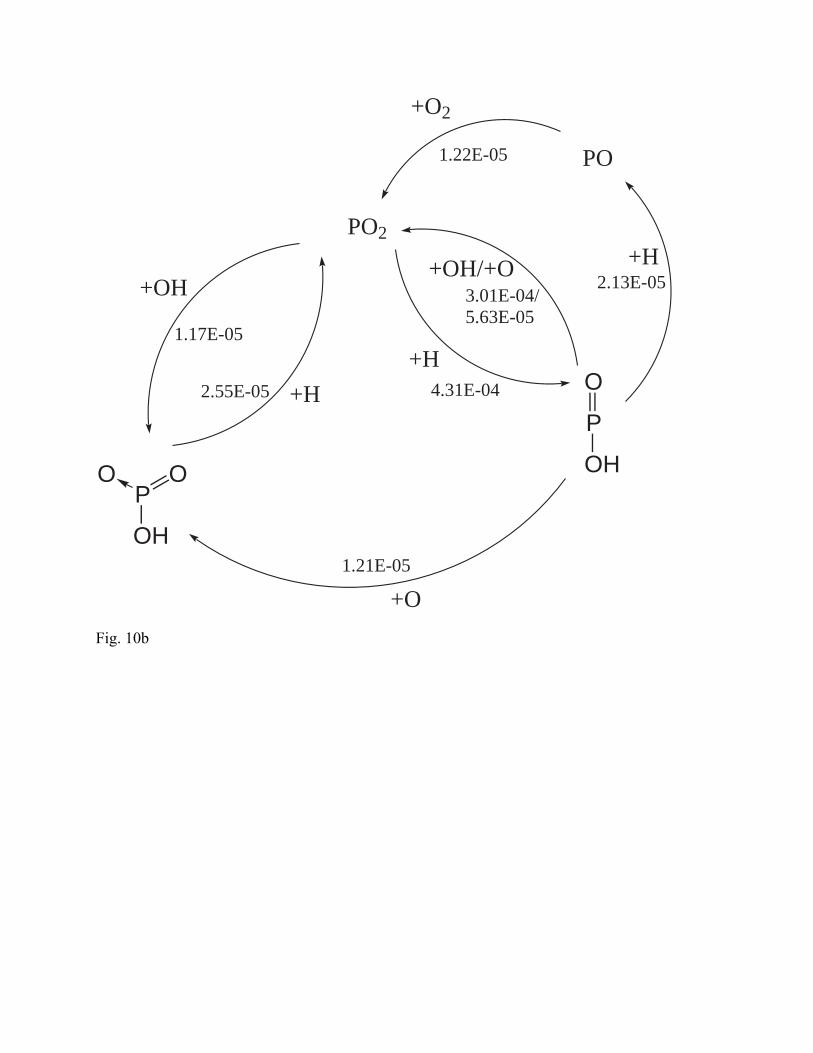
To aid in describing the key cycles involved in suppression, we chose to schematically
draw the different reactions. Given in Fig. 10a and b is a schematic describing the important
reaction pathways needed for the OH and H recombination for the lean and rich flames,
respectively. Given in the figure are the reactions that have the greatest impact on the rate-of-
production/destruction of H and OH along with their fluxes. That is, only cycles which have a
flux greater than 2*10-6 moles/cc/sec are included. The fluxes are those present at 0.107 cm in
the flame, which is the point of the greatest ROP of PO2.
There are several points to be made from these figures. Firstly, one needs to compare the
differences in inhibition due to the two equivalence ratios. In both cases, the reaction pathways
are more or less equivalent. There are two main cycles:

PO2 + H HOPO and HOPO + OH PO2 + H2O (1)
PO2 + OH HOPO2 and HOPO2 + H PO2 + H2O (2)
As can be seen in both cycles, the phosphorus compounds are acting catalytically to recombine H
and OH to form H2O. It should be noted that H+H recombination between PO2 and HOPO, as
seen by MacDonald [11] in a non-premixed flame, is also observed, but the H+OH and H+O
recombination dominates. Another reaction that is present, and part of the greater cycle, is
HOPO + O HOPO2. Although these reactions are present in both cases of equivalence ratio,
there are several differences in the two mechanisms, as well as differences in the relative
importance of the different reactions.
The key difference in a rich vs. lean flame environment is the oxidation state of the
various species. If one were to consider the phosphorus species of interest to hold the form
POxHy, then it is expected, and has been shown [17] that in a lean flame, the more oxidized
species, e.g. HOPO2, are in greater concentration than less oxidized species, e.g. HOPO. The
reverse is true in the rich flame, where the concentration of HOPO is greater than HOPO2. The
concentrations of these POxHy species, evaluated at the point of maximum PO2 rate-of-
production (x=0.107 cm) for the two flames are given in Table 1. The HPO concentration is
insignificant and does not play a role in these flames.
As a result of the different concentrations, the relative importance of the two cycles
varies, depending on the stoichiometry. Although for both flames the most important cycle is
(1), this cycle is approximately 30% more important in the rich flame, where HOPO is more
prevalent, than in the lean flame. Similarly in the rich flame, PO is playing a significant role,
while for the lean flame, the corresponding species is PO3. Also, in the lean flame, because of
the relatively high concentration of HOPO2, the alternate route through PO(OH) 2 becomes
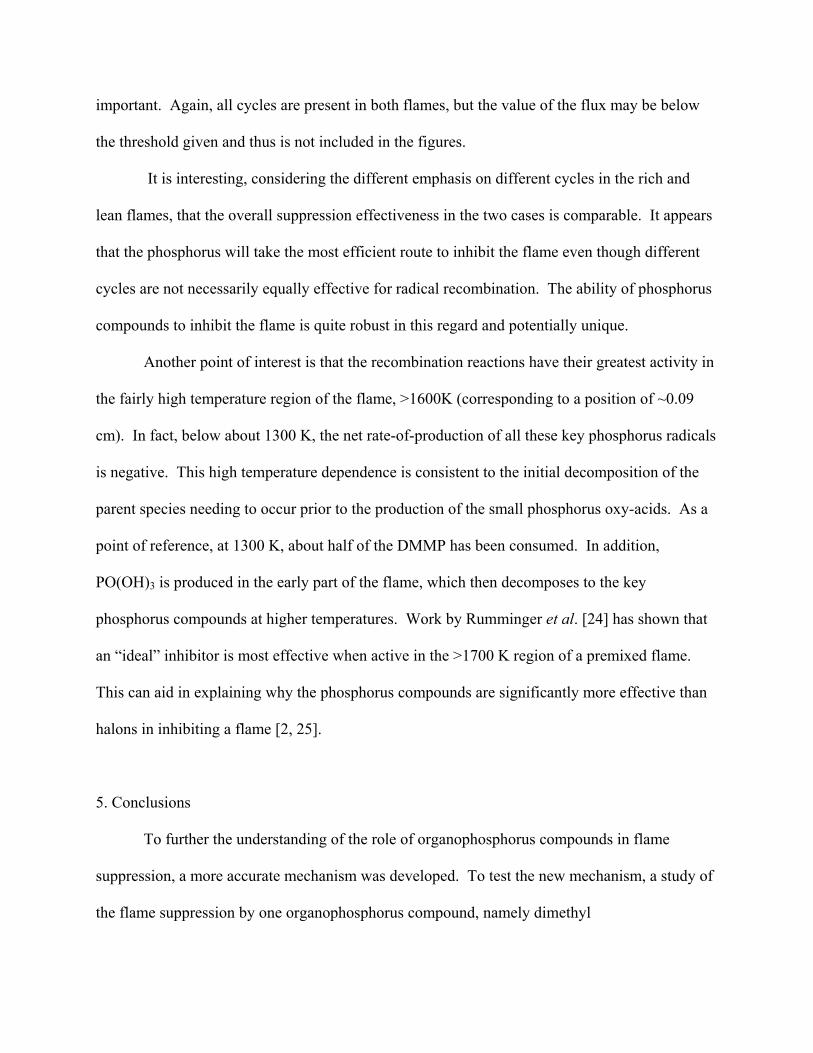
important. Again, all cycles are present in both flames, but the value of the flux may be below
the threshold given and thus is not included in the figures.
It is interesting, considering the different emphasis on different cycles in the rich and
lean flames, that the overall suppression effectiveness in the two cases is comparable. It appears
that the phosphorus will take the most efficient route to inhibit the flame even though different
cycles are not necessarily equally effective for radical recombination. The ability of phosphorus
compounds to inhibit the flame is quite robust in this regard and potentially unique.
Another point of interest is that the recombination reactions have their greatest activity in
the fairly high temperature region of the flame, >1600K (corresponding to a position of ~0.09
cm). In fact, below about 1300 K, the net rate-of-production of all these key phosphorus radicals
is negative. This high temperature dependence is consistent to the initial decomposition of the
parent species needing to occur prior to the production of the small phosphorus oxy-acids. As a
point of reference, at 1300 K, about half of the DMMP has been consumed. In addition,
PO(OH)3 is produced in the early part of the flame, which then decomposes to the key
phosphorus compounds at higher temperatures. Work by Rumminger et al. [24] has shown that
an “ideal” inhibitor is most effective when active in the >1700 K region of a premixed flame.
This can aid in explaining why the phosphorus compounds are significantly more effective than
halons in inhibiting a flame [2, 25].
5. Conclusions
To further the understanding of the role of organophosphorus compounds in flame
suppression, a more accurate mechanism was developed. To test the new mechanism, a study of
the flame suppression by one organophosphorus compound, namely dimethyl

methylphosphonate (DMMP), under a range of equivalence ratios (0.8-1.3) was performed
experimentally and numerically. Good agreement exists between the experimental and
numerical results. No significant bias of the ability for the DMMP to suppress the flame was
observed experimentally for the rich versus lean cases. When studied numerically, the
mechanism by which the DMMP, or OPCs in general, act under different equivalence ratios can
be explored. Although the same key catalytic cycles are observed for both equivalence ratios,
φ=0.8 and φ=1.3, the bias toward more highly oxidized species is seen in the lean case. Even
with this difference, the ability for the OPCs to be similarly effective under a range of
equivalence ratios demonstrates their robustness as flame inhibitors. In addition, OPCs
similarity to the “ideal” inhibitor described by Rumminger [24] in operating in the high
temperature region of the flame gives further understanding to their high level of effectiveness.
6. Acknowledgements
The authors thank Dr. P. A. Glaude for helpful discussions on the reaction mechanism. The
computational portions of this work were supported by the Office of Basic Energy Sciences,
Division of Chemical Sciences, and performed under the auspices of the U.S. Department of
Energy by the University of California, Lawrence Livermore National Laboratory under Contract
No.W-7405-Eng-48. The experimental part of this work was carried out with support from the
Civilian Research and Development Foundation under grant RC1-2386-NO-02 and by US Army
Research Office under grant DAAD 19-00-1-0136, Modification No.P00001. Dr. Curran
acknowledges support from Enterprise Ireland under their Research Scholarship and
International Collaboration Programmes.

7. References
1. Hastie, J. W. and Bonnell, D. W., Molecular Chemistry of Inhibited Combustion Systems, National Bureau of Standards, NBSIR 80-2169, (1980). 2. MacDonald, M. A., Jayaweera, T. M., Fisher, E. M. and Gouldin, F. C., Combust. Flame 116:166-176 (1999). 3. Siow, J. E. and Laurendeau, N. M., Combust. Flame 136:16-24 (2004). 4. Twarowski, A., Combust. Flame 94:91-107 (1993). 5. Twarowski, A., Combust. Flame 94:341-348 (1993). 6. Twarowski, A., Combust. Flame 102(1-2):41-54 (1995). 7. Korobeinichev, O. P., Ilyin, S. B., Mokrushin, V. V. and Shmakov, A. G., Combust. Sci. Technol. 116:51-67 (1996). 8. Korobeinichev, O. P., Mamaev, A. L., Sokolov, V. V., Bolshova, T. A. and Schvartsberg, V. M., "Experimental Study and Modeling of the Effect of Phosphorus-Containing Compounds on Premixed Atmospheric Methane-Oxygen Flame Structure and Propagation Velocity," Proceedings of the Halon Option Technical Working Conference, Albuquerque, NM, 2001, pp.173-186. 9. Westbrook, C. K., Proc. Combust. Inst. 19:127-141 (1983). 10. Westbrook, C. K., Combust. Sci. Technol. 34:201-225 (1983). 11. MacDonald, M. A., Fisher, E. M. and Gouldin, F. C., Combust. Flame 124(4):668-683 (2001). 12. Linteris, G. T. and Truett, G. T., Combust. Flame 105(1-2):15-27 (1996). 13. Mache, H. and Hebra, A., Sitzungsber. Osterreich. Akad. Wiss. Abt.(IIa):150-157 (1941). 14. van Maaren, A. and deGoey, L. P. H., Combust. Sci. Technol. 102:309-314 (1994). 15. Vagelopoulos, C. M. and Egolfopoulos, F. N., Proc. Combust. Inst. 25:1341-1347 (1994). 16. Dyakov, I. V., Konnov, A. A., de Ruyck, J., Bosschaart, K. J., Brock, E. C. M. and de Goey, L. P. H., Combust. Sci. Technol. 172:81-96 (2001). 17. Korobeinichev, O. P., Shvartsberg, V. M., Shmakov, A. G., Bolshova, T. A., Jayaweera, T. M., Melius, C. F., Pitz, W. J. and Westbrook, C. K., "Flame Inhibition by Phosphorus-Containing Compounds in Lean and Rich Propane Flames," Submitted to the Proceedings of the Combustion Institute, Chicago, Ilinois, 2004. 18. Mackie, J. C., Bacskay, G. B. and Haworth, N. L., J. Phys. Chem. A 106:10825-10830 (2002). 19. Sheng, C. Y. and Bozzelli, J. W., Journal of American Chemical Society A 106(7276-7293) (2002). 20. Tsang, W. and Herron, J. T., J. Phys. Chem. Ref. Data 20:609-663 (1991). 21. Kee, R. J., Rupley, F.M., Miller, J.A., Coltrin, M.E., Grcar, J.F., Meeks, E., Moffat, H.K., Lutz, A.E., Dixon-Lewis, G., Smooke, M.D., Warnatz, J., Evans, G.H., Larson, R.S., Mitchell, R.E., Petzold, L.R., Reynolds, W.C., Caracotsios, M., Stewart, W.E., Glarborg, P., Wang, C., Adigun, O., Houf, W.G., Chou, C.P., Miller, S.F. Chemkin Collection,3.7.1;Reaction Design, Inc.: San Diego, CA, 2003. 22. Curran, H., Jayaweera, T., Pitz, W., and Westbrook, C., "A Detailed Modeling Study of Propane Oxidation," Western States Section of the Combustion Institute, Davis, California, 2004. 23. Orme, J., Simmie, J. M. and Curran, H. J., "A Shock Tube Study of Methylcyclohexane Oxidation," Proceedings of the European Combustion Meeting, Orleans, France, 2003,

24. Rumminger, M. D., Babushok, V. and Linteris, G. T., Proc. Combust. Inst. 29:329-336 Part 1 (2003). 25. Babushok, V. I., Tsang, W., Linteris, G. T. and Reinelt, D., Combust. Flame 115(4):551-560 (1998).

Table 1
Mole fraction of key POxHy species in lean and rich flames. Mole fractions at the location of the
maximum rate-of-production for PO2 (distance from cold boundary = 0.107 cm) were used.
Species Mole fraction (lean)
Mole fraction (rich)
Species Mole fraction (lean)
Mole fraction (rich)
PO 8.60e-6 4.37e-5 HPO 1.75e-8 1.87e-7
PO2 1.86e-4 1.22e-4 HOPO 1.08e-4 3.16e-4
PO3 3.13e-6 1.83e-7 HOPO2 2.57e-4 4.60e-5
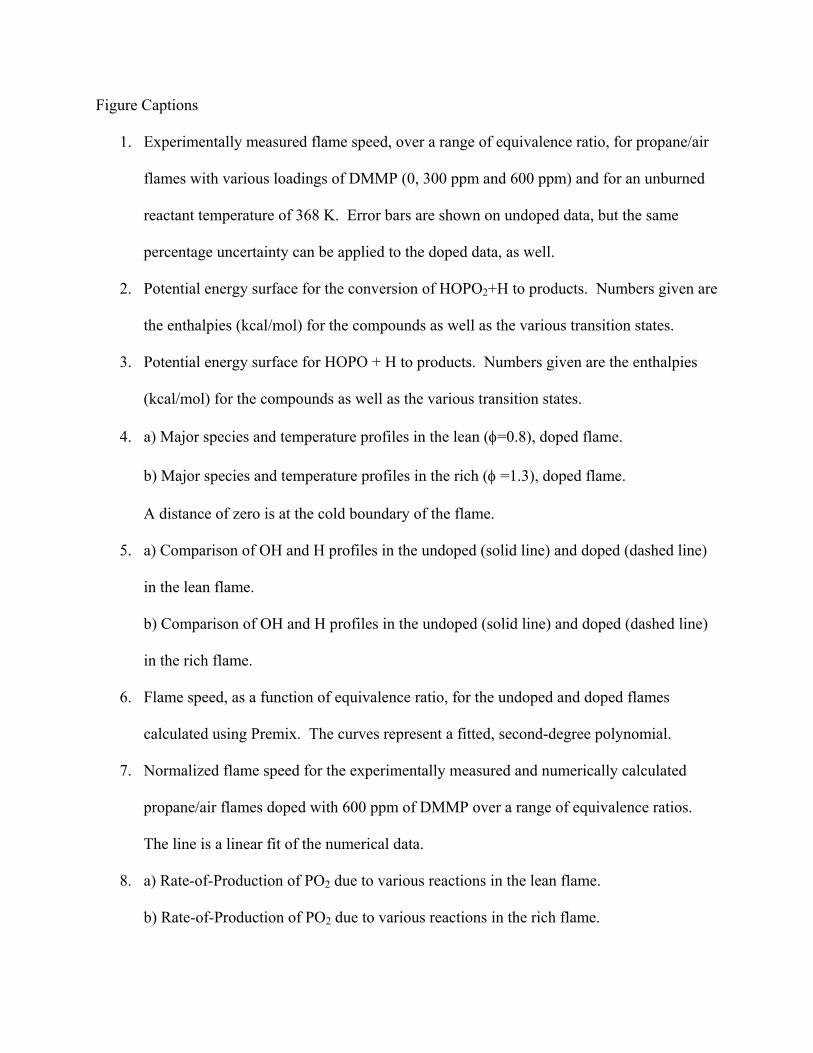
Figure Captions
1. Experimentally measured flame speed, over a range of equivalence ratio, for propane/air
flames with various loadings of DMMP (0, 300 ppm and 600 ppm) and for an unburned
reactant temperature of 368 K. Error bars are shown on undoped data, but the same
percentage uncertainty can be applied to the doped data, as well.
2. Potential energy surface for the conversion of HOPO2+H to products. Numbers given are
the enthalpies (kcal/mol) for the compounds as well as the various transition states.
3. Potential energy surface for HOPO + H to products. Numbers given are the enthalpies
(kcal/mol) for the compounds as well as the various transition states.
4. a) Major species and temperature profiles in the lean (φ=0.8), doped flame.
b) Major species and temperature profiles in the rich (φ =1.3), doped flame.
A distance of zero is at the cold boundary of the flame.
5. a) Comparison of OH and H profiles in the undoped (solid line) and doped (dashed line)
in the lean flame.
b) Comparison of OH and H profiles in the undoped (solid line) and doped (dashed line)
in the rich flame.
6. Flame speed, as a function of equivalence ratio, for the undoped and doped flames
calculated using Premix. The curves represent a fitted, second-degree polynomial.
7. Normalized flame speed for the experimentally measured and numerically calculated
propane/air flames doped with 600 ppm of DMMP over a range of equivalence ratios.
The line is a linear fit of the numerical data.
8. a) Rate-of-Production of PO2 due to various reactions in the lean flame.
b) Rate-of-Production of PO2 due to various reactions in the rich flame.

9. a) Sensitivity of H concentration due to phosphorus species in lean flame.
b) Sensitivity of H concentration due to phosphorus species in rich flame.
10. a) Reaction pathway diagram for the key recombination pathways via phosphorus in lean
flame.
b) Reaction pathway diagram for the key recombination pathways via phosphorus in rich
flame.

Fig. 1
0
10
20
30
40
50
60
70
0.7 0.8 0.9 1 1.1 1.2 1.3 1.4
undoped300 ppm600 ppmFl
ame
spee
d [c
m/s
]
Equivalence ratio

Fig 2
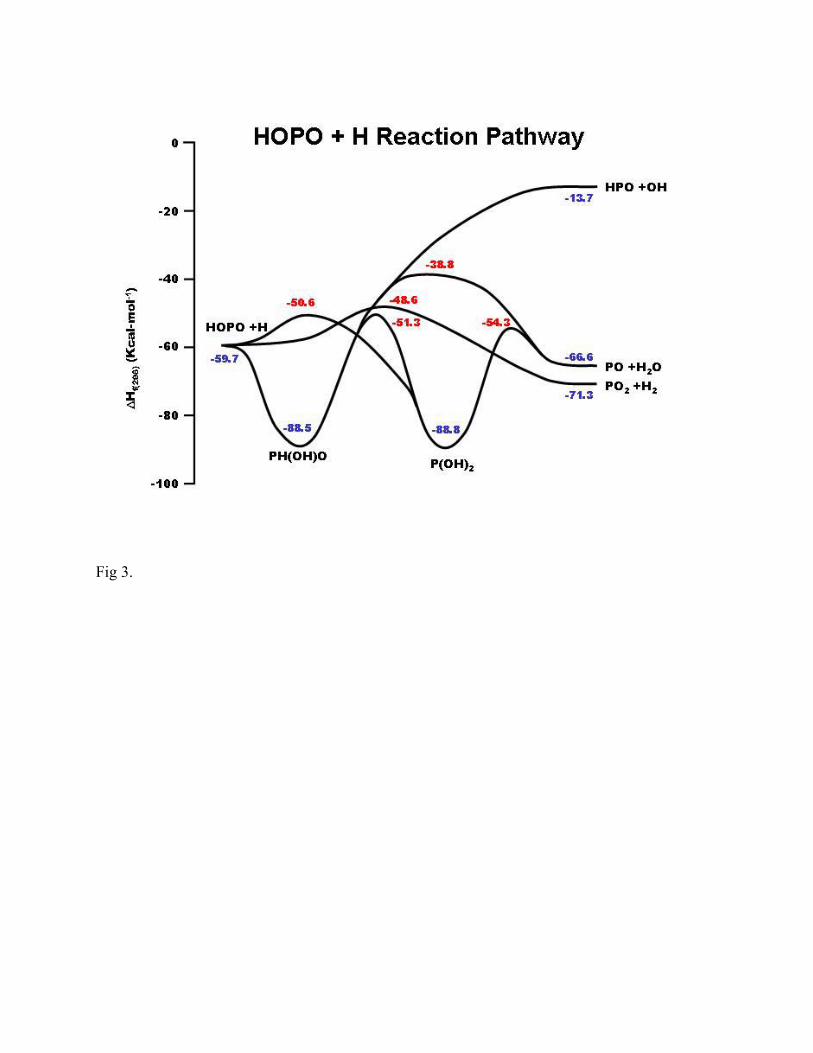
Fig 3.

0
0.05
0.1
0.15
0.2
0.25
0
500
1000
1500
2000
2500
0 0.05 0.1 0.15 0.2 0.25 0.3
Mol
e fra
ctio
nTem
perature [K]
Distance [cm]
O2
C3H
8
H2O
CO2
T
Fig 4a

0
0.05
0.1
0.15
0.2
0
500
1000
1500
2000
2500
0 0.05 0.1 0.15 0.2 0.25 0.3
Mol
e fra
ctio
nTem
perature [K]
Distance [cm]
O2
H2O
CO2
C3H
8
T
Fig 4b

0
0.001
0.002
0.003
0.004
0.005
0.006
0.007
0.008
0 0.05 0.1 0.15 0.2 0.25 0.3
Mol
e fra
ctio
n
Distance [cm]
H
OH
Fig 5a

0
0.002
0.004
0.006
0.008
0.01
0 0.05 0.1 0.15 0.2 0.25 0.3
Mol
e fra
ctio
n
Distance [cm]
H
OH
Fig 5b
35
40
45
50
55
60
65
0.7 0.8 0.9 1 1.1 1.2 1.3 1.4
undoped600ppm
Flam
e sp
eed
[cm
/s]
Equivalence ratio
Fig 6

0
0.05
0.1
0.15
0.2
0.25
0.7 0.8 0.9 1 1.1 1.2 1.3 1.4
experimentalnumerical(S
u o-Su)
/Su o
Equivalence ratio
Fig. 7
-0.0004
-0.0003
-0.0002
-0.0001
0
0.0001
0.0002
0 0.05 0.1 0.15 0.2 0.25 0.3
Rat
e-of
-Pro
duct
ion
[mol
/cc/
sec]
Distance [cm]
PO2+H+m=HOPO+m
HOPO+OH=PO2+H
2O
HOPO+O=PO2+OH
PO2+OH+m=HOPO
2+m
HOPO2+H=PO
2+H
2O
Fig 8a.

-0.0004
-0.0003
-0.0002
-0.0001
0
0.0001
0.0002
0.0003
0 0.05 0.1 0.15 0.2 0.25 0.3
Rat
e-of
-Pro
duct
ion
[mol
/cc/
sec]
Distance [cm]
PO2+H+m=HOPO+m
HOPO+OH=PO2+H
2O
(via abstraction)
HOPO+OH=PO2+H
2O
(via adduct)
HOPO+O=PO2+OH
Fig 8b.
-1.0
-0.8
-0.6
-0.4
-0.2
0
0.2
0.4
0 0.05 0.1 0.15 0.2 0.25 0.3
Sen
sitiv
ity o
f H
Distance [cm]
PO2+OH+m=HOPO
2+m
HOPO+O+m=HOPO2+m
HOPO2+H=PO
2+H
2O
PO2+H+m=HOPO+m
HOPO+OH=PO2+H
2O
Fig. 9a

-0.8
-0.6
-0.4
-0.2
0
0.2
0 0.05 0.1 0.15 0.2 0.25 0.3
Sen
sitiv
ity o
f H
Distance [cm]
HOPO+OH=PO2+H
2O
(via adduct)
PO2+H+m=HOPO+m
HOPO+OH=PO2+H
2O
(via abstraction)
Fig 9b

PO2
P
OH
O
P
OH
OO
P
O
HO OH
+H
+OH/+O+OH
+H
+H
+O
PO3
+H2O
+O
4.9E-05
3.39E-05
2.28E-04/1.38E-04
3.99E-06
8.02E-05
2.0E-067.91E-06
4.01E-04
1.99E-5 PO3.99E-06
+O2
3.41E-06+H
Fig 10a
PO2
P
OH
O
P
OH
OO
+H
+OH/+O+OH
+H
+O
PO
+H
+O2
1.17E-05
1.21E-05
3.01E-04/5.63E-05
2.55E-05 4.31E-04
2.13E-05
1.22E-05
Fig. 10b
Copyright © 2022 FDOKUMEN