Digital image-based flame emission spectrometry
6
Talanta 77 (2009) 1584–1589 Contents lists available at ScienceDirect Talanta journal homepage: www.elsevier.com/locate/talanta Digital image-based flame emission spectrometry Wellington Silva Lyra, Vagner Bezerra dos Santos, Amália Geiza Gama Dionízio, Valdomiro Lacerda Martins, Luciano Farias Almeida, Edvaldo Nóbrega Gaião, Paulo Henrique Gonc ¸ alves Dias Diniz, Edvan Cirino Silva ∗ , Mário César Ugulino Araújo Universidade Federal da Paraíba, CCEN, Departamento de Química, Caixa Postal 5093, CEP 58051-970 João Pessoa, PB, Brazil article info Article history: Received 25 April 2008 Received in revised form 25 September 2008 Accepted 26 September 2008 Available online 17 October 2008 Keywords: Digital image Red–green–blue colour system Flame emission spectrometry Alkaline metal determination Pharmaceutical formulations Water analysis abstract A digital image-based flame emission spectrometric (DIB-FES) method for the quantitative chemical anal- ysis is proposed here for the first time. The DIB-FES method employs a webcam to capture the digital images which are associated to a radiation emitted by the analyte into an air-butane flame. Since the detection by webcam is based on the RGB (red–green–blue) colour system, a novel mathematical model was developed in order to build DIB-FES analytical curves and estimate figures of merit for the proposed method. In this approach, each image is retrieved in the three R, G and B individual components and their values were used to define a position vector in RGB three-dimensional space. The norm of this vector is then adopted as the RGB-based value (analytical response) and it has revealed to be linearly related to the analyte concentration. The feasibility of the DIB-FES method is illustrated in three applications involving the determination of lithium, sodium and calcium in anti-depressive drug, physiological serum and water, respectively. In comparison with the traditional flame emission spectrometry (trad-FES), no statistic difference has been observed between the results by applying the paired t-test at the 95% confi- dence level. However, the DIB-FES method has offered the largest sensitivities and precision, as well as the smallest limits of detection and quantification for the three analytes. These advantageous characteristics are attributed to the trivariate nature of the detection by webcam. © 2008 Elsevier B.V. All rights reserved. 1. Introduction Recently, Maleki et al. [1] and Gaião et al. [2] have exploited the potential of digital images to carry out quantitative chemi- cal analyses. Such digital images have been obtained with up to 24 bits (16.7million colours) by using the RGB (red–green–blue) colour system [3,4]. In their first work [1], the authors have used the digital images for simultaneous determination of Al (III) and Fe (III) in alloys using the chrome azurol S (CAS) as chromogenic reagent. In this case, a neural network model based on the RGB val- ues obtained from the digital images captured from the Al (III)–CAS and Fe (III)–CAS complexes was built. Gaião et al. [2] have used digital images obtained from a webcam to develop a novel dig- ital image-based (DIB) titration method, which was successfully applied to the determination of total alkalinity in mineral and tap waters. In the works mentioned above, the digital images present the colour of the emergent radiation, which is a complementary colour of the absorbed radiation by the absorbent molecular species. Thus, ∗ Corresponding author. Fax: +55 83 3216 7438. E-mail address: [email protected] (E.C. Silva). the digital images are indirectly associated to the molecular absorp- tion phenomenon that provides the basis to the well-known UV–Vis spectrometry [5]. However, the literature does not show the use of digital images to perform chemical analysis based on flame emis- sion. In this paper, a digital image-based flame emission spectromet- ric (DIB-FES) method for quantitative chemical analysis is proposed. The DIB-FES method also employs, as elsewhere [2], a webcam to capture the digital images, but now they are associated to a radi- ation emitted by the analytes into an air–butane flame [5]. Since the detection by webcam is based on the RGB colour system, a novel mathematical approach was developed in order to build lin- ear analytical curves and estimate figures of merit for the DIB-FES method. Three applications involving different matrices and ana- lytes were carried out in order to demonstrate the feasibility and potentiality of the proposed methodology. The first one involves the determination of lithium in an anti-depressive drug, which is nowa- days a relevant problem from a public sanitation point of view. The second application concerns the sodium determination in physio- logical serum, which is a universally adopted solution to provide sodium ions to the human organism. The third application con- sists in the water analysis involving the determination of calcium, which has as function to improve the flocculation and coagulation 0039-9140/$ – see front matter © 2008 Elsevier B.V. All rights reserved. doi:10.1016/j.talanta.2008.09.057
Transcript of Digital image-based flame emission spectrometry

D
WVPU
a
ARR2AA
KDRFAPW
1
tc2ctFruadiaw
co
0d
Talanta 77 (2009) 1584–1589
Contents lists available at ScienceDirect
Talanta
journa l homepage: www.e lsev ier .com/ locate / ta lanta
igital image-based flame emission spectrometry
ellington Silva Lyra, Vagner Bezerra dos Santos, Amália Geiza Gama Dionízio,aldomiro Lacerda Martins, Luciano Farias Almeida, Edvaldo Nóbrega Gaião,aulo Henrique Goncalves Dias Diniz, Edvan Cirino Silva ∗, Mário César Ugulino Araújoniversidade Federal da Paraíba, CCEN, Departamento de Química, Caixa Postal 5093, CEP 58051-970 João Pessoa, PB, Brazil
r t i c l e i n f o
rticle history:eceived 25 April 2008eceived in revised form5 September 2008ccepted 26 September 2008vailable online 17 October 2008
eywords:igital image
a b s t r a c t
A digital image-based flame emission spectrometric (DIB-FES) method for the quantitative chemical anal-ysis is proposed here for the first time. The DIB-FES method employs a webcam to capture the digitalimages which are associated to a radiation emitted by the analyte into an air-butane flame. Since thedetection by webcam is based on the RGB (red–green–blue) colour system, a novel mathematical modelwas developed in order to build DIB-FES analytical curves and estimate figures of merit for the proposedmethod. In this approach, each image is retrieved in the three R, G and B individual components and theirvalues were used to define a position vector in RGB three-dimensional space. The norm of this vectoris then adopted as the RGB-based value (analytical response) and it has revealed to be linearly relatedto the analyte concentration. The feasibility of the DIB-FES method is illustrated in three applications
ed–green–blue colour systemlame emission spectrometrylkaline metal determinationharmaceutical formulationsater analysis
involving the determination of lithium, sodium and calcium in anti-depressive drug, physiological serumand water, respectively. In comparison with the traditional flame emission spectrometry (trad-FES), nostatistic difference has been observed between the results by applying the paired t-test at the 95% confi-dence level. However, the DIB-FES method has offered the largest sensitivities and precision, as well as thesmallest limits of detection and quantification for the three analytes. These advantageous characteristics
iate n
ttsds
rTcatneml
are attributed to the trivar
. Introduction
Recently, Maleki et al. [1] and Gaião et al. [2] have exploitedhe potential of digital images to carry out quantitative chemi-al analyses. Such digital images have been obtained with up to4 bits (16.7 million colours) by using the RGB (red–green–blue)olour system [3,4]. In their first work [1], the authors have usedhe digital images for simultaneous determination of Al (III) ande (III) in alloys using the chrome azurol S (CAS) as chromogeniceagent. In this case, a neural network model based on the RGB val-es obtained from the digital images captured from the Al (III)–CASnd Fe (III)–CAS complexes was built. Gaião et al. [2] have usedigital images obtained from a webcam to develop a novel dig-
tal image-based (DIB) titration method, which was successfullypplied to the determination of total alkalinity in mineral and tap
aters.In the works mentioned above, the digital images present theolour of the emergent radiation, which is a complementary colourf the absorbed radiation by the absorbent molecular species. Thus,
∗ Corresponding author. Fax: +55 83 3216 7438.E-mail address: [email protected] (E.C. Silva).
pddslssw
039-9140/$ – see front matter © 2008 Elsevier B.V. All rights reserved.oi:10.1016/j.talanta.2008.09.057
ature of the detection by webcam.© 2008 Elsevier B.V. All rights reserved.
he digital images are indirectly associated to the molecular absorp-ion phenomenon that provides the basis to the well-known UV–Vispectrometry [5]. However, the literature does not show the use ofigital images to perform chemical analysis based on flame emis-ion.
In this paper, a digital image-based flame emission spectromet-ic (DIB-FES) method for quantitative chemical analysis is proposed.he DIB-FES method also employs, as elsewhere [2], a webcam toapture the digital images, but now they are associated to a radi-tion emitted by the analytes into an air–butane flame [5]. Sincehe detection by webcam is based on the RGB colour system, aovel mathematical approach was developed in order to build lin-ar analytical curves and estimate figures of merit for the DIB-FESethod. Three applications involving different matrices and ana-
ytes were carried out in order to demonstrate the feasibility andotentiality of the proposed methodology. The first one involves theetermination of lithium in an anti-depressive drug, which is nowa-ays a relevant problem from a public sanitation point of view. The
econd application concerns the sodium determination in physio-ogical serum, which is a universally adopted solution to provideodium ions to the human organism. The third application con-ists in the water analysis involving the determination of calcium,hich has as function to improve the flocculation and coagulation
W. Silva Lyra et al. / Talanta
Nomenclature
C concentration of the analyte (mg L−1)I intensity of emission (arbitrary units)k constant of proportionality (arbitrary units)LOD limit of detection (mg L−1)LOQ limit of quantification (mg L−1)Rs, Gs, and Bs average value of the red, green and blue com-
ponent of the sample solution (arbitrary units)Rb, Gb, and Bb average value of the red, green and blue com-
ponent of the blank solution (arbitrary units)Rs−b, Gs−b, and Bs−b differences between average values of
the red, green and blue components of the stan-dard/sample solution and blank solution (arbitraryunits)
||v|| norm of a vector v in the RGB tridimensional space(arbitrary units)
||vb|| norm of the vector associated to blank solution(arbitrary units)
sR, sG , and sB standard deviation of the average values of thered, green and blue components of the vector asso-ciated to blank solution (arbitrary units)
sb standard deviation of the norm of the vector associ-ated to blank solution (arbitrary units)
v1, v2, v3, v4, and v5 vector associated to first, second,third, fourth, and fifth standard solution respec-tively (arbitrary units)
Greek letters
emewse
2
2
fwfdCt
psts
obfiwmt
tw
t
ir
dt
2
tcnmlmetwFig. 1.
A model NK-2004 Digimed flame photometer was used for theFES measurements. This instrument was operated according to rec-ommendations of the manufacturer for the maximum sensitivitywith an air–butane flame.
˛ intersection of the analytical curveˇ slope of the analytical curve
fficiency in water treatment plants. For comparison purposes, allentioned analytes were determined by using the traditional flame
mission spectrometry (also named flame photometry) [5]. It isorth noting that in all applications carried out in this work, all the
amples chosen do not present spectral interference and/or matrixffect.
. Experimental
.1. Reagents, samples, and solutions
Stock solutions of 1000 mg L−1 Li+, Na+ and Ca2+ were preparedrom their previously dried carbonate salts by means of dissolutionith HCl 1:1 (v/v). The stock solution of 10.0 g L−1 La3+ was prepared
rom its previously dried chloride salt at 110 ◦C. The working stan-ard solutions of Li+ (6.0–30.0 mg L−1), Na+ (1.8–9.0 mg L−1) anda2+ (10.0–50.0 mg L−1) were prepared by suitable dilutions fromheir respective stock solutions.
The water samples were acquired from a local water treatmentlant. Aliquots of the stock solution of La3+ were added to the wateramples and Ca2+ working standard solutions in order to minimizehe decreasing in the calcium emission signal. After dilution, theseolutions presented 1.0 g L−1 La3+.
Six brands of an anti-depressive drug with a nominal contentf 300 mg Li2CO3 were purchased from local drugstores. For each
rand, a portion of 10 tablets was grinded in a mortar to yield ane powder. An appropriate amount of the powder (400–450 mg)as dissolved in 25 mL of 0.1 mol L−1 HCl solution, shaking theixture with a magnetic stirring for 10 min. Afterwards, a fil-ration to remove the insoluble particles was performed, andFf
77 (2009) 1584–1589 1585
he resulting solution was diluted to a final volume of 1 L withater.
Six samples of physiological serum with a nominal concentra-ion of 0.90% (w/v) NaCl were also purchased in a local drugstore.
Before the analysis, all samples were suitably diluted with watern order to interpolate the analytical signals in a linear responseange.
Chemicals of analytical grade and water recently distilled-eionized by a Milli-Q (Millipore) system were used throughouthe work.
.2. Apparatus
A schematic diagram and a photograph of the analytical sys-em assembled for digital images acquisition are shown in Fig. 1. Itomprises a model Instant Creative Webcam [6], which was con-ected to an universal serial bus (USB) inlet of a Pentium III 650 MHzicrocomputer (PC). In order to avoid interferences of the ambient
ight, the webcam was coupled to a cardboard tube with approxi-ately 4.0 cm of internal diameter and 13.0 cm of length. The other
dge of the tube was coupled to a small window of the photome-er chimney. This tube was finally placed into a black wood boxith approximately 20.0 cm × 16.0 cm × 11.0 cm, as illustrated in
ig. 1. Schematic diagram (a) and photograph (b) of the analytical system assembledor acquisition of the digital images. For further details, see the text.

1586 W. Silva Lyra et al. / Talanta
Fxa
2t
i3rixa(
labaD
umdsseutlaetcs
2
bi
‖
wt
(a
tolt
‖
ptibts
vF(te
teeptbpb
d
‖
wi
dwe
s
wRr
m
LOD = 3sb
ˇ(5)
and
ig. 2. Digital image with n × m pixels obtained from one of the calibration solutions.1, x2, y1 and y2 are coordinates that delimit the flame region more adequate fornalytical treatment.
.3. Digital image acquisition and region selection for datareatment
The webcam was configured to capture 24-bits digitalmages (16.7 million colours) at rate of 34 images s−1 and52 pixels × 288 pixels of spatial resolution [6]. Nevertheless, theegion selected for data treatment, which is delimited in the imagellustrated in Fig. 2, is a matrix with 25 pixels × 25 pixels (where2 − x1 = 25 and y2 − y1 = 25). The images were captured and storeds “bmp” format files by means of the software written in Kylixversion 3.0).
The region of the flame in Fig. 2, named interconal area [5], isocalized approximately 2.5 cm above the bottom of the flame. Thisrea is commonly used for emission measurements in the trad-FES,ecause it presents a thermal equilibrium and it is often rich in freetoms. Such region has revealed to be appropriated to build theIB-FES analytical curves.
In order to delimit the region for data treatment (Fig. 2), theser selects such region only in the first digital image by using theouse. After that, the software automatically uses the same coor-
inates of the delimited region for all digital images (calibrationolutions and samples). Right after that, the software performs thecan of the pixels (column-by-column) on the delimited region ofach image. Then, it retrieves the values of the R, G and B individ-al components from each pixel. Thereafter, the software calculateshe R, G and B average values of all pixels. These values are used toocalize a point in the RGB three-dimensional space and to define
position vector v (see Fig. 4) associated to a digital image fromach calibration solution or sample. The norm “|| ||” of the vec-or v is adopted as the RGB-based value for building the analyticalurves by using the mathematical approach described in the nextection.
.4. RGB-based value, analytical curve and figures of merit
A mathematical approach aiming at a linear relationshipetween the proposed RGB-based value and analyte concentration
s developed as follows.The norm “|| ||” of the vector v is calculated as
v‖ =√
R2s−b
+ G2s−b
+ B2s−b
(1)
here Rs−b, Gs−b and Bs−b are the results of the difference betweenhe Rs, Gs and Bs average values of all pixels from delimited region
L
wa
77 (2009) 1584–1589
Fig. 2) in digital images from the calibration solutions or samplesnd Rb, Gb and Bb from the blank.
By assuming that the number of photons that reaches the photo-ransducer of the webcam is proportional to the emission intensityf the source (I) and that the relationship between “I” and the ana-
yte concentration (C) for a specific concentration range is linear,he following equation is valid:
v‖ = kC (2)
Thereafter, Eq. (2) describes, as experimentally attested inresent work (see Fig. 5), a linear relationship between the vec-or norm ||v|| and the concentration of the analyte. As mentionedn previous section, ||v|| is the RGB-based value here employed touild DIB-FES analytical curves. Moreover, the vectors associatedo the digital images from each analyte should be positioned onto aame support line in the RGB three-dimensional space (see Fig. 4).
The fitted regression models were checked by using analysis ofariance (ANOVA). After that, the analytical performance of the DIB-ES method was assessed using the sensitivity, limit of detectionLOD), limit of quantification (LOQ) and relative standard devia-ion (R.S.D.). These figures of merit were also compared with thosestimated to evaluate the performance of the trad-FES method.
The values of some figures of merit were obtained accordingo the IUPAC recommendations reported elsewhere [7,8]. How-ver, the standard deviation of the blank (sb), LOD and LOQ werestimated for the DIB-FES method by using a novel approach pro-osed in this work. This treatment is necessary by consideringhat the analytical response is now associated to a vector normased on three experimental variables, namely the R, G and B com-onents. For this purpose, the mathematical approach describedelow should be adopted.
According to Eq. (1), the vector norm ||vb|| associated to theigital image from the blank is given by
vb‖ =√
R2b
+ G2b
+ B2b
(3)
here Rb, Gb and Bb are the average values of all pixels from delim-ted region (Fig. 2) in the digital images from the blank.
Since ||vb|| is based on three variables, the associated standardeviation (sb) should be estimated by using the expression below,hich is derived employing error propagation equations described
lsewhere [9]
b =
√(RbsR)
2 + (GbsG)2 + (BbsB)
2
R2b
+ G2b
+ B2b
(4)
here sR, sG and sB are the standard deviations associated to the¯ b, Gb and Bb values resulting of the digital images from the blank,espectively.
Finally, LOD and LOQ are calculated by using the sb value esti-ated by Eq. (4) and the following expressions:
OQ = 10sb
ˇ(6)
here “ˇ” is the slope from the analytical curve based on Eq. (2)nd estimated by linear least-squares regression fitting.

W. Silva Lyra et al. / Talanta 77 (2009) 1584–1589 1587
F(
3
3
acow
c
FR
r
ig. 3. Digital images captured during the flame emission from lithium (a), sodiumb), and calcium (c) in calibration solutions used to build DIB-FES analytical curves.
. Results and discussion
.1. Digital images and emission phenomenon
In Fig. 3 are illustrated the digital images associated to the radi-tion emitted by lithium (a), sodium (b), and calcium (c) from fivealibration solutions with different concentrations. The first image
f the sequences is associated to background radiation emittedhen the blank solution is aspirated by the photometer (Fig. 1).As can be seen in Fig. 3a, the images present the red primaryolour (remarkably the images 5 and 6) for which the intensity
Tats
Fig. 5. DIB-FES (dashed line) and trad-FES (dotted line) analytical
ig. 4. The norm of the vectors v1–v5 of each calibration solution and the values of¯ s−b , Gs−b and Bs−b for digital images from lithium (a), sodium (b) and calcium (c).
aises as the Li+ concentration in calibration solutions increases.his radiation corresponds to the resonance lines (duplet) observed
round 671 nm in the spectrum of the lithium, which result fromhe electronic transition from a 2p excited state to the 2s groundtate [5].curves and residual plots for the three determined analytes.

1588 W. Silva Lyra et al. / Talanta
Table 1Analysis of variance for the fit of a linear model (Y = ˛ + ˇX) of the analytical curves(Fig. 5).
Analyte Degrees of freedom Mean square (MS)
DIB-FES trad-FES
Lithium 1a 1.45 × 10⁴ 16.5713b 8.50 × 10⁻⁴ 3.26 × 10⁻⁶
3c 1.16 × 10⁻³ 3.44 × 10⁻⁶
10d 7.58 × 10⁻⁴ 3.20 × 10⁻⁶
Sodium 1a 7.47 × 10⁴ 5.2013b 4.12 × 10⁻⁴ 4.43 × 10⁻⁶
3c 3.84 × 10⁻⁴ 4.34 × 10⁻⁶
10d 4.20 × 10⁻⁴ 4.47 × 10⁻⁶
Calcium 1a 2.69 × 10⁴ 6.7813b 5.81 × 10⁻⁴ 1.20 × 10⁻⁵
3c 8.06 × 10⁻⁴ 1.57 × 10⁻⁵
10d 5.13 × 10⁻⁴ 1.09 × 10⁻⁵
a Regression.
r[fn[
trai
trpt
3
eamBtesGtvt
at
3t
idFrSmufFgttv(
Modfihsa
lmclhntwtta
3
ylrHowever the DIB-FES method presented a better precision as
TL
A
LSC
b Residual.c Lack of fit.d Pure error.
The images in Fig. 3b present the yellow secondary colour, whichesults from a balanced mixture of the primary colours red + green2–4]. Such yellow light outcomes from the electronic transitionrom the 3p excited state to 3s ground state, yielding the reso-ance lines (D duplet) at 589.6 and 589.0 nm in sodium spectrum5].
Regarding the images shown in Fig. 3c, it can be seen thathey present an orange tertiary colour resulting from the mixtureed + green with a larger contribution of red colour. This colour isssociated to the emission band from the CaOH species producedn an air–butane flame [5].
In all cases (Fig. 3a–c) the intensity of the colour raises ashe analyte concentration in calibration solutions increases. As aesult, an increasing concentration of the emitting species yields aroportional increase in the photons amount reaching the photo-ransducer of the webcam.
.2. Relationships between ||v|| and Rs−b, Gs−b and Bs−b values
Fig. 4a reveals that the vectors v1–v5, associated respectively toach digital image from Li+ calibration solutions, are localized ontosame straight line whose direction coincides with the Rs−b axis. Iteans that there is no significant differences between the Gs and
¯ s values and Gb and Bb, that is, the values of Gs−b and Bs−b are closeo zero. In case of the sodium (Fig. 4b), Rs and Gs values presentquivalent contributions for the norm of the vectors v1–v5 and, con-
¯
equently, these vectors are lie on bisectrix line between Rs−b and¯s−b axis. In Fig. 4c is shown that Rs and Gs values associated to digi-al images from the Ca2+ calibration solutions also contribute for theector norm, but in this case, present different proportions. Thus,he straight line onto which the vectors v1–v5 are localized presents
rit[
able 2inear regression parameters, LOD and LOQ of the DIB-FES and trad-FES methods.
nalyte Regression parameters (Y = ˛ + ˇX)
˛ ˇ
DIB-FES trad-FES DIB-FES trad-FE
ithium 0.07751 −0.03276 3.66879 0.1238odium 0.01750 −0.09190 27.71650 0.23130alcium −0.03100 −0.06417 2.99590 0.0475
77 (2009) 1584–1589
direction closer to the Rs−b axis due to the larger contribution ofhis component.
.3. Analytical curves, analysis of variance and performance ofhe DIB-FES method
Fig. 5 shows the DIB-FES and trad-FES analytical curves obtainedn the determination of lithium, sodium and calcium in anti-epressive drug, physiological serum and water, respectively.or both techniques, a linear behaviour between the analyticalesponses and analyte concentrations for all analytes was observed.uch inference based on a visual inspection can be confirmed byeans of the results of ANOVA shown in Table 1 and model resid-
al plots presented in Fig. 5. According to the recommendationsound elsewhere [10], the F-test for lack of fit should be applied too.or this purpose, the experimental design should also contemplateenuine repeated measurements at least in one of the concentra-ions levels. In the present work, the analytical curves were built onhe basis of three repeated measurements in five levels. Thus, thealues of pure errors were calculated by using the mean squaresMS) shown in Table 1.
In all cases, values of MSlack of fit/MSpure error and MSregression/Sresidual are smaller and much higher than the value of the point
f F-distribution at the 95% confidence level and correspondingegrees of freedom, respectively. As a result, no evidence of lack oft for the linear models is observed, and the linear regressions areighly significant. In order to corroborate this conclusion, an analy-is of the residual plots (Fig. 5) was also performed. It can be noticedrandom distribution of the residuals around zero for all analytes.
Since the DIB-FES and trad-FES analytical curves do not presentack of fit according to ANOVA test, the figures of merit were esti-
ated for both methods and the results are present in Table 2. Asan be seen, the DIB-FES method yielded analytical curves with theargest slopes for all analytes. Consequently, the proposed methodas a higher sensitivity than those presented by the trad-FES tech-ique. This advantageous characteristic may be attributed to therivariate detection of the webcam, yielding analytical responsesith larger sensitivities. The DIB-FES method also presented bet-
er performance in terms of the figures of merit LOD and LOQ. Forhis purpose, 20 digital images from the blank of each analyte werecquired and used to calculate sR, sG and sB, as well as the value of sb.
.4. Analytical determinations
As presented in Table 3, DIB-FES and trad-FES methods haveielded similar results in the determination of the three ana-ytes. In fact, it was not verified statistic difference between theesults by applying the paired t-test at the 95% confidence level.
evealed by the smaller values of overall R.S.D. (n = 5). This sat-sfactory precision may be ascribed to the multivariate nature ofhe monitored signal in RGB image-based analytical determinations2,11].
Values of merit figures (×10−1)
LOD (mg L−1) LOQ (mg L−1)
S DIB-FES trad-FES DIB-FES trad-FES
5 0.9 2.8 3.1 9.30.4 0.8 1.5 3.0
4 1.0 2.6 3.2 8.5
W. Silva Lyra et al. / Talanta
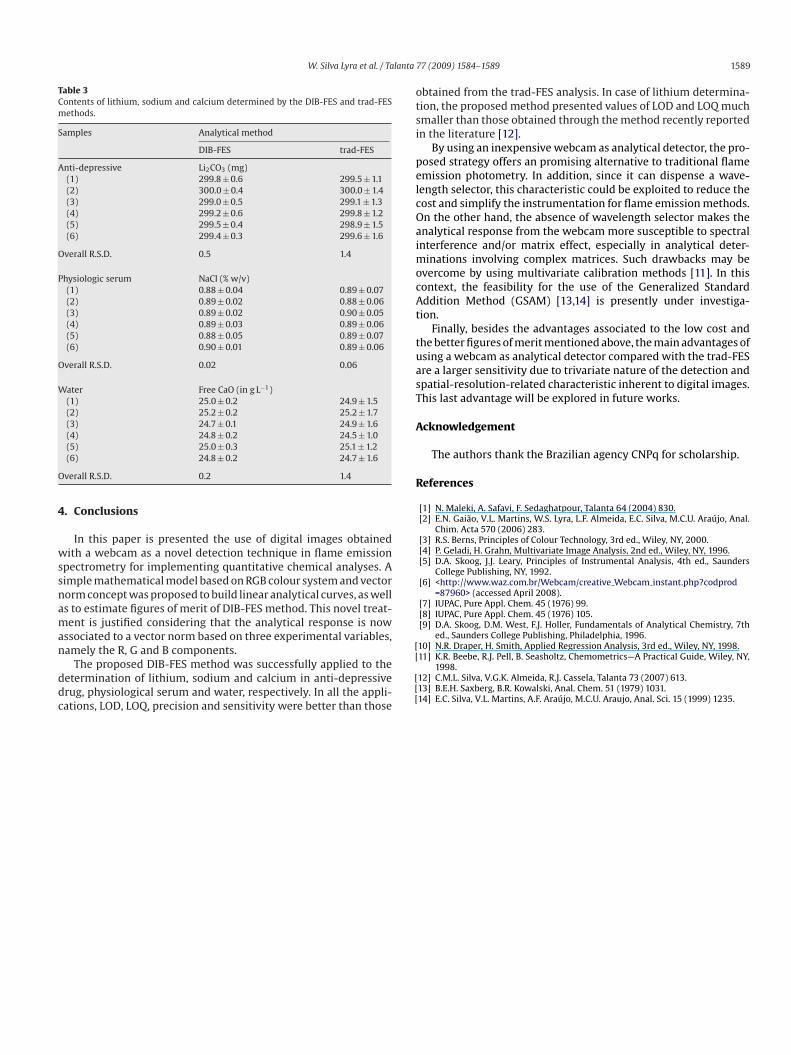
Table 3Contents of lithium, sodium and calcium determined by the DIB-FES and trad-FESmethods.
Samples Analytical method
DIB-FES trad-FES
Anti-depressive Li2CO3 (mg)(1) 299.8 ± 0.6 299.5 ± 1.1(2) 300.0 ± 0.4 300.0 ± 1.4(3) 299.0 ± 0.5 299.1 ± 1.3(4) 299.2 ± 0.6 299.8 ± 1.2(5) 299.5 ± 0.4 298.9 ± 1.5(6) 299.4 ± 0.3 299.6 ± 1.6
Overall R.S.D. 0.5 1.4
Physiologic serum NaCl (% w/v)(1) 0.88 ± 0.04 0.89 ± 0.07(2) 0.89 ± 0.02 0.88 ± 0.06(3) 0.89 ± 0.02 0.90 ± 0.05(4) 0.89 ± 0.03 0.89 ± 0.06(5) 0.88 ± 0.05 0.89 ± 0.07(6) 0.90 ± 0.01 0.89 ± 0.06
Overall R.S.D. 0.02 0.06
Water Free CaO (in g L−1)(1) 25.0 ± 0.2 24.9 ± 1.5(2) 25.2 ± 0.2 25.2 ± 1.7(3) 24.7 ± 0.1 24.9 ± 1.6(4) 24.8 ± 0.2 24.5 ± 1.0
O
4
wssnaman
ddc
otsi
pelcOaimocAt
tuasT
A
R
[10] N.R. Draper, H. Smith, Applied Regression Analysis, 3rd ed., Wiley, NY, 1998.
(5) 25.0 ± 0.3 25.1 ± 1.2(6) 24.8 ± 0.2 24.7 ± 1.6
verall R.S.D. 0.2 1.4
. Conclusions
In this paper is presented the use of digital images obtainedith a webcam as a novel detection technique in flame emission
pectrometry for implementing quantitative chemical analyses. Aimple mathematical model based on RGB colour system and vectororm concept was proposed to build linear analytical curves, as wells to estimate figures of merit of DIB-FES method. This novel treat-ent is justified considering that the analytical response is now
ssociated to a vector norm based on three experimental variables,
amely the R, G and B components.The proposed DIB-FES method was successfully applied to theetermination of lithium, sodium and calcium in anti-depressiverug, physiological serum and water, respectively. In all the appli-ations, LOD, LOQ, precision and sensitivity were better than those
[
[[[
77 (2009) 1584–1589 1589
btained from the trad-FES analysis. In case of lithium determina-ion, the proposed method presented values of LOD and LOQ muchmaller than those obtained through the method recently reportedn the literature [12].
By using an inexpensive webcam as analytical detector, the pro-osed strategy offers an promising alternative to traditional flamemission photometry. In addition, since it can dispense a wave-ength selector, this characteristic could be exploited to reduce theost and simplify the instrumentation for flame emission methods.n the other hand, the absence of wavelength selector makes thenalytical response from the webcam more susceptible to spectralnterference and/or matrix effect, especially in analytical deter-
inations involving complex matrices. Such drawbacks may bevercome by using multivariate calibration methods [11]. In thisontext, the feasibility for the use of the Generalized Standardddition Method (GSAM) [13,14] is presently under investiga-
ion.Finally, besides the advantages associated to the low cost and
he better figures of merit mentioned above, the main advantages ofsing a webcam as analytical detector compared with the trad-FESre a larger sensitivity due to trivariate nature of the detection andpatial-resolution-related characteristic inherent to digital images.his last advantage will be explored in future works.
cknowledgement
The authors thank the Brazilian agency CNPq for scholarship.
eferences
[1] N. Maleki, A. Safavi, F. Sedaghatpour, Talanta 64 (2004) 830.[2] E.N. Gaião, V.L. Martins, W.S. Lyra, L.F. Almeida, E.C. Silva, M.C.U. Araújo, Anal.
Chim. Acta 570 (2006) 283.[3] R.S. Berns, Principles of Colour Technology, 3rd ed., Wiley, NY, 2000.[4] P. Geladi, H. Grahn, Multivariate Image Analysis, 2nd ed., Wiley, NY, 1996.[5] D.A. Skoog, J.J. Leary, Principles of Instrumental Analysis, 4th ed., Saunders
College Publishing, NY, 1992.[6] <http://www.waz.com.br/Webcam/creative Webcam instant.php?codprod
=87960> (accessed April 2008).[7] IUPAC, Pure Appl. Chem. 45 (1976) 99.[8] IUPAC, Pure Appl. Chem. 45 (1976) 105.[9] D.A. Skoog, D.M. West, F.J. Holler, Fundamentals of Analytical Chemistry, 7th
ed., Saunders College Publishing, Philadelphia, 1996.
11] K.R. Beebe, R.J. Pell, B. Seasholtz, Chemometrics—A Practical Guide, Wiley, NY,1998.
12] C.M.L. Silva, V.G.K. Almeida, R.J. Cassela, Talanta 73 (2007) 613.13] B.E.H. Saxberg, B.R. Kowalski, Anal. Chem. 51 (1979) 1031.14] E.C. Silva, V.L. Martins, A.F. Araújo, M.C.U. Araujo, Anal. Sci. 15 (1999) 1235.


![Cholesterol Hydroperoxides Generate Singlet Molecular Oxygen [O 2 ( 1 Δ g )]: Near-IR Emission, 18 O-Labeled Hydroperoxides, and Mass Spectrometry](https://static.fdokumen.com/doc/165x107/63335dc0ce61be0ae50e9c78/cholesterol-hydroperoxides-generate-singlet-molecular-oxygen-o-2-1-d-g-near-ir.jpg)