
Emission microtomography of plasma
15
Emission microtomography of plasma * * A.L.Balandin, A.V.Likhachov, N.V.Panferov, V.V.Pickalov, A.A.Rupasov, A.S.Shikanov P.N.Lebedev Physical Institute, Moscow, Russia. * Institute of theoretical and applied mechanics, Novosibirsk, Russia. ABSTRACT The iteration algorithm of three-dimensional tomography, the modified Gershberg-Papulis algorithm is developed. Its accuracy characteristics have been determined by numerical simulations. Much attention has been paid to the peculiarities of preliminary processing of the projection images from physical experiment. Algorithm is used for the reconstruction of the local emission coefficients in a micropinch discharge plasma. The analysis has revealed admissible accuracy of the algorithm, its sufficient stability to measurements noises, and the applicability in the processing of a real experiment. 1. INTRODUCTION The problem of the plasma spatial inhomogeneity is one of the main problems facing the plasma diagnostics investigations. The experimental procedures are needed that could determine reliable spatial distribution of a variety of parameters, e.g. plasma emission coefficients, temperature and concentration of plasma components, spectral composition of the radiation etc. The tomographic methods have been developed in order to determine such distributions. The problems of three- dimensional emission tomography, where the self-radiation of the total plasma volume is recorded by two- dimensiona1l2dtectors are the most complicated both in view of the experiment and computation ' ' The number of observation views in such experiments is rather small (about 3—10), and the reconstruction of objects tomograms with suitable accuracy is quite a complex problem. The algorithm of such a problem should include the maximum accessible a priori information about the studied plasma. The influence of such an information and the optimal means of its correction can be ascertained in a vast computer experiment. The aim of the paper is to construct two iteration algorithms of three- dimensional tomography , to give a numerical simulation of their exact characteristics, and to discover real experimental measurements in the emission diagnostics of a micro-pinch discharge during processing of possibly all stages of the preliminary treatment of two-dimensional projections. Let's formulate the problem of three-dimensional emission tomography of the plasma ( Fig. 1 ). Here n(k) is the sought three-dimensional distribution of the 68 ISPIE Vol. 1843 Analytical Methods for Optical Tomography (1991) O-43194-1069-1/92/$4.OO
Transcript of Emission microtomography of plasma
Emission microtomography of plasma
* *A.L.Balandin, A.V.Likhachov, N.V.Panferov,V.V.Pickalov, A.A.Rupasov, A.S.Shikanov
P.N.Lebedev Physical Institute, Moscow, Russia.
* Institute of theoretical and applied mechanics, Novosibirsk, Russia.
ABSTRACT
The iteration algorithm of three-dimensional tomography, the modifiedGershberg-Papulis algorithm is developed. Its accuracy characteristics have beendetermined by numerical simulations. Much attention has been paid to thepeculiarities of preliminary processing of the projection images from physicalexperiment. Algorithm is used for the reconstruction of the local emissioncoefficients in a micropinch discharge plasma. The analysis has revealed admissibleaccuracy of the algorithm, its sufficient stability to measurements noises, and theapplicability in the processing of a real experiment.
1. INTRODUCTION
The problem of the plasma spatial inhomogeneity is one of the main problemsfacing the plasma diagnostics investigations. The experimental procedures are neededthat could determine reliable spatial distribution of a variety of parameters, e.g.plasma emission coefficients, temperature and concentration of plasma components,spectral composition of the radiation etc. The tomographic methods have beendeveloped in order to determine such distributions. The problems of three-dimensional emission tomography, where the self-radiation of the total plasma volumeis recorded by two- dimensiona1l2dtectors are the most complicated both in view ofthe experiment and computation ' '
The number of observation views in such experiments is rather small (about3—10), and the reconstruction of objects tomograms with suitable accuracy is quite acomplex problem. The algorithm of such a problem should include the maximumaccessible a priori information about the studied plasma. The influence of such aninformation and the optimal means of its correction can be ascertained in a vastcomputer experiment.
The aim of the paper is to construct two iteration algorithms of three-dimensional tomography , to give a numerical simulation of their exactcharacteristics, and to discover real experimental measurements in the emissiondiagnostics of a micro-pinch discharge during processing of possibly all stages ofthe preliminary treatment of two-dimensional projections.
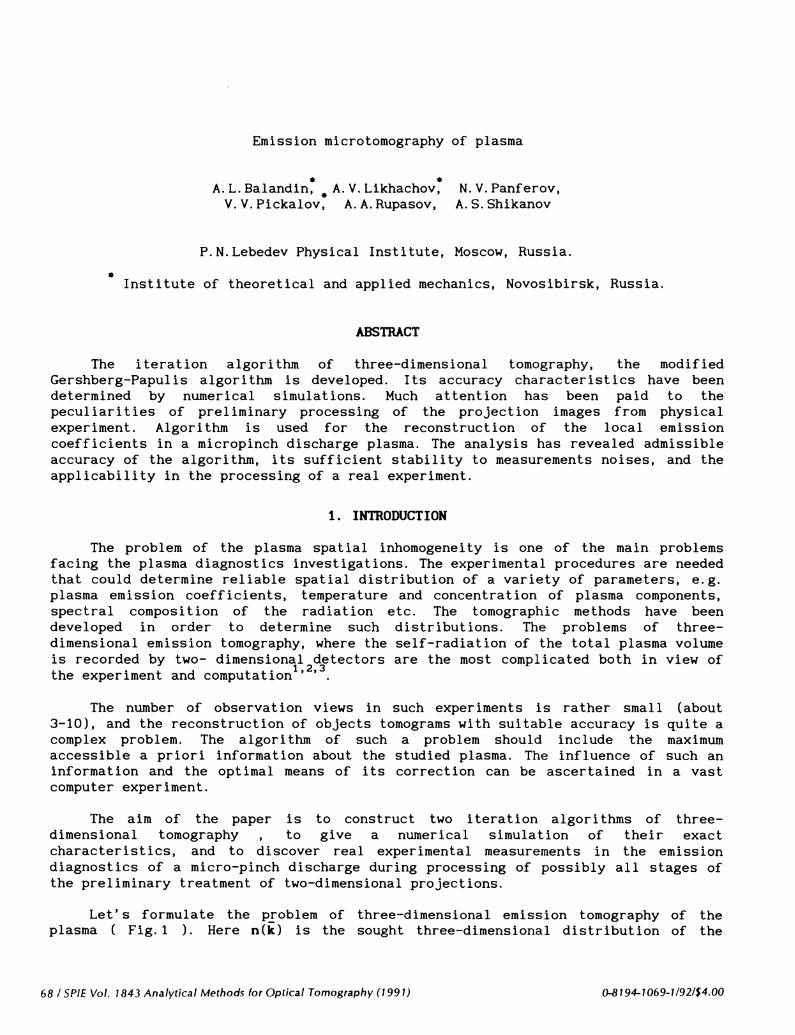
Let's formulate the problem of three-dimensional emission tomography of theplasma ( Fig. 1 ). Here n(k) is the sought three-dimensional distribution of the
68 ISPIE Vol. 1843 Analytical Methods for Optical Tomography (1991) O-43194-1069-1/92/$4.OO
local coefficients of plasma emission, a0q,(uv) the two—dimensional projection,
i.e. the integral luminosity of the plasma recorded by any two-dimensional detectorof the radiation (f.e. photo film). By neglecting the refraction, scattering andself-absorption we get the relation between the integral and local chaacteristicsof the plasma in the form of integral equation of the radial P-transform
a (u,v) = I n(k)dl9,(p J
where dl is the linear differential in T9,(p
UOV plane.
(1)
- direction with (u,v) coordinates in
Fig. 1. Geometry of three-dimensional emission tomography.
The problem of the tomography is the solution of Eq. (1) with respect to g(r) atthe known set of functions a9 (u, v), i= 1 ,. . . , N0 ; j 1 , . . . , N.
2 . THREE-DIMENSIONAL ITERATION ALGORITHM
The algorithms of compute omography (CT) for two-dimensional problems aredescribed in quite a detail in
-. We consider modifications of Gershberg-Papulis
three-dimensional iteration algorithm which continue the investigations of other1,9-12 . . . . . . 2',7,8,13-15authors . The CT algorithms without iteration are considered in
Three-dimensional modification of Gershberg-Papulis a1gorthm (3DMGP) isdestined for inversion of P-transform in a three-dimensional case . It is based onthe projection theorem, which is formulated in the following way for the case ofthree variables.
Let n(k) = n(x,y,z) be the function of three variables, a (u,v) itsO,(p
projection in (O,p) direction. Their Fourier transforms are designated as
v ) and ii(v , t, ) . Such a value of the function n(v ,v , ) on the plane,x y z U V X y Z
SPIE Vol. 1843 Analytical Methods for Optical Tomography (1991) / 69
which intersects with the coordinate origin and has the normal vector T8(1 coincides
with the function a(v ,v ). We admit N projections of a (u,v)U V
According to the central slice theorem their Fourier transforms coincide withthe cross-sections of three-dimensional Fourier transform of the solution n(v) onthe planes, having the same directions of normal vectors and intersecting thecoordinate origin. Thus, we know the Fourier transform of the solution, based on thecombination of N planes. By interpolating the values of these planes to the entireFourier space we get the Fourier transform in some approximation of the soughtfunction. By making the reverse Fourier inversion we get the function. Then weintroduce an a priori information about the sought solution, i.e. about itspositiveness, and the found function is taken to be the first approximation to thesolution. Then we make the direct Fourier transform and turn to Fourier-domainagain. Into the obtained Fourier-coefficients we introduce the known values from theplanes and turn again to the spatial region. By introducing an a priori informationabout the solution into the found function we get the second approximation to thesolution, etc. The given iteration process can be written down in the following way:
—1-P-n= F nI x i—i
(2)hi , i=1
i; =°i-i 1Fn i>l
p i-iwhere F and F1, respectively, are the operators of the direct and inverse Fouriertransform, and are the operators of the introduced a priori information in
spatial and frequency domains, respectively, and is the Fourier image, obtained
as a result of initial interpolation.
In the algorithm of this paper we used the operator c1 which reduces to zero
all negative values of the function, and all values of the function outside a ballof a unit radius. As the operator ,, we took the operator which executes the
following operations for each of the planes with the known Fourier-coefficients ofthe sought solutions. They are: in any point A of the Fourier domain (the distance
from which to the given plane is cS) the value of Fourier-transform is given, equalto mean arithmetic between the value of this point and value in the plane at thepoint, which is the projection of A to this plane. At other points the value of
Fourier image does not change.
3. COMPUTER SIMULATIONS
In the plasma tomography. experiments7 the following problems of the computersimulation were solved:
a) what is the accuracy of the image reconstruction at small number of views;b) what is the sensitivity of such a solution to the measurement noise;c) what is the influence of the difference in the projections of various
directions on the final transform;
70 / SPIE Vol. 1843 Analytical Methods for Optical Tomography (1991)
d) what numerical procedures make it possible to control reciprocal binding ofthe projections, and their internal consistency.
The results of three-dimensional numerical simulations allow us to answer thesequestions.
The computer simulation includes calculation of the projections of the knownsimulation solution, and then, the inverse problems are solved by using theseprojections, the result of reconstruction being compared to the exact solution. Thecomparison of two net functions was made on the basis of the following norm:
= - g212
where the summation is taken by all points. The norm (3. 1) is the discrete analog ofthe norm L
2
In order to control the convergence of the iteration process we have chosen thefollowing 7 kinds of deviations:
N(1) 2
g1— 1)
i 2
'100, % . (4)1 N
gHere and further is the exact solution, g is the estimation of the solution,
obtained at the 1-st operation.
(1) —
•100, %, (5)
index max denoting the maximum function on the net.
N2
(Re g1- Re
1 2
N. 100,%, (6)
(Re
where the sign above the symbol is the Fourier-transform, Re and Im are the realand imaginary parts of the function.
3.1. Reconstruction of the tomogranis: exact projections
As the test functions we used in the numerical experiment a series of gaussianthree-axis ellipsoids. Let
SPIE Vol. 1843 Analytical Methods for Optical Tomography (1991) / 71
I 41n2 41n2 41n2 )g(x,y,z) = a exp —
2 (x—x0)2 + 2 (yy0)2 + 2 (z—z0)2 , (7)( a f3 f J
where a,13, are the full gaussian half-widths by the axis coordinates. Then theprojection of the function g(x,y,z) in Ce ,p ) direction ism m
f(u,v) = aexp { [D(u_u0)2 ÷ E(v-v)2 + F(u-u)(v-v)] } , (8)
where:
A =A1sin2ecos2Ø + Xsin2e cos2 + A3cosO
2D = AAsine + AAsin cose + AXsin cose12 13 23
EXAcos2+ AAsin213 23
F=cosesin2e(xx -AA)13 23
u= -xsin + y0cos
V = x cos cose + y sinØ cose - z sine0 0 0 0
A = 1n2 = .:_a__ = (9)1 2 2 2 3 2' 13
The numerical experiment was made, in the majority of cases on the grid17x17x17, and only in some cases on the grid 33x33x33. In all cases, excluding thecase of a very noisy projection without any smoothing or regularization in the firstiterations, we observed the convergence of the iteration process (i.e. the deviation1drased from iteration to iteration). By increasing the number of iterations 1
we observed in some cases a negligible increase in t. Normally, it took place at
large aspects of observation and constant thickness of the layer ó. In some cases weobserved a clear minimum in the dependence of value on the number of iteration,
and the first iteration revealed a sharp decrease in value 1. The behavior of the
dependence Z3 on the number of iteration practically repeated the behavior of the
chart i. For greater numbers of the iterations (- 20) we observed convergence in
the decreasing of the norm for most computer experiments. In all experiments,
where that norm was taken into account, it became less than 1% by the 20-thiteration. Thus we believe that the iteration process tends to some limit (in anycase, at constant parameters). Such a behavior of the dependence can be explained bythe fact that the errors that are introduced into the Fourier transform at everyiteration with the data deflection from the projection planes being compatible withthe value
1
72 ISPIE Vol. 1843 Analytical Methods for Optical Tomography (1991)
Thus, from the divergence of algorithms one can conclude, that at large numbersof the iterations the iteration processes coincide in respect of the deviation
which tends to zero. Values A and tend to the constant limit, which depends
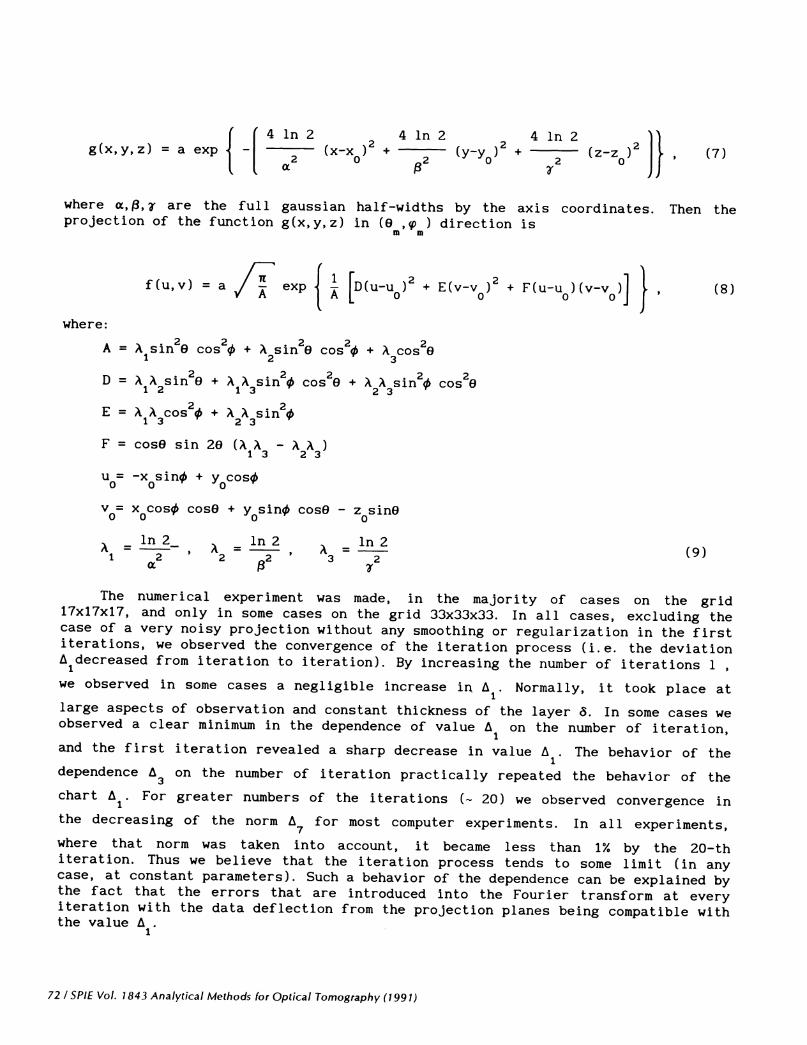
strongly on the polar angle of the projection (in numerical experiments all theprojection had the same polar angle, and were distributed uniformly by the azimuthalangle), and on the number of projections, to the lesser extent. The divergence ofthe algorithm can be observed in Fig.2. It shows the results of the gaussianreproduction with the parameters a=f3='=O.4, x0=y0=z0=O.O, where x0,y0,z0 are the
coordinates of the gaussian center. This phantom will be called below modl Ni.Fig.2 illustrates the norm , the upper curve corresponds to the angle 6=30 , thelower one to O=600, K=20 projections. It is seen that with decrease in the polarangle the deviation of the derived solution from the exact one increases5 igni f i cant ly.
L1,°h6c._0— I IL
Fig.2. Number of the errors versus number of iterations L for the model Ni.
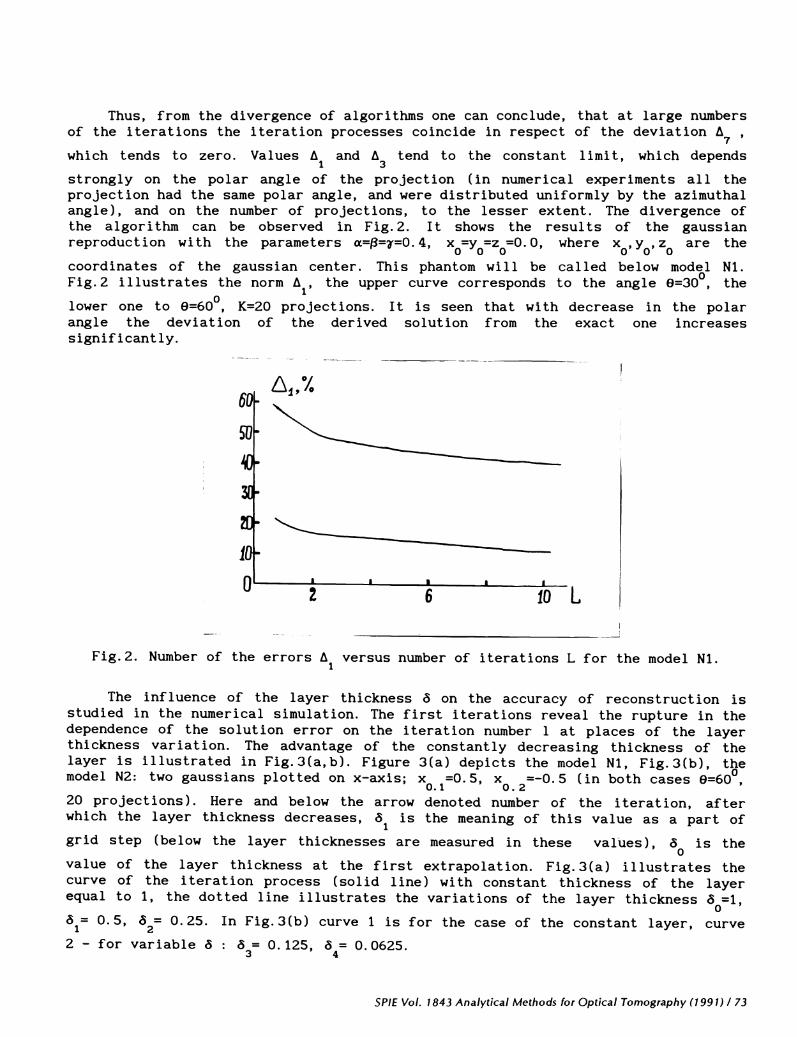
The influence of the layer thickness ó on the accuracy of reconstruction isstudied in the numerical simulation. The first iterations reveal the rupture in thedependence of the solution error on the iteration number 1 at places of the layerthickness variation. The advantage of the constantly decreasing thickness of thelayer is illustrated in Fig.3(a,b). Figure 3(a) depicts the model Ni, Fig.3(b), temodel N2: two gaussians plotted on x-axis; x0 =O.5 x0 205 (in both cases =6020 projections). Here and below the arrow denoted number of the iteration, afterwhich the layer thickness decreases, is the meaning of this value as a part of
grid step (below the layer thicknesses are measured in these values), is the
value of the layer thickness at the first extrapolation. Fig.3(a) illustrates thecurve of the iteration process (solid line) with constant thickness of the layerequal to i, the dotted line illustrates the variations of the layer thickness
0.5, 2 0.25. In Fig.3(b) curve i is for the case of the constant layer, curve
2 - for variable ó : = 0. 125 ó = 0. 0625.3 4
SPIE Vol. 1843 Analytical Methods for Optical Tomography (1991) / 73
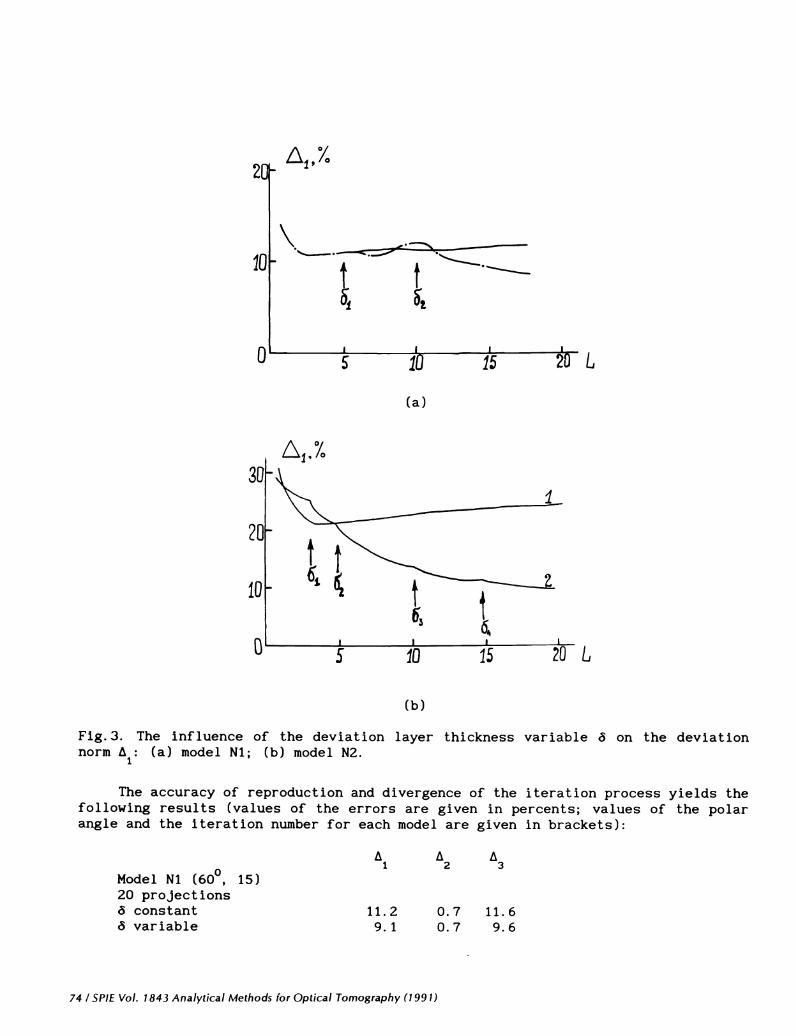
Fig.3. The influence of the deviationnorm : (a) model Ni; (b) model N2.
layer thickness variable 5 on the deviation
The accuracy of reproduction and divergence of the iteration process yields thefollowing results (values of the errors are given in percents; values of the polarangle and the iteration number for each model are given in brackets):
Model Ni (600, i5)20 projections
constant3 variable
0.7 ii.60.7 9.6
74 ISPIE Vol. 1843 Analytical Methods for Optical Tomography (1991)
Lx1,%2[
10
0
k
SI I I
lU 15
(a)
20 L
A1,°!030
10
U 5 10 15 20L
(b)
A A1 2 3
ii. 2
9. i
11 2 3
Model N2 (600, 15)20 projections5 variable 12.8 4.0 13.2
Model N3 (600, 15)20 projections5 variable 9.1 4.1 11.2
Model N3 is the elliptical gaussian, placed at the coordinate origin, a=O.1,3=O.5, r=O.2. It was used to study the influence of noise on the imagereconstruct ion.
3.2. Reconstruction of tomograms: influence of noises
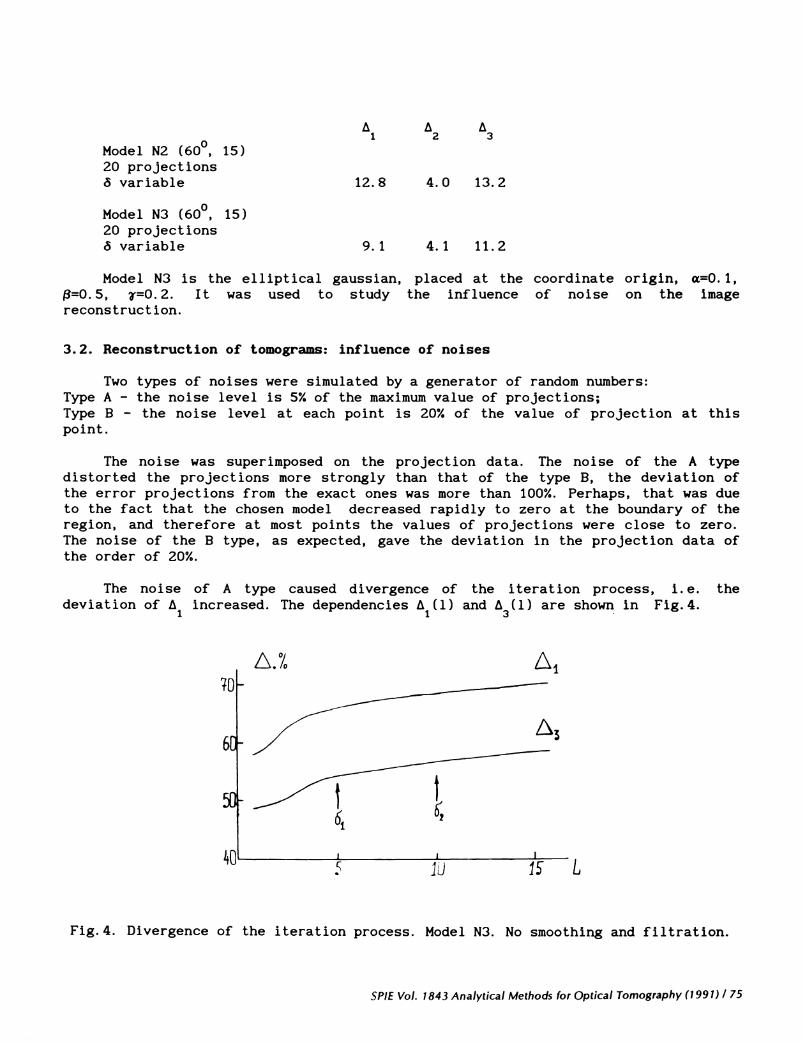
Two types of noises were simulated by a generator of random numbers:Type A - the noise level is 57. of the maximum value of projections;Type B - the noise level at each point is 20% of the value of projection at thispoint.
The noise was superimposed on the projection data. The noise of the A typedistorted the projections more strongly than that of the type B, the deviation ofthe error projections from the exact ones was more than 1007.. Perhaps, that was dueto the fact that the chosen model decreased rapidly to zero at the boundary of theregion, and therefore at most points the values of projections were close to zero.The noise of the B type, as expected, gave the deviation in the projection data ofthe order of 207..
The noise of A type caused divergence of the iteration process, i.e. thedeviation of increased. The dependencies L(l) and t3(l) are shown in Fig.4.
L.o/o
70 -61A3I i L
Fig.4. Divergence of the iteration process. Model N3. No smoothing and filtration.
SPIE Vol. 1843 Analytical Methods for Optical Tomography (1991) / 75
The noises are controlled by the median filtration method; smoothing was madeby 5 or 9 points. The followin results were obtained (values of errors are givenafter the 20th iteration, e = 60 ):
smoothing by 5 points: =38.6% A2=58.9%,
smoothing by 9 points: =47.9%, t2=46.5%
median filtration and smoothing by 5 points: z= 47.7%, 3%.
3.3. Information contents of projections
The projections obtained in different directionscapacities were studied on a complex composite model ofThe parameters of gaussians were chosen the following:
j3 x y z0 0 0
1 1.0 0.25 0.25 0.25 -0.5 0.0 0.0
2 1.0 0.25 0.25 0.25 0.0 0.0 0.0
3 1.0 0.25 0.25 0.75 0.5 0.0 0.0
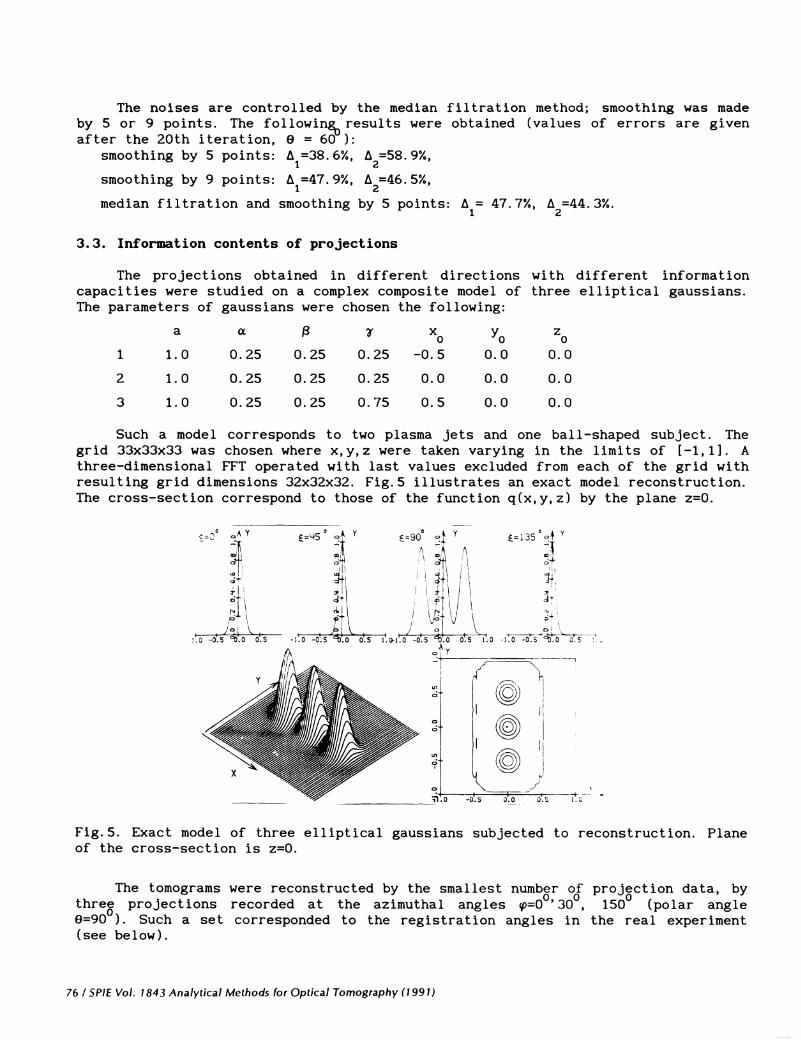
Such a model corresponds to two plasma jets and one ball-shaped subject. Thegrid 33x33x33 was chosen where x, y, z were taken varying in the limits of [-1, 1]. Athree-dimensional FFT operated with last values excluded from each of the grid withresulting grid dimensions 32x32x32. Fig.5 illustrates an exact model reconstruction.The cross—section correspond to those of the function q(x,y,z) by the plane z=0.
=135°9
J \ ____Ô5 0 -1005
,(,)IIe\
-0.5 0.0 0.5
Fig.5. Exact model of three elliptical gaussians subjected to reconstruction. Planeof the cross—section is z=0.
The tomograms
three projections=90 ). Such a set(see below).
were reconstructed by the smallest numbr ofrecorded at the azimuthal angles p=O '30corresponded to the registration angles in
projction data, by150 (polar angle
the real experiment
76 ISPIE Vol. 1843 Analytical Methods for Optical Tomography (1991)
a
with different informationthree elliptical gaussians.
O y L45 ° Y 9O°
-1o _05tO5 11J'1
1.0
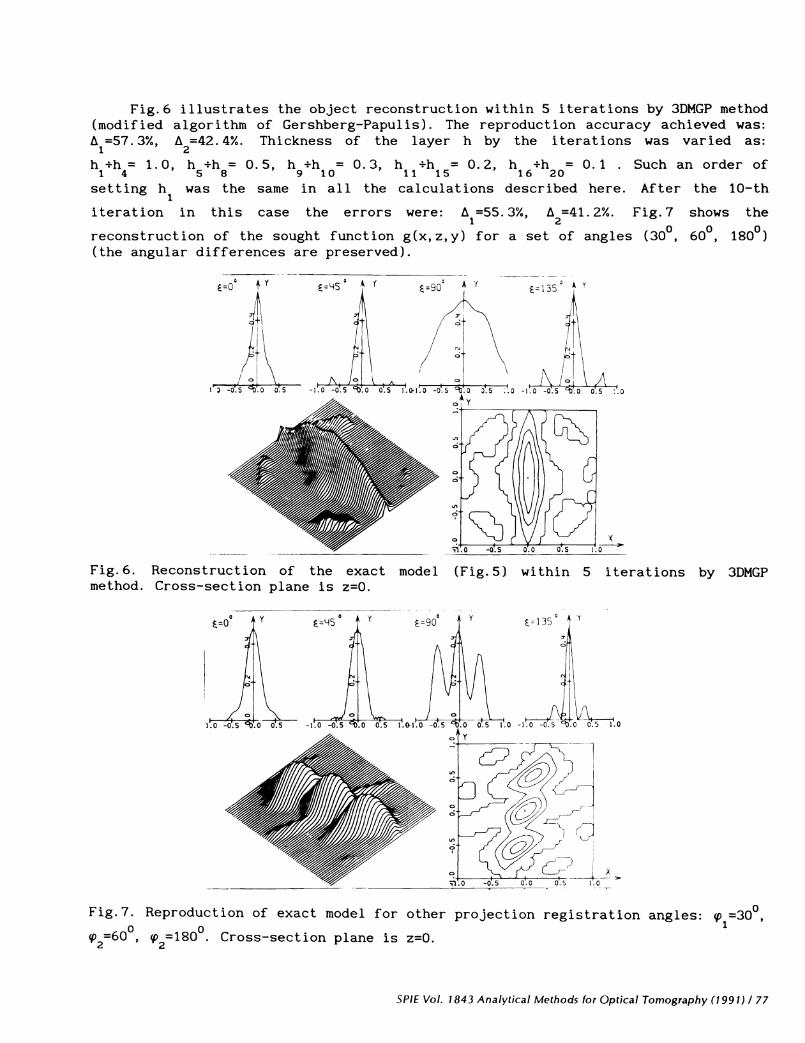
Fig.6 illustrates the object reconstruction within 5 iterations by 3DMGP method(modified algorithm of Gershberg-Papulis). The reproduction accuracy achieved was:
2Thickness of the layer h by the iterations was varied as:
h+h= 1.0 h +h = 0.5 h +h = 0.3, h +h = 0.2, h +h = 0.1 . Such an order of1 4 5 8 9 10 11 15 16 20
setting h1 was the same in all the calculations described here. After the 10-th
iteration in this case the errors were: b=55.3%, L2=41.2%. Fig.7 shows the
reconstruction of the sought function g(x,z,y) for a set of angles (30°, 60°, 180°)(the angular differences are preserved).
=oQ +
0.5
Fig.7. Reproduction of exact model for other projection registration angles: q1=30,
p2=180 . Cross-section plane is z=0.
SPIE Vol. 1843 Analytical Methods for Optical Tomography (1991) / 77
Fig.6. Reconstruction of the exact model (Fig.5) within 5 iterations by 3DMGPmethod. Cross-section plane is z=0.
x
The division of the whole structure into three separate formations is seenquite clearly, though a mean-square error of the three-dimensional image is high:
2The result in given here for the 20-th iteration, though the
similar images are obtained already by the lO-th iteration (L=51.8%, L2=43.8%). It
is interesting to note that the structure of artefacts in the cross-section z=Ocontains the defined directions along directions of the projection detection.
4. TOMOGRAPHIC INVESTIGATIONS OF A MICROPINCH DISCHARGE PLASMA
The above algorithms are compared in this chapter at the example oç6the plasmaemission coefficients reconstruction for a real physical experiment using the"Micropinch" set-up.
4.1. Parameters of the set-up and imaging system
The condenser energy was 0.3-0.5 kJ, induction of the discharge gap was I'S- 100
kA. A micropinch is produced by current of the main discharge. The micropinch is thelocal region of hot dense plasma with electron temperature T0-' 1 keV, electron
density N 10 21 cm3and the sizes 100 tim, which is the source of intense
radiationin X-ray spectral region16.
The micropinch discharge plasma in the intrinsic X-ray emission was formed invacuum pin-hole chambers and recorded on the photo emulsion. The use of 6 zm-thickAl filters made it possible to produce the radiation with quantum energy hi.' 0.8keV. The distance from the radiation source to the chamber was 21 mm, and fromchamber to the film, 149 mm, which gave the magnification F=7. Spatial resolution ofpinhole chamber was 85 m in the film and 12 im in the object with holes 10-12 nn in
diameter The produced images were parallel projections, with good approximation(beam divergence was negligibly small)16.
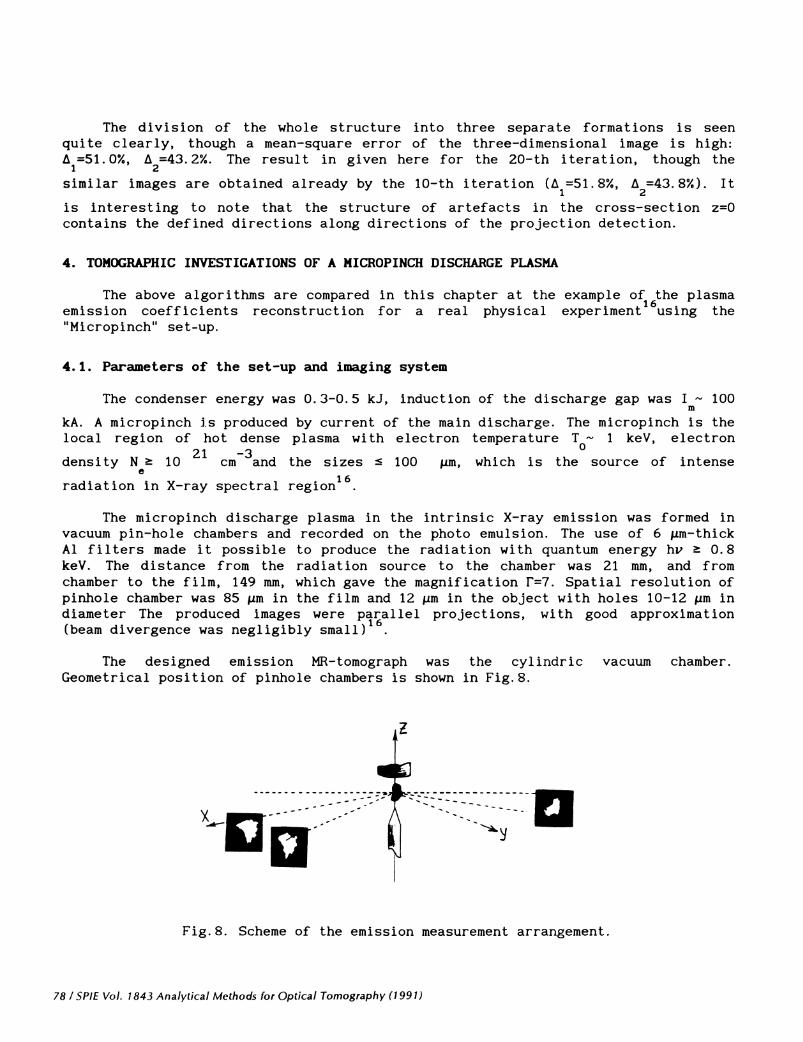
The designed emission MR-tomograph was the cylindric vacuum chamber.Geometrical position of pinhole chambers is shown in Fig.8.
Fig.8. Scheme of the emission measurement arrangement.
78 ISPIE Vol. 1843 Analytical Methods for Optical Tomography (1991)
We have used the equatorial scheme of the radiation registration, where theoptical axes of all chambers were in the same plane and the angles between them wereidentical and equal to 300. As shown in Section 3. 1 , such a system is optimal forthe image reconstruction accuracy.
4.2. Experimental reconstruction of MPD plasma
Spectral composition and time characteristics of MPD X-ray radiation arestudied in17'18. It is shown that mainly the linear emission of L-ions Fe(7A<X<l7A)is recorded on a photo film in the range of energy quanta hvO.8 keV. It intensityis considerably higher than that of hard quanta. The pulse duration of soft X-rayFWHM is -- 2 ns. For a simple mathematical treatment the source was taken to beoptically thin. Time resolution of the intrinsic plasma radiation was absent atregistration, therefore the results were averaged and, actually, corresponded to theoutmost luminosity of the object in the studied spectral region.
The X-ray images of MPD plasma produced on the photo film UF-VR 19 are treatedon the automatic microdensitometer with step 85x85 m and fuilnumber of referencepoints 21x21=441. They were used as input data for the tomographic processing by3DMGP method.
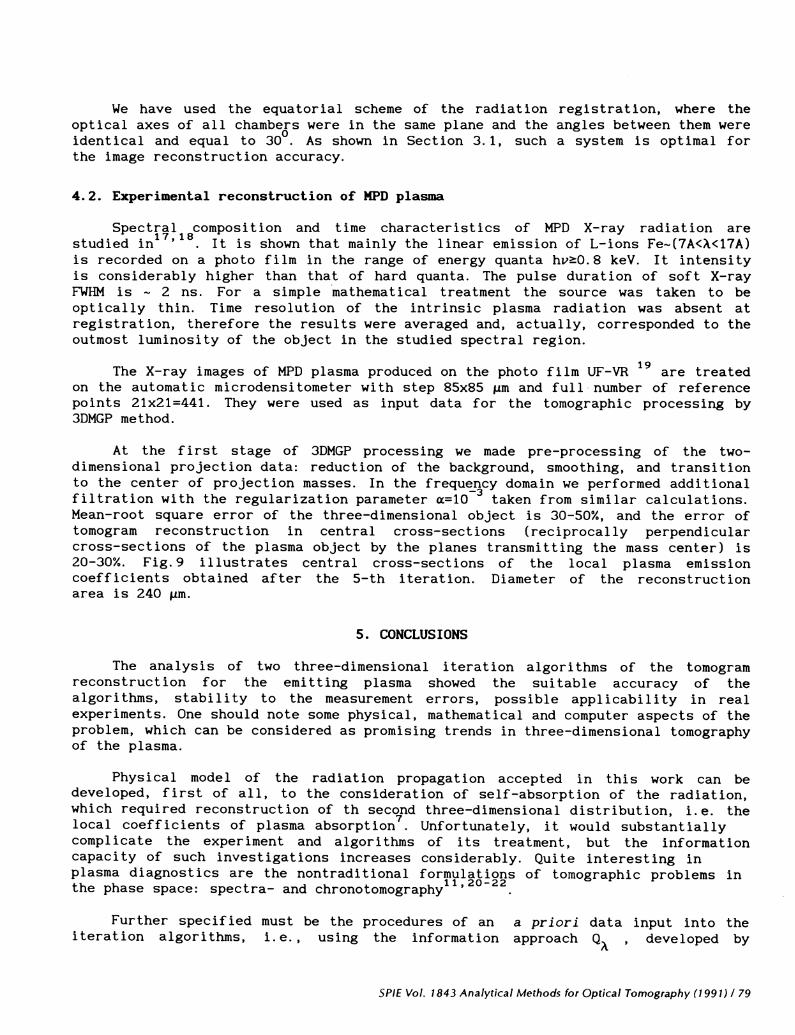
At the first stage of 3DMGP processing we made pre-processing of the two-dimensional projection data: reduction of the background, smoothing, and transitionto the center of projection masses. In the frequ9cy domain we performed additionalfiltration with the regularization parameter a=1O taken from similar calculations.Mean-root square error of the three-dimensional object is 30-50%, and the error oftomogram reconstruction in central cross-sections (reciprocally perpendicularcross-sections of the plasma object by the planes transmitting the mass center) is20-30%. Fig.9 illustrates central cross-sections of the local plasma emissioncoefficients obtained after the 5-th iteration. Diameter of the reconstructionarea is 240 tim.
5 . CONCLUSIONS
The analysis of two three-dimensional iteration algorithms of the tomogramreconstruction for the emitting plasma showed the suitable accuracy of thealgorithms, stability to the measurement errors, possible applicability in realexperiments. One should note some physical, mathematical and computer aspects of theproblem, which can be considered as promising trends in three-dimensional tomographyof the plasma.
Physical model of the radiation propagation accepted in this work can bedeveloped, first of all, to the consideration of self-absorption of the radiation,which required reconstruction of th second three-dimensional distribution, i.e. thelocal coefficients of plasma absorption . Unfortunately, it would substantiallycomplicate the experiment and algorithms of its treatment, but the informationcapacity of such investigations increases considerably. Quite interesting inplasma diagnostics are the nontraditional formulations of tomographic problems inthe phase space: spectra- and chronotomography11'2022.
Further specified must be the procedures of an a priori data input into theiteration algorithms, i.e., using the information approach , developed by
SPIE Vol. 1843 Analytical Methods for Optical Tomography (1991)! 79
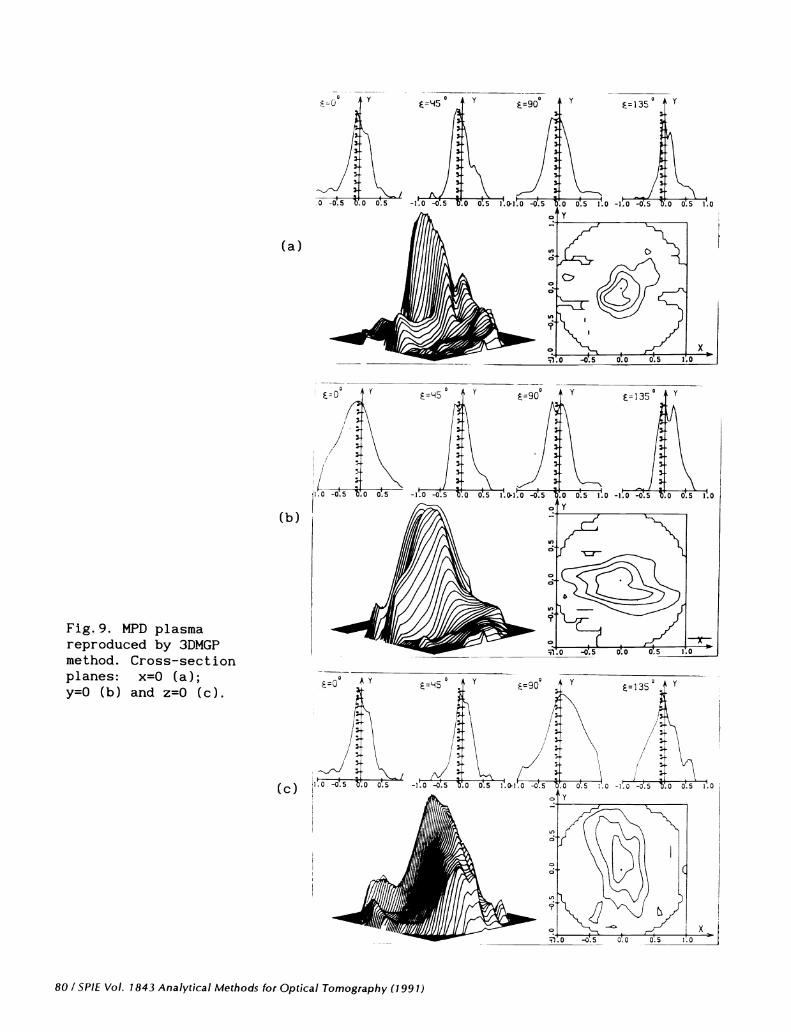
Fig.9. MPD plasmareproduced by 3DMGPmethod. Cross—sectionplanes: x=O (a);y=O (b) and z=O (c).
(a)
(b)
(c)
80 / SPIE Vol. 1843 Analytical Methods for Optical Tomography (1991)
I.G. Kazantsev23'24. In 3DMGP algorithms it is necessary to relate t1e innerparameter of the algorithm 5 with value Q. Method of minimal projections gives
the upper value for a three-dimensional object, which can also be used as an apriori information.
The search of optimal fast-operation with law memory of the iterationalgorithms is one of the problems of three-dimensional program realization. Thecomputer realization of these programs would allow one to reduce the calculationtime from hours and tens minutes to several minutes. Moreover, still actual is theproblem of representation of three-dimensional distributions. There are neededmodifications and further improvement in frames of reflection of diffuse plasmaobjects of the computer graphics programs (beam tracing, darkening etc. ). Perhaps,one should develop special data bases, which store initial projection data, resultsof their pre—processing, reproduced three-dimensional matrices of the plasmaemission, as well as libraries of ready plasma transforms in various cross—sectionsand different experimental conditions. Such DB could be an important informationsource for numerical simulation of three-dimensional gasdynamic and radiativeprocesses in the plasma.
6. REFERENCES
1 . G. N. Minerbo, J. G. Sanderson, D. B. van Hulsteyn et al . , Three-DimensionalReconstruction of the X-ray Emission in Laser Imploded Targets", Appi. Opt., vol.19,no.10, pp.1723-1728, 1980.
2. V. I.Denisov, Ju.A.Zakharenkov, A.A.Kologrivov, V. V. Pickalov,N. G. Preobrazhensky, A. A. Rupasov, G. V. Skl izkov, N. V. Sharapova, A. S. Shikanov,
"Emission and Interferometric Methods of Laser Plasma Tomography", Brief Reports onPhysics, no 12, pp.17-21, 1985 (in Russian).
3. Y. W. Chen, N. Miyanaga, M. Yamanaka, M. Nakai , K. Tanaka, K. Nishihara, T. Yamanaka,S. Nakai , " Three-Dimensional Imaging of Laser Imploded Targets" , J. Appi . Phys.,vol.68, no.4, pp.1483-1488, 1990.
4. F.Natterer, The mathematics of computerized tomography, Stuttgart et al.:B.G.Teubner, John Wiley, 1986.
5. A.K.Luis, F.Natterer, Proc. of IEEE, NBB H, vol.71, no.3, pp.111-125, 1983.6. A.N.Tichonov, V.Ya.Arsenin, A.A.Timonov, Mathematical Problems of Computer
Tomography, Nauka, Moscow, 1987 (in Russian).7. V. V. Pickalov, N. G. Preobrazhensky, Reconstruct ive Tomography in Gas Dynamics
and Plasma Physics , Novosibirsk, Nauka, 1987 (in Russian).8. G.Harman, Image Reconstruction from Projections, Mir, Moscow, 1983 (in
Russian).9. M.Defrise, C.De Mol, "A Regularized Iterative Algorithm for Limited—Angle
Inverse Radon Transform", Optica Acta, vol.30, no.4, pp.403-408, 1983.10. G.N.Vishnyakov, G.A.Gilman, G.G.Levin, "Reconstruction of Tomograms for
Small Number of Projections. Iterative Methods", Opt. & Spectr., vol.58, no.2,pp.406-413, 1985 (in Russian).
11. G.G.Levin, G.N.Vishnyakov, Optical tomography, Radio i svyaz, Moscow, 1989(in Russian).
12. A.L.Balandin, A.V.Likhachov, V.V.Pickalov, "Generators of Low-TemperaturePlasma", Proceedings of XIth All-Union Conference, part II, pp.236-237, Novosibirsk,1989. (in Russion)
13. 0. Nalchoglu, E. H. Chgo, Proc. of IEEE, NBB H, vol. 66, no. 11, pp. 345-347,1978.
SPIE Vol. 1843 Analytical Methods for Optical Tomography (1991) / 81

(1 66 1) AqdeBowoj ,idO oj spoqj jepAIuv i jo,' 31d5 ,' zii
. (UgTssn UT) 6861 'U)jT4S '88-L8 •dd ' • I I d ' '1OWOJ dwo uo dwAS UOTUfl-TTy QJAI JO 3O1J ')UW9J4"y' 'Ufl)t3'j 'AOUJj/
. (UTssnH UT) 0661 'ZLI-L9t'dd 'ou 'LITOA 'SOTUO.1WaT WflUfl1j '1SW9 JSfl JO SJ39W1d
eodS-/2Jau3 Jo UOT 1OSJ Tt421,1 'iojo Id A 'i 'AoU9s)IV d A 'Z (UTSSflJ UT)
9861 '1SSfl SY S JU3 dwoj 's1JqsoAo ' 99 . ou uT1dJd 'tqd.zowoj pazindwo UT uoT,ro1d ATW10JUI 2OJ T1T13 UOTOTaS 'AOSUZ] CZ
(UTSSfl} UT) 8861 'AU ')!wnU AO)E 'SCI' d ' j i d ' .zcdS Uo •.19JU03 UOTUfl-T TV '1XX JO OO1J '
Aqdi2owo pu do3soJodS o 4u/,1 'A)suoqzJqooJJ N 'Ao)jo 'A 'A •
9861 'CLI-OLI'dd 'C69'T0' ' Al S3UO1Otj pU 'Aqd.zoap 'Aqd1otoq pds qTH :rIds ozi '.,2UTPJ0O9H
aw,u pedS q2TH o qooidd M3N 1c2j,, 'ioqs 'i 'ojtz3w;oJ 'A 'A 'AaAJwouoJ'}'y 'UTA8"'J'3 'u'[qqzoJj'r'n) 'iz
'(UTSSfl}j UT) S861 'C6-L8 'dd 'issn sv as iuj 'dwoj 's,zqsoAo 'swaqoid AqcI,zowoj aAT nzisuoa>j :u 'Ao)jAUqs 'N ' 'uTAQ '0 'o 'oz
'(UTSSfl)J UT)I661 'btO3SOH
' 'OU 'JTf tUTzdazj ''Ta AO1SflW 'V 'A 'AOAqSO4 '0 'N 'AOJpUS)TV 'N 'flf '61
'(UTSSflJ UT) 1861 'LOZI—6611'dd '9'OU
'L '1O' ''WSTd SAth1 ' qoUdOzo 92JT43STG UIflfl3A JO S3TWUJcU JO UO' 2T S9AUI 1WeWT.19dX311 '' AoUaw5'O'O 'UTT4)flTOd'N'S 'A0)1TUU9JOA'V'A '81
'(UTSSfl UT) SC6-LZ6'dd '8'OU 'I1'10" ''WSTcJ 'SALkJ 'AO3TUTpTS'A'A 'A9T1S0X'N'N 'AOUOUO'A'3 'LI
'(UTssflH UT) Z661 'poqs qnd eq o "WT13dX uqaej T 'qTd ''Tn ° AoAaqso'' 'AOUuueeeA'V'A 'UTpUTa"1'V '91
'(UTSSflH UT)8861 'C89-LL9'dd ''ou '9'o' ''iadS 'SI
'1861 ',OZ-ZOZ'dd 'S'OU '69'TOA 'H 6TffN '3( JO OO1J 'OqJ'}j'3 'J''f '1