2 Neurochemical Imaging with Emission Tomography
31
2 Neurochemical Imaging with Emission Tomography: Clinical Applications Giovanni Lucignani and James J. Frost G. Lucignani, MD Unit of Molecular Imaging, Division of Radiation Oncology, European Institute of Oncology, and Institute of Radiologi- cal Sciences, University of Milan, Via Ripamonti 435, 20141 Milan, Italy J. J. Frost, PhD, MD Departments of Radiology and Radiological Services and Neuroscience, The Johns Hopkins University School of Medi- cine, JHOC 3225, 601 North Carolina Street, Baltimore, MD 21287, USA 2.1 Introduction The assessment of neurochemical and neurophysi- ological variables by emission tomography can be based on two strategies in relation to the goal to be achieved. A first approach is aimed at the assessment of basic variables related to brain functional activity and energy metabolism, such as blood flow, rates of glucose and oxygen metabolism, and incorporation of amino acids into proteins. This first approach allows us the assessment of brain function in a broad manner, often without previous knowledge of the location, if any, to look for a specific function or an abnormal function. A second approach is based on the measurement of neurotransmitter synthesis and reuptake, receptor density and enzyme activity, i.e., variables related to the function of the chemically heterogeneous neuronal populations that compose the central nervous system. This second approach requires a more solid prior hypothesis on the system and on the neurochemical variable to be assessed, among many, and on the construction of the experi- mental approach. The two approaches are comple- mentary and can be used for the assessment of regional derangements of cerebral energy metabo- lism and chemical transmission. As most CNS disor- ders entail neurochemical alterations involving the synthesis of neurotransmitters and the disruption of synaptic function, imaging of neurotransmitters and neuroreceptors has become crucial in helping to understand the intrinsic neurochemical basis of neurologic and psychiatric diseases. CONTENTS 2.1 Introduction 7 2.2 Physiologic and Biochemical Basis of Radionuclide Brain Imaging 8 2.2.1 Cerebral Blood Flow and Energy Metabolism 9 2.2.2 Neurotransmission 9 2.3 Methodology 9 2.3.1 Detection Instruments 9 2.3.2 Dynamic and Static Acquisition Procedures 10 2.3.3 Data Analysis 10 2.4 Tracers for Brain Imaging 12 2.4.1 Cerebral Blood Flow and Metabolism Tracers 12 2.4.2 Neurotransmission Function Tracers 12 2.5 Clinical Applications 14 2.6 Dementias 14 2.6.1 Cerebral Blood Flow and Metabolism in Patients with Degenerative Dementias 15 2.6.2 Neurotransmission Function in Degenerative Dementias 16 2.6.3 Amyloid and Microglial Activation Imaging in Alzheimer Disease 17 2.7 Movement Disorders 17 2.7.1 Cerebral Blood Flow and Metabolism in Movement Disorders 18 2.7.2 Neurotransmitter Function in Movement Disorders 18 2.8 Cerebrovascular Diseases 20 2.8.1 Cerebral Blood Flow and Metabolism in CVD Patients 20 2.8.2 Imaging of Neuronal Viability by Assessment of Central Benzodiazepine Receptors 22 2.9 Epilepsy 22 2.9.1 Cerebral Blood Flow and Metabolism in Seizure Disorders 23 2.9.2 Neurotransmission Function in Seizure Disorders 25 2.10 Brain Tumors 26 2.10.1 Imaging of Tumor Metabolic Processes 27 2.10.2 Imaging of Cerebral Tumors by Antibodies and Receptor-Bound Tracers 27 2.10.3 Differential Diagnosis of Lymphoma and Infectious Diseases in AIDS 28 2.11 Outlook for the Future 28 References 29
-
Upload
khangminh22 -
Category
Documents
-
view
1 -
download
0
Transcript of 2 Neurochemical Imaging with Emission Tomography

Neurochemical Imaging with Emission Tomography: Clinical Applications 7
2 Neurochemical Imaging with Emission Tomography: Clinical Applications Giovanni Lucignani and James J. Frost
G. Lucignani, MDUnit of Molecular Imaging, Division of Radiation Oncology, European Institute of Oncology, and Institute of Radiologi-cal Sciences, University of Milan, Via Ripamonti 435, 20141 Milan, ItalyJ. J. Frost, PhD, MDDepartments of Radiology and Radiological Services and Neuroscience, The Johns Hopkins University School of Medi-cine, JHOC 3225, 601 North Carolina Street, Baltimore, MD 21287, USA
2.1 Introduction
The assessment of neurochemical and neurophysi-ological variables by emission tomography can be based on two strategies in relation to the goal to be achieved. A first approach is aimed at the assessment of basic variables related to brain functional activity and energy metabolism, such as blood flow, rates of glucose and oxygen metabolism, and incorporation of amino acids into proteins. This first approach allows us the assessment of brain function in a broad manner, often without previous knowledge of the location, if any, to look for a specific function or an abnormal function. A second approach is based on the measurement of neurotransmitter synthesis and reuptake, receptor density and enzyme activity, i.e., variables related to the function of the chemically heterogeneous neuronal populations that compose the central nervous system. This second approach requires a more solid prior hypothesis on the system and on the neurochemical variable to be assessed, among many, and on the construction of the experi-mental approach. The two approaches are comple-mentary and can be used for the assessment of regional derangements of cerebral energy metabo-lism and chemical transmission. As most CNS disor-ders entail neurochemical alterations involving the synthesis of neurotransmitters and the disruption of synaptic function, imaging of neurotransmitters and neuroreceptors has become crucial in helping to understand the intrinsic neurochemical basis of neurologic and psychiatric diseases.
CONTENTS
2.1 Introduction 72.2 Physiologic and Biochemical Basis of Radionuclide Brain Imaging 82.2.1 Cerebral Blood Flow and Energy Metabolism 92.2.2 Neurotransmission 92.3 Methodology 92.3.1 Detection Instruments 92.3.2 Dynamic and Static Acquisition Procedures 102.3.3 Data Analysis 102.4 Tracers for Brain Imaging 122.4.1 Cerebral Blood Flow and Metabolism Tracers 122.4.2 Neurotransmission Function Tracers 122.5 Clinical Applications 142.6 Dementias 142.6.1 Cerebral Blood Flow and Metabolism in Patients with Degenerative Dementias 152.6.2 Neurotransmission Function in Degenerative Dementias 162.6.3 Amyloid and Microglial Activation Imaging in Alzheimer Disease 172.7 Movement Disorders 172.7.1 Cerebral Blood Flow and Metabolism in Movement Disorders 182.7.2 Neurotransmitter Function in Movement Disorders 182.8 Cerebrovascular Diseases 202.8.1 Cerebral Blood Flow and Metabolism in CVD Patients 202.8.2 Imaging of Neuronal Viability by Assessment of Central Benzodiazepine Receptors 222.9 Epilepsy 222.9.1 Cerebral Blood Flow and Metabolism in Seizure Disorders 232.9.2 Neurotransmission Function in Seizure Disorders 25
2.10 Brain Tumors 262.10.1 Imaging of Tumor Metabolic Processes 272.10.2 Imaging of Cerebral Tumors by Antibodies and Receptor-Bound Tracers 272.10.3 Differential Diagnosis of Lymphoma and Infectious Diseases in AIDS 282.11 Outlook for the Future 28 References 29

8 G. Lucignani and J. J. Frost
The first studies aimed at the in vivo assessment of cerebral function by using radioactive tracers and external monitoring by gamma-rays detectors were focused on measuring cerebral hemodynamics and energy metabolism (Ingvar and Lassen 1961; Hoedt-Rasmussen et al. 1966; Obrist et al. 1975; Phelps et al. 1979; Reivich et al. 1979; Frackow-iak et al. 1980; Herscovitch et al. 1983). This work was a tremendous stimulus in the development of tracer methods for the assessment of regional cere-bral blood flow in clinical practice, a goal that has been readily achieved in the mid 1980s following the development of SPECT perfusion tracers labeled with Iodine-123 and most important with Techne-tium-99m. Following these milestones in the devel-opment of brain perfusion imaging in humans, there has been further development of methods and trac-ers over the last two decades that permit the assess-ment of neurotransmission. The first images of brain receptors were those of dopamine (D2) receptors (Wagner et al. 1983) with PET, and those of musca-rinic cholinergic receptors (Eckelman et al. 1984) with SPECT. An historical overview of the develop-ment in the field of neurotransmitter imaging has recently been published by Frost (2003). Following this seminal work many tracers have been developed (Mason and Mathis 2003) and are currently used. Basic neuroscientists and clinical neuropsychiatrists use these methods for the assessment of regional cerebral functional activity and of neurochemical transmission under physiologic or pharmacologic conditions. Currently, the use of emission tomogra-phy allows assessment of cerebral blood flow, glu-cose utilization, oxygen metabolism, oxygen extrac-tion ratio, rate of incorporation of amino acids into proteins, and rate of transport of substrates across the brain capillaries into the brain, as well as of the rate of neurotransmitter storage, release, and bind-ing to specific receptors. The assessment of neuro-transmission by emission tomography has attracted the interest of neuroscientists with an expertise in nuclear medicine and has raised high expectations among clinical neurologists and psychiatrists, many of which have been realized.
2.2 Physiologic and Biochemical Basis of Radionuclide Brain Imaging
The central nervous system is a heterogeneous entity composed of a number of neuronal systems for trans-
ferring signals along their own body surface and, by secreting highly selective chemical substances, transferring this information to down-stream neu-rons. This function requires a continuous supply of nutrients through the cerebral circulation. As nutrients are delivered to brain structures for their energy metabolism, the rate of delivery and their consumption is indicative of neuronal functional activity, and also of functional derangements when they occur. Since the function of the nervous system is based on the communication among its compo-nents, the characterization of the neuronal circuits and of neurotransmission constitute a primary goal of neuroscientists and neuropsychiatrists. A description of the fundamental body of knowledge is reported elsewhere (Feldman et al. 1997; Siegel et al. 1999).
Neuronal communication represents the ulti-mate function of the nervous system. It requires the integrated function of ion channels, classi-fied according to the mechanism controlling their gating as either voltage-sensitive or receptor oper-ated, and neurotransmitters, defined on their pres-ence and release at the presynaptic sites and on the capability to evoke a response at the postsynaptic site. The sequence of events characterizing neuro-transmission can be schematically summarized as follows. The propagation of an action potential in the presynaptic neuron activates voltage-sensitive channels at the nerve ending, which turn on the fusion and release of synaptic vesicles, contain-ing the neurotransmitter, into the synaptic cleft; the neurotransmitter then binds to postsynaptic neuroreceptors and initiates a cascade of events, including the activation of second messengers, and by modifying the ionic permeability of the postsyn-aptic neuron. This event in turn may result in the excitation or inhibition of the postsynaptic neuron, by either depolarization or hyperpolarization states produced by changes in neuronal membranes’ per-meability to ions such as calcium, sodium, potas-sium and chloride. The depolarization results in an excitatory postsynaptic potential (EPSP), whereas the hyperpolarization results in an inhibi-tory postsynaptic potential (IPSP). EPSP and IPSP have a short duration, of the order of milliseconds, therefore they represent temporary states during which the threshold for neuronal response is either decreased (depolarization) or increased (hyperpo-larization). The electrical impulses and the chemi-cal messengers act sequentially and synergistically, the former for intraneuronal conduction, the latter for interneuronal communication.

Neurochemical Imaging with Emission Tomography: Clinical Applications 9
2.2.1 Cerebral Blood Flow and Energy Metabolism
The normal energy metabolism of the nervous system is dependent on the obligatory consumption of oxygen and glucose. Due to the lack of significant storage of glycogen, the brain functions are sustained by a continuous supply of nutrients via blood. The rate of glucose and oxygen utilization throughout the brain is very heterogeneous and is tightly coupled to the rate of blood flow. Thus, the assessment of any of the three variables, i.e., blood flow, oxygen or glucose utilization, provides a measure of the degree of cerebral functional activity (Sokoloff 1960). Normal values of regional cerebral blood flow and metabolism and other neurophysiologic variables are listed in Table 2.1. Because of the close relation between blood flow, metabolism and brain function, the assessment of blood flow is currently performed not only with the aim of detecting cerebrovascular disorders, i.e., pathologic states originated by altera-tions of cerebral circulation, but also to assess other diseases of the nervous system that, due to neuronal death or to neuronal loss of function, require less blood supply compared to normal regions. In the latter case the reduction of blood flow is secondary to a reduced metabolic demand. The increase in blood flow is interpreted as a consequence of increased functional activity and this concept is the basis of the neuroactivation studies aimed at localizing areas and neuronal networks involved in functional processes.
2.2.2 Neurotransmission
The function of the different neuronal systems of the brain hinges on the synthesis and release of sev-eral neurotransmitters, each acting selectively on specific neuroreceptor types and subtypes. Thus, neurons, receptors, and entire neuronal networks, can be classified according to the neurotransmitter utilized. Neurotransmitters can range in size from small molecules such as amino acids and amines, to peptides. They are contained in small intracel-lular vesicles and are released in the synaptic cleft by exocytosis. Neurotransmitters act by influencing the excitability of target receptors, located either on postsynaptic neurons or effector organs. The mech-anism of action of neurotransmitters depends on the features of the two types of receptor subfamilies. Ligand-gated receptors contain an intrinsic channel that is rapidly opened in response to transmitter
binding, whereas G protein-coupled receptors acti-vate G proteins in the membrane which then stimu-late various membrane effector proteins. Membrane proteins act on the synthesis of second messengers (e.g. cAMP, cGMP, and Ca ions) which in turn act on intracellular protein kinases. The action of neu-rotransmitters may produce rapid and short-term changes, or initiate long term processes by modify-ing gene expression. The neurotransmitter action is terminated after metabolic degradation or cel-lular reuptake. Many neurons possess autoreceptors at their surface, which by responding to the cell’s own transmitter initiate feedback mechanisms that reduce transmitter synthesis and release.
2.3 Methodology
The development and use of methods for brain radionuclide studies must take into account cerebral morphologic heterogeneity, neuronal circuitry com-plexity, neurotransmitter specificity, non-uniform blood flow and metabolism, and presence of the blood–brain barrier (BBB). Each experimental and diagnostic procedure must be tailored to examine the physiologic and biochemical process of interest.
The methodological research has been aimed at constructing instruments to detect and reconstruct the temporal distribution of tracer substances in three dimensions and at developing methods of data analysis for the transformation of the radioactivity distribution data into relevant neurophysiologic and neurochemical parameters.
2.3.1 Detection Instruments
The process of detecting photons emitted either as singles or in pairs, constitutes the basis of single photon emission computed tomography (SPECT) and
Table 2.1. Normal values per 100 g brain tissue in a healthy resting young adult man. (Modified from Sokoloff 1960)
Cerebral blood flow 57 ml/minCerebral oxygen consumption 03.5 ml/minCerebral glucose utilization 05.5 mg/minCerebral blood volume 04.8 mlMean RBC volume 01.5 mlMean plasma volume 03.3 ml

10 G. Lucignani and J. J. Frost
positron emission tomography (PET), respectively (Chap. 16). In order to appreciate the potentials and limitations of SPECT and PET with respect to their applications in brain studies, it is worth pinpoint-ing some features of both techniques. Image quality in emission tomography results from a compromise between spatial resolution, which affects the ability to discriminate small structures, and count density, which depends on the system detection efficiency and determines the level of noise in the image. The temporal resolution of emission tomography, defined as the minimum time needed for acquisition of counts, even with recent increases in detection efficiency, remains on the order of seconds/min-utes to obtain acceptable, i.e., low noise levels in the image. It should be noted that detection efficiency in PET is approximately 10–15 times higher than in SPECT. The features of state-of-the-art PET and SPECT scanners are defined according to their phys-ical performances, including field of view, spatial resolution, system sensitivity, count rate (Chap. 16). Whereas PET remains for the brain an instrument primarily devoted to research with many opportuni-ties for clinical applications still unexplored, SPECT is nowadays widely used for clinical purposes, and will mature as a research tool in time.
2.3.2 Dynamic and Static Acquisition Procedures
Two main approaches can be used for SPECT and PET brain data acquisition. One is based on the acquisition at one fixed time interval after tracer administration. The second approach is based on the measurement of changes in time of the brain radioactivity distribu-tion. The two approaches are sometimes referred to as autoradiographic and dynamic imaging, respectively. Both methods may require sequential sampling of peripheral arterial or venous blood to determine the time course of radioactivity in blood. Blood sampling is usually necessary for quantitative assessment of physiologic or biochemical processes, whereas it is not required for assessing uptake ratios of radioac-tivity distribution between cerebral structures, also referred to as semiquantitative indices of function.
2.3.3 Data Analysis
Data analysis presents a major intellectual and prac-tical challenge in SPECT and PET. Quantification is,
in general, a requisite of research studies and is often a complex procedure that may require the assess-ment of the fractions of radioactive metabolites in blood by chromatography and scintillation count-ing, as well as scanning times in the order of hours. Data acquired for quantification must be analyzed by kinetic models; these are in general schematic representations of the behavior of tracers in the body spaces, i.e., compartments (Gjedde and Wong 1990). Kinetic models represent the basis to calculate the variables of interest, e.g., tracer rate of transfer across compartment boundaries or rate of tracer accumu-lation in a compartment. The application of these models requires measurement of radioactivity con-centrations in blood and brain after tracer injection. These models may require the a priori knowledge of parameters that are applicable to any subject; two of such kinetic models are shown in Fig. 2.1. Models representing biological events never can fully account for all relevant factors and conditions that occur in vivo and consequently are imperfect. The experimental procedures must therefore be designed to minimize the possible errors arising from limita-tions and imperfections of the method. Semiquan-titative assessment is considered adequate in most clinical studies with emission tomography, when only localization of phenomena is sought. Quantifi-cation may also not be required in activation studies, i.e., performed under baseline conditions (unstimu-lated) and then repeated under physiologic or phar-macologic stimuli, where localization of neuronal function is sought. For many studies that address clinical and research questions, location may be only a part of the information sought; the assessment of the magnitude of the alterations is also important. Furthermore, it is often impossible without quanti-fication to make comparisons between individuals, e.g., patients, groups, and normal control subjects. Relative changes, as assessed by semiquantitative methods, may be inadequate because the reference region may be affected by the same process as the area under investigation. Nevertheless, semiquanti-tative assessments are in general preferred as they are less cumbersome for patients, physicians and technical staff, since blood sampling can generally be avoided and data acquisition can be performed in a shorter time span, with an acceptable tradeoff in accuracy.
Regional cerebral radioactivity is usually mea-sured by drawing regions of interest (ROIs) of either regular or irregular shape on the images. This pro-cedure is time consuming and can be biased as it is based on arbitrary subdivision of cerebral struc-
Neurochemical Imaging with Emission Tomography: Clinical Applications 11
tures into small discrete volumes. To overcome these problems non-interactive voxel by voxel-based techniques have been developed. One such method developed by Friston et al. (1995) for activation studies with PET and 15O-labeled water, has become very popular, and is known as statistical paramet-ric mapping (SPM). The use of this method has been extended to other tracers. It offers a series of non-interactive techniques that permit: (1) spatial nor-malization of brain images into a stereotactic space, (2) normalization for differences in global cerebral radioactivity distribution depending on intersubject variability, and (3) higher spatial resolution than that achieved with subjective ROIs based analysis.
Methods have been specifically developed for estimating in vivo regional variables of blood flow, metabolism, neurotransmitter synthesis and recep-tor binding. A selection of these methods is reported in Table 2.2.
Whereas numerous procedures for quantita-tive measurement of hemodynamic and metabolic variables have been established and fully validated, semiquantitative assessments are performed for clinical use. Methods developed for the assessment of neurotransmission function have been most often semiquantitative, although fairly simple quantitative methods exist for assessing the maximum concen-tration of binding sites (Bmax) and the affinity of the ligand for the receptor (KD). A frequently adopted
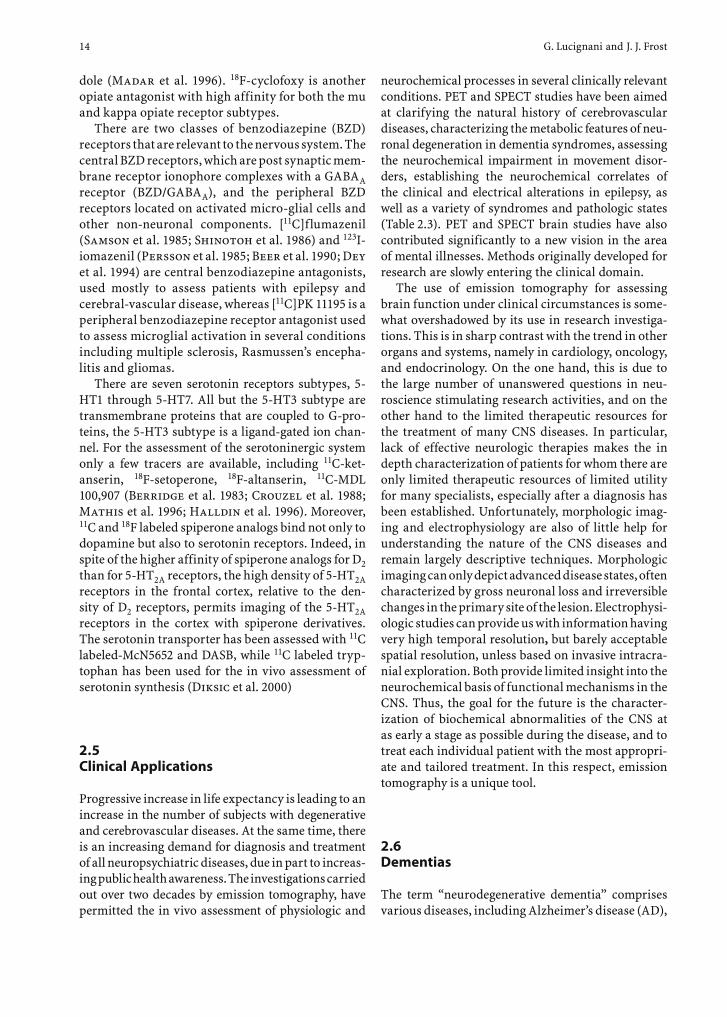
Table 2.2. Major neurotransmitters and receptors
Neurotransmitter Receptors Clinical application
Glutamic acid NMDA,AMPA, kainate, quisqualate EpilepsyMovement disordersIschemia
Gamma-amino-butyric-acid linked to benzodiazepine receptors: GABAA/BZD
GABAA and GABAB Movement disordersMood disorders
Acetylcholine Nicotinic (peripheral) Movement disordersNicotinic (central), some abnormal in AD DementiaMuscarinic (central), five subtypes Epilepsy
Dopamine Five subtypes Movement disordersDrug addictionSchizophrenia
Noradrenaline Five subtypes Vascular toneMovement controlMood control
Serotonin Seven subtypes SleepDepressionFood intakePain
Opioid Mu, delta, kappa Drug addictionPain syndromesEpilepsyEating disorders
For details see: Feldman et al. 1997; Siegel et al. 1999
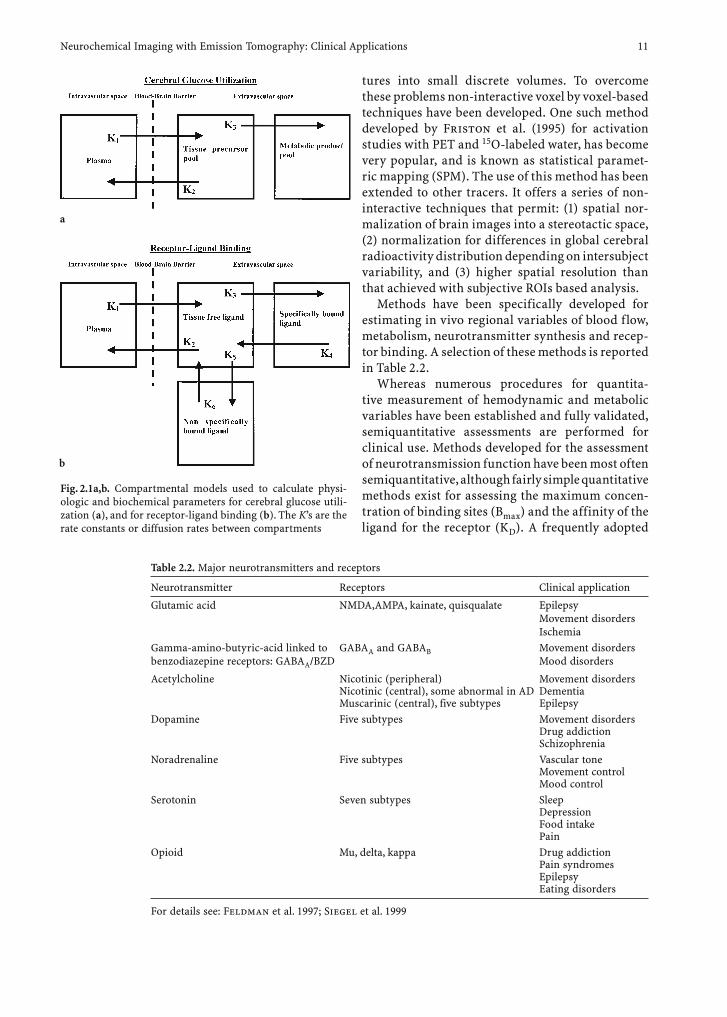
Fig. 2.1a,b. Compartmental models used to calculate physi-ologic and biochemical parameters for cerebral glucose utili-zation (a), and for receptor-ligand binding (b). The K’s are the rate constants or diffusion rates between compartments
a
b

12 G. Lucignani and J. J. Frost
measure of the functional status of brain receptors is based on the assessment of the binding potential (BP), which is equal to the ratio of receptor density (Bmax) to receptor affinity (KD).
Analytical methods have also been developed that allow the assessment of the rate of uptake and storage of neurotransmitter precursors into neu-rons. One such method, which has interesting appli-cations for the analysis of the behavior of any tracer and permits the assessment of volumes of distribu-tion, as well as rate of trapping, has largely been applied (Patlak et al. 1985). However, there is a widespread use of semiquantitative methods based on the assessment of ratios of radioactivity concen-tration in target regions, i.e., known to contain spe-cific receptors and in which there is specific tracer binding, to that of regions devoid of receptors, in which tracer uptake is non-specific. A comprehen-sive review on tracer kinetics has recently been pub-lished by Price (2003)
2.4 Tracers for Brain Imaging
Numerous tracers have been developed for studying the chemical processes in the brain (Mason and Mathis 2003). The availability of radiotracers for the in vivo assessment of biochemical variables, physiological, and pharmacological processes, is a major advantage of PET over SPECT, but the short half-life of the positron emitters makes the presence of a cyclotron mandatory in the proximity of the PET scanner, thus increasing the cost and limiting the diffusion of PET compared to SPECT. Indeed, in spite of the increased availability of PET scanners and cyclotrons, PET is mainly used for oncology and FDG is the only clinical tracer, produced in large amounts with automated industrial procedures. All other tracers used for PET brain scanning to assess the neurotransmitter system are still produced with often laborious semi-automated procedures, on demand, in centers where research is the pri-mary goal. Moreover, their development presents in many cases a real challenge, even more so in view of the limited availability of experts and training programs in this field. Thus, while there are many examples of how molecular imaging has improved our understanding of brain function, examples of its use for diagnosis and treatment monitoring of neu-rologic diseases are less frequent. It is noteworthy that for some neurochemical studies, tracers labeled
with single photon emitting radionuclides may be more suitable as they decay slowly and allow the assessment of tracer kinetics over several hours; this feature is particularly relevant for tracers with high affinity for receptors.
2.4.1 Cerebral Blood Flow and Metabolism Tracers
Cerebral blood flow can be measured both with SPECT or PET by using either diffusible or non-diffusible tracers. To the group of diffusible tracers belongs 133Xe, a gas that decays by single photon emission and employed with SPECT (Kanno and Lassen 1979), as well as 15O labeled water and 15O labeled carbon dioxide (which is converted to 15O-water in vivo), both decaying by positron emis-sion and employed with PET. The use of molecular 15O-oxygen, along with 15O-water permits the assess-ment of oxygen extraction fraction, cerebral blood flow, and oxygen metabolism (Herscovitch et al. 1983; Frackowiak et al. 1980). To the group of the non-diffusible tracers belong the so-called chemical microspheres, i.e., tracers that cross the BBB after venous administration, and which are retained in the brain in proportion to blood flow dependent delivery; chemical microspheres are labeled with 99mTc and employed with SPECT (Leveille et al. 1992). The assessment of cerebral metabolism can be achieved by PET only, as for this purpose glu-cose, or its analogues, and oxygen itself can be used, which cannot be labeled with single photon emitting radionuclides. The measurement of glucose utiliza-tion is performed with 18F-labeled 2-fluoro-2-deoxy-D-glucose (18F-FDG) (Phelps et al. 1979; Reivich et al. 1979), since glucose itself, labeled with 11C, undergoes a rapid metabolic degradation to water and carbon dioxide, which are partially lost during the measurement of the radioactivity concentration. 18F-FDG instead remains trapped as 18F-labeled flu-orodeoxyglucose-6-phosphate, and accumulation is a function of the glucose metabolic rate.
2.4.2 Neurotransmission Function Tracers
The dopaminergic system has been extensively investigated in terms of both presynaptic and post-synaptic processes by means of selective positron emitting radiotracers. The large number of studies performed has also facilitated the development of

Neurochemical Imaging with Emission Tomography: Clinical Applications 13
methods and procedures for studying other neu-rotransmitter systems. 18F-Fluoro-DOPA has been extensively used as a probe of the presynaptic dopa-minergic system, is transported across the BBB and incorporated into the sequence of processes for dopamine synthesis and subsequent conversion of dopamine to homovanillic acid and 3,4-dihydroxy-phenylacetic acid (DOPAC) (Cumming and Gjedde 1998). Although this tracer does not permit the measurement of endogenous dopamine synthesis, turnover, and storage, it has been used as a probe of amino acid decarboxylase activity (the rate limiting enzyme in the synthesis of dopamine) and thus of nigrostriatal neuron density and presynaptic func-tion.
The dopaminergic system has also been studied with tracers binding to the presynaptic dopamine reuptake system (DAT), such as 11C-nomifensine, 18F-GBR 13,119, 11C-cocaine, 11C-CFT, 11C-WIN 35,428, and 11C-FE−CIT. WIN 35,428 (Dannals et al. 1993) and 123I-β−CIT (Neumeyer et al. 1991) are the tracers that are being used currently. The par-ticular interest in DAT is related to the assessment of dopaminergic neuronal loss in Parkinson’s dis-ease and parkinsonian syndromes. The first agent for assessing dopamine reuptake labeled with 99mTc, TRODAT-1, has been synthesized and tested in human subjects (Kung et al. 1997).
The activity of the mitochondrial enzyme mono-amine oxidase B (MAO-B) can be investigated by using 11C-L-deprenyl, a so-called suicide inactivator, since it covalently binds to the MAO-B flavoprotein group, which results in the labeling of the enzyme itself. Following i.v. administration of this tracer, there is significant uptake and retention of radioac-tivity in the striatum and thalamus. This tracer can be used to measure the effect of therapy in patients under treatment with MAO-B inhibitors as well as the rate of turnover of MAO-B (Arnett et al. 1987; Fowler et al. 1987, 1993).
The type-2 vesicular monoamine transporter (VMAT-2) are cytoplasmic proteins of the presyn-aptic nerve terminal for monoamine transport from the cytoplasm into synaptic storage vesicles. Also this transporter has been imaged by using 11C labeled DTBZ (Frey et al. 1996). In the brain, VMAT-2 is expressed exclusively by monoaminer-gic neurons, i.e., those using dopamine, serotonin, norepinephrine, or histamine, yet mainly by dopa-minergic neurons.
Dopamine receptors can be grouped into two major families: one including D1 and D5 receptors, and the other including the D2, D3 and D4 receptors.
PET tracers to measure D2 and D1 receptors have been developed; however, there are currently no specific PET ligands to differentially evaluate D3, D4 and D5 receptors
The first visualization of dopamine receptors in live human subjects with PET was reported by Wagner et al. (1983) using 11C-N-methyl-spiper-one, a D2 receptor antagonist. Subsequently, several other D2-receptor tracers have been synthesized including 11C-raclopride and 18F-fluoro-ethyl-spi-perone (Coenen et al. 1987). For SPECT studies of the D2 receptors l23I-Iodobenzamide has been used (Kung et al. 1988, 1990). The specific D1 ligands SCH 23,390, SCH 39,166 and NNC 112 labeled with 11C have allowed investigation of Dl-receptor subtypes in human subjects with PET (Halldin et al. 1986, 1990, 1998; Abi-Dargham et al. 2000).
The cholinergic system includes two major recep-tor classes, nicotinic and muscarinic. Tracers have been developed for the assessment of cholinergic presynaptic function including acetylcholinester-ase activity, by N-[11C]methylpiperidin-4-yl pro-pionate (Kuhl et al. 1996), and vesicular acetylcho-line transporter, by vesamicol and benzovesamicol labeled with either 11C or 18F or 123I (Kilbourn et al. 1990). Nicotinic receptor function assessment has been pursued with 11C labeled nicotine, however the use of this tracer has been dropped due to high levels of non-specific binding. The limits of nicotine have been overcome by the development of 6-[18F]fluoro-3-(2(S)-azetidinylmethoxy)pyridine (Dolle et al. 1999; Scheffel et al. 2000; Ding et al. 2000).
Muscarinic receptor function assessment has been evaluated with 123I-quinuclinidylbenzilate (QNB) (Eckelman et al. 1984), 11C-scopolamine, 11C-tropanylbenzilate, 11C-N-methyl-piperydil-benzilate (Mulholland et al. 1992, 1995; Koeppe et al. 1994), and recently by an M2-selective agonist [18F]FP-TZTP (Podruchny et al. 2003).
The opiate receptor system is comprised of three major receptor subtypes: mu, delta, and kappa; each subtype is composed of several subclasses. Opiate receptors have been studied with two ligands: 11C-carfentanil, a potent opiate agonist that is highly selective for mu receptors, and 11C-diprenorphine, a partial agonist of the same system but with no speci-ficity for the opiate receptors subtypes: mu, delta, and kappa (Frost et al. 1986, 1990; Jones et al. 1988). This lack of specificity limits the use of diprenor-phine due to its widespread uptake in the cortex, whereas the uptake of carfentanil is more selective to the areas that contain mu receptors. Delta recep-tors can be imaged using and 11C-methyl-naltrin-
14 G. Lucignani and J. J. Frost
dole (Madar et al. 1996). 18F-cyclofoxy is another opiate antagonist with high affinity for both the mu and kappa opiate receptor subtypes.
There are two classes of benzodiazepine (BZD) receptors that are relevant to the nervous system. The central BZD receptors, which are post synaptic mem-brane receptor ionophore complexes with a GABAA receptor (BZD/GABAA), and the peripheral BZD receptors located on activated micro-glial cells and other non-neuronal components. [11C]flumazenil (Samson et al. 1985; Shinotoh et al. 1986) and 123I-iomazenil (Persson et al. 1985; Beer et al. 1990; Dey et al. 1994) are central benzodiazepine antagonists, used mostly to assess patients with epilepsy and cerebral-vascular disease, whereas [11C]PK 11195 is a peripheral benzodiazepine receptor antagonist used to assess microglial activation in several conditions including multiple sclerosis, Rasmussen’s encepha-litis and gliomas.
There are seven serotonin receptors subtypes, 5-HT1 through 5-HT7. All but the 5-HT3 subtype are transmembrane proteins that are coupled to G-pro-teins, the 5-HT3 subtype is a ligand-gated ion chan-nel. For the assessment of the serotoninergic system only a few tracers are available, including 11C-ket-anserin, 18F-setoperone, 18F-altanserin, 11C-MDL 100,907 (Berridge et al. 1983; Crouzel et al. 1988; Mathis et al. 1996; Halldin et al. 1996). Moreover, 11C and 18F labeled spiperone analogs bind not only to dopamine but also to serotonin receptors. Indeed, in spite of the higher affinity of spiperone analogs for D2 than for 5-HT2A receptors, the high density of 5-HT2A receptors in the frontal cortex, relative to the den-sity of D2 receptors, permits imaging of the 5-HT2A receptors in the cortex with spiperone derivatives. The serotonin transporter has been assessed with 11C labeled-McN5652 and DASB, while 11C labeled tryp-tophan has been used for the in vivo assessment of serotonin synthesis (Diksic et al. 2000)
2.5 Clinical Applications
Progressive increase in life expectancy is leading to an increase in the number of subjects with degenerative and cerebrovascular diseases. At the same time, there is an increasing demand for diagnosis and treatment of all neuropsychiatric diseases, due in part to increas-ing public health awareness. The investigations carried out over two decades by emission tomography, have permitted the in vivo assessment of physiologic and
neurochemical processes in several clinically relevant conditions. PET and SPECT studies have been aimed at clarifying the natural history of cerebrovascular diseases, characterizing the metabolic features of neu-ronal degeneration in dementia syndromes, assessing the neurochemical impairment in movement disor-ders, establishing the neurochemical correlates of the clinical and electrical alterations in epilepsy, as well as a variety of syndromes and pathologic states (Table 2.3). PET and SPECT brain studies have also contributed significantly to a new vision in the area of mental illnesses. Methods originally developed for research are slowly entering the clinical domain.
The use of emission tomography for assessing brain function under clinical circumstances is some-what overshadowed by its use in research investiga-tions. This is in sharp contrast with the trend in other organs and systems, namely in cardiology, oncology, and endocrinology. On the one hand, this is due to the large number of unanswered questions in neu-roscience stimulating research activities, and on the other hand to the limited therapeutic resources for the treatment of many CNS diseases. In particular, lack of effective neurologic therapies makes the in depth characterization of patients for whom there are only limited therapeutic resources of limited utility for many specialists, especially after a diagnosis has been established. Unfortunately, morphologic imag-ing and electrophysiology are also of little help for understanding the nature of the CNS diseases and remain largely descriptive techniques. Morphologic imaging can only depict advanced disease states, often characterized by gross neuronal loss and irreversible changes in the primary site of the lesion. Electrophysi-ologic studies can provide us with information having very high temporal resolution, but barely acceptable spatial resolution, unless based on invasive intracra-nial exploration. Both provide limited insight into the neurochemical basis of functional mechanisms in the CNS. Thus, the goal for the future is the character-ization of biochemical abnormalities of the CNS at as early a stage as possible during the disease, and to treat each individual patient with the most appropri-ate and tailored treatment. In this respect, emission tomography is a unique tool.
2.6 Dementias
The term “neurodegenerative dementia” comprises various diseases, including Alzheimer’s disease (AD),

Neurochemical Imaging with Emission Tomography: Clinical Applications 15
Pick’s disease (frontotemporal lobar atrophy), diffuse – or cortical – Lewy body disease (DLBD), and mul-tiple system atrophies. The disease with the highest prevalence is AD. Degenerative dementias are clas-sified on the basis of postmortem neuropathologic assessment. Thus, the in vivo diagnosis of AD by clinical and instrumental assessment is only a prob-abilistic statement based on evidence of progressive cognitive decline, and lack of an alternative diagno-sis of intoxications, systemic metabolic disturbances, infection, cerebrovascular ischemic disease, cerebral mass lesions, and normal pressure hydrocephalus. Several imaging strategies have been applied to the study of dementias. From the perspective of clinical diagnosis, glucose metabolism and blood flow are key variables. The assessment of other neurochemi-cal variables is crucial for testing pathophysiological hypotheses of the etiology of AD and to assess the efficacy of new drugs as they are developed and intro-duced into clinical practice (Frey et al. 1998).
2.6.1 Cerebral Blood Flow and Metabolism in Patients with Degenerative Dementias
Glucose metabolism imaging with 18F-FDG is the most sensitive and specific imaging modality avail-able today for the diagnosis of AD. Automatic analysis of PET images yields a sensitivity as high as 95%–97% and a specificity of 100%, in discriminating patients with probable AD from normal subjects (Minoshima et al. 1995). Probable AD patients have reduced glu-cose utilization in the posterior parietal and temporal lobe association cortex and posterior cingulate cortex (Benson et al. 1983; Friedland et al. 1983; Cutler et al. 1985). In moderate-to-severely affected indi-viduals, the reductions of metabolism are bilateral, yet there is often an asymmetry of the severity or the extent of hypometabolism. Patients with more advanced clinical symptoms have reduced metabo-lism in the dorsal prefrontal association cortex as
Table 2.3. Synopsis of clinically relevant tracers
Physiologic variable Method Tracers
Blood flow (CBF) PET 15O-carbon dioxide; 15O-water; 11C-butanol; 18F-fluoro-methyl-fluoride; 13N-ammonia
SPECT 133Xe; 99mTc-hydroxy-methyl-propyleneamine oxime (HMPAO);99mTc-ethyl-cysteinate-dimer (ECD)
Oxygen extraction fraction (OEF) and metabolism (CMRO2)
PET Molecular oxygen (15O2) (CMRO2 is calculated by multiplying CBF by OEF)
Glucose metabolism PET 18F-fluoro-deoxy-glucoseBlood volume PET 15O-carbon monoxide-labeled RBC
SPECT 99mTc-RBCProtein synthesis and amino acid transport
PET 11C-methionine, 18F-fluoro-L-tyrosine
Tumor viability and proliferation PET 18F-fluoro-deoxy-glucose; 11C-thymidine; 11C-methionine; 18F-fluoro-L-tyrosine
SPECT 201Thallium; 99mTc-methoxy-isobutyl-isonitrile (MIBI); 123I-methyl-tyrosineGamma-amino-butyric-acid (GABA) PET 11C-flumazenil; 18F-fluoro-ethyl-flumazenil
SPECT 123I-iomazenilAcetylcholine PET Acetylcholine-esterase activity: 11C-methyl-phenyl-piperidine
Nicotinic receptors: 11C-nicotine Muscarinic receptors: 18F-fluoro-dexetimide; 11C-N-methyl-piperidil-ben-zilate; 11C-Tropanyl benzilate; 11C-scopolamine
SPECT Acetylcholine transport: 123I-iodo-benzovesamicol Muscarinic receptors: 123I-iododexetimide; 123I-QNB;
Dopamine PET MAO-B: 11C-deprenylPresynaptic function: 18F-fluoro-L-DOPA; 18F-fluoro-L-m-tyrosineDopamine reuptake: 11C-nomifensine; 11C-cocaine; 11C-WIN 35,428D2-receptors: 11C-raclopride; 18F-fluoro-ethyl-spiperone; 18F-N-methylspiper-one; 18F-fluoro-alkyl-benzamidesD1-receptors: 11C-SCH 23,390
SPECT Dopamine reuptake: 123I-beta-CITD2-receptors: 123I-Iodobenzamide (IBZM)
Noradrenaline 18F-Fluoro-norepinephrineSerotonin 5HT reuptake: 11C-McN5652
5HT receptors: 18F-fluoro-ethyl-ketanserin; 18F-setoperone; 18F-altanserinOpioid PET 11C carfentanil (mu selective); 11C methylnaltrindole (delta selective); 11C
diprenorphine (mu, delta, and kappa selective); 18F cyclofoxy (mu and delta selective)
16 G. Lucignani and J. J. Frost
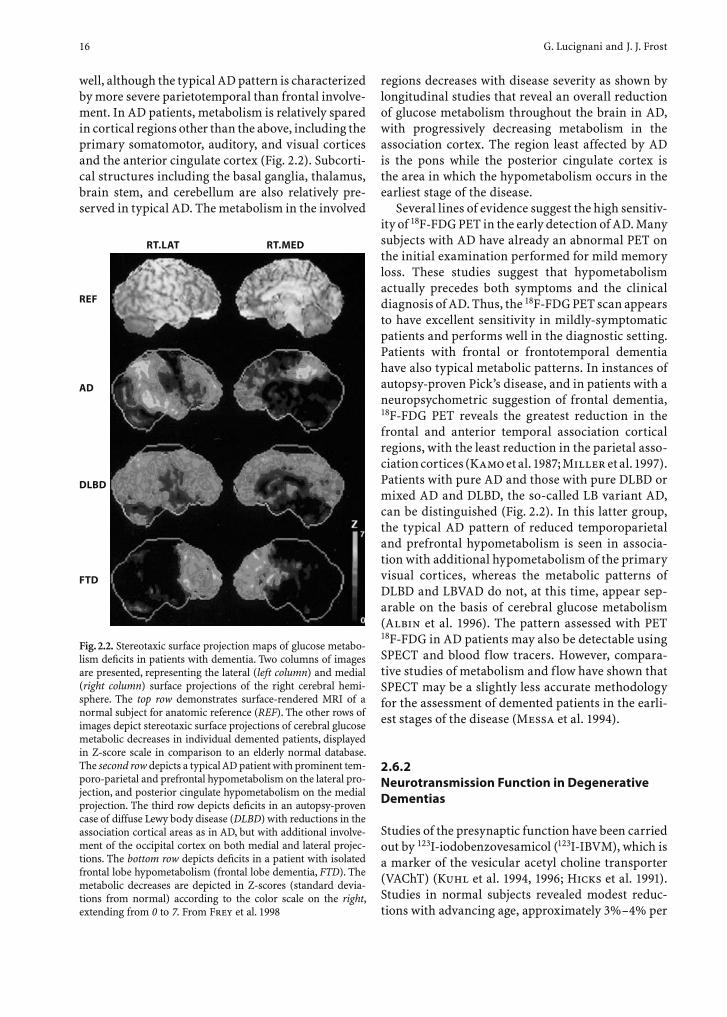
well, although the typical AD pattern is characterized by more severe parietotemporal than frontal involve-ment. In AD patients, metabolism is relatively spared in cortical regions other than the above, including the primary somatomotor, auditory, and visual cortices and the anterior cingulate cortex (Fig. 2.2). Subcorti-cal structures including the basal ganglia, thalamus, brain stem, and cerebellum are also relatively pre-served in typical AD. The metabolism in the involved
regions decreases with disease severity as shown by longitudinal studies that reveal an overall reduction of glucose metabolism throughout the brain in AD, with progressively decreasing metabolism in the association cortex. The region least affected by AD is the pons while the posterior cingulate cortex is the area in which the hypometabolism occurs in the earliest stage of the disease.
Several lines of evidence suggest the high sensitiv-ity of 18F-FDG PET in the early detection of AD. Many subjects with AD have already an abnormal PET on the initial examination performed for mild memory loss. These studies suggest that hypometabolism actually precedes both symptoms and the clinical diagnosis of AD. Thus, the 18F-FDG PET scan appears to have excellent sensitivity in mildly-symptomatic patients and performs well in the diagnostic setting. Patients with frontal or frontotemporal dementia have also typical metabolic patterns. In instances of autopsy-proven Pick’s disease, and in patients with a neuropsychometric suggestion of frontal dementia, 18F-FDG PET reveals the greatest reduction in the frontal and anterior temporal association cortical regions, with the least reduction in the parietal asso-ciation cortices (Kamo et al. 1987; Miller et al. 1997). Patients with pure AD and those with pure DLBD or mixed AD and DLBD, the so-called LB variant AD, can be distinguished (Fig. 2.2). In this latter group, the typical AD pattern of reduced temporoparietal and prefrontal hypometabolism is seen in associa-tion with additional hypometabolism of the primary visual cortices, whereas the metabolic patterns of DLBD and LBVAD do not, at this time, appear sep-arable on the basis of cerebral glucose metabolism (Albin et al. 1996). The pattern assessed with PET 18F-FDG in AD patients may also be detectable using SPECT and blood flow tracers. However, compara-tive studies of metabolism and flow have shown that SPECT may be a slightly less accurate methodology for the assessment of demented patients in the earli-est stages of the disease (Messa et al. 1994).
2.6.2 Neurotransmission Function in Degenerative Dementias
Studies of the presynaptic function have been carried out by 123I-iodobenzovesamicol (123I-IBVM), which is a marker of the vesicular acetyl choline transporter (VAChT) (Kuhl et al. 1994, 1996; Hicks et al. 1991). Studies in normal subjects revealed modest reduc-tions with advancing age, approximately 3%–4% per
Fig. 2.2. Stereotaxic surface projection maps of glucose metabo-lism defi cits in patients with dementia. Two columns of images are presented, representing the lateral (left column) and medial (right column) surface projections of the right cerebral hemi-sphere. The top row demonstrates surface-rendered MRI of a normal subject for anatomic reference (REF). The other rows of images depict stereotaxic surface projections of cerebral glucose metabolic decreases in individual demented patients, displayed in Z-score scale in comparison to an elderly normal database. The second row depicts a typical AD patient with prominent tem-poro-parietal and prefrontal hypometabolism on the lateral pro-jection, and posterior cingulate hypometabolism on the medial projection. The third row depicts defi cits in an autopsy-proven case of diffuse Lewy body disease (DLBD) with reductions in the association cortical areas as in AD, but with additional involve-ment of the occipital cortex on both medial and lateral projec-tions. The bottom row depicts defi cits in a patient with isolated frontal lobe hypometabolism (frontal lobe dementia, FTD). The metabolic decreases are depicted in Z-scores (standard devia-tions from normal) according to the color scale on the right, extending from 0 to 7. From Frey et al. 1998
RT.LAT RT.MED
REF
AD
DLBD
FTD
Neurochemical Imaging with Emission Tomography: Clinical Applications 17
decade. Application of the 123I-IBVM SPECT method for studying AD revealed further losses of choliner-gic cortical innervation. The average reductions are distinctly greater in AD patients with symptom onset before age 65 (30%) than in those with later age at onset (15%). These neocortical reductions were, how-ever, less than the expected 50%–80% losses reported for choline acetyl transferase (CAT) enzyme activity in autopsy series. While CAT activity was reduced over 50% in the neocortex of AD, a parallel 15% reduc-tion in VAChT was not statistically significant. Thus, there is the possibility that these two presynaptic cho-linergic markers may be differentially regulated or differentially lost in AD. There may be upregulation of VAChT expression to compensate for cholinergic terminal losses, or alternatively, CAT expression may be reduced within otherwise intact presynaptic nerve terminals. Further studies are underway to explore each of these hypotheses. 11C-N-methyl- piperidinil propionate (PMP) is a substrate for hydrolysis by acetyl choline esterase (AChE) (Kilbourn et al. 1996), thus, PET measurements of PMP hydrolysis, accomplished by measuring regional radiolabeled product retention in the brain, provide an index of AChE activity. Preliminary studies of patients with probable AD reveal approximately 20% reductions throughout the cerebral cortex (Namba et al. 1994; Irie et al. 1996; Iyo et al. 1997; Kuhl et al. 1999).
Postsynaptic cholinergic studies have also been carried out. Studies of muscarinic cholinergic recep-tors with 11C-tropanyl benzilate (TRB) (Koeppe et al. 1994; Lee et al. 1996) and 11C-N-methylpiperidyl ben-zilate (NMPB) (Mulholland et al. 1995; Zubieta et al. 1994) indicate minor losses of cholinergic receptors function with advancing age. In probable AD patients there is no evidence of significant neocortical losses of muscarinic receptors, whereas significant ligand delivery reduction is found in the association cortical areas, paralleling reductions in glucose. PET studies of the central benzodiazepine binding site on the GABAA receptor with the antagonist ligand 11C-flumazenil are amenable for the assessment of neuronal viability. In patients with probable AD, a modest reduction of benzodiazepine binding sites has been observed in the association cortex only in the most clinically-advanced cases, thus indicating the presence of viable neurons in the early phases of the disease. As this reduction is of a lesser degree than glucose hypometabolism, it is conceivable that the reductions in glucose metabolism seen in the early stages of AD are not just a reflection of synapse and neuron losses, but a correlate of a syn-aptic dysfunction that precedes the structural losses (Meyer et al. 1995).
The development of acetylcholinesterase inhibi-tors for symptomatic treatment of AD is being pur-sued by several pharmaceutical companies. Devel-opment of PET imaging of the cholinergic system activity parallels this search to comply in due time with the need to assess the appropriateness of expen-sive treatments in the aging world population.
2.6.3 Amyloid and Microglial Activation Imaging in Alzheimer Disease
One of the major limitations in the diagnosis of AD is the lack of criteria that can exclude other illness that share with AD the same cognitive deterioration. Thus, AD can only be diagnosed at autopsy, when neuritic plaques and neurofibrillary tangles can be detected in the brain. To overcome this difficulty and to diagnose AD as early as possible, several attempts have been made to develop radiotracers that bind to the amyloid deposits in the brain; [18F]FDDNP ( 2-(1-(6-[(2-[18F]fluoro-ethyl)(methyl)amino]-2-naphthyl)ethylidene)malononitrile) is one such tracer and binds to amyloid senile plaques and neurofibril-lary tangles (Shoghi-Jadid et al. 2002). However, this tracer presents some limitations, including low specificity, and in an effort to improve specific-to-non-specific amyloid binding ratios in vivo, a neu-tral 11C-labeled derivative of thioflavin-T, 6-OH-BTA-1 or PIB, was developed. Imaging of amyloid plaques is still in the early stage, however the avail-able results appear to be very promising.
Recently Cagnin et al. (2001) have reported the in-vivo detection of increased 11C-PK11195 binding in AD of various degrees and suggested that micro-glial activation is an early event in the pathogenesis of the disease. Early detection of this process may ease the diagnosis of AD and allow an early neuro-protective treatment.
2.7 Movement Disorders
The balance between cholinergic and dopaminergic neuronal activity in the basal ganglia is required for normal motor function. Damage to dopaminergic nigrostriatal neurons is found in various forms of parkinsonism. In patients with Parkinson’s Disease (PD) clinical symptoms occur when dopaminergic nigral neurons have undergone a loss of 40%–50%.
18 G. Lucignani and J. J. Frost
The neurons projecting to the putamen have been estimated to decline most, as compared to those innervating the caudate and those projecting to the nucleus accumbens. A reduction in dopamine metab-olites 3,4-dihydroxyphenylacetic acid (DOPAC) and homovanillic acid (HVA), and the number of dopa-mine reuptake sites is also observed. The reduction in dopamine content occurs also in the mesocorti-cal and mesolimbic projections of the ventral teg-mental area (VTA) possibly as a consequence of the destruction of dopaminergic neurons in the VTA. Other neurotransmitter systems have been shown to be damaged in parkinsonism, including noradrener-gic, cholinergic, opioidergic and serotonergic circuits (Dubois et al. 1983, 1987; Hornykiewicz and Kish 1984, 1986; Uhl et al. 1985; Baronti et al. 1991). Such alterations may explain the occurrence of depression, dementia and other symptoms in patients with PD.
2.7.1 Cerebral Blood Flow and Metabolism in Movement Disorders
In the early studies various patterns of flow and metabolism have been observed in movement disor-ders, related to the duration and degree of the disease. In the early phase of hemiparkinsonism an increased metabolism was found in the putamen and globus pallidus (Wolfson et al. 1985; Miletich et al. 1988), along with a decrease of metabolism in the frontal cortex, contralateral to the affected limbs (Perlmut-ter and Raichle 1985; Wolfson et al. 1985). In bilat-erally affected patients the cortical alteration is more widespread; however, this effect could be due to con-current degenerative processes (Kuhl et al. 1984). The significance of the cortical hypometabolism remains unclear. All studies have shown inconsistent and minor changes that have lead to abandon the use of 18F-FDG and flow tracers to measure functional activ-ity in the basal ganglia and cortex of patients with movement disorders. Overall, the assessment of flow and metabolism does not appear a useful approach in studying patients with movement disorders.
2.7.2 Neurotransmitter Function in Movement Disorders
The assessment of the dopaminergic presynaptic func-tion has been pursued by two strategies: one aimed at assessing the incorporation of a metabolic substrate
of dopamine synthesis in the nigrostriatal neuronal terminals, and another aimed at assessing the density of the presynaptic dopamine reuptake sites.
For the first goal the most used tracer is 18F-6-fluoro-DOPA (18F-DOPA) which is metabolized to 18F-fluoro-dopamine by amino-acid decarboxyl-ase (AADC) and subsequently stored in vesicles in the presynaptic nerve endings. Following 18F-DOPA administration in patients with early PD and hemiparkinsonism, a reduced accumulation of tracer is observed, reflecting reduced-AADC-activity in the putamen contralateral to the affected limbs, with relative sparing of the caudate (Nah-mias et al. 1985). Significant correlations between 18F-DOPA uptake and motor symptoms have been reported (Leenders et al. 1988; Brooks et al. 1990a; Martin et al. 1988, 1989). These results are sus-tained by a lack of AADC activity due to a selective destruction of the ventrolateral nigrostriatal neu-rons projecting to the putamen in PD. However, the rate of 18F-DOPA uptake is the expression of both the neuronal density as well as of the AADC activity. Whereas 18F-DOPA has shown potential for the early and preclinical detection of PD, it must be noted that 18F-DOPA uptake in the basal ganglia is not propor-tional to the degree of degeneration of the ventrolat-eral substantia nigra, due to adaptational increases in AADC function in the surviving cells. This is made evident by the observation that at the onset of symptoms, 18F-DOPA uptake in the affected puta-men is reduced by approximately 35%, with no sig-nificant reductions detected in the caudate. On the other hand, at symptom onset, putamen dopamine content is already decreased by 80% and at least 50% of pigmented nigra cells are lost. From these observations it can be concluded that the activity of DOPA decarboxylase, as assessed with 18F-DOPA is a sensitive but inaccurate measure of dopaminergic neuronal loss. In fully symptomatic patients, reduc-tions of 18F-DOPA uptake range from 40%–60% in the posterior putamen, and 15%–40% in caudate and anterior putamen, respectively (Otsuka et al. 1991; Brooks et al. 1990b).
Functional imaging of the presynaptic trans-porter, aimed at assessing neuronal density by meth-ods independent of dopamine synthesis, offers a more accurate alternative to 18F-DOPA studies. This goal has been achieved by several cocaine analogues that bind to the presynaptic dopamine transporter (DAT) sites (Scheffel et al. 1992; Dannals et al. 1993; Lever et al. 1996). Among various tracers, 11C-WIN 35,428 seems to be the most sensitive tracer for DAT imaging in PD, and PET studies have revealed

Neurochemical Imaging with Emission Tomography: Clinical Applications 19
markedly reduced DAT levels in early PD (Frost et al. 1993). In patients with stage-2 PD, specific binding of 11C-WIN 35,428 in the posterior puta-men is reduced more than in the anterior putamen and the caudate nucleus (Fig. 2.3). SPECT imaging with 123I-β-CIT also shows severe loss of striatal DA transporters in idiopathic PD compared to healthy human subjects, with markedly abnormal striatal uptake, more pronounced in the putamen than in the caudate nucleus. 123I-β CIT uptake is related to clinical findings including degree of akinesia, rigid-ity, axial symptoms and activities of daily living. The striatal uptake is reduced by 35% in Hoehn-Yahr stage 1 to over 72% in stage 5 and is correlated to dis-ease severity. In general, abnormalities of dopamine transporter binding are more pronounced than 18F-DOPA abnormalities (Brucke et al. 1993; Seibyl et al. 1994; Marek et al. 1996). The assessment of pre-synaptic function may permit both the early detec-tion of PD and a differential diagnosis between PD and progressive supranuclear palsy (PSP) in a single study since PSP is associated with a more uniform loss of DAT compared to PD which shows more spe-cific loss in the posterior putamen (Fig. 2.2) (Ilgin et al. 1995). This goal can conveniently be achieved with SPECT tracers that selectively bind to the pre-synaptic dopamine transporters, such as 123I-β-CIT (Messa et al. 1998). However, in early PD also DAT may not be directly related to the extent of neuro-nal loss. In fact, DAT may be downregulated as part mechanisms compensating for neuronal loss and reduced neurotransmitter availability.
The assessment of VMAT-2 may be a more reli-able indicator of nigrostriatal nerve terminal den-
sity with minimal or no influence of regulatory changes. VMAT-2 density is in fact linearly related to the integrity of substantia nigra dopamine neu-rons and not subject to compensatory regulation as those apparently affecting the expression of DAT and the synthesis of DOPA (Lee et al. 2000). VMAT-2 specific binding using DTBZ and PET are greater in patients who have higher Hoehn and Yahr sever-ity scores.
The role of methods for the assessment of presyn-aptic function is not diagnostic, except for patients who do not respond to dopaminergic treatment, or for experimental treatment definition and monitor-ing, including stem cell transplantation and electri-cal deep brain stimulation.
Ligands available for studying D2 receptors with PET are 11C-raclopride and spiperone derivatives labeled with 11C and 18F. D2 receptors can also be assessed with SPECT and 123I-IBZM (Giobbe et al. 1993; Nadeau et al. 1995). 123I-IBZM SPECT and 11C-raclopride PET findings in patients with PD are significantly correlated (Schwarz et al. 1994). In patients not treated with DOPA, either small increases or no changes in basal ganglia D2 receptor density are observed (Rinne et al. 1990). In patients treated with L-DOPA, D2 receptor density is reduced or unchanged (Hagglund et al. 1987). Longitudi-nal studies have shown that 11C-raclopride uptake is increased in the putamen in the early stage of PD, compared to controls, whereas after 3–5 years 11C-raclopride binding is significantly reduced in the putamen and caudate nucleus in these patients com-pared with baseline (Brooks et al. 1992a; Antonini et al. 1997). These results indicate long-term down-
Fig. 2.3. Images of 11C-WIN 35,428 binding at four different levels through-out the striatum of a healthy control, a stage-2 PD and a PSP patient. The images are obtained after averaging the data acquired from 35–82 min follow-ing administration of the tracer and are normalized for the administered activ-ity. Higher binding in the basal ganglia is seen in the healthy age-matched con-trol subject compared to patients diag-nosed with PD and PSP. In PD, reduced 11C-WIN 35,428 binding is seen pre-dominantly in the posterior putamen while there is more uniform reduction throughout the entire striatum in PSP

20 G. Lucignani and J. J. Frost
regulation of striatal dopamine D2 receptor bind-ing in PD. Besides idiopathic Parkinson’s disease there are other distinct diseases, such as progres-sive supranuclear palsy (PSP) and multiple system atrophy (MSA) may start with tremor, akinesia or rigidity. As the diagnosis may be difficult in some cases, hampering the adoption of a proper therapeu-tic strategy, tools for the early differential diagnosis of relevant and of clinical interest. PSP and MSA are characterized by a decrease of striatal D2 dopamine receptor activity, as demonstrated by 123I-IBZM uptake, compared to control subjects (van Royen et al. 1993). D2 receptor density is less markedly reduced in the basal ganglia of patients with PSP, with frequent overlap with controls. The decrease in D2 dopamine receptor activity in the early phase of PSP and MSA, contrary to the initial phases of PD, allows us to differentiate between idiopathic PD and parkinsonian syndromes (Buck et al. 1995). The dif-ferential diagnosis between essential tremor (ET) and PD is also crucial to implement an appropriate therapeutic strategy. This is a relevant issue as up to 1/3 of the patients presenting with tremor will even-tually develop PD (Geraghty et al. 1985). Thus, the demonstration of reduced dopaminergic marker binding in the putamen of individual patients pre-senting with isolated postural tremor may provide the diagnosis and a targeted therapy. Familial essen-tial tremor is characterized by putamen and caudate 18F-DOPA uptake within the normal range, whereas 18F-DOPA uptake in the basal ganglia appears reduced in patients with essential tremor that even-tually develop typical PD (Brooks et al. 1992b).
The dopaminergic function is impaired in sev-eral syndromes including Huntington’s chorea, tics, essential tremor, dystonia. The assessment of dopa-minergic function in these diseases is of interest for research, however it is not of significant clini-cal relevance as observations are rather episodic. A detailed analysis of the use of functional imaging techniques for the assessment in the dopaminergic system has recently been published by Bohnen and Frey (2003).
2.8 Cerebrovascular Diseases
Patients with cerebrovascular disease (CVD) are conventionally studied after the onset of symptoms, by morphologic imaging techniques, such as CT and MRI. Morphologic imaging, although crucial for
distinguishing between ischemia and hemorrhage, is not sufficient for the complete assessment of these patients. In particular, within the first 6 h after the onset of symptoms, CT and MRI T2 sequences may be normal, as only MRI diffusion techniques (avail-able only at a few sites) can indeed show the signs of early ischemia. Therefore, assessment of cerebral hemodynamics with emission tomography can be crucial for patient management in cases of transient ischemia and cerebral infarction, and for monitor-ing cerebrovascular reserve and reperfusion. The same methods can be used in patients with cerebral or subarachnoid hemorrhage. Local cerebral blood flow can conveniently be assessed with SPECT, while other key variables, such as glucose utiliza-tion, blood volume, oxygen extraction and oxygen metabolism can be assessed with PET. Although PET has permitted a detailed description of the natural history of CVD from a hemodynamic and metabolic standpoint, it is not easily amenable to individual patient assessment and management, due to the complexity of such studies. We will present a brief summary of the pathophysiology of stroke, with emphasis on CVD patient evaluation in clini-cal practice by SPECT with perfusion and viability tracers.
2.8.1 Cerebral Blood Flow and Metabolism in CVD Patients
Perfusion is determined by hemodynamic vari-ables, including vessel patency, arterial blood pres-sure, cardiac output, as well as functional activity, i.e., the tissue metabolic demand. Thus, blood flow measurements represent the result of the balance between these two concurrent variables, i.e., deliv-ery and demand.
With PET it has been shown that the regional cerebral metabolic rate of oxygen (rCMRO2) is main-tained by continuous oxygen delivery, adjusted to the metabolic demand by variations of regional blood flow (rCBF), regional oxygen extraction (rOER), and regional blood volume (rCBV). Reductions of per-fusion pressure can be compensated by increases in rOER and rCBV. These compensatory mechanisms may leave the patient asymptomatic. Further reduc-tion of perfusion pressure causes cerebral infarction (Frackowiak et al. 1980). The acute phase is fol-lowed by reperfusion and 1–3 weeks after the stroke by a marked increase of rCBF in the infarct area (Lassen 1966) without increase in rCMRO2 (Wise

Neurochemical Imaging with Emission Tomography: Clinical Applications 21
et al. 1983). Such changes in rCBF, uncoupled to the metabolic demand, are attributed to loss of vascular autoregulation mechanisms, capillary hyperplasia and tissue reperfusion and has been termed “luxury perfusion” by Lassen (1966). The assessment of per-fusion in the postischemic phase may be relevant for prognostic evaluation as reperfusion within one week of stroke is suggestive of neurologic recov-ery, whereas delayed reperfusion, beyond 1 week is indicative of poor outcome (Jorgensen et al. 1994).
Another phenomenon that is observed in stroke patients, in the subacute and chronic phase, is the presence of reduced perfusion and metabolism in areas distant from the site of ischemia. Such reduc-tion in neuronal function is attributed to deafferen-tation and is termed diaschisis. This phenomenon has been the object of several PET studies (Baron et al. 1981; Lenzi et al. 1982; Serrati et al. 1994). With respect to the location of the infarct region, the areas of diaschisis may be localized in the cerebellum con-tralateral and in the thalamus ipsilateral to a corti-cal lesion, in the cortex ipsilateral to a subcortical lesion and in the homotopic cortex contralateral to a cortical lesion.
With SPECT, one can study perfusion and assess the local hemodynamics in the ischemic territo-ries, and the degree of focal neuronal dysfunction due to deafferentation and diaschisis in areas dis-tant from the ischemic zone. In transient ischemic attacks (TIA), i.e., reversible episodes of temporary focal neuronal dysfunction caused by a transient cerebral hypoperfusion, SPECT perfusion studies within hours of the event demonstrate a persistent perfusion reduction, which in some cases may last for up to several days following the clinical recovery. This condition, i.e., persisting hypoperfusion with normal CT and complete clinical recovery termed “incomplete infarction”, may be due to reduced vas-cular reserve, i.e., the capacity of the cerebral circu-lation to comply to increases in metabolic demand with vasodilatation. When this occurs, vascular reserve, an important predictor of stroke, can be measured in individual patients by assessing perfu-sion before and after pharmacologic challenge. Acet-azolamide, 5% CO2, or adenosine administration cause vasodilatation and increase blood volume and perfusion only in areas supplied by normal vessels (Vorstrup et al. 1986; Choksey et al. 1989). Lack of an increase of perfusion after challenge indicates a condition termed misery perfusion and is predic-tive of high risk of cerebral infarction. An alterna-tive to pharmacologic challenge is the assessment of the rCBF/rCBV ratio. Due to the rapid modifications
of the two variables they should be measured con-currently by using two tracers labeled with different radionuclides, i.e., either 133Xe or 123I-iodo-amphet-amine for the assessment of rCBF and 99mTc-RBC for the assessment of rCBV (Sabatini et al. 1991).
The flow pattern at the time of cerebral infarc-tion and thereafter is characterized by a high degree of spatial and temporal heterogeneity due to the imbalance of hemodynamic status and functional demand. In the acute phase of a stroke reduced uptake of the perfusion tracer is seen in an area cor-responding to a vascular territory. The CT lesion that eventually develops is usually smaller than the area of the initial hypoperfusion, and at the same time areas of diaschisis are identifiable in cerebral and cerebellar territories. In the subacute phase of infarction, SPECT and CT studies show consistent volumes of ischemic tissue. As shown by SPECT, the core of the lesion is characterized by more severe tissue hypoperfusion than its periphery. Moreover, areas of hypoperfusion due to diaschisis can be observed in areas that are morphologically normal. The area of hypoperfusion surrounding the core lesion may show a response to the acetazolamide test and may reveal luxury perfusion. The chronic phase is characterized by an area of absent perfusion in the infarcted territory.
The clinical applications in cerebral ischemia are limited to SPECT both for diagnosis and prognosis due to the logistic difficulties. The use of SPECT for the early diagnosis of complete ischemic stroke is currently not considered necessary, in view of the fact that there is no substantial difference in the therapeutic approach, even though SPECT may pro-vide information on the severity of hypoperfusion prior to the occurrence of morphologic alterations (Fieschi et al. 1989). On the other hand, the assess-ment of perfusion with SPECT is the only procedure that shows circulatory derangements underlying the occurrence of completely reversible symptoms in patients with TIA. The assessment of TIA by using a pharmacologic challenge, can provide useful infor-mation prior to EC-IC bypass surgery (Vorstrup et al. 1986).
As for the prognostic use of SPECT in stroke patients, it has been shown that the greater the per-fusion deficit, the worse the outcome. This seems to hold particularly when the assessment is performed within 6 h of the onset of symptoms, but also up to 24 h post onset of symptoms (Giubilei et al. 1990; Limburg et al. 1991). The occurrence of diaschisis has been related to outcome, as permanent diaschi-sis 15–56 days after stroke is correlated with poor

22 G. Lucignani and J. J. Frost
outcome (Serrati et al. 1994). Although some hypotheses have been raised about the possibility of using this approach to select patients for thromboly-sis with recombinant tissue plasminogen activator in acute stroke, many perplexities still remain and prospective studies are needed (Alexandrov et al. 1997).
Another frequent application of SPECT is the assessment of vasospasm in subarachnoid hemor-rhage (SAH), an event that occurs 4–12 days after a SAH. SPECT can detect early the occurrence of isch-emia, the worst complication of SAH in a non-inva-sive and reproducible manner (Davis et al. 1990; Soucy et al. 1990).
2.8.2 Imaging of Neuronal Viability by Assessment of Central Benzodiazepine Receptors
One limitation of SPECT perfusion studies is the inability to distinguish whether hypoperfusion is due to ischemia or to diaschisis, or to distinguish between glial and neuronal damage. The assess-ment of neuron-specific damage in CVD has become possible using 11C-flumazenil and 123I-iomazenil, two selective high affinity antagonists of the BZD/GABAA receptors. Biousse et al. (1993) have demon-strated reduced glucose metabolism with preserved distribution volume of flumazenil as a result of dias-chisis, laying the groundwork for benzodiazepine GABAA (BZD/GABAA) receptor studies in ischemia. In stroke patients, BZD/GABAA receptor imaging with 123I-iomazenil and SPECT has been pursued. Hatazawa et al. (1995) have studied the relation-ship between iomazenil uptake, CBF, CMRO2, morphologic and clinical findings (Fig. 2.4); they reported a decrease in iomazenil uptake beyond
the CT hypodense area. This finding is suggestive of either a CT-negative ischemic damage in the area surrounding a complete infarction, or an inhibition of iomazenil binding due to the release of endog-enous substances specifically binding to BZD recep-tors following ischemia. Perfusion reductions with a normal 123I-iomazenil distribution indicate dias-chisis, i.e., abnormalities in areas distant from the stroke region, due to deafferentation.
2.9 Epilepsy
Epilepsy is a heterogeneous group of neurological disorders characterized by recurrent seizures. Sei-zures may manifest as focal or generalized motor jerks, sensory or visual phenomena or more complex alterations in behavior, awareness and conscious-ness, and are influenced by the age of the patient, the degree of brain maturation, underlying focal lesions, and the electroencephalographic (EEG) correlates present at the time of seizures. Epilepsy is common, affecting 1% of the population with about 50 new cases per year per 100,000 people. Between 10% and 20% of these new cases will go on to have “medically intractable seizures” and therefore become candi-dates for surgical treatment if they can be shown to have a localized seizure focus. Non-invasive local-ization of seizure foci can be achieved in many patients with PET and SPECT imaging and these methods have a solid clinical role in management of epilepsy. Nonetheless, it is important to keep in mind that the diagnosis of epilepsy is made largely on clinical and electrophysiological grounds and accordingly, it is important to carefully integrate functional brain imaging studies into the diagnostic
Fig. 2.4. 123I-iomazenil SPECT study (right) in a 61-year-old patient with purely subcortical infarction 46 days after onset. CT scan (left) shows hypodensity in the frontal deep white matter with no involvement of the cortical area. Blood fl ow measured with 123I-IMP (center) was reduced in the frontal and temporal cortices, basal ganglia, and thalamus 123I-iomazenil image (right) demonstrated reduced uptake in the Broca area and milder reduction in the frontal and temporal lobes that were normal on the CT images. The patient presented with global aphasia

Neurochemical Imaging with Emission Tomography: Clinical Applications 23
process in patients who have been determined to be candidates for seizure surgery.
2.9.1 Cerebral Blood Flow and Metabolism in Seizure Disorders
The cerebral metabolic consequences of epilepsy were first investigated using 18F-FDG and PET (Kuhl et al. 1980; Engel et al. 1982a–c; Yamamoto et al. 1983; Theodore et al. 1984; Franck et al. 1986; Abou-Khalil et al. 1987). Following the development of blood flow tracers for SPECT imaging, many reports of blood flow abnormalities in epilepsy have appeared (Bonte et al. 1983; Sanabria et al. 1983; Lee et al. 1988; Stefan et al. 1987a; Lang et al. 1988). In recent years there has been a parallel recognition of the use-fulness of PET and SPECT in evaluating patients for seizure surgery, but few systematic studies have been performed comparing these two modalities.
Most interictal PET studies demonstrate that approximately 70% of patients with severe partial seizures have reduced regional glucose utilization. Interictal hypometabolism is more common in patients with mesial temporal lesions such as hip-pocampal sclerosis, small tumors and hamarto-mas, but is less frequently seen in patients without radiographically visible lesions (Engel et al. 1982a; Henry et al. 1990). While the region of interictal hypometabolism corresponds grossly to the loca-
tion of interictal EEG abnormalities, its size is con-sistently larger than the area of the EEG abnormal-ity, as demonstrated in Fig. 2.5 (Engel et al. 1982a; Theodore et al. 1988; Henry et al. 1990). For exam-ple, in patients with seizure foci well localized in the temporal lobe, reduced metabolism is seen in the mesial and lateral temporal cortex and at times in the ipsilateral frontal and parietal cortex, basal ganglia and thalamus (Fig. 2.5) (Engel et al. 1982c; Henry et al. 1990; Sackelleras et al. 1990). However, sub-sequent studies indicated that within the temporal lobe the metabolic pattern may differ according to whether the patient has temporal lobe epilepsy of lateral neocortical or mesial basal origin (Hajek et al. 1993). Patients with temporal lobe epilepsy due to mesial gliosis display a generalized mesial and lat-eral hypometabolism, while patients with a lateral neocortical gliosis have relatively little mesial basal hypometabolism. Accordingly, PET may provide non-invasive information that helps stratify patients for mesial basal versus lateral neocortical selective temporal lobe surgery. Patients with bilateral hypo-metabolism have a worse surgical prognosis that those with unilateral hypometabolism (Blum et al. 1998). Interestingly, no quantitative relations have been observed between the presence and magnitude of regional hypometabolism and interictal or ictal electrical parameters (Engel 1988). Accordingly, 18F-FDG metabolic studies appear to be measuring processes different than those reflected by regional electrical activity.
Fig. 2.5. 18F-FDG-PET images of a patient with partial complex epilepsy. There is left temporal lobe interictal hypometabolism corresponding to the left temporal lobe seizure focus. In addition, the area of hypometabolism extends into the left frontoparietal region and ipsilateral thalamus, even though these areas were normal on the electroencephalogram

24 G. Lucignani and J. J. Frost
False positive identification of the side of a sei-zure focus by 18F-FDG PET has been observed in only a few individuals and was attributed to artifacts resulting from depth electrode placement (Engel et al. 1982c; Engel 1984). Conversely, erroneous later-alization using scalp and sphenoidal EEG is observed in 10%–15% of patients (Engel 1984; Risinger et al. 1989). Accordingly, for clinical management of patients with intractable seizures 18F-FDG PET is commonly used together with scalp EEG studies. Close correspondence of scalp EEG and 18F-FDG PET results provides strong evidence for lateraliza-tion of epileptogenic tissue and in many instances patients undergo focal resections without invasive electrical monitoring. If 18F-FDG PET and EEG data do not correspond then invasive electrical monitor-ing is needed (Engel et al. 1990). Although 18F-FDG PET is clearly useful in non-invasive localization of epileptogenic tissue, there is no general correlation between the presence and degree of hypometabo-lism and the surgical outcome (Engel 1984). How-ever, Swartz et al. (1992a) has demonstrated that patients with widespread areas of hypometabolism tend to have a worse postoperative prognosis. The lack of a clear relation between hypometabolism and outcome undoubtedly relates to the fact that 18F-FDG PET overestimates the extent of epileptogenic tissue and conversely, extratemporal seizure foci may cause temporal lobe hypometabolism. Clearly new and more specific tracers are needed in order to identify epileptogenic tissue more precisely.
The site of interictal hypometabolism corre-sponds to sites of ictal onset as shown by EEG, but ictal PET studies are difficult to perform since the tracer may not be available due to its short half-life. Nonetheless, the fortuitous occurrence of seizures at the time of 18F-FDG administration has provided ictal 18F-FDG PET scans (Engel et al. 1982b, 1983; Theodore et al. 1984; Abou-Khalil et al. 1987). Due to the propagation of seizure activity beyond the focus and the problems in timing of the injec-tion of 18F-FDG, ictal PET scanning has received relatively little attention, particularly in the context of the clinical management of patients with intrac-table epilepsy. Additionally, images reflect average metabolic activity over an approximate 30-min time interval after injection. Accordingly, images reflect an admixture of interictal, ictal and postic-tal metabolism, which may be difficult to interpret. For example, some 18F-FDG PET studies acquired during an ictus have shown global hypometabolism. In these instances it is thought that the 18F-FDG PET image reflects predominantly postictal depres-
sion of metabolism when the actual seizure activity occurs during a small portion of the uptake period. Since some seizures may be subclinical it is impor-tant to monitor the EEG during the uptake period (Barrington et al. 1998). Ictal and postictal blood flow changes in epilepsy have been more extensively investigated with SPECT.
Although most 18F-FDG PET studies have been performed in patients with complex partial seizures originating in the temporal lobe, the same methods can be used to localize frontal lobe lesions (Swartz et al. 1989; Franck et al. 1992; Henry et al. 1992; Robitaille et al. 1992). Interictal hypometabolism is observed in the region of frontal lobe seizure foci and, as in temporal lobe epilepsy, may extend beyond the areas of electrical abnormality (Henry et al. 1992; Swartz et al. 1989). The relation of PET to other imaging modalities in epilepsy has been recently reviewed (Duncan 1997).
SPECT imaging in epilepsy has employed 123I-IMP and 123HIPDM (Magistretti and Uren 1983; Lee et al. 1986, 1987, 1988) and subsequently 99mTc-HMPAO and related tracers (Stefan et al. 1987b; Andersen et al. 1988; Ryding et al. 1988; Devous and Leroy 1989; Rowe et al. 1989, 1991a; Grünwald et al. 1991; Krausz et al. 1991; Newton et al. 1992; Thomas et al. 1992). Overall, these results demonstrate the high sensitivity in localizing seizure foci comparable to that of 18F-FDG PET (70%), but some studies have shown a lower sensitivity, stimulating the use of ictal SPECT scanning.
Due to the longer half-life of SPECT blood flow radiopharmaceuticals, the use of ictal and post-ictal scanning in patients with epilepsy has been explored in recent years (Magistretti and Uren 1983; Lee et al. 1987, 1988; Devous and Leroy 1989; Rowe et al. 1989; Marks et al. 1992; Newton et al. 1992; Ramsey et al. 1992). A number of studies have suggested that ictal imaging is more sensitive than interictal scanning in temporal lobe epilepsy (Rowe et al. 1989). In these studies a simultaneous EEG recording is obtained and the radiopharmaceutical injected within 1 or 2 min of the onset of seizure. Areas of interictal hypoperfusion convert to areas of hyperperfusion during the ictus. Ictal SPECT imaging has the potential to identify multiple and bilateral seizure foci, but carries with it the possibil-ity of identifying areas of secondary seizure activity depending on the timing of the radiopharmaceu-tical injection and the rapidity of seizure spread. In addition, one study has provided evidence for an increase in regional blood flow prior to the ini-tiation of seizure activity, implying that the blood
Neurochemical Imaging with Emission Tomography: Clinical Applications 25
flow changes may not directly reflect regional sei-zure activity (Baumgartner et al. 1998). However, studies of localized simple partial seizures using 99mTc-HMPAO demonstrate well localized areas of hyperperfusion that correlate with the electrical and clinical localization. Ictal SPECT has also been applied to frontal lobe epilepsy, demonstrating a 91% sensitivity of correctly localizing lateralized seizure foci. Peri-ictal scanning in pediatric patients has been specifically evaluated and found to be ben-eficial (O’Brien et al. 1998; Shulkin 1997).
Post-ictal SPECT imaging (i.e., imaging within minutes after a seizure) has also been employed and the results demonstrate an improvement in sensitiv-ity compared to interictal scanning (Rowe et al. 1989, 1991b; Duncan et al. 1993). The largest of these stud-ies reported a sensitivity of 69% for post-ictal imag-ing compared to 38% for true interictal scans; the reasons for the low interictal sensitivity in this study are unclear. Within approximately 10 min after the completion of a seizure, the pattern of hyperperfu-sion in the antero-mesial temporal lobe and hypo-perfusion in the remaining temporal lobe is often observed. After about 15 min the mesial hyperper-fusion disappears and the hypoperfusion becomes less pronounced. Accordingly, the time from ictus is important in interpreting post-ictal SPECT images. It is important not to misinterpret severe post-ictal hypoperfusion ipsilateral to the seizure focus and hyperperfusion on the contralateral side. As with 18F-FDG-PET imaging, SPECT perfusion imaging is more sensitive than MRI (Cordes et al. 1990). The presence of interictal hypoperfusion is similarly more common in patients with T2-weighted MRI abnormalities, as compared to patients with normal MRI scans (Ryvlin et al. 1992).
Another application of 99mTc-HMPAO is to map the distribution of amobarbital in the intracarotid Wada test (Hietala et al. 1990; Jeffery et al. 1991; Hart et al. 1993). Administration of intracarotid amobarbital was first used to indicate hemispheric dominance for language in patients who were to undergo surgery for intractable epilepsy and is cur-rently also used to identify patients at risk for amne-sia following temporal lobe surgery. Subsequently, the WADA test has been used to aid in the lateral-ization of epileptogenic regions. A good correlation exists between interictal PET and intracarotid amo-barbital administration in the lateralization of sei-zure foci (Salanova et al. 1998). Intracarotid amo-barbital administration is used not only to localize language function, but also to predict memory disturbance following temporal lobectomy. In this
regard, delivery of amobarbital to ipsilateral mesial lobe structures is the key. In 90% of individuals the posterior two-thirds of the hippocampus is supplied by the vertebrobasilar system via the posterior cere-bral artery. Accordingly, administration of amobar-bital via the intracarotid artery probably does not result in anesthesia of the entire hippocampus in many patients (Jeffery et al. 1991). If the amobarbi-tal is not delivered to the hippocampus, false nega-tive memory lateralization may occur. Co-admin-istration of 99mTc-HMPAO and amobarbital via the internal carotid artery can be used to assess areas of perfusion during the WADA test. If present, contra-lateral hemispheric perfusion via the circle of Willis during the WADA test can also be identified.
Recent studies support the added value of PET over interictal SPECT studies (Lamusuo et al. 1997) and comparable accuracy with ictal SPECT and inter-ictal PET (Markand et al. 1997). However, the final conclusions regarding the relative merits of PET and SPECT will have to await studies using state-of-the-art instrumentation for both modalities.
2.9.2 Neurotransmission Function in Seizure Disorders
Although scalp and invasive electroencephalogra-phy is the mainstay of diagnosis, classification, and lesion identification in epilepsy, PET and SPECT have advanced our understanding of the basic ictal and interictal blood flow and metabolic events that correlate with the electrical abnormalities. Flow-metabolism imaging alone is limited in its potential to elucidate the neurochemical mechanisms respon-sible for initiation and termination of seizures. More specific tracers are needed to further improve local-ization of the epileptogenic foci, predict prognosis following seizure surgery, and stratify patients for various drug therapies. New methods to image and quantitate neuroreceptors have provided the first approach to realizing these goals.
Studies using PET and SPECT have been conducted with tracers for opioid receptors: 11C-carfentanil, 11C-diprenorphine, 18F-cyclofoxy, and 11C-methyl-naltrindole (Fig. 2.6) (Frost et al. 1988; Mayberg et al. 1991; Madar et al. 1997); benzodiazepine receptors: 11C-flumazenil and 123I-Iomazenil (Savic et al. 1988, 1990; Innis et al. 1991); muscarinic cho-linergic receptors: 123I-iododexetimide (Mueller-Gaertner et al. 1993); and histamine receptors: 11C-doxepin (Iinuma et al. 1993). Increased levels of

26 G. Lucignani and J. J. Frost
mu and delta opioid receptors (Fig. 2.6) and reduced benzodiazepine and muscarinic cholinergic recep-tors have been observed. In some, but not all, cases receptor imaging has provided additional localiza-tion information over flow/metabolism imaging alone. Comparison of 11C-flumazenil (FMZ) and 18F-FDG in patients with partial complex seizures has shown that 11C-FMZ may provide improved local-ization of seizure foci (Savic et al. 1993; Koepp et al. 1997a,b; Richardson et al. 1997, 1998). However, another study showed that 11C-flumazenil was less accurate (Debets et al. 1997). Changes in benzodi-azepine receptors may vary as a function of seizure activity (Savic et al. 1998).
As FMZ binding depends on viability rather than metabolism and perfusion, it allows better iden-tification of lesions and discrimination of areas of hypometabolism due to morphologic alterations from areas of hypometabolism extending beyond the area of the morphologic lesion, both in case of temporal and extratemporal epilepsy. Indeed FMZ circumscribes more restricted areas of decreased tracer binding relative to the extent of concurrent hypometabolism and hypoperfusion. Thus, FMZ PET is an excellent complementary imaging method in patients with inconclusive morphologic and func-tional studies.
Some studies have begun to examine the effect of seizure activity on 11C-diprenorphine binding in patients with primary generalized absence seizures (Bartenstein et al. 1993) and seizures induced by reading (Koepp et al. 1998). These studies demon-strate that active seizure activity alters opioid recep-tor binding, probably due to release of endogenous opioid peptides. This demonstration of a functional
change in opiate receptor binding following seizures introduces a new paradigm for investigation of the role of the opiate system in epilepsy.
2.10 Brain Tumors
For the last two decades the diagnostic work-up of brain tumors has been based on morphological imaging, first with CT and more recently with MRI (Atlas 1991; Fishbein 1988; Goldberg 1991). Con-trast-enhanced CT is, in general, the first exami-nation performed in patients with suspected brain tumor. It is possible with CT to make a differen-tial diagnosis with other cerebral lesions and, to a limited extent also among different types of intra-cranial tumors. Investigations with CT and MRI, however, may yield partial answers, and must be complemented by biochemical imaging. Biochemi-cal imaging of brain tumors may indeed be crucial for the early differential diagnosis, for a prognostic assessment and for differentiating between edema and gliosis, as well as between recurrence and radio-necrosis, and is best achieved by emission tomog-raphy. The mechanisms of uptake and retention of each tracer in normal tissue, are frequently altered markedly in neoplastic tissue. Alterations in the normal pattern of tracer accumulation can either be due to secondary events, commonly detectable by morphologic imaging, such as the disruption of the BBB, or perfusion modifications due to compression and dislocation of the cerebral structures. However, most interesting is the tracer accumulation due to biochemical modifications of the neoplastic tissue itself, as alterations of metabolic processes and their rates may be related to the rate of growth and cell type of the tumor, while the expression of specific antigens or receptors by the tumor, may help in their histologic characterization and assist in treatment planning. Developments in morphologic imaging and concurrent advances in biochemical imaging have therefore completely modified the role of radi-ology and nuclear medicine in the assessment of patients with brain tumors.
The clinical use of radioactive tracers in neuro-oncology has followed their use for other purposes. This is the case of 18F-fluorodeoxyglucose, devel-oped for the assessment of neuronal functional activity, 11C-methionine, developed for the assess-ment of amino acid transport and protein synthesis, followed by the development of 123I-tyrosine. It also
Fig. 2.6. Images of 11C-carfentanil and 11C-N-methyl-naltrin-dole binding in a patient with right-sided temporal lobe sei-zure focus. Both 11C-carfentanil and 11C-N-methyl naltrindole binding are increased in the right temporal neocortex
mu receptor11C-carfentanil
delta receptor11C-methylnaltrindole
Neurochemical Imaging with Emission Tomography: Clinical Applications 27
holds for 201Tl and 99mTc-methoxy-isobutil-isonitrile (MIBI), both extensively used in nuclear cardiology. All of these tracers are relatively non-specific, and some of them can also be used for the assessment of extracranial tumors. In other cases tracers have been developed for the assessment of tumors with very specific features, including the expression of antigens or receptors.
2.10.1 Imaging of Tumor Metabolic Processes
Tracers most commonly used for the assessment of cerebral tumors include 18F-FDG, 11C-methio-nine, 201Tl and 99mTc-MIBI. In various manners their uptake is dependent on basic processes such as membrane permeability to electrolytes by active and passive mechanisms, Na+, K+, ATP-ase activity, energy metabolism and other metabolic variables such as protein synthesis, as well as on the presence of specific clearance mechanisms. The uptake and retention of tracer in tumor tissue depends also on cell type, extent of differentiation, immunogenicity, rate of growth, tissue mass perfusion pattern, BBB integrity, vascular neoformation and maturation.
18F-FDG is the most important tracer for PET oncologic studies (see Chapters 11–13). Relatively simple synthesis and long half-life along with exten-sive knowledge of the mechanisms determining its uptake and retention have made it quite popular in neuro-oncology. Initial studies have related the grade of malignancy of gliomas to the rate of 18F-FDG uptake, and have shown that while low grade astrocytomas have low 18F-FDG uptake, anaplastic astrocytomas and glioblastomas have markedly ele-vated tracer uptake (di Chiro et al. 1982, 1988; di Chiro and Brooks 1988). In tumor cells there is an overexpression of glucose transporters and enzymes related to glucose metabolism and this causes an accumulation of tracer in tumor tissue that is gener-ally higher than in normal tissue. As already stated, normal brain is avid of glucose and therefore the accumulation of 18F-FDG in tumor may in some cases be very close to that of normal tissue causing difficulties in the interpretation of the study. Based on these premises 18F-FDG has been used for the assessment of tumor malignancy and prognosis, but the most important use is follow-up of patients with low grade astrocytomas, possibly evolving into high grade malignancy, and the differentiation between radiation necrosis and tumor recurrence in patients presenting with relapse of neurologic symptoms
and non-diagnostic CT and/or MRI after radiation therapy. Problems related to the tumor/non-tumor uptake ratio encountered with 18F-FDG, and difficult differential diagnoses with other cerebral patholo-gies, i.e., infections, radiation necrosis, edema, that may cause abnormal 18F-FDG uptake, can be avoided by using 11C-methionine, the uptake of which is related to amino acid transport and metabolic rate of the tumor (Bergstrom et al. 1987; Ericson et al. 1985; Hatazawa et al. 1989).
An alternative to positron tracers in neuro-oncol-ogy is 201Tl (Kaplan et al. 1987; Kim et al. 1990; Dier-ckx et al. 1994; Ricci et al. 1996). The discovery that 201Tl accumulates in neoplastic tissue was serendipi-tous as it was observed in patients undergoing myo-cardial perfusion studies, who also had tumors. The uptake of 201Tl in brain tumors is related to blood flow, BBB integrity and malignant cell density and is due to its similarities with potassium and thus on the Na+,K+, ATP-ase activity. 201Tl uptake is also related to tumor type, as the rate of uptake differs, 201Tl cannot be used as a partial substitute for histologic characterization and grading. It must be pointed out that, depending on the patient selection process 201Tl sensitivity and specificity have been estimated to be about 70% and 80%, respectively, but sensitiv-ity is lower in low grade gliomas, while specificity is lower in cases with hemorrhagic infarction. The highest sensitivities have been observed in glioblas-toma multiforme and metastatic lesions.
Another tracer that is amenable for imaging cere-bral tumors with SPECT is 99mTc-MIBI (O’Tuama et al. 1993; Soler et al. 1998; Maffioli et al. 1996), which was originally also developed for evaluat-ing myocardial perfusion. This tracer is a cationic complex that is concentrated in cytoplasm and mitochondria as a result of passive diffusion across highly negative transmembrane potentials in rela-tion to metabolic demand. Studies with this tracer have shown sensitivities similar to that of 201Tl in malignant tumors and recurrence.
As for amino acid transport into tumor cells, the SPECT tracer 123I-methyl-tyrosine, has been evalu-ated in small patient series with promising results (Biersack et al. 1989; Langen 1997).
2.10.2 Imaging of Cerebral Tumors by Antibodies and Receptor-Bound Tracers
Imaging modalities based on the use of SPECT and monoclonal antibodies is attracting increasing

28 G. Lucignani and J. J. Frost
interest, in particular for those aimed at the signal amplification by tumor pretargeting techniques. This is best achieved by the administration of bio-tinylated monoclonal antibody, followed by the administration of the radioactive tracer (two-step technique), or by the administration of avidin, after the monoclonal antibody, and then by the tracer administration (three-step technique). The addi-tional steps are aimed at the enhancement of the signal-to-noise ratio, by allowing a longer time for the antibody localization on the tumor (two-step), and removal of free antibody by conjugation with avidin (three-step), prior to the administration of low doses of radioactive tracer.
The use of tracers, which specifically bind to receptors, has been applied mostly to pituitary ade-nomas, in particular in the assessment of non-secret-ing tumors. Non-functioning pituitary adenomas, as well as meningiomas and craniopharyngiomas, do not cause any specific endocrine syndrome; thus their presence is usually suggested by the evidence of compression of the parasellar nervous structures. Radiological differential diagnosis may occasion-ally be difficult in primary parasellar lesions with presentation in the parasellar region. Diagnostic uncertainty after MRI investigation occurs in up to 10% of patients with hormonally inactive tumors of the sellar region. In these selected cases, the in vivo characterization of the biochemical and functional properties of the tissue may provide useful informa-tion about the nature of the pituitary mass.
PET and SPECT have been used for the assess-ment of adenomas and other parasellar tumors with 18F-FDG, 11C-methionine, 11C-tyrosine, 11C-deprenyl, 11C and 18F labeled spiperone analogs, as well as 123I-IBZM and 123I-epidepride (Muhr et al. 1986; Daemen et al. 1991; Bergstrom et al. 1992; Pirker et al. 1996; Lucignani et al. 1997; de Herder et al. 1999). Some of the methods proposed for the assessment of sellar and parasellar tumors are based on measurements that are not specific to any particular type of neoplastic tissue, i.e., the rate of glucose metabolism or protein synthesis. These variables may indicate a neoplastic process when they are abnormally increased or decreased. Such methods have been shown to be useful for visualiz-ing pituitary adenomas, for differentiating between viable neoplastic tissue and scar, and for assessing the response to pharmacological treatment. Other methods are based on the use of radiopharmaceuti-cals tracing processes in the normal and abnormal pituitary tissue, but neither in the other tumors of the sella nor in the nearest surrounding tissue.
Another approach to imaging pituitary adeno-mas is based on the presence of somatostatin recep-tors on pituitary tumors, which bind octreotide. For this purpose both 111In-DTPA-pentetreotide and 123I-Tyr3-octreotide have been used (Krenning et al. 1993; see Chap. 10).
2.10.3 Differential Diagnosis of Lymphoma and Infectious Diseases in AIDS
Neurological disorders occur in 40%–60% of patients with AIDS and approximately 10% develop focal lesions of the central nervous system. In these patients contrast enhancing brain lesions are most frequently caused by infectious diseases (50%–70% of patients), due to Toxoplasma gondii, Candida albicans, Mycobacterium tuberculosis, or by pri-mary lymphomas (2%–10% of patients). Each type of lesion requires a timely, specific therapy, but it is a common practice to start anti-toxoplasmosis ther-apy based on empirical evidence. In patients who do not respond to therapy a non-invasive diagnos-tic procedure, i.e., alternative to biopsy, is required for an appropriate therapeutic planning. In these patients 201Tl, 18F-FDG or 99mTc-MIBI can be used to support the selection of a therapeutic approach, based on the evidence that in lymphomas the uptake of these tracers is generally higher than in focal infectious lesions (Costa et al. 1995; D’Amico et al. 1997).
2.11 Outlook for the Future
The state-of-the-art PET and SPECT techniques, which have been developed over the last 20 years, enable us to diagnose and evaluate CNS diseases, predominantly by measurement of cerebral blood f low and metabolism. Flow-metabolism methods make it possible to identify the areas of abnor-mal neuronal function and thus to differentiate distinct diseases due to cortical neuronal degen-eration, such as the various forms of dementia that occur with cognitive impairment. However, as energy metabolism is a non-specific process with respect to the activity of the neuronal sub-populations, radionuclide imaging of the brain is under continuous evolution as new methods are developed and applied also for the assessment of

Neurochemical Imaging with Emission Tomography: Clinical Applications 29
pre- and post-synaptic neurotransmitter function. These methods make it possible to differentiate syndromes occurring with motor impairment due to subcortical neuronal damage. Moreover, the use of neurochemical imaging, including the rate of synthesis and uptake of neurotransmitters, and their rate of binding to selective receptors appears crucial for the assessment of neuronal viability and damage in cerebral vascular diseases and epilepsy. Finally, the assessment of neurochemical derange-ments is the only key to the understanding of psy-chiatric diseases.
The future of brain radionuclide imaging hinges on the continuous development of devices to measure the radiotracer distribution, and on the search for new radiopharmaceuticals, along with improvements in the area of data processing. To this end, tomographic systems are being developed to improve the accuracy of measurements of radio-tracer distribution with a concurrent reduction of the acquisition time, while radiopharmaceuticals that selectively tag the various receptor classes and subclasses are successfully manufactured. Last but not least, analytical procedures are being imple-mented for faster and more accurate image and data processing.
The strategy for the assessment of neurologic patients will soon include the use of activation tasks with pharmacologic challenge, and the use of dedi-cated instruments that combine state of the art X-ray computed tomography and emission tomography imaging. This synergistic approach will overcome the spatial resolution limitations of emission tomog-raphy and add the power of biochemical imaging to morphologic imaging.
References
Abi-Dargham A, Martinez D, Mawlawi O, Simpson N, Hwang DR, Slifstein M et al (2000) Measurement of striatal and extrastriatal dopamine D1 receptor binding potential with [11C]NNC 112 in humans: validation and reproducibility. J Cereb Blood Flow Metab 20:225-243
Abou-Khalil BW, Siegel GJ, Sackellares JC, Gilman S, Hichwa R, Marshall R (1987) Positron emission tomography studies of cerebral glucose metabolism in chronic partial epilepsy. Ann Neurol 22:480-486
Albin RL, Minoshima S, D’Amato CJ, Frey KA, Kuhl DE, Sima AAF (1996) Fluoro-deoxyglucose positron emission tomography in diffuse Lewy body disease. Neurology 47:462-466
Alexandrov AV, Masdeu JC, Devous MD Sr, Black SE, Grotta JC (1997) Brain single-photon emission CT with HMPAO
and safety of thrombolytic therapy in acute ischemic stroke. Proceedings of the meeting of the SPECT Safe Thrombolysis Study Collaborators and the members of the Brain Imaging Council of the Society of Nuclear Medicine. Stroke28:1830-1834
Andersen AR, Gram L, Kjaer L, Fuglsang-Frederiksen A, Hern-ing M, Lassen NA, Dam M (1988) SPECT in partial epilepsy: identifying side of the focus. Acta Neurol Scand 78 [Suppl 117]:90-95
Antonini A, Schwarz J, Oertel WH, Pogarell O, Leenders KL (1997) Long-term changes of striatal dopamine D2 recep-tors in patients with Parkinson’s disease: a study with positron emission tomography and [11C]raclopride. Mov Disord 12:33-38
Arnett CD, Fowler JS, MacGregor RR (1987) Turnover of brain monoamine oxidase measured in vivo by positron emission tomography using L-11C deprenyl. J Neurochem 49:522-527
Atlas SW (1991) Intraaxial brain tumours. In: Atlas SW (ed) Magnetic resonance imaging of the brain and spine. Raven, New York, pp 379-409
Baron JC; Bousser MG; Comar D; Soussaline F; Castaigne P (1981) Noninvasive tomographic study of cerebral blood flow and oxygen metabolism in vivo. Potentials, limitations, and clinical applications in cerebral ischemic disorders. Eur Neurol 20:273-284
Baronti F, Conant KE, Giuffra M, Davis TL, Brughitta G, Iada-rola M, Berrettini WH, Chase TN, Mouradian MM (1991) Opioid peptides in Parkinson’s disease: effects of dopamine repletion. Brain Res 560:92-96
Barrington SF, Koutroumanidis M, Agathonikou A, Marsden PK, Binnie CD, Polkey CE, Maisey MN, Panayiotopoulos CP (1998) Clinical value of “ictal” FDG-positron emission tomography and the routine use of simultaneous scalp EEG studies in patients with intractable partial epilepsies. Epi-lepsia 39:753-766
Bartenstein P, Ludolph A, Schober O, Lottes G, Scheidhauer K, Sciuk J, Beer H-F (1993) Benzodiazepine receptors and cerebral blood flow in partial epilepsy. Eur J Nucl Med 18:111-118
Baumgartner C, Serles W, Leutmezer F, Pataraia E, Aull S, Czech T, Pietrzyk U, Relic A, Podreka I (1998) Preictal SPECT in temporal lobe epilepsy: regional cerebral blood flow is increased prior to electroencephalography-seizure onset. J Nucl Med 39:978-982
Beer HF, Bläuenstein PA, Hasler PH, Delaloye B, Riccabona G, Bangerl I, Hunkeler W, Bonetti EP, Pieri L, Richards JG, Schubiger PA (1990) In vitro and in vivo evaluation of iodine-123-Ro16-0154: a new imaging agent for SPECT investigations of benzodiazepine receptors. J Nucl Med 31:1007-1014
Benson DF, Kuhl DE, Hawkins RA, Phelps ME, Cummings JL, Tsai SY (1983) The fluorodeoxyglucose-18F scan in Alzheimer’s disease and multi-infarct dementia. Arch Neurol 40:711-714
Bergstrom M, Muhr C, Lundberg PO, Berstrom K, Lundqvist H, Antoni G, Fasth K-G, Langstrom B (1987) In vivo study of amino acid distribution and metabolism in pituitary adenomas using positron emission tomography with 11C-D-methionine and 11C-L-methionine. J Comput Assist Tomogr 11:384-389
Bergstrom M, Muhr C, Jossan S, Lilja A, Nyberg G, Langstrom B (1992) Differentiation of pituitary adenoma and menin-

30 G. Lucignani and J. J. Frost
gioma: visualization with positron emission tomography and[11C ]-L-deprenyl. Neurosurgery 30:855-861
Berridge M, Comar D, Crouzel C, Baron JC (1983) 11C-Labelled ketanserin: a selective serotonin S2 antagonist. J Label Compds Radiopharm 20:73
Biersack HJ, Coenen HH, Stocklin G, Reichmann K, Bockisch A, Oehr P, Kashab M, Rollmann O (1989) Imaging of brain tumors with L-3-[123I]iodo-alpha-methyl tyrosine and SPECT. J Nucl Med 30:110-112
Biousse V, Zilovicius M, De Recondo A, Woimant F, Amarenco P, Bousser MG et al (1993) PET study of central benzodi-azepine receptors (BZR) with [11C]-flumazenil (Cflu) dis-tinguishes “functional” from structural hypometabolism in stroke. Neurology 43:A381
Blum DE, Ehsan T, Dungan D, Karis JP, Fisher RS (1998) Bilateral temporal hypometabolism in epilepsy. Epilepsia 39:651-659
Bohnen NI, Frey KA (2003) The role of positron emission tomography imaging in movement disorders. Neuroimag Clin North Am 13:791-803
Bonte FJ, Stokely EM, Devous MD Jr, Homan RW (1983) Single-photon tomographic study of regional cerebral blood flow in epilepsy. A preliminary report. Arch Neurol 40:267-270
Brooks DJ, Salmon EP, Mathias CJ, Quinn N, Leenders KL, Ban-nister R, Marsden CD, Frackowiak RSJ (1990a) The rela-tionship between locomotor disability, autonomic dysfunc-tion, and the integrity of the striatal dopaminergic system in patients with multiple system atrophy, pure autonomic failure, and Parkinson’s disease, studied with PET. Brain 113:1539-1552
Brooks DJ, Ibanez V, Sawle GV, Quinn N, Lees AJ, Mathias CJ, Bannister R, Marsden CD, Frackowiak RSJ (1990b) Dif-fering patterns of striatal 18F-dopa uptake in Parkinson’s disease, multiple system atrophy, and progressive supra-nuclear palsy (see comments). Ann Neurol 28:547-555
Brooks DJ, Ilbanez V, Sawle GV, Plaayford ED, Quinn N, Math-ias CJ, Lees AJ, Marsden CD, Bannister R, Frackowiak RSJ (1992a) Striatal D2 receptor status in patients with Par-kinson’s disease, striatonigral degeneration, and progres-sive supranuclear palsy, measured with 11C-raclopride and positron emission tomography. Ann Neurol 31:184-192
Brooks DJ, Playford ED, Ibanez V, Sawle GV, Thompson PD, Findley L, Marsden CD (1992b) Isolated tremor and dis-ruption of the nigrostriatal system: an 18F-dopa PET study (see comments). Neurology 42:1554-1560
Brucke T, Kornhuber J, Angelberger P, Asenbaum S, Frassine H, Podreka I (1993) SPECT imaging of dopamine and sero-tonin transporters with [123I]beta-CIT. Binding kinetics in the human brain. J Neural Transm Gen Sect 94:137-146
Buck A, Westera G, Sutter M, Albani C, Kung HF, von Schulthess GKJ (1995) Iodine-123-IBF SPECT evaluation of extrapyra-midal diseases. J Nucl Med 36:1196-1200
Cagnin A, Brooks DJ, Kennedy AM, Gunn RN, Myers R, Turkheimer FE et al (2001) In-vivo measurement of acti-vated microglia in dementia. Lancet 358:461-467
Choksey MS, Costa DC, Iannotti F, Ell PJ, Chochard HA (1989) Tc-99m-HMPAO SPECT and cerebral blood flow: a study of CO2 reactivity. Nucl Med Commun 10:609-618
Coenen HH, Laufer P, Stocklin G, Wienhard K, Pawlik G, Bocker-Schwarz HG, Heiss WD (1987) 3-N-(2’[18F]fluoroethyl)spiperone: a new ligand for cerebral dopamine receptor studies with PET. Life Sci 40:81-88
Cordes M, Christe W, Henkes H, Delavier U, Eichstädt H,
Schörner W, Langer R, Felix R (1990) Focal epilepsies: HM-PAO SPECT compared with CT, MR, and EEG. J Comput Assist Tomogr 14:402-409
Costa DC, Gacinovic S, Miller RF (1995) Radionuclide brain imaging in acquired immunodeficiency syndrome (AIDS). Q J Nucl Med 39:243-249
Crouzel C, Venet M, Irie T, Sanz G, Boullais C (1988) Labelling of a serotonergic ligand with 18F: [18F]setoperone. J Label Compds Radiopharm 25:403
Cumming P, Gjedde A (1998) Compartmental analysis of dopa decarboxylation in living brain from dynamic positron emission tomograms. Synapse 29:37-61
Cutler NR, Haxby JV, Duara R, Grady CL, Kay AD, Kessler RM, Sundaram M, Rapoport SI (1985) Clinical history, brain metabolism, and neuropsychological function in Alzheim-er’s disease. Ann Neurol 18:298-309
Daemen BJ, Zwertbroek R, Elsinga PH, Paans AM, Doorenbos H, Vaalburg W (1991) PET studies with L-[11C]tyrosine, L-[metyl-11C]methionine and 18F-fluorodeoxyglucose in prolactinomas in relation to bromocriptine treatment. Eur J Nucl Med 18:453-460
D’Amico A, Messa C, Castagna A, Zito F, Galli L, Pepe G, Laz-zarin A, Lucignani G, Fazio F (1997) Diagnostic accuracy and predictive value of 201-Tl SPET for the differential diagnosis of cerebral lesions in AIDS patients. Nucl Med Commun 18:741-750
Dannals RF, Neumeyer JL, Milius RAJ, Ravert HT, Wilson AA, Wagner HN (1993) Synthesis of a radiotracer for study-ing dopamine uptake sites in vivo using PET: 2B-carbo-methoxy-3B-(4-fluorophenyl)-[N-11C-methyl]-tropane (11C)CFT or (11C)-WIN 35,428. J Label Compounds Radio-pharmacol 33:147-152
Davis S, Andrews J, Lichenstein M, Kaye A, Tress B, Rossiter S, Salehi N, Binns D (1990) A Single-photon emission computed tomographay study of hypoperfusion after sub-arachnoid hemorrhage. Stroke 21:252-259
Debets RM, Sadzot B, van Isselt JW, Brekelmans GJ, Meiners LC, van Huffelen AO, Franck G, van Veelen CW (1997) Is 11C-flumazenil PET superior to 18FDG PET and 123I-ioma-zenil SPECT in presurgical evaluation of temporal lobe epi-lepsy. J Neurol Neurosurg Psychiatry 62:141-150
De Herder WWA, Reijs AEM, de Swart J, Kaandorp Y, Lamberts SWJ, Krenning EP, Kwekkeboom DJ (1999) Comparison of iodine-123 epidepride and iodine-123 IBZM for domapine D2 receptor imaging in clinically non-functioning pituitary macroadenomas and macroprolactinomas. Eur J Nucl Med 26:46-50
Dey HM, Seibyl JP, Stubbs JB, Zoghbi SS, Baldwin RM, Smith EO, Zubal IG, Zea Ponce Y, Olson C, Charney DS (1994) Human biodistribution and dosimetry of the SPECT ben-zodiazepine receptor radioligand iodine-123 iomazenil. J Nucl Med 35:399-404
Devous MD Sr, Leroy RF (1989) Comparison of interictal and ictal regional cerebral blood flow findings with scalp and depth electrode seizure focus localization. J Cereb Blood Flow Metab 9 [Suppl]:S91
Di Chiro G, Brooks RA (1988) PET-FDG of untreated and treated cerebral gliomas. J Nucl Med 29:421-422
Di Chiro G, De LaPaz RL, Brooks RA, Sokoloff L, Kornblith PL, Smith BH, Patronas NJ, Kufta CV, Kessler RM, Johnson GS, Manning RG, Wolf AP (1982) Glucose utilization of cerebral gliomas measured by 18F-fluorodeoxyglucose and positron emission tomography. Neurology 32:1323-1329
Neurochemical Imaging with Emission Tomography: Clinical Applications 31
Di Chiro G, Oldfield E, Wright DC, de Michele G, Patronas N, Doppman JL, Larson SM, Masanori I, Kufta CV (1988) Cere-bral necrosis after radiotherapy and/or intraarterial che-motherapy for brain tumours, PET and neuropathologic studies. Am J Roentgenol 150:189-197
Diksic M, Tohyama Y, Takada A (2000) Brain net unidirectional uptake of a-methyltryptophan. Neurochem Res 25:1537-1546
Dierckx RA, Martin JJ, Dobbeleir A, Crols R, Neetens I, de Deyn PP (1994) Sensitivity and specificity of thallium-201 single-photon emission tomography in the functional detection and differential diagnosis of brain tumours. Eur J Nucl Med 21:621-633
Ding Y, Liu N, Wang T, Marecek J, Garza V, Ojima I et al (2000) Synthesis and evaluation of 6-[18F]fluoro-3-(2(S)-azetidinylmethoxy)pyridine as a PET tracer for nicotinic acetylcho-line receptors. Nucl Med Biol 27:381-389
Dolle F, Dolci L, Valette H, Hinnen F, Vaufrey F, Guenther I et al (1999) Synthesis and nicotinic acetylcholine receptor in vivo binding properties of 2-fluoro-3-[2(S)- 2-azetidinylmethoxy]pyridine: a new positron emission tomography ligand for nicotinic receptors. J Med Chem 42:2251-2259
Dubois B, Ruberg M, Javoy-Agid F, Ploska A, Agid Y (1983) A subcortico-cortical cholinergic system is affected in Par-kinson’s disease. Brain Res 288:213-218
Dubois B, Danze F, Pillon B, Cusimano G, Lhermitte F, Agid Y (1987) Cholinergic-dependent cognitive deficits in Parkin-son’s disease. Ann Neurol 22:26-30
Duncan JS (1997) Imaging and epilepsy. Brain 120:339-377Duncan R, Patterson J, Roberts R, Hadley DM, Bone I (1993)
Ictal/postictal SPECT in the pre-surgical localization of complex partial seizures. J Neurol Neurosurg Psychiatry 56:141-148
Eckelman WC, Reba RC, Rzeszotarski WJ, Gibson RE, Hill T, Holman BL, Budinger T, Conklin JJ, Eng R, Grissom MP (1984) Cerebral imaging of acetylcholine muscarinic receptors. Science 223:291-293
Engel J Jr (1984) The use of positron emission tomographic scanning in epilepsy. Ann Neurol 15 [Suppl]:S180-191
Engel J Jr (1988) Comparison of positron emission tomogra-phy and electroencephalography as measures of cerebral function in epilepsy. In: Pfurtscheller G, Lopes da Silva FH (eds) Functional brain imaging. Huber, Bern, pp 229-238
Engel J Jr, Brown WJ, Kuhl DE, Phelps ME, Mazziotta JC, Cran-dall PH (1982a) Pathological findings underlying focal temporal lobe hypometabolism in partial epilepsy. Ann Neurol 12:518-528
Engel J Jr, Kuhl DE, Phelps ME, Crandall PH (1982b) Compara-tive localization of epileptic foci in partial epilepsy by PCT and EEG. Ann Neurol 12:529-537
Engel J Jr, Kuhl DE, Phelps ME (1982c) Patterns of human local cerebral glucose metabolism during epileptic seizures. Sci-ence 218:64-66
Engel J Jr, Kuhl DE, Phelps ME, Rausch R, Nuwer M (1983) Local cerebral metabolism during partial seizures. Neurol-ogy 33:400-413
Engel J Jr, Henry TR, Risinger MW, Mazziotta JC, Sutherling WW, Levesque MF, Phelps ME (1990) Presurgical evalua-tion for partial epilepsy: relative contributions of chronic depth-electrode recordings versus FDG-PET and scalp-sphenoidal ictal EEG. Neurology 40:1670-1677
Ericson K, Lilja A, Bergstrom M, Collins VP, Eriksson L, Ehrin E, von Holst H, Lundqvist H, Langsrom B B, Mosskin M (1985) Positron emission tomography with ([11C]methyl)-
L-methionine, [11C]D-glucose, and [68Ga]EDTA in supra-tentorial tumors. J Comput Assist Tomogr 9:683-689
Feldman RS, Meyer JS, Quenzer LF (1997) Principles of neuro-psychopharmacology. Sinauer Associates, Sunderland
Fieschi C, Argentino C, Lenzi GL, Sacchetti ML, Toni D, Bozzao L (1989) Clinical and instrumental evaluation of patients with ischemic stroke within the first six hours. J Neurol Sci 91:311-321
Fishbein DS (1988) Neuroradiologic work-up of brain tumours. In: Theodore WH (ed) Clinical neuroimaging. Liss, New York, pp 111-137
Fowler JS, MacGregor RR, Wolf AP Arnett CD, Dewey SL, Schlyer D, Christman D, Logan J, Smith M, Sachs H et al (1987) Mapping human brain monoamine oxidase A and B with 11C-labeled suicide inactivators and PET. Science 235:481-485
Fowler JS, Volkow ND, Logan J, Schlyer DJ, MacGregor RR, Wang GJ, Wolf AP, Pappas N, Alexoff D, Shea C (1993) Monoamine oxidase B (MAO B) inhibitor therapy in Parkinson’s dis-ease: the degree and reversibility of human brain MAO B inhibition by Ro 19 6327. Neurology 43:1984-1992
Frackowiak RSJ, Lenzi GL, Jones T, Heather JD (1980) Quan-titative measurement of regional cerebral blood flow and oxygen metabolism in man using 15O and positron emis-sion tomography: theory, procedure and normal values. J Comput Assist Tomogr 4:727-736
Franck G, Sadzot B, Salmon E, Depresseux JC, Grisar T, Peters JM, Guillaume M, Quaglia L, Delfiore G, Delmotte D (1986) Regional blood flow and metabolic rates in human focal epi-lepsy and status epilepticus. In: Delgado-Escueta AV, Ward AA Jr, Woodbury DM, Porter RJ (eds) Basic mechanisms of the epilepsies. Molecular and cellular approaches. Advances in neurology, vol 44. Raven, New York, pp 935-948
Franck G, Maquet P, Sadzot B, Salmon E, Debets R, Dive D, Grisar T, Guillaume D, van Veelen C, van Huffelen A, van Emde Boas (1992) Contribution of positron emission tomography to the investigation of epilepsies of frontal lobe origin. In: Chauvel P, Delgado-Escueta AV et al (eds) Advances in neurology, vol 57. Raven, New York, pp 471-485
Frey KA, Koeppe RA, Kilbourn MR, Vander Borght TM, Albin RL, Gilman S et al (1996) Presynaptic monoaminergic ves-icles in Parkinson’s disease and normal aging. Ann Neurol 40:873-884
Frey KA, Minoshima S, Kuhl DE (1998) Neurochemical imag-ing of Alzheimer’s disease and other degenerative demen-tias. Q J Nucl Med 42:166-178
Friedland RP, Budinger TF, Ganz E, Yano Y, Mathis CA, Koss B, Ober BA, Muesman RH, Derenzo SE (1983) Regional cerebral metabolic alterations in dementia of the Alzheimer type: pos-itron emission tomography with [18F]fluorodeoxyglucose. J Comput Assist Tomogr 7:590-598
Friston KJ, Holmes AP, Worsley KJ, Poline JB, Frith CD, Frack-owiak RS (1995) Statistical parametric maps in functional imaging: a general linear approach. Human Brain Mapp 2:189-210
Frost JJ (1986) Measurement of neurotransmitter receptors by positron emission tomography: focus on the opiate recep-tor. NIDA Res Monogr 74:15-24
Frost JJ (2003) Molecular imaging of the brain: a historical perspective. Neuroimag Clin North Am 13:653-658
Frost JJ, Smith AC, Wagner HN Jr (1986) 3H-diprenorphine is selective for mu opiate receptors in vivo. Life Sci 38:1597-1606

32 G. Lucignani and J. J. Frost
Frost JJ, Mayberg HS, Fisher RS, Douglass KH, Dannals RF, Links JM, Wagner HN Jr (1988) Mu-opiate receptors mea-sured by positron emission tomography are increased in temporal lobe epilepsy. Ann Neurol 23:231-237
Frost JJ, Mayberg HS, Sadzot B, Dannals RF, Lever JR, Ravert HT, Wilson AA, Wagner HN Jr, Links JM (1990) Com-parison of [11C]carfentanil binding to opiate receptors in humans by positron emission tomography. J Cereb Blood Flow Metab 10:484-492
Frost JJ, Rosier AJ, Reich SG, Smith JS, Ehlers MD, Snyder SH, Ravert HT, Dannals RF (1993) Positron emission tomo-graphic imaging of the dopamine transporter with 11C-WIN 35,428 reveals marked declines in mild Parkinson’s disease. Ann Neurol 34:423-431
Geraghty JJ, Jankovic J, Zetusky WJ (1985) Association between essential tremor and Parkinson’s disease. Ann Neurol 17:329-333
Giobbe D, Castellano GC, Podio V (1993) Dopamine D2 recep-tor imaging with SPECT using IBZM in 16 patients with Parkinson’s disease. Ital J Neurol Sci 14:165-169
Giubilei F, Lenzi GL, di Piero V, Pozzilli C, Pantano P, Bastianello S, Argentino C, Fieschi C (1990) Predictive value of brain perfusion single-photon emission computed tomography in acute ischemic stroke. Stroke 21:895-900
Gjedde A, Wong DF (1990) Modeling neuroreceptor binding of radioligands in vivo. In: Frost JJ, Wagner HN Jr (eds) Quantitative imaging: neuroreceptors, neurotransmitters, and enzymes. Raven, New York, pp 51-79
Goldberg HI (1991) Extraaxial brain tumours. In: Atlas SW (ed) Magnetic resonance imaging of the brain and spine. Raven, New York, pp 327-377
Grünwald F, Durwen HF, Bockisch A, Hotze A, Kersjes W, Elger CE, Biersack HJ (1991) Technetium-99m-HMPAO brain SPECT in medically intractable temporal lobe epilepsy: a postoperative evaluation. J Nucl Med 32:388-394
Hagglund J, Aquilonius SM, Eckernas SA, Hartvig P, Lundquist H, Gullberg P, Langstrom B (1987) Dopamine receptor properties in Parkinson’s disease and Huntington’s chorea evaluated by positron tomography using 11C-N-methyl-spiperone. Acta Neurol Scand 75:87-94
Hajek M, Antonini A, Leonhard K, Wieser HG (1993) Mesio-basal versus lateral temporal lobe epilepsy: metabolic dif-ferences in the temporal lobe shown by interictal 18F-FDG positron emission tomography. Neurology 43:79-86
Halldin C, Stone-Elander S, Farde L, Ehrin E, Fasth KJ, Lang-strom B, Sedvall G (1986) Preparation of 11C-labelled SCH 23390 for the in vivo study of dopamine D-1 receptors using positron emission tomography. Appl Radiat Isot 37:1039-1043
Halldin C, Farde L, Barnett A, Sedvall G (1990) Preparation of [11C]SCH 39166, a new selective D1 dopamine receptor ligand for PET. J Nucl Med 31:737
Halldin C, Foged C, Chou YH, Karlsson P, Swahn CG, Sand-ell J et al (1998) Carbon-11-NNC 112: a radioligand for PET examination of striatal and neocortical D1-dopamine receptors. J Nucl Med 39:2061-2068
Hart J Jr., Lewis PJ, Lesser R, Fisher RS, Monsein LH, Schwerdt P, Bandeen-Roche K, Gordon B (1993) Anatomic correlates of memory from intracarotid amobarbital injections with technetium Tc-99m hexamethylpropyleneamine oxime SPECT. Arch Neurol 50:745-750
Hatazawa J, Ishiwata K, Itoh M, Kameyama M, Kubota K, Ido T, Matsuzawa T, Yoshimoto T, Watanuki S, Seo S (1989) Quan-
titative evaluation of L-[methyl-C-11] methionine uptake in tumor using positron emission tomography. J Nucl Med 30:1809-1813
Hatazawa J, Shimosegawa E, Okudera T, Inugami A, Ogawa T, Fujita H, Noguchi K, Kanno I, Miura S (1995) Evaluation of cerebral infarction with 123I-Iomazenil SPECT. J Nucl Med 36:2154-2161
Henry TR, Mazziotta JC, Engel J Jr, Christenson PD, Zhang JX, Phelps ME, Kuhl DE (1990) Quantifying interictal meta-bolic activity in human temporal lobe epilepsy. J Cereb Blood Flow Metab 10:748-757
Henry TR, Mazziotta JC, Engel J Jr (1992) The functional anat-omy of frontal lobe epilepsy studied with PET. In: Chauvel P, Delgado-Escueta A, Holgren E, Bancaud J (eds) Advances in neurology, vol 57. Raven, New York, pp 449-463
Herscovitch P, Markham J, Raichle ME (1983) Brain blood flow measured with intravenous H2
150. I. Theory and error analysis. J Nucl Med 24:782-789
Hicks BW, Rogers GA, Parsons SM (1991) Purification and characterization of a nonvesicular vesamicol-binding pro-tein from electric organ and demonstration of a related protein in mammalian brain. J Neurochem 57:509-519
Hietala S-O, Silfvenius H, Aasly J, Olivecrona M, Johnson L (1990) Brain perfusion with intracarotid injection of 99mTc-HM-PAO in partial epilepsy during amobarbital testing. Eur J Nucl Med 16:683-687
Hoedt-Rasmussen L, Sveinsdottir E, Lassen NA (1966) Regional cerebral blood flow in man determined by intra-arterial injection of radioactive inert gas. Circ Res 18:237-247
Hornykiewicz O, Kish SJ (1984) Neurochemical basis of dementia in Parkinson’s disease. Can J Neurol Sci 11 [Suppl 1]:185-190
Hornykiewicz O, Kish SJ (1986) Biochemical pathophysiology of Parkinson’s disease. Adv Neurol 45:19-34
Iinuma K, Yokoyama H, Otsuki T, Yanai K, Watanabe T, Ido T, Itoh M (1993) Histamine H1 receptors in complex partial seizures. Lancet 341:238
Ilgin N, Zubieta JK, Reich SG, Ravert TH, Dannals RF, Frost JJ (1995) Differential diagnosis of Parkinson’s disease and progressive supranuclear palsy with C11-WIN 35,248 PET imaging of the dopamine transporter. J Nucl Med 36:99
Ingvar DH, Lassen NA (1961) Quantitative determination of regional cerebral blood flow in man. Lancet 2:806-807
Innis RB, al-Tikriti MS, Zoghbi S, Baldwin RM, Sybirska EH, Laruelle MA, Malison RT, Seiby JP, Zimmermann RC, Johnson EW (1991) SPECT imaging of the benzodiazepine receptor: feasibility of in vivo potency measurements from stepwise displacement curves. J Nucl Med 32:1754-1761
Irie T, Fukushi K, Namba H, Iyo M, Tamagami H, Nagatsuka S et al (1996) Brain acetylcholinesterase activity: validation of a PET tracer in a rat model of Alzheimer’s disease. J Nucl Med 37:649-655
Iyo M, Namba H, Fukushi K, Shinotoh H, Nagatsuka S, Suhara T, Nagatsuka S, Sumara T, Sudo Y, Suzuki K, Irie T (1997) Measurement of acetylcholinesterase by positron emission tomography in the brains of healthy controls and patients with Alzheimer’s disease. Lancet 349:1805-1809
Jeffery PJ, Monsein LH, Szabo A, Hart JH, Fisher FS, Lesser RP, Debrun GM, Gordon B, Wagner HN Jr, Camargo EE (1991) Mapping the distribution of amobarbital sodium in the intracarotid Wada test by use of Tc-99m HMPAO with SPECT. Radiology 178:847-850
Jones AK, Luthra SK, Maziere B, Pike VW, Loc’h C, Crouzel C,

Neurochemical Imaging with Emission Tomography: Clinical Applications 33
Syrota A, Jones T (1988) Regional cerebral opioid recep-tor studies with [11C]diprenorphine in normal volunteers. J Neurosci Methods 2:121-129
Jorgensen HS, Sperling B, Nakayama H, Raaschow HO, Olsen TS (1994) Spontaneous reperfusion of cerebral infarcts in acute stroke patients. Incidence, time course and clini-cal outcome: the Copenhagen Stroke study. Arch Neurol 57:865-873
Kamo H, McGeer PL, Harrop R, McGeer EG, Calne DB, Martin WR, Pate BD (1987) Positron emission tomography and histopathology in Pick’s disease. Neurology 37:439-445
Kanno I, Lassen NA (1979) Two methods for calculation of regional cerebral blood flow from emission computed tomography of emission tomography of inert gas concen-tration. J Comput Assist Tomogr 3:71-76
Kaplan WD, Takvorian T, Morris JH, Rumbaugh CL, Connolly BT, Atkins HL (1987) Thallium-201 brain tumor imaging: a comparative study with pathologic correlation. J Nucl Med 28:47-52
Kilbourn MR, Jung YW, Haka MS, Gildersleeve DL, Kuhl DE, Wieland DM (1990) Mouse brain distribution of a carbon-11 labeled vesamicol derivative: presynaptic marker of cholinergic neurons. Life Sci 47:1955-1963
Kilbourn MR, Snyder SE, Sherman PS, Kuhl DE (1996) In vivo studies of acetylcholinesterase activity using a labeled sub-strate, N-[11C]methylpiperdin-4-yl propionate ([11C]PMP). Synapse 22:123-131
Kim KT, Black KL, Marciano D, Mazziotta JC, Guze BH, Grafton S, Hawkins RA, and Becker DP. (1990) Thallium-201 SPECT imaging of brain tumors: methods and results. J Nucl Med 31:965-969
Koepp MJ, Labbe C, Richardson MP, Brooks DJ, van Paess-chen W, Cunningham VJ, Duncan JS (1997a) Regional hip-pocampal [11C]flumazenil PET in temporal lobe epilepsy with unilateral and bilateral hippocampal sclerosis. Brain 120:1865-1876
Koepp MJ, Richardson MP, Brooks DJ, Cunningham VJ, Duncan JS (1997b) Central benzodiazepine/gamma-ami-nobutyric acid A receptors in idiopathic generalized epi-lepsy: an [11C]flumazenil positron emission tomography study. Epilepsia 38:1089-1097
Koepp MJ, Richardson MP, Brooks DJ, Duncan JS (1998) Focal cortical release of endogenous opioids during reading-induced seizures. Lancet 352:952-955
Koeppe RA, Frey KA, Mulholland GK, Kilbourn MR, Buck A, Lee KS, Kuhl DE (1994) [11C]tropanyl benzilate-binding to muscarinic cholinergic receptors: Methodology and kinetic modeling alternatives. J Cereb Blood Flow Metab 14:85-99
Krausz Y, Cohen D, Konstantini S, Meiner Z, Yaffe S, Atlan H (1991) Brain SPECT imaging in temporal lobe epilepsy. Neuroradiology 33:274-276
Krenning EP, Kwekkeboom DJ, Bakker WH, Breman WAP, Kooij PPM, Oei HJ, wan Haen M, Postema PTE, de Jong M, Reubi JC, Visser TJ, Reijs AEM, Hofland LJ, Koper JW, Lamberts SWJ (1993) Somatostatin receptor scintigraphy with 111In-DTPA-D-Phe and 123I-Tyr3-octeotride: the Rot-terdam experience in more than 1000 patients. Eur J Nucl Med 20:716-731
Kuhl DE, Engel J Jr, Phelps ME, Selin C (1980) Epileptic pat-terns of local cerebral metabolism and perfusion in humans determined by emission computed tomography of 18FDG and 13NH3. Ann Neurol 8:348-360
Kuhl DE, Metter EJ, Riege WH (1984) Patterns of local cerebral
glucose utilisation determined in Parkinson’s disease by the 18F-fluorodeoxyglucose method. Ann Neurol 15:419-424
Kuhl DE, Koeppe RA, Fessler JA, Minoshima S, Ackermann RJ, Carey JE, Glidersleeve DL, Frey KA, Wieland DM (1994) In vivo mapping of cholinergic neurons in the human brain using SPECT and IBVM. J Nucl Med 35:405-410
Kuhl DE, Minoshima S, Fessler JA, Frey KA, Foster NL, Ficaro EP, Wieland DM, Koeppe RA (1996) In vivo mapping of cholinergic terminals in normal aging, Alzheimer’s disease, and Parkinson’s disease. Ann Neurol 40:339-410
Kuhl DE, Koeppe RA, Minoshima S, Snyder SE, Ficaro EP, Foster NL et al (1999) In vivo mapping of cerebral ace-tylcholinesterase activity in aging and Alzheimer’s disease. Neurology 52:691-699
Kung HF, Kasliwal R, Pan SG, Kung MP, Mach RH, Guo YZ (1988) Dopamine D-2 receptor imaging radiopharma-ceuticals: synthesis, radiolabeling, and in vitro binding of (R)-(+)- and (S)-(-)-3-iodo-2-hydroxy-6-methoxy-N- [(1-ethyl-2-pyrrolidinyl)methyl]benzamide. J Med Chem 31:1039-1043
Kung HF, Alavi A, Chang W, Kung MP, Keyes JW Jr, Velchik MG, Billings J, Pan S, Noto R, Rausch et al (1990) In vivo SPECT imaging of CNS D-2 dopamine receptors: initial studies with iodine-123-IBZM in humans. J Nucl Med 31:573-579
Kung MP, Stevenson DA, Plossl K, Meegalla SK, Beckwith A, Essman WD, Mu M, Lucki I, Kung HF (1997) [99mTc] TRODAT-1: a novel technetium-99m complex as a dopa-mine transporter imaging agent. Eur J Nucl Med 24:372-380
Lamusuo S, Ruottinen HM, Knuuti J, Harkonen R, Ruots-alainen U, Bergman J, Haaparanta M, Solin O, Mervaala E, Nousiainen U, Jaaskelainen S, Ylinen A, Kalviainen R, Rinne JK, Vapalahti M, Rinne JO (1997) Comparison of [18F]FDG-PET, [99mTc]-HMPAO-SPECT, and [123I]-ioma-zenil-SPECT in localising the epileptogenic cortex. J Neurol Neurosurg Psychiatry 63:743-748
Lang W, Podreka I, Suess E, Müller C, Zeitlhofer J, Deecke L (1988) Single photon emission computerized tomography during and between seizures. J Neurol 235:277-284
Langen K (1997) Evaluation of 123-I-a-L-methyltyrosine as a SPECT tracer of amino acid uptake in brain tumours. In: De Deyn PP, Dierckx RA, Alavi A, Pickut BA (eds) SPECT in neurology and psychiatry. Libbey, London, pp 387-405
Lassen NA (1966) The luxury-perfusion syndrome and its pos-sible relation to acute metabolic acidosis localized within the brain. Lancet 2:1113-1115
Lee BI, Markand ON, Siddiqui AR, Park HM, Mock B, Wellman HH, Worth RM, Edwards MK (1986) Single photon emis-sion computed tomography (SPECT) brain imaging using N,N,N’-trimethyl-N’-(2 hydroxy-3-methyl-5-123I-iodo-benzil)-1,3-propanediamine 2 HCl (HIPDM): Intractable complex partial seizures. Neurology 36:1471-1477
Lee BI, Markand ON, Wellman HN, Siddiqui AR, Mock B, Krepshaw J, Kung H (1987) HIPDM single photon emis-sion computed tomography brain imaging in partial onset secondarily generalized tonic-clonic seizures. Epilepsia 28:305-311
Lee BI, Markand ON, Wellman HN, Siddiqui AR, Park HM, Mock B, Worth RM, Edwards MK, Krepshaw J (1988) HIPDM-SPECT in patients with medically intractable com-plex partial seizures. Arch Neurol 45:397-402
Lee KS, Frey KA, Koeppe RA, Buck A, Mulholland GK, Kuhl DE (1996) In vivo quantification of cerebral muscarinic

34 G. Lucignani and J. J. Frost
receptors in normal human aging using positron emission tomography and [11C]tropanyl benzilate. J Cereb Blood Flow Metab 16:303-310
Lee CS, Samii A, Sossi V, Ruth TJ, Schulzer M, Holden JE et al (2000) In vivo positron emission tomographic evidence for compensatory changes in presynaptic dopaminergic nerve terminals in Parkinson’s disease. Ann Neurol 47:493-503
Leenders KL, Aquilonius SM, Bergstrom K, Bjurling P, Cross-man AR, Eckernas SA, Gee AG, Hartuing P, Lundtquist H, Langstrom B (1988) Unilateral MPTP lesion in a rhesus monkey: effects on the striatal dopaminergic system mea-sured in vivo with PET using various novel tracers. Brain Res 445:61-67
Lenzi GL, Frackowiak RSJ, Jones T (1982) Cerebral oxygen metabolism and blood flow in human cerebral ischemic infarction. J Cereb Blood Flow Metab 2:321-325
Leveille J, Demonceau G, Walovitch RC (1992) Intrasubject comparison between technetium-99m-ECD and techne-tium-99m-HMPAO in healthy human subjects. J Nucl Med 33:480-484
Lever JR, Scheffel U, Stathis M, Seltzman HH, Wyrick CD, Abra-ham P, Parkam K, Thomas BF, Boja JW, Fuhar MJ, Carroll FI (1996) Synthesis and in vivo studies of a selective ligand for the dopamine transporter: 3 beta-[4-(125I)iodophenyl] tropan-2 beta-carboxylic acid isopropyl ester [(125I)RTI-121]. J Nucl Med Biol 23:277-284
Limburg M, Royen EAV, Hijdra A, Verbeeten B Jr (1991) rCBF-SPECT in brain infarction: When does it predict outcome. J Nucl Med 3:382-387
Lucignani G, Losa M, Moresco RM, del Sole A, Matarrese M, Bettinardi V, Mortini P, Giovanelli M, Fazio F (1997) Differ-entiation of clinically non-functioning pituitary adenomas from meningiomas and craniopharyngiomas by positron emission tomography with [18F]fluoro-ethyl-spiperone. Eur J Nucl Med 24:1149-1155
Lundkvist C, Halldin C, Ginovart N, Nyberg S, Swahn CG, Carr AA, Brunner F, Farde L (1996) [11C]MDL 100907, a radio-ligand for selective imaging of 5-HT(2A) receptors with positron emission tomography. Life Sci 58:PL 187-192
Madar I, Lever JR, Kinter CM, Scheffel U, Ravert HT, Musa-chio JL, Mathews WB, Dannals RF, Frost JJ (1996) Imag-ing of delta opioid receptors in human brain by N1’- ([11C]methyl)naltrindole and PET. Synapse 24:19-28
Madar I, Lesser RP, Krauss G, Zubieta JK, Lever JR, Kinter CM, Ravert HT, Musachio JL, Mathews WB, Dannals RF, Frost JJ (1997) Imaging of delta- and mu-opioid receptors in tem-poral lobe epilepsy by positron emission tomography. Ann Neurol 41:358-367
Maffioli L, Gasparini M, Chiti A, Gramaglia A, Mongoj V, Pozzi A, Bombardieri E (1996) Clinical role of thechnetium-99m sestamibi single-photon emission tomography in evaluat-ing pretreated patients with brain tumours. Eur J Nucl Med 23:308-311
Magistretti PL, Uren RF (1983) Cerebral blood flow patterns in epilepsy. In: Nistico G, DiPerri R, Meinardi H (eds) Epi-lepsy: an update on research and therapy. Liss, New York, pp 241-247
Marek KL, Seibyl JP, Zoghbi SS, Zea-Ponce Y, Baldwin RM, Fus-sell B, Charney DS, van Dyck C, Hoffer PB, Innis RP (1996) [123I] beta-CIT-SPECT imaging demonstrates bilateral loss of dopamine transporters in hemi-Parkinson’s disease. Neurology 46:231-237
Markand ON, Salanova V, Worth R, Park HM, Wellman HN
(1997) Comparative study of interictal PET and ictal SPECT in complex partial seizures. Acta Neurol Scand 95:129-136
Marks DA, Katz Am Hoffer P, Spencer SS (1992) Localization of extratemporal epileptic foci during ictal single photon emission computed tomography. Ann Neurol 31:250-255
Martin WRW, Stoessl AJ, Palmer M, Adam MJ, Ruth TJ, Gri-erson JR et al (1988) Positron emission tomography in Parkinson’s disease: glucose and dopa metabolism. Adv Neurol 50:223-229
Martin WR, Palmer MR, Patlak CS, Calne DB (1989) Nigros-triatal function in humans studied with positron emission tomography. Ann Neurol 26:535-542
Mason NS, Mathis CA (2003) Positron emission tomography radiochemistry. Neuroimag Clin North Am 13:671-687
Mathis CA, Mahmood K, Huang Y, Simpson NR, Gerdes JM, Price JC (1996) Synthesis and preliminary in vivo evalua-tion of [11C]MDL 100907: a potent and selective radioligand for the 5–HT2A receptor system. Med Chem Res 6:1–10
Mayberg HS, Sadzot B, Meltzer CC, Fisher RS, Lesser RP, Dan-nals RF, Lever JR, Wilson AA, Ravert HT, Wagner HN Jr, Bryan RN, Cromwell CC, Frost JJ (1991) Quantification of mu and non-mu opiate receptors in temporal lobe epilepsy using positron emission tomography. Ann Neurol 30:3-11
Messa C, Perani D, Lucignani G, Zenorini A, Zito F, Rizzo G, Grassi F, del Sole A, Franeschi M, Gilardi MC, Fazio F (1994) High resolution SPET/ [99mTc]HM-PAO in patients with probable Alzheimer’s disease: comparison with PET/[18F]FDG. J Nucl Med 35:210-216
Messa C, Volonté MA, Fazio F, Zito F, Carpinelli A, d’Amico A, Rizzo G, Moresco RM, Paulesu E, Franceschi M, Lucignani G (1998) Differential distribution of striatal [123I]βCIT in Parkinson’s disease and progressive supranuclear palsy, evaluated with SPET. Eur J Nucl Med 25:1270-1276
Meyer M, Koeppe A, Frey KA, Foster NL, Kuhl DE (1995) Posi-tron emission tomography measures of benzodiazepine binding in Alzheimer’s disease. Arch Neurol 52:314-317
Miletich RS, Chan T, Gillespie M et al (1988) Contralateral basal ganglia metabolism in abnormal in hemiparkinso-nian patients. An FDG-PET study. Neurology 38:S260
Miller BL, Darby A, Benson DF, Cummings JL, Miller MH (1997) Aggressive, socially disruptive and antisocial behav-iour associated with fronto-temporal dementia. Br J Psy-chiatry 170:150-154
Minoshima S, Frey KA, Koeppe RA, Foster NL, Kuhl DE (1995) A diagnostic approach in Alzheimer’s disease using three-dimensional stereotactic surface projections of fluorine-18FDG PET. J Nucl Med 36:1238-1248
Mueller-Gaertner HW, Mayberg HS, Fisher RS, Lesser RP, Wilson AA, Ravert HT, Dannals RF, Wagner HN, Uematsu S, Frost JJ (1993) Decreased hippocampal muscarinic cholin-ergic receptor binding measured by 123I-iododexetimide and SPECT in epilepsy. Ann Neurol 34:235-238
Muhr C, Bergstrom M, Lundberg PO, Bergstrom K, Hartv-ing P, Lundqvist H, Antoni G, Langstom B (1986) Dopa-mine receptors in pituitary adenomas: PET visualization with (11C)-N-methyl-spiperone. J Comput Assist Tomogr 10:175-180
Mulholland GK, Otto CA, Jewett DM, Kilbourn MR, Koeppe RA, Sherman PS, Petry NA, Carey JE, Atkinson ER, Archer S, Frey KA, Kuhl DE (1992) Synthesis, rodent biodistribution, dosimetry, metabolism, and monkey images of carbon-11 labeled (+)-2a-tropanyl benzilate: a central muscarinic receptor imaging agent. J Nucl Med 33:423-430
Neurochemical Imaging with Emission Tomography: Clinical Applications 35
Mulholland GK, Kilbourn MR, Sherman P, Carey JE, Frey KA, Koeppe RA, Kuhl DE (1995) Synthesis, in vivo biodistri-bution and dosimetry of [11C]N-methylpiperidyl benzilate ([11C]NMPB), a muscarinic acetylcholine receptor antago-nist. Nucl Med Biol 22:13-17
Nadeau SE, Couch MW, Devane CL, Shukla SS (1995) Regional analysis of D2 dopamine receptors in Parkinson’s disease using SPECT and iodine-123-iodobenzamide. J Nucl Med 36:384-393
Nahmias C, Garnett ES, Firnau G, Long A (1985) Striatal dopa-mine distribution in parkinsonian patients during life. J Neurol Sci 69:223-230
Namba H, Irie T, Fukushi K, Iyo M (1994) In vivo measurement of acetylcholinesterase activity in the brain with a radioac-tive acetylcholine analog. Brain Res 667:278-282
Neumeyer JL, Wang S, Milius RA, Baldwin RM, Zea Ponce Y, Hoffer PB, Sybirska E, al Tikriti M, Charney DS, Mali-son RT (1991) Iodine-123-2-β-carboxymethoxy -3-β-(4-iodophenyl)tropane (βCIT): high affinity SPECT radio-tracer of monoamine reuptake sites in brain. J Med Chem 34:3144-3146
Newton MR, Berkovic SF, Austin MC, Reutens DC, McKay WJ, Bladin PF (1992) Dystonia, clinical lateralization, and regional blood flow changes in temporal lobe seizures. Neurology 42:371-377
O'Brien TJ, Zupanc ML, Mullan BP, O'Connor MK, Brinkmann BH, Cicora KM, So EL (1998) The practical utility of per-forming peri-ictal SPECT in the evaluation of children with partial epilepsy. Pediatr Neurol 19:15-22
Obrist WD, Thompson HK Jr, Wang KS, Wilkinson WE (1975) Regional cerebral blood flow estimated by 133-Xenon inha-lation. Stroke 6:245-256
Otsuka M, Ichiya Y, Hosokawa S (1991) Striatal blood flow, glucose metabolism, and 18F-dopa uptake: difference in Parkinson’s disease and atypical parkinsonism. J Neurol Neurosurg Psychiatry 54:898-904
Patlak C, Blasberg R, Fenstermacher J (1985) Graphical evalu-ation of blood-to-brain transfer constants from multiple-time uptake data. Generalizations. J Cereb Blood Flow Metab 5:584-590
Perlmutter JS, Raichle ME (1985) Regional blood flow in hemiparkinsonism. Neurology 35:1127-1134
Persson A, Ehrin E, Eriksson L, Farde L, Hedstrom CG, Litton JE, Mindus P, Sedvall G (1985) Imaging of [11C]-labelled Ro 15-1788 binding to benzodiazepine receptors in the human brain by positron emission tomography. J Psychiatr Res 19:609-622
Phelps ME, Huang SC, Hoffman EJ, Selin C, Sokoloff L, Kuhl DE (1979) Tomographic measurement of local cerebral glucose metabolic rate in humans with (F-18)2-fluoro-2-deoxy-d-glucose: validation of method. Ann Neurol 6:371-388
Podruchny TA, Connolly C, Bokde A, Herscovitch P, Eckel-man WC, Kiesewetter DO et al (2003) In vivo muscarinic 2 receptor imaging in cognitively normal young and older volunteers. Synapse 48:39-44
Pirker W, Riedl M, Luger A, Czech T, Rossler K, Asenbaum S, Angelberger P, Kornhuber J, Deecke L, Podreka I, Brucke T (1996) Dopamine D2 receptor imaging in pituitary adeno-mas using iodine-123-epidepride and SPECT. J Nucl Med 37:1931-1937
Price JC (2003) Principles of tracer kinetic analysis. Neuro-imag Clin North Am 13:689-704
Ramsey SC, McLaughlin AF, Greenough R, Walsh J, Morris JG
(1992) Comparison of independent aura, ictal and interic-tal cerebral perfusion. J Nucl Med 33:438-440
Reivich M, Kuhl D, Wolf A, Greenberg J, Phelps M, Ido T, Casella V, Fowler J, Hoffman E, Alavia A, Som P, Sokoloff L (1979) The 18F-Fluoro-deoxyglucosemethod for the mea-surement of local cerebral glucose utilization in man. Circ Res 44:127-137
Ricci M, Pantano P, Pieralini A, di Stefano D, Santoro A, Bozzao L, Lenzi GL (1996) Relationship between thallium-201 uptake by supratentorial glioblastomas and their morpho-logical characteristics on magnetic resonance imaging. Eur J Nucl Med 23:524-529
Richardson MP, Friston KJ, Sisodiya SM, Koepp MJ, Ashburner J, Free SL, Brooks DJ, Duncan JS (1997) Cortical grey matter and benzodiazepine receptors in malformations of cortical development. A voxel-based comparison of structural and functional imaging data. Brain 120:1961-1973
Richardson MP, Koepp MJ, Brooks DJ, Duncan JS (1998) 11C-flumazenil PET in neocortical epilepsy. Neurology 51:485-492
Rinne JO, Laihinen A, Nagren K, Bergman J, Ruotsalainen U, Rinne UK (1990) PET demonstrates different behaviour of striatal dopamine D-1 and D-2 receptors in early Parkin-son’s disease. J Neurosci Res 27:494-499
Risinger MW, Engel J Jr, van Ness PL, Henry TR (1989) Ictal localization of temporal lobe seizures with scalp/sphenoi-dal recordings. Neurology 39:1288-1293
Robitaille Y, Rasmussen T, Dubeau, Tampieri D, Kemball K (1992) Histopathology of non-neoplastic lesions in frontal lobe epilepsy. Review of 180 cases with recent MRI and PET correlations. In: Chauvel P, Delgado-Escueta A, Holgren E, Bancaud J (eds) Advances in neurology, vol 57. Raven, New York, pp 499-513
Rowe CC, Berkovic SF, Sia STB, Austin M, McKay WJ, Kalnins RM, Bladin PF (1989) Localization of epileptic foci with postictal single photon emission computed tomography. Ann Neurol 26:660-668
Rowe CC, Berkovic SF, Austin MC, McKay WJ, Bladin PF (1991a) Patterns of postictal cerebral blood flow in tem-poral lobe epilepsy: qualitative and quantitative analysis. Neurology 41:1096-1103
Rowe CC, Berkovic SF, Austin MC, Saling M, Kalnins RM, McKay WJ, Bladin PF (1991b) Visual and quantitative anal-ysis of interictal SPECT with technetium-99m-HMPAO in temporal lobe epilepsy. J Nucl Med 32:1688-1694
Ryding E, Rosen I, Elmqvist B, Ingvar DH (1988) SPECT mea-surements with 99mTc-HMPAO in focal epilepsy. J Cereb Blood Flow Metab 8:S95-S100
Ryvlin P, Garcia-Larrea L, Philippon B, Froment JC, Fischer C, Revol M, Mauguière F (1992) High signal intensity on T2-weighted MRI correlates with hypoperfusion in temporal lobe epilepsy. Epilepsia 33:28-35
Sabatini U, Celsis P, Viallard G, Rascol A, Marc Vergnes JP (1991) Quantitative assessment of cerebral blood volume by single-photon emission computed tomography. Stroke 22:324-330
Sackellares JC, Siegel GJ, Abou-Khalil BW, Hood TW, Gilman S, McKeever PE, Hichwa RD, Hutchins GD (1990) Differ-ences between lateral and mesial temporal metabolism interictally in epilepsy of mesial temporal origin. Neurol-ogy 40:1420-1426
Salanova V, Markand O, Worth R, Smith R, Wellman H, Hutchins G, Park H, Ghetti B, Azzarelli B (1998) FDG-PET

36 G. Lucignani and J. J. Frost
and MRI in temporal lobe epilepsy: relationship to febrile seizures, hippocampal sclerosis and outcome. Acta Neurol Scand 97:146-153
Samson Y, Hantraye P, Baron JC, Soussaline F, Comar D, Maz-iere M (1985) Kinetics and displacement of 11C-Ro 15=1788, a benzodiazepine antagonist, studied in human brain in vivo by positron emission tomography. Eur J Pharmacol 110:247-251
Sanabria E, Chauvel P, Askienazy S, Vignal JP, Trottier S, Chod-kiewicz JP, Bancaud J (1983) Single photon emission com-puted tomography (SPECT) using 123I-isopropyl-iodo-amphetamine (IAMP) in partial epilepsy. In: Baldy-Mouli-nier M, Ingar D-H, Meldrum BS (eds) Current problems in epilepsy. vol 1. Cerebral blood flow, metabolism and epilepsy. Libbey, London, pp 82-87
Savic I, Persson A, Roland P, Pauli S, Sedvall G, Widen L (1988) In-vivo demonstration of reduced benzodiazepine recep-tor binding in human epileptic foci. Lancet 2:863-866
Savic I, Widen L, Thorell JO, Blomqvist G, Ericson K, Roland P (1990) Cortical benzodiazepine receptor binding in patients with generalized and partial epilepsy. Epilepsia 31:724-730
Savic I, Ingvar M, Stone-Elander S (1993) Comparison of [11C]flumazenil and [18F]FDG as PET markers of epileptic foci. J Neurol Neurosurg Psychiatry 56:615-621
Savic I, Blomqvist G, Halldin C, Litton JE, Gulyas B (1998) Regional increases in [11C]flumazenil binding after epi-lepsy surgery. Acta Neurol Scand 97:279-286
Scheffel U, Dannals RF, Wong DF, Yokoi F, Carroll FI, Kuhar MJ (1992) Dopamine transporter imaging with novel, selective cocaine analogs. Neuroreport 3:969-972
Scheffel U, Horti AG, Koren AO, Ravert HT, Banta JP, Finley PA et al( 2000) 6-[18F]Fluoro-A-85380: an in vivo tracer for the nicotinic acetylcholine receptor. Nucl Med Biol 27:51-56
Schwarz J, Antonini A, Tatsch K, Kirsch CM, Oertel WH, Leen-ders KL (1994) Comparison of 123I-IBZM SPECT and 11C-raclopride PET findings in patients with parkinsonism. Nucl Med Commun 15:806-813
Seibyl J, Wallace, Smith E et al (1994) Whole body biodistribu-tion, radiation absorbed dose, and brain SPECT imaging with [123I]β-CIT in healthy human subjects. J Nucl Med 35:764-770
Serrati C, Marchal G, Rioux P, Viader F, Petit Taboue MC, Lochon P, Luet D, Derlon JM, Baron JC (1994) Contralat-eral cerebellar hypometabolism: a predictor for stroke out-come? J Neurol Neurosurg Psychiatry 57:174-179
Shinotoh H, Yamasaki T, Inoue O, Itoh T, Suzuki K, Hashimoto K, Tateno Y, Ikehira H (1986) Visualization of specific bind-ing sites of benzodiazepine in human brain. J Nucl Med 27:1593-1599
Shoghi-Jadid K, Small GW, Agdeppa ED, Kepe V, Ercoli LM, Siddarth P, Read S, Satyamurthy N, Petric A, Huang SC, Barrio JR (2002) Localization of neurofibrillary tangles and beta-amyloid plaques in the brains of living patients with Alzheimer disease. Am J Geriatr Psychiatry 10:24-35
Shulkin BL (1997) PET applications in pediatrics (review) (20 refs). Q J Nucl Med 41:281-291
Siegel GJ, Agranoff BW, Wayne Albers R, Fisher SK, Uhler MD (1999) Basic Neurochemistry. Molecular, cellular and medi-cal aspects, 6th edn. Lippincott-Raven, Philadelphia
Sokoloff L (1960) The metabolism of the central nervous system in vivo. In: Field J, Magoun HW, Hall VE (eds) Handbook of physiology-neurophysiology, vol 3. American Physiological Society, Washington DC, pp 1843-1864
Soler C, Beauchesne P, Maatougui K, Schmitt T, Barral FG, Michel D, Dubois F, Brunon J (1998) Technetium-99m sestamibi brain single-photon emission tomography for detection of recurrent gliomas after radiation therapy. Eur J Nucl Med 25:1649-1657
Soucy JP, McNamara D, Mohr G, Lamoureux F, Lamoureux J, Danais S (1990) Evaluation of vasospasm secondary to sub-arachnoid hemorrhage with technetium-99m-hexameth-ylpropyleneamine oxime (HM-PAO) tomoscintigraphy. J Nucl Med 31:972-977
Stefan H, Kuhnen C, Biersack HJ, Reichmann K (1987) Ini-tial experience with 99mTc hexamethyl-propylene amine oxime (HM-PAO) single photon emission computed tomography (SPECT) in patients with focal epilepsy. Epi-lepsy Res 1:134-138
Stefan H, Pawlik G, Böcher-Schwarz HG, Biersack HJ, Burr W, Penin H, Heiss W-D (1987) Functional and morphological abnormalities in temporal lobe epilepsy: a comparison of interictal and ictal EEG, CT, MRI, SPECT and PET. J Neurol 234:377-384
Swartz BE, Halgren E, Delgado-Escueta AV, Mandelkern M, Gee M, Quinones N, Blahd WH, Repchan J (1989) Neuro-imaging in patients with seizures of probable frontal lobe origin. Epilepsia 30:547-558
Swartz BE, Theodore WH, Sanabria E, Fisher RS (1992a) Posi-tron emission and single photon emission computed tomo-graphic studies in the frontal lobe with emphasis on the relationship to seizure foci. In: Chauvel P, Delgado-Escueta A, Holgren E, Bancaud J (eds) Advances in neurology, vol 57. Raven, New York, pp 487-497
Theodore WH, Newmark ME, Sato S, de LaPaz R, DiChiro G, Brooks R, Patronas N, Kessler RM, Manning R, Margolin R, Channing M, Porter RJ (1984) 18F-fluorodoxyglucose posi-tron emission tomography in refractory complex partial seizures. Ann Neurol 14:429-437
Theodore WH, Fishbein D, Dubinsky R (1988) Patterns of cere-bral glucose metabolism in patients with partial seizures. Neurology 38:1201-1206
Thomas P, Migneco O, Darcourt J, Chatel M (1992) Single photon emission computed tomography study of subclini-cal rhythmic electrographic discharge in adults. Electroen-cephalogr Clin Neurophysiol 83:223-227
Uhl GR, Hedreen JC, Price DL (1985) Parkinson’s disease: loss of neurons from the ventral tegmental area contralateral to therapeutic surgical lesions. Neurology 35:1215-1218
Van Royen E, Verhoeff NF, Speelman JD, Wolters EC, Kuiper MA, Janssen AG (1993) Multiple system atrophy and progressive supranuclear palsy. Diminished striatal D2 dopamine recep-tor activity demonstrated by 123I-IBZM single photon emis-sion computed tomography. Arch Neurol 50:513-516
Vorstrup S, Brun B, Lassen NA (1986) Evaluation of the cere-bral vasodilatory capacity by the acetazolamide test before EC-IC bypass surgery in patients with occlusions of the internal carotid artery. Stroke 17:1291-1298
Wagner HNJ, Burns HD, Dannals RF, Wong DF, Langstrom B, Duelfer T, Frost JJ, Ravert HT, Links JM, Rosenbloom SB, Lukas SE, Kramer AV, Kuhar MJ (1983) Imaging dopamine receptors in the human brain by positron emission tomog-raphy. Science 221:1264-1266
Wise RJS, Bernardi S, Frackowiak RSJ, Legg NJ, Jones T (1983) Serial observations on the pathophysiology of acute stroke: the transition from ischemia to infarction as reflected in regional oxygen extraction. Brain 106:197-222

Neurochemical Imaging with Emission Tomography: Clinical Applications 37
Wolfson LI, Leenders KL, Brown LL, Jones T (1985) Alterations of regional cerebral blood flow and oxygen metabolism in Parkinson’s disease. Neurology 35:1399-1405
Yamamoto YL, Ochs R, Gloor P, Ammann W, Meyer E, Evans AC, Cooke B, Sako K, Gotman J, Feindel WH, Diksic M, Thompson CJ, Robitaille Y (1983) Patterns of rCBF and focal energy metabolic changes in relation to electroen-cephalographic abnormality in the interictal phase of par-
tial epilepsy. In: Baldy-Moulinier M, Ingvar D-H, Meldrum BS (eds) Current problems in epilepsy, vol 1. Cerebral blood flow, metabolism and epilepsy. Libbey, London, pp 51-62
Zubieta JK, Frey KA, Koeppe RA, Kilbourn MR, Mulholland GK, Foster NL et al (1994) Muscarinic receptor binding in aging and Alzheimer’s disease determined with [11C]n-methyl-4-piperidyl benzilate and PE. J Nucl Med 35 [Suppl 5]:20P