
Deconvolution-free Subcellular Imaging with Axially Swept Light Sheet Microscopy

JAAS
PAPER
Publ
ishe
d on
23
Dec
embe
r 20
14. D
ownl
oade
d by
Uni
vers
idad
e Fe
dera
l do
Rio
Gra
nde
do S
ul o
n 15
/01/
2015
10:
20:5
9. View Article Online
View Journal
Effect of N2 on t
Institute of Chemistry, Federal University of
9500, 91501-970 Porto Alegre, RS, Brazil. E
3308 7304; Tel: +55 51 3308 7215
Cite this: DOI: 10.1039/c4ja00431k
Received 14th November 2014Accepted 22nd December 2014
DOI: 10.1039/c4ja00431k
www.rsc.org/jaas
This journal is © The Royal Society of
he emission profile and excitationtemperature in axially viewed plasma-ICP OES
Guilherme Luiz Scheffler and Dirce Pozebon*
Fundamental studies were conducted in order to gain useful insights about energy transfer that takes place
when a low flow (20 mL min�1) of N2 is introduced into the central channel of the Ar-ICP in inductively
coupled plasma optical emission spectrometry (ICP OES). Axial and radial emission profiles of Mg(I), Mg(II)
and Ar(I) were collected along and across the central channels of both Ar-ICP and Ar–N2-ICP. Axial
profiles indicated a more energetic plasma close and above the load coil when N2 was added. On the
other hand, radial profiles suggested a wider and more uniform central channel with the N2 flow addition.
By computing the plasma robustness (Mg(II)/Mg(I) ratio) across the central ICP channel, a low (and uniform)
energy coupling was found between the bulk plasma and the central channel of the Ar-ICP, which was
significantly improved by adding N2. The results obtained also suggested that N2 plays an important role
locally, but does not in the outer regions of the ICP, which in turn denoted an unlikely N2 diffusion. The
better excitation conditions caused by N2 were confirmed by measuring the excitation temperature in the
central channel of the ICP, using a set of Fe ionic lines, where the excitation temperature increased from
7480 K to 7910 K. The effectiveness of the improved plasma robustness was evaluated for diluted
seawater and the results demonstrated that the analyte signal suppression induced by the concomitants
was reduced. Accuracy was accessed by analyzing certified reference samples (water and sediment),
whereas good agreement among the concentrations found and those certified were observed. These
results indicated the absence of spectral interferences caused by N2. The estimated detection limits for
both Ar-ICP and Ar–N2-ICP were fairly comparable, revealing that the mixed-gas plasma is a robust
source for trace elements determination using axially viewed-ICP OES. It was concluded that addition of a
low flow of N2 is a simple way to increase plasma robustness without sacrificing analyte sensitivity.
Introduction
The inductively coupled plasma of Ar (Ar-ICP) has beensuccessfully applied as an efficient desolvation, vaporization,excitation and/or ionization source in ICP-spectrometry. Thisacceptance relies on the advantages of the Ar-ICP, such as high-temperature, inert environment, reduced chemical interfer-ences, high energy for ionization, high excitation temperatureand electron density. These good features justify the popular useof Ar in inductively coupled plasma optical emission spectrom-etry (ICP OES) and inductively coupled plasma mass spectrom-etry (ICP-MS) techniques. However, the widespread applicationof these techniques has shown limitations with respect to bothspectroscopic and non-spectroscopic interferences.
Therefore, in an attempt to reduce such interferences andimprove plasma characteristics in ICP-spectrometry, othergases with chemical and physical properties different fromthose of Ar have been investigated, particularly N2. Mixed-gas
Rio Grande do Sul, Av. Bento Gonçalves,
-mail: [email protected]; Fax: +55 51
Chemistry 2015
plasmas like Ar–N2-ICP have been utilized for fundamentalstudies or analytical application purposes since the launchingof Ar-ICP in the late 1960s as reported by Montaser and otherresearchers.1–6 Nitrogen has higher thermal conductivity andheat capacity than argon, which improve energy transfer in theplasma atmosphere. In fact, owing to the higher plasmarobustness promoted by N2, addition of this molecular gas hasfound valuable application to complex samples analysis such asseawater, soil digests, slurries and other matrices.7–16 In addi-tion, Ar–N2-ICP proved its usefulness in reducing oxides and Arpolyatomic ions, which are interferents in ICP-MS.17–35
Researches dealing with the use of Ar–N2-ICP in axiallyviewed plasma in ICP OES have been quite limited. Ohata et al.36
demonstrated that plasma robustness (i.e., Mg(II)/Mg(I) ratio)was improved by using 1.3% of N2 in the outer gas, whereas therobustness remained constant under higher amounts of N2.These results corroborated with those found in the previousstudies conducted by Montaser and Horlick. In a series ofarticles1,37–43 these researchers reported that an excess of N2 inthe outer gas or nebulizer gas can degrade the plasma excitationcapability and increase the emission background. Scheffler andPozebon2 reported that the plasma robustness increased twice
J. Anal. At. Spectrom.

JAAS Paper
Publ
ishe
d on
23
Dec
embe
r 20
14. D
ownl
oade
d by
Uni
vers
idad
e Fe
dera
l do
Rio
Gra
nde
do S
ul o
n 15
/01/
2015
10:
20:5
9.
View Article Online
when a low ow of N2 (20 mL min�1) was combined with theargon nebulizer gas ow. The authors demonstrated theusefulness of this approach for diminishing matrix effectsinduced by easily ionized elements such as Na, K and Ca,without impairing the limits of detection (LODs). However,ionic emission lines were mostly monitored and fundamentalparameters of the ICP were not fully investigated. Investigationsare necessary to understand how a low ow of N2 acts in theanalytical region of the plasma, i.e., in its central channel. It isalso important to know if there is any synergistic effect throughthe outer region or the central channel of the ICP and howmuch N2 is required for the robustness improvement withoutsignicant degradation of the LOD.
According to the aforementioned aspects, the purpose of thepresent study was the investigation of energy transfer that takesplace when a small ow of N2 is added into the central channelof an Ar-ICP. To this end, emission proles of Mg(II), Mg(I), andAr(I) were obtained along and across the ICP. The characteristicsof the Ar–N2-ICP are demonstrated by the Mg(II)/Mg(I) intensityratio, Ar emission signal and plasma excitation temperature,using Fe as thermometric species. Matrix effects caused by seawater (as a representative matrix) are investigated for a set ofatomic and ionic energetic states. Possible shis of the excita-tion/ionization processes induced by N2 in the Ar-ICP are alsoinvestigated.
ExperimentalInstrumentation, reagents, samples and solutions
The experiments were performed using an Optima 2000DV ICPOES spectrometer (Perkin Elmer, MA, USA), whereas the oper-ating conditions are given in Table 1. Argon (99.996%, fromWhite Martins/Praxair, Brazil) was used as the plasma, auxiliaryand nebulizer gas. Nitrogen (99.998%, from White Martins/Praxair, Brazil) was utilized to purge the optical system of theICP OES spectrometer and as additional ow in the nebulizergas. For liquid sample introduction into the ICP, a high-effi-ciency nebulizer with an aerosol desolvation unity was used(APEX-Q, from ESI, NB, USA). The system consists of a PFAnebulizer, a heated cyclonic spray chamber (140 �C) and aPeltier multipass condenser (2 �C), producing a partially driedaerosol and enhancing the sensitivity (about 30%). Nitrogenwas added to the nebulizer gas through this system, asdescribed elsewhere.9 Calibration and test solutions wereprepared by serial dilution of monoelemental stock solution(1000 mg L�1 –Merck, Darmstadt, Germany) or multielementalstock solution (10 mg L�1 SCP33MS – SCP Science, Quebec,Canada). Deionised water (18.2 MU cm) puried in a Milli-Qsystem (Millipore, Billerica, MA, USA) was used for preparationof samples and solutions. Calibration solutions were preparedin 5% (v/v) HNO3. Solutions containing 0.1 mg L�1 Mg or 50 mgL�1 Mg were used for plasma robustness evaluation and thediagnostic emission line test, respectively. For plasma excita-tion temperature measurements a 0.5 mg L�1 Fe solution wasemployed. The reagents used – HCl (37% m/m), HF (48%m/m),HNO3 (65% m/m) and H2O2 (30% m/m) – were purchased fromMerck. The certied reference water NIST 1640a (trace elements
J. Anal. At. Spectrom.
in natural water, from National Institute of Standard andTechnology – NIST, USA) was used to evaluate accuracy andpossible spectral interferences caused by N2. Other certiedsamples were also analysed for accuracy checking: pond sedi-ment (NIES-2 from National Institute for EnvironmentalStudies, Japan), trace elements in river sediment (BCR-320 fromInstitute for Reference Materials and Measurements, Belgium)and soil (NIST 2710a, Montana soil). These samples weredecomposed as follows: 6 mL HNO3 + 2 mL HF + 1 mL HCl + 1mL H2O2 were added to 0.2 g of the sample placed in a PTFEvessel, which was subsequently closed and the mixture heatedat 200 �C for 6 h in a heating block. Then, the sample solutionwas transferred to a graduated polypropylene vial where thevolume of the solution was elevated to 50 mL by adding water.Certied seawater (NASS-4 from National Research Council ofCanada) was diluted as necessary and then spiked with theanalytes (100 mg L�1) for determining the extension of matrixeffects. The instrument operating conditions used in thepresent study were similar to those established in a previousstudy9 (rf power of 1500 W, nebulizer gas ow rate of 0.6 Lmin�1 and sample uptake rate of 0.65 mL min�1). The N2 owrate was evaluated in the range of 0.0 to 20 mL min�1 and xedat 20 mL min�1, corresponding to 3.3% of the nebulizer gas. Allexperiments and samples were run in triplicate unless other-wise specied. Emission line energies and other constants wereextracted from NIST Atomic Spectra Database (www.nist.gov/pml/data/asd.cfm).
Emission proles and excitation temperature
Axial spatial proles were computed by measuring the emissionintensity at different distances of the load coil (1 to 30 mm, with1 mm of interval) whereas radial spatial proles were computedacross the plasma centre (from �15 mm to +15 mm, with 1 mminterval, being 0 mm the plasma center). The emission intensitysignals were collected in both Ar-ICP and Ar–N2-ICP forcomparison purposes. All data obtained were not treated usingthe Abel inversion in order to avoid additional uncertaintiesusually introduced by this mathematical procedure. In addi-tion, the Abel inversion requires substantial modication of thecommercial ICP OES instrument. The absolute emissionintensity (I) of a set of ionic lines of Fe was used for calculatingthe plasma excitation temperature (Tex) in the central channelaxis of the ICP. The wavelength (l), excitation energy (eV) andthe transition probability (A) multiplied by the statistical weightof the respective emission level (g) are given in Table 2. It wasassumed that both plasmas (Ar-ICP and Ar–N2-ICP) were in localthermodynamic equilibrium (LTE) and the population of atomsand ions followed the Boltzmann distribution (with k ¼ 8.617 �10�5 eV K�1). In this way, by plotting ln(Il/gA) versus the corre-sponding excitation energy of the Fe lines, a linear relationshipis obtained (slope ¼ �1/kTex). Iron was selected as a thermo-metric species in view of its rich emission spectra, with a broadenergy range, encompassing a short wavelength interval(avoiding correction for the detector response), appropriateintensity as well as signal-to-noise ratio. Additionally, transitionprobabilities for Fe are reliable and already well-known.
This journal is © The Royal Society of Chemistry 2015

Table 1 Instrumental and operating conditions of ICP OES equipment and spectral lines monitoreda
Parameter Setting
RF applied power (W) 1500Argon ow rate (L min�1) Outer: 15; intermediate: 0.2, nebulizer: 0.6Injector tube Alumina (2 mm i.d.)Integration time (s) 5Sample uptake rate (mL min�1) 0.65N2 ow rate (mL min�1) 20Plasma view Axial or radialb
Emission line (nm)
Potential, eV Energy sum, eV
Excitation (E) Ionization (I) E + I
Ba(II) 233.527 6.00 5.21 11.21Cd(I) 228.802 5.41 8.99 14.40Cd(II) 214.440 5.78 8.99 14.77Co(II) 228.616 5.84 7.86 13.70Cr(II) 267.716 6.18 6.77 12.95Cr(I) 357.869 3.46 6.77 10.23Zn(I) 206.200 6.01 9.39 15.40Zn(II) 213.857 5.80 9.39 15.19Pb(II) 220.353 7.37 7.42 14.79Pb(I) 217.000 5.71 7.42 13.13Sr(II) 407.771 3.04 5.70 8.74Cu(I) 327.393 3.78 7.73 11.51Cu(II) 224.700 8.23 7.73 15.96Mn(II) 257.610 4.81 7.44 12.25Ni(II) 231.604 6.39 7.64 14.03Ni(I) 232.003 5.34 7.64 12.98Mo(II) 202.031 6.13 7.10 13.23
a I: atomic state; II: ionic state. b Radial view was used to obtain emission proles only.
Paper JAAS
Publ
ishe
d on
23
Dec
embe
r 20
14. D
ownl
oade
d by
Uni
vers
idad
e Fe
dera
l do
Rio
Gra
nde
do S
ul o
n 15
/01/
2015
10:
20:5
9.
View Article Online
ResultsSpatial proles
Emission proles collected across the ICP are useful to indicatepossible changes of plasma characteristics and/or excitationpathways taking place in the ICP. In fact, collecting emittedphotons is a passive process when compared to ion samplingusing ICP-MS where the interface usually changes the ionpopulation distribution in the ICP.16 However, the emissionproles may be distorted by the skin effect (i.e., the emissionintensity in the central channel can be diluted/superposed bythe hot plasma annulus), which is a disadvantage of ICP OES.16
The emission intensity proles of Mg(I), Mg(II) and Ar(I)collected across the ICP are shown in Fig. 1. By comparingFig. 1(a) and (b), one can conclude that there are more excitedions than excited atoms in the central channel of the ICP underthe N2 ow. Under such conditions there is an overpopulationof Mg ionic states in the central channel of the ICP. As observedpreviously in laser ablation ICP-MS,50 the normal analyticalzone in the central channel of the ICP becomes broader andwider with the addition of N2, in comparison to standard pureAr-ICP. As shown in Fig. 1(c) by the Ar emission prole, themolecular gas (N2) increases the excited Ar(I) population. Onereason would be the increased population of more energetic Ar
This journal is © The Royal Society of Chemistry 2015
emission states, caused by the higher plasma temperature and/or charge transfer reaction among Ar and N+ or N2
+.1–3
Emission proles collected along the ICP can indicate rele-vant aspects of particle vaporization, atomization or ionizationalong the plasma axis as well as possible matrix effects, earlierparticle ionization and/or changes in the ICP characteristics.Fig. 2 shows the proles obtained by plotting the emissionintensity versus the observation height. From 0 to 5mm ahead ofthe load coil, the initial radiation zone exists and so any signal isnot observed. In Fig. 2(a), lower emission intensity is observedfor Mg(I) in the presence of N2 up to 15 mm from the load coil,which is considered the analytical zone of the ICP. However, thesamebehaviour is not observed forMg(II), whose signal increasesin the presence of N2. The same trend of signal increase anddecrease as a function of the distance of the induction coil isobserved for Mg(II) with and without N2 addition. Similarbehaviour of that of Mg(II) is observed for Ar(I) as can be seen inFig. 2(c). According to the results found, the foreign gas (N2)seems to exert more relevant inuence on the analytical zone ofthe ICP. The N2 inuence can be partially explained by thethermal conductivity of N2, which is estimated to be 30 timeshigher than that of Ar at 8000 K.1 Molecular nitrogen is probablypredominant at lower distance from the load coil, whichenhances the thermal conductivity and, therefore, improves,
J. Anal. At. Spectrom.
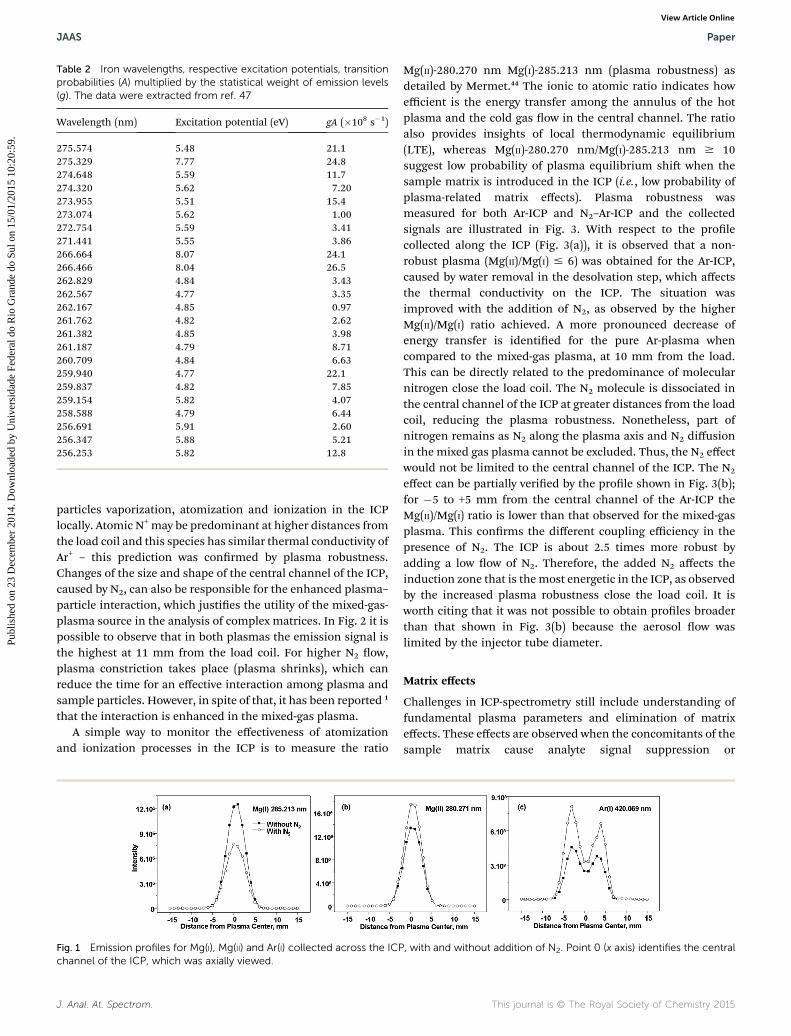
Table 2 Iron wavelengths, respective excitation potentials, transitionprobabilities (A) multiplied by the statistical weight of emission levels(g). The data were extracted from ref. 47
Wavelength (nm) Excitation potential (eV) gA (�108 s�1)
275.574 5.48 21.1275.329 7.77 24.8274.648 5.59 11.7274.320 5.62 7.20273.955 5.51 15.4273.074 5.62 1.00272.754 5.59 3.41271.441 5.55 3.86266.664 8.07 24.1266.466 8.04 26.5262.829 4.84 3.43262.567 4.77 3.35262.167 4.85 0.97261.762 4.82 2.62261.382 4.85 3.98261.187 4.79 8.71260.709 4.84 6.63259.940 4.77 22.1259.837 4.82 7.85259.154 5.82 4.07258.588 4.79 6.44256.691 5.91 2.60256.347 5.88 5.21256.253 5.82 12.8
JAAS Paper
Publ
ishe
d on
23
Dec
embe
r 20
14. D
ownl
oade
d by
Uni
vers
idad
e Fe
dera
l do
Rio
Gra
nde
do S
ul o
n 15
/01/
2015
10:
20:5
9.
View Article Online
particles vaporization, atomization and ionization in the ICPlocally. Atomic N+may be predominant at higher distances fromthe load coil and this species has similar thermal conductivity ofAr+ – this prediction was conrmed by plasma robustness.Changes of the size and shape of the central channel of the ICP,caused by N2, can also be responsible for the enhanced plasma–particle interaction, which justies the utility of the mixed-gas-plasma source in the analysis of complex matrices. In Fig. 2 it ispossible to observe that in both plasmas the emission signal isthe highest at 11 mm from the load coil. For higher N2 ow,plasma constriction takes place (plasma shrinks), which canreduce the time for an effective interaction among plasma andsample particles. However, in spite of that, it has been reported 1
that the interaction is enhanced in the mixed-gas plasma.A simple way to monitor the effectiveness of atomization
and ionization processes in the ICP is to measure the ratio
Fig. 1 Emission profiles for Mg(I), Mg(II) and Ar(I) collected across the ICPchannel of the ICP, which was axially viewed.
J. Anal. At. Spectrom.
Mg(II)-280.270 nm Mg(I)-285.213 nm (plasma robustness) asdetailed by Mermet.44 The ionic to atomic ratio indicates howefficient is the energy transfer among the annulus of the hotplasma and the cold gas ow in the central channel. The ratioalso provides insights of local thermodynamic equilibrium(LTE), whereas Mg(II)-280.270 nm/Mg(I)-285.213 nm $ 10suggest low probability of plasma equilibrium shi when thesample matrix is introduced in the ICP (i.e., low probability ofplasma-related matrix effects). Plasma robustness wasmeasured for both Ar-ICP and N2–Ar-ICP and the collectedsignals are illustrated in Fig. 3. With respect to the prolecollected along the ICP (Fig. 3(a)), it is observed that a non-robust plasma (Mg(II)/Mg(I) # 6) was obtained for the Ar-ICP,caused by water removal in the desolvation step, which affectsthe thermal conductivity on the ICP. The situation wasimproved with the addition of N2, as observed by the higherMg(II)/Mg(I) ratio achieved. A more pronounced decrease ofenergy transfer is identied for the pure Ar-plasma whencompared to the mixed-gas plasma, at 10 mm from the load.This can be directly related to the predominance of molecularnitrogen close the load coil. The N2 molecule is dissociated inthe central channel of the ICP at greater distances from the loadcoil, reducing the plasma robustness. Nonetheless, part ofnitrogen remains as N2 along the plasma axis and N2 diffusionin the mixed gas plasma cannot be excluded. Thus, the N2 effectwould not be limited to the central channel of the ICP. The N2
effect can be partially veried by the prole shown in Fig. 3(b);for �5 to +5 mm from the central channel of the Ar-ICP theMg(II)/Mg(I) ratio is lower than that observed for the mixed-gasplasma. This conrms the different coupling efficiency in thepresence of N2. The ICP is about 2.5 times more robust byadding a low ow of N2. Therefore, the added N2 affects theinduction zone that is themost energetic in the ICP, as observedby the increased plasma robustness close the load coil. It isworth citing that it was not possible to obtain proles broaderthan that shown in Fig. 3(b) because the aerosol ow waslimited by the injector tube diameter.
Matrix effects
Challenges in ICP-spectrometry still include understanding offundamental plasma parameters and elimination of matrixeffects. These effects are observed when the concomitants of thesample matrix cause analyte signal suppression or
, with and without addition of N2. Point 0 (x axis) identifies the central
This journal is © The Royal Society of Chemistry 2015

Fig. 2 Emission profiles for Mg(I), Mg(II) and Ar(I) collected along the ICP, with and without the addition of N2. Point 0 (x axis) identifies the loadcoil position. The ICP was laterally viewed.
Fig. 3 Profiles of plasma robustness (Mg(II)/Mg(I)) along (a) and across (b) the ICP, with and without N2 addition. The ICP was laterally viewed in (a)and axially viewed in (b). Point 0 (x axis) in (a) identifies the load coil position and in (b) it does the central channel of the ICP.
Paper JAAS
Publ
ishe
d on
23
Dec
embe
r 20
14. D
ownl
oade
d by
Uni
vers
idad
e Fe
dera
l do
Rio
Gra
nde
do S
ul o
n 15
/01/
2015
10:
20:5
9.
View Article Online
enhancement, whose intensity depends on analyte character-istics and the sample matrix as well. In general, matrix effectscan be categorized into two main types: sample introduction-related or plasma-related. While the former can, in some cases,be more easily corrected by means of alternative calibrationstrategies (standards addition, internal standardization, matrix-matching) or even matrix separation, the latter is usuallyunpredictable. In order to evaluate how the foreign gas (N2)could reduce matrix effects, seawater (2 to 500-fold diluted) wasspiked with the analyte and its emission subsequentlymeasured. More concentrated and more diluted seawatersimulated complex and simple matrices, respectively. Fig. 4illustrates the results obtained for diluted seawater. Accordingto this gure, addition of N2 does not exert any remarkableinuence on the signal of the analyte for seawater diluted 50–500 times. The matrix effects observed may be related primarilyto the sample introduction system (generation and ltering ofaerosol – the miniaturized design of the PFA micronebulizerand aerosol desolvation must be considered) in the ICP. Sincethese effects are more pronounced, they could hide thoseoccurring in the ICP under the N2 ow. As previously observed,9
N2 does not affect the sample-introduction (aerosol generationand transport) in the ICP, but solely the ICP atmosphere. InFig. 4, signal suppression is observed for all analytes, except Sr(8.74 eV). As Sr is present at appreciable concentration inseawater (about 8000 mg L�1 in undiluted seawater), the signalsuppression was probably compensated by the signal of Sralready present in the sample. Although seawater was verydiluted, matrix effects were still observed. This occurred
This journal is © The Royal Society of Chemistry 2015
because a high efficiency nebulizer was used for introducing thesample solution in the ICP. That is, the amount of samplereaching the ICP is larger when compared to a conventionalpneumatic nebulizer. The effect of N2 became noticeable forseawater 2 to 10-fold diluted; it can be clearly seen that theanalyte signal was less affected when N2 was added to the ICP.Excluding Sr, the mean analyte signal suppression in the Ar-ICPwas 56%, 63% and 71% for seawater 10-, 5- and 2-fold diluted,respectively. On the other hand, in the Ar–N2-ICP the meananalyte signal suppression was 42%, 48% and 52%, for seawater10-, 5- and 2-fold diluted, respectively. For the 2-fold dilutedseawater, whose salinity is 17.5, the analyte signal suppressionwas 35% lower in the Ar–N2-ICP. The reasons for the lowersignal suppression would be the higher thermal conductivity ofN2, improving particles vaporization, especially for a suchcomplex matrix. Nitrogen, by increasing the excitation temper-ature in the central channel of the ICP, would also mitigateshis in the fundamental plasma parameters caused by thematrix components. The use of mixed-gas plasma combinedwith on-line ow injection were investigated in order to improvesample throughput in seawater analysis, as detailed by Beau-chemin et al.8,11–16 The authors observed that the foreign gas (N2)decreased the sensitivity (in comparison to the Ar-ICP). Thisdrawback was possibly related to the excess of N2 added, whichcould decrease the ICP temperature, time of plasma–particleinteraction, and/or increase the population of doubly chargedions, decreasing the population of single charged ions and thesensitivity as a consequence. In addition, the nitrogen-speciesmay have also increased the background signal.
J. Anal. At. Spectrom.

Fig. 4 Matrix effects of diluted sea-water spiked with 100 mg L�1 of elements cited in Table 1, with and without N2 addition. The relative emissionintensity in the y axis is the ratio of the analyte signal in diluted seawater/the analyte signal in 5% (v/v) HNO3. Ratio close to 1.0 identifies theabsence of thematrix effect. The relative emission intensity is plotted against the energy sum (see Table 1). Error bars are the standard deviation of3 independent measurements in axially-viewed ICP.
Fig. 5 Plasma excitation temperature calculated in the centralchannel of the ICP using Fe as thermometric species, as a function ofthe N2 flow rate (added to the nebulizer gas). Error bars are the stan-
JAAS Paper
Publ
ishe
d on
23
Dec
embe
r 20
14. D
ownl
oade
d by
Uni
vers
idad
e Fe
dera
l do
Rio
Gra
nde
do S
ul o
n 15
/01/
2015
10:
20:5
9.
View Article Online
Excitation temperature
Fig. 5 shows the excitation temperatures estimated bymeasuring the signal of Fe(II) lines along the ICP axis. Thetemperature was calculated from the slope of the Boltzmannplot, whereas the correlation coefficients were higher than 0.99.The values quoted in Fig. 5 were calculated frommeasurementscarried out at room temperature and signicant discrepancieswere possible inside the ICP environment at 8000 K. The devi-ations are related to Ar and N2, whose properties are known at25 �C in the room environment and extrapolated to 8000 K inthe ICP environment. However, it can be stated that the calcu-lated temperature is still reliable.47 It is important to mentionthat all data were collected by using a sequential spectrometer,whichmay have deteriorated the precision (when compared to asimultaneous spectrometer) as denoted by the deviations inFig. 5. As shown in this gure, the excitation temperatureincreased from 7480 K to 7910 K with the addition of N2, whichconrms that this molecular gas improves plasma characteris-tics (particularly in the central channel), not only by its higherthermal conductivity (0.024 W mK�1 for N2 and 0.016 W mK�1
for Ar) but also by its higher heat capacity (1.04 kJ kg�1 K�1 forN2 and 0.52 kJ kg�1 K�1 for Ar). In fact, it has been estimatedthat the thermal conductivity of N2 is 30 times higher than thatof Ar,1 which explains the remarkable N2 effect in the Ar-ICP,
J. Anal. At. Spectrom.
even when a very low ow of N2 is added. The plasma maydepart from the LTE when N2 is added, especially in the centralchannel. However, the present investigation was conducted
dard deviation of 3 determinations in axially-viewed ICP.
This journal is © The Royal Society of Chemistry 2015

Paper JAAS
Publ
ishe
d on
23
Dec
embe
r 20
14. D
ownl
oade
d by
Uni
vers
idad
e Fe
dera
l do
Rio
Gra
nde
do S
ul o
n 15
/01/
2015
10:
20:5
9.
View Article Online
using robust plasma conditions, ensuring that both plasmasmoved closer to the LTE. Therefore, this source of uncertaintywas reduced. Other researchers40 found that addition of 10% ofN2 into the outer gas ow increased the temperature of the ICPto about 1000 K. Witte and Houk49 observed that the gas kinetictemperature of the ICP increased to 340 K when laser ablationwas used as the sample introduction system and 5 mL min�1 ofN2 was added to the carrier gas. Therefore, the results found inthe present study corroborate with others already reported.
Figures of merit and accuracy
Addition of N2 to the Ar-ICP gives rise to a structural back-ground owing to emission of molecular species such as N2, N2
+,NH and NO. Bands related to emission of NO at 200 to 280 nmare observed. The interval between 350 and 500 nm should beused because it is relatively free of interferences caused bynitrogen.1,37 However, the wavelengths of prominent lines of theinvestigated elements were lower than 280 nm. The intensity ofspectral interference caused by N2 was estimated by measuringthe blank signal in both atmospheres, i.e., with and without N2
addition. In both cases, the signal of the analyte in calibrationsolutions was blank corrected and the slope of the calibrationcurves compared to check the sensitivity. The results obtainedare given in Table 3 where a pattern can be observed for atomicand ionic lines; the ratio “slope of calibration curve obtainedwith N2 addition/slope of calibration curve obtained without N2
addition” is typically <1 for atomic lines. Therefore, the sensi-tivity for ionic lines increases by adding N2 to the Ar-ICP. Theremarkable exceptions are Sr(II) 407.771 and Cu(II) 224.700 thatmay behave as atomic lines. These results corroborate with theexcitation temperature calculated using the Boltzmann equa-tion and a set of Fe(II) emission lines. This means that
Table 3 Limit of detection (LOD), slope of calibration curves and respectiN2-ICP/Ar-ICP. The LOD was calculated following the 3s criterion (n ¼ 1plasma
Spectral line LOD, mg L�1 (Ar-ICP) LOD, mg L�1 (Ar–N2 ICP) Slope (A
Mo(II) 202.031 1 1 62Ba(II) 233.527 0.1 0.2 1062Cd(I) 228.802 0.1 0.2 913Cd(II) 214.440 0.5 0.4 174Co(II) 228.616 0.2 0.2 371Cr(II) 267.716 0.2 0.3 450Cr(I) 357.869 0.2 0.4 1663V(II) 292.464 0.4 0.9 292V(II) 290.880 0.3 0.2 856Zn(II) 206.200 1 1 74Zn(I) 213.857 0.5 0.4 485Pb(II) 220.353 3 3 28Pb(I) 217.000 16 28 5.Sr(II) 407.771 0.01 0.01 78 610Cu(I) 327.393 0.1 0.2 1798Cu(II) 224.700 0.5 2 190Mn(II) 257.610 0.02 0.02 6064Ni(II) 231.604 0.5 0.5 182Ni(II) 232.003 0.9 1.0 84Fe(II) 238.204 0.25 0.20 867
This journal is © The Royal Society of Chemistry 2015
ionization of analyte atoms increases with the temperatureincrease promoted by the low ow of N2 introduced in thecentral channel of the ICP. It is interesting to observe in Table 3that higher enhancement was observed for Zn(II) and Cd(II)whose ionization energies are 9.39 eV and 8.99 eV, respectively.These two species may participate in charge-transfer reactionwith NO+, whose ionization potential is 9.26 eV. The higherexcitation temperature of the mixed-gas plasma leads to anoverpopulation of ionic states, but charge transfer reaction withNO+ may happen concomitantly in the ICP and would be thereason for the higher enhancement observed for Cd(II) andZn(II). The linearity of calibration curves was not affected by N2,as observed by the r2 values in Table 3. The LODs were almostsimilar for the Ar-ICP and N2–Ar-ICP. The LODs were calculatedfollowing the 3s criterion, whereas s is the standard deviation often consecutive blank measurements. According to the resultsobtained it can be stated that addition of a low ow of N2 to theAr-ICP is a straightforward way to increase the ICP robustnesswithout a visible side effect on the ICP performance.
Accuracy was accessed by analysing certied water (traceelements in natural water – NIST 1640a). The analyte concen-tration found agreed with that certied, indicating that thespectral interferences caused by adding N2 to the Ar-ICP wereproperly blank corrected. Three certied sediment sampleswere analyzed to check accuracy for more complex matrices. Ascan be seen in Table 4, the concentrations found and thosecertied or informed were in agreement, which again conrmsthat there is no side effects by adding a small ow of N2 in thecentral channel of the Ar-ICP. One can note in Table 4 that theconcentrations measured were in general more accurate whenthe Ar–N2-ICP was employed.
ve linear regression coefficient (r). The ratio of slopes is identified as Ar–0). All data were obtained using external calibration and axially-viewed
r-ICP) Slope (Ar–N2 ICP) Ratio of slopes r2 (Ar-ICP) r2 (Ar–N2 ICP)
78 1.2 0.9997 0.99941259 1.2 0.9999 0.9998677 0.74 0.9998 0.9998315 1.8 0.9998 0.9998459 1.2 0.9999 0.9998572 1.3 0.9999 0.9998825 0.49 0.9999 0.9999324 1.1 0.9999 0.9999935 1.1 0.9999 0.9999117 1.6 0.9934 0.9977426 0.87 0.9940 0.992228 1.0 0.9997 0.9997
1 3.6 0.71 0.9993 0.997768 700 0.87 0.9999 0.99991664 0.92 0.9990 0.9987128 0.67 0.9990 0.9988
6930 1.1 0.9999 0.9999228 1.2 0.9997 0.999668 0.81 0.9997 0.9996
1042 1.2 0.9999 0.9998
J. Anal. At. Spectrom.

Table 4 Analysis of certified reference samples. Concentration values measured are the mean and standard deviation of three independentdeterminations (n ¼ 3). External calibration and axially viewed plasma were used. Concentration in mg g�1a
Spectral line
Soil Pond sediment River sediment
CertiedMeasuredAr–N2-ICP
MeasuredAr-ICP Certied
MeasuredAr–N2-ICP
MeasuredAr-ICP Certied
MeasuredAr–N2-ICP
MeasuredAr-ICP
Mo 202.031 — nd nd — nd nd (0.64) nd ndBa 233.527 792 � 36 773 � 28 940 � 50 — 245 � 20 310 � 30 (531) 530 � 25 468 � 20Cd 228.802 12.3 � 0.3 25 � 1 51 � 5 0.82 � 0.06 nd nd 0.533 � 0.026 nd ndCd 214.440 12.3 � 0.3 11 � 1 16 � 3 0.82 � 0.06 nd nd 0.533 � 0.026 nd ndCo 228.616 5.99 � 0.14 4.5 � 0.5 8.6 � 1.0 27 � 3 23 � 2 30.3 � 1.5 (19.4) 16.5 � 1.2 20.7 � 3.5Cr 267.716 23 � 6 19 � 2 37.6 � 3.0 75 � 5 70 � 4 75.5 � 3.0 138 � 7 137 � 10 139 � 21Cr 357.869 23 � 6 17.5 � 1 21.7 � 1.4 75 � 5 68 � 8 48.6 � 2.0 138 � 7 139 � 12 136 � 2.0V 292.464 82 � 9 75 � 5 72 � 8 (250) 230 � 30 210 � 15 (104) 45.2 � 1.8 40.3 � 3.5V 290.880 82 � 9 72 � 3 68.3 � 5.3 (250) 215 � 25 218 � 13 (104) 48.5 � 1.5 42.5 � 2.0Zn 206.200 4180 � 150 3980 � 375 4540 � 350 343 � 17 325 � 15 324 � 11 142 � 3 138 � 10 118 � 16Zn 213.857 4180 � 150 4175 � 380 4580 � 240 343 � 17 320 � 10 325 � 9 142 � 3 135 � 12 114 � 10Pb 220.353 5550 � 30 5640 � 330 5320 � 150 105 � 6 103 � 4 120 � 4 42.3 � 1.6 40.3 � 2.1 28 � 2Pb 217.000 5550 � 30 5660 � 530 5240 � 450 105 � 6 181 � 13 334 � 21 42.3 � 1.6 45.2 � 2.3 52 � 4Sr 407.771 255 � 7 275 � 15 310 � 20 (110)a 120 � 23 160 � 25 (235.2)a 240 � 13 253 � 27Cu 327.393 3420 � 50 3462 � 50 3360 � 190 210 � 12 220 � 10 186 � 20 44.1 � 1.0 41.5 � 1.4 42.5 � 6.0Cu 224.700 3420 � 50 3340 � 85 3570 � 250 210 � 12 218 � 14 208 � 15 44.1 � 1.0 42 � 3 48.8 � 3.4Mn 257.610 2140 � 60 1945 � 125 2180 � 40 (770)a 710 � 25 760 � 35 (737)a 732 � 10 603 � 25Ni 231.604 8 � 1 6.5 � 1.0 10.5 � 2.0 40 � 3 38 � 4 23.3 � 2.0 75.2 � 1.4 70 � 2 47 � 4Ni 232.003 8 � 1 6.0 � 0.8 9.5 � 1.3 40 � 3 42 � 3 40 � 2 75.2 � 1.4 78.3 � 2.2 74.3 � 4.5Fe 238.204 b 4.32 � 0.08 4.26 � 0.18 4.38 � 0.06 6.53 � 0.35 6.39 � 0.08 6.64 � 0.27 (4.48)a 4.37 � 0.03 4.13 � 0.04
a nd: not detected (see Table 3); a: informed value; b: concentration in %. Soil: NIST 2710a; river sediment: BCR-320; pond sediment: NIES-2.
JAAS Paper
Publ
ishe
d on
23
Dec
embe
r 20
14. D
ownl
oade
d by
Uni
vers
idad
e Fe
dera
l do
Rio
Gra
nde
do S
ul o
n 15
/01/
2015
10:
20:5
9.
View Article Online
Investigation using diagnostic emission species
Changes of fundamental plasma parameters (i.e., electronnumber density, excitation or ionization temperature, atom/ionpopulation distribution) taking place in the central channel ofthe Ar-ICP under a low ow of N2 are revealed by changes in theemission intensities of atomic and ionic lines. These effects areillustrated in Fig. 6 where one can see that the intensity of Mg(I)decreases while that of Mg(II) increases. According to Burtonand Blades,45 atomic Mg with low excitation energy may beexcited by electron impact predominantly. The same does notoccur for high-energy levels, which may be excited by charge-transfer reactions involving Ar+ species, causing an over-population of ionic Mg. Although the emission intensity may beaffected by changes in plasma temperature, the remarkablesuppression of Mg(I) emission intensity that took place when N2
was added to the Ar-ICP (see Fig. 6) denotes a decrease in theexcitation pathway by an electron impact. Sesi et al.46 havedemonstrated that a signicant drop in electron numberdensity occurs when N2 is added to the central channel of theICP. They attributed this phenomenon to the high heat capacityof N2, which acts as a ‘energy sink’, storing energy from theplasma and further reducing electron density.
The enhancement of Mg(II) intensity shown in Fig. 6 suggestsa possible overpopulation of Ar+ (by charge-transfer from N2
+ toAr species), which would ionize Mg atoms. An evidence of suchionization mechanism that takes place in an Ar–N2-ICP wasexperimentally demonstrated by Holliday and Beauchemin.8
They added N2 to the outer gas ow and through measurementsof plasma background species in both ICP atmospheres and
J. Anal. At. Spectrom.
respective radial spatial proles, demonstrated that charge-transfer reactionmay be the predominant ionization path in theAr–N2-ICP, which is consistently different from electron impactin a pure Ar-ICP.
Additional investigations were conducted by monitoringemission signals of O(I) as well as OH radicals. These species aredirectly related to the amount of water introduced in the ICPand can provide additional insights on the effects of N2. Fig. 7shows the effect of N2 on the emission intensity of O(I) and OH.The increase of O(I) emission denotes that the decomposition ofwater increases in the central channel of the ICP under the N2
ow. On the other hand, the intensity of the OH radical does notchange, which simply indicates that the amount of waterintroduced into the ICP remains constant. It is important toremark that the addition of a low ow N2 to the nebulizer gasdoes not affect the aerosol generation and subsequent transportto the ICP, as previously observed.9
Excited Ar states play an important role in Penning ioniza-tion and, therefore, Ar emission is a useful indicator of N2
effects going on in the Ar-ICP. Two groups of argon emissionlines involving low-energy (13.25 to 13.50 eV) and high-energy(14.80 to 15.40 eV) levels are useful for that purpose.48 However,it is difficult to measure the emission of Ar because the detectorbecomes saturated. This shortcoming can be circumvented byreducing the time of signal measurements. The ICP OES spec-trometer used in the present study limits the minimummeasurement time to 0.1 s. Under this condition it was possibleto measure the emission intensity of several Ar lines. This wasset as a compromise condition because the precision worsens
This journal is © The Royal Society of Chemistry 2015

Fig. 6 Effect of N2 (20 mL min�1 added to the nebulizer gas) on theintensity of atomic and ionic lines of Mg. The number above each bar isthe respective excitation energy in eV.45 Error bars are the standarddeviation of 3 determinations in axially-viewed ICP.
Fig. 8 Effect of N2 (20 mL min�1 added to the nebulizer gas) on thesignal enhancement of Ar-emission lines. The number above each baris the respective excitation energy in eV. Values in the y axis are theratio “signal in the presence of N2/signal in the absence of N2”. Errorbars are the standard deviation of 3 determinations in axially-viewedICP.
Paper JAAS
Publ
ishe
d on
23
Dec
embe
r 20
14. D
ownl
oade
d by
Uni
vers
idad
e Fe
dera
l do
Rio
Gra
nde
do S
ul o
n 15
/01/
2015
10:
20:5
9.
View Article Online
with the decreasing of the signal integration time. According toFig. 8 a clear pattern is not observed but those Ar lines withhigher excitation energy were less enhanced or even suppressedwhen N2 was added. If a defect energy of 0.5 eV is considered,the excitation of Ar with an energy of 14.03 eV to 15.03 eV hashigh probability to occur directly via charge-transfer among N+
(14.53 eV). As shown in Fig. 8, the signals of Ar lines whoseenergy is 14.03 eV to 15.06 eV increase more than the others inthe presence of the N2 ow. On the other hand, argon withhigher excitation energy (15.13 to 15.35 eV) would be excited bycharge transfer among N2
+ (15.58 eV). However, this excitation
Fig. 7 Effect of N2 (20 mL min�1 added to the nebulizer gas) on theemission intensity of atomic lines of oxygen and the OH radical. Thenumber above each bar is the respective excitation energy in eV.Values in the y axis are the ratio “the signal in the presence of N2/thesignal in the absence of N2”. Error bars are the standard deviation of 3determinations in axially-viewed ICP.
This journal is © The Royal Society of Chemistry 2015
path probability involves two steps whose occurrence is lower.This phenomenon could be the reason for the lower enhance-ments of the energetic states of Ar from 15.13 to 15.35 eV (lines543.999, 602.515, 603.213 and 604.323 nm). However, moreexperiments involving a larger number of Ar excited states aswell as spatial proles collected along and across the ICP axisare required to validate and support these conclusions. A rathercomplex excitation path is possible in the used mixed-gasplasma, which may involve several processes occurring spatiallyand temporally. Ions distribution determined using ICP-MS canbe used as a complementary tool to probe possible excitationmechanisms, as already demonstrated by Beaucheminet al.7,8,11–16,51
Conclusions
A low ow of N2 in the central channel of the Ar-ICP signif-icantly increased the coupling efficiency among the bulkplasma and the central channel without sensitivity degrada-tion in ICP OES. The excitation temperature in the centralchannel of the ICP increased, improving its performance. Theanalyte signal suppression caused by the seawater matrix wasreduced when N2 was added to the ICP, being a high effi-ciency nebulizer (pneumatic nebulization with aerosol des-olvation) used as a sample introduction system. Reduction ofmatrix interference is also expected for other complexmatrices by adding a low ow of N2 to the ICP and using thesame sample introduction system, which improves thesensitivity. Nitrogen added in the central channel of the ICPplays an important role in energy transfer locally (at thecentral channel). This molecular gas can also act positively asa load buffer, increasing plasma robustness and minimizingmatrix effects without sacricing sensitivity. These benets
J. Anal. At. Spectrom.

JAAS Paper
Publ
ishe
d on
23
Dec
embe
r 20
14. D
ownl
oade
d by
Uni
vers
idad
e Fe
dera
l do
Rio
Gra
nde
do S
ul o
n 15
/01/
2015
10:
20:5
9.
View Article Online
would be useful for sample introduction systems such aselectrothermal vaporization (ETV), laser ablation (LA), andnanonebulizers. Water exerts a positive buffering in the Ar-ICP and when these sample introduction systems are used aminimum amount of water is introduced into the ICP. Thus,a low ow of N2 could compensate the lack of water. By col-lecting emission proles along and across the plasma axis, itwas possible to identify possible shis of excitation condi-tions caused by N2. Although additional studies are necessaryto conrm specic excitation pathways, the present studyfound evidence of charge-transfer reactions among ground-state Ar species and ionized nitrogen species (N2
+ and N+).The results found conrm that the excitation/ionizationmechanism in the N2–Ar-ICP is shied in comparison to theAr-ICP. Future studies will also focus on addition of a lowow of N2 to the auxiliary and outer gas ows in an attemptto gain robustness without sacricing detectability for bothICP OES and ICP-MS techniques.
Acknowledgements
The authors would like to thank CNPQ and CAPES for schol-arships and FAPERGS for nancial support.
References
1 A. Montaser and R. L. Van Hoven, CRC Crit. Rev. Anal. Chem.,1987, 18, 45.
2 G. L. Scheffler and D. Pozebon, Anal. Methods, 2014, 6, 6170.3 R. S. Houk, A. Montaser and V. A. Fassel, Appl. Spectrosc.,1983, 37, 425.
4 S. F. Durrant, Fresenius. J. Anal. Chem., 1993, 347, 389.5 B. S. Sheppard and J. A. Caruso, J. Anal. At. Spectrom., 1994, 9,145.
6 A. Montaser, V. A. Fassel and J. Zalewski, Appl. Spectrosc.,1981, 35, 292.
7 C. Agatemor and D. Beauchemin, Spectrochim. Acta, Part B,2011, 66, 1.
8 A. E. Holliday and D. Beauchemin, J. Anal. At. Spectrom.,2003, 18, 289.
9 G. L. Scheffler and D. Pozebon, Anal. Chim. Acta, 2013, 789,33.
10 G. L. Scheffler, V. L. Dressler and D. Pozebon, Food Anal.Methods, 2013, 7, 1415.
11 D. Beauchemin and J. M. Craig, Spectrochim. Acta, Part B,1991, 46, 603.
12 A. E. Holliday and D. Beauchemin, J. Anal. At. Spectrom.,2003, 18, 1109.
13 A. E. Holliday and D. Beauchemin, Can. J. Anal. Sci.Spectrosc., 2002, 47, 91.
14 G. Xiao and D. Beauchemin, Can. J. Anal. Sci. Spectrosc.,2001, 46, 28.
15 J. M. Craig and D. Beauchemin, J. Anal. At. Spectrom., 1992, 7,937.
16 A. E. Holliday and D. Beauchemin, Spectrochim. Acta, Part B,2004, 59, 291.
J. Anal. At. Spectrom.
17 J. W. Lam and J. W. McLaren, J. Anal. At. Spectrom., 1990, 5,419.
18 E. H. Choot and G. Horlick, Spectrochim. Acta, Part B, 1986,41, 925.
19 J. W. H. Lam and G. Horlick, Spectrochim. Acta, Part B, 1990,45, 1313.
20 J. Wang, E. Hywel Evans and J. A. Caruso, J. Anal. At.Spectrom., 1992, 7, 929.
21 S. Branch, L. Ebdon, M. Ford, M. Foulkes and P. O'Neil, J.Anal. At. Spectrom., 1991, 6, 151.
22 K. Akatsuka, J. W. McLaren, J. W. Lam and S. S. Berman, J.Anal. At. Spectrom., 1992, 7, 889.
23 C. Haraldsson, B. Lyven, P. Ohman and J. Munthe, J. Anal. At.Spectrom., 1994, 9, 1229.
24 C. J. Amarasiriwardena, N. Lupoli, V. Potula, S. Korrick andH. Hu, Analyst, 1998, 123, 441.
25 K. Akatsuka, T. Suzuki, N. Nobuyama, S. Hoshi,K. Haraguchi, K. Nakagawa, T. Ogata and T. Kato, J. Anal.At. Spectrom., 1998, 13, 271.
26 E. Hywel Evans and L. Ebdon, J. Anal. At. Spectrom., 1990, 5,425.
27 M. Ford, L. Ebdon and S. J. Hill, Anal. Proc., 1992, 29, 104.28 K. Newman, P. A. Freedman, J. Williams, N. S. Belshaw and
A. N. Halliday, J. Anal. At. Spectrom., 2009, 24, 742.29 M. J. Bloxham, P. J. Worsfold and S. J. Hill, Anal. Proc., 1994,
31, 95.30 T. van der Velde-Koerts and J. L. M. de Boer, J. Anal. At.
Spectrom., 1994, 9, 1093.31 Y. Zhu, K. Inagaki, H. Haraguchi and K. Chiba, J. Anal. At.
Spectrom., 2010, 25, 364.32 F. Laborda, H. J. Baxter, H. M. Crews and J. Dennis, J. Anal.
At. Spectrom., 1994, 9, 727.33 E. Hywel Evans and L. Ebdon, J. Anal. At. Spectrom., 1989, 4,
299.34 S. J. Hill, M. J. Ford and L. Ebdon, J. Anal. At. Spectrom., 1992,
7, 719.35 S. F. Durrant, Fresenius. J. Anal. Chem., 1994, 349, 768.36 M. Ohata, Y. Takaku, K. Inagaki, A. Hioki and K. Chiba, Anal.
Sci., 2009, 25, 161.37 A. Montaser and J. Mortazavi, Anal. Chem., 1980, 52, 255.38 M. Cai, D. A. Haydar, A. Montaser and J. Mostaghimi,
Spectrochim. Acta, Part B, 1997, 52, 369.39 S. E. O'Brien, J. R. Chirinos, K. Jorabchi, K. Kahen, M. E. Cree
and A. Montaser, J. Anal. At. Spectrom., 2003, 18, 910.40 I. Ishii, D. W. Golightly and A. Montaser, J. Anal. At.
Spectrom., 1988, 3, 965.41 E. H. Choot and G. Horlick, Spectrochim. Acta, Part B, 1986,
41, 935.42 E. H. Choot and G. Horlick, Spectrochim. Acta, Part B, 1986,
41, 907.43 E. H. Choot and G. Horlick, Spectrochim. Acta, Part B, 1986,
41, 889.44 J. M. Mermet, Anal. Chim. Acta, 1990, 250, 85.45 L. L. Burton and M. W. Blades, Spectrochim. Acta, Part B,
1991, 46B, 819.46 N. N. Sesi, A. MacKenzie, K. E. Shanks, P. Yang and
G. M. Hieje, Spectrochim. Acta, Part B, 1994, 49, 1259.
This journal is © The Royal Society of Chemistry 2015

Paper JAAS
Publ
ishe
d on
23
Dec
embe
r 20
14. D
ownl
oade
d by
Uni
vers
idad
e Fe
dera
l do
Rio
Gra
nde
do S
ul o
n 15
/01/
2015
10:
20:5
9.
View Article Online
47 G. Kreuning and F. J. M. J. Maessen, Spectrochim. Acta, Part B,1989, 44B, 167.
48 G. C.-Y. Chan and G. M. Hieje, Spectrochim. Acta, Part B,2007, 62, 196.
49 T. M. Witte and R. S. Houk, Spectrochim. Acta, Part B, 2012,69, 9.
This journal is © The Royal Society of Chemistry 2015
50 Z. Hu, S. Gao, Y. Liu, S. Hu, H. Chen and H. Yuan, J. Anal. At.Spectrom., 2008, 23, 1093.
51 Y. Makonnen and D. Beauchemin, Spectrochim. Acta, Part B,2014, 99, 87.
J. Anal. At. Spectrom.
Copyright © 2022 FDOKUMEN