Hydrogen Balmer-β and Balmer-γ emission profiles in an abnormal glow region of hydrogen plasma
7
Vacuum 80 (2006) 574–580 Hydrogen Balmer-b and Balmer-g emission profiles in an abnormal glow region of hydrogen plasma A. Qayyum a , R. Ahmad b , S.A. Ghauri a , A. Waheed c , M. Zakaullah a, a Department of Physics, Quaid-i-Azam University, 45320 Islamabad, Pakistan b Department of Physics, G. C. University, Lahore, Pakistan c PINSTECH, P.O. Box 2151, 44000 Islamabad, Pakistan Received 7 January 2005; received in revised form 14 July 2005 Abstract Emission spectroscopy measurements of Balmer-b and Balmer-g line profiles are carried out to study their line shapes and line intensities as a function of discharge parameters such as fill pressure (3–7 mbar) and input power (200–400 W). A technique based on determining the relative intensities of neutral atomic hydrogen emission lines is used to evaluate the electron temperature, whereas the electron density is extracted from the Stark broadening (FWHM) of the H b emission profile. It is found that both the emission intensity and the broadening of the Balmer-b and Balmer-g lines exhibit significant dependence on the fill pressure in the same manner. However, both the emission intensity and broadening of the H b line exhibit a weak dependence on input power in contrast to the H g emission line. Based on optical measurements reported here, plasma discharge parameters can be selected to optimize the electron temperature and density. r 2005 Elsevier Ltd. All rights reserved. PACS: 52.70.Kz; 52.80.Hc; 81.65.Lp Keywords: Glow discharge plasma; Optical diagnostics; Stark broadening 1. Introduction Gaseous discharge plasmas are used in a variety of technical areas ranging from basic plasma physics studies to commercial uses [1,2]. Usually, the abnormal glow regime of the discharge is used for plasma processing because in this mode the cathode is fully covered by the glow and offers the possibility of uniform processing of the material. When oxidized surfaces of metals are exposed to hydrogen plasma at appropriate pressure and temperature they become metallic due to the removal of oxide layers by reduction and sputtering. Therefore ultra-high clean surfaces may be prepared by treating samples in a hydrogen plasma environment, prior to being transferred to a system for additional processing. For example, this approach facilitates the diffusion of nitrogen atoms from the surface to the bulk providing stronger adhesion of nitrided films [3]. The efficiency of chemical processes occurring in the plasma and their reaction rates are generally dependent on the density of the charged particles and their attendant energy [4]. Detailed information concerning electron number density, electron temperature, and the electron energy distribution function (EEDF) are often used as the starting point for understanding associated plasma phenomena including particle collision processes, plasma reactions, and plasma surface interac- tions. For these reasons, accurate and reliable information concerning the electron behavior is an important first step in many different kinds of plasma-related researches. At the most basic level, knowledge of these parameters not only is critical to the understanding of complex plasma behavior, but also provides a basis for optimizing the conditions for surface treatment or related processing applications [5]. Optical emission spectroscopy (OES) is the ARTICLE IN PRESS www.elsevier.com/locate/vacuum 0042-207X/$ - see front matter r 2005 Elsevier Ltd. All rights reserved. doi:10.1016/j.vacuum.2005.09.007 Corresponding author. Tel.: +92 51 2273999; fax: 92 51 9210256. E-mail addresses: [email protected], [email protected] (M. Zakaullah).
-
Upload
independent -
Category
Documents
-
view
0 -
download
0
Transcript of Hydrogen Balmer-β and Balmer-γ emission profiles in an abnormal glow region of hydrogen plasma
ARTICLE IN PRESS
0042-207X/$ - s
doi:10.1016/j.va
�CorrespondE-mail addr
zaka_qau_pk@
Vacuum 80 (2006) 574–580
www.elsevier.com/locate/vacuum
Hydrogen Balmer-b and Balmer-g emission profiles in anabnormal glow region of hydrogen plasma
A. Qayyuma, R. Ahmadb, S.A. Ghauria, A. Waheedc, M. Zakaullaha,�
aDepartment of Physics, Quaid-i-Azam University, 45320 Islamabad, PakistanbDepartment of Physics, G. C. University, Lahore, PakistancPINSTECH, P.O. Box 2151, 44000 Islamabad, Pakistan
Received 7 January 2005; received in revised form 14 July 2005
Abstract
Emission spectroscopy measurements of Balmer-b and Balmer-g line profiles are carried out to study their line shapes and line
intensities as a function of discharge parameters such as fill pressure (3–7mbar) and input power (200–400W). A technique based on
determining the relative intensities of neutral atomic hydrogen emission lines is used to evaluate the electron temperature, whereas the
electron density is extracted from the Stark broadening (FWHM) of the Hb emission profile. It is found that both the emission intensity
and the broadening of the Balmer-b and Balmer-g lines exhibit significant dependence on the fill pressure in the same manner. However,
both the emission intensity and broadening of the Hb line exhibit a weak dependence on input power in contrast to the Hg emission line.
Based on optical measurements reported here, plasma discharge parameters can be selected to optimize the electron temperature and
density.
r 2005 Elsevier Ltd. All rights reserved.
PACS: 52.70.Kz; 52.80.Hc; 81.65.Lp
Keywords: Glow discharge plasma; Optical diagnostics; Stark broadening
1. Introduction
Gaseous discharge plasmas are used in a variety oftechnical areas ranging from basic plasma physics studiesto commercial uses [1,2]. Usually, the abnormal glowregime of the discharge is used for plasma processingbecause in this mode the cathode is fully covered by theglow and offers the possibility of uniform processing of thematerial. When oxidized surfaces of metals are exposed tohydrogen plasma at appropriate pressure and temperaturethey become metallic due to the removal of oxide layers byreduction and sputtering. Therefore ultra-high cleansurfaces may be prepared by treating samples in ahydrogen plasma environment, prior to being transferredto a system for additional processing. For example, this
ee front matter r 2005 Elsevier Ltd. All rights reserved.
cuum.2005.09.007
ing author. Tel.: +9251 2273999; fax: 92 51 9210256.
esses: [email protected],
yahoo.com (M. Zakaullah).
approach facilitates the diffusion of nitrogen atoms fromthe surface to the bulk providing stronger adhesion ofnitrided films [3]. The efficiency of chemical processesoccurring in the plasma and their reaction rates aregenerally dependent on the density of the charged particlesand their attendant energy [4]. Detailed informationconcerning electron number density, electron temperature,and the electron energy distribution function (EEDF) areoften used as the starting point for understandingassociated plasma phenomena including particle collisionprocesses, plasma reactions, and plasma surface interac-tions. For these reasons, accurate and reliable informationconcerning the electron behavior is an important first stepin many different kinds of plasma-related researches. Atthe most basic level, knowledge of these parameters notonly is critical to the understanding of complex plasmabehavior, but also provides a basis for optimizing theconditions for surface treatment or related processingapplications [5]. Optical emission spectroscopy (OES) is the
ARTICLE IN PRESSA. Qayyum et al. / Vacuum 80 (2006) 574–580 575
most popular technique for investigating glow dischargessince it produces no perturbation to the plasma and can beemployed quite simply to obtain information aboutelectron temperature and density. There are a variety ofspectroscopic methods used for the determination ofelectron temperature, but the method based on determiningthe relative intensities of two spectral lines belonging to thesame atom is most commonly used, because it offers thepossibility to evaluate the electron temperature without aknowledge of number density of the atomic species [6]. Thestandard spectroscopic technique used for electron densitydetermination of low-temperature plasmas is the applica-tion of Stark broadening of suitable spectral lines. TheStark broadening of a certain spectral line spontaneouslyemitted by species in the plasma allows determination ofthe electron density, provided the electron temperature isknown [7]. As a consequence of the linear Stark effect,spectral lines of hydrogen exhibit significant broadeningcompared to lines of other plasma constituents. The shapesof these lines depend not only on the specific transitionsbetween two energy levels but also on the density of thecharged particles in the hydrogen plasma discharge.Therefore, the Stark broadening of these lines is oftenused for plasma diagnostic purposes. Particularly, the full-width at half-maximum (FWHM) of the Balmer series isfrequently used as a measure of electron density in plasma[8]. The corresponding theoretical broadening parametersare well known from standard theories [9,10].
This work describes the study of Hb and Hg emissionprofiles associated with the abnormal glow hydrogenplasma. Results correlate the calculated values of plasmaelectron temperature and density with the fill pressure anddischarge power. The electron temperature is determinedby comparing the emission intensity of Hb and Hg lines,whereas the electron density is calculated by using the
Fig. 1. Schematic illustration o
Stark broadening of Balmer-b line. This technique offersthe possibility of determining the electron temperature anddensity rapidly.
2. Experiment
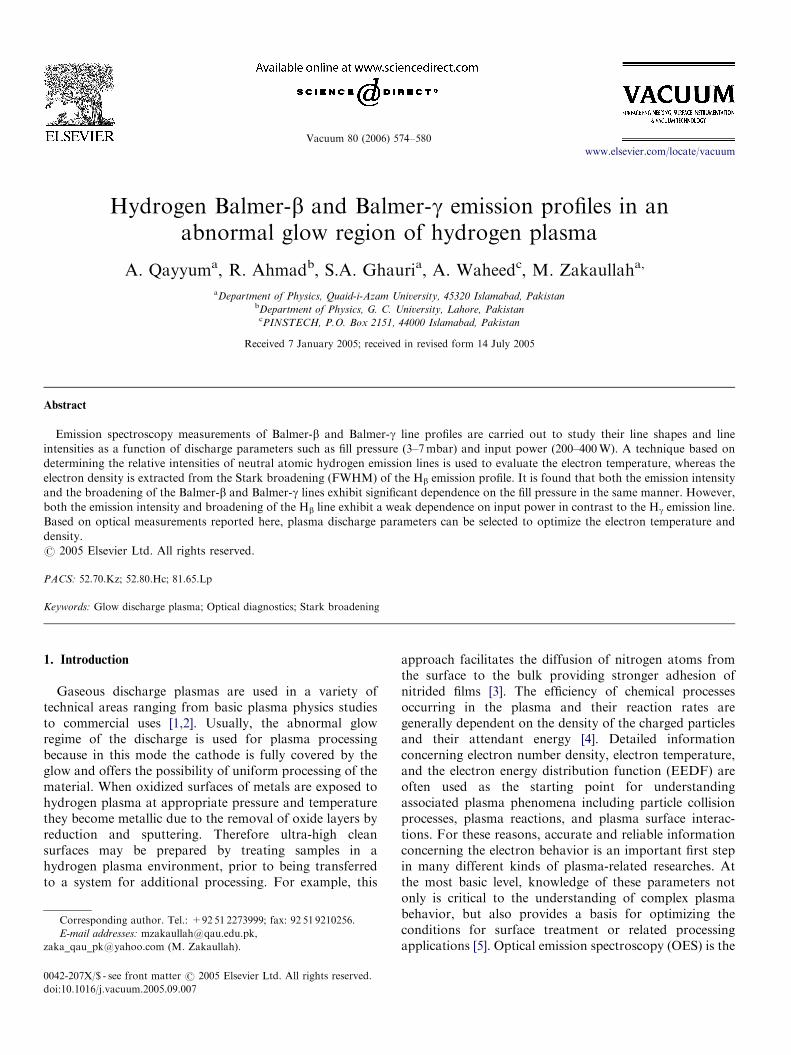
The experiment is carried out in a parallel plate electrodeconfiguration consisting of stainless steel electrodes with adiameter of 7.5 cm and a spacing of 6.0 cm. The side andback of the electrodes are covered with ceramic casing toprevent additional discharge. The electrode assembly ishoused in a cylindrical stainless steel vacuum chamber of40 cm diameter and height. The experimental set-up isshown schematically in Fig. 1. Prior to admitting hydrogengas into the chamber, it is evacuated down to 10�5mbarusing a rotary vane pump and oil diffusion pump. The flowof hydrogen gas is monitored with a mass flow meter,whereas pressure in the chamber is recorded by using acapsule-type dial gauge. Pulsed DC power having pulsewidth (FWHM) of 7ms, obtained from a 50Hz AC powersource through a step-up transformer and a diode chain(in half-wave rectifier arrangement), is applied to the topelectrode through the inductive load, which limits thecurrent during the discharge. The bottom electrode isgrounded. The glow discharge is generated in the abnormalregion and OES is carried out using a computer-controlledsystem comprised of a McPherson-2061 monochromatorhaving 1200 groove/mm and spectral resolution of 0.01 nmcoupled with a side window photomultiplier tube (PMT-9781B) and auto-ranging Pico-ammeter (Keithley-485).The system is calibrated using a mercury lamp. Theemission of Hb and Hg Balmer lines is recorded as afunction of fill pressure (3–7mbar) and electrical power(200–400W) by keeping the corresponding dischargeparameters constant. The effect of fill pressure and
f the experimental set-up.

ARTICLE IN PRESS
485.4 485.6 485.8 486.0 486.2 486.4 486.6 486.8 487.00.0
8.0x10⁻⁶
1.6x10⁻⁶
2.4x10⁻⁶
3.2x10⁻⁶
4.0x10⁻⁶
4.8x10⁻⁶
5.6x10⁻⁶
6.4x10⁻⁶ Input electrical power = 250 watts
Em
issi
on
inte
nsi
ty (
a.u
.)
Wavelength (nm)
3 mbar4 mbar5 mbar6 mbar7 mbar
Em
issi
on
inte
nsi
ty (
a.u
.)
Wavelength (nm)
485.4 485.6 485.8 486.0 486.2 486.4 486.6 486.8 487.00.0
1.0x10⁻⁶
2.0x10⁻⁶
3.0x10⁻⁶
4.0x10⁻⁶
5.0x10⁻⁶
6.0x10⁻⁶
7.0x10⁻⁶
(b)
(a)
Fill pressure = 5 mbar200 watts250 watts300 watts350 watts400 watts
Fig. 2. Dependence of Balmer-b line profile on (a) fill pressure, (b) input
electrical power.
A. Qayyum et al. / Vacuum 80 (2006) 574–580576
electrical power on the shapes and emission intensities ofHb and Hg Balmer lines, electron temperature, the Starkbroadening of Hb line and electron density is investigatedby recording the spectra under different discharge condi-tions.
3. Spectroscopy of Balmer Hb and Hc emission profiles
3.1. Hydrogen Balmer lines
Hydrogen spectral lines of the Balmer series have beenthe subject of numerous experimental investigations,because of their convenient location in the visible regionof the spectrum. The energy levels of neutral hydrogen(because of their special 2n2-fold degeneracy) interact withlocal electric fields produced by neighboring electrons andions in the plasma according to the scheme of the linearStark effect. As a result, the spectra exhibit symmetricalsplitting of the lines due to shift in the eigenstates [6]. Thehydrogen emission lines exhibit significant broadeningcompared to lines of other plasma species. These localelectric fields vary with electron and ion densities and theirassociated energies. This fact facilitates the determinationof plasma electron density in the emitting plasma from theobserved line profiles. The temperature needs to be knownonly approximately, because the temperature dependenceof Stark profiles is rather weak [11]. In turn, the Starkbroadening of hydrogen Balmer lines provides a sensitivemeasure of the electron density and number of excitedhydrogen atoms in a glow discharge [12]. The spectralprofiles of the Hb and Hg lines are shown in Figs. 2 and 3 todemonstrate their dependence on fill pressure and electricalinput power.
3.2. Plasma electron temperature
Plasma electron temperature can be determined byspectroscopic techniques in a variety of ways, but the mostcommonly used method to determine the electron tem-perature (Te) of a laboratory plasma is based on determin-ing the relative intensities of the two spectral lines of thesame atom [11]. For low electron density plasmas(neo1011 cm�3), the steady-state coronal model is applic-able, which balances radiative decay against electronimpact excitation; electron temperature determines thepopulation of the excited states. This method also assumesthat the velocity distribution of the electrons is Maxwellianand the population of emitting levels follows the Boltz-mann distribution. Consequently, the line intensity ratio isassumed to depend solely on the electron temperature inthe low-pressure plasma. The spectroscopically determinedelectron temperature based on this model is reasonablyaccurate even for low electron density plasmas [12–15].Explicitly, the formula is
Te ¼E2 � E1
kln
A2g2I1l1A1g1I2l2
� �� ��1.
Here I2, l2, A2 and g2 are the total emission intensity(integrated over the profile), the wavelength, the transitionprobability and statistical weight for Hg emission line,respectively. E2 is the energy of the upper level of Hg (5,2)transition. The corresponding quantities for the Hb (4,2)emission line are I1, l1, g1, A1 and E1. The emission profilesof Hb and Hg are recorded as a function of fill pressure andelectrical power by keeping the corresponding parametersconstant. The electron temperature is calculated by usingthe relative emission intensities of Hb and Hg linesnormalized with the spectral response of the PMT andmonochromator grating. Excitation energies, wavelengths,transition probabilities and statistical weights are takenfrom compiled data [16]. The dependence of intensity ratio(Hb/Hg) of the Balmer-b and Balmer-g emission profiles onfill pressure and input electrical power is evaluated andpresented in Fig. 4 under plasma conditions where thehighest emission intensities are observed; the variation of
ARTICLE IN PRESS
433.4 433.6 433.8 434.0 434.2 434.4 434.6 434.80.0
3.0x10⁻⁷
6.0x10⁻⁷
9.0x10⁻⁷
1.2x10⁻⁶
1.5x10⁻⁶
1.8x10⁻⁶
2.1x10⁻⁶
2.4x10⁻⁶ Input electrical power = 250 watts
Em
issi
on
inte
nsi
ty (
a.u
.)
Wavelength (nm)
3 mbar
4 mbar
5 mbar
6 mbar
7 mbar
Em
issi
on
inte
nsi
ty (
a.u
.)
Wavelength (nm)
433.4 433.6 433.8 434.0 434.2 434.4 434.6 434.80.0
3.0x10⁻⁷
6.0x10⁻⁷
9.0x10⁻⁷
1.2x10⁻⁶
1.5x10⁻⁶
1.8x10⁻⁶
2.1x10⁻⁶
2.4x10⁻⁶
(b)
(a)
Fill pressure = 5 mbar 200 watts
250 watts
300 watts
350 watts
400 watts
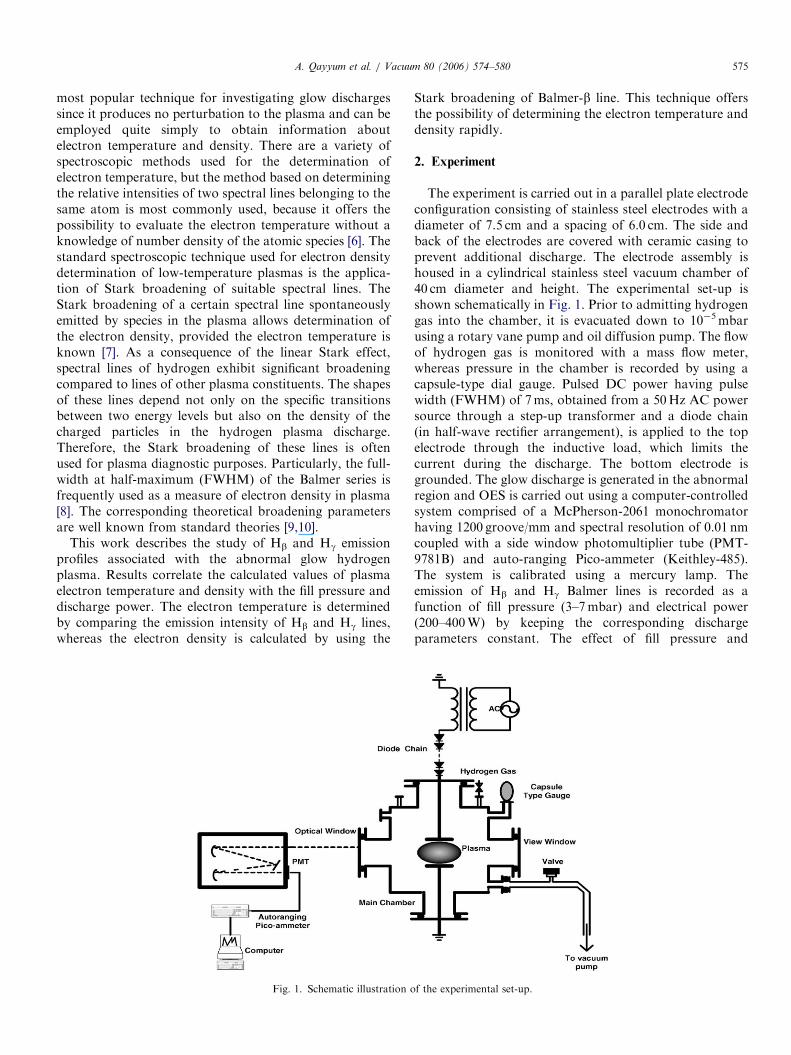
Fig. 3. Dependence of Balmer-g line profile on (a) fill pressure, (b) input
electrical power.
3.6
3 4 5 6 7
3.8
4.0
4.2
4.4
4.6
4.8
Input electrical power = 200 watts
Input electrical power (watts)
I(H
β )/
I(H
γ)I(
Hβ
)/I(
Hγ)
Fill pressure (mbar)
200 250 300 350 400
3.6
3.8
4.0
4.2
4.4
4.6
4.8
(b)
(a)
Fill pressure = 5 mbar
Fig. 4. Dependence of emission intensity ratio of Hb and Hg lines on (a)
fill pressure, (b) input electrical power.
A. Qayyum et al. / Vacuum 80 (2006) 574–580 577
electron temperature as a function of fill pressure andelectrical power is determined and shown in Fig. 5.
3.3. Plasma electron density
The emission profiles of Balmer-b line can be affectedby different mechanisms including natural broa-dening, the Doppler broadening, the Stark Broadening,instrumental broadening, etc. Generally, the most impor-tant broadening mechanisms generate Gaussian profiles,except the Stark broadening, which mainly generates aLorentzian profile. In turn, the convolution of theLorentzian and the Gaussian profiles results in theso-called the Voight profile that includes contributionsfrom different plasma processes that can influence theshape of an emission line. It is possible to deconvolutethe Lorentzian (Stark) contribution according to the
following relationship [6]:
DlVoight
�DlLorentz
2
� �2
þ ðDlGaussÞ2
" #1=2þ
DlLorentz
2
� �.
Measurements are made in terms of the FWHM of bothtypes of contributions.The 2n2 degenerate levels of hydrogen separate with
energy shifts proportional to the local electric fields mostlygenerated by the neighboring electrons as a function oftheir density and energy. This fact facilitates the determi-nation of plasma electron density and field strength interms of the Stark broadening. The relationship between
ARTICLE IN PRESS
200 250 300 350 400
3500
3750
4000
4250
4500
4750
5000Fill pressure = 5 mbar
Ele
ctro
n t
emp
erat
ure
(K
)
Fill pressure (mbar)
Ele
ctro
n t
emp
erat
ure
(K
)
Input electrical power (watts)
3 4 5 6 7
3300
3600
3900
4200
4500
4800
(b)
(a)
Input electrical power = 200 watts
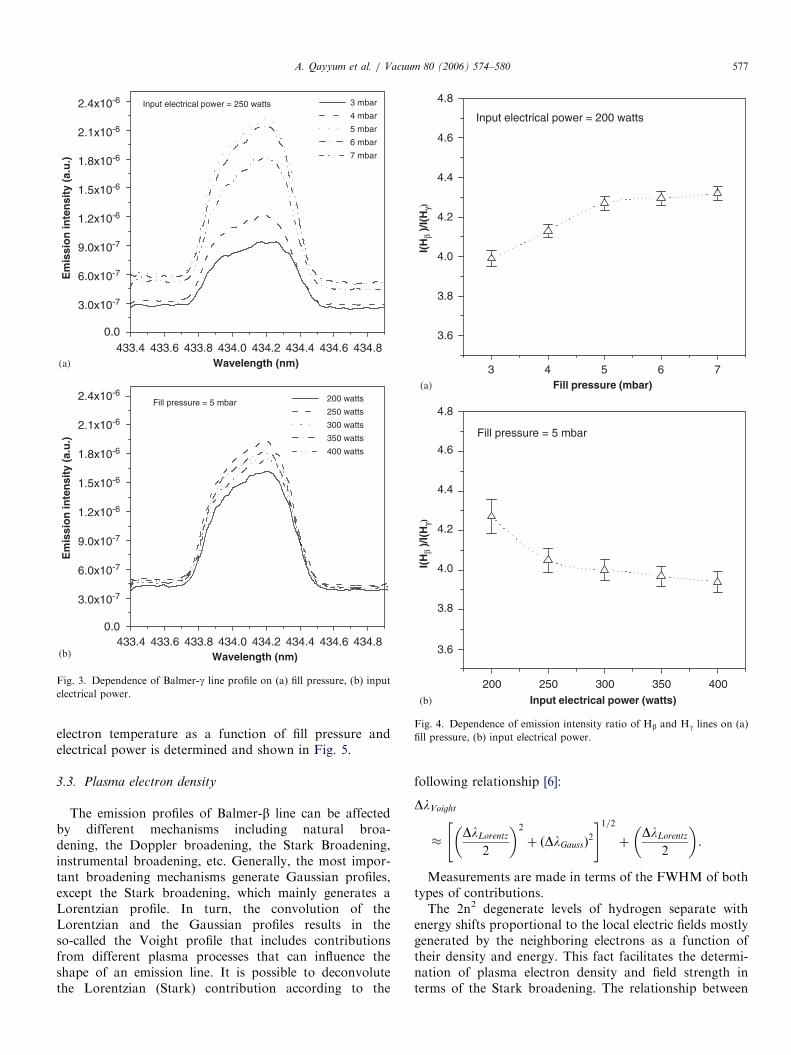
Fig. 5. Dependence of plasma electron temperature on (a) fill pressure,
(b) input electrical power.
200 250 300 350 4000.20
0.22
0.24
0.26
0.28
0.30
Fill pressure = 5 mbar
FW
HM
[nm
]
Fill pressure (mbar)
FW
HM
[nm
]
Input electrical power (watts)
3 4 5 6 70.18
0.20
0.22
0.24
0.26Input electrical power = 200 watts Stark
(a)
(b)
∆λβ
Stark∆λβ
Fig. 6. Dependence of the Stark broadening (FWHM) on (a) fill pressure,
(b) input electrical power.
A. Qayyum et al. / Vacuum 80 (2006) 574–580578
the Stark broadening DlS of the Balmer-b line innanometers, the electron density ne in m�3 and the electrontemperature Te in K is represented phenomenologically bythe following equation [17]:
log ne ¼ C0 þ C1 log ðDlSÞ
þ C2½log ðDlSÞ�2 þ C3 log ðTeÞ.
Here C0 ¼ 22:578, C1 ¼ 1:478, C2 ¼ �0:144 andC3 ¼ 0:1265. In order to determine the electron density(ne) of the hydrogen plasma, the hydrogen b line profile hasbeen recorded as a function of fill pressure and electricalpower and the contribution originating from the otherbroadening mechanisms except the Stark broadening isdeconvoluted by applying the above given deconvolutionprocedure. The Stark broadenings of Balmer-b and
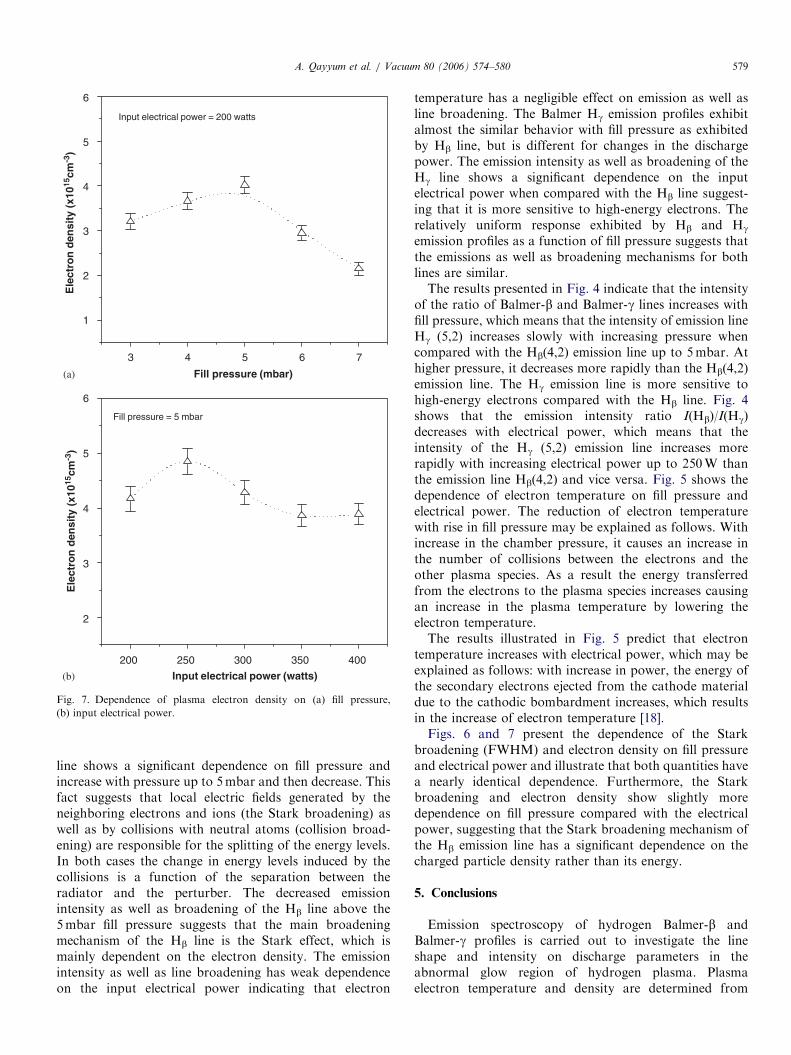
Balmer-g emission lines as a function of fill pressure andelectrical power obtained from Voight profile deconvolu-tion is given in Fig. 6. From the calculated intrinsic Starkwidth and electron temperature, the electron density isdeduced by using the relationship above. The electrondensity determined as a function of fill pressure andelectrical power is presented in Fig 7.
4. Results and discussion
The hydrogen Balmer-b and Balmer-g emission profilesare recorded as a function of fill pressure (3–7mbar) andelectrical power (200–400W) by keeping the flow rate con-stant, and the results are presented in Figs. 2 and 3. Boththe emission intensity and broadening of the Balmer-b
ARTICLE IN PRESS
3 4 5 76
1
2
3
4
5
6
Input electrical power = 200 watts
Ele
ctro
n d
ensi
ty (
x1015
cm-3
)
Input electrical power (watts)
Ele
ctro
n d
ensi
ty (
x1015
cm-3
)
Fill pressure (mbar)
200 250 300 350 400
2
3
4
5
6
(b)
(a)
Fill pressure = 5 mbar
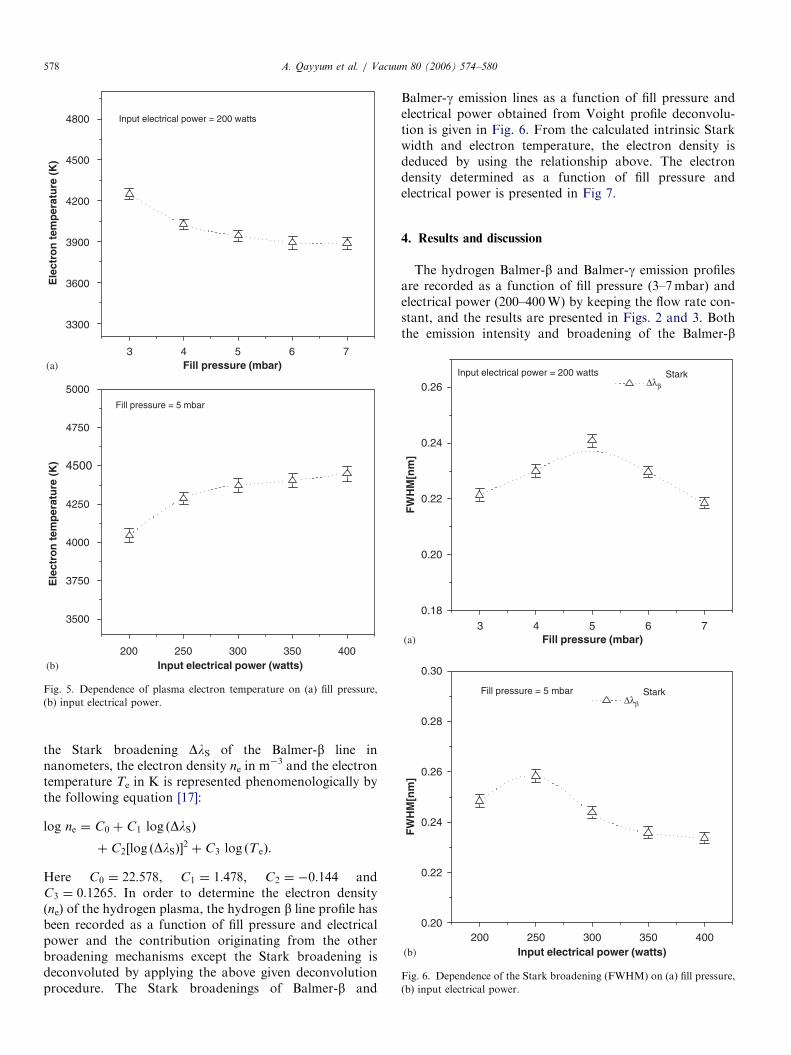
Fig. 7. Dependence of plasma electron density on (a) fill pressure,
(b) input electrical power.
A. Qayyum et al. / Vacuum 80 (2006) 574–580 579
line shows a significant dependence on fill pressure andincrease with pressure up to 5mbar and then decrease. Thisfact suggests that local electric fields generated by theneighboring electrons and ions (the Stark broadening) aswell as by collisions with neutral atoms (collision broad-ening) are responsible for the splitting of the energy levels.In both cases the change in energy levels induced by thecollisions is a function of the separation between theradiator and the perturber. The decreased emissionintensity as well as broadening of the Hb line above the5mbar fill pressure suggests that the main broadeningmechanism of the Hb line is the Stark effect, which ismainly dependent on the electron density. The emissionintensity as well as line broadening has weak dependenceon the input electrical power indicating that electron
temperature has a negligible effect on emission as well asline broadening. The Balmer Hg emission profiles exhibitalmost the similar behavior with fill pressure as exhibitedby Hb line, but is different for changes in the dischargepower. The emission intensity as well as broadening of theHg line shows a significant dependence on the inputelectrical power when compared with the Hb line suggest-ing that it is more sensitive to high-energy electrons. Therelatively uniform response exhibited by Hb and Hg
emission profiles as a function of fill pressure suggests thatthe emissions as well as broadening mechanisms for bothlines are similar.The results presented in Fig. 4 indicate that the intensity
of the ratio of Balmer-b and Balmer-g lines increases withfill pressure, which means that the intensity of emission lineHg (5,2) increases slowly with increasing pressure whencompared with the Hb(4,2) emission line up to 5mbar. Athigher pressure, it decreases more rapidly than the Hb(4,2)emission line. The Hg emission line is more sensitive tohigh-energy electrons compared with the Hb line. Fig. 4shows that the emission intensity ratio I(Hb)/I(Hg)decreases with electrical power, which means that theintensity of the Hg (5,2) emission line increases morerapidly with increasing electrical power up to 250W thanthe emission line Hb(4,2) and vice versa. Fig. 5 shows thedependence of electron temperature on fill pressure andelectrical power. The reduction of electron temperaturewith rise in fill pressure may be explained as follows. Withincrease in the chamber pressure, it causes an increase inthe number of collisions between the electrons and theother plasma species. As a result the energy transferredfrom the electrons to the plasma species increases causingan increase in the plasma temperature by lowering theelectron temperature.The results illustrated in Fig. 5 predict that electron
temperature increases with electrical power, which may beexplained as follows: with increase in power, the energy ofthe secondary electrons ejected from the cathode materialdue to the cathodic bombardment increases, which resultsin the increase of electron temperature [18].Figs. 6 and 7 present the dependence of the Stark
broadening (FWHM) and electron density on fill pressureand electrical power and illustrate that both quantities havea nearly identical dependence. Furthermore, the Starkbroadening and electron density show slightly moredependence on fill pressure compared with the electricalpower, suggesting that the Stark broadening mechanism ofthe Hb emission line has a significant dependence on thecharged particle density rather than its energy.
5. Conclusions
Emission spectroscopy of hydrogen Balmer-b andBalmer-g profiles is carried out to investigate the lineshape and intensity on discharge parameters in theabnormal glow region of hydrogen plasma. Plasmaelectron temperature and density are determined from

ARTICLE IN PRESSA. Qayyum et al. / Vacuum 80 (2006) 574–580580
spectroscopic measurements of the relative emissionintensity of the electronic transitions having a commonlower level and the Stark broadening (FWHM) of the Hb
line. It is found that both the emission intensity and thebroadening of the Balmer-b and Balmer-g lines exhibit asignificant dependence on the fill pressure. The emissionintensity and broadening of the Hb line shows a weakdependence on electrical power compared with the Hg
emission line. The emission intensity ratio I(Hb)/I(Hg)increases with increasing fill pressure, whereas it decreaseswith increasing electrical power. These results suggest thatthe high-energy tail of the electron energy distributionfunction (EEDF) contracts with increasing fill pressure andexpands with increasing electrical power. This fact also isconfirmed from calculation of the electron temperature.The Stark broadening (FWHM) and electron density showthe same behavior with fill pressure and input power,demonstrating their linear correlation.
Acknowledgments
The work was partially supported by the Ministry ofScience & Technology Grant, Pakistan Science FoundationProject no. PSF/R&D/C-QU/Phys. (199), ICSC–WorldLaboratory Project E-13 CHEPCI Islamabad, Quaid-i-Azam University Research Fund and Higher EducationCommission Research Project for Plasma Physics.
References
[1] Graves DB. IEEE Trans Plasma Sci 1994;22:31–41.
[2] Bogaerts A, Neyts E, Gijbels R, van der Mullen Jr. Spectrochim Acta
B 2002;57:609–58.
[3] Schlapbach L, Zuttel A, Groning P, Groning O, Aebi P. Appl Phys A
2001;72:245–55.
[4] Conrads H, Schmidt M. Plasma Sources Sci Technol 2000;9:441–54.
[5] Bowden MD, Kogano M, Suetome Y, Hori T, Uchino K, Muraoka
K. J Vac Sci Technol A 1999;17:493–9.
[6] Lochte-Holtgreven W. Plasma Diagnostics. New York: Wiley; 1968.
[7] Torres J, Junkers J, van de Sande MJ, van der Mullen JJAM,
Gamero A, Sola A. J Phys D Appl Phys 2003;36:L55–9.
[8] Wujec T, Olchawa W, Halenka J, Musielok J. Phys Rev E
2002;66:066403–11.
[9] Griem HR. Plasma Spectroscopy. New York: Academic Press; 1964.
[10] Griem HR. Principles of Plasma Spectroscopy. Cambridge: Cam-
bridge University Press; 1997.
[11] Griem HR. Phys Scr 1999;T83:142–8.
[12] Randell LM, Paresh CR, Mark N, Xuemin C, Robert MM. IEEE
Trans Plasma Sci 2003;31:338–55.
[13] Boivin RF, Kline JL, Scime EE. Phys Plasma 2001;12:5303–14.
[14] Qayyum A, Shan SA, Zakaullah M, Waheed A. Int J Mod Phys B
2004;18:1687–96.
[15] Qayyum A, Ikram M, Zakaullah M, Waheed A, Murtaza G, Ahmed
R, Majeed A, Khattak NAD, Mansoor K, Chaudhary KA. Int J
Mod Phys B 2003;17:2749–59.
[16] Wiese WL, Smith MW, Miles BM. Atom Trans Prob 1969 NSRDS-
NBS US.
[17] Czernikpwski A, Chapelle J. Acta Phys Pol A 1983;63:67–75.
[18] Lu ZC, Foster JE, Snodgrass TG, Booske JH, Wendt EJ. J Vac Sci
Technol A 1999;17:840–50.