Starter Activity: - Glow Blogs
97
Starter Activity: How many different plant species are in this field? How would you find this out?
-
Upload
khangminh22 -
Category
Documents
-
view
1 -
download
0
Transcript of Starter Activity: - Glow Blogs

Starter Activity:
How many different plant species are in this field?
How would you find this out?
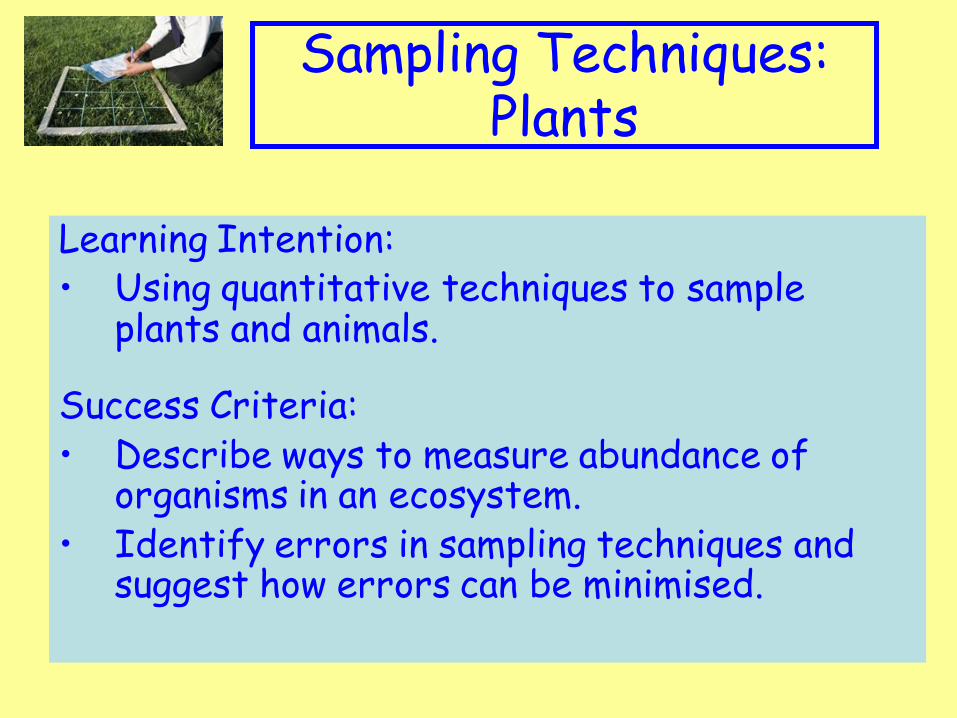
Sampling Techniques: Plants
Learning Intention: • Using quantitative techniques to sample
plants and animals.
Success Criteria: • Describe ways to measure abundance of
organisms in an ecosystem. • Identify errors in sampling techniques and
suggest how errors can be minimised.
Appropriate Clip art to topic

Sampling Techniques
• Studying an ecosystem involves: – Finding out what plants and animals live there.
– Finding out how many of them live there.
– Finding out why they live there.
Think: How would you do this?
Pair: Discuss with a partner how would carry out each of the above
Share: With another pair discuss your ideas.

Abundance
• Abundance is the measure of how frequently a species of plant or animal appears in a particular area.
• Abundance can be measured using sampling techniques.

Counting plants
• It would be very difficult to count every single plant in a field. How could you resolve this problem?
• We can sample using a quadrat.

• Sampling using a quadrat: – A quadrat is a square frame with a known area
such as 1m2
– It is used to estimate numbers of plants or slow moving animals (slugs or snails).
1m
1m

Example 1
Estimating the abundance of thistles in a field:
• Quadrat placed at random and number of thistles in quadrat counted.
• Repeated several times.
• Average number per square metre is calculated.
• Area of whole field measured
• Estimate of total number of thistles in field calculated

Calculate the abundance of flowers in a field with a total area of 150m2
_______flowers in 1m2.
_______ x ________= ____ flowers in a field of 150m2.
Example 2
12
12 1800 150
1m
1m

In reality, to make the results of abundance more reliable, many samples would be taken using quadrats and the results then averaged before calculating the abundance of the entire area.
Quadrat Number of flowers
1 12
2 10
3 8
4 14
Average 11
So for the 150m2 area, Abundance = 11 x 150 = 1650 flowers

Possible sources of error with quadrats
Sources of Error Method of minimising errors
1. Organisms in the quadrat may be wrongly identified.
2. Organisms in the quadrat may be wrongly counted.
3. Too few samples have been taken to be representative of the habitat.
A. Use the same rule for each quadrat to count part of organisms or not.
B. Use a key to make sure that the organisms are correctly identified.
C. If you notice that organisms are in clusters, increase the sample size.
Match up correct method of minimising error to the source of error:
1. Pair the numbers and letters on a show me board.
2. Create a table in your notebook to show a summary of these errors.

Starter Activity:
How would you sample this field?

Sampling
Learning Intention: • Using quantitative techniques to sample plants
and animals.
Success Criteria: • Measure abundance of organisms in an
ecosystem. • I can identify errors in sampling techniques and
suggest how errors can be minimised.
Appropriate Clip art to topic

Sampling Techniques
Your task… measure the abundance of grass species in the school grounds.
Appropriate Clip art to topic
Think: What equipment will you need to do this?
Pair: Discuss the size of area are you going to sample and where this area will be. How will you record your results?
Share: Explain how you will measure the abundance of grass species in the school grounds.

Sampling Techniques
Equipment List:
Classification key – common grasses
Quadrat
Tape measure
Results table
Clipboard
Appropriate Clip art to topic
Method: 1. Mark out your area e.g. 5m x 5m 2. Decide how you will take random samples. e.g. using
coordinates from a random numbers table. 3. Decide how you will record your data using the quadrat, to
ensure you are consistent each time and a valid sample. 4. Record the name of each species you find in each quadrat
and the NUMBER of each species (% coverage) 5. Repeat this for 10 quadrat samples

How to sample abundance with a quadrat: You are going to use a 25m²quadrat to investigate the % coverage of plant species.
The easiest way to calculate % coverage is to imagine each box split into 4, so each quarter is worth 1% (or each square is worth 4%) and count how many sections of squares that particular plant species is covering.
E.g. Look at the yellow dandelion flowers, how many sections does it cover?
Answer: 1 quarter of a square = 1%
In this picture the dandelion flowers cover 1 quarter of a square = 1%
1 square
= 4%
1 quarter of a square
= 1%

Quadrat Sampling

Sampling Analysis
Use your data and knowledge about quadrat sampling to answer the following in FULL sentences:
1. How many different plant species did you identify?
2. Which plant species was most abundant?
3. Which plant species was least abundant?
4. What sources of error could have affected your results?
5. How did you overcome these sources of error?
Appropriate Clip art to topic

Wet weather alternative for quadrat sampling:
Click this link for the online resource

Possible sources of error in Quadrats
Sources of Error Method of minimising errors
1. Plant or animal mis-identified
2. Estimation of number of plants is not representative of the area e.g. overestimated/underestimated
3. Some plants or animals may be counted more than once
4. The estimation of the abundance of plants/animals is unreliable
A. Establish a rule such as counting only the plants/animals touching the left and bottom of the quadrat
B. Use a key to identify organisms.
C. Take a larger number of samples
D. Sample a larger number of quadrats in an area.
Match up correct method of minimising error to the source of error:
1. Pair the numbers and letters on a show me board.
2. Create a table in your notebook to show a summary of these errors.

Sampling Techniques: Invertebrates
Learning Intention: • Using quantitative techniques to sample plants
and animals.
Success Criteria: • I can describe ways to measure abundance of
organisms in an ecosystem. • I can identify errors in sampling techniques and
suggest how errors can be minimised.
Appropriate Clip art to topic

– A container is placed in a hole in the
ground to trap animals that are active at the soil surface.
– Several traps should be set up to increase reliability of the results.
Sampling Using a Pitfall Trap

Pitfall Trap • Traps can be placed to compare
different areas and see what animals are more abundant in each.

Your task… Use page 284 – 285 of the National 5 text book and your
iPad to make notes about further sampling techniques, adding possible sources of error and how you would overcome these. You may present the information any way you wish.
• Tullgren funnel • Pooters • Tree beating • Sweep netting • Pond netting
Other Methods of Sampling
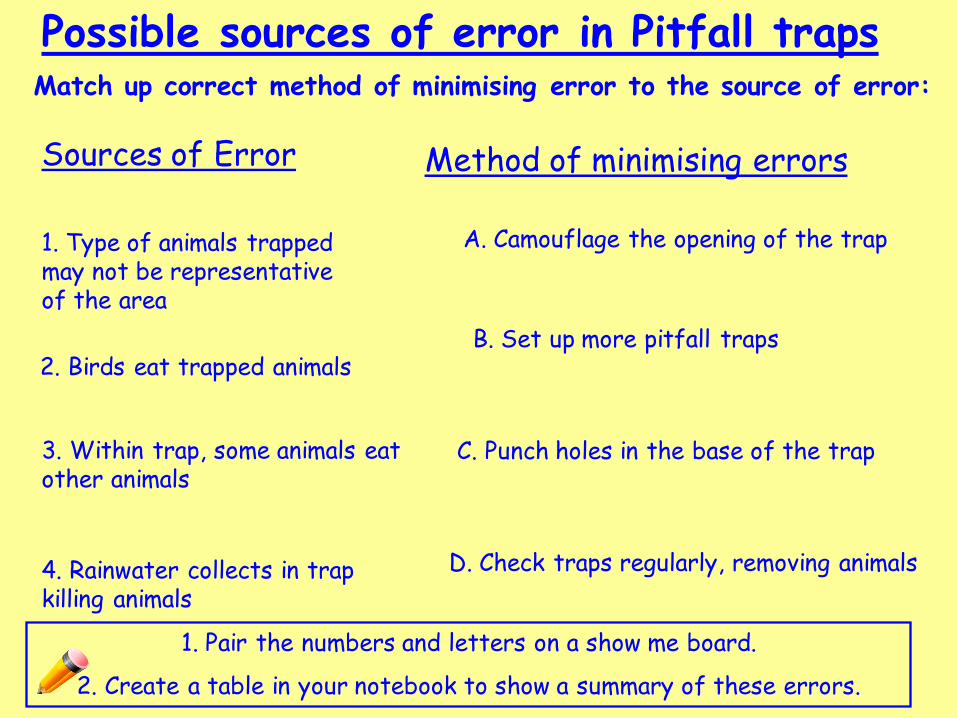
Possible sources of error in Pitfall traps
Sources of Error Method of minimising errors
1. Type of animals trapped may not be representative of the area
2. Birds eat trapped animals
3. Within trap, some animals eat other animals
4. Rainwater collects in trap killing animals
A. Camouflage the opening of the trap
B. Set up more pitfall traps
C. Punch holes in the base of the trap
D. Check traps regularly, removing animals
Match up correct method of minimising error to the source of error:
1. Pair the numbers and letters on a show me board.
2. Create a table in your notebook to show a summary of these errors.

Starter Activity: Ideas on a show me board
How would you explain to a small child how to identify the following organisms?

Classification Keys
Learning Intention:
• Paired statement keys.
Success Criteria:
• I can construct paired statement keys to identify unknown plants or animals found during sampling an ecosystem.
Appropriate Clip art to topic

Classification Keys
• When using sampling methods, it is important that you are able to identify the plants or animals you have found.
• One method of identification is to use a key.

Keys
• Used to identify organisms while sampling.
• There are two types
– Branched keys
– Paired Statement keys

Branching keys
• A key is a series of questions. Each question leads to another until eventually the name of the organism is found.

Paired Statement Key
• Instead of asking questions at branching points on a diagram, you are asked to choose between two statements.
• Each pair of statements is numbered and the instructions send you to the next relevant pair of statements.

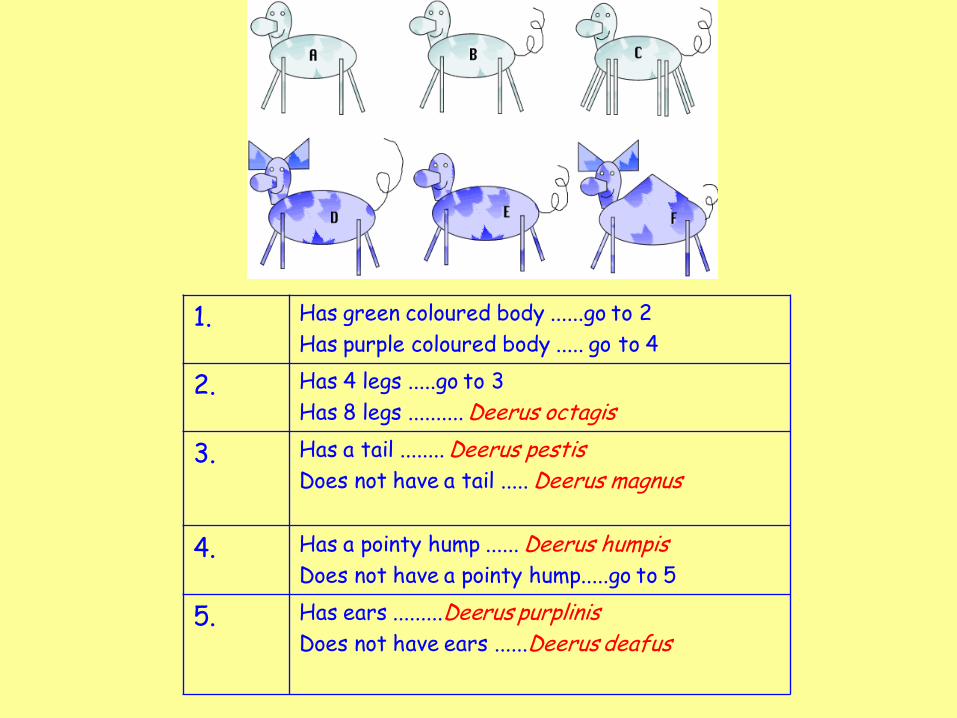
1. Has green coloured body ......go to 2
Has purple coloured body ..... go to 4
2. Has 4 legs .....go to 3
Has 8 legs .......... Deerus octagis
3. Has a tail ........ Deerus pestis
Does not have a tail ..... Deerus magnus
4. Has a pointy hump ...... Deerus humpis
Does not have a pointy hump.....go to 5
5. Has ears .........Deerus purplinis
Does not have ears ......Deerus deafus

Vertebrates Remember to use obvious visible characteristics when constructing paired statement keys.
What are the obvious visible characteristics?

Invertebrates Remember to use obvious visible characteristics when constructing paired statement keys.
wasp centipede
earwig
spider What are the obvious
visible characteristics?

Invertebrates Remember to use obvious visible characteristics when constructing paired statement keys.
mayfly Caddis fly larva
stonefly flatworm
limpet
Fresh water shrimp
What are the obvious visible
characteristics?

Paired Statement Key
Click on a leaf number 1 to start, then complete leaves 2-6 in that order
1.
2.
3.
4. 5.
6.

Construct a paired statement key for the animals below:
1.
2.
3.
4.
5.

Invertebrate Number of legs
Wings Body Stripe
Spider 8 No No
Wasp 6 Yes Yes
Fly 6 Yes No
Springtail 6 No No
Construct a paired statement key for the information below:
Example 1

Plant Presence of chlorophyll
Presence of cones
Presence of flowers
Aquatic
Grass Yes No Yes No
Spruce Yes Yes No No
Yeast No No No No
Moss Yes No No No
Seaweed Yes No No Yes
Construct a paired statement key for the information below:
Example 2

Bird Type of feet Crest on head
Beak shape
Head colour
Swan Webbed Absent Straight White
Curlew Not Webbed Absent Curved Brown
Rook Not Webbed Absent Straight Black
Puffin Webbed Absent Straight Black
Skylark Not Webbed Present Straight Brown
Avocet Not Webbed Absent Curved Black
Construct a paired statement key for the information below:
Example 3

Name Body Design
External or
Internal
Suckers Wings Legs Size
Liver fluke
Unsegmented Internal 2 None None Macroscopic
Polystoma Unsegmented Internal More than 2 None None Macroscopic
Mange Mite
Segmented External None None 4 pairs Microscopic
Sheep tick
Segmented External None None 4 pairs Macroscopic
Sheep ked Segmented External None None 3 pairs Macroscopic
Tetse fly Segmented External None Present 3 pairs Macroscopic
Leech Segmented External Present None None Macroscopic
Diplozoon Unsegmented External Present None None Macroscopic
Construct a paired statement key for the information below:
Example 4

Classification Keys
Learning Intention:
• Paired statement keys.
Success Criteria:
• I can construct paired statement keys to identify unknown plants or animals found during sampling an ecosystem.
Appropriate Clip art to topic

Starter Activity:
What can be measured in this picture?

Abiotic Factors
Learning Intention: • Measurement of abiotic factors.
Success Criteria: • Give examples biotic and abiotic factors. • Measure abiotic factors (light intensity,
temperature, pH and soil moisture). • Explain why abiotic factors affect
distribution of organisms in an ecosystem.
Appropriate Clip art to topic

Measuring abiotic factors • Light intensity:
– Light meter is held with sensor panel pointed towards source to be measured
– Reading is taken when pointer stops moving
Possible errors • Casting a shadow over meter
while taking reading. • Changing weather such as cloud
cover. All measurements should be taken at same time of day.

• Soil moisture:
– Ensure probe of moisture meter is pushed fully into soil.
– Reading taken when pointer stops moving.
– Possible errors:
• Probe not dry at start. Probe should be wiped before every use.
Measuring abiotic factors

• pH:
– Ensure probe of moisture meter is pushed fully into soil.
– Reading taken when pointer stops moving.
– Take a soil sample, make a solution and use a chemical test.
– Possible errors:
• Probe not dry at start. Probe should be wiped before every use.
• Contamination of samples.
Measuring abiotic factors

• Soil temperature: – Ensure thermometer or
temperature probe is pushed fully into soil.
– Reading taken when level stops moving.
– Possible errors:
• Thermometer is not left in the soil for long enough.
• Leave in the ground for two minutes before taking reading.
• Do not remove from the ground when taking the
reading.
Measuring abiotic factors

Measuring Abiotic Factors Take one piece of A4 paper and fold it in half twice:
Light Intensity
1. Describe how to use the light meter.
2. Describe any sources of error and how you would prevent this.
3. Add a diagram if you can
Temperature
1. Describe how to use the thermometer/temperature probe
2. Describe any sources of error and how you would prevent this.
3. Add a diagram if you can
Soil pH
1. Describe how to use the pH meter/chemical test.
2. Describe any sources of error and how you would prevent this.
3. Add a diagram if you can
Soil Moisture
1. Describe how to use the moisture meter.
2. Describe any sources of error and how you would prevent this.
3. Add a diagram if you can

• Organisms can only survive in an ecosystem if certain abiotic factors suited to their needs are present there.
• This affects the distribution of organisms in any ecosystem.
• For example:
– Daisies only grow in areas of high light intensity so they can carry out photosynthesis, therefore they are found in open areas and not in the shade of larger plants eg. Trees.
The effect of abiotic factors on the distribution of organisms.
Think: Can you think of any other examples?
Pair: Compare your ideas with a partner.
Share: Share your thoughts with another pair and be ready to feedback your best example.

Starter
Biotic and Abiotic Factors
Learning Intention: • Measurement of biotic and abiotic factors.
Success Criteria: • Give examples biotic and abiotic factors. • Measure abiotic factors (light intensity,
temperature, pH and soil moisture). • Explain why abiotic factors affect
distribution of organisms in an ecosystem.
Appropriate Clip art to topic
Starter Activity:
In the back of your notebook answer the following:
How would you measure the following:
1. Light Intensity?
2. Soil moisture?
3. Soil temperature?
4. Air temperature?
5. Surface temperature?
6. Soil pH?
7. Soil moisture?

Biotic and Abiotic Factors
Learning Intention: • Measurement of biotic and abiotic factors.
Success Criteria: • Measure abiotic factors (light intensity,
temperature, pH and soil moisture).
Appropriate Clip art to topic

Measuring abiotic factors in the school grounds:
1. Choose five sample sites spread out across the above area.
2. Record each abiotic reading three times and record your results in a suitable table.

Measuring abiotic factors in the school grounds:
Don’t forget your UNITS of measurement!!

Analysis of Results
Results analysis:
1. Present your data in a suitable graph(s).
2. Sketch the sample area into your notebook and highlight your five sample sites.
3. Use your observations from the sample sites to compare the abiotic factors and the distribution of living organisms.
Did you see anything other than grass? Why/why not?

Biotic and Abiotic Factors
Learning Intention: • Measurement of biotic and abiotic factors.
Success Criteria: • Measure abiotic factors (light intensity,
temperature, pH and soil moisture).
Appropriate Clip art to topic

INDICATOR SPECIES.
Learning Intention: Explain what is meant by an
indicator species.
Success Criteria:
•Define the term indicator species.
•Give examples of indicator species.
•Give some examples of indicator
species in different environments.

What do you think is meant by the term
INDICATOR SPECIES?

Indicator Species
An indicator species is a group of organisms whose presence or absence give information about
the level of pollution in the environment.
INDICATOR SPECIES- OIL POLLUTION
http://vimeo.com/16839012

INDICATORS OF FRESH WATER POLLUTION
By sampling the organisms present in the water it is possible to determine the levels of organic pollution.

INDICATORS OF FRESH WATER POLLUTION
In fresh water, certain invertebrates
are only found in unpolluted water (they require a lot of oxygen) .
These invertebrates indicate the water
is UNPOLLUTED.

Stonefly

INDICATORS OF FRESH WATER POLLUTION
Other invertebrates can tolerate
moderate or extreme pollution (they can live in environments with a low
Oxygen concentration). These invertebrates indicate the water
is POLLUTED.

Sludge worms

Level of pollution
Incre
asing pollution
Indicator species
Stonefly or Mayfly Very low
Low
Moderate
High
Very High
Fresh Water Shrimp
Water Louse
Blood worms
Rat tailed maggot
Indicator Species for Fresh water Pollution


Pollution Indicators
In which type of water do you think you would find the
following organisms?

Stonefly Nymph

Water Louse

Caddis Fly Larva

Rat-Tailed Maggot

Mayfly Nymph

Blood worm

Sludge Worm

Pollution Indicators
Collect a copy of the worksheet and stick this into your notes.

DATA SHOWING WHAT HAPPENS WHEN SEWAGE
FROM A TOWN ENTERS A WATER SYSTEM.
town
sewer
1
2 3 4 5
direction of flow

town
sewer
1
2 3 4 5
direction of flow
Look at the map below and the information before
answering the questions on the next 2 slides.

Sample site
Stonefly nymph
Mayfly nymph
Caddis fly larva
Blood worm
Sludge worm
Water louse
Shrimp Rat-tailed maggot
1 55 14 3 0 0 1 2 0
2 0 0 0 0 59 0 0 38
3 0 0 0 10 8 21 0 4
4 0 0 11 5 0 2 9 0
5 40 13 1 0 0 1 1 0
0
5
10
15
20
25
1 2 3 4 5
site
0
10
20
30
40
50
60
70
80
90
100
1 2 3 4 5
site
0
2
4
6
8
10
12
14
1 2 3 4 5
site
Clo
udin
ess
No.
of
Bac
teri
a
Ox
ygen
Con
c.

1. The river is cloudiness at site 2. 1. In which part of the river is the cloudiness greatest?
2. What causes the river to be cloudy?
2. The high level of bacteria causes the cloudiness.
3. Why is there a large no. of bacteria at site 2?
3. The bacteria use the sewage for food and so multiply rapidly.
4. Why is there a low conc. of oxygen at site 2?
4. The bacteria use up the oxygen when breaking down the sewage.
5. Why does the water get less cloudy as you move downstream?
5. It is less cloudy as you move downstream as there are less bacteria
because there is less food (sewage) for them to eat.
6. Give 2 reasons why the oxygen increases as you move downstream?
6. The oxygen increases as (i) there are less bacteria using it and
(ii) more dissolves in from the air.

0
1
2
3
4
5
1 2 3 4 5
site
No.
of
Spe
cies
7. Draw a BAR GRAPH to show the no. of different species at each site.
8. What effect does sewage have on the no. of species at site 2?
8. Sewage reduces the no. of species because sewage is organic pollution
and food for bacteria which use up oxygen when breaking down the
sewage. Some species of organisms die from lack of oxygen

INDICATORS OF AIR POLLUTION


LICHENS give information about the levels of SULPHUR DIOXIDE pollution in the air
Sulphur dioxide is a pollutant produced by the burning of fossil fuels such as coal, oil and gas
LICHENS


NO SULPHUR DIOXIDE
POLLUTION
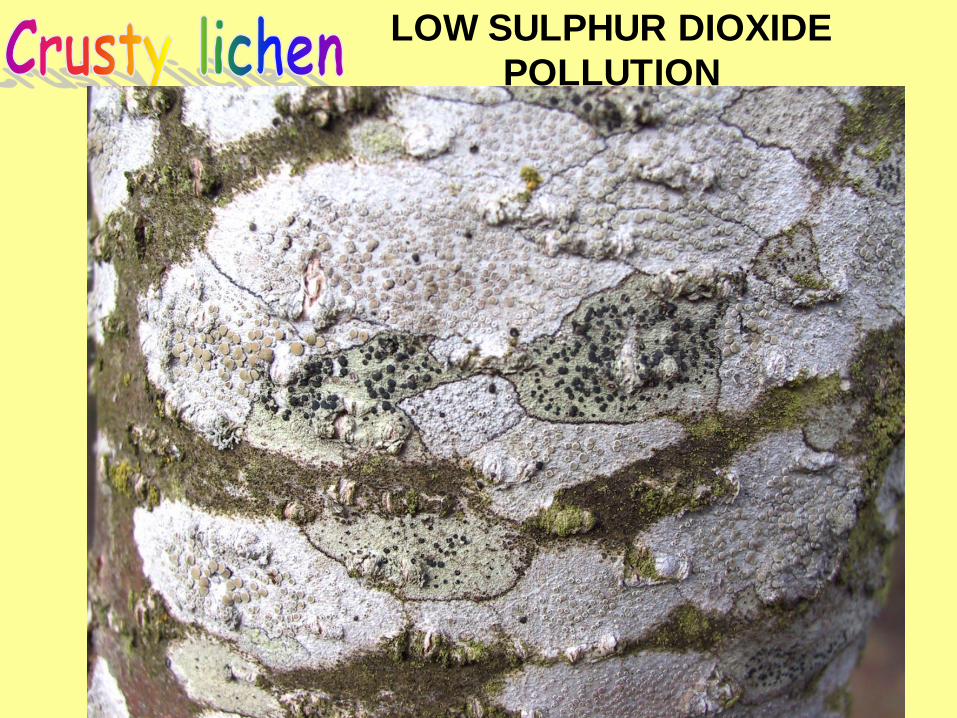
LOW SULPHUR DIOXIDE
POLLUTION

MODERATE SULPHUR DIOXIDE
POLUTION.

HIGH SULPHUR DIOXIDE
POLLUTION

Draw a table to show the different types of lichens and what level of pollution they
indicate.
Leafy
Crusty
Hairy
None
Type of Lichen Level of pollution indicated

1. “LICHENS are unusual plants”. Find out how lichens are formed and then decide if you agree or disagree with this statement.
2. Go out and see if you can spot LICHENS in your environment.
3. Make models of the different types of LICHENS .
Some extra activities you could try;-

WHAT I’M LOOKING FOR:
You know that an indicator species is a
species which tells us something about
the state of the environment
eg. whether it is polluted or not.
You can gives some examples of indicator
species in different environments
eg. fresh water, air.