miniPCR™ DNA Glow Lab™:
24
Version: 1.4 Release: October 2019 © Amplyus 2018-2019 1 | miniPCR DNA Glow Lab TM Exploring DNA Structure Student’s Guide miniPCR™ DNA Glow Lab™: Exploring DNA Structure For use with P51 TM Molecular Glow Lab (or other blue light illuminator 1 ) 1 Compatible with blue light transilluminators such as blueGel™, blueBox™ and other 460-480 nm illuminators.
-
Upload
khangminh22 -
Category
Documents
-
view
4 -
download
0
Transcript of miniPCR™ DNA Glow Lab™:
Version: 1.4
Release: October 2019
© Amplyus 2018-2019
1 | m i n i P C R D N A G l o w L a b T M E x p l o r i n g D N A S t r u c t u r e
Student’s Guide
miniPCR™ DNA Glow Lab™: Exploring DNA Structure
For use with P51TM Molecular Glow Lab
(or other blue light illuminator1)
1 Compatible with blue light transilluminators such as blueGel™, blueBox™ and other 460-480 nm illuminators.
Version: 1.4
Release: October 2019
© Amplyus 2018-2019
2 | m i n i P C R D N A G l o w L a b T M E x p l o r i n g D N A S t r u c t u r e
Student’s Guide
Student’s Guide Contents
1. Background and significance p. 3
2. Laboratory guide p. 9
3. Data tables p. 17
4. Study questions p. 18
5. Appendix: If a miniPCR is not available p. 24
Overview The sentence "This structure has novel features which are of considerable biological interest" may be one of science's most famous understatements. It was published in April 1953 in the Nature article where James Watson and Francis Crick revealed the structure of DNA, the molecule that carries genetic information. Watson and Crick (and Maurice Wilkins) shared a Nobel Prize for determining that DNA is a double stranded helix, held together by specific base pairing. They also predicted, correctly, that at times the base pairs separate allowing DNA to perform functions that are essential for life. In this lab, students will use a fluorescent dye to investigate the conditions that influence DNA structure and its transition from double helix to single strand, and vice versa.
Version: 1.4
Release: October 2019
© Amplyus 2018-2019
3 | m i n i P C R D N A G l o w L a b T M E x p l o r i n g D N A S t r u c t u r e
Student’s Guide
1. Background and significance “This structure has novel features which are of considerable biological interest.”
- A Structure for Deoxyribose Nucleic Acid
Watson J. and Crick F
Nature 171, 737 (1953)
The structure of DNA is both remarkable and unique. The discovery of that structure remains one of the
great advancements in modern science. In 1951, 23-year-old James Watson and 35-year-old student
Francis Crick started working together to try to deduce the structure of the DNA double helix. When they
published their paper less than two years later, Watson and Crick ushered in a biological revolution and
beat out some of the world’s most respected scientists in the race to do so.
When Watson and Crick began working together, it was widely understood that DNA was the genetic
material and that DNA was a polymer, a long biological molecule made of smaller subunits, or nucleotide
monomers. Their job was to figure out how those nucleotides fit together like a molecular puzzle in a way
that made sense both biologically and chemically. Watson and Crick solved this problem by literally
building models out of cardboard, aluminum, and other materials.
Watson and Crick based their models of DNA on the results produced by other scientists. Perhaps most
notably, the X-ray diffraction results of Rosalind Franklin and her student, Raymond Gosling, suggested
that DNA was helical, or spiral, in shape. In 1952, based on these results, Watson and Crick built their first
model of the DNA double helix. It was not correct. Rosalind Franklin, who had a much better
understanding of basic chemistry, pointed out that parts of their model were obviously backwards. Their
version of the double helix had sections that would be repelled by water on the outside, where they
would be in direct contact with water, and parts that would be attracted to water buried on the inside.
Watson and Crick went back to working on their models. Their major breakthrough occurred after
meeting with Erwin Chargaff, a scientist whose work gave them insight into the ratio of different
nucleotides used in DNA. On February 28, 1953, they assembled a structure that both worked chemically
and instantly had clear and profound biological implications. While celebrating in a pub later that day,
according to their own recollection, Crick proclaimed loudly “We have discovered the secret of life.” The
paper detailing their discovery was published in April, 1953.
The biological breakthrough of Watson and Crick’s model was what we now call “complementary base
pairing”, or sometimes “Watson-Crick base pairing.” In its most basic form, base paring says that each
type of nucleotide found in one DNA strand will bind, or pair, with only one other type of nucleotide. If
you know the order of nucleotides on one side of the double helix, you can automatically deduce the
order on the other side of the double helix. Their base pairing model not only explained DNA’s structure,
Version: 1.4
Release: October 2019
© Amplyus 2018-2019
4 | m i n i P C R D N A G l o w L a b T M E x p l o r i n g D N A S t r u c t u r e
Student’s Guide
but also aspects of its function. Today, understanding this model of DNA base pairing is fundamental to
understanding DNA structure, replication and transcription.
DNA structure – the basics
DNA is a double helix, a long spiral shaped molecule made of two strands twisted around each other. Each
strand contains combinations of four nitrogenous bases, adenine (A), thymine (T), cytosine (C), and
guanine (G). Along one strand of the double helix, these bases may be found in any order, but the order
of the other strand of the double helix is strictly determined by the sequence of bases in the first strand
and DNA base pairing rules.
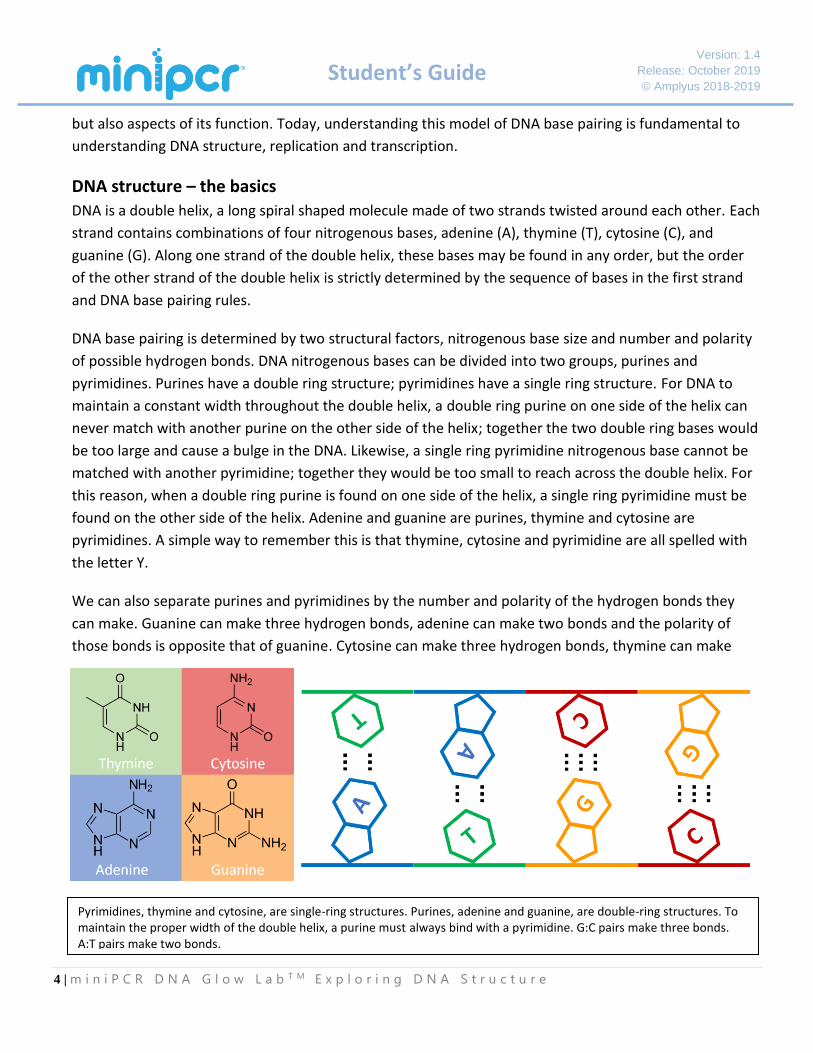
DNA base pairing is determined by two structural factors, nitrogenous base size and number and polarity
of possible hydrogen bonds. DNA nitrogenous bases can be divided into two groups, purines and
pyrimidines. Purines have a double ring structure; pyrimidines have a single ring structure. For DNA to
maintain a constant width throughout the double helix, a double ring purine on one side of the helix can
never match with another purine on the other side of the helix; together the two double ring bases would
be too large and cause a bulge in the DNA. Likewise, a single ring pyrimidine nitrogenous base cannot be
matched with another pyrimidine; together they would be too small to reach across the double helix. For
this reason, when a double ring purine is found on one side of the helix, a single ring pyrimidine must be
found on the other side of the helix. Adenine and guanine are purines, thymine and cytosine are
pyrimidines. A simple way to remember this is that thymine, cytosine and pyrimidine are all spelled with
the letter Y.
We can also separate purines and pyrimidines by the number and polarity of the hydrogen bonds they
can make. Guanine can make three hydrogen bonds, adenine can make two bonds and the polarity of
those bonds is opposite that of guanine. Cytosine can make three hydrogen bonds, thymine can make
Pyrimidines, thymine and cytosine, are single-ring structures. Purines, adenine and guanine, are double-ring structures. To maintain the proper width of the double helix, a purine must always bind with a pyrimidine. G:C pairs make three bonds. A:T pairs make two bonds.
Version: 1.4
Release: October 2019
© Amplyus 2018-2019
5 | m i n i P C R D N A G l o w L a b T M E x p l o r i n g D N A S t r u c t u r e
Student’s Guide
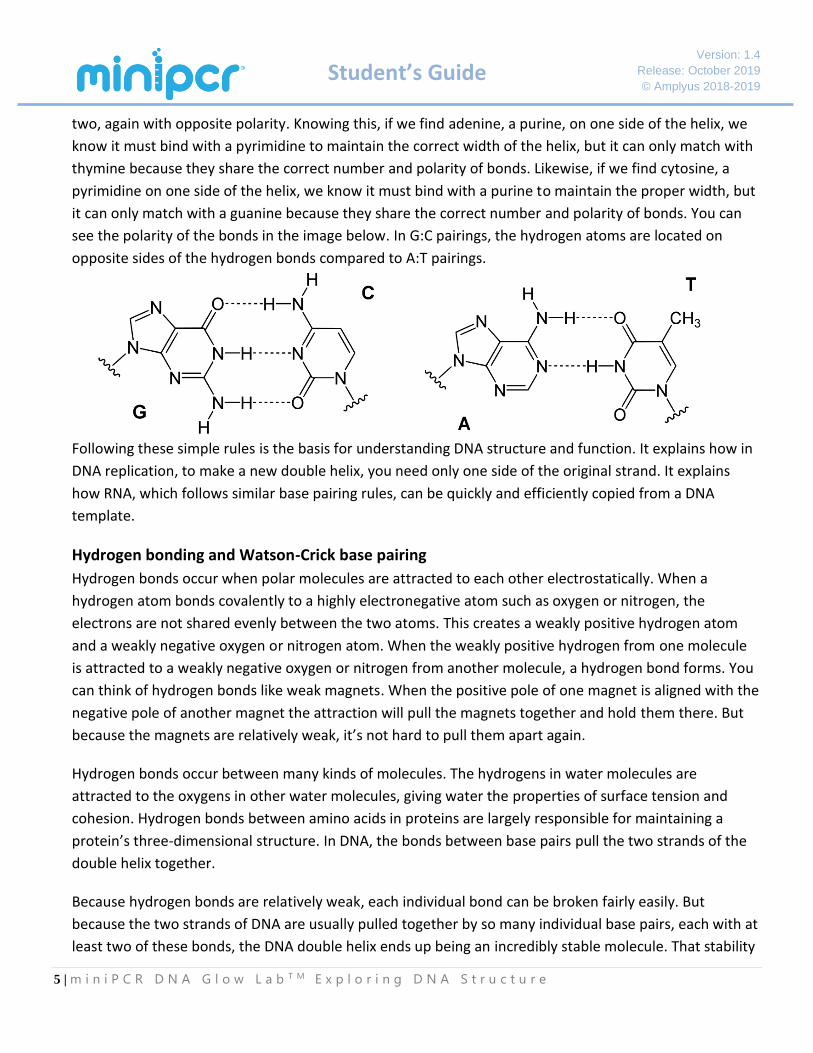
two, again with opposite polarity. Knowing this, if we find adenine, a purine, on one side of the helix, we
know it must bind with a pyrimidine to maintain the correct width of the helix, but it can only match with
thymine because they share the correct number and polarity of bonds. Likewise, if we find cytosine, a
pyrimidine on one side of the helix, we know it must bind with a purine to maintain the proper width, but
it can only match with a guanine because they share the correct number and polarity of bonds. You can
see the polarity of the bonds in the image below. In G:C pairings, the hydrogen atoms are located on
opposite sides of the hydrogen bonds compared to A:T pairings.
Following these simple rules is the basis for understanding DNA structure and function. It explains how in
DNA replication, to make a new double helix, you need only one side of the original strand. It explains
how RNA, which follows similar base pairing rules, can be quickly and efficiently copied from a DNA
template.
Hydrogen bonding and Watson-Crick base pairing
Hydrogen bonds occur when polar molecules are attracted to each other electrostatically. When a
hydrogen atom bonds covalently to a highly electronegative atom such as oxygen or nitrogen, the
electrons are not shared evenly between the two atoms. This creates a weakly positive hydrogen atom
and a weakly negative oxygen or nitrogen atom. When the weakly positive hydrogen from one molecule
is attracted to a weakly negative oxygen or nitrogen from another molecule, a hydrogen bond forms. You
can think of hydrogen bonds like weak magnets. When the positive pole of one magnet is aligned with the
negative pole of another magnet the attraction will pull the magnets together and hold them there. But
because the magnets are relatively weak, it’s not hard to pull them apart again.
Hydrogen bonds occur between many kinds of molecules. The hydrogens in water molecules are
attracted to the oxygens in other water molecules, giving water the properties of surface tension and
cohesion. Hydrogen bonds between amino acids in proteins are largely responsible for maintaining a
protein’s three-dimensional structure. In DNA, the bonds between base pairs pull the two strands of the
double helix together.
Because hydrogen bonds are relatively weak, each individual bond can be broken fairly easily. But
because the two strands of DNA are usually pulled together by so many individual base pairs, each with at
least two of these bonds, the DNA double helix ends up being an incredibly stable molecule. That stability
Version: 1.4
Release: October 2019
© Amplyus 2018-2019
6 | m i n i P C R D N A G l o w L a b T M E x p l o r i n g D N A S t r u c t u r e
Student’s Guide
is a desirable attribute for hereditary material, but to be useful in transmitting that information, DNA
can’t be too stable. To copy DNA or to transcribe DNA into RNA, the hydrogen bonds must be temporarily
split and DNA made single stranded. In the cell, this is done with enzymes. But changes in physical or
chemical conditions can also affect the structure of DNA through changes in hydrogen bonding.
The stability of hydrogen bonds is most susceptible to changes in pH, temperature, and ion concentration.
Because these bonds are relatively weak, relatively small changes in the thermal energy of a system can
affect their stability. Heating molecules can weaken the attraction, while cooling hydrogen bonds can
make them stronger. Changes in pH can also have a strong effect on hydrogen bonding. Acidic conditions
have high levels of H+ ions in solution. These H+ ions can disrupt normal hydrogen bonding by binding to
the negatively charged ends of polar molecules. Likewise, alkaline (basic) conditions have high levels of
OH- ions in solution. These OH- ions will disrupt hydrogen bonds by being attracted to and bonding with
the weak positive charge found on hydrogen atoms that are bound to oxygen or nitrogen.
Base pairing in biotechnology
Scientists can use two properties of the hydrogen bonds in DNA to their advantage. The first property is
the specificity of hydrogen bonds, dictated by base pairing (A with T and C with G). The second is the
ability to break and reform hydrogen bonds by altering the environment of a DNA molecule. For example,
by simply altering temperature, scientists can temporarily break the hydrogen bonds of a DNA molecule
and can later cause DNA to reform hydrogen bonds
by cooling it down again.
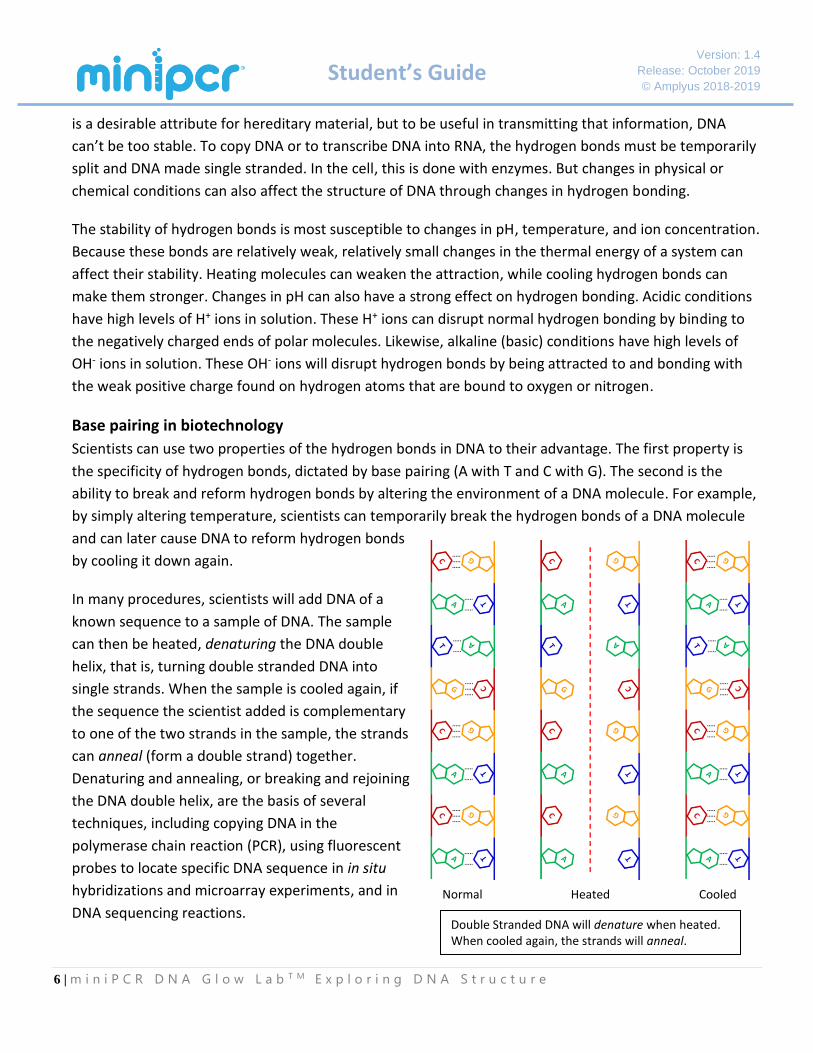
In many procedures, scientists will add DNA of a
known sequence to a sample of DNA. The sample
can then be heated, denaturing the DNA double
helix, that is, turning double stranded DNA into
single strands. When the sample is cooled again, if
the sequence the scientist added is complementary
to one of the two strands in the sample, the strands
can anneal (form a double strand) together.
Denaturing and annealing, or breaking and rejoining
the DNA double helix, are the basis of several
techniques, including copying DNA in the
polymerase chain reaction (PCR), using fluorescent
probes to locate specific DNA sequence in in situ
hybridizations and microarray experiments, and in
DNA sequencing reactions. Double Stranded DNA will denature when heated. When cooled again, the strands will anneal.
Normal Heated Cooled
Version: 1.4
Release: October 2019
© Amplyus 2018-2019
7 | m i n i P C R D N A G l o w L a b T M E x p l o r i n g D N A S t r u c t u r e
Student’s Guide
As stated before, the number of hydrogen bonds varies depending on the nucleotide, and this difference
can be important when designing experiments. G:C pairs share three bonds, while A:T pairs share only
two. This difference plays into how easily the DNA strands can be denatured and how readily they will
anneal. The more bonds between nucleotides, the stronger the hold between them - denaturing the
strands becomes more difficult and already denatured strands will anneal more readily. The fewer bonds
between the strands, the easier it is to denature the strands and the less readily they will reanneal. In
experiments that require these steps, careful attention must be paid to the precise temperature, pH and
salt concentration of the samples. Likewise, in experiments that require annealing of more than one
sequence of DNA, like when using PCR primers, careful attention must be paid to make sure the GC and
AT content of the two sequences is similar. Otherwise, the sequences may require very different
conditions for annealing to occur.
Use of fluorescent dyes in biotechnology
Fluorescence can have many uses in the biology laboratory. Fluorescent proteins such as the green
fluorescent protein (GFP) can be engineered to be produced by organisms, usually as a reporter molecule.
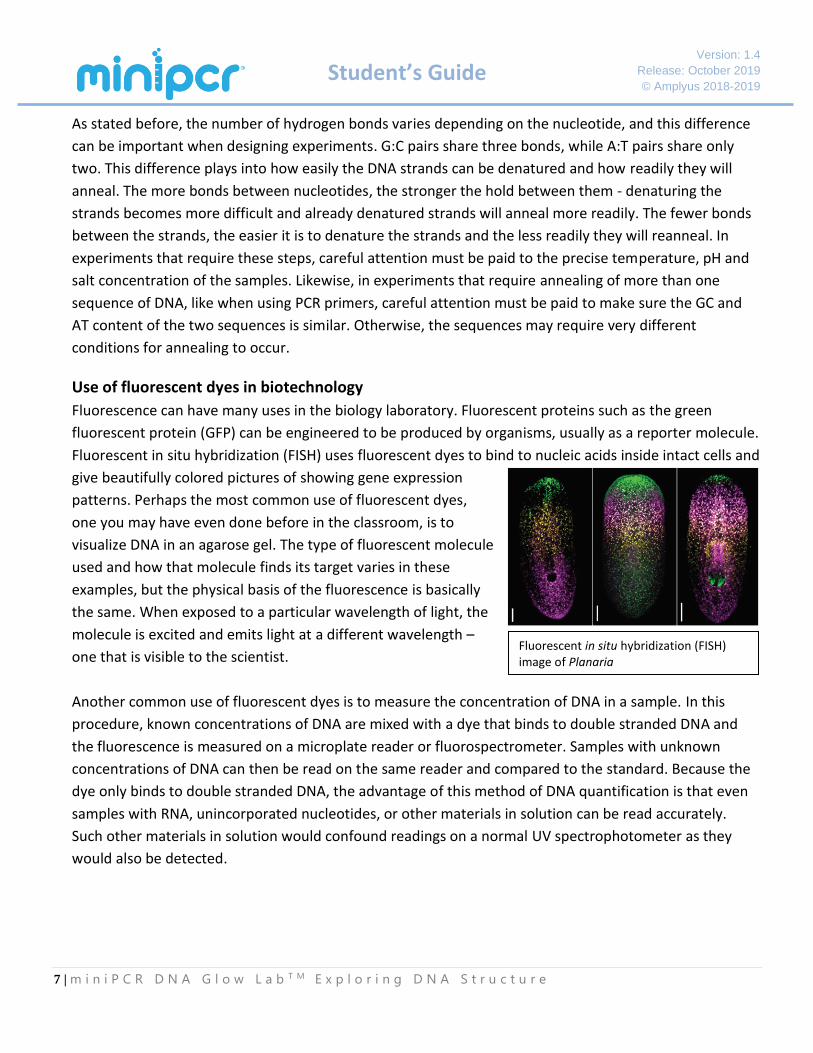
Fluorescent in situ hybridization (FISH) uses fluorescent dyes to bind to nucleic acids inside intact cells and
give beautifully colored pictures of showing gene expression
patterns. Perhaps the most common use of fluorescent dyes,
one you may have even done before in the classroom, is to
visualize DNA in an agarose gel. The type of fluorescent molecule
used and how that molecule finds its target varies in these
examples, but the physical basis of the fluorescence is basically
the same. When exposed to a particular wavelength of light, the
molecule is excited and emits light at a different wavelength –
one that is visible to the scientist.
Another common use of fluorescent dyes is to measure the concentration of DNA in a sample. In this
procedure, known concentrations of DNA are mixed with a dye that binds to double stranded DNA and
the fluorescence is measured on a microplate reader or fluorospectrometer. Samples with unknown
concentrations of DNA can then be read on the same reader and compared to the standard. Because the
dye only binds to double stranded DNA, the advantage of this method of DNA quantification is that even
samples with RNA, unincorporated nucleotides, or other materials in solution can be read accurately.
Such other materials in solution would confound readings on a normal UV spectrophotometer as they
would also be detected.
Fluorescent in situ hybridization (FISH) image of Planaria
Version: 1.4
Release: October 2019
© Amplyus 2018-2019
8 | m i n i P C R D N A G l o w L a b T M E x p l o r i n g D N A S t r u c t u r e
Student’s Guide
Today’s lab
Watson and Crick deduced the structure of DNA by using X-ray crystallography results obtained by
Rosalind Franklin. The conditions that cause DNA to denature and to anneal were later discovered using
spectrophotometry. For practical reasons, both of these techniques are not viable in a classroom
environment. This has left classrooms without and authentic laboratory investigation into the structure of
DNA. For this reason, we have adapted the use of fluorescent dyes for student use to investigate
conditions that affect DNA base pairing. In this lab, students will investigate Watson-Crick base pairing
using a dye that only fluoresces when bound to double stranded DNA. Students will be given three
unknown samples of DNA to identify, an AT-rich sequence, a GC-rich sequence and a sequence with equal
proportions of A:T and G:C base pairs. Using a thermocycler or other heat source such as a water bath,
students will establish the identity of each sample and then estimate the melting temperature (Tm) of
each. Students will then create a series of samples with varying pH to test how pH, affects DNA base
pairing. Finally, students will create a dilution series of a sample with known DNA concentration in order
to estimate the concentration of an unknown sample through observing relative fluorescence.
Useful Vocabulary:
Hydrogen bond: Hydrogen atoms bound to electronegative elements such as oxygen or nitrogen will have a slight
positive charge. This positive charge will cause them to be attracted to other electronegative elements, typically
oxygen or nitrogen. The attraction between these atoms is referred to as a hydrogen bond.
Polarity: The separation of positive and negative charge. Hydrogen bonds form between polar molecules. In a
hydrogen bond, the hydrogen will have a slight positive charge and the oxygen or nitrogen will have a slight
negative charge.
Denaturation: The process by which a complex organic molecule loses its three-dimensional structure. For DNA,
this means the two strands of the double helix will no longer bind together and will become single stranded.
Annealing: The formation of hydrogen bonds between complementary nucleotide sequences. Annealing between
nucleotide strands will create double stranded molecules.
Tm / Melting temperature: The temperature at which 50% of the DNA in solution will be denatured. At this
temperature, half the DNA will be double stranded; half will be single stranded. For DNA to be fully denatured, the
temperature must be above Tm. For DNA to be fully annealed, temperature must be below Tm.
Annealing temperature: The temperature used in an experiment, usually PCR, to cause single stranded DNA to
anneal and become double stranded. Annealing temperature is set by the scientist, but is usually around 5˚C below
Tm.
Version: 1.4
Release: October 2019
© Amplyus 2018-2019
9 | m i n i P C R D N A G l o w L a b T M E x p l o r i n g D N A S t r u c t u r e
Student’s Guide
2. Laboratory Guide
A. Temperature investigation
1. Label three of the tubes on a 4-tube strip.
• Label the tubes “A”, “B”, and “C”.
• Use a fine tip permanent market to write on the side wall of the tube.
• The fourth tube may be discarded or left as part of the strip; it will not be used.
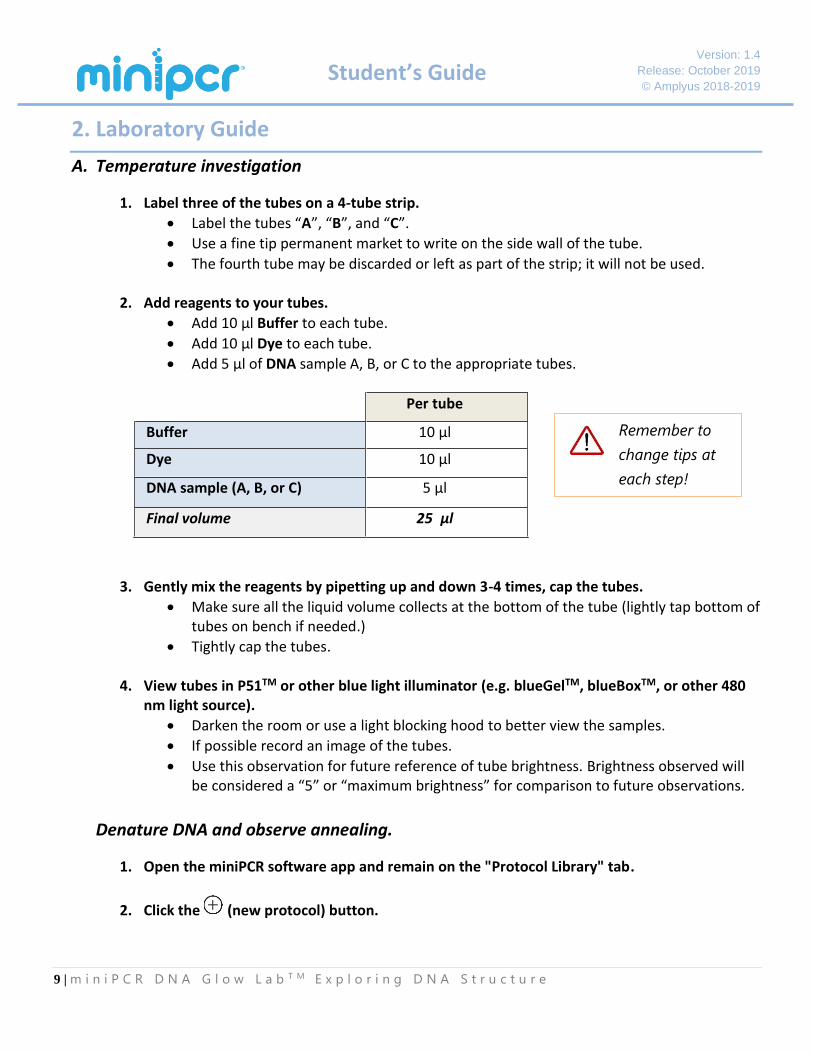
2. Add reagents to your tubes.
• Add 10 µl Buffer to each tube.
• Add 10 µl Dye to each tube.
• Add 5 µl of DNA sample A, B, or C to the appropriate tubes.
Per tube
Buffer 10 µl
Dye 10 µl
DNA sample (A, B, or C) 5 µl
Final volume 25 µl
3. Gently mix the reagents by pipetting up and down 3-4 times, cap the tubes.
• Make sure all the liquid volume collects at the bottom of the tube (lightly tap bottom of tubes on bench if needed.)
• Tightly cap the tubes.
4. View tubes in P51TM or other blue light illuminator (e.g. blueGelTM, blueBoxTM, or other 480 nm light source).
• Darken the room or use a light blocking hood to better view the samples.
• If possible record an image of the tubes.
• Use this observation for future reference of tube brightness. Brightness observed will be considered a “5” or “maximum brightness” for comparison to future observations.
Denature DNA and observe annealing.
1. Open the miniPCR software app and remain on the "Protocol Library" tab.
2. Click the (new protocol) button.
Remember to
change tips at
each step!
Version: 1.4
Release: October 2019
© Amplyus 2018-2019
10 | m i n i P C R D N A G l o w L a b T M E x p l o r i n g D N A S t r u c t u r e
Student’s Guide
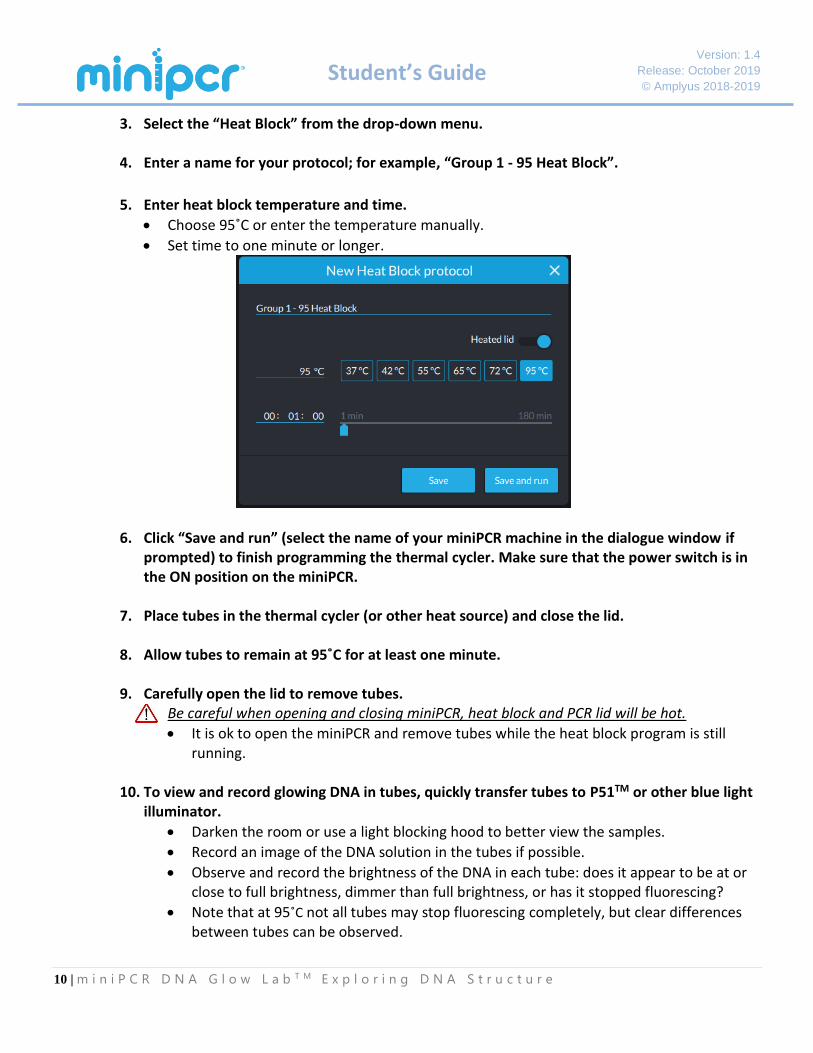
3. Select the “Heat Block” from the drop-down menu. 4. Enter a name for your protocol; for example, “Group 1 - 95 Heat Block”.
5. Enter heat block temperature and time.
• Choose 95˚C or enter the temperature manually.
• Set time to one minute or longer.
6. Click “Save and run” (select the name of your miniPCR machine in the dialogue window if prompted) to finish programming the thermal cycler. Make sure that the power switch is in the ON position on the miniPCR.
7. Place tubes in the thermal cycler (or other heat source) and close the lid.
8. Allow tubes to remain at 95˚C for at least one minute.
9. Carefully open the lid to remove tubes. Be careful when opening and closing miniPCR, heat block and PCR lid will be hot.
• It is ok to open the miniPCR and remove tubes while the heat block program is still running.
10. To view and record glowing DNA in tubes, quickly transfer tubes to P51TM or other blue light
illuminator.
• Darken the room or use a light blocking hood to better view the samples.
• Record an image of the DNA solution in the tubes if possible.
• Observe and record the brightness of the DNA in each tube: does it appear to be at or close to full brightness, dimmer than full brightness, or has it stopped fluorescing?
• Note that at 95˚C not all tubes may stop fluorescing completely, but clear differences between tubes can be observed.
Version: 1.4
Release: October 2019
© Amplyus 2018-2019
11 | m i n i P C R D N A G l o w L a b T M E x p l o r i n g D N A S t r u c t u r e
Student’s Guide
11. Continue viewing for up to two minutes at room temperature.
• Observe the tubes as they cool. Using a cell phone camera can aid in viewing. It can also be useful to record a video of the samples.
• As the samples cool, DNA will begin to anneal. Annealing DNA can be recognized because the tubes will begin to fluoresce.
• Record the order in which the different tubes begin to fluoresce.
• AT rich DNA may not reach full fluorescence in the time allotted. This can be partly due to heat from the blue light illuminator keeping the tubes from fully cooling.
12. Predict the contents of each tube based on relative time to fluoresce.
• AT rich DNA: tube___
• 50:50 DNA: tube___
• GC rich DNA: tube___
Estimate approximate Tm using miniPCRTM in linear ramp mode.
1. Open the miniPCR software app and remain on the "Protocol Library" tab.
2. Click the (new protocol) button.
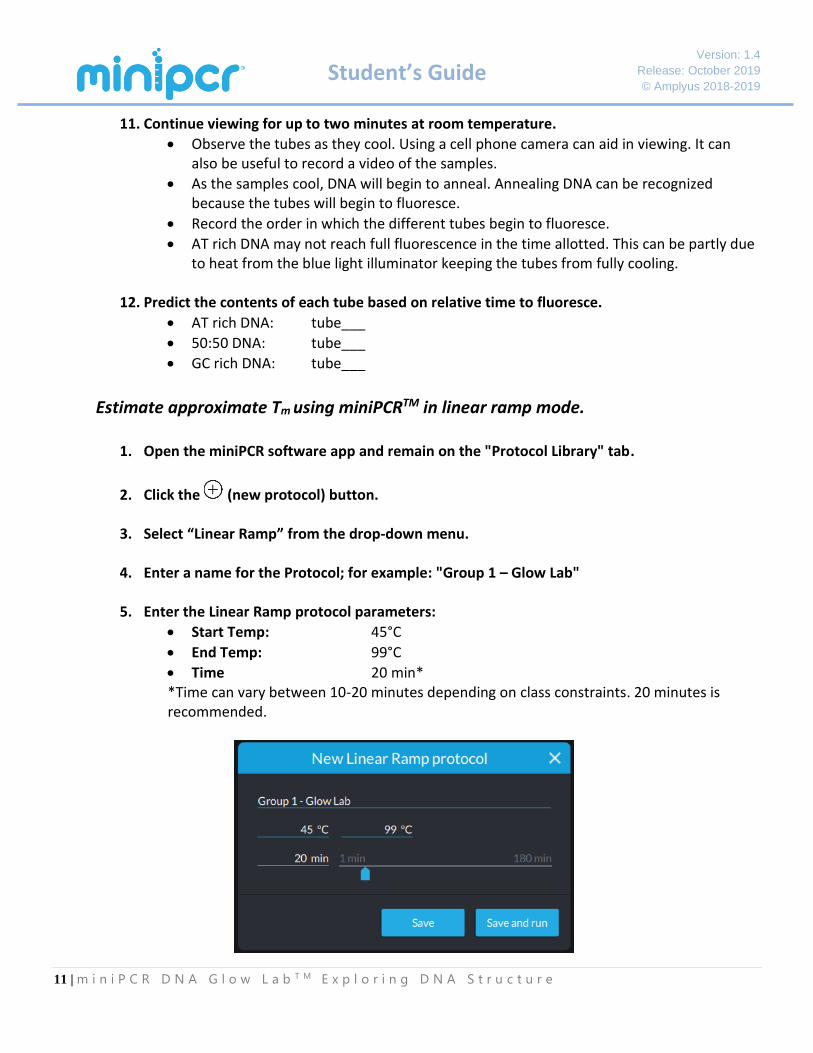
3. Select “Linear Ramp” from the drop-down menu.
4. Enter a name for the Protocol; for example: "Group 1 – Glow Lab"
5. Enter the Linear Ramp protocol parameters:
• Start Temp: 45°C
• End Temp: 99°C
• Time 20 min* *Time can vary between 10-20 minutes depending on class constraints. 20 minutes is recommended.
Version: 1.4
Release: October 2019
© Amplyus 2018-2019
12 | m i n i P C R D N A G l o w L a b T M E x p l o r i n g D N A S t r u c t u r e
Student’s Guide
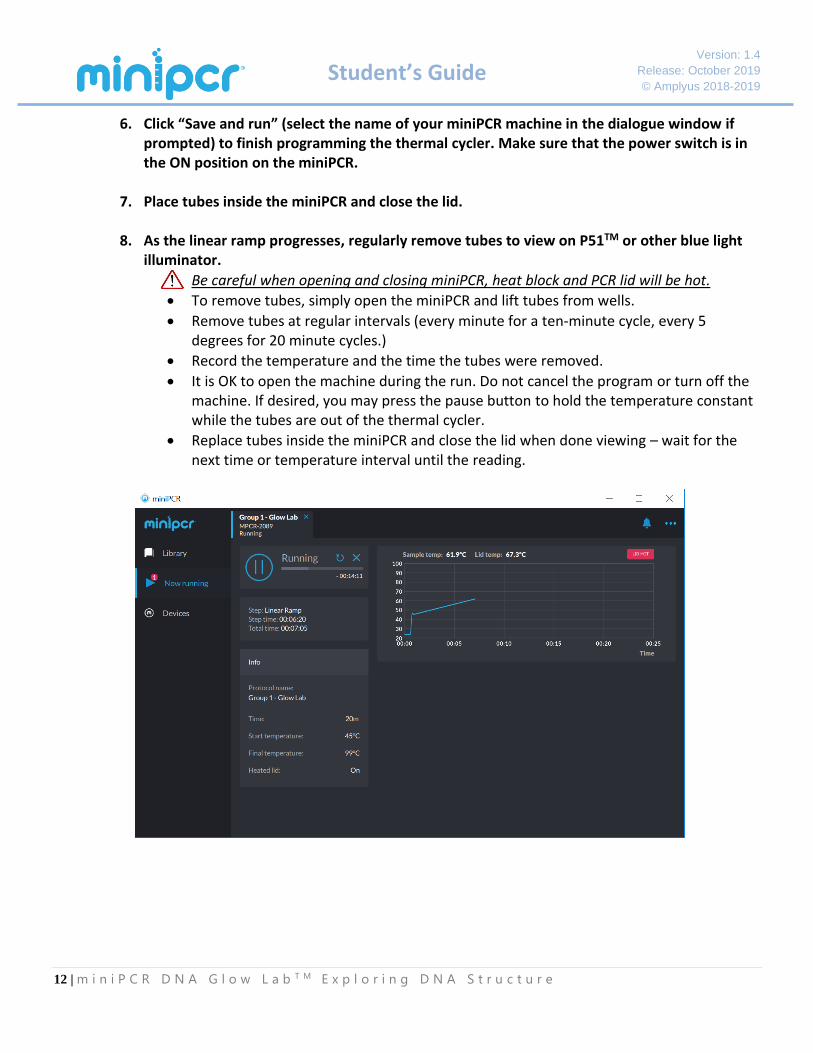
6. Click “Save and run” (select the name of your miniPCR machine in the dialogue window if prompted) to finish programming the thermal cycler. Make sure that the power switch is in the ON position on the miniPCR.
7. Place tubes inside the miniPCR and close the lid.
8. As the linear ramp progresses, regularly remove tubes to view on P51TM or other blue light illuminator.
• Be careful when opening and closing miniPCR, heat block and PCR lid will be hot.
• To remove tubes, simply open the miniPCR and lift tubes from wells.
• Remove tubes at regular intervals (every minute for a ten-minute cycle, every 5 degrees for 20 minute cycles.)
• Record the temperature and the time the tubes were removed.
• It is OK to open the machine during the run. Do not cancel the program or turn off the machine. If desired, you may press the pause button to hold the temperature constant while the tubes are out of the thermal cycler.
• Replace tubes inside the miniPCR and close the lid when done viewing – wait for the next time or temperature interval until the reading.
Version: 1.4
Release: October 2019
© Amplyus 2018-2019
13 | m i n i P C R D N A G l o w L a b T M E x p l o r i n g D N A S t r u c t u r e
Student’s Guide
9. To view and record glowing DNA in tubes, quickly transfer tubes to the blue light illuminator.
• Darken the room or use a light blocking hood to better view the samples.
• Record an image of the DNA solution in the tubes if possible.
• Observe and record the brightness of the DNA in each tube: does it appear to be at or close to full brightness, dimmer than full brightness, or has it stopped fluorescing?
• Record your observations by assigning a brightness value (1 = low brightness, 5 = maximum brightness) in the data logging table (see next section, “Data tables”.)
• Tubes will begin cooling as soon as they are removed from the thermal cycler, so it is important to view the DNA as quickly as possible after removing from the miniPCR. Try to take the same amount of time between removing tubes from the heat source and viewing for every timepoint.
10. Quickly return tubes to the thermal cycler to continue heating. Be careful when opening and closing miniPCR, heat block and PCR lid will be hot.
• Close and latch the lid.
• It is OK if the tubes are out of the machine for some of the linear ramp cycle. Make sure that tubes are in place for at least 30 seconds prior to each time you remove them. If the tubes have not been in the thermal cycler for a full thirty seconds, press the pause button to hold the temperature until 30 seconds is reached.
11. Continue regularly removing tubes and viewing in P51 or other blue light illuminator until the end of the linear ramp protocol is reached.
• Follow directions for viewing as above
• Record observations in the data logging table (see next section, “Data tables”.)
12. Use observations to predict contents of tubes and melting temperatures (Tm) of each.
• Tubes contain AT rich, GC rich and 50:50 AT:GC DNA.
• Tm is the temperature at which 50% of the DNA strands in solution will be denatured.
• Tm should be approximated to a “3” (the intermediate value) on the brightness scale.
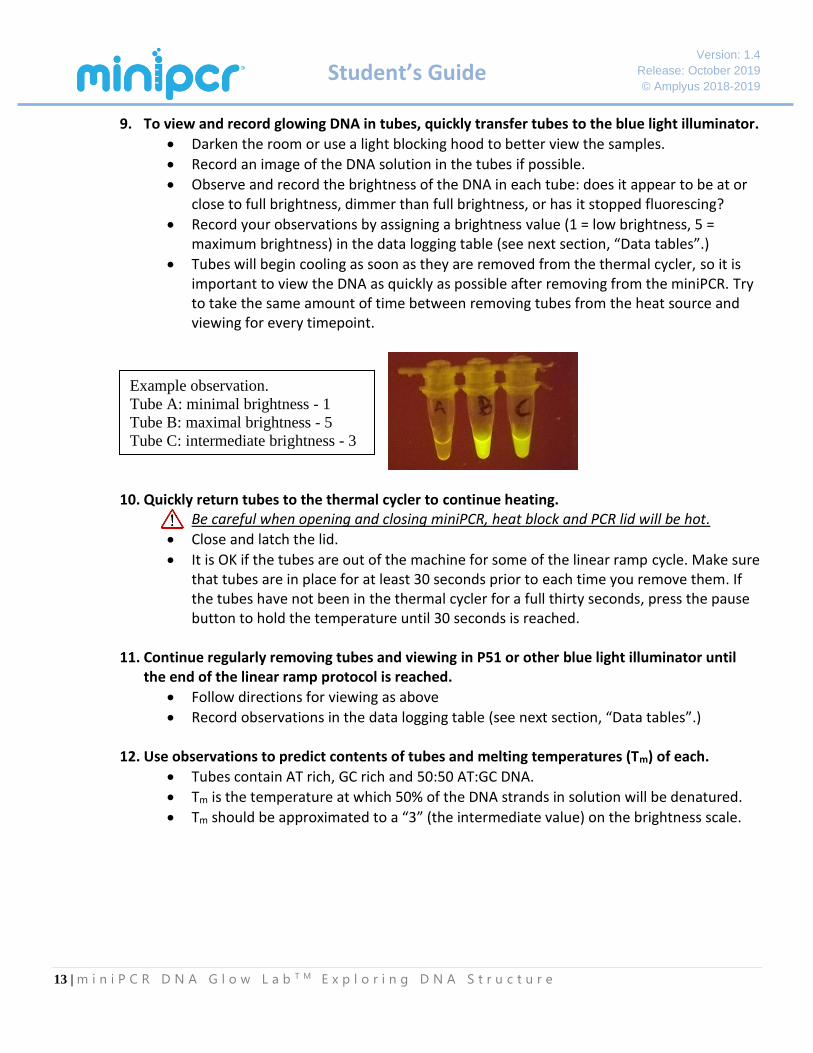
Example observation.
Tube A: minimal brightness - 1
Tube B: maximal brightness - 5
Tube C: intermediate brightness - 3
Version: 1.4
Release: October 2019
© Amplyus 2018-2019
14 | m i n i P C R D N A G l o w L a b T M E x p l o r i n g D N A S t r u c t u r e
Student’s Guide
B. pH Investigation
Sodium hydroxide (NaOH) is a corrosive chemical that can cause skin and eye damage. Gloves and eye protection should be worn at all times.
1. Label the three remaining 4-tube PCR strips (200 µl thin-walled tubes) on the side wall.
• Label the tubes in the first 4-strip A1, A2, A3, A4
• Label the tubes in the second 4-strip B1, B2, B3, B4
• Label the tubes in the third 4-strip C1, C2, C3, C4
2. Add NaOH and/or Buffer to tubes.
• To tubes A1, B1, and C1, add 10 µl Buffer.
• To tubes A2, B2, and C2, add 8 µl Buffer and 2 µl 100 mM NaOH.
• To tubes A3, B3, and C3, add 5 µl Buffer and 5 µl 100 mM NaOH.
• To tubes A4, B4, and C4, add 10 µl 100 mM NaOH.
3. Add Dye to each labeled PCR tube.
• Add 10 µl of Dye to each tube.
4. Add 5 µl DNA to each tube.
• Add 5 µl sample A to tubes A1, A2, A3 and A4
• Add 5 µl sample B to tubes B1, B2, B3 and B4
• Add 5 µl sample C to tubes C1, C2, C3 and C4
5. Gently mix the reagents by pipetting up and down 3-4 times, and cap the tubes
• Make sure all the liquid volume collects at the bottom of the tube (tap lightly.)
All tubes will now contain 25 µl volume. 6. Place tubes in P51TM or other blue light illuminator
• If possible record image with your camera.
• Record brightness values in the “Data” section of your lab manual.
Version: 1.4
Release: October 2019
© Amplyus 2018-2019
15 | m i n i P C R D N A G l o w L a b T M E x p l o r i n g D N A S t r u c t u r e
Student’s Guide
Optional The following steps are optional to this investigation. These steps are independent of each other. You can do both, one, or neither of these. 7. Retest melting temperature of one of your samples.
• Set the thermocycler or heat block to a temperature 10-20˚C below what you previously established sample B melting temperature to be (in Activity A.)
• Place the sample B strip in the thermocycler and wait for at least one minute.
• Place the tube on a blue light illuminator and record your results.
• Compare to earlier observations during Activity A. 8. Add HCl to restore pH. (HCl is not supplied as part of the lab reagents.)
• Use caution - HCl should always be handled while wearing gloves and eye protection.
• Add 2 µl of 100 mM HCl to tube A4, and place on the blue light illuminator.
• Continue adding HCl 2 µl at a time until fluorescence is achieved.
Version: 1.4
Release: October 2019
© Amplyus 2018-2019
16 | m i n i P C R D N A G l o w L a b T M E x p l o r i n g D N A S t r u c t u r e
Student’s Guide
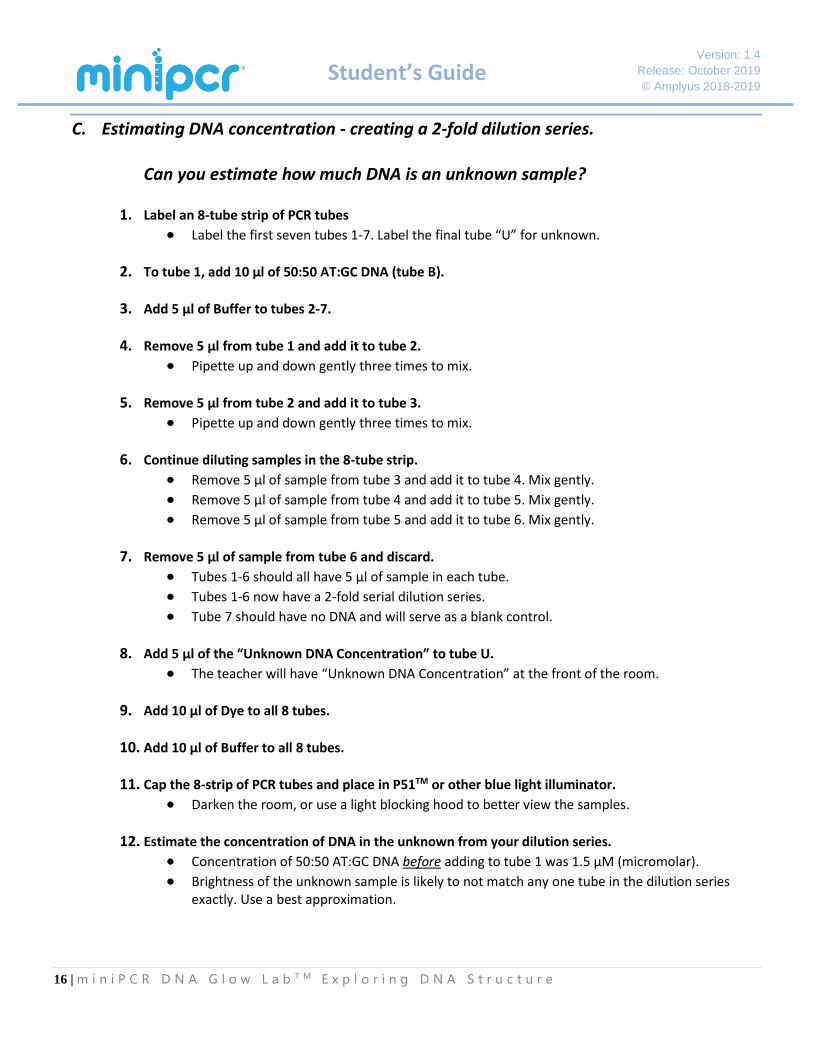
C. Estimating DNA concentration - creating a 2-fold dilution series. Can you estimate how much DNA is an unknown sample?
1. Label an 8-tube strip of PCR tubes
• Label the first seven tubes 1-7. Label the final tube “U” for unknown.
2. To tube 1, add 10 µl of 50:50 AT:GC DNA (tube B).
3. Add 5 µl of Buffer to tubes 2-7.
4. Remove 5 µl from tube 1 and add it to tube 2.
• Pipette up and down gently three times to mix.
5. Remove 5 µl from tube 2 and add it to tube 3.
• Pipette up and down gently three times to mix.
6. Continue diluting samples in the 8-tube strip.
• Remove 5 µl of sample from tube 3 and add it to tube 4. Mix gently.
• Remove 5 µl of sample from tube 4 and add it to tube 5. Mix gently.
• Remove 5 µl of sample from tube 5 and add it to tube 6. Mix gently.
7. Remove 5 µl of sample from tube 6 and discard.
• Tubes 1-6 should all have 5 µl of sample in each tube.
• Tubes 1-6 now have a 2-fold serial dilution series.
• Tube 7 should have no DNA and will serve as a blank control.
8. Add 5 µl of the “Unknown DNA Concentration” to tube U.
• The teacher will have “Unknown DNA Concentration” at the front of the room.
9. Add 10 µl of Dye to all 8 tubes.
10. Add 10 µl of Buffer to all 8 tubes.
11. Cap the 8-strip of PCR tubes and place in P51TM or other blue light illuminator.
• Darken the room, or use a light blocking hood to better view the samples.
12. Estimate the concentration of DNA in the unknown from your dilution series.
• Concentration of 50:50 AT:GC DNA before adding to tube 1 was 1.5 µM (micromolar).
• Brightness of the unknown sample is likely to not match any one tube in the dilution series exactly. Use a best approximation.
Version: 1.4
Release: October 2019
© Amplyus 2018-2019
17 | m i n i P C R D N A G l o w L a b T M E x p l o r i n g D N A S t r u c t u r e
Student’s Guide
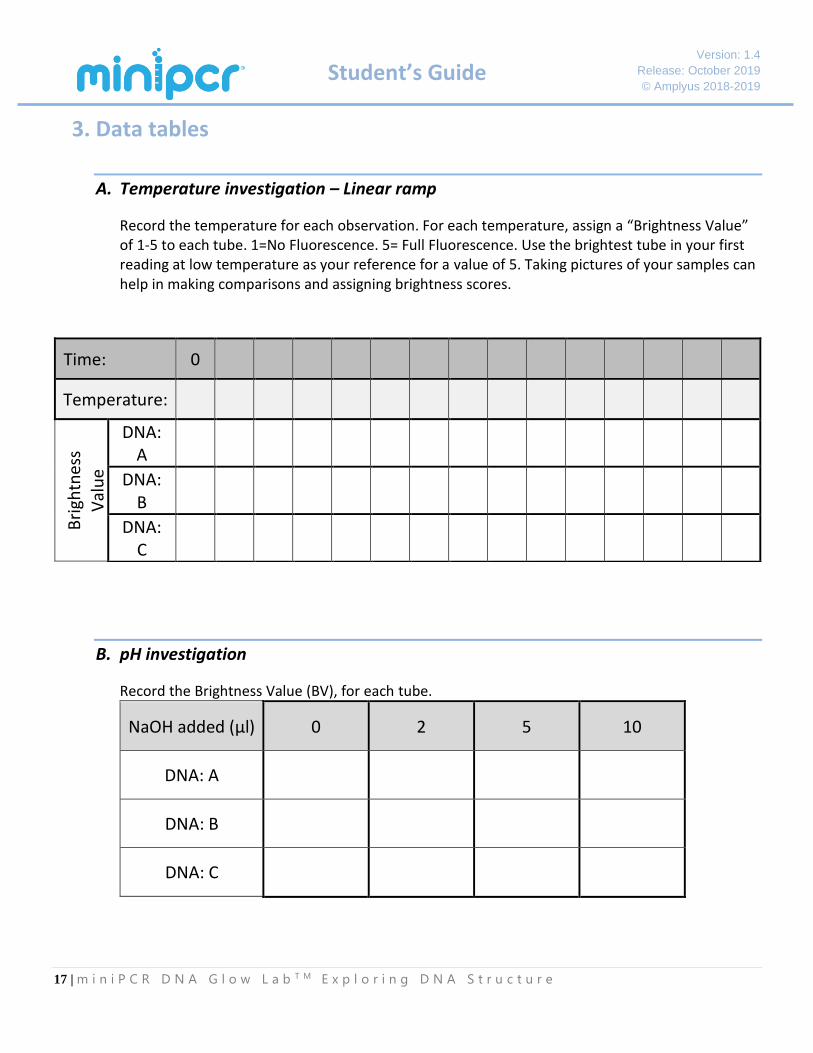
3. Data tables
A. Temperature investigation – Linear ramp
Record the temperature for each observation. For each temperature, assign a “Brightness Value” of 1-5 to each tube. 1=No Fluorescence. 5= Full Fluorescence. Use the brightest tube in your first reading at low temperature as your reference for a value of 5. Taking pictures of your samples can help in making comparisons and assigning brightness scores.
B. pH investigation
Record the Brightness Value (BV), for each tube.
NaOH added (µl) 0 2 5 10
DNA: A
DNA: B
DNA: C
Time: 0
Temperature:
Bri
ghtn
ess
Val
ue
DNA: A
DNA: B
DNA: C
Version: 1.4
Release: October 2019
© Amplyus 2018-2019
18 | m i n i P C R D N A G l o w L a b T M E x p l o r i n g D N A S t r u c t u r e
Student’s Guide
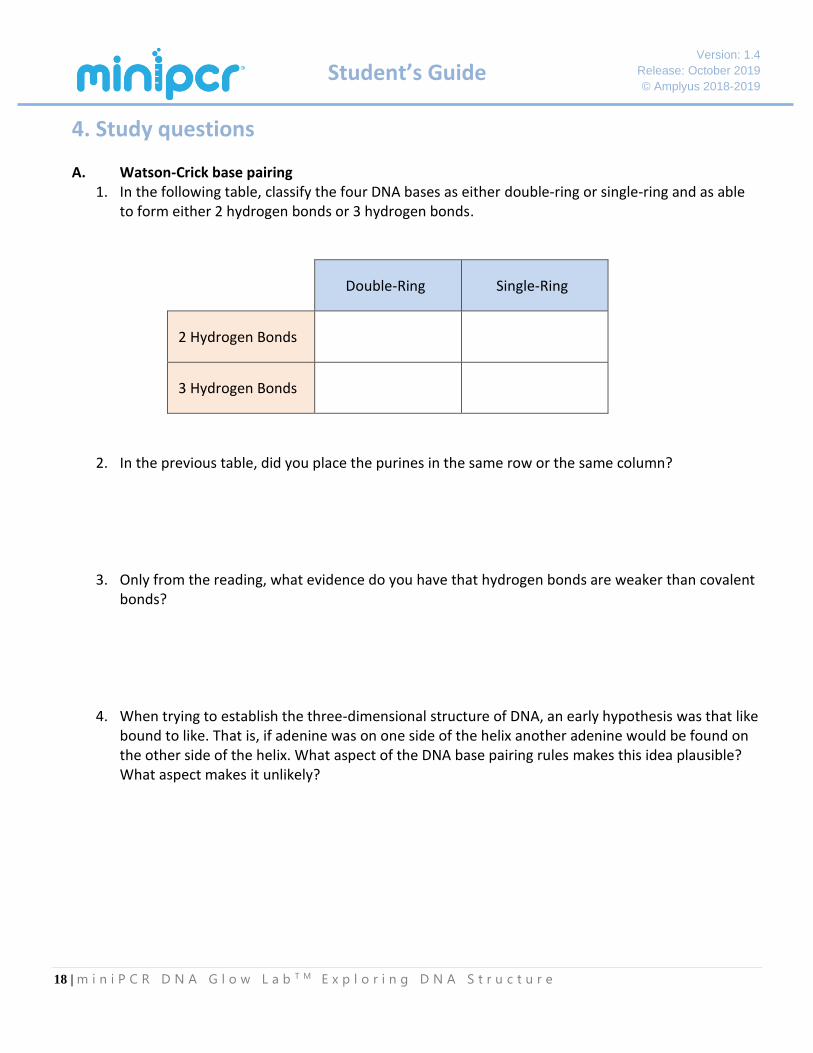
4. Study questions A. Watson-Crick base pairing
1. In the following table, classify the four DNA bases as either double-ring or single-ring and as able to form either 2 hydrogen bonds or 3 hydrogen bonds.
Double-Ring Single-Ring
2 Hydrogen Bonds
3 Hydrogen Bonds
2. In the previous table, did you place the purines in the same row or the same column?
3. Only from the reading, what evidence do you have that hydrogen bonds are weaker than covalent bonds?
4. When trying to establish the three-dimensional structure of DNA, an early hypothesis was that like bound to like. That is, if adenine was on one side of the helix another adenine would be found on the other side of the helix. What aspect of the DNA base pairing rules makes this idea plausible? What aspect makes it unlikely?
Version: 1.4
Release: October 2019
© Amplyus 2018-2019
19 | m i n i P C R D N A G l o w L a b T M E x p l o r i n g D N A S t r u c t u r e
Student’s Guide
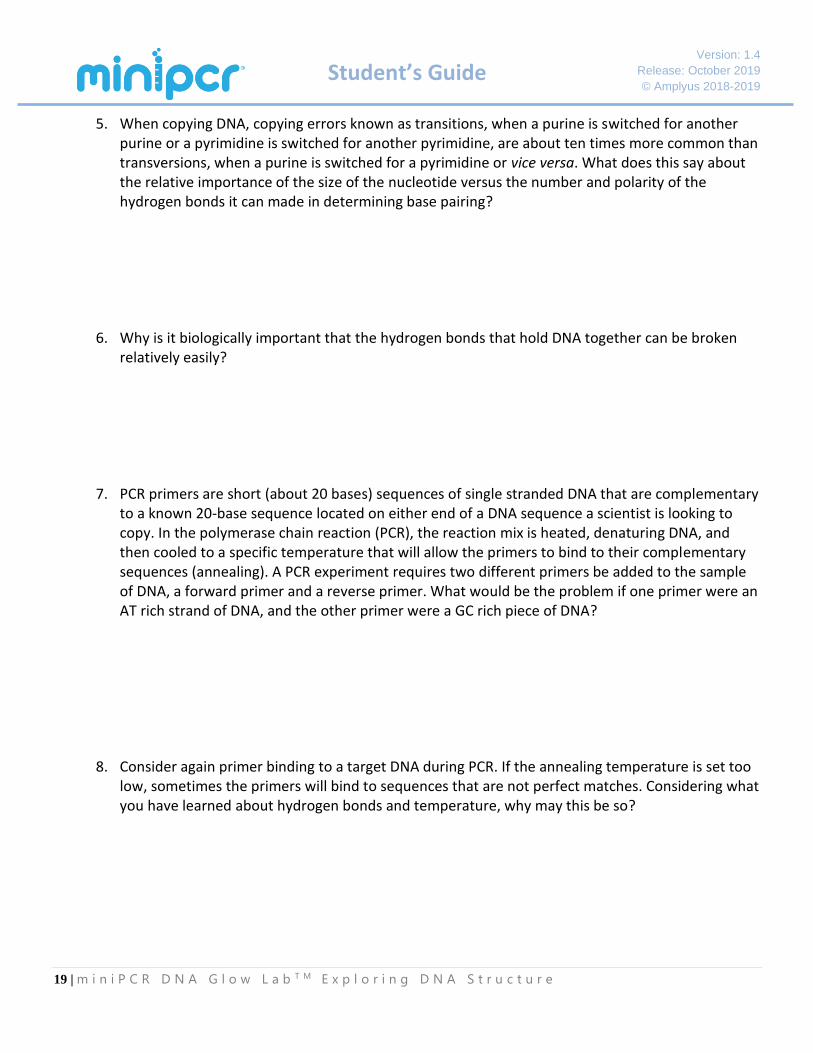
5. When copying DNA, copying errors known as transitions, when a purine is switched for another purine or a pyrimidine is switched for another pyrimidine, are about ten times more common than transversions, when a purine is switched for a pyrimidine or vice versa. What does this say about the relative importance of the size of the nucleotide versus the number and polarity of the hydrogen bonds it can made in determining base pairing?
6. Why is it biologically important that the hydrogen bonds that hold DNA together can be broken
relatively easily?
7. PCR primers are short (about 20 bases) sequences of single stranded DNA that are complementary to a known 20-base sequence located on either end of a DNA sequence a scientist is looking to copy. In the polymerase chain reaction (PCR), the reaction mix is heated, denaturing DNA, and then cooled to a specific temperature that will allow the primers to bind to their complementary sequences (annealing). A PCR experiment requires two different primers be added to the sample of DNA, a forward primer and a reverse primer. What would be the problem if one primer were an AT rich strand of DNA, and the other primer were a GC rich piece of DNA?
8. Consider again primer binding to a target DNA during PCR. If the annealing temperature is set too low, sometimes the primers will bind to sequences that are not perfect matches. Considering what you have learned about hydrogen bonds and temperature, why may this be so?
Version: 1.4
Release: October 2019
© Amplyus 2018-2019
20 | m i n i P C R D N A G l o w L a b T M E x p l o r i n g D N A S t r u c t u r e
Student’s Guide
B. Post lab questions 1. Which sample do you think is the AT-rich sample; which is the GC-rich sample; which is the
balanced ATGC DNA sample? Justify your answer using evidence from the lab.
2. What temperature did you estimate to be each sample’s approximate melting temperature?
*Note: Melting temperatures observed in this lab will lack precision. Give your best estimate.
3. Explain the above results in relation to Watson-Crick base pairing.
4. How did pH of your samples affect whether or not the DNA remained double stranded?
5. Explain your above results in relation to Watson-Crick base pairing.
6. What do you think is the concentration of the unknown sample of DNA?
Version: 1.4
Release: October 2019
© Amplyus 2018-2019
21 | m i n i P C R D N A G l o w L a b T M E x p l o r i n g D N A S t r u c t u r e
Student’s Guide
DNA Glow Lab story board Directions: Use at least three of the following six boxes to illustrate what occurred at the molecular level in this lab as if it were a comic strip. On the lines beside each box, describe what is happening in each drawing. Use and underline the following words or phrases: adenine, thymine, guanine, cytosine, denature, anneal, hydrogen bond, double helix, purine, pyrimidine.
Version: 1.4
Release: October 2019
© Amplyus 2018-2019
22 | m i n i P C R D N A G l o w L a b T M E x p l o r i n g D N A S t r u c t u r e
Student’s Guide
DNA Glow Lab story board (cont.)
Version: 1.4
Release: October 2019
© Amplyus 2018-2019
23 | m i n i P C R D N A G l o w L a b T M E x p l o r i n g D N A S t r u c t u r e
Student’s Guide
5. Appendix- If a miniPCRTM or Linear Ramp mode is not available The protocols in this lab were optimized for use on a miniPCRTM in Linear Ramp mode. These protocols could be modified to use a water bath or with other machines where a linear ramp protocol is not available. Below is a suggested protocol for use on a thermal cycler or other programable heat block or water bath with no ramp function.
Tubes that are heated to 95° and above have the potential to pop open unexpectedly. Gloves and protective eyewear should be worn for the entirety of this lab.
1. Incubate the tubes for at least 1 minute at 95˚C.
• Use a thermal cycler in Heat Block mode, a heat block, or water bath.
• Close the heated lid on the PCR machine to avoid lids opening under pressure. Be aware that if using another heat source, PCR tube lids may pop open when heated.
2. Remove tubes from heat block and immediately transfer to P51TM or other blue light illuminator.
• Careful, heat block and PCR lid will be hot
• Tubes will begin cooling off as soon as they are removed from heat, so it is important to visualize the tubes within the first few seconds.
• Darken the room or use a light blocking hood to better view the samples.
3. If possible, record an image of the samples.
4. Continue viewing the samples for up to 2 minutes.
• Note changes in fluorescence over time.
• Note the relative time taken for each sample to regain fluorescence
• Move on once all three tubes have regained fluorescence. Note - maximum fluorescence is likely to be less than when originally viewed prior to heating.
• Samples can be reheated to observe again if necessary.
5. Use observations to predict contents of tubes.
• Tubes contain AT rich, GC rich and AT:GC DNA.
Identify the melting temperature of your samples
6. Make sure all three samples have fully cooled.
• It can be helpful to briefly place the samples on ice or wave tubes in air for a short time to help cool.
Version: 1.4
Release: October 2019
© Amplyus 2018-2019
24 | m i n i P C R D N A G l o w L a b T M E x p l o r i n g D N A S t r u c t u r e
Student’s Guide
7. Using a programmable heat block: Try different temperatures to establish the melting temperature (Tm) of each different sample.
• Start by heating the sample to 45 ˚C. Repeat the above procedure, increasing the temperature of the heat block each time by 5-10 ˚C.
• If a sample does not fluoresce immediately after removing it from the heat block and viewing on the illuminator, the sample is above Tm.
• If a sample fluoresces immediately after removing it from the heat block and viewing on the illuminator, the sample is below Tm.
• Remember to heat the samples for at least one minute to ensure thorough heating and denaturation.
• Remember to transfer samples to the illuminator and to view as quickly as possible as the temperature of the sample will change as soon as it is removed from the heat block.
• It may be easiest to start at a low temperature and work upwards to avoid having to cool samples in between temperatures.
• Melting temperatures should be clearly distinguishable between samples and resolvable to approximately 5-10˚ accuracy.
8. Using multiple water baths: Try different temperatures to establish the melting temperature (Tm) of each different sample.
• Use at least three water baths set at intervals between 55˚ and 95˚ C.
• If only using three water baths, we recommend trying 70˚, 85˚, and 95˚ C.