3.5 keV Line Is Likely to be Due to Plasma Emission (Ar, Ca) And NOT Due To Any Fictitious Dark...
27
Prepared for submission to JCAP Where do the 3.5 keV photons come from? A morphological study of the Galactic Center and of Perseus Eric Carlson, a,b Tesla Jeltema, a,b Stefano Profumo a,b a Department of Physics, University of California, Santa Cruz 1156 High St, Santa Cruz, CA 95064 b Santa Cruz Institute for Particle Physics, 1156 High St, Santa Cruz, CA 95064 E-mail: [email protected], [email protected], [email protected] Abstract. We test the origin of the 3.5 keV line photons by analyzing the morphology of the emission at that energy from the Galactic Center and from the Perseus cluster of galaxies. We employ a variety of different templates to model the continuum emission and analyze the resulting radial and azimuthal distribution of the residual emission. We then perform a pixel-by-pixel binned likelihood analysis including line emission tem- plates and dark matter templates and assess the correlation of the 3.5 keV emission with these templates. We conclude that the radial and azimuthal distribution of the residual emission is incompatible with a dark matter origin for both the Galactic center and Perseus; the Galactic center 3.5 keV line photons trace the morphology of lines at comparable energy, while the Perseus 3.5 keV photons are highly correlated with the cluster’s cool core, and exhibit a morphology incompatible with dark matter decay. The template analysis additionally allows us to set the most stringent constraints to date on lines in the 3.5 keV range from dark matter decay. arXiv:1411.1758v2 [astro-ph.HE] 12 Nov 2014
Transcript of 3.5 keV Line Is Likely to be Due to Plasma Emission (Ar, Ca) And NOT Due To Any Fictitious Dark...

Prepared for submission to JCAP
Where do the 3.5 keV photons comefrom? A morphological study of theGalactic Center and of Perseus
Eric Carlson,a,b Tesla Jeltema,a,b Stefano Profumoa,b
aDepartment of Physics, University of California, Santa Cruz1156 High St, Santa Cruz, CA 95064bSanta Cruz Institute for Particle Physics,1156 High St, Santa Cruz, CA 95064
E-mail: [email protected], [email protected], [email protected]
Abstract. We test the origin of the 3.5 keV line photons by analyzing the morphologyof the emission at that energy from the Galactic Center and from the Perseus cluster ofgalaxies. We employ a variety of different templates to model the continuum emissionand analyze the resulting radial and azimuthal distribution of the residual emission. Wethen perform a pixel-by-pixel binned likelihood analysis including line emission tem-plates and dark matter templates and assess the correlation of the 3.5 keV emissionwith these templates. We conclude that the radial and azimuthal distribution of theresidual emission is incompatible with a dark matter origin for both the Galactic centerand Perseus; the Galactic center 3.5 keV line photons trace the morphology of lines atcomparable energy, while the Perseus 3.5 keV photons are highly correlated with thecluster’s cool core, and exhibit a morphology incompatible with dark matter decay. Thetemplate analysis additionally allows us to set the most stringent constraints to date onlines in the 3.5 keV range from dark matter decay.
arX
iv:1
411.
1758
v2 [
astr
o-ph
.HE
] 1
2 N
ov 2
014
Contents
1 Introduction 1
2 Methodology 42.1 Choice of Targets 42.2 X-Ray Data Selection 52.3 Binned Likelihood Analysis 62.4 Continuum Templates 72.5 Emission Line Templates 82.6 Dark Matter Templates 9
3 Results 133.1 Residual Maps 143.2 Fits and Limits for Decaying Dark Matter 173.3 Cross-Correlating the 3.45-3.6 keV Emission 19
4 Discussion and Conclusions 23
5 Acknowledgments 23
1 Introduction
Earlier this year, an unidentified spectral line at 3.55-3.57 keV was reported by Bulbulet al [1] using XMM-Newton observations of galaxy clusters. The signal was detectedin five independent samples, including observations both of single objects and stackedcluster spectra. Subsequently, the presence of an unidentified line at ∼ 3.52 keV wasconfirmed by a re-analysis of XMM data of the Perseus cluster, and also reported froman analysis of XMM observations of M31 in Ref. [2]. XMM blank-sky observations donot reveal any evidence for any feature at the energy of interest [2]. Furthermore, whendetected in clusters, the line is observed to have a redshift consistent with that of thehost cluster, helping to rule out an obvious instrumental origin [1].
Two possible explanations have dominated the ensuing debate over the origin ofthis mysterious signal. The first was initially put forth by Ref. [1], proposing the ex-citing possibility that the line is due to the decay of sterile neutrino dark matter. Thesecond possibility is astrophysical, suggesting that the size and impact of uncertaintiesin modeling the complex multi-phase plasma structure in clusters had been previouslyunderestimated, and that one or more weak plasma transition lines could in fact beresponsible for the signal [3]. Below we summarize these ongoing developments andpresent a novel spatial analysis method which aims to discriminate the two scenariosusing existing archival XMM X-ray data.
– 1 –
Self-consistency of the unidentified X-ray line across different objects and for differ-ent X-ray instruments (XMM MOS, PN and Chandra) has appeared problematic fromthe start. For example, the precise spectral location of the line1 has been difficult to pindown and the line flux for a given object were found to vary substantially even betweendifferent instruments on the same telescope. Interpretations of the signal in terms of astandard decaying dark matter candidate are also troubling due to the observed strengthbeing inconsistent across different objects [1].
The possibility of explaining the 3.5 keV signal with new physics prompted vigorousactivity especially in the model-building community, and a variety of possible particlephysics scenarios have been proposed. In particular, models with sterile neutrinos canpotentially provide avenues to successful baryogenesis via leptogenesis, to the generationof the observed pattern of (active) neutrino masses and mixing, and to providing adark matter candidate which can alleviate certain small-scale issues of cold dark matterscenarios [4]. Model building efforts were also directed toward constructing a consistentnew-physics picture that could reconcile varying signal strengths across different objects,especially in the context of axion-like particles converting to 3.5 keV photons in thepresence of magnetic fields (see e.g. Ref. [5–9] for early studies of this scenario).
In the dark-matter decay picture the relative signal strength is easily calculated,scaling as the dark matter density integrated over the line of sight. It thus became clearthat a confirmation of the non-standard and possibly dark-matter-related origin of theunidentified line might come from observations of nearby targets such as the Galacticcenter (GC), or nearby dark-matter-dominated systems, such as local dwarf spheroidalgalaxies (dSph), where no plasma emission line background is expected.
Ref. [10] proceeded to analyze Chandra data of the Galactic center, finding noevidence for an excess 3.5 keV line after including known plasma emission lines. Thisstudy produced constraints on a decaying dark matter scenario in clear tension with suchan interpretation of previous results, but it was not clear from this work if the measuredline fluxes near 3.5 keV were consistent with those expected from plasma lines.
While relevant, Chandra observations of the Galactic center are significantly shal-lower than available archival XMM observations. In Ref. [3], two of us (TJ & SP)analyzed XMM observations of the center of the Galaxy, and discovered a line at an en-ergy of about 3.5 keV. We pointed out that the detected line signal was compatible, atface value, with a dark matter decay origin, and calculated the corresponding preferredsterile neutrino lifetime and mixing angle2. However, we also showed that, given thefluxes of other bright plasma emission lines, the flux of the detected 3.5 keV line is com-patible with two atomic lines from K XVIII at 3.47 and 3.51 keV, making astrophysicalplasma emission a natural explanation of the 3.5 keV feature.
In Ref. [3] we also re-analyzed, in the 3-4 keV energy range, archival XMM datafrom M31, and found no statistical evidence for a line at 3.5 keV. In addition, wepointed out that the procedure employed in Ref. [1] to predict the K XVIII line flux
1In what follows, we will refer to the energy of the line simply as 3.5 keV for brevity.2This aspect of our study appears to have been under-appreciated in the recent literature on the
topic.
– 2 –

and the flux of other atomic transition lines was not, contrary to what stated in thatpaper, maximally conservative. We argued that the multi-temperature models employedthere were biased towards excessively large temperatures which artificially suppress, forexample, the expected K XVIII line intensity3.
Two key subsequent observational analyses of other sources also found no confir-mation of an exotic origin for the 3.5 keV line (or any line at that energy whatsoever):Ref. [12] analyzed stacked observations of dwarf galaxies, while Ref. [13] analyzed Chan-dra and XMM observations of two large samples of galaxies and groups of galaxies, whichshould exhibit tenuous, if any, plasma emission features. Both results robustly rule outa dark matter decay interpretation of the 3.5 keV line observations reported by Ref. [1]and by Ref. [2].
Finally, a recent study utilized deep Suzaku observations of Perseus, Coma, Virgoand Ophiuchus, to test the dark matter decay hypothesis for the 3.5 keV line [14].While confirming the existence of a 3.5 keV signal in Perseus, Ref. [14] did not findany evidence of an associated signal, with the appropriately rescaled intensity, in theother three clusters, robustly ruling out a dark matter interpretation for the 3.5 keV lineobserved from Perseus; also, Ref. [14] points out that the radial variation of the 3.5 keVsignal in Perseus is in tension with what expected from dark matter decay, and findsevidence that the Perseus signal could be potentially explained by elemental lines, as wehad originally suggested in Ref. [3].
Following our analysis of the GC data in Ref. [3], two comments, Ref. [15, 16],appeared regarding our paper, as well as an analysis of XMM data of the Galacticcenter, which confirmed our discovery of a 3.5 keV line [17]. While these commentsdebate some details of the analysis in Ref. [3], we show in Ref. [11] that none of ourconclusions are substantially affected or challenged by the points raised. This ongoingdiscussion highlights the difficulty in assessing the origin of (and in the case M31, theexistence of) such a weak spectral feature amongst a background rich in astrophysicalemission.
Previous studies have argued that a final word on the origin of the 3.5 keV linemight possibly come from future high-resolution instruments such as Astro-H. In thiswork, we show that it is possible to assess the nature of the 3.5 keV line by using availablearchival data in a completely independent context compared with the spectral analysesperformed thus far: we show that a morphological analysis of the 3.5 keV emissionallows for a critical evaluation of the physical nature of the source, and conclude thatthe 3.5 keV line is highly unlikely to originate from dark matter decay, or from axion-likeparticle conversion. We also derive the most constraining limits to-date on the lifetimeof a putative radiatively decaying dark matter particle producing a monochromatic 3.5keV line.
In this study we carry out an extensive morphological analysis of two of the most
3We further demonstrate this point in Ref. [11], where we show that the Ca XX to Ca XIX ratioindicates temperatures inconsistent with the multi-temperature models employed in Ref. [1]: for example,in the case of the “all-clusters” MOS sample, the large temperatures employed in Ref. [1] produce under-estimates of the K XVIII line flux by factors between more than 4 and more than 10.
– 3 –

tantalizing locations where the 3.5 keV line has been conclusively detected: the Galacticcenter and Perseus cluster. As the 3.5 keV line is quite tenuous compared to the contin-uum emission, the choice and determination of the continuum model is important. Wethus consider a broad sample of continuum emission models, and assess possible system-atic effects associated with modeling the morphology of the continuum using differentassumptions. We then study the morphology of plasma emission lines observed at differ-ent energies, and assess the radial and azimuthal behavior of the residual emission at 3.5keV. We compare this residual emission with the morphology of line emission templatesas well as with dark matter templates. Finally, we study the cross-correlation of the 3.5keV morphology with a sliding-window template, and calculate the resulting constraintson any emission sharing the morphology expected from dark matter decay models forboth the Galactic center and Perseus.
2 Methodology
In this section, we introduce the two targets we focus on in the present study, we describeour XMM data selection, the details of the binned-likelihood analysis, the “sideband”templates for nearby spectral lines and continuum emission, and finally, the generationof sky-maps for decaying dark matter based on several choices for the dark matter halomodel.
2.1 Choice of Targets
The present study focuses on the Galactic center [3], and on the Perseus cluster [1, 2].The proximity of the Galactic center and the inherent asymmetry of the expected astro-physical emission makes it an especially compelling target for a morphological study; thePerseus cluster’s 3.5 keV line has been robustly detected with several X-ray instruments(including XMM MOS but not PN, Chandra ACIS-S and ACIS-I, and Suzaku) and thecluster has a large enough extension in the sky, compared to the instrumental angularresolution, that a morphological study is also possible.
If the 3.5 keV line indeed arises from the decay (or annihilation, or conversionof the decay products) of particle dark matter, the spatial morphology of any excessemission must be both roughly spherical4 and declining with growing distance fromthe center of the halo. On the other hand, the flux from atomic emission lines shouldtrace the distribution of the astrophysical plasma as the product of atomic abundanceand emissivity, the latter of which possesses a strong dependence on the local plasmatemperature.
The X-ray emission from the Galactic center is dominated by resolved and unre-solved X-ray point sources as well as thermal emission from the hot gas. In additionto hot plasma and high gas densities, the Galactic center region is densely packed withfeedback sources, including the central black-hole, Sgr A*, supernova remnants suchas Sgr A East, and stellar clusters. This environment leads to an extremely complex
4A possible exception, which we discuss in what follows, is the case of the Galactic center for axion-like-particle conversion.
– 4 –

and spatially varying multi-temperature plasma structure, as well as to strong gradientsin the atomic abundances of each radiating species, making it difficult to conclusivelyspatially correlate strong emission lines [18–20].
X-ray emission from galaxy clusters originates from the hot intergalactic mediumheated during gravitational collapse. With very different cooling and feedback processescompared to the Galactic center, such systems provide an independent lens for spectrallyand morphologically differentiating dark matter emission from that of ∼keV plasmaemission lines. Already, there is substantial tension between the 3.5 keV line fluxesdetected within the stacked and unstacked observations of clusters [1], perhaps providingan indication of differing multi-phase plasmas, or more exotic dark matter candidates,such as an Axion-Like-Particle with a photo-conversion rate dependent on the cluster’smagnetic field structure.
Categorically, clusters fall into two groups. ‘Cool-core clusters’ are stable virial-ized structures with no recent major-mergers, whereas in ‘non-cool-core’ clusters re-cent collisions have inhibited dynamical relaxation. Radiative cooling timescales are∼ 108− 109 yr, creating a flow of hot (∼ 7 keV) dispersed gas to into the cool (∼ 3 keV)cluster center. AGN feedback eventually halts the inflow and maintains temperatures ofabout a few keV [21]. Perseus is a prototypical cool-core cluster with a complicated corestructure, where the plasma has clearly been affected by feedback from the bright centralAGN, offering an excellent test case for a comparative study of DM versus gas-correlatedemission. Unfortunately, due to the relatively low flux of the spectral line in question,all but the most prominent of the detailed core structures in Perseus are unresolved,making a morphological analysis potentially less stringent than in the Galactic center.A prominent spatial feature associated with the cluster core would, however, providea strong handle for differentiating exotic emission from that associated with the coolcore [21–23] (see also Ref. [14]).
2.2 X-Ray Data Selection
We employ archival observations from XMM for both the Galactic center and the Perseuscluster. We restrict our analysis to using the two EPIC MOS detectors which haveboth higher spatial resolution and fewer instrumental chip gap features than the EPICPN detector. While in principle the Chandra Observatory would offer better spatialresolution, the smaller field-of-view and lower effective area of Chandra make XMM thebetter choice. In addition, given the small 3.5 keV line flux, we employ a binning thatis in any case larger than the inherent instrumental angular resolution.
For the Galactic center we use the same observations as listed in Table 1 of Ref. [3].This set has been chosen to eliminate observations with either strong particle back-ground flaring or significant flaring from Sgr A*. For the Perseus cluster we utilize thesame two XMM observations as in Ref. [1]. The basic data reduction follows Ref. [3].All observations were reprocessed using the emchain task in XMM SAS version 13.5.0.Particle background flares were then removed using the mos-filter task in the XMMESAS package [24, 25]. The energies of all photons in the Perseus field-of-view are then
– 5 –

blue-shifted by the current NED value5 z = 0.0179.For each observation, we also created a mask to remove regions containing bright
point sources, including Sgr A* in the Galactic center and the central AGN in Perseus, aswell as low exposure regions due to chip gaps and bad columns on the detector. Maskswere generated with the ESAS task cheese run on broad-band (0.4-7.2 keV) images.These masks are applied consistently to all images generated as described below. Toappropriately include the detector response when modeling the possible dark mattercontribution (see Sec. 2.6), we also created exposure maps in the 3-4 keV band for eachobservation.
2.3 Binned Likelihood Analysis
In order to quantify the contributions of various templates to the 3.45-3.60 keV band, weperform a pixel-by-pixel binned likelihood analysis. Photons are binned into 20” squarepixels over the ≈ 0.5 diameter field of view of XMM’s MOS1 & MOS2 imagers. Thischoice provides an average of several photons per pixel for the weak detectable emissionlines (after subtracting off continuum emission), and happens to be only slightly largerthan the XMM MOS point-spread function, implying that little would be gained withfiner resolutions. We verified that the main conclusions reached by the present analysisare largely independent of this specific choice of binning, with only minor changes to e.g.limits. In these cases, we have ensured that the results presented here reflect the mostconservative values.
The Poisson likelihood function is defined by
L =
Npix∏i=1
µdii e−µi
di!, (2.1)
where µi and di are the predicted and observed counts for pixel i. The model countsare derived by summing the included templates with independent normalizations. Thenormalizations of each template are restricted to be positive semi-definite and are varieduntil the log-likelihood is maximized. To obtain a fast approximate fit, we use the welltested minimization algorithm MIGRAD from the IMINUIT python package6. Due to thelarge fit parameter space and the potential for nearly degenerate templates, we then usethe stochastic global minimizer BasinHopping-L-BFGS-B7 for further refinement.
A test-statistic (TS) is defined through the likelihood-ratio test TS= −2∆ ln(L)where ∆ ln(L) is the difference in log-likelihood between the null and trial model. Whenonly considering the normalization of a single template, the TS behaves as a χ2/2 dis-tribution with one degree of freedom. Limits are found by increasing the normalizationof the (e.g. dark matter) template until the log-likelihood is decreased by s2/2, for an sstandard deviation result. We use s = 2 throughout, corresponding to 95% confidencelevels.
5http://ned.ipac.caltech.edu6http://iminuit.github.io/iminuit/index.html7http://docs.scipy.org/doc/scipy-dev/reference/generated/scipy.optimize.basinhopping.html
– 6 –

2.4 Continuum Templates
We select 5 continuum emission bands at energies between 3.19 and 4.8 keV8. The lower-energy sideband includes photons from 3.19 and 3.27 keV. Although partially overlappingwith the bright Ar XVII line at 3.14 keV, this band is included to provide continuumphotons at low energies, where dense line structure prohibits a single band of wide energy(and also prohibits the selection of line-free continuum at energies below 3 keV). Thesecond low-energy continuum band is also selected to be very narrow, ranging from3.373-3.45 keV, but provides a reasonable background sample immediately neighboringour spectral region of interest. For the next neighboring continuum band, we choose 3.6-3.811 keV which also includes a series of three weak and tightly-packed Ar XVII lines.The limited energy resolution of the XMM MOS sensors make it difficult to separate suchlines, and we include them as a single wide-band contribution. Finally, two additionalhigh-energy bands from 4.2-4.5 keV and 4.5-4.8 keV provide a region which is effectivelyfree of emission lines.
While the continuum templates are visually difficult to distinguish, it is clear fromthe likelihood analysis that they do supply linearly independent degrees of freedom,and that the inclusion of each additional continuum template improves the model fitto photons in the 3.5 keV band at high-significance. In Figure 1 we show log-scaledcontinuum count maps at high binning resolution (2.5”) for the photons between 4.2and 5.5 keV in both the Galactic center and Perseus fields. The GC is reveled to be veryasymmetrically-structured, while the Perseus cluster is significantly smoother and morespherically symmetric (i.e. virialized). A similar trend is observed in the morphologyof emission lines, although in the Perseus cluster different plasma lines show differentcharacteristic radii depending of the temperature at which their emissivity peaks.
When analyzing the morphology of the residual emission (i.e. the emission notassociated with continuum templates), when performing dark matter fits, and whencomputing limits, we consider three different continuum models with the intent of prob-ing the sensitivity to the background model. The set of continuum models we employ isas follows:
• ‘All’, utilizes all five continuum templates
• ‘Neighboring’ uses the two templates bracketing our 3.45-3.6 keV band of interestplus a single high-energy band (4.2-4.5 keV), and
• ‘High-energy’ uses only the two high-energy bands.
While it is naively preferable for the ‘Neighboring’ model to include only the neighboringtwo bands, these are both contaminated by Ar line structures that are substantiallybrighter near Sgr A* than the nearby continuum. In addition, when we fit the 3.5 keVphotons using this background model, inspection of the covariance matrix reveals neardegeneracy between fitting the normalization of the two neighboring sidebands in bothPerseus and the Galactic Center. We therefore (minimally) add the 4.2-4.5 keV band
8See also Fig. 7, where we show the bands we employ as vertical green bands above 3 keV.
– 7 –

−0.3−0.2−0.10.00.10.2
Galactic Longitude l []
−0.3
−0.2
−0.1
0.0
0.1
0.2
Gal
acti
cL
ati
tud
eb
[]
−12.50
−12.25
−12.00
−11.75
−11.50
−11.25
−11.00
−10.75
−10.50
log
10
Cou
nts
(cm−
2s−
1sr−
1)
(a) Galactic center
−0.2−0.10.00.10.2
Offset Equatorial East []
−0.2
−0.1
0.0
0.1
0.2
Off
set
Equ
atori
al
Nor
th[
]
−12.0
−11.7
−11.4
−11.1
−10.8
−10.5
−10.2
−9.9
−9.6
−9.3
log
10
Cou
nts
(ph
cm−
2s−
1sr−
1)
(b) Perseus cluster
Figure 1. Representative continuum photon maps for energies in the 4.2-5.5 keV range, centeredon Sgr A* in the Galactic center (left) region and on the Perseus cluster (right). Count maps havebeen blurred using a Gaussian kernel with σ = 2.5′′ and are log-scaled to highlight distinctivespatial features. In the right panel, the x-y axes are aligned with the equatorial axes and showthe angular displacement from the cluster center. In both cases, bright point sources have beenmasked out.
in order to provide at least one clean (“line-free”) continuum sample. It is importantto note that this continuum template does not resemble a dark matter profile (Fig. 1)while improving the fit dramatically in each system.
2.5 Emission Line Templates
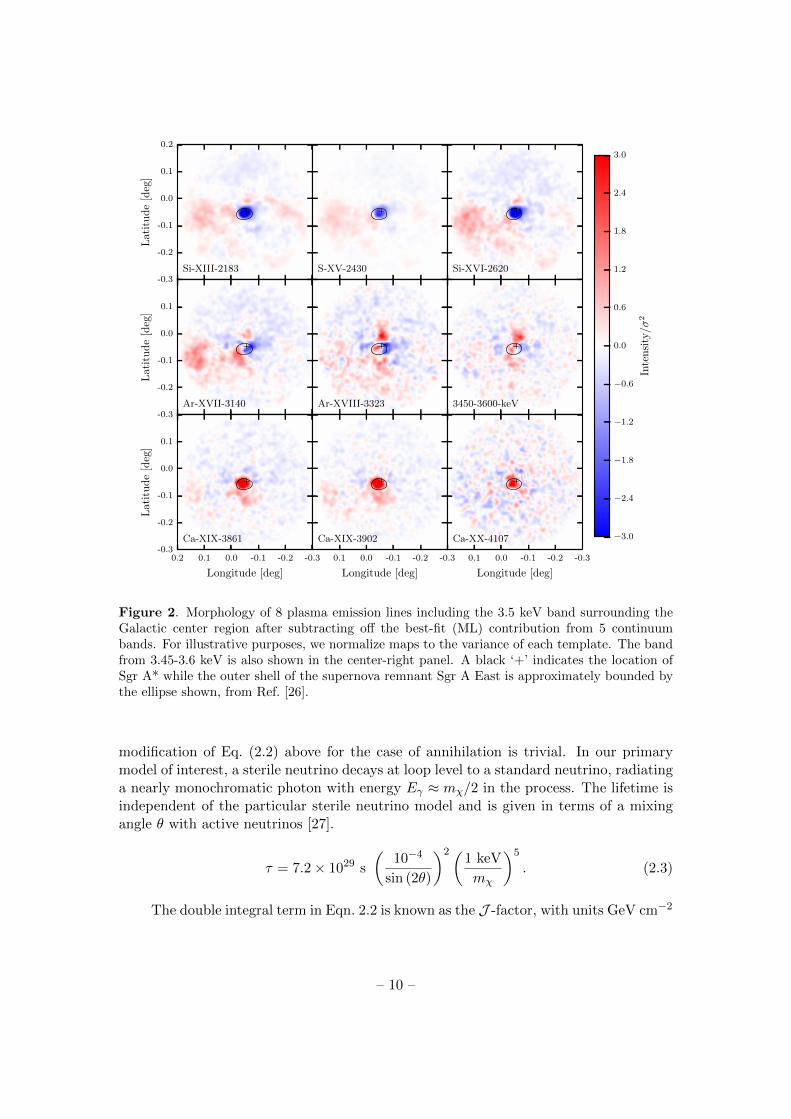
In order to search for qualitative correlations between the 3.5 keV exess and knownplasma emission lines, we create templates for 8 spectral lines between 2 and 4.1 keV byselecting photons within ±50 eV of each line’s central energy9. The complete list of lineswe consider is in the first column of the left panel of Table 1, along with the correspondingcentral energies and peak emissivity temperatures (the electron temperature for whichthe line intensity is maximal). In Figure 2 we show the line templates, as well as our3.45-3.6 keV band of interest, with the best fitting ‘All’ continuum model subtracted offin order to highlight the characteristic morphology of each line. A black ‘+’ and ellipseindicate the location of Sgr A* and the shell of the supernova remnant (SNR) Sgr AEast, from Ref. [26].
Note that because many of the lines are weak with respect to the continuum emis-sion, and our continuum is slightly energy dependent, it is difficult to unambiguouslyseparate ‘line photons’ from ‘continuum photons’. Later in our analysis we refer to ‘line’templates in two contexts: for qualitative comparisons we will subtract off the best fit-
9The Full-Width-Half-Maximum (FWHM) energy resolution of the MOS CCDs is approximately100 eV
√Eγ/3.5 keV. Performance characteristics for XMM used throughout this paper are taken
from http://xmm.esac.esa.int/external/xmm user support/documentation/uhb 2.1/node1.html.
– 8 –
ting continuum model, and thus most of the residual should be characteristic of thatspectral line. When setting limits on the dark matter decay lifetime we will howeverinclude all photons in the respective line energy bands. In each case where the linetemplates are used, one should keep the above caveat in mind, though we do not expecteither the continuum or line emission to trace dark matter.
Figure 2 shows a clear common feature observed across all lines whose emissivitiespeak at relatively low plasma temperatures, which exhibit a negative (oversubtracted)residual concentrated near SNR Sgr A East, which increases into a bright, 0.2 diameterlobe extended toward positive galactic longitudes. In contrast, the lines which peak athigher plasma temperatures10 are seen to be more centrally concentrated around Sgr A*and Sgr A East. The 3.45-3.6 keV band shows a distinct quadrapolar morphology withpositive residuals in the north/south oriented lobes. Visually, this ‘residual’ emissionmost closely resembles the Ar XVIII line at 3.32 keV, and it is already evident that thisemission profile is qualitatively incompatible with that expected from dark matter. Wequantify this statement accurately in what follows.
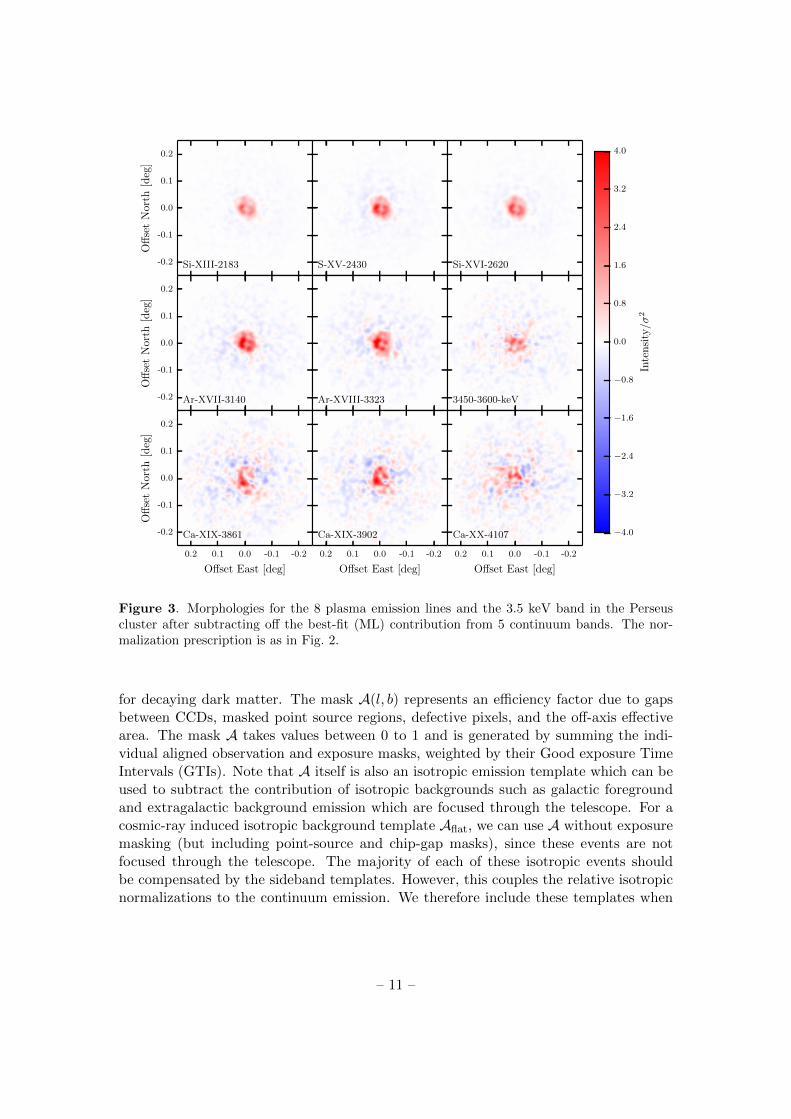
In Figure 3, we exhibit the same set of lines for the Perseus cluster. At our binningresolution and exposure depth, many of the detailed asymmetric features in the clusterare unfortunately washed out, and one is left with an approximately spherical distribu-tion of X-rays for both the continuum and the lines. Still, the two well-known ‘ear-like’features (see e.g. Ref. [23]) are visible in the central regions, keeping in mind thatpoint source masking and exposure maps induce some distortions. Clearly, cooler emis-sion lines are more concentrated in the cool cluster core, with a characteristic radius. 2.5′, while emission lines associated with hotter, higher-dispersion plasmas extendwell beyond the core. The 3.5 keV band appears, here, to be associated both withthe core, perhaps from residual low-energy continuum emission, as well as exhibiting asmall extended component tracing the morphology of emission lines that peak at highertemperatures (Tpeak & 3 keV). In Section 3.1 we discuss potential systematic effectsassociated with the continuum model for the 3.5 keV band.
2.6 Dark Matter Templates
The differential flux of photons from dark matter decay factorizes into two components:one containing the particle physics (P. P.) factors and one associated with the particle-physics-model-independent astrophysics.
dΦγ
dEγ=
1
4π
∑f
Γfmχ
dNγ
dEγ︸ ︷︷ ︸P.P.
∫∆Ω
∫l.o.sA(l, b) · ρ(l, b, z) dΩdz︸ ︷︷ ︸J−factor
(2.2)Decay
In the above equations, the first terms represent the particle physics for final-states f , dark matter mass mχ, and model-independent decay rate Γ ≡ 1/τ . The
10We urge caution in strictly interpreting emission in terms of temperature, as varying relative ele-mental abundances also play an important role in the morphology.
– 9 –
-0.3
-0.2
-0.1
0.0
0.1
0.2L
ati
tud
e[d
eg]
Si-XIII-2183 S-XV-2430 Si-XVI-2620
-0.3
-0.2
-0.1
0.0
0.1
Lati
tud
e[d
eg]
Ar-XVII-3140 Ar-XVIII-3323 3450-3600-keV
-0.3-0.2-0.10.00.10.2
Longitude [deg]
-0.3
-0.2
-0.1
0.0
0.1
Lat
itu
de
[deg
]
Ca-XIX-3861
-0.3-0.2-0.10.00.1
Longitude [deg]
Ca-XIX-3902
-0.3-0.2-0.10.00.1
Longitude [deg]
Ca-XX-4107 −3.0
−2.4
−1.8
−1.2
−0.6
0.0
0.6
1.2
1.8
2.4
3.0
Inte
nsi
ty/σ
2
Figure 2. Morphology of 8 plasma emission lines including the 3.5 keV band surrounding theGalactic center region after subtracting off the best-fit (ML) contribution from 5 continuumbands. For illustrative purposes, we normalize maps to the variance of each template. The bandfrom 3.45-3.6 keV is also shown in the center-right panel. A black ‘+’ indicates the location ofSgr A* while the outer shell of the supernova remnant Sgr A East is approximately bounded bythe ellipse shown, from Ref. [26].
modification of Eq. (2.2) above for the case of annihilation is trivial. In our primarymodel of interest, a sterile neutrino decays at loop level to a standard neutrino, radiatinga nearly monochromatic photon with energy Eγ ≈ mχ/2 in the process. The lifetime isindependent of the particular sterile neutrino model and is given in terms of a mixingangle θ with active neutrinos [27].
τ = 7.2× 1029 s
(10−4
sin (2θ)
)2(1 keV
mχ
)5
. (2.3)
The double integral term in Eqn. 2.2 is known as the J -factor, with units GeV cm−2
– 10 –
-0.2
-0.1
0.0
0.1
0.2O
ffse
tN
ort
h[d
eg]
Si-XIII-2183 S-XV-2430 Si-XVI-2620
-0.2
-0.1
0.0
0.1
0.2
Off
set
Nort
h[d
eg]
Ar-XVII-3140 Ar-XVIII-3323 3450-3600-keV
-0.2-0.10.00.10.2
Offset East [deg]
-0.2
-0.1
0.0
0.1
0.2
Off
set
Nort
h[d
eg]
Ca-XIX-3861
-0.2-0.10.00.10.2
Offset East [deg]
Ca-XIX-3902
-0.2-0.10.00.10.2
Offset East [deg]
Ca-XX-4107 −4.0
−3.2
−2.4
−1.6
−0.8
0.0
0.8
1.6
2.4
3.2
4.0
Inte
nsi
ty/σ
2
Figure 3. Morphologies for the 8 plasma emission lines and the 3.5 keV band in the Perseuscluster after subtracting off the best-fit (ML) contribution from 5 continuum bands. The nor-malization prescription is as in Fig. 2.
for decaying dark matter. The mask A(l, b) represents an efficiency factor due to gapsbetween CCDs, masked point source regions, defective pixels, and the off-axis effectivearea. The mask A takes values between 0 to 1 and is generated by summing the indi-vidual aligned observation and exposure masks, weighted by their Good exposure TimeIntervals (GTIs). Note that A itself is also an isotropic emission template which can beused to subtract the contribution of isotropic backgrounds such as galactic foregroundand extragalactic background emission which are focused through the telescope. For acosmic-ray induced isotropic background template Aflat, we can use A without exposuremasking (but including point-source and chip-gap masks), since these events are notfocused through the telescope. The majority of each of these isotropic events shouldbe compensated by the sideband templates. However, this couples the relative isotropicnormalizations to the continuum emission. We therefore include these templates when
– 11 –
−0.3−0.2−0.10.00.10.2
Longitude []
−0.3
−0.2
−0.1
0.0
0.1
0.2L
ati
tud
e[
]
−0.2−0.10.00.10.2
Offset East []
−0.2
−0.1
0.0
0.1
0.2
Off
set
Nort
h[
]
0.0
0.1
0.2
0.3
0.4
0.5
0.6
0.7
0.8
0.9
1.0
Rel
ati
veIn
ten
sity
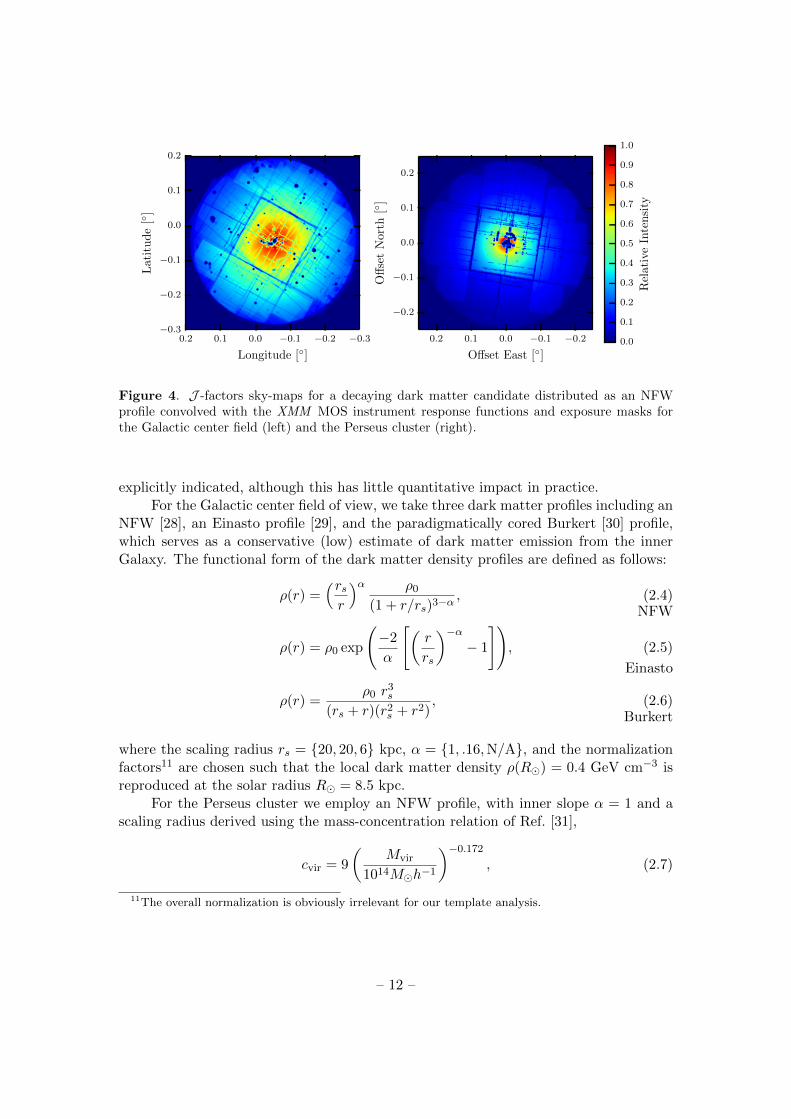
Figure 4. J -factors sky-maps for a decaying dark matter candidate distributed as an NFWprofile convolved with the XMM MOS instrument response functions and exposure masks forthe Galactic center field (left) and the Perseus cluster (right).
explicitly indicated, although this has little quantitative impact in practice.For the Galactic center field of view, we take three dark matter profiles including an
NFW [28], an Einasto profile [29], and the paradigmatically cored Burkert [30] profile,which serves as a conservative (low) estimate of dark matter emission from the innerGalaxy. The functional form of the dark matter density profiles are defined as follows:
ρ(r) =(rsr
)α ρ0
(1 + r/rs)3−α , (2.4)NFW
ρ(r) = ρ0 exp
(−2
α
[(r
rs
)−α− 1
]), (2.5)
Einasto
ρ(r) =ρ0 r
3s
(rs + r)(r2s + r2)
, (2.6)Burkert
where the scaling radius rs = 20, 20, 6 kpc, α = 1, .16,N/A, and the normalizationfactors11 are chosen such that the local dark matter density ρ(R) = 0.4 GeV cm−3 isreproduced at the solar radius R = 8.5 kpc.
For the Perseus cluster we employ an NFW profile, with inner slope α = 1 and ascaling radius derived using the mass-concentration relation of Ref. [31],
cvir = 9
(Mvir
1014Mh−1
)−0.172
, (2.7)
11The overall normalization is obviously irrelevant for our template analysis.
– 12 –
Template E (keV) Tpk(107 K)
Si XIII 2.183 1.0S XV 2.430 1.26Si XVI 2.620 2.0Ar XVII 3.140 2.0Ar XVIII 3.323 3.98Ca XIX 3.861 2.51Ca XIX 3.902 3.16Ca XX 4.107 5.01
Template E (keV)
Ctnm1 3.190-3.270Ctnm2 3.373-3.450Ctnm3 3.600-3.811†
Ctnm4 4.200-4.500Ctnm5 4.500-4.800DM –Focused Isotropic –Flat Isotropic –
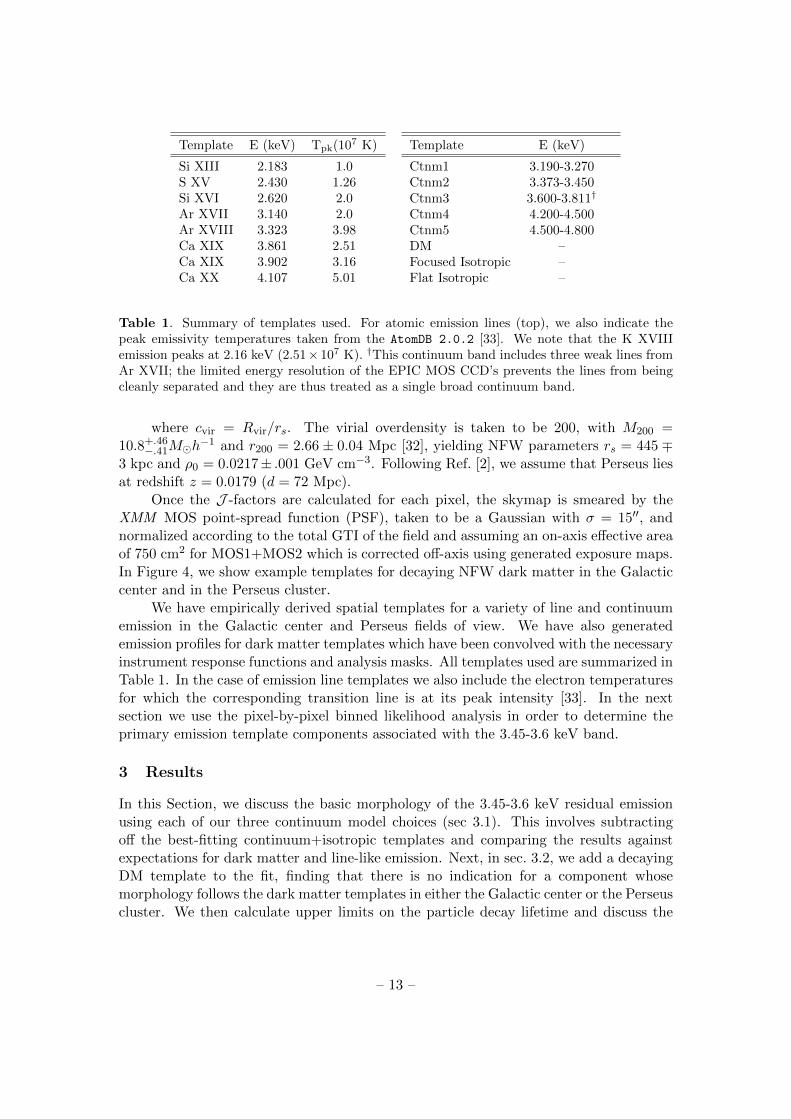
Table 1. Summary of templates used. For atomic emission lines (top), we also indicate thepeak emissivity temperatures taken from the AtomDB 2.0.2 [33]. We note that the K XVIIIemission peaks at 2.16 keV (2.51× 10⁷ K). †This continuum band includes three weak lines fromAr XVII; the limited energy resolution of the EPIC MOS CCD’s prevents the lines from beingcleanly separated and they are thus treated as a single broad continuum band.
where cvir = Rvir/rs. The virial overdensity is taken to be 200, with M200 =10.8+.46
−.41Mh−1 and r200 = 2.66 ± 0.04 Mpc [32], yielding NFW parameters rs = 445 ∓
3 kpc and ρ0 = 0.0217± .001 GeV cm−3. Following Ref. [2], we assume that Perseus liesat redshift z = 0.0179 (d = 72 Mpc).
Once the J -factors are calculated for each pixel, the skymap is smeared by theXMM MOS point-spread function (PSF), taken to be a Gaussian with σ = 15′′, andnormalized according to the total GTI of the field and assuming an on-axis effective areaof 750 cm2 for MOS1+MOS2 which is corrected off-axis using generated exposure maps.In Figure 4, we show example templates for decaying NFW dark matter in the Galacticcenter and in the Perseus cluster.
We have empirically derived spatial templates for a variety of line and continuumemission in the Galactic center and Perseus fields of view. We have also generatedemission profiles for dark matter templates which have been convolved with the necessaryinstrument response functions and analysis masks. All templates used are summarized inTable 1. In the case of emission line templates we also include the electron temperaturesfor which the corresponding transition line is at its peak intensity [33]. In the nextsection we use the pixel-by-pixel binned likelihood analysis in order to determine theprimary emission template components associated with the 3.45-3.6 keV band.
3 Results
In this Section, we discuss the basic morphology of the 3.45-3.6 keV residual emissionusing each of our three continuum model choices (sec 3.1). This involves subtractingoff the best-fitting continuum+isotropic templates and comparing the results againstexpectations for dark matter and line-like emission. Next, in sec. 3.2, we add a decayingDM template to the fit, finding that there is no indication for a component whosemorphology follows the dark matter templates in either the Galactic center or the Perseuscluster. We then calculate upper limits on the particle decay lifetime and discuss the
– 13 –
implications for a dark matter interpretation of the 3.5 keV line. Finally, we use themaximum likelihood technique to check for spatial correlations between the 3.5 keV bandand nearby energies, uncovering strong statistical evidence in favor of an astrophysicalinterpretation of the 3.5 keV line (sec. 3.3).
3.1 Residual Maps
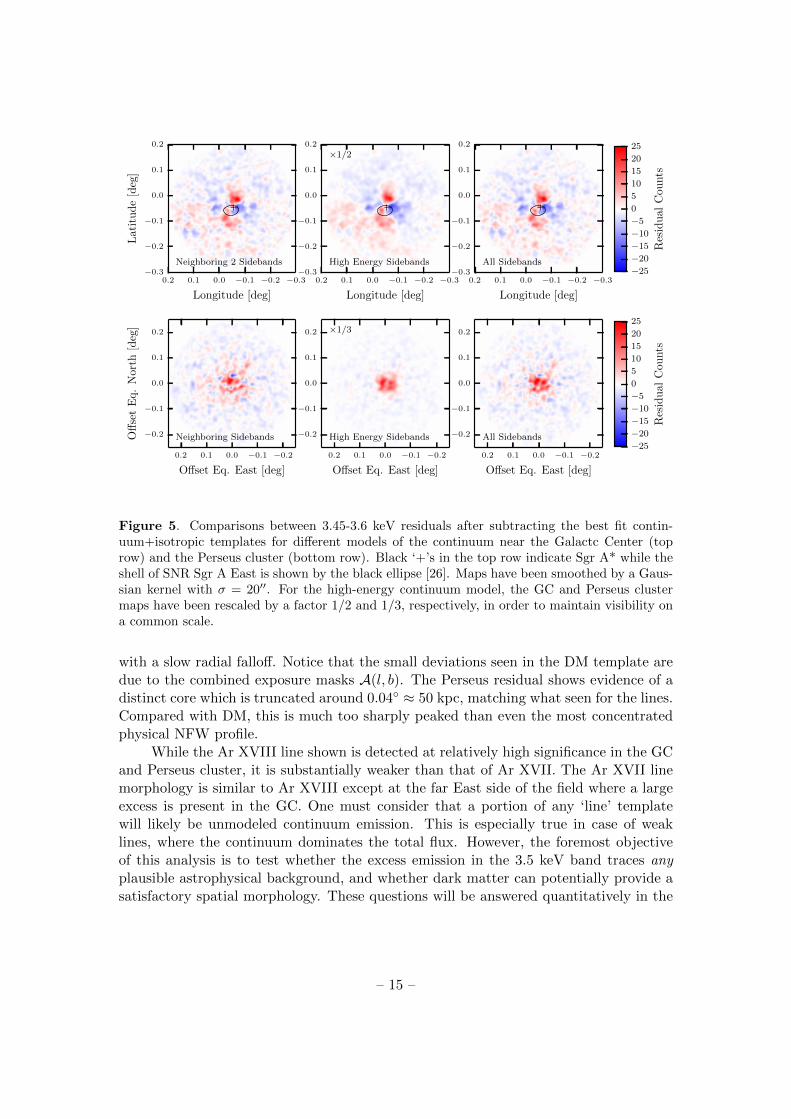
We perform a maximum likelihood analysis of the Galactic center and of the Perseuscluster X-ray observations listed above for energies between 3.45-3.6 keV, subtractingoff the best-fitting linear combination of (1) isotropic templates, and (2) each of the‘All’, ‘Neighboring’, and ’High-Energy’ continuum template sets described in Section2.4. Figure 5 shows the residual count maps for the Galactic center (top panels) and forthe Perseus cluster (bottom panels) for each of the three different continuum models.
For each continuum model in the GC we observe a bright extension emanatingroughly perpendicularly to the Galactic plane from the position of Sgr A* (black ‘+’),with a smaller bridge connecting toward the direction of the supernova remnant Sgr AEast (the outer shell is represented by the black ellipse [26]) as well as a large faint bubbleextending to the positive longitude edge of the field. Although this residual appears mostlikely associated with Sgr A* or Sgr A East, the central few parsecs are not well resolvedand are known to host a large number of potential sources. The largest residual isseen when using the high-energy model, indicating that this feature is at least partiallyaligned with the ≈ 3.2 keV and ≈ 3.5 keV continuum. In the ‘All’ and ‘Neighboring’models, the residual is substantially reduced and the log-likelihood is greatly increased.
In the Perseus cluster (Fig. 5, bottom), prominent morphological identifiers areseen in each residual. A relatively bright core region is apparent, with 4-5 ‘hot-spots’.Extensions to large radii are also observed, similar to those observed in the hotter Cal-cium lines, and to a lesser extent in Ar XVIII. The clumped nature of these hot-spotsis difficult to reconcile with the much smoother distribution expected from dark matteras is the radial profile which has a much sharper gradient at the edge of the core thanwhat expected from a decaying dark matter profile (cf. Fig. 4).
In Figure 6 we show averaged radial and azimuthal intensity profiles for each ofthe residuals along with the NFW DM templates, a prototypical cool emission line (SXV at 2.43 keV), and a medium-temperature emission line (Ar XVIII at 3.32 keV),both with the ‘All’ continuum model already subtracted. The normalizations of linesand DM templates are determined by minimizing the total χ2 of the binned templatein question to the ‘All’ residual – i.e. the best fit is to the entire template rather thanfitting the averaged profiles individually. Because the dark matter templates are positiveeverywhere, we have also included a flat isotropic degree of freedom in this case.
By visual inspection, it is evident that standard decaying dark matter does notprovide a good fit to either the GC or Perseus cluster system azimuthally or radially,while the Ar XVIII line morphology shares precisely the same features as the GC residualand both the Ar XVIII and the S XV profiles share common features with the Perseusresidual. The GC is characterized by a distinctly quadrupolar profile in azimuth and bya centrally peaked radial profile. The DM template is instead effectively flat in azimuth,
– 14 –
−0.3−0.2−0.10.00.10.2
Longitude [deg]
−0.3
−0.2
−0.1
0.0
0.1
0.2
Lati
tud
e[d
eg]
Neighboring 2 Sidebands
−0.3−0.2−0.10.00.10.2
Longitude [deg]
−0.3
−0.2
−0.1
0.0
0.1
0.2
×1/2
High Energy Sidebands
−0.3−0.2−0.10.00.10.2
Longitude [deg]
−0.3
−0.2
−0.1
0.0
0.1
0.2
All Sidebands−25
−20
−15
−10
−5
0
5
10
15
20
25
Res
idu
al
Cou
nts
−0.2−0.10.00.10.2
Offset Eq. East [deg]
−0.2
−0.1
0.0
0.1
0.2
Off
set
Eq.
Nor
th[d
eg]
Neighboring Sidebands
−0.2−0.10.00.10.2
Offset Eq. East [deg]
−0.2
−0.1
0.0
0.1
0.2 ×1/3
High Energy Sidebands
−0.2−0.10.00.10.2
Offset Eq. East [deg]
−0.2
−0.1
0.0
0.1
0.2
All Sidebands−25
−20
−15
−10
−5
0
5
10
15
20
25
Res
idu
al
Cou
nts
Figure 5. Comparisons between 3.45-3.6 keV residuals after subtracting the best fit contin-uum+isotropic templates for different models of the continuum near the Galactc Center (toprow) and the Perseus cluster (bottom row). Black ‘+’s in the top row indicate Sgr A* while theshell of SNR Sgr A East is shown by the black ellipse [26]. Maps have been smoothed by a Gaus-sian kernel with σ = 20′′. For the high-energy continuum model, the GC and Perseus clustermaps have been rescaled by a factor 1/2 and 1/3, respectively, in order to maintain visibility ona common scale.
with a slow radial falloff. Notice that the small deviations seen in the DM template aredue to the combined exposure masks A(l, b). The Perseus residual shows evidence of adistinct core which is truncated around 0.04 ≈ 50 kpc, matching what seen for the lines.Compared with DM, this is much too sharply peaked than even the most concentratedphysical NFW profile.
While the Ar XVIII line shown is detected at relatively high significance in the GCand Perseus cluster, it is substantially weaker than that of Ar XVII. The Ar XVII linemorphology is similar to Ar XVIII except at the far East side of the field where a largeexcess is present in the GC. One must consider that a portion of any ‘line’ templatewill likely be unmodeled continuum emission. This is especially true in case of weaklines, where the continuum dominates the total flux. However, the foremost objectiveof this analysis is to test whether the excess emission in the 3.5 keV band traces anyplausible astrophysical background, and whether dark matter can potentially provide asatisfactory spatial morphology. These questions will be answered quantitatively in the
– 15 –

−180 −135 −90 −45 0 45 90 135 180
Azimuthal Angle [deg]
−400
−300
−200
−100
0
100
200
300
400
500
Cou
nts
[phµ
sr−
1]
Galactic CenterAveraging: 0 < r < .25
0.00 0.05 0.10 0.15 0.20 0.25
Radius [deg]
−40
−20
0
20
40
60
80
Cou
nts
[phµ
sr−
1]
Galactic CenterAveraging: −180 < φ < 180
DM
S-XV-2430
Ar-XVIII-3323
High-Energy Residual
Neighbor Residual
All Residual
−180 −135 −90 −45 0 45 90 135 180
Azimuthal Angle [deg]
−200
−150
−100
−50
0
50
100
Cou
nts
[phµ
sr−
1]
Perseus ClusterAveraging: 0 < r < .25
0.00 0.05 0.10 0.15 0.20 0.25
Radius [deg]
−20
0
20
40
60
80
100
120
Cou
nts
[phµ
sr−
1]
Perseus ClusterAveraging: −180 < φ < 180
Peak at 235
ALP Photo-conversion (Ref. [34])
Figure 6. Radial and azimuthal profiles for the Galactic center (left panels) and for the Perseuscluster’s (right panels) un-smoothed residual maps shown in Fig 5. The shaded regions bracketalternative continuum models along with the best fitting NFW template (red), S XV Line (lightblue), and Ar XVIII line (magenta). Poisson error bars are shown for our ‘All’ model. Azimuthalprofiles rotate clockwise from the line pointing from the center (Sgr A* in the GC) to positivelongitudes. In the top-right panel, we also show the steepest radial profile expected from photo-conversion of axion-like-particles (solid blue), calculated using formulae in Ref. [34] and convolvedwith the relevant masks and instrument response.
following sections.For Perseus, we also overlay the steepest of the radial profiles expected from pho-
toconversion of axion-like-particles (ALPs) in Perseus’ large scale magnetic field as cal-culated using Eqns. (3.1) and (3.3) of Ref. [34], with a free electron density ne takenfrom Ref. [35], and using the NFW parameters specified in our subsec 2.6. The threedimensional profile for the axion signal is then proportional to ρ(r) × ne(r)
2η and isalways steeper than the decaying DM case for a radially decaying magnetic field, as ismeasured in Perseus. The case shown corresponds to the steepest magnetic field profile,η = 1, while smaller values of η lead to a significant flattening. The projected skymapwas then convolved with the relevant masks.
The ALP scenario is significantly steeper than the decaying DM case due to themagnetic field falloff and it visually appears marginally compatible with the morphologyof the residual emission. As η → 0, this profile asymptotes to the decaying DM case.
– 16 –

The azimuthal profile is also reasonably compatible, though much less so than for theprofiles corresponding to elemental lines. While the steepest ALP-conversion profilemorphologically traces the cluster’s core, the excess emission is much better fit by addinga continuum or low energy line template (after which there is no preference for ALPs).We discuss this aspect on more quantitative grounds in the next section.
Recently, Ref. [36] also calculated the morphology expected in the Milky Way’scenter where the signal is expected to roughly trace the projected free electron density(see also Ref. [37]). Based on the NE2001 model for the free electron distribution [38, 39],the expected signal is (i) highly elliptical with an axis ratio of nearly 4:1 elongated in theGalactic plane, and (ii) has a peak intensity offset from the center ≈ 7′ toward Galacticsouth. Neither of these features are remotely compatible with the observed excess. Infact, the orientation of an ALP-conversion excess is orthogonal to the residual shownhere making it maximally incompatible with observations. A successful interpretationof the 3.5 keV line in terms of ALP photoconversion seems unlikely across both objectssimultaneously. The case for an astrophysical origin of the GC 3.5 keV signal thusappears very robust.
3.2 Fits and Limits for Decaying Dark Matter
In this section we test statistically for the presence of a dark matter component in thespatial distribution of photons in the 3.45-3.6 keV band. Using the method of maximumlikelihood described above, our model consists of up to eight templates: one for darkmatter, one to two for flat and focused isotropic templates, and up to five more, de-pending on the continuum model. Our key finding is that there is no statistical evidence(TS≈0) for decaying dark matter in the Galactic center region for any combination ofthe three DM halo models or continuum models, with or without any combination ofisotropic templates.
As additional tests of the robustness of our results, we start with the ‘All’ continuumand an ‘NFW’ profile and allow the central location of the DM profile to float in thevicinity of Sgr A*, increase the size of the spatial binning, radially mask the inner 5arcminutes, and mask the outer 5 arcminutes, finding that each variation produces nochange in the (zero) statistical significance of the dark matter template. Finally, we scanthe inner slope of the NFW profile between 0 and 3, finding no preferred value. Sincethe DM profile is a pure power-law this close to the GC, annihilating dark matter –with the intensity canonically tracing r−2 – is also essentially ruled out as a candidateexplanation of the 3.5 keV excess from the GC at high confidence level. We reiterate thatmodels where the signal is azimuthally flat, including e.g. eXciting Dark Matter [40] orannihilating dark matter scenarios (e.g. [41]), are clearly disfavored by the quadrupolarstructure of the residuals from the GC.
Similarly, the morphology of the X-ray emission from Perseus also does not exhibitany evidence for a dark matter component for the default cluster NFW model using anycontinuum model. Allowing the inner slope and scale factor to vary does not increase thegoodness of fit, unless the relevant parameters are set to completely unphysical values(e.g. rs = 60 kpc and γ = 1.6 compared to 445 kpc and 1 respectively), in which case
– 17 –
there is a slight statistical preference. These parameters effectively try to mimic theprofile of the cool inner core, making it clear that the excess emission is associated withunmodeled cool lines or with thermal continuum emission below 3 keV. We will explorethis further in sec. 3.3.
We also test the case of ALP photoconversion for Perseus. Using the ‘All’ continuummodel and both isotropic templates we find a TS=28 preference for the steepest ALPprofile (corresponding to η = 1 in subsection 3.1). We note that if the 3.5 keV line isdue to K XVIII, we expect to see strong correlations with the bright thermal emissionbelow 3 keV. This continuum is not included in our three continuum models, and if weadd continuum and/or line templates below 3 keV, these templates pick up TS>100 andthe ALP template’s TS becomes insignificant. The significance is also reduced for theshallower η = 0.5 scenario. While we cannot rule out an ALP component with robuststatistical significance due to the inherent morphological similarity to the core, it is clearthat an elemental origin is strongly preferred. This is also a natural interpretation giventhe strong incompatibility of the ALP photoconversion scenario with an excess in theGalactic Center.
We now calculate upper limits on the dark matter decay rate and sterile neutrinomixing angle. While what described above has focused on spatially correlating the 3.5keV excess with nearby regions of the X-ray spectrum, such analyses carry the importantcaveat that they may be sensitive to the choice of background models. If the templatesemployed in the fit – or some combination of them – are able to mimic the emissionprofile of dark matter, then there would be no statistical preference for adding a (nowredundant) DM template. When placing upper limits, the story is more subtle. Onthe one hand, as the normalization of the dark matter template is increased, additionaldegrees of freedom work to accommodate the ‘imposed’ DM component. On the otherhand, if the fit is poor to begin with, a small number of critical pixels may be degeneratewith a DM template; for example, within the brightest inner arcminutes of Sgr A*. Inlight of these competing effects we explicitly check each template combination in orderto systematically assess limits.
In Table 2 we show the 95% confidence level lower limits on the dark matter de-cay lifetime for NFW, Einasto, and Burkert profiles in the Galactic center, and for theexpected NFW profile for the Perseus cluster using the maximal template set: the ‘All’continuum, both isotropic templates, and all lines. These have been verified to be themost conservative12 and have also been translated into upper limits on the sterile neu-trino mixing angle using Eqn. (2.3). Remarkably, our morphological analysis of theGalactic center provides the most stringent available limits. Even in the most conserva-tive GC case, corresponding to the Burkert profile, the upper limit on the mixing angleessentially rules out preferred values for M31 in Ref. [2], while the other profiles rulethese out at high significance. The GC results also rule out a standard decaying darkmatter interpretation of the stacked cluster analysis in Ref. [1], unless a radically differ-
12The sole exception is for the ‘Neighboring’ continuum case, where the limits weaken by a factor ∼ 2in the GC. However, if we mask the inner 2’ of the DM mask, the limits become more stringent than forthe ‘All+Lines’ case, opposite of what would happen if a true dark matter component were present.
– 18 –
Target Template Set Profile J τ sin2(2θ)(1018 GeV cm−2) (1028 s)
GC All+Lines NFW 6.8 >3.7 < 1.1× 10⁻¹¹
GC All+Lines Ein 8.2 >5.9 < 7.0× 10⁻¹²
GC All+Lines Bur 1.9 >1.3 < 3.3× 10⁻¹¹
Perseus All NFW 1.4 >.55 < 7.5× 10⁻¹⁰
Perseus All+Lines NFW 1.4 >.03 < 1.5× 10⁻⁹
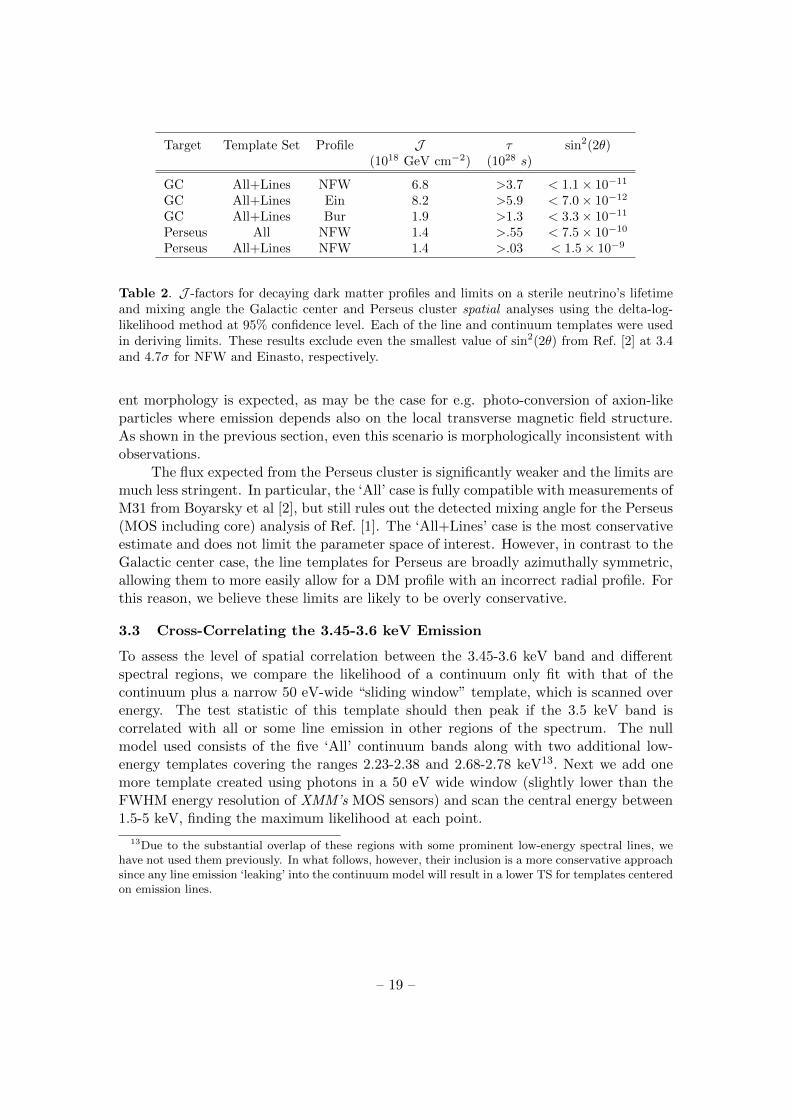
Table 2. J -factors for decaying dark matter profiles and limits on a sterile neutrino’s lifetimeand mixing angle the Galactic center and Perseus cluster spatial analyses using the delta-log-likelihood method at 95% confidence level. Each of the line and continuum templates were usedin deriving limits. These results exclude even the smallest value of sin2(2θ) from Ref. [2] at 3.4and 4.7σ for NFW and Einasto, respectively.
ent morphology is expected, as may be the case for e.g. photo-conversion of axion-likeparticles where emission depends also on the local transverse magnetic field structure.As shown in the previous section, even this scenario is morphologically inconsistent withobservations.
The flux expected from the Perseus cluster is significantly weaker and the limits aremuch less stringent. In particular, the ‘All’ case is fully compatible with measurements ofM31 from Boyarsky et al [2], but still rules out the detected mixing angle for the Perseus(MOS including core) analysis of Ref. [1]. The ‘All+Lines’ case is the most conservativeestimate and does not limit the parameter space of interest. However, in contrast to theGalactic center case, the line templates for Perseus are broadly azimuthally symmetric,allowing them to more easily allow for a DM profile with an incorrect radial profile. Forthis reason, we believe these limits are likely to be overly conservative.
3.3 Cross-Correlating the 3.45-3.6 keV Emission
To assess the level of spatial correlation between the 3.45-3.6 keV band and differentspectral regions, we compare the likelihood of a continuum only fit with that of thecontinuum plus a narrow 50 eV-wide “sliding window” template, which is scanned overenergy. The test statistic of this template should then peak if the 3.5 keV band iscorrelated with all or some line emission in other regions of the spectrum. The nullmodel used consists of the five ‘All’ continuum bands along with two additional low-energy templates covering the ranges 2.23-2.38 and 2.68-2.78 keV13. Next we add onemore template created using photons in a 50 eV wide window (slightly lower than theFWHM energy resolution of XMM’s MOS sensors) and scan the central energy between1.5-5 keV, finding the maximum likelihood at each point.
13Due to the substantial overlap of these regions with some prominent low-energy spectral lines, wehave not used them previously. In what follows, however, their inclusion is a more conservative approachsince any line emission ‘leaking’ into the continuum model will result in a lower TS for templates centeredon emission lines.
– 19 –
In Figure 7 we show the test statistic as a function of the window energy (blackline) for the Galactic center and Perseus cluster along with an overlay of the raw spectrafor each system (light blue line with errorbars). We also indicate the 3.45-3.6 keV band(gold), continuum bands (hatched green), and spectral lines from Section 2.5 (and a fewextra), color coded by the ratio of their peak emissivity (electron) temperatures to thatof K XVIII taken from AtomDB 2.0.2 [33]. The width of each band corresponds to theincluded photon energy range while the height indicates the TS of the sliding windowat the central energy of each line. The height of the continuum and 3.45-3.6 keV bandare arbitrary.
Immediately, one can see a dramatic improvement to the Galactic center fit whenthe sliding template overlaps with any spectral line above 2.5 keV, peaking for the ArXVII line at 3.14 keV, but also very high for the Ar XVIII and Ca XIX lines. If thePoisson uncertainty were the only source of error, the corresponding significance wouldbe more than 10σ compared to TS=0 when adding a dark matter template. Of course,the TS becomes very large when the window overlaps with the 3.45-3.6 keV band sincethe fit becomes nearly perfectly autocorrelated. Contrarily, the TS runs to zero whenthe energy window overlaps with continuum bands already included in the fit, since littleto no additional template “information” is added.
The peaks of the line emission must be compared against neighboring pseudo-continuum regions which are not included in the null model. For example, the fit im-provement when the window is near 3 keV is much smaller than that of the neighboringspectral lines, indicating two things: First, the continuum emission in the 3.5 keV band isalready well modeled. Since the continuum morphology changes rather slowly in energy,adding more continuum templates offers little improvement; Second, for the Galacticcenter the morphology of the residual emission is strongly correlated with that of atomictransition lines. Since we are using the nearby continuum as a reference point, this canonly be attributed to the presence of a distinct emission component over a narrow en-ergy range. The cool lines below 2.5 keV are seen to have the opposite behavior, wherethe TS is instead reduced compared to the nearby continuum model. This is indicativeof a negative correlation with these spectral lines, and their template normalization ispreferentially driven to zero.
For each emission line, there exists a unique electron temperature where the emis-sivity peaks. If each element is assumed to be identically distributed, one would thenexpect a parallel morphology between emission lines that peak at similar temperatures.Roughly speaking, this is observed here, where the very-cool and very-hot lines do notprovide a substantially improved fit. It is difficult to quantify this further for severalreasons. Firstly, over the few keV energy range of interest here, the emissivity as afunction of temperature changes by less than a factor two for the emission lines consid-ered. Thus we have only weak sensitivity to the underlying plasma temperature usingmorphology. Secondly, it is important to note that chemical abundances are not uniformover the physical scales probed here. As noted by e.g. Ref. [26] in studying Sgr A East,heavy elements such as iron are distributed much more compactly compared with He-likeelements. More generally, recent simulations of supernova explosions show that hydrody-
– 20 –

2000 2500 3000 3500 4000 4500 5000
Energy [eV]
0
50
100
150
200T
est
Sta
tist
ic≡−
2∆lo
g(L
)
CaX
IX
SX
V
SiX
III
SiX
VI
ArX
VII
CaX
IX
SX
V
ArX
VII
I
CaX
X
3.5
5keV
Band
Galactic Center
Continuum
0.0
0.5
1.0
1.5
2.0
2.5
3.0
3.5
4.0
dN
/dE
[arb
]
0.0 0.5 1.0 1.5 2.0
Tpk/TK XVIIIpk
1500 2000 2500 3000 3500 4000 4500 5000
Blueshifted Energy [eV]
0
20
40
60
80
100
Tes
tS
tati
stic≡−
2∆lo
g(L
)
SX
V
SiX
VI
SX
V
FeX
XIV
SiX
III
ArX
VII
CaX
IXC
aX
IX
SiX
III
SiX
IV
ArX
VII
I
MgX
II
CaX
X
Perseus Cluster
Continuum
3.5
5keV
Band
0
2
4
6
8
10
12
dN
/d
E[a
rb]
0.0 0.5 1.0 1.5 2.0
Tpk/TK XVIIIpk
Figure 7. Shown in black is the test statistics corresponding to adding a sliding 50 eV-widewindow template to a null model consisting of 7 continuum bands (green hatched regions). Inlight blue we also overlay the raw XMM spectrum for the Galactic center (top) and Perseuscluster (bottom). The 3.45-3.6 keV band is highlighted in gold. The brightest spectral linetemplates (with correct widths) are color coded according to the ratio of a given line’s peakemissivity temperature to that of K XVIII. Tpeak for K XVIII is also represented by a dashedline at 2.16 keV, visible in the Perseus plot. For both the Gaclactic center and Perseus the TSstemming from adding a dark matter template is zero.
namic instabilities can lead to highly asymmetric ejection of heavy elements [42]. Thesefactors complicate, for example, showing a nearly perfect correlation between suspectedK XVIII at 3.5 keV and a spectral line with identical peak emissivity temperatures whilealso showing anti-correlation with cooler and hotter transition lines.
In the lower-panel of Figure 7 we show results for the Perseus cluster. Here thesituation is very different. The relevant physical scale is increased by more than 103 andemission is dominated by the approximately isothermal cool-core surrounded by increas-ingly warmer and fainter radial shells. This is in contrast to the Galactic center, where
– 21 –

the continuum flux is dominated by non-thermal emission (predominantly unresolvedpoint sources). On this scale, entire galaxies are nearly point-like and the relative dis-tribution of heavy elements is averaged out, depending much less on the atomic speciesin question. Emission lines above 2.5 keV are much weaker in Perseus, appearing onlyas small bumps in the spectrum. Still, distinct peaks are observed for the cooler SiXII and S XV lines while the Ar lines are more ambiguous. The hot Ca lines are nowanti-correlated compared to the in-between continuum region at 4 keV.
Below 2.4 keV the flux rises very rapidly and it becomes difficult to disentanglethe continuum and line emission. We note that the K XVIII line at 3.515 keV peaksat a plasma temperature of ≈2.16 keV, indicated by a vertical dashed line. In the op-tically thin limit, the power spectrum of the corresponding thermal bremsstrahlung isexponentially suppressed above 2.16 keV and is relatively flat below, having at most a
T−1/2e dependence on temperature. Since we would like to test for correlation with this
very low temperature continuum, this is not included in our baseline model. The sup-pressed TS observed at Si line energies could therefore be interpreted as anti-correlatedSi lines plus a strong continuum component due to a low temperature plasma. Sucha plasma must exist, as the core temperature of Perseus has been measured to have astrong component near kT ≈ 2 keV [23]. We note that the elemental abundances ofbremsstrahlung-generating ionized hydrogen and K XVIII are likely to be different. Theline structure is too dense below 2 keV to gain additional insight with such a simplisticanalysis.
For the Perseus cluster, our key finding is thus that the strongest correlations areobserved with the cluster’s core, namely continuum emission below ≈ 2.16 keV and selectlines that peak at similarly low electron temperatures. Such correlation is expected ifthe emission is due primarily to an atomic transition line of K XVIII, and is not expectedif the emission is due to dark matter. The recent findings of Ref. [14] reveal a similarresult, showing that the ratio of 3.5 keV emission in the core (r < 6 arcmin) to the‘confining-region’ (r > 6 arcmin) is at least a few times too large to be compatible withdecaying dark matter.
In summary, after finding no statisticaly significant morphological evidence for adark matter component in Perseus or the Galactic center, we have taken a narrow win-dow in photon energies and checked for regions of the spectrum with similar morphologyto that of the 3.45-3.6 keV band. In the Galactic center the background is highly non-thermal and we see very strong statistical evidence for correlation with known spectrallines. At face value, the lines that most closely match the 3.5 keV morphology are thosewhose emissivity peaks at electron temperatures similar to that of K XVIII. Thermalemission from such a population of kTe ≈ 2.1 keV electrons is sub-dominant comparedwith the unresolved point source component. In the Perseus cluster, we see more ambigu-ous evidence of line correlated emission in the 3.5 keV band. The cool thermal emissionis dominant in this system and the line fluxes above 2.6 keV are very low. Below 2.6keV, the dense line structure also inhibits a clean correlation with continuum versus lineemission. We note, however, that either of these cases could be taken as circumstantialevidence for K XVIII, or other atomic elemental emission since, for example, a kTe ≈ 2.1
– 22 –

keV electron gas maximizes the K XVIII emission and is already measured in the coreof Perseus.
4 Discussion and Conclusions
We have examined the morphology of the X-ray emission at 3.5 keV from the Galacticcenter region and from the Perseus cluster of galaxies. We employed a variety of differentchoices to model the morphology of the continuum emission, and studied the resultingresidual signal at 3.5 keV. The azimuthal and radial distribution of such signal is strik-ingly different from the prediction from dark matter decay. In the case of the Galacticcenter, the 3.5 keV emission has a distinct quadrupolar distribution and is completelyincompatible with emission from axion-like particle conversion. In the Perseus cluster3.5 keV emission strongly overlaps with the cluster’s cool clumpy core. While the ALPscenario cannot be ruled out for Perseus, it is strongly disfavored after adding even asingle additional low-energy continuum or line template.
Utilizing a sliding-window template, we demonstrated that the 3.5 keV emissionmost prominently correlates with the morphology of strong emission lines associated withAr and Ca transitions in the case of the Galactic center. For Perseus, the correlationis observed in lines with a comparable peak emission temperature to K XVIII (kTe ≈2.16 keV) and/or the corresponding thermal bremsstrahlung. This is generally observedto feature a distribution overlapping with the cluster’s cool core. In both the Galacticcenter and Perseus, we thus find strong evidence in favor of a plasma emission origin forthe observed 3.5 keV line and against a dark matter interpretation.
Finally, utilizing the same binned-likelihood approach, we set the most stringentconstraints to date on the lifetime of a dark matter particle decaying into a final stateincluding a 3.5 keV monochromatic photon. These constraints robustly exclude a darkmatter decay origin for the 3.5 keV line observed from clusters.
We believe that the burden of proof for a claim of discovery of any “new” physicsmust be set as high as reasonably possible. This includes pursuing with vigor Occam’srazor, thus focusing with due diligence on any explanation that does not invoke unnec-essary entities, and exploring with care the possible backgrounds and systematic errors.In the context of astrophysical searches for dark matter, the duck test – “If it looks like aduck, swims like a duck, and quacks like a duck, then it is a duck” – is far from sufficientproof. This work provides additional and robust evidence that the 3.5 keV line does notlook, swim, nor quack like dark matter.
5 Acknowledgments
EC is supported by a NASA Graduate Research Fellowship under NASA NESSFGrant No. NNX13AO63H. SP is partly supported by the US Department of Energy,Contract DE-SC0010107-001. We thank Joseph P. Conlon for feedback on an earlierversion of this manuscript.
– 23 –
References
[1] E. Bulbul, M. Markevitch, A. Foster, R. K. Smith, M. Loewenstein, et al., Detection of AnUnidentified Emission Line in the Stacked X-ray spectrum of Galaxy Clusters,arXiv:1402.2301.
[2] A. Boyarsky, O. Ruchayskiy, D. Iakubovskyi, and J. Franse, An unidentified line in X-rayspectra of the Andromeda galaxy and Perseus galaxy cluster, arXiv:1402.4119.
[3] T. E. Jeltema and S. Profumo, Dark matter searches going bananas: the contribution ofPotassium (and Chlorine) to the 3.5 keV line, arXiv:1408.1699.
[4] A. Boyarsky, O. Ruchayskiy, and M. Shaposhnikov, The Role of sterile neutrinos incosmology and astrophysics, Ann.Rev.Nucl.Part.Sci. 59 (2009) 191–214,[arXiv:0901.0011].
[5] T. Higaki, K. S. Jeong, and F. Takahashi, The 7 keV axion dark matter and the X-ray linesignal, Phys.Lett. B733 (2014) 25–31, [arXiv:1402.6965].
[6] J. Jaeckel, J. Redondo, and A. Ringwald, A 3.55 keV hint for decaying axion-like particledark matter, Phys.Rev. D89 (2014) 103511, [arXiv:1402.7335].
[7] H. M. Lee, S. C. Park, and W.-I. Park, Cluster X-ray line at 3.5 keV from axion-like darkmatter, arXiv:1403.0865.
[8] M. Cicoli, J. P. Conlon, M. C. D. Marsh, and M. Rummel, A 3.55 keV Photon Line andits Morphology from a 3.55 keV ALP Line, arXiv:1403.2370.
[9] A. Ringwald, Axions and Axion-Like Particles, arXiv:1407.0546.
[10] S. Riemer-Sorensen, Questioning a 3.5 keV dark matter emission line, arXiv:1405.7943.
[11] T. Jeltema and S. Profumo, Reply to Two Comments on ”Dark matter searches goingbananas the contribution of Potassium (and Chlorine) to the 3.5 keV line”,arXiv:1411.1759.
[12] D. Malyshev, A. Neronov, and D. Eckert, Constraints on 3.55 keV line emission fromstacked observations of dwarf spheroidal galaxies, arXiv:1408.3531.
[13] M. E. Anderson, E. Churazov, and J. N. Bregman, Non-Detection of X-Ray EmissionFrom Sterile Neutrinos in Stacked Galaxy Spectra, arXiv:1408.4115.
[14] O. Urban, N. Werner, S. Allen, A. Simionescu, J. Kaastra, et al., A Suzaku Search forDark Matter Emission Lines in the X-ray Brightest Galaxy Clusters, arXiv:1411.0050.
[15] A. Boyarsky, J. Franse, D. Iakubovskyi, and O. Ruchayskiy, Comment on the paper ”Darkmatter searches going bananas: the contribution of Potassium (and Chlorine) to the 3.5keV line” by T. Jeltema and S. Profumo, arXiv:1408.4388.
[16] E. Bulbul, M. Markevitch, A. R. Foster, R. K. Smith, M. Loewenstein, et al., Comment on”Dark matter searches going bananas: the contribution of Potassium (and Chlorine) to the3.5 keV line”, arXiv:1409.4143.
[17] A. Boyarsky, J. Franse, D. Iakubovskyi, and O. Ruchayskiy, Checking the dark matterorigin of 3.53˜keV line with the Milky Way center, ArXiv e-prints (Aug., 2014)[arXiv:1408.2503].
– 24 –

[18] F. Yusef-Zadeh, M. Wardle, C. Heinke, C. D. Dowell, D. Roberts, F. K. Baganoff, andW. Cotton, Simultaneous chandra, cso, and vla observations of sgr a*: The nature offlaring activity, The Astrophysical Journal 682 (2008), no. 1 361.
[19] M. P. Muno, F. K. Baganoff, M. W. Bautz, W. N. Brandt, P. S. Broos, E. D. Feigelson,G. P. Garmire, M. R. Morris, G. R. Ricker, and L. K. Townsley, A deep chandra catalog ofx-ray point sources toward the galactic center, The Astrophysical Journal 589 (2003),no. 1 225.
[20] M. P. Muno, F. K. Baganoff, M. W. Bautz, E. D. Feigelson, G. P. Garmire, M. R. Morris,S. Park, G. R. Ricker, and L. K. Townsley, Diffuse x-ray emission in a deep chandraimage of the galactic center, The Astrophysical Journal 613 (2004), no. 1 326.
[21] A. C. Fabian, J. S. Sanders, S. W. Allen, C. S. Crawford, K. Iwasawa, R. M. Johnstone,R. W. Schmidt, and G. B. Taylor, A deep Chandra observation of the Perseus cluster:shocks and ripples, MNRAS 344 (Sept., 2003) L43–L47, [astro-ph/0306036].
[22] A. C. Fabian, J. S. Sanders, S. Ettori, G. B. Taylor, S. W. Allen, C. S. Crawford,K. Iwasawa, R. M. Johnstone, and P. M. Ogle, Chandra imaging of the complex x-ray coreof the perseus cluster, Monthly Notices of the Royal Astronomical Society 318 (2000), no. 4L65–L68, [http://mnras.oxfordjournals.org/content/318/4/L65.full.pdf+html].
[23] R. W. Schmidt, A. C. Fabian, and J. S. Sanders, Chandra temperature and metallicitymaps of the Perseus cluster core, MNRAS 337 (Nov., 2002) 71–78, [astro-ph/0207290].
[24] S. L. Snowden, R. F. Mushotzky, K. D. Kuntz, and D. S. Davis, A catalog of galaxyclusters observed by XMM-Newton, Astronomy & Astrophysics 478 (Feb., 2008) 615–658,[arXiv:0710.2241].
[25] K. D. Kuntz and S. L. Snowden, The EPIC-MOS particle-induced background spectra,Astronomy & Astrophysics 478 (Feb., 2008) 575–596.
[26] Y. Maeda, F. K. Baganoff, E. D. Feigelson, M. Morris, M. W. Bautz, W. N. Brandt, D. N.Burrows, J. P. Doty, G. P. Garmire, S. H. Pravdo, G. R. Ricker, and L. K. Townsley, AChandra Study of Sagittarius A East: A Supernova Remnant Regulating the Activity ofOur Galactic Center?, ApJ 570 (May, 2002) 671–687, [astro-ph/0102183].
[27] P. B. Pal and L. Wolfenstein, Radiative Decays of Massive Neutrinos, Phys.Rev. D25(1982) 766.
[28] J. F. Navarro, C. S. Frenk, and S. D. M. White, The Structure of Cold Dark Matter Halos,ApJ 462 (May, 1996) 563, [astro-ph/9508025].
[29] J. F. Navarro, E. Hayashi, C. Power, A. R. Jenkins, C. S. Frenk, S. D. M. White,V. Springel, J. Stadel, and T. R. Quinn, The inner structure of ΛCDM haloes - III.Universality and asymptotic slopes, MNRAS 349 (Apr., 2004) 1039–1051,[astro-ph/0311231].
[30] A. Burkert, The Structure of Dark Matter Halos in Dwarf Galaxies, ApJ 447 (July, 1995)L25, [astro-ph/9504041].
[31] D. A. Buote, F. Gastaldello, P. J. Humphrey, L. Zappacosta, J. S. Bullock, F. Brighenti,and W. G. Mathews, The X-Ray Concentration-Virial Mass Relation, ApJ 664 (July,2007) 123–134, [astro-ph/0610135].
[32] T. H. Reiprich and H. Bohringer, The Mass Function of an X-Ray Flux-limited Sample ofGalaxy Clusters, ApJ 567 (Mar., 2002) 716–740, [astro-ph/0111285].
– 25 –
[33] R. K. Smith, N. S. Brickhouse, D. A. Liedahl, and J. C. Raymond, Collisional PlasmaModels with APEC/APED: Emission-Line Diagnostics of Hydrogen-like and Helium-likeIons, ApJ Letters 556 (Aug., 2001) L91–L95, [astro-ph/0106478].
[34] J. P. Conlon and A. J. Powell, A 3.55 keV line from DM→ a→ γ: predictions forcool-core and non-cool-core clusters, arXiv:1406.5518.
[35] E. Churazov, W. Forman, C. Jones, and H. Bohringer, XMM-Newton Observations of thePerseus Cluster. I. The Temperature and Surface Brightness Structure, ApJ 590 (June,2003) 225–237, [astro-ph/0301482].
[36] P. D. Alvarez, J. P. Conlon, F. V. Day, M. C. D. Marsh, and M. Rummel, Observationalconsistency and future predictions for a 3.5 keV ALP to photon line, ArXiv e-prints (Oct.,2014) [arXiv:1410.1867].
[37] J. P. Conlon and F. V. Day, 3.55 keV photon lines from axion to photon conversion in theMilky Way and M31, arXiv:1404.7741.
[38] J. M. Cordes and T. J. W. Lazio, NE2001.I. A New Model for the Galactic Distribution ofFree Electrons and its Fluctuations, ArXiv Astrophysics e-prints (July, 2002)[astro-ph/0207156].
[39] J. M. Cordes and T. J. W. Lazio, NE2001. II. Using Radio Propagation Data to Constructa Model for the Galactic Distribution of Free Electrons, ArXiv Astrophysics e-prints (Jan.,2003) [astro-ph/0301598].
[40] D. P. Finkbeiner and N. Weiner, An X-Ray Line from eXciting Dark Matter,arXiv:1402.6671.
[41] E. Dudas, L. Heurtier, and Y. Mambrini, Generating X-ray lines from annihilating darkmatter, arXiv:1404.1927.
[42] A. Wongwathanarat, H.-T. Janka, and E. Muller, Three-dimensional neutrino-drivensupernovae: Neutron star kicks, spins, and asymmetric ejection of nucleosynthesisproducts, A&A 552 (Apr., 2013) A126, [arXiv:1210.8148].
– 26 –


![Botswana_(Karasch_Nass).ppt [Read-Only] - Uni-Due](https://static.fdokumen.com/doc/165x107/631a6bef1a1adcf65a0f10c6/botswanakaraschnassppt-read-only-uni-due.jpg)