Damage of ears due to noise pollution
20
What is my Research Question? What are the features of a Sound Level Meter? A basic SLM consists of a Power Switch button, an Electric Condenser Microphone, which is protected by a Sponge Ball, a LED Display that demonstrates the Sound Pressure readings, and a bar that allows the setting of a suitable range for the readings. How does a Sound Level Meter Work? The Decibel Meters use Microphones for measuring Sound Intensities, just like Sound Recorders. The Microphones consist of a grill that protects the membrane within. When the pressure waves of sound from the external environment collide with the membrane, they promote a vigorous back and forth movement. This movement creates an Electric Current in the membrane, which helps to measure the intensity of Sound Pressure. The more the membrane moves, the stronger will the
-
Upload
independent -
Category
Documents
-
view
5 -
download
0
Transcript of Damage of ears due to noise pollution

What is my Research Question?
What are the features of a Sound Level Meter?
A basic SLM consists of a Power Switch button, an ElectricCondenser Microphone, which is protected by a Sponge Ball,a LED Display that demonstrates the Sound Pressurereadings, and a bar that allows the setting of a suitablerange for the readings.
How does a Sound Level Meter Work?
The Decibel Meters use Microphones for measuring SoundIntensities, just like Sound Recorders. The Microphonesconsist of a grill that protects the membrane within. Whenthe pressure waves of sound from the external environmentcollide with the membrane, they promote a vigorous backand forth movement. This movement creates an ElectricCurrent in the membrane, which helps to measure theintensity of Sound Pressure.
The more the membrane moves, the stronger will the

Electric Current be. Sound Level Meters hence, in simplelanguage, measure the strength of the Electric Current andconvert it into numerical values in the form of SoundPressure Levels.
The following picture is a Circuit Diagram of a TypicalDigital Sound Level Pressure Meter:
What is my Action Plan?
With the aim of monitoring the Sound Level in GandhiMemorial International School, I will use a Sound LevelMeter from the Vernier Company, provided to me by theSchool Faculty.
To provide an Average Level of Sound Pressure and avoidbiased results for my Research Question, I will categorize4 Venues, namely- the Assembly Area, Canteen, Wing C, andGym, and 4 Time Frames, 7:10, 10:15, 12:15, and 2:10.
The results collected by the collation of this RawData/Material will then be analyzed through Graphs andCharts, hence arriving to Averages and Means that willhelp me produce a better conclusion per Time Frame, perVenue.
What are my Aims and Objectives?

The basic Aim of my Research is to produce a Hypothesisthrough my Practical and Analytical Skills, collect theRaw Data by measuring the varying Sound Pressure Levels atthe different prescribed Venues, produce calculations ofAverages and Means, demonstrate the Processed Data via themeans of Diagrams, and finally arrive at a suitableconclusion.
In this way, the combination of Area and Time leading tothe highest Sound Level can be calculated to evaluate it'sintensity of Noise Pollution and the resultant effects onhuman ears.
On the basis of a Research, it has been stated that‘Sounds louder than 85 dB can cause permanent HearingDamages’. Hence, this range can be used to evaluatewhether or not Gandhi Memorial International School shouldtake measures to control the explosive Sound PressureLevels, or not.
What is my Hypothesis?
A Hypothesis is an interpretation or assumption of theresult to be obtained from a Practical Activity orPhenomenon.
On the basis of my Personal Analysis, I predict that thehighest Noise Pollutant Area will be the Assembly Area atthe time frame of 7:10 a.m. This assumption is based onthe fact that at the time of 7:10, i.e. during the MorningAssembly, the Sound Pressure Levels are at their peak dueto the use of Speakers, Microphones, Generators, etc.
According to my experience and knowledge, at 7:10, thecurrent produced by Sound during itsoscillation is so intense that itreaches the highest horizontal andvertical distances from the centerpoint, i.e. the Assembly Stage.
Also, during this time frame, themaximum level of students arrive atschool with their drivers, parents and
friends, all students are left unattended in theirrespected classes which promotes discussions, friends,classmates and teachers communicate with each other, lifts

and stairways are continuously being used, and last-minuteassembly practices are being conducted.
Hence, at the precise time and venue, the Sound PressureLevel will exceed the barriers to reach a Level higherthan 85 dB, therefore promoting damage.
What are my Variables?
Any condition, factor or trait in an experiment that canvary in value is known as a Variable. An experimentusually has 3 types of Variables:
Independent Variables (IV):IVs are Variables manipulated by the Researcher sothat the change promoted to the other Variables can becalculated or evaluated.
Dependent Variables (DV):DVs are the Variables that change or incur an effectdue to manipulations in the IVs.
Constant/Controlled Variables (CV):CVs are the Variables that the Researcher aims to keepconstant so that the results of observations from DVscan be calculated without errors or bias.

What is my Methodology and Procedure?
Materials Used:1. Sound Level Meter (Vernier Company).
2. Pen and Paper (for noting down the results of
Trails).
In my experiment, the IVs are- Location and Time Frames-
which had been prescribed for the investigation prior to the execution. These Locations and Time Frames change accordingly
to allow a better range of DVs.
In my experiment, the DV is the range of Sound Pressure
Level achieved as a result of the trials.
In my experiment, the CVs are

Procedure:1. Collect the Sound Level Meter from School Faculty
(Sir Manish).2. Clean until spotless.3. Check the 4 AAA Batteries installed in the device.4. Set:
‘Maximum Hold Level’ on ‘Reset’. ‘Frequency-Weighting’ according to your need, on
either ‘A’ or ‘C’. ‘A’ is used when monitoringthe Sound Level of an Area, and ‘C’ is used whenmonitoring the Sound Level of Engines andMachines.
‘Time Weighting’ according to you need, oneither ‘S’ (Slow) or ‘F’ (Fast). ‘S’ is used toproject less readings per second, whereas ‘F’increases the frequency of readings.
‘Power Measurement/Range Switch’ to either ofthe ranges – 35dB to 90dB (Lo), or 75dB to 130dB (Hi).
5. Ensure that the device is working satisfactorily,i.e. verify the readings displayed by the device bytallying the readings with another set of SLM (atthe SAME time and place), so that accuracy can beverified.
6. Point the Sound Pressure Sensor to the source ofNoise, and record the readings displayed on the LCDPanel. Since the readings fluctuate continuously,limit your results by accounting the Range, i.e.Maximum and Minimum Levels.
7. To obtain accurate and reliable results, record thereadings thrice in the form of Trial 1, Trial 2 andTrial 3. In this way, the result will be moregenuine and authentic.

8. Tabulate these results, i.e. arrange them in aTable or various Tables, and label it as Raw Data.Use this data for the formulation of Averages,Means, Graphs, Charts and Diagrams, so that thenumerical information can be visually andgraphically displayed and interpreted.
Treatments
The Raw Data that is collected will be treated and modifiedto produce a Processed version from the Crude recordings.
Via the following Methods and Formulae, the variouseditions of Processed Data will be assembled and composed:
Raw Data
Assembly:
Average Maximum
Average Maximum Sound Pressure Level can be computed by:(MaximumTrial 1 + MaximumTrial 2 + MaximumTrial
3)/3
Average Minimum
AverageMinimum Sound Pressure Level can be computed by:(MiniimumTrial 1 + MinimumTrial 2 + MinimumTrial 3)/3
Average Range
Average Range of each Trial can be computed by finding Range (per Time), i.e. (Highest - Lowest), and then adding Ranges (per Trial)/4.
Average Sound Level
To compute the Average Sound Level per Venue, add Average Maximums and Average Minimums (per Time)/4.

Time Trail 1 Trail 2 Trail 3Highest Lowest Highest Lowest Highest Lowest
7:10 90.0 63.2 89.4 56.9 85.6 65.110:15 55.6 42.7 59.3 44.2 60.8 48.212:15 62.4 44.6 64.9 46.2 63.1 48.52:10 84.6 42.4 87.5 51.2 79.6 43.9
7:10 a.m. 10:15 a.m. 12:15 p.m. 2:10 p.m.0
10
20
30
40
50
60
70
80
90
Trial 1Trial 2Trial 3
According to the Bar Chart, we can analyze that in theAssembly Area, the highest Sound Pressure Level occurs at7:10 a.m. in Trial 1, and the lowest Sound Pressure Leveloccurs at 10:15 a.m. in Trial 1.
The highest SPL in the Assembly Area occurs at 7:10 a.m.as the entire School Population, including both Teachersand Students, gathers during this Time Frame forattending the Morning Assembly. The developingCommunication and Assembly Presentation are the maincontributors to this increased Sound Level.
The lowest SPL in the Assembly Area occurs at 10:15 a.m.as the least amount of School Population gathers at thisTime Frame due to the limited time available in thisShort Break.
Wing C:

Time Trail 1 Trail 2 Trail 3Highest Lowest Highest Lowest Highest Lowest
7:10 89.3 76.5 90.0 72.1 84.9 68.710:15 73.4 40.6 79.6 36.2 80.3 40.212:15 59.8 52.2 74.4 43.2 69.5 58.82:10 89.3 43.2 72.2 35.7 74.3 36.0
7:10 a.m. 10:15 a.m. 12:15 p.m. 2:10 p.m.0
10
20
30
40
50
60
70
80
90
Trial 1Trial 2Trial 3
According to the Bar Chart, we can analyze that in WingC, the highest Sound Pressure Level occurs at 7:10 a.m.in Trial 1, and the lowest Sound Pressure Level occurs at2:10 p.m. in Trial 2.
The highest SPL in Wing C occurs at 7:10 a.m. just as theAssembly Area, due to the short distance between them.The continuous arrival of Students, Teachers, Parents,Staff, etc. proves to be the contributor to this highSPL. The lowest SPL in Wing C occurs at 2:10 p.m., aseverybody is about to leave at this Time Frame.
Canteen:

Time Trail 1 Trail 2 Trail 3Highest Lowest Highest Lowest Highest Lowest
7:10 75.6 73.5 78.1 70.9 80.2 69.110:15 80.4 66.3 75.6 52.8 77.7 52.512:15 80.6 72.9 82.8 72.0 84.6 70.92:10 84.5 74.8 89.4 67.2 82.7 69.3
7:10 a.m. 10:15 a.m. 12:15 p.m. 2:10 p.m.0
10
20
30
40
50
60
70
80
90
Trial 1Trial 2Trial 3
According to the Bar Chart, we can analyze that in theCanteen Area, the highest Sound Pressure Level occurs at2:10 p.m. in Trial 1, and the lowest Sound Pressure Leveloccurs at 10:15 a.m. in Trial 2.
The highest SPL in the Canteen Area occurs at 2:10 p.m.as at this time, the entire School Population gathers forFood/Drinks and to return home. The external NoisePollution (Cars, Buses, Bikes, etc.) from the outerprovince, also adds up to the Sound Pollution of theCanteen Area.
The lowest SPL in the Canteen Area occurs at 10:15 a.m.as at this time students have very less time forgathering into the Canteen, and hence this limits them inthe boundaries of their respected Classes.

Gym:
Time Trail 1 Trail 2 Trail 3Highest Lowest Highest Lowest Highest Lowest
7:10 81.2 65.4 86.9 70.0 90.0 76.510:15 59.2 42.6 57.3 42.2 76.4 41.312:15 68.4 40.4 72.2 42.7 74.3 45.62:10 78.1 39.8 81.7 44.6 82.3 42.5
7:10 a.m. 10:15 a.m. 12:15 p.m. 2:10 p.m.0
10
20
30
40
50
60
70
80
90
Trial 1Trial 2Trial 3
According to the Bar Chart, we can analyze that in theGym, the highest Sound Pressure Level occurs at 7:10 a.m.in Trial 2, and the lowest Sound Pressure Level occurs at10:15 a.m. in Trial 2.
The highest SPL in the Gym occurs at 7:10 a.m., as this is one of the Time Periods where students have no Studying-Pressures and can practice for upcoming Matches and Competitions without hesitation.
The lowest SPL in the Gym occurs at 10:15 a.m., as this is the Time Frame between the Short Break, which, due to it’s short span, does not allow students to gather at this Venue.
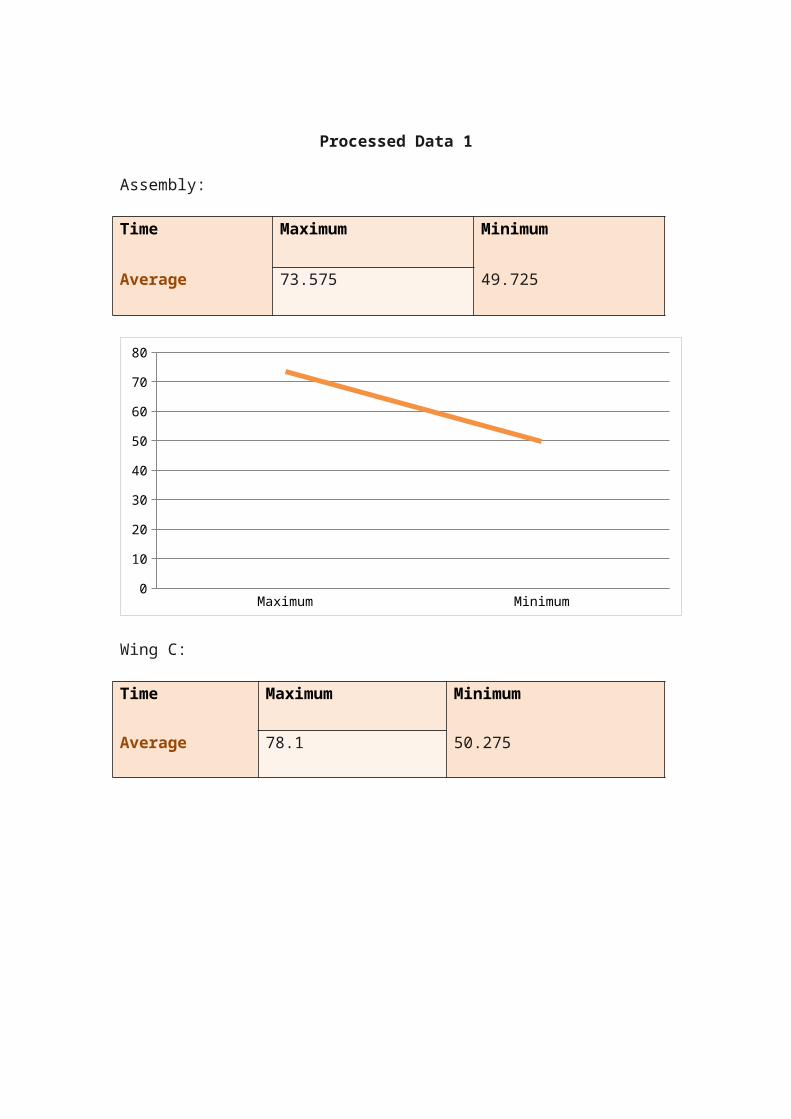
Processed Data 1
Assembly:
Time Maximum Minimum
Average 73.575 49.725
Maximum Minimum0
10
20
30
40
50
60
70
80
Wing C:
Time Maximum Minimum
Average 78.1 50.275

Maximum Minimum0102030405060708090
Canteen:
Time Maximum Minimum
Average 81.025 67.675
Maximum Minimum60
65
70
75
80
85
Gym:
Time Maximum Minimum
Average 75.65 49.45

Maximum Minimum0
10
20
30
40
50
60
70
80
Processed Data 2
Assembly:
Time RangeT1 RangeT2 RangeT3
Average 24.925 25.65 20.85
Range T1 Range T2 Range T30
5
10
15
20
25
30
Wing C:
Time RangeT1 RangeT2 RangeT3
Average 24.825 32.375 26.325

Range T1 Range T2 Range T30
5
10
15
20
25
30
35
Canteen:
Time RangeT1 RangeT2 RangeT3
Average 8.4 15.75 15.85
Range T1 Range T2 Range T30
2
46
8
10
12
1416
18
Gym:
Time RangeT1 RangeT2 RangeT3
Average 24.675 24.65 29.275

Range T1 Range T2 Range T322
23
24
25
26
27
28
29
30
Processed Data 3
Assembly:
Time Sound Level
Average 61.65
Wing C:
Time Sound Level
Average 64.1875
Canteen:
Time Sound Level
Average 74.35
Gym:
Time Sound Level
Average 62.55
Average Sound Level per Location

Assembly
Wing C
Average Sound Level
Canteen
Gym
0 10 20 30 40 50 60 70 80
Processed Data 4
GMIS Sound Level
Average 65.684375
Based on the computing of the Raw Data, the final AverageSound Level of GMIS is supposedly assumed to be around65.7 dB. Although the overall level does not indicate anyDanger or Alarming Rates, through the Raw Data it can beanalysed that certain areas of the School, at certainTime Frames incur excessive Sound Pressure Levels whichmay harm the Hearing of the Population.
For example, in the Assembly Area, the Maximum SPL at7:10 a.m. (Trial 1) and 2:10 p.m. (Trial 2) can becategorized under harmful as their Pressures exceed 85dB, hence can impair Hearing. Other examples include-Wing C at 7:10 a.m. (Trial 1 and Trial 2) and 2:10 p.m.(Trial 1), Canteen at 2:10 p.m. (Trial 2), and finallyGym at 7:10 a.m. (Trial 2 and Trial 3).
Also, the Average Maximum Sound Pressure Level of theCanteen Expanse ranges up to 81.025 dB. This rate is onthe verge of an Alarming Level, and therefore, needs tobe controlled before severe consequences are diagnosed.

Processed Data 5
Time AverageMaximum Minimum
7:10 85.1 68.97510:15 69.65 45.812:15 71.425 53.8252:10 82.175 49.2
7:10 a.m. 10:15 a.m. 12:15 p.m. 2:10 p.m.0
10
20
30
40
50
60
70
80
90
MaximumMinimum

Processed Data 6
Time Average7:10 77.037510:15 57.72512:15 62.6252:10 65.6875
Parameters that (might have) affected the Result
There exist various aspects and factors that may or may not haveaffected the Final Results. According to my perception, these

factors could have been the following:
Quality of Roof’s ‘Sound Absorption’, i.e. Concrete or Absorbing.
Source of Noise. Remoteness and Closeness to the Source of Noise. Duration of exposure to Students. Clarity of Sound. Capability of Walls to ‘Echo’ and ‘Rebound Sound’. Population of Students.
Limitations or Limiting Factors
These are the factors that affect the Outcome adversely, i.e. the aspects that limit the Result from being accurate and crude.
According to my perception, these factors may, or may not include the following:
Ability of Walls to absorb Sound. Ability of Walls to produce Echo. Ignorance of all possible School Provinces, i.e. short-
listing of only important and socially active Areas. Ignorance of all possible Time Frames, i.e. short-
listing of specified Timings only. Lack of knowledge of the Instrument (SLM).
Bibliography
The following sites have been made use of for Reference and Help:
ehow.com inds.co.uk/education wikipedia.org socialresearchmethods.net soundbuddies.org