EEG reveals the effect of fMRI scanner noise on noise-sensitive subjects
10
EEG reveals the effect of fMRI scanner noise on noise-sensitive subjects Juergen Pripfl, a, * Simon Robinson, b,c Ulrich Leodolter, a Ewald Moser, b,c,d,e and Herbert Bauer a a Brain Research Lab, Department of Psychology, University of Vienna, Liebiggasse 5, A-1010 Vienna, Austria b MR Centre of Excellence, Medical University of Vienna, A-1090 Vienna, Austria c Center of Biomedical Engineering and Physics, Medical University of Vienna, A-1090 Vienna, Austria d Department of Radiology, Medical University of Vienna, A-1090 Vienna, Austria e Department of Psychiatry, University of Pennsylvania Medical Center, Philadelphia, PA 19104, USA Received 5 August 2004; revised 3 November 2005; accepted 17 November 2005 Available online 18 January 2006 One drawback of fMRI is that subjects must endure intense noise during testing. This may be annoying to some people and acceptable to others. The aim of this study was to examine, by means of event-related potentials (ERPs), the possible influence of this noise on brain activity while performing a mental reasoning task. Subjects carrying out tasks in a silent environment were compared with two groups executing the same tasks in an ‘‘fMRI-like’’ noisy environment, one of which consisted of subjects who were annoyed by the noise and the other of subjects who tolerated it easily. Subjects who were annoyed performed less well (i.e., produced more errors compared to the ‘‘no noise’’ group) and ‘‘not annoyed’’subjects showed a speed-accuracy trade-off (i.e., reacted faster but made more errors compared to ‘‘no noise’’subjects). Noise led to more pronounced N1 and P2 peaks but attenuated N2. As early ERP components are influenced by attention, this observation most likely reflects different attentional requirements. The slow cortical negative shift during task processing was significantly attenuated with ‘‘annoyed’’ subjects compared to ‘‘not annoyed’’ subjects. Emotion-related subcortical structures may be responsible for the observed difference. These findings suggest that individual reactions to fMRI scanner noise should be taken into account when designing fMRI studies and interpreting results. D 2005 Elsevier Inc. All rights reserved. Keywords: fMRI acoustic noise; EPI; EEG; Slow cortical potential, SCP; Event-related potential, ERP; Noise annoyance; Cognition; Emotion Introduction Functional imaging using fMRI with EPI-BOLD sequences usually produces very intense acoustic noise. Current flowing in gradient coils causes Lorenz forces to act on them in the presence of the main magnetic field, and the direction of these forces varies with the rapid switching of these currents in EPI, causing them to vibrate noisily. ‘‘Silent’’ MRI sequences have been developed (Hennel et al., 1999) which reduce noise by using sinusoidal gradient slopes, the longest possible slope duration and the minimum number of slopes. These offer significantly lower performance, particularly in a reduction of spatial and temporal resolution, and truly mute sequences are suitable only for noise- intolerant subjects, for instance in some pediatric and psychiatric applications (Marcar et al., 2002). Scanner noise present during the presentation of tasks is one of many unusual environmental variables in fMRI that may affect brain activation. Others are the supine position of subjects, which has been postulated to influence cerebral perfusion, and the psychological effect of the confinement of the MR scanner bore. Subject discomfort and the unusual environment of the horizontal MR scanner were at least partial motivations behind the development of a 7 T vertical primate scanner (Pfeuffer et al., 2004), and interest in the difference in activation between supine and upright fMRI, the specific reason for the construction of a 3 T vertical human scanner (Nakada and Tasaka, 2001). Nakada and Tasaka find no significant differences between the shape of brain structures between upright and supine MR and have yet to report results regarding perfusion or activation. It seems likely that scanner noise is the most important environmental disparity between everyday environments in which cognitive tasks are solved and the fMRI setting. Several studies have been performed to assess the influence of fMRI noise on brain activity through direct and cognition-related indirect pathways (for an overview see Moelker and Pattynama, 2003). The direct adverse effects are most apparent in auditory tasks, as MR-related acoustic noise induces a BOLD response in the auditory cortex (Hall et al., 1999; Talavage et al., 1999; Bandettini and Cox, 2000). Further evidence for altered brain activity during auditory tasks comes from EEG research: Novitski et al. (2001), 1053-8119/$ - see front matter D 2005 Elsevier Inc. All rights reserved. doi:10.1016/j.neuroimage.2005.11.031 * Corresponding author. Fax: +43 1 4277 47939. E-mail address: [email protected] (J. Pripfl). Available online on ScienceDirect (www.sciencedirect.com). www.elsevier.com/locate/ynimg NeuroImage 31 (2006) 332 – 341
-
Upload
independent -
Category
Documents
-
view
0 -
download
0
Transcript of EEG reveals the effect of fMRI scanner noise on noise-sensitive subjects

www.elsevier.com/locate/ynimg
NeuroImage 31 (2006) 332 – 341
EEG reveals the effect of fMRI scanner noise on
noise-sensitive subjects
Juergen Pripfl,a,* Simon Robinson,b,c Ulrich Leodolter,a
Ewald Moser,b,c,d,e and Herbert Bauera
aBrain Research Lab, Department of Psychology, University of Vienna, Liebiggasse 5, A-1010 Vienna, AustriabMR Centre of Excellence, Medical University of Vienna, A-1090 Vienna, AustriacCenter of Biomedical Engineering and Physics, Medical University of Vienna, A-1090 Vienna, AustriadDepartment of Radiology, Medical University of Vienna, A-1090 Vienna, AustriaeDepartment of Psychiatry, University of Pennsylvania Medical Center, Philadelphia, PA 19104, USA
Received 5 August 2004; revised 3 November 2005; accepted 17 November 2005
Available online 18 January 2006
One drawback of fMRI is that subjects must endure intense noise during
testing. This may be annoying to some people and acceptable to others.
The aim of this study was to examine, by means of event-related
potentials (ERPs), the possible influence of this noise on brain activity
while performing amental reasoning task. Subjects carrying out tasks in
a silent environment were compared with two groups executing the same
tasks in an ‘‘fMRI-like’’ noisy environment, one of which consisted of
subjects who were annoyed by the noise and the other of subjects who
tolerated it easily. Subjects who were annoyed performed less well (i.e.,
produced more errors compared to the ‘‘no noise’’ group) and ‘‘not
annoyed’’ subjects showed a speed-accuracy trade-off (i.e., reacted faster
but made more errors compared to ‘‘no noise’’ subjects).
Noise led to more pronounced N1 and P2 peaks but attenuated N2. As
early ERP components are influenced by attention, this observation most
likely reflects different attentional requirements. The slow cortical
negative shift during task processing was significantly attenuated with
‘‘annoyed’’ subjects compared to ‘‘not annoyed’’ subjects. Emotion-related
subcortical structures may be responsible for the observed difference.
These findings suggest that individual reactions to fMRI scanner
noise should be taken into account when designing fMRI studies and
interpreting results.
D 2005 Elsevier Inc. All rights reserved.
Keywords: fMRI acoustic noise; EPI; EEG; Slow cortical potential, SCP;
Event-related potential, ERP; Noise annoyance; Cognition; Emotion
Introduction
Functional imaging using fMRI with EPI-BOLD sequences
usually produces very intense acoustic noise. Current flowing in
1053-8119/$ - see front matter D 2005 Elsevier Inc. All rights reserved.
doi:10.1016/j.neuroimage.2005.11.031
* Corresponding author. Fax: +43 1 4277 47939.
E-mail address: [email protected] (J. Pripfl).
Available online on ScienceDirect (www.sciencedirect.com).
gradient coils causes Lorenz forces to act on them in the presence
of the main magnetic field, and the direction of these forces varies
with the rapid switching of these currents in EPI, causing them to
vibrate noisily. ‘‘Silent’’ MRI sequences have been developed
(Hennel et al., 1999) which reduce noise by using sinusoidal
gradient slopes, the longest possible slope duration and the
minimum number of slopes. These offer significantly lower
performance, particularly in a reduction of spatial and temporal
resolution, and truly mute sequences are suitable only for noise-
intolerant subjects, for instance in some pediatric and psychiatric
applications (Marcar et al., 2002).
Scanner noise present during the presentation of tasks is one of
many unusual environmental variables in fMRI that may affect brain
activation. Others are the supine position of subjects, which has been
postulated to influence cerebral perfusion, and the psychological
effect of the confinement of the MR scanner bore. Subject
discomfort and the unusual environment of the horizontal MR
scanner were at least partial motivations behind the development of
a 7 T vertical primate scanner (Pfeuffer et al., 2004), and interest in
the difference in activation between supine and upright fMRI, the
specific reason for the construction of a 3 T vertical human scanner
(Nakada and Tasaka, 2001). Nakada and Tasaka find no significant
differences between the shape of brain structures between upright
and supine MR and have yet to report results regarding perfusion or
activation. It seems likely that scanner noise is the most important
environmental disparity between everyday environments in which
cognitive tasks are solved and the fMRI setting.
Several studies have been performed to assess the influence of
fMRI noise on brain activity through direct and cognition-related
indirect pathways (for an overview see Moelker and Pattynama,
2003). The direct adverse effects are most apparent in auditory
tasks, as MR-related acoustic noise induces a BOLD response in the
auditory cortex (Hall et al., 1999; Talavage et al., 1999; Bandettini
and Cox, 2000). Further evidence for altered brain activity during
auditory tasks comes from EEG research: Novitski et al. (2001),

3 5 9 15 23 33 45
55 57 58 59
J. Pripfl et al. / NeuroImage 31 (2006) 332–341 333
showed that, in event-related potentials (ERPs) evoked by tones and
chords, P1, N1 and P2 peak latencies were prolonged and the
amplitude of N2 was reduced in response to standard sounds by
fMRI background noise compared to no background noise
conditions. Functional MRI noise may influence higher cognitive
processing through indirect effects which are based on altered
attention. Focusing attention on a specific modality implies that the
modality-specific cortical area shows increased activity. Increasing
the attentional load required to process the task in the presence of a
distracting noise may lead to increased activity in attentional
(Mazard et al., 2002) and task-relevant areas (Brechmann et al.,
2002), respectively. On the other hand, it is also possible that fMRI
signal decreases are attributable to exhaustion and loss of attention
in the presence of MR noise (Cho et al., 1998).
From a psychological perspective, an emotion-related indirect
influence on brain activity is also conceivable. It is obvious that
noise can lead to emotional reactions: noise annoyance has been
linked to a variety of emotions including anger, aggression, rage,
displeasure, exasperation, fear, disquiet, helplessness, resignation,
depression, etc. (Breier et al., 1987; Guski et al., 1999). Each of
these may be caused by separate, although perhaps partly
overlapping brain networks (for reviews, see e.g., Phan et al.,
2002; Wager et al., 2003). Thus, emotional reactions to fMRI-
scanner noise could also influence brain activity during an fMRI
session. Furthermore, emotions have been shown to interfere with
cognition (e.g., Ellis et al., 1984; Jackson and Smith, 1984;
Conway and Giannopoulos, 1993; Perlstein et al., 2002). Impair-
ments in cognitive task performance when fMRI noise is
presented, as revealed by higher error rates (Mazard et al.,
2002; Lamm et al., 2001) and longer response times (Lamm et al.,
2001), may be linked to both MR noise-related attentional
distraction and emotional reactions. As individual factors influ-
ence noise annoyance (e.g., Fields, 1993; Miedema and Vos,
1999), fMRI noise may be annoying or distracting to some
subjects but acceptable to others. We hypothesized that brain
activity may systematically differ between healthy subjects who
were annoyed and those who were not annoyed by fMRI noise.
The purpose of the current study was to clarify the possible effect
of background fMRI scanner noise on brain activity during higher
cognitive processing and whether there is a difference in brain
activation between subjects who become annoyed by the noise and
those who do not. To explore these effects, the impact on cognitive
processing of playing recorded fMRI noise to subjects was
investigated using slow cortical potential (SCP; Bauer, 1998)
recording.
Methods
Subjects
Forty right-handed healthy female subjects, aged between 18
and 29 years (mean 23 years), volunteered for this study. Written
informed consent was obtained from all subjects prior to their
participation. The experiment was approved by the Ethics
Committee of the Medical Faculty of the University of Vienna.
Since brain activity may differ with gender in respect of emotions
(e.g., Oliver-Rodriguez et al., 1999; Klein et al., 2003; Royet et
al., 2003), only female participants were investigated. Of the 40
subjects, 15 were chosen at random for the ‘‘no noise’’ group. The
remaining 25 subjects were assigned to the ‘‘noise’’ group.
According to a post-experimental questionnaire, subjects from
the ‘‘noise’’ group were categorized into those who were
‘‘annoyed’’ and ‘‘not annoyed’’. In total, 13 subjects had to be
excluded from the analyses, 10 on the basis of excessive EEG
artifacts and 3 due to incomplete post-experimental question-
naires. In total, 9 subjects remained in the ‘‘no noise’’ group, 9 in
the ‘‘annoyed’’ and 9 in the ‘‘not annoyed’’ group.
Stimuli
The stimuli were 50 number completion items which were
presented in a random order for each subject. With each task item,
subjects were presented with a series of numbers arranged according
to some mathematical rule and asked to choose the number which
continued the sequence correctly from 4 alternatives (see the
example below) by pushing the corresponding button of a 4-button
response box. The multiple choice format (one correct and 3
plausible looking numbers) was chosen to minimize the number of
correct answers arrived at by chance.
The sample below is given in the presentation format used (the
correct choice is underlined here):
All of the task items used in the experiment had been pre-tested
extensively and were solvable in a median time of 18 s.
In order to familiarize subjects with the task, they had
extensive training approximately 1 week before EEG record-
ing. Immediately prior to the data acquisition, subjects were
also given 20 items to ensure familiarity with the tasks and
confidence in their ability to answer them correctly.
Item presentation was for a maximum of 43 s but was
terminated by subjects’ answers. Immediately after each response
subjects were shown the message ‘‘correct’’ or ‘‘incorrect’’ for 2
s. Subjects were then asked to estimate the likelihood that they
would solve the next item correctly on a 4 point scale (Fveryhigh_, Fhigh_, Flow_ and Fvery low_). This question was presented
for a maximum of 5 s. Crosshairs were presented between tasks
for a random period of 6 to 10 s to allow the electrophysiological
signal to return to baseline.
EEG recordings
The EEG data set used in the analysis was collected via 20
electrodes attached to the scalp according to the International 10–
20 System at Fp1, Fp2/F7, F3, Fz, F4, F8/T3, C3, Cz, C4, T4/T5,
P3, Pz, P4, T6/O1, Oz, O2. All channels were referenced to the
noncephalic Fsterno-vertebral_ site, i.e., to the common end of an
adjustable voltage divider that connected skin locations above the
7th vertebra and the right manilum sternum (Stephenson and
Gibbs, 1951). In order to control for eye movements, the vertical
and horizontal electrooculogramm (EOG) was recorded bipolarly.
Calibration trials in which subjects performed voluntary vertical
and then horizontal eye movements were stored for regression-
based EOG correction (Bauer and Lauber, 1979). 3D coordinates
of all scalp-electrode locations were measured by means of a
photogrammeric 3D scanner (Bauer et al., 2000).
All signals were recorded within a frequency range of DC to 30
Hz and sampled at 125 Hz for digital storage. The recording

J. Pripfl et al. / NeuroImage 31 (2006) 332–341334
system was a DC-amplifier BDS 3064 (Ing. Zickler Ges.m.b.H,
2511 Pfaffstatten, Austria).
Experimental setting and procedures
Subjects were seated in front of an 18� TFT-monitor in a
comfortable chair in a sound-attenuated, dimly lit room equipped
with an intercom, enabling communication with the experimenter.
The ‘‘noise’’ group was presented with digitally recorded
fMRI scanner noise via a surround sound system during EEG
recording. Scanner noise was switched on before the first task
was presented and switched off after the last task was solved,
i.e., in a similar manner to an fMRI experiment. Noise was
also present during the interstimulus interval.
The sound used in EEG was that produced by a Bruker 3 T
Medspec S300 MR scanner with whole-body gradients (BGA-55)
providing a maximum of 45 mT/M in <300 As, executing a single-
shot blipped gradient-recalled echo-planar sequence with a 128 �128 matrix and receiver bandwidth of 200 kHz, running continu-
ously with a slice acquisition time of 167ms (i.e., a frequency of EPI
‘‘beeps’’ of 6 Hz) (Robinson et al., 2004). This was recorded with a
digital audiotape (DAT) using two nonmagnetic microphones
separated by 25 cm sited inside the scanner bore.
The scanner noise was played back during EEG experiments
via a PC over a Dolby 5.1 surround sound system. Subjects
generally wear ear protection in fMRI (in the case of our
laboratory, earplugs) but not in EEG. As a consequence, the same
noise level in the two environments could not be achieved under
these two conditions via sound levels measured with a calibrated
microphone or a noise level meter. The noise level in EEG without
earplugs was instead matched to that experienced in fMRI with
earplugs via a two-stage subjective comparison. In the first stage, a
single test person wearing earplugs was placed in the MR scanner
and subjected to the EPI sequence described for 3 min. This
person, still wearing earplugs, listened to the DAT recording of the
sequence over headphones immediately after coming out of the
scanner, and adjusted the playback volume to that which they
judged to give the same sound level. This process was repeated
until the person was satisfied that the volume levels were the
same. In the second comparison, the sequence was again played
over headphones at this volume to the test person, still wearing
Table 1
Latencies of the selected ERP components
‘‘no noise’’ group
N1 Not observed
P2 Not observed
N2 Average over 16 ms centered at the minimum
value between 170 and 270 ms p.s. at Oz
P3a Average over 16 ms centered at the maximum
value between 280 and 380 ms p.s. at Cz
P3b Average over 16 ms centered at the maximum
value between 380 and 530 ms p.s. at Pz
SCP1 Average over 50 ms centered at 1000 ms p.s.
SCP2 Average over 200 ms centered at 1900 ms p.s.
SCP3 Average over 200 ms centered at 2900 ms p.s.
SCP4 Average over 200 ms centered at 3900 ms p.s.
SCP5 Average over 200 ms centered at 4900 ms p.s.
earplugs, but this time seated in the EEG laboratory. The sequence
was then played to the test person without earplugs via the
surround system, the volume of which was adjusted to give the
same sound level. This volume was used for playback for all EEG
measurements.
The sound level in the EEG setting was measured with a
single omnidirectional condenser microphone (Behringer 8000,
Behringer International GmbH, Willich, Germany), connected to
the DAT recorder described and calibrated with a 94 dB tone at
1 kHz issued from a Cirrus 511 E calibrator (Cirrus Research
PLC, Hunmanby, UK) before and after recording the scanner
sequence at the playback volume. The microphone was sited in
the transverse plane, with the tip at the usual position of a
subject’s left ear. The DAT recording was transferred to a PC
and analyzed for peak sound pressure level (SPL).
Subjects of the ‘‘noise’’ group were seated in the center of the 5.1
surround sound system without earplugs during EEG recording.
Subjects were informed that – in addition to the EEG experiment –
an fMRI experiment with the same tasks was to be carried out, and
that fMRI scanner noise would be presented during the whole EEG
recording to ensure optimum comparability.
Post-experimental questionnaire
Subjects were asked to complete a questionnaire immediately
after the experiment, covering the subjects’ general motivation and
the perceived difficulty of the tasks. For the ‘‘noise’’ group,
additional questions addressed the emotional impact of the noise
(presence and strength of feelings of anger, aggression, dejection,
demotivation and apathy) and the possible impact of the noise on
concentration and whether the noise was disturbing. All ratings were
given on a 4 point scale (+ +, +, �, � �).
Analyses
EEG data processing and averaging
Prior to any processing of the data, weighted vertical and
horizontal EOG signals were subtracted from each EEG channel,
trial by trial, in order to compensate for eye movement artifacts.
‘‘noise’’ group
Average over 16 ms centered at the minimum
value between 140 and 200 ms post-stimulus
(p.s.) at Oz
Average over 16 ms centered at the maximum
value between 180 and 240 ms p.s. at Oz
Average over 16 ms centered at the minimum
value between 220 and 280 ms p.s. at Oz
Average over 16 ms centered at the maximum
value between 300 and 400 ms p.s. at Cz
Average over 16 ms centered at the maximum
value between 400 and 550 ms p.s. at Pz
Average over 50 ms centered at 1000 ms p.s.
Average over 200 ms centered at 1900 ms p.s
Average over 200 ms centered at 2900 ms p.s
Average over 200 ms centered at 3900 ms p.s
Average over 200 ms centered at 4900 ms p.s
.
.
.
.

J. Pripfl et al. / NeuroImage 31 (2006) 332–341 335
Subject- and channel-specific weights, separated for the vertical and
the horizontal EOG, were calculated as the ratio of the covariance of
the EEGs and EOGs and the variance of the EOGs. Additionally,
trials were skipped if judged by visual inspection to contain artifacts.
Fig. 1. ERP components of the grand means of the groups without noise (red) an
(blue) subjects. The EEG time courses for the first 5 s of task processing at selected
shift can be identified clearly with and without noise. N1 and P2 are only observ
potential shift (SCP1–SCP5).
For each subject, artifact-free single-trial data of items 1–50
were averaged. Five early components (N1, P2, N2, P3a and P3b)
and 5 SCP components (SCP1, SCP2, SCP3, SCP4 and SCP5) were
chosen for further analyses (see Table 1 and Fig. 1). Mean signal
d with noise, the latter divided into ‘‘not annoyed’’ (green) and ‘‘annoyed’’
electrode positions are shown. N2, P3a, P3b and the slow cortical potential
able when noise was presented. 5 time points were chosen within the slow
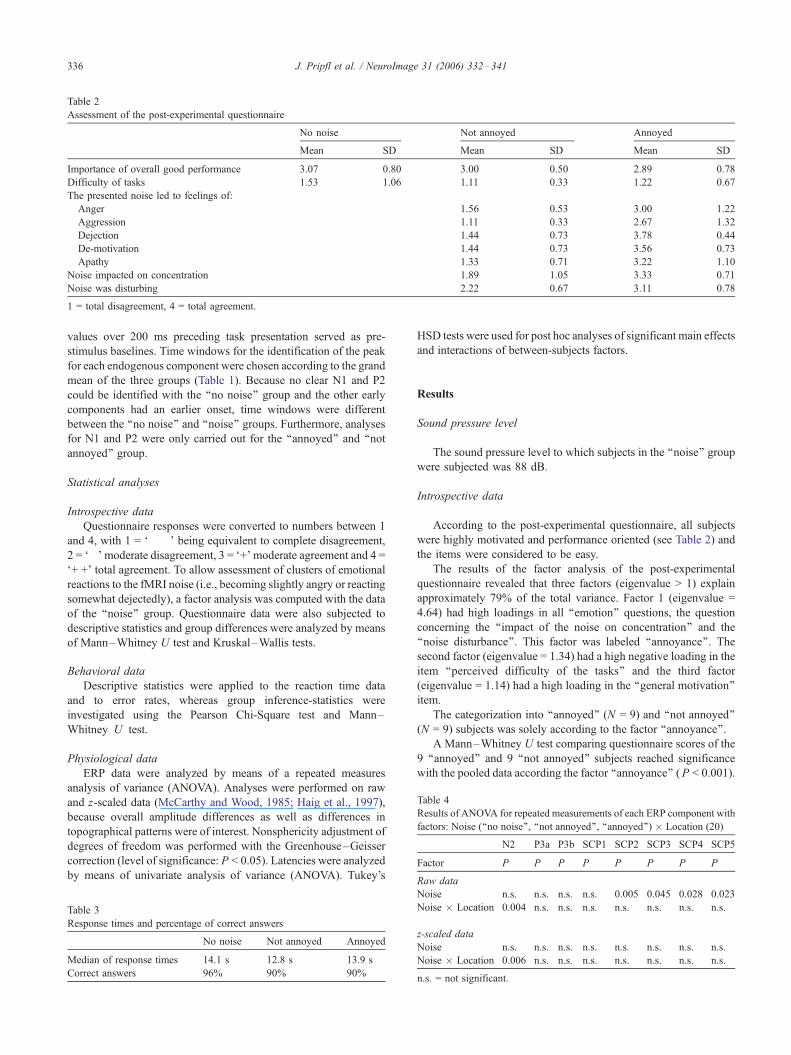
Table 2
Assessment of the post-experimental questionnaire
No noise Not annoyed Annoyed
Mean SD Mean SD Mean SD
Importance of overall good performance 3.07 0.80 3.00 0.50 2.89 0.78
Difficulty of tasks 1.53 1.06 1.11 0.33 1.22 0.67
The presented noise led to feelings of:
Anger 1.56 0.53 3.00 1.22
Aggression 1.11 0.33 2.67 1.32
Dejection 1.44 0.73 3.78 0.44
De-motivation 1.44 0.73 3.56 0.73
Apathy 1.33 0.71 3.22 1.10
Noise impacted on concentration 1.89 1.05 3.33 0.71
Noise was disturbing 2.22 0.67 3.11 0.78
1 = total disagreement, 4 = total agreement.
Table 4
Results of ANOVA for repeated measurements of each ERP component with
factors: Noise (‘‘no noise’’, ‘‘not annoyed’’, ‘‘annoyed’’) � Location (20)
N2 P3a P3b SCP1 SCP2 SCP3 SCP4 SCP5
Factor P P P P P P P P
Raw data
J. Pripfl et al. / NeuroImage 31 (2006) 332–341336
values over 200 ms preceding task presentation served as pre-
stimulus baselines. Time windows for the identification of the peak
for each endogenous component were chosen according to the grand
mean of the three groups (Table 1). Because no clear N1 and P2
could be identified with the ‘‘no noise’’ group and the other early
components had an earlier onset, time windows were different
between the ‘‘no noise’’ and ‘‘noise’’ groups. Furthermore, analyses
for N1 and P2 were only carried out for the ‘‘annoyed’’ and ‘‘not
annoyed’’ group.
Statistical analyses
Introspective data
Questionnaire responses were converted to numbers between 1
and 4, with 1 = F� �_ being equivalent to complete disagreement,
2 = F�_moderate disagreement, 3 = F+_moderate agreement and 4 =
F+ +_ total agreement. To allow assessment of clusters of emotional
reactions to the fMRI noise (i.e., becoming slightly angry or reacting
somewhat dejectedly), a factor analysis was computed with the data
of the ‘‘noise’’ group. Questionnaire data were also subjected to
descriptive statistics and group differences were analyzed by means
of Mann–Whitney U test and Kruskal–Wallis tests.
Behavioral data
Descriptive statistics were applied to the reaction time data
and to error rates, whereas group inference-statistics were
investigated using the Pearson Chi-Square test and Mann–
Whitney U test.
Physiological data
ERP data were analyzed by means of a repeated measures
analysis of variance (ANOVA). Analyses were performed on raw
and z-scaled data (McCarthy and Wood, 1985; Haig et al., 1997),
because overall amplitude differences as well as differences in
topographical patterns were of interest. Nonsphericity adjustment of
degrees of freedom was performed with the Greenhouse–Geisser
correction (level of significance: P < 0.05). Latencies were analyzed
by means of univariate analysis of variance (ANOVA). Tukey’s
Table 3
Response times and percentage of correct answers
No noise Not annoyed Annoyed
Median of response times 14.1 s 12.8 s 13.9 s
Correct answers 96% 90% 90%
Noise n.s. n.s. n.s. n.s. 0.005 0.045 0.028 0.023
Noise � Location 0.004 n.s. n.s. n.s. n.s. n.s. n.s. n.s.
z-scaled data
Noise n.s. n.s. n.s. n.s. n.s. n.s. n.s. n.s.
Noise � Location 0.006 n.s. n.s. n.s. n.s. n.s. n.s. n.s.
n.s. = not significant.
HSD tests were used for post hoc analyses of significant main effects
and interactions of between-subjects factors.
Results
Sound pressure level
The sound pressure level to which subjects in the ‘‘noise’’ group
were subjected was 88 dB.
Introspective data
According to the post-experimental questionnaire, all subjects
were highly motivated and performance oriented (see Table 2) and
the items were considered to be easy.
The results of the factor analysis of the post-experimental
questionnaire revealed that three factors (eigenvalue > 1) explain
approximately 79% of the total variance. Factor 1 (eigenvalue =
4.64) had high loadings in all ‘‘emotion’’ questions, the question
concerning the ‘‘impact of the noise on concentration’’ and the
‘‘noise disturbance’’. This factor was labeled ‘‘annoyance’’. The
second factor (eigenvalue = 1.34) had a high negative loading in the
item ‘‘perceived difficulty of the tasks’’ and the third factor
(eigenvalue = 1.14) had a high loading in the ‘‘general motivation’’
item.
The categorization into ‘‘annoyed’’ (N = 9) and ‘‘not annoyed’’
(N = 9) subjects was solely according to the factor ‘‘annoyance’’.
A Mann–Whitney U test comparing questionnaire scores of the
9 ‘‘annoyed’’ and 9 ‘‘not annoyed’’ subjects reached significance
with the pooled data according the factor ‘‘annoyance’’ (P < 0.001).

J. Pripfl et al. / NeuroImage 31 (2006) 332–341 337
Kruskal–Wallis tests comparing the groups ‘‘no noise’’, ‘‘annoyed’’
and ‘‘not annoyed’’ neither reached significance for the question
‘‘importance of overall good performance’’ nor for the question
‘‘difficulty of items’’.
Behavioral data
The ‘‘no noise’’ group achieved 96% correct answers on average.
Both ‘‘not annoyed’’ and ‘‘annoyed’’ subjects solved 90% of tasks on
average (see Table 3). A Pearson Chi-Square test comparing all these
groups revealed a significant difference (P < 0.002). The median
response time for the ‘‘no noise’’ group was 14.1 s, for ‘‘not
annoyed’’ subjects 12.8 s and for the ‘‘annoyed’’ 13.9 s (see Table 3).
Mann–Whitney U tests revealed a significant difference between
‘‘no noise’’ and ‘‘not annoyed’’ groups (P < 0.002) and between
‘‘annoyed’’ and ‘‘not annoyed’’ groups (P < 0.001).
EEG changes
In order to identify differences between the three groups,
ANOVAs for repeated measures [factors: Noise (‘‘no noise’’, N =
9, ‘‘not annoyed’’, N = 9, ‘‘annoyed’’, N = 9) � Location (20)] were
Fig. 2. Maps of grand means of significant components. Noise reduced the N2 com
when subjects became annoyed.
performed with raw and z-scaled data for each ERP component (see
Table 4) except N1 and P2. These two components were subjected to
anANOVA for repeatedmeasures with the factors: Annoyance (‘‘not
annoyed’’, N = 9, ‘‘annoyed’’, N = 9) � Location (20).
Analyses of N2 raw and z-data revealed significant inter-
actions for Noise � Location (raw data: F(38,456) = 3.928, P <
0.004; Greenhouse–Geisser (GG = 0.126; z-data: F(38,456) =
2.688, P < 0.006; (GG = 0.247). As shown by significant a priori
linear and a posteriori interaction contrasts (Boik, 1979; a
posteriori significance level was Bonferoni-corrected with a’ =
0.016), this significant interaction was mainly due to a more
pronounced N2 over occipital areas without noise, with higher
negative values at occipital sites and more positive values at
frontal sites (see Fig. 2 and Table 5).
ANOVA for latencies [Noise (‘‘no noise’’, N = 9, ‘‘not
annoyed’’, N = 9, ‘‘annoyed’’, N = 9) � Latency] revealed a
significant difference for the N2 (P < 0.002, F(2,24) = 8.128). Noise
prolonged latencies, as shown by Tukey’s HSD [‘‘annoyed’’ (mean
latency L = 255 ms) vs. ‘‘no noise’’ (L = 220 ms): P < 0.002; ‘‘not
annoyed’’ (L = 244 ms) vs. ‘‘no noise’’: P < 0.034]. No difference
was found between the noise groups [Tukey’s HSD ‘‘annoyed’’ vs.
‘‘not annoyed’’ did not reach significance].
ponent and shifts towards negative amplitude values were generally reduced

Table 5
A priori and a posteriori contrasts for the significant ANOVA interaction ‘‘Noise � Location’’ of N2
Raw data at locations z-data at locations
O1, Oz, O2 O1, Oz, O2
P F(1,24) P F(1,24)
A priori contrasts
‘‘annoyed’’ vs. ‘‘not annoyed’’ n.s. n.s. n.s. n.s.
‘‘annoyed’’ vs. ‘‘no noise’’ 0.016 6.730 0.031 5.219
‘‘not annoyed’’ vs. ‘‘no noise’’ n.s. n.s. 0.017 6.522
Raw data at locations z-data at locations
F3, Fz, F4 vs. O1, Oz, O2 F3, Fz, F4 vs. O1, Oz, O2
P F(1,24) P F(1,24)
A posteriori interaction contrasts
‘‘annoyed’’ vs. ‘‘not annoyed’’ n.s. n.s. n.s. n.s.
‘‘annoyed’’ vs. ‘‘no noise’’ 0.003 11.120 0.004 7.833
‘‘not annoyed’’ vs. ‘‘no noise’’ 0.002 11.621 0.010 10.283
vs. = versus; n.s. = not significant.
J. Pripfl et al. / NeuroImage 31 (2006) 332–341338
Analyses of SCP2, SCP3, SCP4 and SCP5 showed significant
main effects for the factor ‘‘Noise’’ with raw data (SCP2: F(2,24) =
6.779, P < 0.005; SCP3: F(2,24) = 3.538, P < 0.045; SCP4: F(2,24) =
4.144, P < 0.028; SCP5: F(2,24) = 4.422, P < 0.023) indicating a
topographic pattern with a generally smaller negative-going shift
with ‘‘annoyed’’ subjects compared to ‘‘not annoyed’’, as supported
by Tukey’s HSD (‘‘annoyed’’ vs. ‘‘not annoyed’’ during SCP2: P <
0.004, mean difference for SCP2: 4.65 AV; SCP3: P < 0.040, 4.52
AV; SCP4: P < 0.027, 5.43 AV; SCP5: P < 0.020, 6.59 AV).Although mean differences were also large between ‘‘annoyed’’ and
‘‘no noise’’ subjects (from 3.03 AV for SCP2 up to 4.42AV for
SCP5), Tukey’s HSD did not reveal any significance. Likewise,
Tukey’s HSD did not reveal any significant difference between the
‘‘not annoyed’’ and ‘‘no noise’’ groups (see Table 6). Neither
ANOVA of z-scaled data of these SCP components, nor ANOVA of
latencies as well as raw and z-data for P3a and P3b amplitudes
yielded any significant result.
Repeated measures ANOVA for N1 and P2 [factors: Annoy-
ance (‘‘not annoyed’’, N = 9, ‘‘annoyed’’, N = 9) � Location (20)]
showed no significance either for latencies, or for raw or z-scaled
data. As has been mentioned, these two components were not
identifiable for ‘‘no noise’’ subjects, so a separate ANOVA was
calculated.
Discussion
As our study included only female subjects, results and
interpretations cannot be generalized for gender. According to the
Table 6
Tukey’s HSD for significant ANOVA main factor ‘‘Noise’’ of SCP2, SCP3,
SCP4 and SCP5
SCP2 SCP3 SCP4 SCP5
P P P P
‘‘annoyed’’ vs. ‘‘not annoyed’’ 0.004 0.040 0.027 0.020
‘‘annoyed’’ vs. ‘‘no noise’’ n.s. n.s. n.s. n.s.
‘‘not annoyed’’ vs. ‘‘no noise’’ n.s. n.s. n.s. n.s.
vs. = versus; n.s. = not significant.
introspective data, all subjects were highly motivated and
considered the tasks to be easy. Individual differences were
found when fMRI scanner noise was played back as background
noise: some of the subjects accepted the noise, others became
annoyed and the noise evoked negative feelings. By means of a
factor analysis, we attempted to establish if a specific type of
emotion (e.g., anger or dejection) was preferentially evoked in
reaction to scanner noise or if subjects experienced a diffuse
pattern of negative feelings. We identified just one factor which
had high loadings in all questions concerning emotions and
distraction of concentration. Thus, fMRI noise seems to induce a
general negative affect and subjects are not able to clearly
identify an emotion to which this should be assigned. This result
reflects the broad extent of the noise annoyance concept, as a
negative evaluation of environmental conditions, but with
connotations that are rather diverse (Guski et al., 1999).
However, the weak selectivity may also be partly due to the
method. No time course of feelings was measurable with the
applied post-experimental questionnaire. It is feasible that
subjects reacted with anger or aggression at the beginning of
the experiment but fell into a state of ‘‘helplessness’’ with feeling
similar to those associated with depression or passivity, when
they experienced a loss of control over the noise for an extended
period of time. Given the available data, subjects had to be
simply classified as having been annoyed or not annoyed.
Response times were shorter for ‘‘not annoyed’’ subjects than for
the ‘‘no noise’’ group and did not differ between the groups of
‘‘annoyed’’ and ‘‘no noise’’. Error rates were more than twice as
high in the noisy environment as in the silent. According to the
‘‘annoyed’’ subjects, these behavioral observations clearly indi-
cate that their performance was worse. Explanations for the so-
called Fspeed-accuracy trade-off_ of the ‘‘not annoyed’’ group,
i.e., why subjects trade speed for accuracy, remain somewhat
speculative. When and why people respond quickly or accurately
has been a fundamental question since the beginning of
experimental psychology (Woodworth, 1899). Given the exten-
sive research on this topic, it is surprising that the basic
processes underlying these decisions are still poorly understood
(for a review see Forster et al., 2003). One explanation may be
that processing the task in the presence of a distracting noise
entails increased attentional load. This may serve two purposes;

J. Pripfl et al. / NeuroImage 31 (2006) 332–341 339
to allow the task to be performed under such conditions and,
quite separately, to block noise. The additional resources
allocated to processing the task may have led to shorter reaction
times here. Shorter reaction times are often related to lower
accuracy (Forster et al., 2003). In the present study, the
additional cognitive effort required to block noise was perhaps
responsible for this impaired performance. Interestingly, people
who became annoyed did not show this speed-accuracy trade-off.
Their mean response time did not differ significantly from the
‘‘no noise’’ group, but they made more mistakes. It is possible
that they were not able to make additional attentional resources
available for task processing because some of the attentional
resources were used for dealing with the evoked emotions (see
e.g., Drevets and Raichle, 1998). As ‘‘not annoyed’’ and
‘‘annoyed’’ subjects had the same error rates but the ‘‘annoyed’’
subjects took longer to find an answer, the reported differences
in the literature between performance recorded off-line and
during fMRI (Lamm et al., 2001; Mazard et al., 2002) may not
only be due to distracted attention but to cognitive-emotional
interference as a result of noise annoyance. Other factors may
contribute to differences between cognitive processing in the
fMRI environment and in everyday circumstances, such as
subjects’ supine position and the narrow confines of the MR
scanner. By analyzing cognitive processing with fMRI noise in
EEG, however, we have been able to separate noise effects from
the other potential confounds of the fMRI setting.
Acoustically, typical EPI noise experienced in fMRI is not a
broadband noise but rather a complex sound, with characteristic
beep-beep-beep-. . . noise bursts, with beeps corresponding to each
acquisition of a slice. The aim of the study was to assess the
influence of the noise that is usually present in an fMRI
experiment. Noise was switched on at the beginning of EEG
recording and switched off after recording was stopped, without
stimulus-locking of the presentation of the noise. Thus, averaging
the data should have eliminated evoked potentials elicited by
single noise bursts. However, fMRI scanner noise influenced very
early stages (N1, P2, N2) of processing of the visual presented
tasks. Additionally, different reactions to the noise (being annoyed
vs. being not annoyed) resulted in distinct brain activity during
later stages of task processing, i.e., from 2 s post-stimulus until the
end of the analyzed time interval.
N1 and P2 were only identifiable with background noise,
whereas, in agreement with Novitski et al. (2001), N2 was more
pronounced without noise. As early ERP components are influenced
by attention (besides physical task features; e.g., Groves and Eason,
1969; Oakley and Eason, 1990; Johannes et al., 1995), and cross-
modal attention has been shown to modulate event-related brain
potentials (e.g., Eimer, 2001; Hotting et al., 2003), the observed
heterogeneity in distribution was probably caused by different
attentional requirements. It is obvious that the blocking out of
distracting fMRI noise is necessary for successful processing of the
reasoning task under noise conditions. Thus, an additional cognitive
effort is required, even if this blocking is highly automated, leading
to altered task performance and perhaps also to the divergent ERP’s
observed. Prolonged peak latency of N2 under noise fits with this
interpretation.
The slow cortical negative shift during task processing was
significantly attenuated for ‘‘annoyed’’ subjects compared to ‘‘not
annoyed’’ subjects. As there was no significant interaction with
the location factor, topographies of the two groups differed only
in strength. Thus, the same cortical areas might have been
activated, but with different intensities. The EEG method used
collects mainly cortical brain activity, but emotions are also
related to limbic and subcortical structures (e.g., LeDoux, 1992;
Charney and Deutch, 1996; Lang et al., 1998; Cardinal et al.,
2002), which may be responsible for the observed difference.
Actually, there are some hints of a reciprocal suppression of brain
activity during emotional vs. higher cognitive processing. Drevets
and Raichle (1998), showed in a review that when brain regions
putatively involved in performing memory, language, or visuo-
spatial tasks become activated, brain regions involved in
emotional processing become less active, and vice versa. They
suggest that ‘‘the deactivation of particular regions may be
consistent with a Flimited capacity_ model of cognitive process-
ing, in which the excessive amounts of information available to
the brain necessitate a variety of attentional mechanisms that
select among competing mental processes’’. In this context, our
results could be interpreted as the different SCPs of the groups
reflecting different attentional mechanisms that allocate process-
ing resources during task performance. SCPs of ‘‘annoyed’’
subjects were not as negative as those of the ‘‘not annoyed’’,
perhaps due to an allocation of attentional resources for dealing
with the emotions which arose. The poorer performance of this
group is in agreement with this interpretation.
Our findings have several implications for the design and
interpretation of fMRI studies. Firstly, we have shown that fMRI
background noise can influence attention-related neuronal activity
as reflected in the early ERP components of visual processing,
probably causing different task performance. The BOLD response
for cognitive tasks of longer duration is usually recorded with
repetition times (TR) of 2 s and longer. Thus, very short duration
early brain activity as measured via N1, P2 or N2 may not be
apparent in fMRI data. However, these early processes are perhaps
accompanied by longer lasting activation of other attention-related
areas which should be detectable by fMRI. Activity in one of
these areas, the anterior cingulate cortex (ACC) has already been
shown to increase during cognitive task processing when fMRI
noise was presented compared to a silent condition (Mazard et al.,
2002).
Secondly, fMRI noise may lead to annoyance and emotional
reactions in some but not all subjects. Annoyed subjects differ
systematically from not annoyed subjects in both brain activity
and performance in the reasoning task (with the annoyed subjects
needing about 1 s longer to solve a task). The same would be
expected to be the case with other complex mental tasks. It has
been demonstrated that emotional reactions to scanner noise
could be a confounding variable when studying the emotions
with fMRI. This could pose a particular problem when studying
patients suffering from affective disorders, because they are
potentially particularly susceptible to the emotional reactions
described. This could confound matched control investigations in
both cognition and emotion studies.
Our results suggest that individual reactions to fMRI noise
should be taken into account when designing fMRI studies,
interpreting results and making comparisons with EEG studies
employing the same stimuli in quiet surroundings.
Acknowledgments
Many thanks to W. Deutsch and P. Majdak of the Institute of
Musicology, University of Vienna, for their assistance in EPI

J. Pripfl et al. / NeuroImage 31 (2006) 332–341340
volume measurements. This work was supported by a grant of the
Jubilaeumsfonds of the Austrian National Bank (Project 9854).
References
Bandettini, P.A., Cox, R.W., 2000. Event-related fMRI contrast when using
constant interstimulus interval: theory and experiment. Magn. Reson.
Med. 43 (4), 540–548.
Bauer, H., 1998. Slow potential topography. Behav. Res. Meth. Instrum.
Comput. 13, 51–58.
Bauer, H., Lauber, W., 1979. Operant conditioning of brain steady potential
shifts in man. Biofeedback Self-Regul. 4 (2), 145–154.
Bauer, H., Lamm, C., Holzreiter, I., Hollander, U., Leodolter, M., Leodolter,
U., 2000. Measurement of 3D electrode coordinates by means of a 3D
photogrammetric head digitizer. NeuroImage 11 (5, Part 2), 461.
Boik, R.J., 1979. Interactions, partial interactions, and interaction contrasts
in the analysis of variance. Psychol. Bull. 86, 1084–1089.
Brechmann, A., Baumgart, F., Scheich, H., 2002. Sound-level-dependent
representation of frequency modulations in human auditory cortex: a
low-noise fMRI study. J. Neurophysiol. 87 (1), 423–433.
Breier, A., Albus, M., Pickar, D., Zahn, T.P., Wolkowitz, O.M., Paul, S.M.,
1987. Controllable and uncontrollable stress in humans: alterations in
mood and neuroendocrine and psychophysiological function. Am. J.
Psychiatry 144 (11), 1419–1425.
Cardinal, R.N., Parkinson, J.A., Hall, J., Everitt, B.J., 2002. Emotion and
motivation: the role of the amygdala, ventral striatum, and prefrontal
cortex. Neurosci. Biobehav. Rev. 26 (3), 321–352.
Charney, D.S., Deutch, A., 1996. A functional neuroanatomy of anxiety and
fear: implications for the pathophysiology and treatment of anxiety
disorders. Crit. Rev. Neurobiol. 10 (3–4), 419–446.
Cho, Z.H., Chung, S.C., Lim, D.W., Wong, E.K., 1998. Effects of the
acoustic noise of the gradient systems on fMRI: a study on
auditory, motor, and visual cortices. Magn. Reson. Med. 39 (2),
331–335.
Conway, M., Giannopoulos, C., 1993. Dysphoria and decision making:
limited information use for evaluations of multiattribute targets. J. Pers.
Soc. Psychol. 64 (4), 613–623.
Drevets, W.C., Raichle, M.E., 1998. Reciprocal suppression of regional
cerebral blood flow during emotional versus higher cognitive processes:
implications for interactions between emotion and cognition. Cogn.
Emot. 12 (3), 353–385.
Eimer, M., 2001. Crossmodal links in spatial attention between vision,
audition, and touch: evidence from event-related brain potentials.
Neuropsychologia 39 (12), 1292–1303.
Ellis, H.C., Thomas, R.L., Rodriguez, I.A., 1984. Emotional mood states
and memory: elaborative encoding, semantic processing, and cognitive
effort. J. Exp. Psychol. Learn. Mem. Cogn. 10 (3), 470–482.
Fields, J.M., 1993. Effect of personal and situational variables on noise
annoyance in residential areas. J. Acoust. Soc. Am. 93, 2753–2763.
Forster, J., Higgins, E.T., Bianco, A.T., 2003. Speed/accuracy decisions in
task performance: built-in trade-off or separate strategic concerns? Org.
Behav. Human Decis. Process. 90, 148–164.
Groves, P.M., Eason, R.G., 1969. Effects of attention and activation on the
visual evoked cortical potential and reaction time. Psychophysiology 5
(4), 394–398.
Guski, R., Felscher-Suhr, U., Schuemer, R., 1999. The concept of noise
annoyance: how international experts see it. J. Sound Vib. 223 (4),
513–527.
Haig, A.R., Gordon, E., Hook, S., 1997. To scale or not to scale: McCarthy
and Wood revisited. Electroencephalogr. Clin. Neurophysiol. 103 (2),
323–325.
Hall, D.A., Haggard, M.P., Akeroyd, M.A., Palmer, A.R., Summerfield,
A.Q., Elliott, M.R., Gurney, E.M., Bowtell, R.W., 1999. ‘‘Sparse’’
temporal sampling in auditory fMRI. Hum. Brain Mapp. 7 (3),
213–223.
Hennel, F., Girard, F., Loenneker, T., 1999. ‘‘Silent’’ MRI with soft gradient
pulses. Magn. Reson. Med. 42 (1), 6–10.
Hotting, K., Rosler, F., Roder, B., 2003. Crossmodal and intermodal
attention modulate event-related brain potentials to tactile and auditory
stimuli. Exp. Brain Res. 148 (1), 26–37.
Jackson, R.L., Smith, L.R., 1984. The effects of uncontrollable failure and
depression on memorial processes. J. Res. Pers. 18, 463–479.
Johannes, S., Munte, T.F., Heinze, H.J., Mangun, G.R., 1995. Luminance
and spatial attention effects on early visual processing. Brain Res. Cogn.
Brain Res. 2 (3), 189–205.
Klein, S., Smolka, M.N., Wrase, J., Gruesser, S.M., Mann, K., Braus, D.F.,
Heinz, A., 2003. The influence of gender and emotional valence of
visual cues on FMRI activation in humans. Pharmacopsychiatry 36
(Suppl 3), 191–194.
Lamm, C., Windischberger, C., Leodolter, U., Moser, E., Bauer, H., 2001.
Evidence for premotor cortex activity during dynamic visuospatial
imagery from single-trial functional magnetic resonance imaging and
event-related slow cortical potentials. NeuroImage 14 (2), 268–283.
Lang, P.J., Bradley, M.M., Cuthbert, B.N., 1998. Emotion, motivation, and
anxiety: brain mechanisms and psychophysiology. Biol. Psychiatry 44
(12), 1248–1263.
LeDoux, J.E., 1992. Brain mechanisms of emotion and emotional learning.
Curr. Opin. Neurobiol. 2 (2), 191–197.
Marcar, V.L., Girard, F., Rinkel, Y., Schneider, J.F., Martin, E., 2002.
Inaudible functional MRI using a truly mute gradient echo sequence.
Neuroradiology 44 (11), 893–899.
Mazard, A., Mazoyer, B., Etard, O., Tzourio-Mazoyer, N., Kosslyn,
S.M., Mellet, E., 2002. Impact of fMRI acoustic noise on the
functional anatomy of visual mental imagery. J. Cogn. Neurosci. 14
(2), 172–186.
McCarthy, G., Wood, C.C., 1985. Scalp distributions of event-related
potentials: an ambiguity associated with analysis of variance models.
Electroencephalogr. Clin. Neurophysiol. 62 (3), 203–208.
Miedema, H.M.E., Vos, H., 1999. Demographic and attitudinal factors that
modify annoyance from transportation noise. J. Acoust. Soc. Am. 105
(6), 3336–3344.
Moelker, A., Pattynama, P.M., 2003. Acoustic noise concerns in functional
magnetic resonance imaging. Hum. Brain Mapp. 20 (3), 123–141.
Nakada, T., Tasaka, N., 2001. Human brain imaging in the upright position.
Neurology 57 (9), 1720–1722.
Novitski, N., Alho, K., Korzyukov, O., Carlson, S., Martinkauppi, S.,
Escera, C., Rinne, T., Aronen, H.J., Naatanen, R., 2001. Effects of
acoustic gradient noise from functional magnetic resonance imaging on
auditory processing as reflected by event-related brain potentials.
NeuroImage 14 (1 Pt 1), 244–251.
Oakley, M.T., Eason, R.G., 1990. Subcortical gating in the human visual
system during spatial selective attention. Int. J. Psychophysiol. 9 (2),
105–120.
Oliver-Rodriguez, J.C., Guan, Z., Johnston, V.S., 1999. Gender differences
in late positive components evoked by human faces. Psychophysiology
36 (2), 176–185.
Perlstein, W.M., Elbert, T., Stenger, V.A., 2002. Dissociation in human
prefrontal cortex of affective influences on working memory-related
activity. Proc. Natl. Acad. Sci. U. S. A. 99 (3), 1736–1741.
Pfeuffer, J., Merkle, H., Beyerlein, M., Steudel, T., Logothetis, N.K.,
2004. Anatomical and functional MR imaging in the macaque
monkey using a vertical large-bore 7 Tesla setup. Magn. Reson.
Imaging 22 (10), 1343–1359.
Phan, K.L., Wager, T., Taylor, S.F., Liberzon, I., 2002. Functional
neuroanatomy of emotion: a meta-analysis of emotion activation studies
in PET and fMRI. NeuroImage 16 (2), 331–348.
Robinson, S., Windischberger, C., Rauscher, A., Moser, E., 2004.
Optimized 3 T EPI of the amygdalae. NeuroImage 22 (1), 203–210.
Royet, J.P., Plailly, J., Delon-Martin, C., Kareken, D.A., Segebarth, C.,
2003. fMRI of emotional responses to odors: influence of hedonic
valence and judgment, handedness, and gender. NeuroImage 20 (2),
713–728.

J. Pripfl et al. / NeuroImage 31 (2006) 332–341 341
Stephenson, W., Gibbs, F.A., 1951. A balanced non-cephalic reference
electrode. Clin. Neurophysiol. 3, 237–240.
Talavage, T.M., Edmister, W.B., Ledden, P.J., Weisskoff, R.M., 1999.
Quantitative assessment of auditory cortex responses induced by imager
acoustic noise. Hum. Brain Mapp. 7 (2), 79–88.
Wager, T.D., Phan, K.L., Liberzon, I., Taylor, S.F., 2003. Valence, gender,
and lateralization of functional brain anatomy in emotion: a meta-
analysis of findings from neuroimaging. NeuroImage 19 (3), 513–531.
Woodworth, R.S., 1899. Accuracy of voluntary movements. Psychol. Rev.
3, 1–101.