Estimation of respiration-induced noise fluctuations from undersampled multislice fMRI data
10
Estimation of Respiration-Induced Noise Fluctuations From Undersampled Multislice fMRI Data Lawrence R. Frank, 1,3 * Richard B. Buxton, 1 and Eric C. Wong 1,2 Functional MRI time series data are known to be contami- nated by highly structured noise due to physiological fluctu- ations. Significant components of this noise are at frequen- cies greater than those critically sampled in standard multi- slice imaging protocols and are therefore aliased into the activation spectrum, compromising the estimation of func- tional activations and the determination of their significance. However, in this work it is demonstrated that unaliased noise information is available in multislice data, and can be used to estimate and reduce noise due to high-frequency respirato- ry-related fluctuations. Magn Reson Med 45:635– 644, 2001. Published 2001 Wiley-Liss, Inc. Key words: functional magnetic resonance imaging; physiolog- ical noise; data analysis; multislice imaging; physiological fluc- tuations The analysis of functional magnetic resonance imaging (fMRI) time series data is complicated by the fact that the noise is not Gaussian (1–5). This is a consequence of the fact that the dominant contributions to the noise in fMRI are signal variations produced by physiological processes, rather than by the thermal noise. These physiologically related signal fluctuations are generally quite complicated and can have significant power over a wide range of fre- quencies. Moreover, these fluctuations can be correlated with one another, producing sidebands with significant power. The dominant contributions appear to be high- frequency fluctuations related to the quasiperiodic pro- cesses of respiration and cardiac pulsations, and low-fre- quency fluctuations, which can result from slow drifts in the time series, but have also been hypothesized to be related to noise correlations produced by the hemody- namic response of the brain (1,6). In spite of the complexities of the spectrum of noise fluctuations, estimation of functional activation can still be relatively straightforward even in the presence of such fluctuations, provided that its spectrum is not overlapped by that of the noise fluctuations, and that the data sam- pling rate is sufficient to critically sample the spectrum of the noise. If these conditions hold, standard methods of filtering can be applied (7) to reduce unwanted noise com- ponents. Unfortunately, while it is possible to collect data in a single slice at a rate sufficient to critically sample high-frequency physiological fluctuations, virtually no fMRI experiments are actually done in this way. Rather, multislice acquisitions are performed in order to achieve adequate spatial coverage. With the typical imaging pa- rameters used in multislice studies, the sampling rate for each slice is not sufficient to critically sample the physio- logical fluctuations, and the resulting time series noise is contaminated by aliased spectral components from the high-frequency physiological fluctuations. This not only reduces both functional signal-to-noise ratio (SNR) and significance of the estimates, but makes improper the use of many well-developed standard estimation techniques based on Gaussian noise models. However, in this work we show that it is possible to obtain unaliased information about the noise structure directly from multislice echo-planar imaging (EPI) fMRI time series data. This is achieved by noting two impor- tant features of such fMRI data: 1) Some physiological fluctuations are relatively global in nature and are there- fore present in the central k-space components. 2) Sur- prisingly, physiological fluctuations are critically sam- pled and obtainable in most multislice EPI data acqui- sitions if the data is reordered into temporal, rather than spatial, order (8). EXPERIMENTAL METHODS A natural way to assess the problem of noise in multislice fMRI is to compare two data sets acquired during the same stimulation paradigm: one acquired in a multislice fash- ion, and one in a rapidly sampled acquisition in a single- slice location as one of the multislice locations. To make the data sets more easily comparable, the same imaging parameters (except those related to slice acquisition) are used and, for reasons that will become clear, the repetition time in the multislice acquisition is set to the repetition time of the single-slice acquisition times the number of slices, so that the time between each data acquisition step, which we term the “effective sampling rate,” is the same in both experiments. All images were acquired on a 1.5T GE Signa LX system using a single-shot EPI acquisition. Images in both data sets acquired in the sagittal plane with imaging parameters FOV 5 24 cm, slice thickness 5 7 mm, TE 5 40 msec, 64 matrix. The stimulation in both data sets was a simple visual field stimulation study (8 Hz flashing checkerboard) presented in a block design paradigm in order to simplify the spectrum of the activation: the stimulus was presented at a rate of 1 per sec, with the stimulus on for 16 sec and off for 16 sec, and thus a stimulation period 5 .03125 Hz. In the first data set, data were collected on a single slice with a very short repetition time ( TR 5 .25 sec) in order to critically sample what we hypothesize to be the largest 1 Department of Radiology, University of California at San Diego, San Diego, California. 2 Department of Psychiatry, University of California at San Diego, San Diego, California. 3 San Diego VA Healthcare System, San Diego, California. Grant sponsor: VA Merit Review; Grant number: SA321. *Correspondence to: Lawrence R. Frank, Ph.D., VA Medical Center, 9114/ MRI, 3350 La Jolla Village Drive, San Diego, CA 92161. E-mail: [email protected] Received 8 February 2000; revised 25 October 2000; accepted 26 October 2000. Magnetic Resonance in Medicine 45:635– 644 (2001) Published 2001 Wiley-Liss, Inc. This article is a US Government work and, as such, is in the public domain in the United States of America. 635
Transcript of Estimation of respiration-induced noise fluctuations from undersampled multislice fMRI data

Estimation of Respiration-Induced Noise FluctuationsFrom Undersampled Multislice fMRI Data
Lawrence R. Frank,1,3* Richard B. Buxton,1 and Eric C. Wong1,2
Functional MRI time series data are known to be contami-nated by highly structured noise due to physiological fluctu-ations. Significant components of this noise are at frequen-cies greater than those critically sampled in standard multi-slice imaging protocols and are therefore aliased into theactivation spectrum, compromising the estimation of func-tional activations and the determination of their significance.However, in this work it is demonstrated that unaliased noiseinformation is available in multislice data, and can be used toestimate and reduce noise due to high-frequency respirato-ry-related fluctuations. Magn Reson Med 45:635– 644, 2001.Published 2001 Wiley-Liss, Inc.†
Key words: functional magnetic resonance imaging; physiolog-ical noise; data analysis; multislice imaging; physiological fluc-tuations
The analysis of functional magnetic resonance imaging(fMRI) time series data is complicated by the fact that thenoise is not Gaussian (1–5). This is a consequence of thefact that the dominant contributions to the noise in fMRIare signal variations produced by physiological processes,rather than by the thermal noise. These physiologicallyrelated signal fluctuations are generally quite complicatedand can have significant power over a wide range of fre-quencies. Moreover, these fluctuations can be correlatedwith one another, producing sidebands with significantpower. The dominant contributions appear to be high-frequency fluctuations related to the quasiperiodic pro-cesses of respiration and cardiac pulsations, and low-fre-quency fluctuations, which can result from slow drifts inthe time series, but have also been hypothesized to berelated to noise correlations produced by the hemody-namic response of the brain (1,6).
In spite of the complexities of the spectrum of noisefluctuations, estimation of functional activation can stillbe relatively straightforward even in the presence of suchfluctuations, provided that its spectrum is not overlappedby that of the noise fluctuations, and that the data sam-pling rate is sufficient to critically sample the spectrum ofthe noise. If these conditions hold, standard methods offiltering can be applied (7) to reduce unwanted noise com-ponents. Unfortunately, while it is possible to collect datain a single slice at a rate sufficient to critically sample
high-frequency physiological fluctuations, virtually nofMRI experiments are actually done in this way. Rather,multislice acquisitions are performed in order to achieveadequate spatial coverage. With the typical imaging pa-rameters used in multislice studies, the sampling rate foreach slice is not sufficient to critically sample the physio-logical fluctuations, and the resulting time series noise iscontaminated by aliased spectral components from thehigh-frequency physiological fluctuations. This not onlyreduces both functional signal-to-noise ratio (SNR) andsignificance of the estimates, but makes improper the useof many well-developed standard estimation techniquesbased on Gaussian noise models.
However, in this work we show that it is possible toobtain unaliased information about the noise structuredirectly from multislice echo-planar imaging (EPI) fMRItime series data. This is achieved by noting two impor-tant features of such fMRI data: 1) Some physiologicalfluctuations are relatively global in nature and are there-fore present in the central k-space components. 2) Sur-prisingly, physiological fluctuations are critically sam-pled and obtainable in most multislice EPI data acqui-sitions if the data is reordered into temporal, rather thanspatial, order (8).
EXPERIMENTAL METHODS
A natural way to assess the problem of noise in multislicefMRI is to compare two data sets acquired during the samestimulation paradigm: one acquired in a multislice fash-ion, and one in a rapidly sampled acquisition in a single-slice location as one of the multislice locations. To makethe data sets more easily comparable, the same imagingparameters (except those related to slice acquisition) areused and, for reasons that will become clear, the repetitiontime in the multislice acquisition is set to the repetitiontime of the single-slice acquisition times the number ofslices, so that the time between each data acquisition step,which we term the “effective sampling rate,” is the same inboth experiments.
All images were acquired on a 1.5T GE Signa LX systemusing a single-shot EPI acquisition. Images in both datasets acquired in the sagittal plane with imaging parametersFOV 5 24 cm, slice thickness 5 7 mm, TE 5 40 msec,64 matrix. The stimulation in both data sets was a simplevisual field stimulation study (8 Hz flashing checkerboard)presented in a block design paradigm in order to simplifythe spectrum of the activation: the stimulus was presentedat a rate of 1 per sec, with the stimulus on for 16 sec and offfor 16 sec, and thus a stimulation period 5 .03125 Hz.
In the first data set, data were collected on a single slicewith a very short repetition time (TR 5 .25 sec) in orderto critically sample what we hypothesize to be the largest
1Department of Radiology, University of California at San Diego, San Diego,California.2Department of Psychiatry, University of California at San Diego, San Diego,California.3San Diego VA Healthcare System, San Diego, California.Grant sponsor: VA Merit Review; Grant number: SA321.*Correspondence to: Lawrence R. Frank, Ph.D., VA Medical Center, 9114/MRI, 3350 La Jolla Village Drive, San Diego, CA 92161.E-mail: [email protected] 8 February 2000; revised 25 October 2000; accepted 26 October2000.
Magnetic Resonance in Medicine 45:635–644 (2001)
Published 2001 Wiley-Liss, Inc. † This article is a US Governmentwork and, as such, is in the public domain in the United States of America.
635

frequency components—those related to cardiac pulsa-tions (' 1 Hz). Thus, 64 images were collected during the“on” period and 64 were collected during the “off” period.In the second experiment, the same activation protocolwas performed, but data was collected in eight slices at arepetition rate of TR 5 .25 sec 3 8 slices 5 2.0 sec so thatthe effective sampling rate for the temporally reordereddata was then equivalent to the single-slice experiment: 2sec/(8 slices) 5 .25 sec. Thus eight images were col-lected during the “on” period and eight were collectedduring the “off” period.
STRUCTURE OF fMRI NOISE
The structure of the noise in fMRI is complex because it isdominated by signal variations produced by physiologicalprocesses. In addition, since there are multiple mecha-nisms by which the MR signal can be altered, the physio-logically related noise fluctuations are not likely to besimply related to any one physiological process, but rathera combination of effects. Therefore, while it is important tounderstand the mechanisms that generate these noise vari-ations, it may be difficult to accurately model them. More-over, since most physiological processes are only quasi-periodic, simple periodic representations are inadequate.Perhaps the most difficult aspect of the noise characteriza-tion is that its domination by physiological processes mayobviate the most obvious method of characterization: col-lecting data in the absence of functional activation. For ifthe noise is generated by physiological activity, it is likelyaltered by the functional activity.
An example of these complications is seen in the powerspectrum from an activated voxel within the visual cortexfrom the single-slice data (Fig. 1). Also shown in Fig. 1 areimages of the spatial distribution of the power spectra atthe peak frequencies in the power spectrum plot.
There are a few important characteristics of the noise tonote in Fig. 1. It is evident that not only is there significantpower at frequencies other than the activation, but that thespatial distribution of these components can overlap re-gions of functional activation. Also, there is a distinctlow-frequency spectrum whose amplitude appears to falloff with increasing frequency. This is sometimes termed a“1/f” spectrum, although this is perhaps an unfortunatenomenclature because there are processes in fMRI that cangenerate such low-frequency spectra but are not 1/f pro-cesses. The most obvious are slowly varying temporalvariations of the signal, or “trends,” that can be caused bya variety of reasons, such as slow patient motion (e.g.,sinking into the padding) or scanner drift. Most relevantfor the present discussion is the existence of distinct peaksat frequencies much higher than the activation due tosignal variations related to both respiratory and cardiacpulsations. Note, however, that the power spectrum nearthese frequencies does not reflect a purely sinusoidal vari-ation, but a distribution of frequencies about the peak.This is to be expected, since physiological processes arerarely purely periodic. The heart rate, for instance, hassignificant temporal variability in healthy humans. More-over, the respiratory and cardiac rates are coupled, so thatsituations in which, for example, the respiratory rate in-creases with the cardiac rate, are not uncommon.
Physiological processes produce signal variations inboth the image magnitude and phase time series. Both ofthese are, of course, manifestations of magnitude andphase variations in the k-space data actually acquired. Aremarkable fact that has been noted before is that thesephysiologically induced k-space phase variations are rel-atively uncontaminated in the phase channel, and can beutilized for retrospective correction of either k-spacephase or image space magnitude time series data (9,10).The fluctuations in the k-space phase produced by respi-ratory processes are relatively global, and therefore areexpected to be present to some degree in most k-spacecomponents. This is to a lesser degree true of cardiacfluctuations, which are more punctate spatially. For thepresent we will assume, however, that both componentsare relatively global. Difficulties with this assumption areaddressed in the Discussion section. The waveform of aparticular spectral component will be a complicated mix-ture of effects due to both the natural variations in thephysiological process (e.g., variation in the cardiac fre-quency during the experiment) and variations in the MRsignal produced by the physiological processes (e.g., vari-ations in blood oxygenation with respiration). In addition,the variability of physiological processes is likely to bedifferent in every subject, and possibly different even forthe same subject during different studies. This is a topic inits own right, and will be addressed in another work.
NOISE ALIASING
The difficulty imposed by multislice imaging is related tothe issue of critical sampling. Frequencies higher than1/(2tN), where tN is the Nyquist sampling interval (i.e.,the maximum time allowed between samples to still cor-rectly reconstruct a frequency) are not accurately recon-structed and appear at another frequency (their “alias”)
FIG. 1. Power spectrum from an activated voxel within the visualcortex. Data was collected from a single slice with a TR of .25 sec.The stimulus was a flashing checkerboard. Evident are strong spec-tral components from the activation, respiratory, and cardiac fluc-tuations.
636 Frank et al.

(see, for example, Ref. 11). Aliased power from frequencycomponents higher than the sampling bandwidth can ob-scure activations (if their spectra overlap), reducing thesignificance of the detected signal. Even if there is nooverlap, aliased noise makes estimation of the noise,which is important for determining significance, difficult.
This effect is illustrated in Fig. 2, in which the effect ofa lower sampling rate on the noise spectrum is illustratedby resampling the data collected from a single slice withTR of .25 sec (top) at every eighth time point to simulatethe data for an eight-slice acquisition with a TR of 2 sec.These multislice parameters were chosen so that the timebetween successive data collections (i.e., between slices) isthe same as in the single slice data (2 sec/8 5 .25 sec).Frequency components higher than .25 Hz are now aliasedacross the power spectrum, and are less clearly delineatedbecause the aliased peaks are broad. Note that becauseeach component of the physiological fluctuations covers arange of frequencies, the aliasing of frequencies can besomewhat subtle since a multislice experiment that criti-cally samples the nominal peak frequency may not criti-cally sample all of the frequency components in the wave-
form of fluctuations. For our previous examples of aneight-slice acquisition with a TR of 2.0 sec, a respiratoryfrequency of .25 Hz f tN 5 2 sec would just be criticallysampled. But the spread of frequencies about .25 Hz wouldmean that some frequencies are not critically sampled.These then can be aliased into the spectrum even if themain peak is not. In the data shown in Fig. 1, the respira-tory peak is at approximately .3 Hz, which corresponds toa period of t 5 1.7 sec, and so is not critically sampled inour eight-slice experiments; nor is the cardiac peak, whichis at about 1 Hz f t 5 0.5 sec.
RECOVERY OF ALIASED INFORMATION
The representation of the physiological fluctuations in thedata depend on the sampling rate: if the sampling rate isnot sufficient to critically sample the fluctuations, theywill be aliased and therefore no longer take on their truephysiological waveform or spectral properties.
Given that the frequency content of the dominant phys-iological fluctuations are much higher than that of a simpleblock design paradigm, and can therefore be removed from
FIG. 2. Top: Estimated noise spectrum from data collected from a single slice with a TR of .25 sec. Bottom: Same spectrum resampled atevery 8th time point to simulate the power spectrum for an eight-slice acquisition with the same imaging parameters. High-frequencycomponents are now aliased across the power spectrum.
Undersampled Multislice fMRI Data 637
the data if it is critically sampled, the question remains:Can anything be done if the fMRI data is collected in amultislice fashion where the sampling rate for a voxel timeseries is the TR? This TR is determined primarily by therequirements of achieving sufficient spatial coverage, andso is usually relatively long compared to the time scale ofphysiological fluctuations. As a consequence, the higher-frequency components of the time series contributed bythe physiological fluctuations are not sampled fast enoughto be accurately reconstructed.
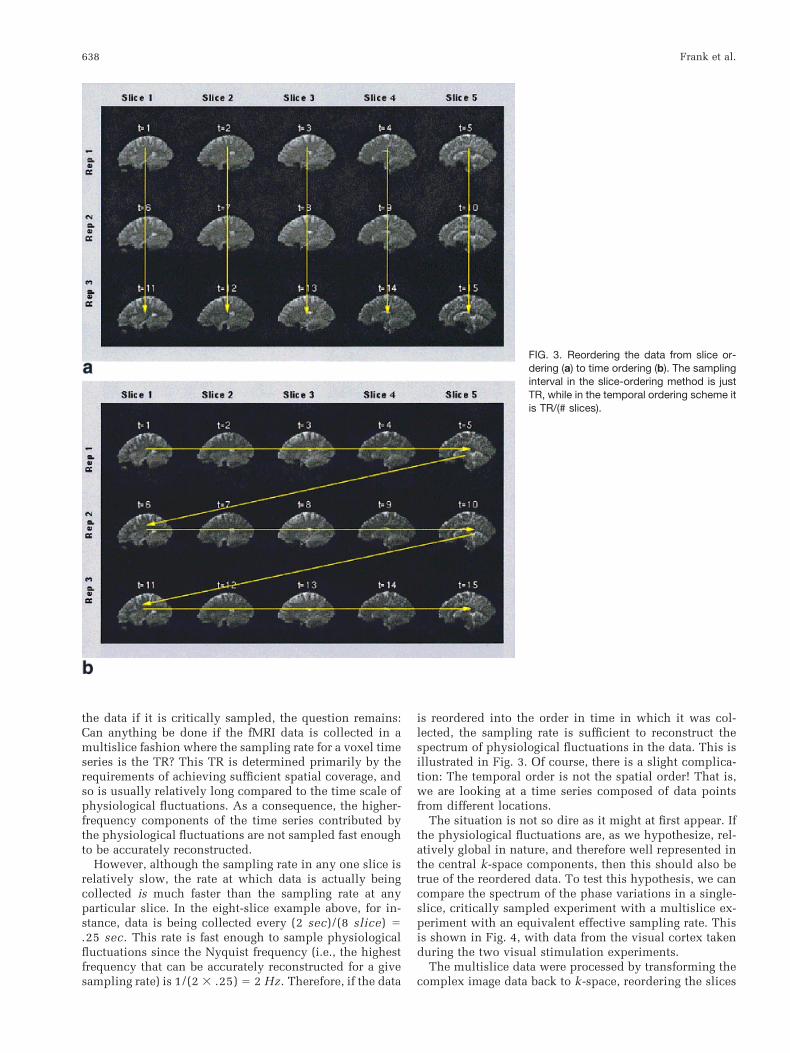
However, although the sampling rate in any one slice isrelatively slow, the rate at which data is actually beingcollected is much faster than the sampling rate at anyparticular slice. In the eight-slice example above, for in-stance, data is being collected every (2 sec)/(8 slice) 5.25 sec. This rate is fast enough to sample physiologicalfluctuations since the Nyquist frequency (i.e., the highestfrequency that can be accurately reconstructed for a givesampling rate) is 1/(2 3 .25) 5 2 Hz. Therefore, if the data
is reordered into the order in time in which it was col-lected, the sampling rate is sufficient to reconstruct thespectrum of physiological fluctuations in the data. This isillustrated in Fig. 3. Of course, there is a slight complica-tion: The temporal order is not the spatial order! That is,we are looking at a time series composed of data pointsfrom different locations.
The situation is not so dire as it might at first appear. Ifthe physiological fluctuations are, as we hypothesize, rel-atively global in nature, and therefore well represented inthe central k-space components, then this should also betrue of the reordered data. To test this hypothesis, we cancompare the spectrum of the phase variations in a single-slice, critically sampled experiment with a multislice ex-periment with an equivalent effective sampling rate. Thisis shown in Fig. 4, with data from the visual cortex takenduring the two visual stimulation experiments.
The multislice data were processed by transforming thecomplex image data back to k-space, reordering the slices
FIG. 3. Reordering the data from slice or-dering (a) to time ordering (b). The samplinginterval in the slice-ordering method is justTR, while in the temporal ordering scheme itis TR/(# slices).
638 Frank et al.

in the temporal order of acquisition, being careful to re-move the mean phase and magnitude values from eachslice so that the spectrum was not dominated by slice-to-slice variations. A single time series of the phase variationswas estimated from the time series of the phase at thecentral k-space point. Because the effective sampling ratefor the temporally reordered data is equivalent to the sin-gle slice experiment: 2 sec/(8 slices) 5 .25 sec, the timesteps in Fig. 4 are equal. The resulting phase time coursesand corresponding power spectra from both these experi-ments are seen in Fig. 4 to be remarkably similar, suggest-ing that the temporal reordering strategy can produce agood representation of the physiological fluctuations.
ESTIMATION OF PHYSIOLOGICAL FLUCTUATIONS
Since it appears from Fig. 4 that it is possible to recover“unaliased” information about the noise fluctuations fromtemporally reordered data, the next step is to use this
information to estimate these noise waveforms and removethem from the data. There are two things that we specifi-cally do not want to assume about the data: 1) Physiolog-ical fluctuations are simple sinusoids, and 2) physiologicalfluctuations are the same in each voxel time series. Both ofthese assumptions are clearly not true in fMRI data and, infact, pose a significant source of complication in the dataanalysis problem.
The k-space phase shown in Fig. 4B contains contribu-tions from several physiological noise sources, each ofwhich may vary independently from voxel to voxel. Wemust therefore estimate the contributions of the individualphysiological components. If the individual componentswere purely sinusoidal variations, they would be rela-tively straightforward to account for, as long as they arewell separated in frequency from each other and from thespectrum of the activation. Physiological waveforms arenot generally sinusoidal. Usually they are merely quasi-periodic, so that estimating these noise waveforms is a
FIG. 4. Comparison of k-space phase from single-slice and multislice data. Left: Phase time course and corresponding power spectrumfrom a single-slice experiment through the visual cortex with TR 5 .25 sec taken during visual stimulation. Right: Phase time course andcorresponding power spectrum from reordered data from an eight-slice experiment through the visual cortex with TR 5 2 sec taken duringvisual stimulation. The similarity between the spectra on the left and the right suggests that the temporal reordering strategy can producea good representation of the physiological fluctuations.
Undersampled Multislice fMRI Data 639

difficult problem in its own right, even if they were criti-cally sampled. A more complete attempt at solving thisproblem will be presented elsewhere, but for the momentthe key issue is that these waveforms have a significantspread in frequency, which produces a much broaderrange of spectral contamination than do purely sinusoidalvariations.
The scheme used in this study to estimate the wave-forms is admittedly simplistic, and its improvement iscurrently the subject of our investigation. For the present,we employ the following method: The peaks in the reor-dered k-space phase power spectrum near the nominalrespiratory and cardiac peak frequencies are automaticallydetermined and a user-specified width of frequenciesabout these peaks is extracted. In the current implementa-tion, this width was simply chosen by eye to be larger thanthe observed spread of frequencies about the noise peaks.The Fourier transforms of these individual frequencybands are used as the estimates of the individual timecourses of the physiological fluctuations.
Once these waveforms have been estimated, they mustthen be removed from the data. Now, the waveforms areestimated from the time-ordered data, so the correction tothe data is also performed on the time-ordered data. How-ever, while the waveform estimation was performed ink-space to get a globally averaged waveform estimate, thecorrection is done in the time-ordered image space, sincethat is where spatial localization is represented, and thecontribution (i.e., the amplitude) of the physiological fluc-tuations (but, by hypothesis, not the waveforms) can bequite different amongst voxels.
For this reason we do not want to simply cut out rangesof frequencies from the spectrum of the individual voxeltime courses, for this act implicitly assumes that all fre-quencies within the selected bands are artifactual. Rather,our model assumes only that there may be contributionsfrom physiological sources. We therefore want to elimi-nate the existing components of the fluctuations. Mathe-matically, this translates into projecting out the unwantedcomponents. Specifically, the projection of the data ontothe subspace spanned by the estimated waveforms is re-moved from the data: the standard least-squares proce-dure. Projecting out specified waveforms is distinctly dif-ferent from simply cutting out blocks of the Fourier spec-trum. If there is no contribution from such a fluctuation,the component projected out is essentially zero, and nocorrection is made.
The basic computational approach is fairly straightfor-ward. We use the following notation: FTl denotes Fouriertransform with respect to coordinate l, s is the time step ineach slice (i.e., repetitions of slice j are collected at timess1, s2, . . . ,sn), and t represents the true time coordinates(i.e., slice 1, repetition 1 is collected at t1; slice 2, repeti-tion 1 is collected at t2, etc), and primed coordinates( x9,y9) and (k9x,k9y) denote pixel locations in the time-reordered image and k-space, respectively, which actuallycorrespond to several true spatial or k-space locations, andIc denotes the corrected version of the data. Here we areusing the term “pixel” simply to denote locations in theimage or k-space data array. Thus:
1. Transform multislice image data I( x,y,s) to k-space:I(kx,ky,s) 5 FTxy[I( x,y,s)], reorder from slice orderto temporal order: I(kx,ky,s)3 I(k9x,k9y,t), being care-ful to remove slice-dependent means and trends.Means and trends were removed from each slice ofthe image data by fitting (in a least-squares sense) alow-order (3) polynomial to the time series in thatslice.
2. Compute time-ordered magnitude and phase-time se-ries, mk(t) and fk(t) from center k-space point.
3. Use resulting time series to find locations in fre-quency spectrum fk(v) 5 FTt[fk(t)] of peak power,being careful to avoid harmonics of the activation.Our current method finds the peak from a user-sup-plied initial guess of the location of a specified num-ber of fluctuation components, locates the sidebands,and chooses a fixed range about them.
4. Determine the time courses of the physiological fluc-tuations g(t) in the image magnitude data using thefrequencies and ranges found in the k-space data:g(t) 5 F[fk(v)] where f denotes the estimated spec-trum of the waveform, found from the location of thepeak and a given width in frequency about the peak.
5. Transform back to image space I( x9,y9,t), keepingdata in temporal order, and in each location ( x9,y9)project out estimated noise components from time-ordered original magnitude data. So at location (i, j),Ic(i, j,t) 5 I(i, j,t) 2 Pf(t)[I(i, j,t)] where Pf(t)[I] sym-bolizes the projection of the data I onto the modelfunction f. This is equivalent to reordering back intoslice order, resampling the physiological fluctuationsat the sampling rate of the slices, and projecting outthese components on a slice-by-slice basis.
6. Reorder data back into slice order: Ic(k9x,k9y,t) 3Ic( x,y,s), putting back slice-dependent means.
RESULTS
The method was tested on four normal human subjects,with approval from the Humans Subject Committee atUC–San Diego. The multislice protocol used was that de-scribed above, in which eight slices were collected at a TRof 2.0 sec for an effective sampling rate of .25 sec. The datawere first registered (IMREG, part of the AFNI suite [12]) toreduce effects due to subject motion. In Fig. 5 is shown thepower spectrum of the image space magnitude of a singlepixel reordered in time, before (top) and after (bottom)processing. The prominent respiratory peak and the tworespiratory sidebands of the cardiac fluctuation have beenvirtually eliminated. The respiratory waveform was esti-mated automatically from the multiplexed k-space phasedata. The sideband waveforms were assumed to be thesame form as the primary respiratory spectrum, and theirlocations were automatically determined since they arethe same distance (in frequency) from the center of thecardiac peak (determined from the multiplexed k-spacemagnitude data) as the primary respiratory peak is fromthe origin. The validity of these assumptions is borne outby the efficiency with which these peaks are removed. Thecurrent algorithm requires only an initial guess (withinspecified limits) at the locations of the primary respiratoryand cardiac fluctuation frequencies. The user can specify
640 Frank et al.

the number of respiratory sidebands of cardiac or cardiacsidebands of respiratory to estimate. Their location andestimation is performed automatically.
A useful way to visualize the spatial distribution of theimprovements afforded by the method is to display thedifference in voxel time series variance before and afterprocessing. As shown in Fig. 6, there are regions of signif-icant spatial extent that have been improved. These re-gions bear a close resemblance to those specified in Fig. 1,showing that the procedure has correctly extracted theknown noise components. Plotting the individual voxelvariance values before and after processing against oneanother (Fig. 7) shows that there is nearly a global decreasein image noise variance. The overall improvement re-flected in this plot is approximately 15%.
DISCUSSION
The existence of highly structured signal components dueto physiological fluctuations in fMRI time series data is asignificant complication in the detection and estimation offunctional activations. The main difficulty in multislicedata is that the sampling rate in any one slice is not
sufficient to critically sample the majority of the physio-logical fluctuations, resulting in significant power beingaliased on top of the spectral components of the activationitself. As we have demonstrated, it is possible to estimatethese fluctuations directly from the undersampled dataand reduce these contributions. If these physiological fluc-tuations are critically sampled and their spectral compo-nents do not overlap the spectrum of the activation, thenthe detection of the fMRI signal and the estimation of itsamplitude are much simpler. However, the determinationof the functional SNR is still problematic, for this requiresan estimate of the structured noise components. The oft-reported non-Gaussian nature of the noise is in large partdue to the presence of physiological fluctuations. In takingthese fluctuations into account in our current model, theremaining noise after removal of the physiological fluctu-ations (as well as trends) results in noise that is expected tobe much closer to true Gaussian noise, thereby providingstronger justification for the use of Gaussian noise modelsin data analysis performed subsequent to our correctionmethod. This is illustrated in the normal probability plotsshown in Fig. 8 for the uncorrected and corrected data inFig. 5. (In a normal probability, the data are plotted vs. a
FIG. 5. Removal of the respiratory peak and respiratory sidebands of the cardiac peak from the time-reordered data from the eight-sliceexperiment.
Undersampled Multislice fMRI Data 641

theoretical normal distribution in such a way that nor-mally distributed data forms a straight line. See, for exam-ple, Ref. 17).
The detection and estimation of physiological fluctua-tions directly from the data is important for several rea-sons. First, this allows for the retrospective correction ofpreviously acquired data. Second, it greatly simplifies theexperimental setup, since it does not require monitoringsystems necessary for direct measurement of cardiac andrespiratory fluctuations. That the fluctuations in the dataare consistent with externally monitored variations hasbeen shown (9,10). In addition, time courses from external
monitoring systems are not necessarily the most helpfuldata, since the processes by which the MR signal varies asa result of these processes is complicated and their rela-tionship to the MR signal variations is not straightforward.What is desired are estimates of the MR signal fluctuationsthemselves (9). Several investigators have utilized thephase information to estimate the physiologically inducedsignal fluctuations. Wowk et al. (10) estimated the timecourses of both respiratory and cardiac fluctuations fromthe k-space phase data in conventional imaging and usedthe estimates to correct phase errors between phase-encod-ing lines in a standard acquisition. Le and Hu (9) also usedthe phase information to retrospectively correct for phys-iologically induced fluctuations in fMRI time-series data.Recently, Glover and coworkers (13) have developed amethod by which physiological monitoring data can beused for reducing physiological fluctuations.
In the present work, we have shown that reordering thedata into the temporal order in which it was acquiredregains the temporal resolution necessary to critically sam-ple the physiological fluctuations. However, since the tem-poral order is not the spatial order, estimation of the phys-iologically induced signal fluctuations from the data is notstraightforward. The data contains gaps in the Fourierspectrum of the time series that are contaminated by thereordering process. This occurs at the harmonics of thereordering frequency. For instance, for 128 time pointscollected in each of eight slices, the reordered 1024-pointtime series will be contaminated at the frequency relatedto the reordering of the eight slices—that is, every 128thpoint. In addition, baseline inconsistencies between theslices, such as are produced by the slice-dependent trends,will widen the contaminated region about the reorderingfrequencies. It is therefore important that such slice-de-pendent trends be removed prior to reordering. Since themagnitude fluctuations produced by the activations varyamongst the slices, the resampling frequency artifacts canalso contain harmonics from the activation, which must beavoided if the activation changes are not to be reduced.
FIG. 6. Spatial maps in eight slices from a single subject of the difference in temporal variance between the pre- and postprocessed data.
FIG. 7. Plot of image variance before vs. after processing, showingthe trend towards improved image variance. Data shown are com-bined from all four subjects. The dashed line is for reference and hasa slope of 1. The solid line is the regression line through the data,showing an overall improvement of approximately 15%.
642 Frank et al.

The estimate of the respiratory waveform was shown tobe robustly found from the k-space phase. This was evi-dent by the completeness with which this component wasremoved from the time series spectrum. This is consistentwith the notion that respiratory effects really are fairlyglobal in nature, and therefore will be well represented bythe low-frequency k-space components, as well as consis-tently present in the time-series spectrum. However, theestimation and removal of the cardiac waveform was moreproblematic. Cardiac-related fluctuations are spatially fo-cal, so that their representation in the low spatial frequen-cies, as an average over all the voxels, can only vaguelyrepresent the signal in any one voxel and are thereforemore problematic to estimate from global data. Impor-tantly, however, the respiratory sidebands of the cardiacfluctuations are removed. Since these are of high fre-quency and localized in regions of cardiac fluctuations,they produce significant aliased noise in the spectrum.
Generally speaking, physiological waveforms are com-plicated since they vary in response to several physiolog-ical factors (e.g., cardiac varies with respiration, exertionlevel, etc). Since these factors may themselves producefluctuations (e.g., as does respiration), the waveforms may
be highly correlated. The most pertinent example for thepresent study is the coupling of the cardiac and respiratorywaveforms. Cardiac and respiratory waveforms vary intime, in part due to each other. This is reflected in thestrong respiratory sidebands on the cardiac peaks. Becausethe frequencies in these components vary during the ex-periment, the spectrum over the course of an experimentrepresents a combination of spectral components that ex-isted during the experiment. The relationship of thesevariations to the slice acquisition schedule will clearlyaffect the waveform in any particular slice time series. Theimprovement of the estimation of the physiological wave-forms will be an important aspect of our continuing refine-ment of this technique. However, the global nature of therespiratory waveform still allows a robust estimation of itswaveform.
Estimation of the waveforms is clearly an area that couldbe improved. In the current method, the width of thefrequency range is chosen by the user to cover the apparentwidth of the distribution of frequencies in the power spec-trum. This entire frequency band is used without modifi-cation to estimate the waveform because the shape of thesedistributions is quite complicated and not amenable to
FIG. 8. Normal probability plots (see, for example, Ref. 17) for the uncorrected and corrected data in Fig. 5. Normally distributed data fallsalong the dashed line. The corrected noise on the right plot is seen to be much closer to Gaussian.
Undersampled Multislice fMRI Data 643

modeling with some simple distribution (such as a Gauss-ian). A more proper approach (which we are pursuing) isto incorporate a physical model for the frequency spec-trum (say, a model for the cardiac pulsations based oncardiac characteristics) and estimate the parameters ofsuch a model and use this in constructing the estimatedwaveform from the spectrum centered about the primaryfrequency components.
It should also be pointed out that in the present imple-mentation, the noise components were estimated, thenprojected out of the data. More properly, one should esti-mate the noise fluctuations and use them as components ofthe signal model in the estimation of the functional acti-vation components of this signal in order to properly takethem into account in the estimation of the activation. Thisis the proper way to “remove” the noise from the data.However, it is computationally more efficient to projectthe noise out first, and is of no consequence if the spectralcomponents of the noise are well separated from those ofthe activation.
One caveat for this technique is that regular slice sam-pling intervals have been assumed. In certain applications(e.g., fMRI of the auditory system) it is beneficial to collectclustered volume multislice acquisitions (e.g., Ref. 14) thatemploy a nonuniform temporal sampling scheme. In prin-ciple, the current technique is still applicable, and in factmay be improved, as irregular sampling tends to disam-biguate aliased frequencies. However, this would require asignificantly more complex estimation scheme for fre-quency identification.
CONCLUSIONS
The primary focus of this study was to address the issue ofphysiological fluctuations that contaminate multislicefMRI time-series data. Since the sampling rate for anyparticular slice is usually long so as to accommodate sev-eral slices within the study, components of the physiolog-ical fluctuations are aliased into the spectrum of the timeseries, making estimation and removal difficult. We haveshown that it is possible to recover unaliased informationabout the respiratory-induced fluctuations, includinghigh-frequency respiratory sidebands of cardiac fluctua-tion, by viewing the data in the precise temporal order inwhich it was collected, rather than the usual spatial order.Estimates of the time courses of components of these fluc-tuations are made from the k-space phase viewed in tem-poral order, since the k-space time courses contain spec-tral components of the physiological fluctuations. Theseestimated time courses are then used as model functions tobe projected out of the temporally-ordered image magni-tude data. Although respiratory fluctuations that were su-perimposed on cardiac fluctuations (i.e., the respiratorysidebands of cardiac) were significantly reduced, cardiacfluctuations themselves were not because they are highlylocalized in space and therefore do not satisfy the “global”
nature of the artifacts upon which this technique is based.However, the presence of cardiac-related peak in the reor-dered data does suggest that our reordering techniquemight yet provide some useful information on cardiacfluctuations.
The results suggest that this method can provide a sig-nificant improvement in the functional signal-to-noise,thereby improving both the detection and significance offunctional activations. In addition, the growing sentimentthat low-frequency components are of physiological inter-est (15,16) will require a similar reduction of the aliasingof high-frequency components in order that the broad low-frequency region of the spectrum be interpretable.
REFERENCES1. Weisskoff RM, Craven KM, Savoy R, Brown E, Solo V. What’s in the
noise? In: Proceedings of the 12th Annual Meeting of the Society ofMagnetic Resonance in Medicine, New York, 1993. p 7.
2. Noll DC, Schneider W. Theory, simulation, and compensation strate-gies of physiological motion artifacts in functional MRI. In: IEEE Con-ference on Image Processing, vol 3, 1994. p 40.
3. Weisskoff RM, Craven KM, Savoy R, Brown E, Solo V. Temporal cor-relation in fMRI of the visual cortex: impact on imaging rate. In: SecondInternational Conference on Functional Mapping of the Human Brain,Boston, 1996. p 5107.
4. Aguirre GK, Zarahn E, D’Esposito M. Empirical analyses of BOLD fMRIstatistics: II. Spatially smoothed data collected under null-hypothesisand experimental conditions. NeuroImage 1997;5:199.
5. Aguirre GK, Zarahn E, D’Esposito M. Empirical analyses of BOLD fMRIstatistics: II. Spatially smoothed data collected under null-hypothesisand experimental conditions. NeuroImage 1997;5:179–197.
6. Thomas CG, Menon RS. Amplitude response and stimulus presentationfrequency response of human primary visual cortex using BOLD EPI at4T. Magn Reson Med 1998;40:203–209.
7. Biswal B, DeYoe EA, Hyde JS. Reduction of physiological fluctuationsin FMRI using digital filters. Magn Reson Med 1996;35:107–113.
8. Frank LR, Buxton RB, Wong EC. Estimation of physiological noisefluctuations from undersampled multislice fMRI data. In: Proceedingsof the 7th Annual Meeting of ISMRM, Philadelphia, 1999. p 277.
9. Le TH, Hu X. Retrospective estimation and correction of physiologicalartifacts in fMRI by direct extraction of physiological activity from MRdata. Magn Reson Med 1996;35:290–298.
10. Wowk B, McIntyre MC, Saunders JK. K-space detection and correctionof physiological artifacts in fMRI. Magn Reson Med 1998;38:1029–1034.
11. Bracewell RN. The Fourier transform and its applications, 2nd ed. NewYork: McGraw-Hill; 1986.
12. Cox RW, Jesmanowicz A, Hyde JS. A program for the analysis forfunctional magnetic resonance imaging data. Computer Vision andGraphics, 1996. Available at http://varda.biophysics.mcw.edu.
13. Glover GH, Li T-Q, Ress D. Image-based method for retrospective cor-rection of physiological motion effects in fMRI: RETROICOR. MagnReson Med 2000;44:162–167.
14. Hall DA, Summerfield A, Goncalves MS, Foster JR, Palmer AR, BowtellRW. Time-course of the auditory BOLD response to scanner noise.Magn Reson Med 2000;43:601–606.
15. Biswal BB, Hyde JS. Pixel-wise correlation of fMRI signal with lowfrequency physiological fluctuation intensity. In Proceedings of the 7thAnnual Meeting of ISMRM, Philadelphia, 1999. p 274.
16. Mayhew J, Zheng Y, Hou Y, Berwick J, Askew S, Coffey P. Low fre-quency haemodynamic and metabolic 0.1 Hz oscillations in braintissue. In Proceedings of the 7th Annual Meeting of ISMRM, Philadel-phia, 1999. p 273.
17. Chambers J, Cleveland W, Kleiner B, Tukey P. Graphical methods fordata analysis. Boston: Duxbury Press; 1983.
644 Frank et al.