Bread wheat varieties as influenced by different nitrogen levels
Upload
independentCategory
view
0download
0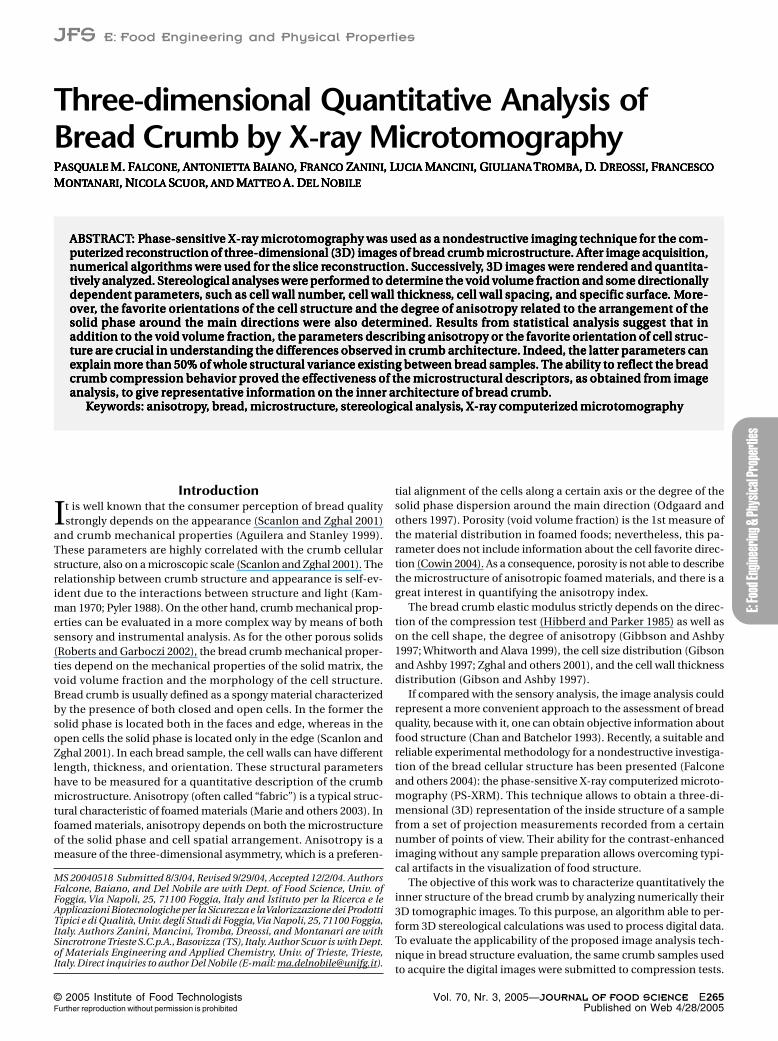
Vol. 70, Nr. 3, 2005—JOURNAL OF FOOD SCIENCE E265Published on Web 4/28/2005
© 2005 Institute of Food TechnologistsFurther reproduction without permission is prohibited
E: Fo
od En
ginee
ring &
Phys
ical P
rope
rties
JFS E: Food Engineering and Physical Properties
Three-dimensional Quantitative Analysis ofBread Crumb by X-ray MicrotomographyPPPPPASQASQASQASQASQUUUUUALEALEALEALEALE M. F M. F M. F M. F M. FALALALALALCCCCCONEONEONEONEONE, A, A, A, A, ANTNTNTNTNTONIETONIETONIETONIETONIETTTTTTAAAAA B B B B BAIANOAIANOAIANOAIANOAIANO, F, F, F, F, FRANCRANCRANCRANCRANCOOOOO Z Z Z Z ZANINIANINIANINIANINIANINI, L, L, L, L, LUCIAUCIAUCIAUCIAUCIA M M M M MANCINIANCINIANCINIANCINIANCINI, G, G, G, G, GIULIANAIULIANAIULIANAIULIANAIULIANA TTTTTRRRRROMBAOMBAOMBAOMBAOMBA, D, D, D, D, D. D. D. D. D. DREOSSIREOSSIREOSSIREOSSIREOSSI, F, F, F, F, FRANCESCRANCESCRANCESCRANCESCRANCESCOOOOO
MMMMMONTONTONTONTONTANARIANARIANARIANARIANARI, N, N, N, N, NICICICICICOLOLOLOLOLAAAAA S S S S SCUORCUORCUORCUORCUOR, , , , , ANDANDANDANDAND M M M M MAAAAATTTTTTEOTEOTEOTEOTEO A. D A. D A. D A. D A. DELELELELEL N N N N NOBILEOBILEOBILEOBILEOBILE
ABSTRAABSTRAABSTRAABSTRAABSTRACTCTCTCTCT: P: P: P: P: Phase-sensitivhase-sensitivhase-sensitivhase-sensitivhase-sensitive X-re X-re X-re X-re X-ray micray micray micray micray microtomogrotomogrotomogrotomogrotomography was used as a nondestraphy was used as a nondestraphy was used as a nondestraphy was used as a nondestraphy was used as a nondestructivuctivuctivuctivuctive imaging technique for the com-e imaging technique for the com-e imaging technique for the com-e imaging technique for the com-e imaging technique for the com-puterized reconstruction of three-dimensional (3D) images of bread crumb microstructure. After image acquisition,puterized reconstruction of three-dimensional (3D) images of bread crumb microstructure. After image acquisition,puterized reconstruction of three-dimensional (3D) images of bread crumb microstructure. After image acquisition,puterized reconstruction of three-dimensional (3D) images of bread crumb microstructure. After image acquisition,puterized reconstruction of three-dimensional (3D) images of bread crumb microstructure. After image acquisition,numernumernumernumernumerical algorical algorical algorical algorical algorithms withms withms withms withms wererererere used for the slice re used for the slice re used for the slice re used for the slice re used for the slice reconstreconstreconstreconstreconstruction. Suction. Suction. Suction. Suction. Successivuccessivuccessivuccessivuccessivelyelyelyelyely, 3D images w, 3D images w, 3D images w, 3D images w, 3D images wererererere re re re re renderenderenderenderendered and quantita-ed and quantita-ed and quantita-ed and quantita-ed and quantita-tively analyzed. Stereological analyses were performed to determine the void volume fraction and some directionallytively analyzed. Stereological analyses were performed to determine the void volume fraction and some directionallytively analyzed. Stereological analyses were performed to determine the void volume fraction and some directionallytively analyzed. Stereological analyses were performed to determine the void volume fraction and some directionallytively analyzed. Stereological analyses were performed to determine the void volume fraction and some directionallydependent pardependent pardependent pardependent pardependent parametersametersametersametersameters, such as cell wall number, such as cell wall number, such as cell wall number, such as cell wall number, such as cell wall number, cell wall thickness, cell wall thickness, cell wall thickness, cell wall thickness, cell wall thickness, cell wall spacing, and specific sur, cell wall spacing, and specific sur, cell wall spacing, and specific sur, cell wall spacing, and specific sur, cell wall spacing, and specific surfacefacefacefaceface. M. M. M. M. Mororororore-e-e-e-e-ooooovvvvvererererer, the fav, the fav, the fav, the fav, the favorororororite orite orite orite orite orientations of the cell strientations of the cell strientations of the cell strientations of the cell strientations of the cell structuructuructuructuructure and the degre and the degre and the degre and the degre and the degree of anisotree of anisotree of anisotree of anisotree of anisotropopopopopy ry ry ry ry related to the arrelated to the arrelated to the arrelated to the arrelated to the arrangement of theangement of theangement of theangement of theangement of thesolid phase around the main directions were also determined. Results from statistical analysis suggest that insolid phase around the main directions were also determined. Results from statistical analysis suggest that insolid phase around the main directions were also determined. Results from statistical analysis suggest that insolid phase around the main directions were also determined. Results from statistical analysis suggest that insolid phase around the main directions were also determined. Results from statistical analysis suggest that inaddition to the void volume fraction, the parameters describing anisotropy or the favorite orientation of cell struc-addition to the void volume fraction, the parameters describing anisotropy or the favorite orientation of cell struc-addition to the void volume fraction, the parameters describing anisotropy or the favorite orientation of cell struc-addition to the void volume fraction, the parameters describing anisotropy or the favorite orientation of cell struc-addition to the void volume fraction, the parameters describing anisotropy or the favorite orientation of cell struc-ture are crucial in understanding the differences observed in crumb architecture. Indeed, the latter parameters canture are crucial in understanding the differences observed in crumb architecture. Indeed, the latter parameters canture are crucial in understanding the differences observed in crumb architecture. Indeed, the latter parameters canture are crucial in understanding the differences observed in crumb architecture. Indeed, the latter parameters canture are crucial in understanding the differences observed in crumb architecture. Indeed, the latter parameters canexplain more than 50% of whole structural variance existing between bread samples. The ability to reflect the breadexplain more than 50% of whole structural variance existing between bread samples. The ability to reflect the breadexplain more than 50% of whole structural variance existing between bread samples. The ability to reflect the breadexplain more than 50% of whole structural variance existing between bread samples. The ability to reflect the breadexplain more than 50% of whole structural variance existing between bread samples. The ability to reflect the breadcrumb compression behavior proved the effectiveness of the microstructural descriptors, as obtained from imagecrumb compression behavior proved the effectiveness of the microstructural descriptors, as obtained from imagecrumb compression behavior proved the effectiveness of the microstructural descriptors, as obtained from imagecrumb compression behavior proved the effectiveness of the microstructural descriptors, as obtained from imagecrumb compression behavior proved the effectiveness of the microstructural descriptors, as obtained from imageanalysis, to give representative information on the inner architecture of bread crumb.analysis, to give representative information on the inner architecture of bread crumb.analysis, to give representative information on the inner architecture of bread crumb.analysis, to give representative information on the inner architecture of bread crumb.analysis, to give representative information on the inner architecture of bread crumb.
KKKKKeyworeyworeyworeyworeywords: anisotrds: anisotrds: anisotrds: anisotrds: anisotropopopopopyyyyy, br, br, br, br, bread, micread, micread, micread, micread, microstrostrostrostrostructuructuructuructuructureeeee, ster, ster, ster, ster, stereological analysiseological analysiseological analysiseological analysiseological analysis, X-r, X-r, X-r, X-r, X-ray computeray computeray computeray computeray computerizizizizized micred micred micred micred microtomogrotomogrotomogrotomogrotomographyaphyaphyaphyaphy
Introduction
It is well known that the consumer perception of bread qualitystrongly depends on the appearance (Scanlon and Zghal 2001)
and crumb mechanical properties (Aguilera and Stanley 1999).These parameters are highly correlated with the crumb cellularstructure, also on a microscopic scale (Scanlon and Zghal 2001). Therelationship between crumb structure and appearance is self-ev-ident due to the interactions between structure and light (Kam-man 1970; Pyler 1988). On the other hand, crumb mechanical prop-erties can be evaluated in a more complex way by means of bothsensory and instrumental analysis. As for the other porous solids(Roberts and Garboczi 2002), the bread crumb mechanical proper-ties depend on the mechanical properties of the solid matrix, thevoid volume fraction and the morphology of the cell structure.Bread crumb is usually defined as a spongy material characterizedby the presence of both closed and open cells. In the former thesolid phase is located both in the faces and edge, whereas in theopen cells the solid phase is located only in the edge (Scanlon andZghal 2001). In each bread sample, the cell walls can have differentlength, thickness, and orientation. These structural parametershave to be measured for a quantitative description of the crumbmicrostructure. Anisotropy (often called “fabric”) is a typical struc-tural characteristic of foamed materials (Marie and others 2003). Infoamed materials, anisotropy depends on both the microstructureof the solid phase and cell spatial arrangement. Anisotropy is ameasure of the three-dimensional asymmetry, which is a preferen-
tial alignment of the cells along a certain axis or the degree of thesolid phase dispersion around the main direction (Odgaard andothers 1997). Porosity (void volume fraction) is the 1st measure ofthe material distribution in foamed foods; nevertheless, this pa-rameter does not include information about the cell favorite direc-tion (Cowin 2004). As a consequence, porosity is not able to describethe microstructure of anisotropic foamed materials, and there is agreat interest in quantifying the anisotropy index.
The bread crumb elastic modulus strictly depends on the direc-tion of the compression test (Hibberd and Parker 1985) as well ason the cell shape, the degree of anisotropy (Gibbson and Ashby1997; Whitworth and Alava 1999), the cell size distribution (Gibsonand Ashby 1997; Zghal and others 2001), and the cell wall thicknessdistribution (Gibson and Ashby 1997).
If compared with the sensory analysis, the image analysis couldrepresent a more convenient approach to the assessment of breadquality, because with it, one can obtain objective information aboutfood structure (Chan and Batchelor 1993). Recently, a suitable andreliable experimental methodology for a nondestructive investiga-tion of the bread cellular structure has been presented (Falconeand others 2004): the phase-sensitive X-ray computerized microto-mography (PS-XRM). This technique allows to obtain a three-di-mensional (3D) representation of the inside structure of a samplefrom a set of projection measurements recorded from a certainnumber of points of view. Their ability for the contrast-enhancedimaging without any sample preparation allows overcoming typi-cal artifacts in the visualization of food structure.
The objective of this work was to characterize quantitatively theinner structure of the bread crumb by analyzing numerically their3D tomographic images. To this purpose, an algorithm able to per-form 3D stereological calculations was used to process digital data.To evaluate the applicability of the proposed image analysis tech-nique in bread structure evaluation, the same crumb samples usedto acquire the digital images were submitted to compression tests.
MS 20040518 Submitted 8/3/04, Revised 9/29/04, Accepted 12/2/04. AuthorsFalcone, Baiano, and Del Nobile are with Dept. of Food Science, Univ. ofFoggia, Via Napoli, 25, 71100 Foggia, Italy and Istituto per la Ricerca e leApplicazioni Biotecnologiche per la Sicurezza e la Valorizzazione dei ProdottiTipici e di Qualità, Univ. degli Studi di Foggia, Via Napoli, 25, 71100 Foggia,Italy. Authors Zanini, Mancini, Tromba, Dreossi, and Montanari are withSincrotrone Trieste S.C.p.A., Basovizza (TS), Italy. Author Scuor is with Dept.of Materials Engineering and Applied Chemistry, Univ. of Trieste, Trieste,Italy. Direct inquiries to author Del Nobile (E-mail: [email protected]).
E266 JOURNAL OF FOOD SCIENCE—Vol. 70, Nr. 3, 2005 URLs and E-mail addresses are active links at www.ift.org
E: Food Engineering & Physical Properties
Analysis of bread crumb microstructure . . .
Results from mechanical tests were compared with those from im-age analysis.
Material and Methods
Samples choiceSamples choiceSamples choiceSamples choiceSamples choiceTwo crumb samples, 25 mm height, 25 mm width, and 12 mm
thickness (they will be henceforth called “sample 1” and “sample2”), were cut from the slice of a commercial loaf of white pan bread.The advantage of this choice is that bread samples have an initialmoisture content that is practically the same. Indeed, mechanicalbehavior of bread crumb strictly depends on both the moisturecontent in solid phase and cell architecture.
Data collectionData collectionData collectionData collectionData collectionThe sample image acquisition was carried out by means of PS-
XRM technique at the SYRMEP line (SYnchrotron Radiation forMEdical Physics) of the Elettra Laboratory (Trieste, Italy).
Each sample was hermetically closed in a Plexiglas tube to avoiddehydration, mounted on the rotation stage, and analyzed bymeans of synchrotron radiation for the image acquisition. The ex-perimental conditions were optimized to enhance both the con-trast and resolution according to Falcone and others (2004). In par-ticular, the distance sample-detector was 200 mm, the radiationintensity 12 keV, and the exposure time 1 s. For each sample, 1440radiographs were acquired for equally spaced rotation angles overa total rotation of 180°.
Once the scan data were collected, the slices (cross-sections) ofeach sample were mathematically reconstructed and saved in a 32-bit TIFF format by means of a set of routines written with the inter-active data language (IDL) and based on the back-projection pro-cedure (Montanari 2003). The reconstructed field of view for themicrotomographic images was 28 × 28 × 28 mm, and the nominalresolution was 14 �m along each edge of the voxels in the 3D ar-rays. The reconstructed images were then processed using theImageJ software (ver.1.29, NIH 2003) to render the bread micro-structure as two-dimensional (2D) stacks and 3D images.
Image processingImage processingImage processingImage processingImage processingAll the images were reduced from a 32-bit to an 8-bit format: this
step was accomplished by adjusting the brightness level so that thehistograms were uniformly distributed within 256 gray scale. In thisway, the final density of the digital information was equal to 714.48pixels per cm.
VVVVVolumes of interolumes of interolumes of interolumes of interolumes of interest (est (est (est (est (VVVVVOIOIOIOIOIs)s)s)s)s)A systematic volume of interest (VOI) selection method was
used to extract cubic volumes from the reconstructed microtomo-graphic images. With this aim the ImageJ software (version 1.29,NIH [2003]) was used to select the square cross-sections and, lateron, to extract the related cubic volumes within the original 3D ar-rays. A macro command created by prerecording a set of processingoperations allowed random extraction of sections from the slices.
Crumb cell segmentationCrumb cell segmentationCrumb cell segmentationCrumb cell segmentationCrumb cell segmentationBefore calculating the structural indices, a segmentation process
based on the threshold-value method was carried out (Falcone andothers 2004). The segregation of the gas and solid phases was sim-ply obtained by using a single threshold value because the graylevel distribution is represented, for each microtomographic imag-es, by a bimodal-histogram. The optimum threshold values weredetermined on the entire set of the digital data in 2D stacks byapplying an iterative cluster analysis, based on the k means algo-
rithm (k = 2) (JMP v. 4.0, SAS Inst. Inc., Cary, N.C., USA). The seg-mentation process converted the images into a binary format thatallowed quantification of the structural indices.
Image analysis of the crumb anisotropyImage analysis of the crumb anisotropyImage analysis of the crumb anisotropyImage analysis of the crumb anisotropyImage analysis of the crumb anisotropyAny current method suitable for performing the anisotropy anal-
ysis from images consists in a numerical approach based on thestereological calculus. The 1st step consisted in obtaining somedirection-dependent measurements (basic quantities) by probingthe segmented images by means of appropriate volumetric array(3D testing sphere) of parallel test lines. According to Inglis andPietruszckak (2003), the directional data were used to derive ananisotropy descriptor, that is, the mean intercept length vectors(MILv). The 2nd step consisted in developing a 3D distributionfunction useful for the visualization and interpretation of the abovefabric descriptor. With this aim, a multivariable linear least squarefitting technique was used to fit an ellipsoid to the MILv data. Final-ly, a MIL tensor based on the ellipsoid coefficients was defined ac-cording to Harringan and Mann (1984), and their eigenvalues andeigenvectors were determined to derive some derivative quantitiesrelated to the anisotropy and favorite orientations of cell structure.
Stereological analysis of bread images determined the followingstructural descriptors: standard morphological indices of thecrumb microstructure such as the porosity (expressed as void vol-ume fraction), cell wall thickness, number of cell walls and specificcell surface; anisotropy descriptors of the cellular structure such asthe isotropic index, the elongation index, relative degrees of anisot-ropy, and the fractional anisotropy. The isotropic index representsthe degree of randomization of cell wall orientation and describesthe degree of deviation of 3D distribution function of MILv from aspherical shape. The elongation index and the relative degrees ofanisotropy represent the degree of dispersion of the solid phasearound the preferential orientation of the crumb structure. Thefractional anisotropy is a more complex index that takes into ac-count both the isotropic index and elongation index.
The above-mentioned indices were obtained from 3D images.The porosity was also calculated on the bi-dimensional images byusing the ImageJ software.
The structural descriptors were determined by applying a suit-able numerical procedure. It consisted in the adaptation of the “fab-ric tensor model” proposed by Harringan and Mann (1984). Bymodifying an algorithm provided by Hipp and others (1996), theanisotropy indices were automatically computed for each selectedVOI. The original algorithm has already been applied to otherspongy materials (Hipp and others 1996; Simmons and Hipp 1997),and it is available from the site: http://www.kin.ucalgary.ca/isb.Morphological parameters were calculated on the basis of a parallelplate model, according to which the solid phase is made of cell wallsinterconnecting pores; the cell walls have parallel sides (some ofthem are open whereas other ones are closed), and the solid phaseis unevenly distributed both in the faces and the edges. As reportedin literature, this is the most suitable physical model for the repre-sentation of the bread crumb structure (Gibson and Ashby 1982).
All structure descriptors were calculated by using the equationslisted in Table 1.
Statistical analysisStatistical analysisStatistical analysisStatistical analysisStatistical analysisThe t test was performed to assess the significance of the differ-
ences detected between the considered samples. The STATISTICA6.0 software (Stat Soft Inc. 1984-2001, Tulsa, Okla., U.S.A.) was used.
Furthermore, principal component analysis (PCA) was per-formed by using the above-mentioned software to cluster thestructure descriptors in a reduced number of new variables as a

Vol. 70, Nr. 3, 2005—JOURNAL OF FOOD SCIENCE E267URLs and E-mail addresses are active links at www.ift.org
E: Fo
od En
ginee
ring &
Phys
ical P
rope
rties
Analysis of bread crumb microstructure . . .
function of their ability to describe the variance in the crumb struc-ture. In this way, it was possible to characterize the structure de-scriptors that better discriminated the examined bread samples. Tothis aim, the raw data were transformed in a correlations matrix.The use of the correlation matrix allowed standardization of thevariance of raw data that were expressed on different scales. A 3-factor rotation based strategy was performed to optimize PCA.
Finally, the classification analysis was used as a classificationtechnique, so that the relations among the original variables andthe VOIs were highlighted by plotting them in a 2D factor planeformed by pairs of principal components chosen from the 3 princi-pal components.
Determination of the elastic modulusDetermination of the elastic modulusDetermination of the elastic modulusDetermination of the elastic modulusDetermination of the elastic modulusAfter the image acquisition, the crumb samples were submitted
to destructive compression tests by using a Universal Testing Ma-chine (Instron mod. 4301, maximum load 100 N) to obtain the
stress-strain curves. Because both used samples have practicallythe same moisture content just as the mechanical tests were run,their different mechanical behaviors have to be attributed only totheir different cell architecture.
Compression tests were carried out by using a cylindrical probeat a crosshead speed of 10 mm/min. The elastic modulus could beevaluated from the initial slope of the stress-strain curve. However,because the crumb surfaces are not perfectly parallel, the estima-tion of the storage modulus is generally affected by an error thatmight be quite significant. For this reason, a mathematical modelcapable of describing the entire stress-strain curve was used (DelNobile and others 2003):
(1)
where � is the engineering strain, that is, the absolute deforma-tion divided by the initial height of the sample, � is the engineer-ing stress, EC is the elastic modulus, and Ki are some constants andhave to be regarded as fitting parameters. The goodness of fit wasevaluated by means of the relative percent difference, or mean
relative deviation modulus (Boquet and others 1978), accordingto the following expression:
(2)
where N is the number of observations, Mp the predicted values,and ,the experimental values.
Results and Discussion
Figure 1 is a picture of one of the slices of the white pan breadused in this investigation. To evaluate the internal structure of
bread crumb, 3D images, and stress-strain data were obtained andanalyzed. The adopted strategy includes (1) nondestructive imag-ing of crumb samples by means of the PS-XRM technique; (2) eval-uation of the effectiveness in data processing of a suitable numer-ical procedure able to perform stereological calculations; (3) imageanalysis of the acquired 3D images with the aim of determining thevoid volume fraction, cell wall number, cell wall thickness, cell wallspacing, specific surface, favorite orientations of the cell structure,and the degree of anisotropy of the solid phase around the main di-rections; (4) statistical analysis of the results from image analysis;(5) compression tests of the same bread samples used for image ac-
Table 1—Mathematical definition of both the crumb mor-phology and anisotropy descriptors as obtained by stereo-logical calculations
Symbol Unita Equation
Morphological descriptors
P (*) b
W_N mm–1
W_Th mm
W_Sp mm
SS mm2/mm3
Fabric descriptors
PrinMILi (*)
Is_Ix (*)
El_Ix (*)
DA (*)
DA1 (*)
DA2 (*)
DA3 (*)
FA (*)
a(*) indicates they are nondimensional parameters.bSv is the number of voxels corresponding to the solid phase within 3Dimage, and Tv is the total number of voxels within the same volume.
Figure 1—Slice of white pan bread used in the experiment
E268 JOURNAL OF FOOD SCIENCE—Vol. 70, Nr. 3, 2005 URLs and E-mail addresses are active links at www.ift.org
E: Food Engineering & Physical Properties
Analysis of bread crumb microstructure . . .
quisition; and (6) analysis of the mechanical properties at contin-uum level as a function of their morphological characteristics.
In the following, each step in bread evaluation after image ac-quisition is presented.
Evaluation of computer codeEvaluation of computer codeEvaluation of computer codeEvaluation of computer codeEvaluation of computer codeability to calculate the porosityability to calculate the porosityability to calculate the porosityability to calculate the porosityability to calculate the porosity
To assess the effectiveness of the numerical procedure that wasused to correctly quantify the structural descriptors from images, avalidation test was carried out. Porosity was calculated on eachcross-section of a 400 × 400–pixel 2D stack related to sample 1 byusing ImageJ software and also on the corresponding 400 × 400 ×400–pixel VOI by using our computer code. The 2 porosity levelswere then statistically compared by performing a t test. As can beinferred from results (data not shown), the mean value of the poros-ity calculated by using ImageJ software on the 2D stacks did notyield statistically different (P < 0.05) results from those calculatedon the corresponding 3D array by using our algorithm, suggestingthat the proposed numerical algorithm can be used for further ap-plications.
Data processingData processingData processingData processingData processingDue to the inability for the currently available software to process
digital arrays larger than 1 Gb, structural descriptors and their vari-ation in bread images were evaluated by processing small VOIsextracted from the reconstructed 3D arrays.
To evaluate the accuracy of the used methodology to derive rep-resentative information of a given volume from different sub-vol-umes extracted from it, a validation test was carried out based on astatistical approach. A 400 × 400 × 400–pixel VOI (VOI400) wascropped from the original reconstructed volumes for each crumbsample. Then sixteen 100 × 100 × 100–pixel sub-volumes (VOI100)were extracted from each VOI400. All VOIs were processed to calculatethe structural indices and their variations within each VOI400. Figure2a and 3a show the reconstructed 2D images (XRM) of a cross-sec-tions of VOIs400 corresponding to sample 1 and sample 2, respective-ly. These cross sections had a 400 pixel-side. In Figure 2a and 3d, thesubdivision in smaller cross-sections having a 100 pixel-side arereported. Figure 2b and 3b show the 3D views of VOIs400 renderedwith 481 cross-sections of the investigated bread images. As onewould expect, the 2 bread samples show an apparently similar po-rous structure. Nevertheless, the effective void volume fractionresult is equal to 0.884 ± 0.058 and 0.743 ± 0.012 for sample 1 andsample 2, respectively. A summary of the descriptive statistic of themorphological descriptors for VOI400 and VOI100 related to sample 1is reported in Table 2. Results demonstrated the effectiveness ofthe proposed approach to quantify structural indices. In otherwords, the evaluation of the structural descriptors made on a cer-tain volume gives the same results obtained by processing differ-ent sub-volumes extracted from it. Similar results were obtained onsample 2 (data not shown). As a consequence, there are possibili-ties to derive representative information on internal 3D structureof a whole crumb slice or bread loaf by processing a set of sub-vol-umes extracted from it.
Relationship between the 2 breadRelationship between the 2 breadRelationship between the 2 breadRelationship between the 2 breadRelationship between the 2 breadsamples in terms of structuresamples in terms of structuresamples in terms of structuresamples in terms of structuresamples in terms of structure
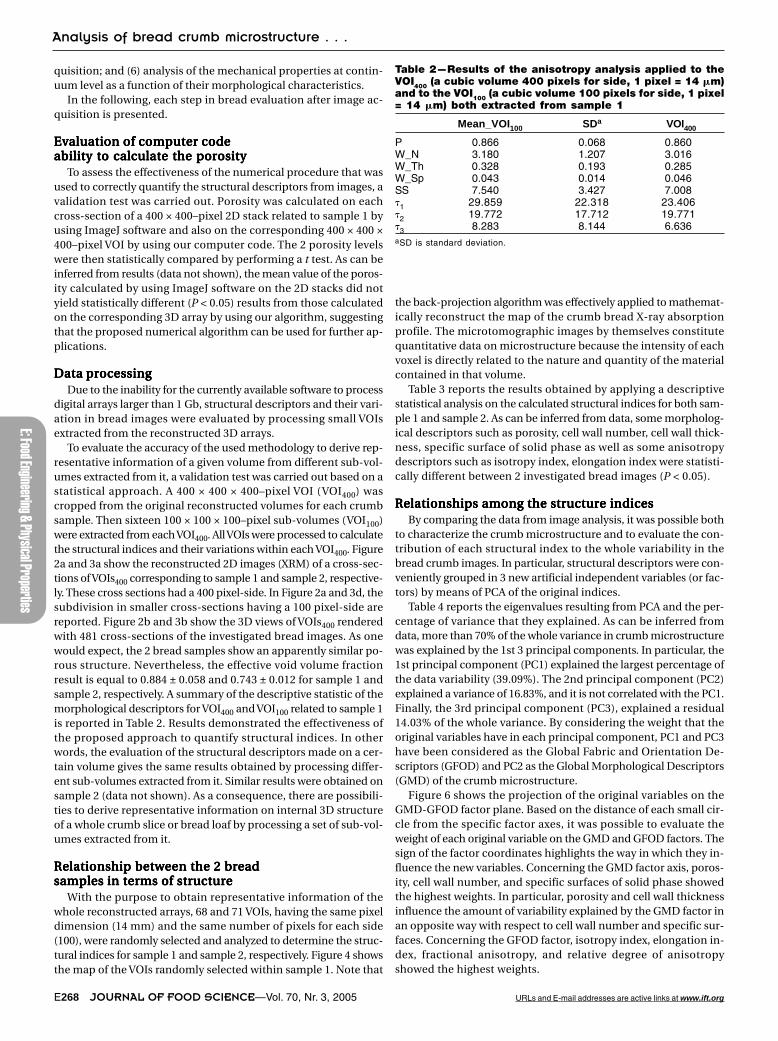
With the purpose to obtain representative information of thewhole reconstructed arrays, 68 and 71 VOIs, having the same pixeldimension (14 mm) and the same number of pixels for each side(100), were randomly selected and analyzed to determine the struc-tural indices for sample 1 and sample 2, respectively. Figure 4 showsthe map of the VOIs randomly selected within sample 1. Note that
the back-projection algorithm was effectively applied to mathemat-ically reconstruct the map of the crumb bread X-ray absorptionprofile. The microtomographic images by themselves constitutequantitative data on microstructure because the intensity of eachvoxel is directly related to the nature and quantity of the materialcontained in that volume.
Table 3 reports the results obtained by applying a descriptivestatistical analysis on the calculated structural indices for both sam-ple 1 and sample 2. As can be inferred from data, some morpholog-ical descriptors such as porosity, cell wall number, cell wall thick-ness, specific surface of solid phase as well as some anisotropydescriptors such as isotropy index, elongation index were statisti-cally different between 2 investigated bread images (P < 0.05).
Relationships among the structure indicesRelationships among the structure indicesRelationships among the structure indicesRelationships among the structure indicesRelationships among the structure indicesBy comparing the data from image analysis, it was possible both
to characterize the crumb microstructure and to evaluate the con-tribution of each structural index to the whole variability in thebread crumb images. In particular, structural descriptors were con-veniently grouped in 3 new artificial independent variables (or fac-tors) by means of PCA of the original indices.
Table 4 reports the eigenvalues resulting from PCA and the per-centage of variance that they explained. As can be inferred fromdata, more than 70% of the whole variance in crumb microstructurewas explained by the 1st 3 principal components. In particular, the1st principal component (PC1) explained the largest percentage ofthe data variability (39.09%). The 2nd principal component (PC2)explained a variance of 16.83%, and it is not correlated with the PC1.Finally, the 3rd principal component (PC3), explained a residual14.03% of the whole variance. By considering the weight that theoriginal variables have in each principal component, PC1 and PC3have been considered as the Global Fabric and Orientation De-scriptors (GFOD) and PC2 as the Global Morphological Descriptors(GMD) of the crumb microstructure.
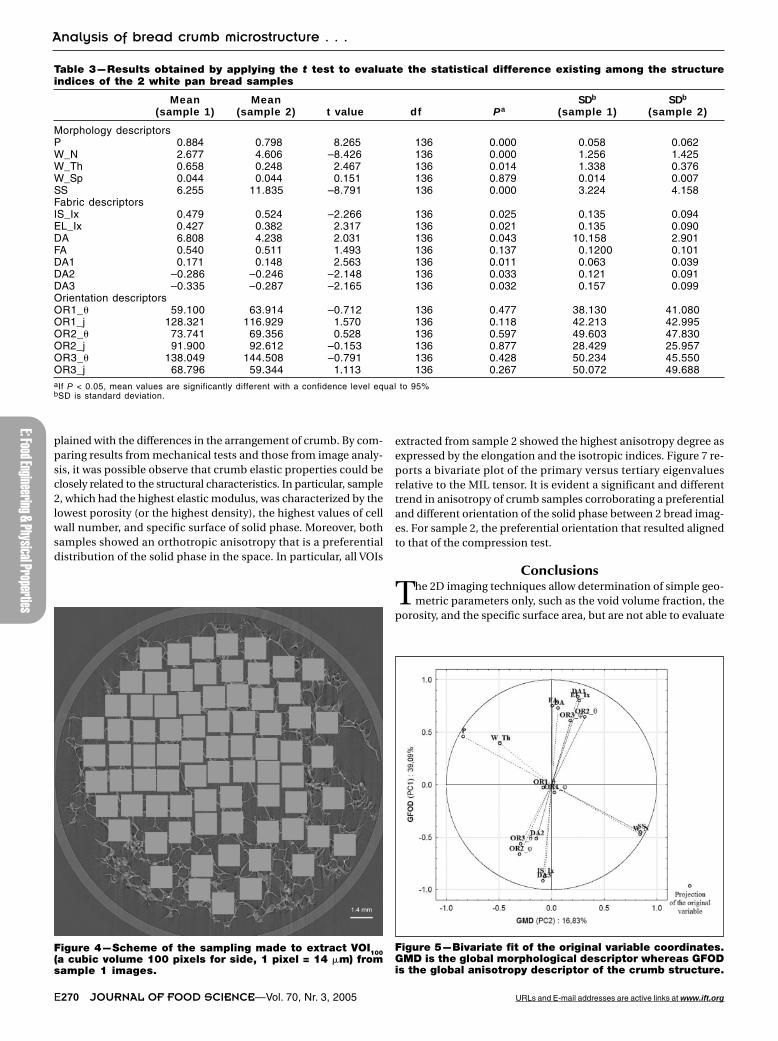
Figure 6 shows the projection of the original variables on theGMD-GFOD factor plane. Based on the distance of each small cir-cle from the specific factor axes, it was possible to evaluate theweight of each original variable on the GMD and GFOD factors. Thesign of the factor coordinates highlights the way in which they in-fluence the new variables. Concerning the GMD factor axis, poros-ity, cell wall number, and specific surfaces of solid phase showedthe highest weights. In particular, porosity and cell wall thicknessinfluence the amount of variability explained by the GMD factor inan opposite way with respect to cell wall number and specific sur-faces. Concerning the GFOD factor, isotropy index, elongation in-dex, fractional anisotropy, and relative degree of anisotropyshowed the highest weights.
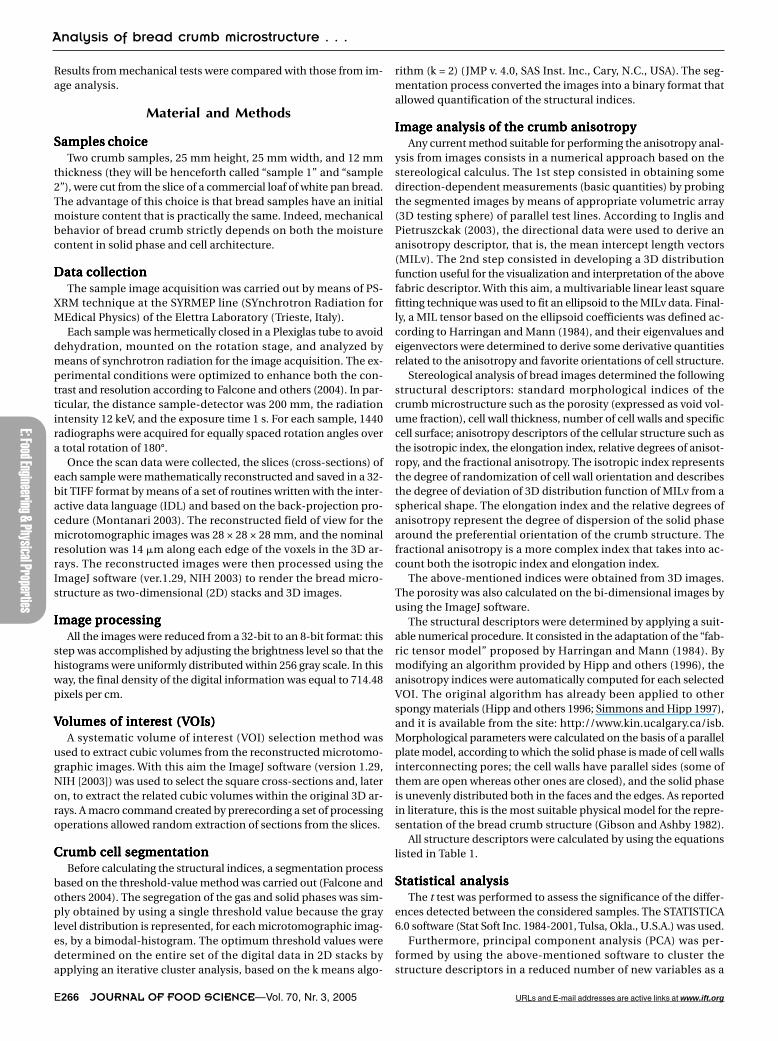
Table 2—Results of the anisotropy analysis applied to theVOI400 (a cubic volume 400 pixels for side, 1 pixel = 14 �m)and to the VOI100 (a cubic volume 100 pixels for side, 1 pixel= 14 �m) both extracted from sample 1
Mean_VOI100 SDa VOI400
P 0.866 0.068 0.860W_N 3.180 1.207 3.016W_Th 0.328 0.193 0.285W_Sp 0.043 0.014 0.046SS 7.540 3.427 7.008�1 29.859 22.318 23.406�2 19.772 17.712 19.771�3 8.283 8.144 6.636aSD is standard deviation.

Vol. 70, Nr. 3, 2005—JOURNAL OF FOOD SCIENCE E269URLs and E-mail addresses are active links at www.ift.org
E: Fo
od En
ginee
ring &
Phys
ical P
rope
rties
Analysis of bread crumb microstructure . . .
It was evident that the examined VOIs100 were better discrimi-nated by the GFOD factor and, as a consequence, the anisotropyand the orientation original descriptors must be evaluated to care-fully characterize the crumb structure.
Relationships between structure indicesRelationships between structure indicesRelationships between structure indicesRelationships between structure indicesRelationships between structure indicesand mechanical propertiesand mechanical propertiesand mechanical propertiesand mechanical propertiesand mechanical properties
Figure 6 shows the stress-strain data recorded during the com-pression tests performed on the 2 crumb samples. Equation 1 was
fitted to the stress-strain data to evaluate the values of model’sparameters; the results are listed in Table 5. The calculated values
of are 5.40 and 9.26 for sample 1 and sample 2, respectively, sug-gesting that the proposed model satisfactorily fits the data. As canbe inferred from the data listed in Table 5, there is a statisticallysignificant difference (P < 0.01) between the 2 sets of fitting param-eters including the elastic modulus.
Because the moisture content was practically the same for the 2crumb samples, the different mechanical behavior can be ex-
Figure 2—(a) Reconstructed XRM image of a cross-sectionof the VOI400 (a cubic volume 400 pixels for side, 1 pixel =14 �m) extracted from sample 1. In evidence, there is thegrid used to extract subvolumes of interest (100 pixels forside). (b) XRM 3D image of the VOI400 extracted from sample1, rendered with 481 bi-dimensional cross-sections hav-ing a 14-�m thickness. The threshold value used for thecell segmentation was equal to 196.
Figure 3—(a) Reconstructed XRM image of a cross sec-tion of the VOI400 (a cubic volume 400 pixels for side, 1 pixel= 14 �m) extracted from sample 2. In evidence, there isthe grid used to extract subvolumes of interest (100 pixelsfor side). (b) XRM 3D image of the VOI400 extracted fromsample 2, rendered with 481 bi-dimensional cross-sectionshaving a 14-�m thickness. The threshold value used forthe cell segmentation was equal to 196.
E270 JOURNAL OF FOOD SCIENCE—Vol. 70, Nr. 3, 2005 URLs and E-mail addresses are active links at www.ift.org
E: Food Engineering & Physical Properties
Analysis of bread crumb microstructure . . .
plained with the differences in the arrangement of crumb. By com-paring results from mechanical tests and those from image analy-sis, it was possible observe that crumb elastic properties could beclosely related to the structural characteristics. In particular, sample2, which had the highest elastic modulus, was characterized by thelowest porosity (or the highest density), the highest values of cellwall number, and specific surface of solid phase. Moreover, bothsamples showed an orthotropic anisotropy that is a preferentialdistribution of the solid phase in the space. In particular, all VOIs
extracted from sample 2 showed the highest anisotropy degree asexpressed by the elongation and the isotropic indices. Figure 7 re-ports a bivariate plot of the primary versus tertiary eigenvaluesrelative to the MIL tensor. It is evident a significant and differenttrend in anisotropy of crumb samples corroborating a preferentialand different orientation of the solid phase between 2 bread imag-es. For sample 2, the preferential orientation that resulted alignedto that of the compression test.
Conclusions
The 2D imaging techniques allow determination of simple geo-metric parameters only, such as the void volume fraction, the
porosity, and the specific surface area, but are not able to evaluate
Table 3—Results obtained by applying the t test to evaluate the statistical difference existing among the structureindices of the 2 white pan bread samples
Mean Mean SDb SDb
(sample 1) (sample 2) t value df Pa (sample 1) (sample 2)
Morphology descriptorsP 0.884 0.798 8.265 136 0.000 0.058 0.062W_N 2.677 4.606 –8.426 136 0.000 1.256 1.425W_Th 0.658 0.248 2.467 136 0.014 1.338 0.376W_Sp 0.044 0.044 0.151 136 0.879 0.014 0.007SS 6.255 11.835 –8.791 136 0.000 3.224 4.158Fabric descriptorsIS_Ix 0.479 0.524 –2.266 136 0.025 0.135 0.094EL_Ix 0.427 0.382 2.317 136 0.021 0.135 0.090DA 6.808 4.238 2.031 136 0.043 10.158 2.901FA 0.540 0.511 1.493 136 0.137 0.1200 0.101DA1 0.171 0.148 2.563 136 0.011 0.063 0.039DA2 –0.286 –0.246 –2.148 136 0.033 0.121 0.091DA3 –0.335 –0.287 –2.165 136 0.032 0.157 0.099Orientation descriptorsOR1_� 59.100 63.914 –0.712 136 0.477 38.130 41.080OR1_j 128.321 116.929 1.570 136 0.118 42.213 42.995OR2_� 73.741 69.356 0.528 136 0.597 49.603 47.830OR2_j 91.900 92.612 –0.153 136 0.877 28.429 25.957OR3_� 138.049 144.508 –0.791 136 0.428 50.234 45.550OR3_j 68.796 59.344 1.113 136 0.267 50.072 49.688aIf P < 0.05, mean values are significantly different with a confidence level equal to 95%bSD is standard deviation.
Figure 4—Scheme of the sampling made to extract VOI100(a cubic volume 100 pixels for side, 1 pixel = 14 �m) fromsample 1 images.
Figure 5—Bivariate fit of the original variable coordinates.GMD is the global morphological descriptor whereas GFODis the global anisotropy descriptor of the crumb structure.

Vol. 70, Nr. 3, 2005—JOURNAL OF FOOD SCIENCE E271URLs and E-mail addresses are active links at www.ift.org
E: Fo
od En
ginee
ring &
Phys
ical P
rope
rties
Analysis of bread crumb microstructure . . .
3D information, such as the anisotropy indices of inner structure.The 3D analysis represents a new approach to the study of thefoamed food structure. In addition to the crumb porosity, some di-rectionally dependent parameters strictly influenced the mechan-ical behavior of the bread crumb. The proposed numerical proce-dure effectively allows determination of the void volume fraction,some anisotropy descriptors, and the preferential orientation of thecellular structure. A quantification of these additional 3 dimension-al indices is necessary to characterize the crumb microstructure. Theanisotropy and favorite orientation descriptors explain at least the53.12% of whole structural variance. Moreover, as can be inferredfrom the stress-strain data, all structural parameters change consis-tently with the mechanical behavior of samples.
These findings indicate that there are possibilities to find appli-cation for the proposed methodology to evaluate the bread micro-
structure trough image analysis. As for the other porous materials,an interesting long-term perspective of the 3D imaging of foamedfoods is the possibility of predicting some functional characteristics(elastic properties, for example) directly from their structure, bymeans of the finite element analysis of the digital arrays for example.
List of symbolsNumber of solid voxels. It corresponds to the solid phase
(crumb) within the 3D testing sphere used in thestereological calculus.
Number of void voxels. It corresponds to the void phase(air) within the 3D testing sphere.
Total number of voxels. It was calculated by summing
and .Crumb density (solid volume fraction). It was calculated
as ratio between and .P Crumb porosity (void volume fraction)W_N Cell wall numberW_Th Cell wall thicknessW_Sp Cell wall spacingSS Specific surface. It is the solid phase surface per unit vol-
ume of crumb.�I Sampling directions of 3D testing sphere used in stereo-
logical calculus.
Table 4—Eigenvalues of the correlation matrix and resultsof the PCA analysis applied to the microstructure descrip-tors
% Cumulative% Total Cumulative explained
Eigenvalue variance eigenvalue variance
1 6.6460 39.0946 6.6460 39.09432 2.8612 16.8309 9.5073 55.92533 2.3857 14.0338 11.8931 70.05934 1.8110 10.6530 13.7041 80.61225 1.1595 6.8209 14.8636 87.43346 0.6644 3.9084 15.5281 91.34187 0.4535 2.6679 15.9816 94.00978 0.4251 2.5008 16.4068 96.51069 0.2305 1.3562 16.6373 97.866810 0.1295 0.7617 16.7668 98.628611 0.0955 0.5620 16.8624 99.190612 0.0538 0.3167 16.9162 99.507413 0.0381 0.2245 16.9544 99.732014 0.0295 0.1737 16.9839 99.905815 0.0123 0.0724 16.9963 99.978216 0.0027 0.0161 16.9990 99.994317 0.0009 0.0056 17.0000 100.0000
Table 5—Results of fit performed on stress-strain dataa
Para-meter Sample 1 Sample 2 Pb
EC [Pa] 3.23 × 10⁵ 6.43 × 10⁵ <0.0001[2.96 × 10⁵, 3.50 × 10⁵] [6.06 × 10⁵, 6.81 × 10⁵]
K1 2.60 6.46 <0.0001[2.05, 3.11] [6.12, 6.76]
K2 –1.35 –2.71 <0.0001[–1.65, –0.978] [–2.79, –2.61]
K3 7.76 × 10⁻³ 1.35 × 10⁻² <0.0001[6.64 × 10⁻³, 9.71 × 10⁻³] [1.27 × 10⁻², 1.4 × 10⁻²]
K4 1.23 × 10⁷ 1.68 × 10⁷ <0.0001[1.09 × 10⁷, 1.40 × 10⁷] [1.62 × 10⁷, 1.75 × 10⁷]
aThe values in brackets represent the confidence interval, which wascalculated as mean ± 1.96 × SE (where SE is the standard error).bIf P < 0.05, mean values are significantly different with a confidence levelequal to 95%.
Figure 6—Stress-strain curves showing the observed andcalculated mechanical behavior of the sample 1 andsample 2 under the compression tests. �, sample 1; �,sample 2; ——, best fit of Eq. 1 to the sample 1 data; – – ––, best fit of Eq. 1 to the sample 2 data.
Figure 7—Trend in the anisotropy degree of the VOIs withinsample 1 (red line) and within sample 2 (blue line).
E272 JOURNAL OF FOOD SCIENCE—Vol. 70, Nr. 3, 2005 URLs and E-mail addresses are active links at www.ift.org
E: Food Engineering & Physical Properties
Analysis of bread crumb microstructure . . .
N(�i) Number of interfaces between solid and void phase alongthe �i within the 3D testing sphere. This parameter is adirectionally dependent basic quantity obtained fromthe stereological analysis, and it was calculated as thenumber of intersections between parallel test lines andsolid phase as represented in digital arrays.
L Total length of test lines within the 3D testing sphere.This parameter is not a directionally dependent basicquantity.
�1 Primary eigenvalue of the MIL tensor. This parameter isrelated to the primary axis magnitude of the ellipsoidused to describe the 3 dimensional distribution of thesolid phase in the bread images.
�2 Secondary eigenvalue of the MIL tensor. This parameteris related to the secondary axis magnitude of the ellip-soid.
�3 Tertiary eigenvalue of the MIL tensor. This parameter isrelated to the tertiary axis magnitude of the ellipsoid.
PrinMIL1 Magnitude of primary MILv vector individuated by theellipsoid in volumetric arrays. This parameter is relatedto the amount of solid phase along the primary favoriteorientation of cell structure.
PrinMIL2 Magnitude of secondary MILv vector individuated bythe ellipsoid in a volumetric arrays. This parameter is re-lated to the amount of solid phase along the secondaryfavorite orientation of cell structure.
PrinMIL3 Magnitude of tertiary MILv vector individuated by theellipsoid in a volumetric arrays. This parameter is relatedto the amount of solid phase along the tertiary favoriteorientation of cell structure.
PrinMILm Mean value among 3 PrinMIL.Is_Ix Isotropic index. This parameter indicates the deviation
from the spherical case of the distribution function (el-lipsoid).
El_Ix Elongation index. This parameter indicates the flattingdegree of the distribution function (ellipsoid) along thetertiary favorite orientation of cell structure.
DA Relative degrees of anisotropy. This parameter indicatesthe flatting degree of the distribution function (ellip-soid) along the secondary favorite orientation of cellstructure.
DA1 Relative degrees of anisotropy. This parameter indicatesthe mean dispersion degree of the solid phase along theprimary favorite orientation of cell structure.
DA2 Relative degrees of anisotropy. This parameter indicatesthe mean dispersion degree of the solid phase along thesecondary favorite orientation of cell structure.
DA3 Relative degrees of anisotropy. This parameter indicatesthe mean dispersion degree of the solid phase along thetertiary favorite orientation of cell structure.
FA Fractional anisotropy. It is a complex index of anisotropyand was defined according to Matusani and others(2003). This parameter takes into account both the iso-tropic index and elongation index.
OR1_� Colatitude [�] of the primary favorite orientations of cellstructure with respect to a polar coordinate system.
OR1_j Longitude [j] of the primary favorite orientations of cellstructure with respect to a polar coordinate system.
OR2_� Colatitude [�] of the secondary favorite orientations of cellstructure with respect to a polar coordinate system.
OR2_j Longitude [j] of the secondary favorite orientations of cellstructure with respect to a polar coordinate system.
OR3_� Colatitude [�] of the tertiary favorite orientations of cellstructure with respect to a polar coordinate system.
OR3_j Longitude [j] of the tertiary favorite orientations of cellstructure with respect to a polar coordinate system.
Ki Fitting parametersEc Elastic modulus
Mean relative deviation modulusN Number of observations
Experimental valuesPredicted values
ReferencesAguilera JM, Stanley DW. 1999. Microstructural principles of food processing
and engineering (2nd ed.). Gaithersburg, Md.: Aspen Publishers Inc. p 87–9.Boquet R, Chirifie J, Iglesias HA. 1978. Equations for fitting water sorption iso-
therms of foods. II. Evaluation of various two-parameters models. J Food Tech-nol 13:319–27.
Chan JP, Batchelor BG. 1993. Machine vision for the food industry. In: Pinder AC,Godfrey G, editors. Food process monitoring system. Glasgow: Blakie Aca-demic & Professional. p 58–101.
Cowin SC. 2004. Anisotropic poroelasticity: fabric tensor formulation. Mech Mater36:665–77.
Del Nobile MA, Martoriello T, Cavella S, Giudici P, Masi P. 2003. Shelf life exten-sion of durum wheat bread. Ital J Food Sci 15(3):383–93.
Falcone PM, Baiano A, Zanini F, Mancini L, Tromba G, Montanari F, Del NobileMA. 2004. A novel approach to the study of bread porous structure: phase-con-trast X-ray microtomography. J Food Sci 69(1):38–43.
Gibson LJ, Ashby MF. 1997. Cellular solid: structure and properties (2nd ed.).Cambridge Univ. Press.
Harringan TP, Mann RW.1984. Characterisation of microstructural anisotropyin orthotropic materials using a second rank tensor. J Mater Sci 19:761–7.
Hibberd GE, Parker NS. 1985. Measurements of the compression properties ofbread crumb. J Texture Stud 16:97–110
Hipp JA, Jansujwicz A, Simmon CA, Snyder BD. 1996. Trabecular bone morphol-ogy from micro-magnetic resonance imaging. J Bone Miner Res 11(2):286–92.
Inglis D, Pietruszczak S. 2003. Characterization of anisotropy in porous media bymeans of linear intercept measurements. Intl J Solids Struct 40:1243–64.
Kamman PW. 1970. Factors affecting the grain and texture of white bread. Back-ers Digest 44:34–8.
Marie E, Fazekas A, Salvo L, Dendievel R, Youssel S, Cloetens P, Letang MJ. 2003.X-ray tomography applied to the characterization of cellular materials. Relat-ed finite element modeling problems. Composites Sci Technol 63:2431–43.
Matusani Y, Aoky S, Abe O, Hayashi N, Otomo K. 2003. MR diffusion tensor imag-ing: recent advance and new techniques for diffusion tensor visualization.Eur J Radiol 46:53–66.
Montanari F. 2003. Syrmep Tomo Project tutorial. Sincrotrone Trieste S.C.p.A.,S.S. 14 km 163.500 in Area Science Park – I-34012 BASOVIZZA (TS) – Italy
[NIH] Natl. Inst. of Health. 2003. ImageJ, v1.29. Available from: http://rsb.info.nih.gov/ij. Accessed 16 April 2003.
Odgaard A, Kabel J, van Rietbergen B, Dalstra M, Huiskes R. 1997. Fabric andelastic principle directions of cancellous bone are closely related. J Biomech30:487-95.
Pyler EJ. 1988. Baking science and technology. Vol. II. Sosland Publishing Co;Merriam, Kans. p.850–910.
Roberts AP, Garboczi EJ. 2002. Elastic properties of model random three-dimen-sional open-cell solid. J Mech Phys Solids 50:33–5.
Scanlon MG, Zghal MC. 2001. Bread properties and crumb structure. Food Res Int34:841–64.
Simmons CA, Hipp JA. 1997. Method-based differences in the automated analy-sis of three-dimensional morphology of trabecular bone. J Bone Mineral Res12(6):942–7.
Whitworth MB, Alava JM. 1999. The imaging and measurement of bubble inbread doughs. In: Campbell GM, Webb C, Pandiella SS, Niranjan K, editors.Bubbles in foods. St. Paul, Minn.: Eagan Press. p 221–31.
Zghal MC, Scanlon MG, Sapirstein HD. 2001. Cellular structure of bread crumband its influence on mechanical properties. J Cereal Sci 36(2):167–76.
Copyright © 2022 FDOKUMEN