Emission Inventory Training Seminar
122
Bangladesh Department of Environment/CASE Project Poribesh Bhaban E-16, Agargaon, Shere Bangla Nagar Dhaka 1207 Bangladesh Norwegian Institute for Air Research PO Box 100 2027 Kjeller Norway Financed by: Norwegian Agency for Development Cooperation (NORAD) PROJECT REPORT Project: Bangladesh Air Pollution Management (BAPMAN) Emission Inventory Training Seminar NILU, 25 - 29 October 2010 Prepared by NILU: Scott Randall, Bjarne Sivertsen, Vo Thanh Dam and Karl Idar Gjerstad REPORT NO.: OR 84/2010 NILU REFERENCE: O-110055 REV. NO.: 12 November 2010 ISBN: 978-82-425-2335-8 (print) 978-82-425-2336-5 (electronic)
-
Upload
khangminh22 -
Category
Documents
-
view
1 -
download
0
Transcript of Emission Inventory Training Seminar
Bangladesh Department of Environment/CASE Project Poribesh Bhaban E-16, Agargaon, Shere Bangla Nagar Dhaka 1207 Bangladesh
Norwegian Institute for Air Research
PO Box 100 2027 Kjeller
Norway
Financed by: Norwegian Agency for Development Cooperation (NORAD) PROJECT REPORT
Project: Bangladesh Air Pollution Management (BAPMAN)
Emission Inventory Training Seminar NILU, 25 - 29 October 2010
Prepared by NILU:
Scott Randall, Bjarne Sivertsen, Vo Thanh Dam and Karl Idar Gjerstad
REPORT NO.: OR 84/2010
NILU REFERENCE: O-110055
REV. NO.: 12 November 2010
ISBN: 978-82-425-2335-8 (print) 978-82-425-2336-5 (electronic)

2
NILU OR 84/2010

1
NILU OR 84/2010
Summary
Funding was secured by NILU through NORAD for the 3-year Bangladesh Air Pollution Management (BAPMAN) project from 2010-2013. The objectives of the BAPMAN project are to train local air quality experts in emission inventories, dispersion modeling, instrumentation protocols, and determining health effects. The purpose of this training seminar at NILU was to train the CASE/DoE experts in the collection of data necessary for the emission inventories for Dhaka, which is a part of Task 1 of the project. This training seminar is specifically part of Task 1.1 of the project, where the project description states: “Training will be given in types of emission inventorying, sources of information, practical matters, and applications for inventorying. This will provide the basis for completion of Tasks 1.2 and 1.3.”. Results from this training seminar will go into producing Deliverable 1.1: “D1.1: Report: Emissions Training Programme: Documentation of its implementation and results”, in which this report will be a part of. The following CASE/DoE staff participated in the training seminar:
Md. Golam Saroar (Scientific Officer), dispersion modeling expert.
Md. Masud Rana (Senior Coordinator), emission inventory expert. The following NILU staff contributed to the training throughout the week:
Bjarne Sivertsen (Associate Research Director), project advisor.
Scott Randall (Research Scientist), project manager.
Vo Thanh Dam (Engineer), Task 1 leader and AirQUIS expert.
Karl Idar Gjerstad (Research Scientist), emissions inventory expert.
Rune Ødegård (Head of Development), AirQUIS development expert.
The daily general schedule of the training was as follows: Date Topic Place
25 October 2010 Administrative and introductory discussions Hotell Fagerborg
26 October 2010 Introduction: NILU, BAPMAN Task 1, AQMS, Emission Inventory, Background Data for Dhaka, Project meeting
NILU
27 October 2010 Emission Inventory Training and Exercises NILU
28 October 2010 AirQUIS introduction and data collection (questionnaires) NILU
29 October 2010 AirQUIS exercises, GAINS data analysis, Screening Study, Project meeting
NILU
The training can be considered a success. The primary goals were met and the participants were very active. In addition, many relevant decisions were made throughout the week, and specific tasks were assigned to ensure a steady road to building the emissions inventories in Bangladesh.

2
NILU OR 84/2010

3
NILU OR 84/2010
Contents
Bangladesh Air Pollution Management (BAPMAN) Emission Inventory Training
Seminar; 25-29 October 2010, NILU ...................................................................... 5
1 Introduction .............................................................................................................. 5
2 Training Seminar Presentations, Exercises, and Meetings .................................. 6 2.1 Introduction ......................................................................................................... 6 2.2 AQMS Review .................................................................................................... 6
2.3 BAPMAN Project Review .................................................................................. 6 2.4 Initial Project (Task 1) Meeting .......................................................................... 7 2.5 Background Data for the Emission Inventory ..................................................... 7 2.6 Emission Inventory Introduction ......................................................................... 7
2.7 Emission Inventory Excercises ........................................................................... 8 2.8 AirQUIS Introduction .......................................................................................... 8 2.9 Emissions Inventory and Questionnaires ............................................................ 8 2.10 AirQUIS Exercises .............................................................................................. 9
2.11 GAINS Data Analysis for Dhaka ........................................................................ 9 2.12 Passive Sampler Screening Study ..................................................................... 10
2.13 Training Closure ................................................................................................ 10
2.14 Final Project (Task 1) Meeting .......................................................................... 10
3 Conclusions from the Training Seminar .............................................................. 11
4 References ............................................................................................................... 11
Appendix A Training Seminar Program ..................................................................... 13
Appendix B Introduction and Welcome Presentation ............................................... 33
Appendix C NILU Organizational Information ......................................................... 37
Appendix D AQMS Review Presentation .................................................................... 43
Appendix E Project Review Presentation ................................................................... 53
Appendix F Initial Project (Task 1) Meeting .............................................................. 57
Appendix G “Data Needs” Sheet .................................................................................. 61
Appendix H Emissions Inventory Introduction Presentation ................................... 65
Appendix I AirQUIS Introduction Presentation ........................................................ 77
Appendix J Brick Kiln Questionnaire (Draft) ............................................................ 81
Appendix K Other Industry Questionnaire Draft ...................................................... 85
Appendix L GAINS Data Analysis for Dhaka ............................................................ 89
Appendix M Screening Study Introduction Presentation ......................................... 95
Appendix N Draft Screening Study Design for Dhaka ............................................ 101
Appendix O Final Project (Task 1) Meeting Agenda ............................................... 111
Appendix P Final Project (Task 1) Meeting Summary ............................................ 115

4
NILU OR 84/2010

5
NILU OR 84/2010
Bangladesh Air Pollution Management (BAPMAN) Emission Inventory Training Seminar; 25-29 October
2010, NILU
1 Introduction NILU received funding from NORAD for a 3-year project for cooperation with the Bangladesh Clean Air and Sustainable Environment Project within the Department of Environment (CASE/DoE) to provide training and tools to establish a solid and sustainable AQ management and monitoring program in Bangladesh. The Bangladesh Air Pollution Management (BAPMAN) project includes institutional building and knowledge/expertise transfer for Bangladesh local experts to best monitor and manage national AQ issues. A major part of the institutional building includes training for the four various tasks of the project. These training seminars will be conducted in Dhaka, as well as in NILU. This report is a summary of the first training seminar at NILU, which covered Emission Inventory preparation as part of Task 1. The following CASE/DoE staff participated in the training seminar:
Md. Golam Saroar (Scientific Officer), dispersion modeling expert.
Md. Masud Rana (Senior Coordinator), emission inventory expert.
The following NILU staff contributed to the training throughout the week:
Bjarne Sivertsen (Associate Research Director), project advisor.
Scott Randall (Research Scientist), project manager.
Vo Thanh Dam (Engineer), Task 1 leader.
Karl Idar Gjerstad (Research Scientist), emission inventory expert.
Rune Ødegård (Head of Development), AirQUIS development expert. The specific goals of the training were to:
Strengthen DoE/CASE Emission Inventory competence to begin work back in Dhaka:
o Data collection o Top-down inventory o Bottom-up inventory
Trained staff to become leaders in work and associated sub-tasks at DoE/CASE

6
NILU OR 84/2010
2 Training Seminar Presentations, Exercises, and Meetings
Each separate training presentation, exercise, and meeting is presented below with supplemental information and documents contained in the referenced Appendices. The full Training Seminar Program can be found in Appendix A. 2.1 Introduction
DAY 1 26.10.2010
0930-1000 Introduction and Welcome
Responsible: Bjarne Sivertsen
DAY 1 26.10.2010
1000-1030 Introduction to NILU
Responsible: Scott Randall
The introductory presentations on the morning of the first day were focused on welcoming the experts from Bangladesh, and giving an overview of the training seminar particulars (see Appendix B), as well as giving an introduction to NILU and its offices/facilities (see Appendix C). 2.2 AQMS Review
DAY 1 26.10.2010
1030-1100 AQMS Review
Responsible: Bjarne Sivertsen
The AQMS review presentation (see Appendix D) concentrated on refreshing the Bangladeshi experts on the full-day AQMS training course given in Dhaka on 3 August 2010 (Sivertsen and Marsteen, 2010). The presentation briefly discussed the following topics:
AQMS elements
Sources and Emissions Inventories
AQMP Procedures
Air Pollution Indicators
Monitoring instruments
Dispersion Modeling
Exposure Assessments
Action Plans (and examples)
Information Dissemination
2.3 BAPMAN Project Review
DAY 1 26.10.2010
1100-1130 Project Review
Responsible: Scott Randall

7
NILU OR 84/2010
Since the BAPMAN project was still in its beginning phase, it was deemed valuable to review the project goals, purpose, and tasks. The project review presentation (see Appendix E) stressed that the purpose of the project is institutional-building which requires training and is the reason why the training seminar is being held. Since the training seminar was concentrating on Task 1 of the project, the purpose and outcomes of this task were specifically reviewed and discussed. The expected results of the training were also discussed, and this included giving the Bangladeshi experts competence is completing top-down and bottom-up inventories when they return to Dhaka. 2.4 Initial Project (Task 1) Meeting
DAY 1 26.10.2010
1200-1230 Project Meeting (Task 1)
Responsible: Scott Randall
A preliminary project meeting was held which focused on the particulars of Task 1 of the project (see Appendix F). The status of Task 1 was fully discussed, and other tasks were briefly covered. It was also preliminarily discussed the future missions to Dhaka and trainings at NILU, as well as the reports needed to be prepared in the coming months. 2.5 Background Data for the Emission Inventory
DAY 1 26.10.2010
1230-1330 Background Data
Responsible: CASE/DoE
It was requested of CASE/DoE to collect and bring necessary data to begin completing the Emission Inventory. CASE/DoE presented a set of GIS files for Dhaka, but unfortunately it was found that this set was missing the necessary reference file (.prj file) and at that time the data could not be viewed. The “Data Needs” Excel sheet (list of all possible data necessary for the emission inventory) was discussed (see Appendix G - note that this is an updated version of the sheet completed during the final meeting on 29.10.2010), and some progress was made on how some of the data could be collected. 2.6 Emission Inventory Introduction
DAY 1 26.10.2010
1330-1600 Emission Inventory Introduction
Responsible: Karl Idar Gjerstad
A thorough presentation was given (see Appendix H) as an introduction to emission inventories and how they are prepared using the AirQUIS modeling system. It was demonstrated how emissions data could be collected and the importance of using questionnaires to collect this data. The AirQUIS emission inventory module was presented, as well as the geographical model and map interface. The final AirQUIS

8
NILU OR 84/2010
emissions model was also shown as an example when all data has been collected, prepared, and entered into the system. 2.7 Emission Inventory Excercises
DAY 2 27.10.2010
0900-1130 Emission Inventory Training I
Responsible: Karl Idar Gjerstad, Vo Thanh Dam
DAY 2 27.10.2010
1200-1600 Emission Inventory Training II
Responsible: Karl Idar Gjerstad, Vo Thanh Dam
A full day hands-on training was given based on sets of exercises in order to prepare the input templates, and entering these templates into AirQUIS. During this exercise the full suite of Excel input templates were given electronically to the Bangladeshi experts:
Emissions Inventory Module o Point Sources o Line Sources o Area Sources o Look-up data
Geographical Module
Measurement Module
General Look-up
Import Overview 2.8 AirQUIS Introduction
DAY 3 28.10.2010
0900-1130 AirQUIS Introduction
Responsible: Rune Ødegård
While AirQUIS had already been mentioned and utilized in the training seminar, it was useful to present the theoretical and conceptual format of the model. Specifically the AirQUIS monitoring, modeling, and information modules were presented and discussed (see Appendix I). 2.9 Emissions Inventory and Questionnaires
DAY 3 28.10.2010
1200-1630 Emission Inventory Training III
Responsible: Karl Idar Gjerstad
Additional emissions inventory exercises were performed, with additional training on how to import this data into AirQUIS. It was discovered in an earlier discussion that not much data exists on point sources in Dhaka, emphasis during this training period was then placed on the creation of questionnaires tailored to Dhaka.
9
NILU OR 84/2010
Many different questionnaire templates and examples where presented and discussed, resulting in the decision of two separate questionnaires based on a simple template; one questionnaire for brick kiln point sources, and one questionnaire for “other” industrial point sources. The fields for the brick kiln point source questionnaire were decided upon and a draft questionnaire to these specifications was produced (see Appendix J). It was discussed how it was essential to keep this questionnaire simple and limited to the front of one page. The fields for the “other” industrial point source questionnaire were decided upon and a draft questionnaire based on this was produced (see Appendix K). It was decided that this questionnaire should be limited to the front and back of one page. 2.10 AirQUIS Exercises
DAY 4 29.10.2010
0900-1130 AirQUIS Exercises
Responsible: Vo Thanh Dam
A more in-depth and hands-on training was performed to show the Bangladeshi experts the capabilities of AirQUIS and how to present and organize the emissions data within the system. This exercise was achieved through each expert practicing with a test data set within AirQUIS. 2.11 GAINS Data Analysis for Dhaka
DAY 4 29.10.2010
1200-1330 GAINS intro and Dhaka report
Responsible: Scott Randall
A presentation was given on the recent analysis and draft report being conducted through utilizing the GAINS (Greenhouse Gas and Air Pollution Interactions and Synergies) S.ASIA model for Dhaka (see Appendix L). The analysis is being conducted for the following components in Dhaka:
Carbon dioxide (CO2)
Nitrogen oxides (NOx)
Particulate Matter 10 fraction (PM10)
Particulate Matter 2.5 fraction (PM2.5)
Sulfur dioxide (SO2)
Greenhouse Gasses (GHGs) These components are being analyzed within the following topic areas for Dhaka:
Economic Activity Pathways (sectors and activities)
Emission Control Strategies (mitigation)
Emissions Scenarios (user-specific)
Emission Control Costs (related to mitigation)
Impacts (health) The GAINS model can give a good screening type estimate of the various components for Dhaka, and the sources and activities responsible for these emissions. The model

10
NILU OR 84/2010
is innovative in that scenarios can be developed to project how changes in various sources and/or activities will affect the resulting emissions. The model also takes into consideration how various mitigation efforts can reduce emissions, and the costs involved. The purpose of the model is to analyze the most efficient ways to implement mitigation and manage components in regards to reducing the standard urban emissions and GHGs simultaneously. 2.12 Passive Sampler Screening Study
DAY 4 29.10.2010
1330-1500 Passive Sampler Screening Study
Responsible: Bjarne Sivertsen
A presentation was given to introduce the Bangladeshi experts to the purpose, goals, and basic design of a typical air pollution screening study (see Appendix M ). After the presentation, the design planned for Dhaka was discussed (see Appendix N), and approximately 15 specific sites (of the 60 planned sites) to place samplers in Dhaka were determined using Google Earth. The Dhaka design will be based on previous screening study campaigns performed in different countries by NILU (Hak, 2010; Sivertsen and Hak 2010; Guerreiro et al., 2005). 2.13 Training Closure
DAY 5 29.10.2010
1500-1530 Training Closure
Responsible: Scott Randall
The training seminar ended with a discussion of the importance of the training and the project purpose of institutional-building. It was determined that the goals of the training were met, and that the Bangladeshi expert participation will allow them to be active leaders on the subject when they return to Dhaka. Official training certificates were given to each training participant. 2.14 Final Project (Task 1) Meeting
DAY 5 29.10.2010
1530-1630 Project Meeting (Task 1)
Responsible: Scott Randall
A final project (Task 1) meeting was held to follow-up on the preliminary project meeting held the first day of training, as well as to summarize the various tasks and assignments which were produced during the trainings and discussions throughout the week. The agenda for the meeting is in Appendix O, and the meeting summary with specific task responsibilities as assigned in the meeting is in Appendix P. Note that the “Data Needs” sheet (found in Appendix G) is a part of the meeting summary because this sheet also lists various assignments for each specific task of the list. The meeting also reviewed the various reports due in the coming months, as well as set some general timeframes from future NILU missions to Dhaka, and trainings at NILU.

11
NILU OR 84/2010
3 Conclusions from the Training Seminar
The training can be considered a success, where the primary goals were met and the participants were very active. In addition, many relevant decisions were made throughout the week, and specific tasks were assigned to ensure a steady road to building the emissions inventories in Bangladesh (see Appendix P and corresponding Appendix G for task responsibilities). It was initially hoped that more background data could be brought to the training in order to perform exercises with Dhaka specific data, but a plan was made to collect this necessary data for the inventory. The documents discussed and transferred to the Bangladeshi experts during the training are as follows (these documents are also located on the project portal at http://bapman.nilu.no):
1. All presentations given – See Appendices 2. AirQUIS manuals – see project portal 3. Excel Input Templates – see project portal 4. Questionnaires (kiln and other industry) – see Appendix J and Appendix K 5. Meeting summary – see Appendix O which was used to create Appendix P 6. Data needs sheet – see Appendix G 7. Prelim Screening study design document - see Appendix N
4 References
Guerreiro, C., Laupsa, H. and Sivertsen, B. (2005) Passive sampling of SO2 and NO2 in ambient air in Dakar. Preliminary study, June 2005. Kjeller (NILU OR 46/2005).
Hak, C. (2010) Planning ambient air pollution screening study in Burgas, Bulgaria.
Winter 2009/2010. Kjeller (NILU OR 27/2010). Sivertsen, B. and Hak, C. (2010) Ambient air pollution screening study in Burgas, March
2010. Kjeller (NILU OR 40/2010). Sivertsen, B. and Marsteen, L. (2010) Air quality management and monitoring seminar.
Dhaka, 3 August 2010. Kjeller (NILU F 19/2010).

12
NILU OR 84/2010

13
NILU OR 84/2010
Appendix A
Training Seminar Program

14
NILU OR 84/2010
15
NILU OR 84/2010
BAPMAN Training Seminar: Emission Inventories
Hosted by the Norwegian Institute for Air Research
Bjarne Sivertsen, Scott Randall, Karl Idar Gjerstad, Vo Thanh Dam, Rune Ødegård
Kjeller, Norway
26 October – 29 October 2010
This training seminar is a part of Task 1.1 of the NORAD financed Bangladesh Air Pollution Management (BAPMAN) project, where the project description states: “Training will be given in types of emission inventorying, sources of information, practical matters, and applications for inventorying. This will provide the basis for completion of tasks 1.2 and 1.3.”. Results from this training seminar will go into producing Deliverable 1.1: “D1.1: Report: Emissions Training Programme: Documentation of its implementation and results”.

16
NILU OR 84/2010
Seminar Schedule for the week:
TIM
E/D
AT
ET
UE
SD
AY
(O
ct 2
6th
)W
ED
NE
SD
AY
(O
ct 2
7th
)T
HU
RS
DA
Y (
Oct
28
th)
FR
IDA
Y (
Oct
29
th)
90
0-9
30
Arr
ive
at
NIL
UA
irQ
UIS
in
tro
(R
uO
):
Air
QU
IS b
as
ics
:A
irQ
UIS
Ex
erc
ise
s I
(VT
D):
U
sin
g o
ld
Dh
ak
a d
ata
, e
xce
rcis
es
93
0-1
00
0In
tro
du
ctio
n a
nd
we
lco
me
(B
S):
pre
se
nt
ag
en
da
fo
r w
ee
k a
nd
sta
ff i
nvo
lve
d.
[
SR
,
BS
, K
iG,
VT
D,
Ru
O,
LTA
]
Mo
nit
ori
ng
Ge
o d
ata
10
00
-10
30
Intr
od
uct
ion
to
NIL
U (
SR
):
Intr
o t
o
org
an
iza
tio
n,
pu
rpo
se
, p
roje
cts
, o
ffic
es
Ge
o d
ata
Po
rta
l
10
30
-11
00
AQ
MS
Re
vie
w (
BS
): A
QM
S s
um
ma
ry a
nd
ho
w
tra
inin
g f
its
in
to e
nti
re s
yste
m.
Po
int
so
urc
es
Mo
de
lin
g
11
00
-11
30
Pro
ject
Re
vie
w (
SR
):
Re
vie
w p
roje
ct t
as
ks
an
d
ho
w t
rain
ing
fit
s i
n t
o t
he
se
ta
sk
s a
nd
th
e
en
tire
pro
ject
.Li
ne
so
urc
es
Info
rma
tio
n
11
30
-12
00
LUN
CH
LUN
CH
LUN
CH
LUN
CH
12
00
-12
30
Ta
sk 1
Pro
ject
Me
eti
ng
(S
R):
ad
min
,
do
cum
en
ts,
ea
ch t
as
k s
tatu
s,
pro
ject
po
rta
l
revi
ew
. [S
R,
BS
, V
TD
, K
iG]
12
30
-13
00
13
00
-13
30
Exe
rcis
es
Exc
erc
ise
s
13
30
-14
00
14
00
-14
30
14
30
-15
00
15
00
-15
30
Tra
inin
g C
losu
re (
SR
):
Fe
ed
ba
ck a
nd
cert
ific
ate
. [S
R,
BS
, V
TD
, K
iG]
15
30
-16
00
16
00
-16
30
EV
EN
ING
Pro
ject
Din
ne
r Li
lle
strø
m (
SR
) [A
ll i
nvi
ted
]D
inn
er
Drø
ba
k (
SR
)D
inn
er
Osl
o (
SR
)
Ta
sk 1
Pro
ject
Me
eti
ng
(S
R):
ad
min
,
do
cum
en
ts,
futu
re t
as
k a
ss
ign
me
nts
,
pro
ject
fa
ct s
he
et
pu
bli
c, e
tc.
[SR
, B
S,
VT
D,
KiG
]
Em
issi
on
s In
ve
nto
ry T
rain
ing
II
(KiG
, V
TD
):
Are
a s
ou
rce
s
Em
issi
on
s In
ve
nto
ry T
rain
ing
I (
KiG
, V
TD
):
Bu
ild
ing
Air
QU
IS d
ata
ba
se
us
ing
Os
lo
da
ta
Em
issi
on
s In
ve
nto
ry T
rain
ing
III
(K
iG,
VT
D):
Ru
nn
ing
em
iss
ion
mo
de
l o
n d
ata
ba
se
Pa
ssiv
e S
am
ple
r S
cre
en
ing
Stu
dy
(B
S):
Dis
cus
s a
nd
pla
n m
iss
ion
to
Dh
ak
a t
o
con
du
ct p
as
siv
ie s
cre
en
ing
stu
dy.
[S
R,
VT
D]
Ba
ckg
rou
nd
Da
ta (
CA
SE
):
Da
ta n
ee
ds
sh
ee
t
[SR
, B
S,
VT
D,
KiG
]
Em
issi
on
s In
ve
nto
ry I
ntr
o (
KiG
, V
TD
):
Tra
inin
g
intr
od
uct
ion
GA
INS
In
tro
an
d r
ep
ort
(S
R):
In
tro
du
ctio
n
to t
he
to
p-d
ow
n G
AIN
S I
nte
gra
ted
as
se
ss
me
nt
mo
de
l, a
nd
re
su
lts
fo
r
Dh
ak
a.
Dis
cus
sio
n o
n s
ou
rce
s…
Sh
ap
e T
he
me
s

17
NILU OR 84/2010
DAY 1 26.10.2010
0930-1000 Introduction and Welcome
Responsible: Bjarne Sivertsen
<SEE PPT SLIDES>BAPMAN Intro NILU oct2010.ppt 1. Present Agenda for the week
a. Technical agenda
b. Social agenda
2. Present Staff involved
a. Training staff members
b. Other BAPMAN team members
3. Purpose of training
a. Institutional-building
b. CASE/DoE leaders in topic
4. Practical matters
a. Meeting room UB
b. Security/alarms
NOTES:

18
NILU OR 84/2010
DAY 1 26.10.2010
1000-1030 Introduction to NILU
Responsible: Scott Randall
<SEE PPT SLIDES> NILUintro.ppt 1. NILU Key figures
2. NILU Organization
3. NILU offices and establishments
4. NILU Vision
5. NILU Research (tasks and topics)
6. NILU Labs and tools
7. NILU assignments
NOTES:

19
NILU OR 84/2010
DAY 1 26.10.2010
1030-1100 AQMS Review
Responsible: Bjarne Sivertsen
<SEE PPT SLIDES> AQ1-AQM overview BAPMAN.ppt
Air Quality Monitoring Program (AQMP) overview
Air Quality Monitoring System (AQMS) objectives
AQMS elements
Sources and Emissions Inventories
AQMP Procedures
Air Pollution Indicators
Monitoring instruments
Dispersion Modeling
Exposure Assessments
Action Plans (and examples)
Information Dissemination
NOTES:

20
NILU OR 84/2010
DAY 1 26.10.2010
1100-1130 Project Review
Responsible: Scott Randall
1. Review Project Description
a. Overall Project Purpose: training, institutional building
2. Review Task 1
a. Task 1 Purpose
b. Task 1 Outcomes
3. Expected results of training seminar
a. Strengthen emission inventory competence to begin work back in Dhaka with remote
assistance from NILU
i. Top-down inventories
ii. Bottom-up inventories
b. For two trained CASE/DoE experts to become leaders in task
c. DISCUSSION and participation!
NOTES:

21
NILU OR 84/2010
DAY 1 26.10.2010
1200-1230 Project Meeting (Task 1)
Responsible: Scott Randall
1. Task Status
a. Task 1
i. Data needs sheet
ii. Training
iii. Top-down assessment (GAINS – more info Friday).
b. Task 2
i. Waiting for station maintenance
c. Task 3
i. Delayed due to lack of data
ii. Intro training (Thursday)
d. Task 4
i. Collaboration with Sarah Hossain
2. Reports
a. Mission 1 Report
b. Dhaka Training Seminar Report
c. NILU Training Seminar Report (in progress) -> D1.1
3. Mission 2: Emissions Inventory preparation
a. November?, or combine with Mission 3?
4. Mission 3: Passive Sampling Screening Study
a. January 2011
5. Project Portal
a. Task pages
b. Literature catalog
c. Internal Documents
NOTES:

22
NILU OR 84/2010
DAY 1 26.10.2010
1230-1330 Background Data
Responsible: CASE/DoE
<SEE XLS SHEET> Bottom-up EI for Dhaka_List of input data for AirQUIS_FINAL
1. Presentation of data collected
a. Checklist
b. Actual files (place on web portal)
2. Discussion of agencies and contacts needed to collect missing data
3. Prioritization of missing data needed
4. Assistance in collecting missing data
NOTES:

23
NILU OR 84/2010
DAY 1 26.10.2010
1330-1600 Emission Inventory Introduction
Responsible: Karl Idar Gjerstad, Vo Thanh Dam
<SEE PPT SLIDES>
1. AirQUIS concept and functionalities
2. Database and data handeling
3. Emission Inventory approaches
4. Emission Sources
5. GIS Features
6. Modelling
NOTES:

24
NILU OR 84/2010
DAY 2 27.10.2010
0900-1130 Emission Inventory Training I
Responsible: Karl Idar Gjerstad, Vo Thanh Dam
1. Building AirQUIS data using Oslo example
2. Geo Data
3. Point Sources
4. Line Sources
NOTES:

25
NILU OR 84/2010
DAY 2 27.10.2010
1200-1600 Emission Inventory Training II
Responsible: Karl Idar Gjerstad, Vo Thanh Dam
1. Area sources
2. Exercises
NOTES:

26
NILU OR 84/2010
DAY 3 28.10.2010
0900-1130 AirQUIS Introduction
Responsible: Rune Ødegård
<SEE PPT SLIDES> 1. Introduction to NILU’s Software and Hardware Development Department (SHaDe)
2. AirQUIS Overall Dataflow – from sensor to web
3. ADACS
4. AirQUIS Monitoring
5. AirQUIS Portal
6. AirQUIS Modelling
7. AirQUIS Information
8. Possible solutions for how to integrate WinCollect Database and AirQUIS Database
NOTES:

27
NILU OR 84/2010
DAY 3 28.10.2010
1200-1630 Emission Inventory Training III
Responsible: Karl Idar Gjerstad, Vo Thanh Dam
1. Running Emission model on database
2. Excercises
NOTES:

28
NILU OR 84/2010
DAY 4 29.10.2010
0900-1130 AirQUIS Excercises
Responsible: Vo Thanh Dam, Karl Idar Gjerstad
<SEE PPT SLIDES>
1. Geographical data of Dhaka in GIS: Regions, Grid, Stations,
2. Shape themes in AirQUIS: River, Road Network, Brick Kilns points
3. Importing measurement data into AirQUIS
NOTES:

29
NILU OR 84/2010
DAY 4 29.10.2010
1200-1330 GAINS intro and Dhaka report
Responsible: Scott Randall
<SEE DRAFT REPORT> 1. GAINS intro
2. GAINS access
3. Data results Dhaka
a. PM2.5
b. PM10
c. SO2
d. CO2
e. GHGs
4. Scenario development
NOTES:

30
NILU OR 84/2010
DAY 4 29.10.2010
1330-1500 Passive Sampler Screening Study
Responsible: Bjarne Sivertsen
<SEE PPT SLIDES> 1. Intro to Passive Sampling Studies
2. Methods based on Burgas study
a. See Report
3. Dhaka design
a. Components: NO2, So2, PM, Ozone
b. City Transects (Dhaka has primary northerly wind)
a. North of city suburban (but south of brick kilns)
b. North of city urban
c. City Center
d. South of city urban
c. Microclimates
a. Roadside
b. Street canyons
c. Urban
d. Vertical
a. 2-3 meters over street level (majority)
b. 5 meters over street level (some)
c. High over street level (one or two) – all components
e. Also at existing and planned monitoring station locations
4. Local assistance with distributing samplers
a. Local training
b. Map of DoE staff
NOTES:

31
NILU OR 84/2010
DAY 5 29.10.2010
1500-1530 Training Closure
Responsible: Scott Randall
1. Summary
2. Importance
3. Feedback
4. Certificates
NOTES:

32
NILU OR 84/2010
DAY 5 29.10.2010
1530-1630 Project Meeting (Task 1)
Responsible: Scott Randall
1. Task assignments
2. Future missions
3. Documents
4. Project Fact sheet (public)
5. Administrative
NOTES:

33
NILU OR 84/2010
Appendix B
Introduction and Welcome Presentation

34
NILU OR 84/2010

AQ Management intro \ B Sivertsen, NILU 2010
1
www.NILU.noBS\ NILU \ 2010
Emission Inventories
Hosted by the Norwegian Institute for Air Research
Bjarne Sivertsen, Scott Randall, Karl Idar Gjerstad, Vo Dam Tranh, Rune Ødegård
Kjeller, Norway
25 October – 29 October 2010
www.NILU.noBS\ NILU \ 2010
Develop expertise at all participating
institutions in air quality management
To provide the training necessary to
achieve in-house emission inventorying
in Bangladesh appropriate to
air quality management.
General
This visit
www.NILU.noBS\ NILU \ 2010
19:00 Project dinner
Lillestrøm
930-1000 Introduction and welcome (BS): present
agenda for week and s taff involved.
[SR, BS, KiG, VTD, RuO, LTA]
1000-1030 Introduction to NILU (SR): Intro to
organization, purpose, projects , offices
1030-1100 AQMS Review (BS): AQMS summary and
how tra ining fi ts into entire system.
1100-1130 Project Review (SR): Review project tasks
and how tra ining fi ts in to these tasks
and the entire project.
1130-1200 LUNCH
1200-1230
1230-1300
1300-1330 Background Data (CASE): Data needs
sheet [SR, BS, VTD, KiG]
1330-1400
1400-1430 Emissions Inventory Intro (VTD, KiG):
Tra ining introduction
1430-1500
Task 1 Project Meeting (SR): admin,
documents , each task s tatus , project
porta l review. [SR, BS, VTD, KiG]
www.NILU.noBS\ NILU \ 2010
DAY 2 26.10.2010
0900-1400 Emission Inventory Training I
and II
Responsible Karl Idar Gjerstad, Vo Tranh Dam
DAY 3 27.10.2010
0900-1600 Emission Inventory Training III
and IV
Resp. Karl Idar Gjerstad, Vo Tranh Dam
DAY 4 28.10.2010
0900-1130 AirQUIS Introduction
Responsible: Rune Ødegård
DAY 4 28.10.2010
1200-1630 AirQUIS Excercises
Responsible: Karl Idar Gjerstad, Vo Tranh Dam
DAY 5 29.10.2010
0900-1030 Passive Sampler Screening Study
Resp. Bjarne Sivertsen
DAY 5 29.10.2010
1030-1130 Luftkvalitet.info
Resp: Scott Randall
DAY 5 29.10.2010
1200-1230 Training Closure
Respons. Scott Randall
DAY 5 29.10.2010
1230-1330 Project Meeting (Task 1)
Responsib Scott Randall
DAY 2 26.10.2010
1400-1600 GAINS intro and Dhaka report
Respon Scott Randall
www.NILU.noBS\ NILU \ 2010
Monday evening 19:00: Project dinner Lillestrøm
Thursday evening : Dinner at Scott, Drøbak
Friday evening Dinner in Oslo
Sight seeing Oslo
Friday or/and by request
www.NILU.noBS\ NILU \ 2010
Name Title Expertise Years of experience
Scott Randall SR Scientist Project management, Air Quality
monitoring, GIS and emissions,
10
Bjarne Sivertsen BS Research Director Project lead, Air Quality assessment,
AQMplanning, Training
40
Karl Idar Gjerstad KiG Scientist Airquality modelling, Emission
inventories, training
11
Rune Ødegård RuO Senior Scientist, AirQUIS, software management,
training.
16
Christoffer Stoll CST IT expert, Data transfer, data dissemination,
Internet,
6
Leif Marsteen LM Senior Scientist QA/QC, Reference Laboratory specs.
training
19
Franck Dauge FrD Engineer Monitoring programme, Instruments,
QA/QC
10
Vo Thanh Dam VTD Engineer AirQUIS data handling, training 7
Kyrre Sundseth KyS Scientist Health impacts, scenario analyses
Strategy planning
5

AQ Management intro \ B Sivertsen, NILU 2010
2
www.NILU.noBS\ NILU \ 2010
Dr. Mohammed Nasiruddin Project Management
Mr. Md. Masud Rana Air Quality Monitoring, Emission Measurement
Mr. Md. Golam Saroar Air Quality Monitoring, Air Quality Data analysis, Modeling
Mr. Abdul Jalil
Ms. Sabera Nasrin
Mr. Ashraf Mahmood
Mr. Nur Hossain
Mr. Mohammed Solaiman Haider
Environmental Management. GIS
Md. Asadur Rahman
Md. Mahbubur Rahman Khan
Mr. Abdullah Al Mamun
Mr. Md. Mizanur Rahman
Mr. Ripon Chandra Sutradar
Mr. Md. Selim Khan
Mr. Asudev Kumar Kundu
Mr. Gazi Md. Mohiuddin
Mr. Masum Billal
Dr. Bilkis Ara Begum Air Quality Monitoring, Data analysis, Receptor Modeling
Dr. Swapan Kumar Biswas Project Management, Air Quality Monitoring, PM, data anal.
www.NILU.noBS\ NILU \ 2010

37
NILU OR 84/2010
Appendix C
NILU Organizational Information

38
NILU OR 84/2010
11/23/2010
1
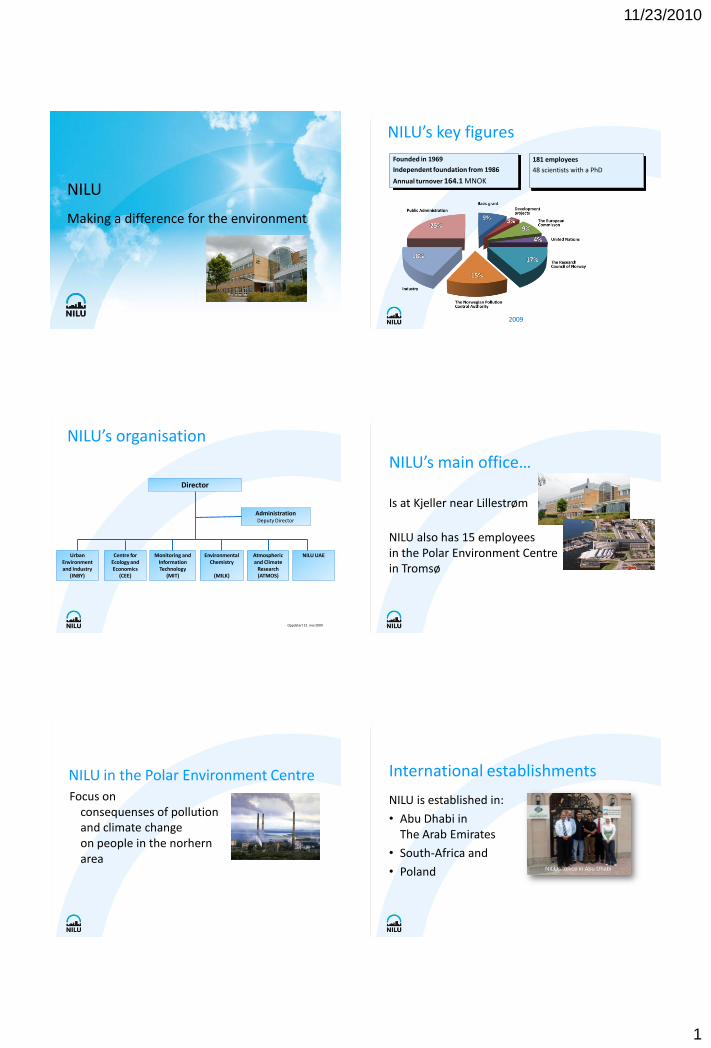
NILU
Making a difference for the environment
NILU’s key figures
Founded in 1969
Independent foundation from 1986
Annual turnover 164.1 MNOK
181 employees
48 scientists with a PhD
2009
NILU’s organisation
Oppdatert 22. mai 2009
Director
AdministrationDeputy Director
NILU UAEEnvironmentalChemistry
(MILK)
Monitoring and InformationTechnology
(MIT)
Centre forEcology andEconomics
(CEE)
UrbanEnvironmentand Industry
(INBY)
Atmosphericand Climate
Research(ATMOS)
NILU’s main office…
Is at Kjeller near Lillestrøm
NILU also has 15 employeesin the Polar Environment Centre in Tromsø
NILU in the Polar Environment CentreFocus on
consequenses of pollution and climate change on people in the norhern area
International establishments
NILU is established in:
• Abu Dhabi in The Arab Emirates
• South-Africa and
• Poland NILUs office in Abu Dhabi

11/23/2010
2
NILU in Abu Dhabi…is Strategic partner for theEnvironmental authorities – EAD
Operates the national outdoorair quality monitoring network
Guiding and law preparations on
• Climate change• Renewable Energy• Indoor Air and• Noise Pollution
NILU promotes sustainable development and a better quality of life through world classresearch and science based support within
• climate change
• air quality and
• hazardous substances
Our vision
Through its research
NILU increases theunderstanding of processesand effects of
• climate change
• of the composition of theatmosphere
• of air quality
• and of hazardous substances
Based on the research
• NILU markets integrated services and products within analysis, monitoring and consulting
• NILU is concerned about increasing the public awareness on climate change and environmental pollution.
Is to establish quantitative
relationships between:
NILU’s task
• Air Quality• Exposure• Effects
• Emissions• Dispersion• Deposition
NILU topics
• Atmospheric composition
• GHG and climate forcing agents
• Ozone layer depletion and UV radiation
• Long range transport of air pollution
• Urban and industrial pollution
• Aerosol and particulate matter
• Chemicals and their environmental effects
• Health effect studies
• Ecology and economics

11/23/2010
3
• Climate change
• Global air quality
• Air pollution transport pathways
Monitoring
NILU from pole to poleNILU monitors climate change, global air quality and air pollution transport pathways
Supplying researchers all over the world with important data
• Zeppelin in the Arctic • Troll in the Antarctica• ALOMAR and Birkenes
in Norway
Accredited laboratories
Instruments and IT - Data transfer and handling
- Instrument development
- Reference laboratory
Chemical laboratory– Organic lab
– Inorganic lab
• Monitoring
• Data retrieval
• QA/QC
• The GIS database
• Models
• Input data
• EIA
• Forecasts
A complete Air Quality Management System
International assignments
58 %
33 %
9 %
International project
National projects
Basic grant

11/23/2010
4
International assignmentsSome major NILU clients:
• United Nations Economic Commission for Europe (UNECE),
• European Environmental Agency (EEA)
• European Commission (EC)
• World Bank (IBRD)
• World Meteorological Organization (WMO)
• World Health Organization (WHO)
• United Nations Environment Programme (UNEP)
Development projects:• NORAD• DANIDA• SIDA• Guangzhou Science and Technology Commission (China)• Egypt Environmental Affairs Agency• Department of Mines, Botswana • HEPA, HCMC Vietnam
www.nilu.no

43
NILU OR 84/2010
Appendix D
AQMS Review Presentation

44
NILU OR 84/2010

AQ Management intro \ B Sivertsen, NILU 2010
1
Bjarne Sivertsen, NILU
Introduction
www.NILU.noBS\ NILU \ 2010
SourcesMonitoringAir quality assessmentModellingData disseminationAbatement planning
www.NILU.noBS\ NILU \ 2010
Identify most cost-effective options
PART 1
PART 2Goal settingLegislation
Baseline AQINFORMATION
PART 6
StakeholdersPublic, Authorities
PART 3 Air Quality Management System
A dynamic processA dynamic process
www.NILU.noBS\ NILU \ 2010
PART 3A PART 3B PART 3CAir QualityMonitoringPART 5
PART 4
ModellingEmissioninventories
Action plansImplemention
Evaluation
InterventionStrategies
Air Quality(Air pollution
concentrations)
Dispersionmodelling Monitoring
Emissions
It all started with the WB URBAIR
approach in the 90’s
www.NILU.noBS\ NILU \ 2010
Cost analysis
Abatementmeasures/regulations
Damageassessment
concentrations)
Exposureassessment
Controloptions
A complete Air Quality Management System
A complete Air Quality Management System
Monitoring (Air Qual.)Meteorological data !Data retrievalQA/QC
www.NILU.noBS\ NILU \ 2010
QA/QCDatabases (GIS based)Emission dataDispersion ModelsAssessment toolsPlanning toolsForecasts (met+AQ)
The elements The elements ofof thethe AQMSAQMSThe elements The elements ofof thethe AQMSAQMSThe AQM SYSTEM
www.NILU.noBS\ NILU \ 2010

AQ Management intro \ B Sivertsen, NILU 2010
2
ModellingCalculate Emissions
Geographical Information System (GIS)
” Bottom-up ”
www.NILU.noBS\ NILU \ 2010
• Static road data (Geography, road classification)
• Dynamic traffic data• Emission factors• Time variation
• Consumption• Emission• Production• Source sector• Fuel /Raw material• Emission factors• Time variation
Point Sources Line Sources Area sources• Industry• Stacks• Consumption• Emission• Production• Emission factors• Time variation
Location
Fuel consumption:- various types and qualities of fuel various processes (transport, domestic, industrial)
Traffic activity:- various vehicle classes and traffic data on major roads
Industrial sources:- type, location, production, emissions, emission conditions (stack height, temperature, etc.)
Input data requirementsInput data requirements
www.NILU.noBS\ NILU \ 2010
Amount of emission
Variation of the emissions with time (hour of the day, day of the week and year).
Other sources:- refuse burning, harbour activities etc.
Population data:- geographic distribution within the area
Emission factors:- amount emitted- per unit of production per input unit (raw material) per kilometre driven per fuel unit
PART 3 B a: Emission inventories point sources
Identify and evaluate sources
Line sources
classify sources
Prepare Questionaires
Point sources Area sources
Request: stack data
b c
www.NILU.noBS\ NILU \ 2010
Send the Questionaires
to polluters
-stack data-production-consumption-emission rates-time variationetc.
IndustriesPower plantsWaste incinerators ect..
Collect emission factors
Prepare input to emission model
Estimate emission rates
GIS based Emission inventory
Mainly large emitters that canbe attributed to a specific location –defined by:
A single, identified stack Geographical co-ordinates,Emission generating activities
www.NILU.noBS\ NILU \ 2010
Emitting activities might be of different types :
combustion activities with fuels and fuel consumption as activity ratesnon-combustion activities without fuels ora combination of activities and use of fuels.
g gand other specific data.
BS\NILU\AQMP.ppt www.NILU.no
EMISSIONS INVENTORY QUESTIONNAIRE 1. GENERAL COMPANY INFORMATION
1.1 Name of company: 1.2 Physical address:
1.3 Postal address:
1.4 Name of contact person: 1.5 Title of contact person:
QuestionnaireQuestionnaireFor point sources
and industries
www.NILU.noBS\ NILU \ 2010
1.6 Telephone number of contact person:
1.7 Fax number of contact person:
1.8 Site coordinates - X: Y: 1.9 E-mail address of contact person: 1.10 Nature of business: 1.11 Source sector code:
1.12 Total Plant emissions (tons/year)
SO2
NOX PM10 CO LEAD TOC OTHERS

AQ Management intro \ B Sivertsen, NILU 2010
3
Fuel
Fuel ID Name
8 Gasoline 19 Diesel 1 Coal 2 Coke
Source Sectors
Source Sector ID Source Sector Name
1000 Stationary combustion
1100 Industry and energy sectors
1200 Primary industries 1300 Private services 1400 Public administration
Contact person Contact
Industrial Plant ID
Name of Industrial Plant Source sectors Name
Region Name Owner Name
301005 Industry nr 301005 COMBUSTION INDUSTRIES Bangladesh Government301006 Industry nr 301006 District heating plants Dhaka Government
301012 Industry nr 301012
Coal mining, oil / gas extraction, pipeline compressors Chittagong Government
Industrial Plant Register
www.NILU.noBS\ NILU \ 2010
Owner IDOwner Name
Postal Address Visiting Address Zip Code City Country
person last name
Contact person first name Title E-mail Telephone Fax
1 NILU Pb100 Instituttveien 18 2027 Kjeller Norway Hansen Jan Scientist [email protected] 4763898000 4763898050
Stack ID Stack nameX Co-ordinate
Y Co-ordinate
Stack height (m)
Stack Diameter (m)
Gas Temperature (C)
Gas Velocity (m/s)
Gas Flow Rate (m^3/s)
Building Height
Building Width
Industrial Plant Name
30100501 Pipe 301005-1 600669 6645282 10 0.5 130 16.27 3.19 5 10 Industry nr 30100530100601 Pipe 301006-1 598856 6646044 20 0.5 178 10 2.00 5 10 Industry nr 30100630101201 Pipe 301012-1 604096 6646518 46 0.9 250 20 6.67 18 28 Industry nr 30101230101301 Pipe 301013-1 600071 6644966 14 0.4 190 12.6 10.00 6 10 Industry nr 30100530101502 Pipe 301015-2 598835 6644487 40 3 225 5 35.34 18 40 Industry nr 30100630101901 Pipe 301019-1 604474 6649890 30 0.8 110 20 10.00 12 18 Industry nr 301012
Stack data
PART 3 B b: Emission inventories line sources
Define line source (mainly traffic)
Are there traffic models available in the area?
Collect road data; nodes and positions
Identify main roads for traffic countingNo
Yes
Count traffic on
Vehicle classification:-private cars-light duty vehicle-heavy duty vehicle
www.NILU.noBS\ NILU \ 2010
Prepare and insert data in emission models
Use traffic templates
(Excel)
selected roads -buses
Insert traffic data to GIS system
Use emission model for line sources
Calculate emission roads along roads
Collect emission factors
Identify compounds
GIS based Emission inventory
Line sources are:road transport, railways, inland navigation, shipping or aviation
The lines are sections of the road, railway-track, canal or sea-lane.
www.NILU.noBS\ NILU \ 2010
y ,
Traffic modelling (G-MAT)Road networkADTVehicle fleet distribution
Traffic countingADTVehicle fleet distribution
Vehicle emission factors fuel and technology
dependent
Inputdata
PART 3 B c: Emission inventories Area sources Define sources
characterised as area sources
Define area extension
Kilometre squares
Administrative borders
Define type of area source
domestic waste small remaining
www.NILU.noBS\ NILU \ 2010
heating burning industries traffic
Collect fuel consumption data
Estimate total waste burned
Collect population distribution data
Collect emission factors
Production & consumption
Estimate total traffic flow (km)
Distribute emissions by population distribution
Estimate total emission of selected pollutants
GIS based Emission inventory
Many small sources spread over an areaPosition not well definedNormally no or low stacks.
Typical area sources:
www.NILU.noBS\ NILU \ 2010
• Stationary source such as residential fuel combustion, domestic heating
• Solvent use (e.g., small surface coating operations)
• Product storage and transport distribution (e.g., gasoline)
• Light industrial / commercial sources, many small enterprises
• Agriculture (e.g., feedlots, crop burning)
• Waste management (e.g., landfills, open air waste burning)
• Miscellaneous area sources (e.g., forest fires, wind erosion, unpaved roads)
Area sourcesArea sources
Many small diffusive sources in a defined area:
www.NILU.noBS\ NILU \ 2010
Many small diffusive sources in a defined area:RegionCountyDistrictSquare kilometre- large number of scattered small sources

AQ Management intro \ B Sivertsen, NILU 2010
4
www.NILU.noBS\ NILU \ 2010
PART 3 C: ModelsAtmospheric dispersion models
No
Atmosphericdispersion model
Evaluate:-Area-Topography-Component
Select type of model
Complex terrain and climate
Exposure Impact Costs
-Multi source-Gaussian M-Numerical M-Line source M-Trajectory M
Simple Gaussianmodels
MODELTest and verify
model f
www.NILU.noBS\ NILU \ 2010
SelectNumerical models
Identify compound to be modelled
Use wind field models
Yes
Collect meteorological data
Emission inventories
All input data prepared
SourcesPoint Line Area
Collect air quality data for model
verification
performance
Data fromPART 3 A
PART 3 B
PlanningScreening studyDesign monitoring ProgramInstrument procurement
www.NILU.noBS\ NILU \ 2010
Installations and QA/QCTrainingData transferDatabasesData assessment & statisticsImpact assessmentAir Q. management planning
First priority pollutants
• SO2 (Sulphur dioxide)• NO2 (Nitrogen dioxide)• PM10 (Particles with aerodynamic
Air Pollution IndicatorsAir Pollution Indicators
www.NILU.noBS\ NILU \ 2010
diameter < 10 micrometer)• Pb (lead)
Limit values developed forother indicators:• CO (Carbon monoxide) • Ozone• Benzene• PM 2,5
PAH (BaP)
BTX
www.NILU.noBS\ NILU \ 2010
SO2 è fluorescent signal exiting SO2 with UVNO, NO 2 è chemiluminiscent reaction NO/O 3O3 è UV absorption analyserCO è non-dispersiveinfrared photometerHC è NMHC, flame ionizator detector (FID)
SO2 fluorescent signal exiting SO2 with UVNO, NO 2 chemiluminiscent reaction NO/OO3 UV absorption analyserCO non-dispersiveinfrared photometer
Reference instruments !
Instrument procurementInstrument selectionsFactory Acceptance TestTransport of shelter to siteInstallation of equipment
CASE
www.NILU.noBS\ NILU \ 2010
Installation of equipment inside shelterTesting of equipment and telecommunicationStart-up of systemsSite Acceptance TestTraining

AQ Management intro \ B Sivertsen, NILU 2010
5
Dispersion modellingDispersion modellingSpatial distribution of pollutant concentrations
Source contribution quantification
www.NILU.noBS\ NILU \ 2010
quantification
Effects of suggested measures
Exposure Estimates
Forecasting
Dispersion ModelsDispersion Models
www.NILU.noBS\ NILU \ 2010
Number of people exposed above the limit value of PM10
OsloOslo
Exposure assessmentExposure assessmentLinks population data to concentration fields
www.NILU.noBS\ NILU \ 2010
– Monitoring /air pollution and meteorology
– Surveys / emissions
Action PlanAction PlanReduction measures:
Mobile sources (traffic)Stationary sourcesProcesses, industries
AQM tools
www.NILU.noBS\ NILU \ 2010
– Surveys / emissions inventory
– Modelling / air quality and exposure
– Guidelines / Regulations– Cost Analysis– Air Quality Information
System
Processes, industriesWaste handlingRenewable energyResidential sourcesUse of coal
Short term – medium - long term actions
assessment
area specific !
Cost of ActionsSources – Strategies – Technologies
Update emission dataValidate costAdditional technologyPolicy options - compliance dateDynamic analysesA large number og
health end points and pollutants
www.NILU.noBS\ NILU \ 2010
Exposure response:
Mortality from chronic exposure: 4 % / 10 µg/m3 PM10 (Infant; 0-1 yr)Increase mortality chronic exposure: 6% / 10 µg/m3 PM2,5 (Pope et.al)
Respiratory hospital admission : 1 % / 10 µg/m3 PM10 (0-64 yrs)
Chronic mortality from PM
Infant mortality from PM
Acute mortality from ozone
Morbidity impacts from PM
Morbidity impacts from ozone
Value of reduced impactsLoss of Workhours – illness – death
Goal: Cleaner air in HCMCGoal: Cleaner air in HCMCevaluate impact of optionsselect cost effective actionsestimate future impacts
www.NILU.noBS\ NILU \ 2010
pforecast air quality
AQ Management intro \ B Sivertsen, NILU 2010
6
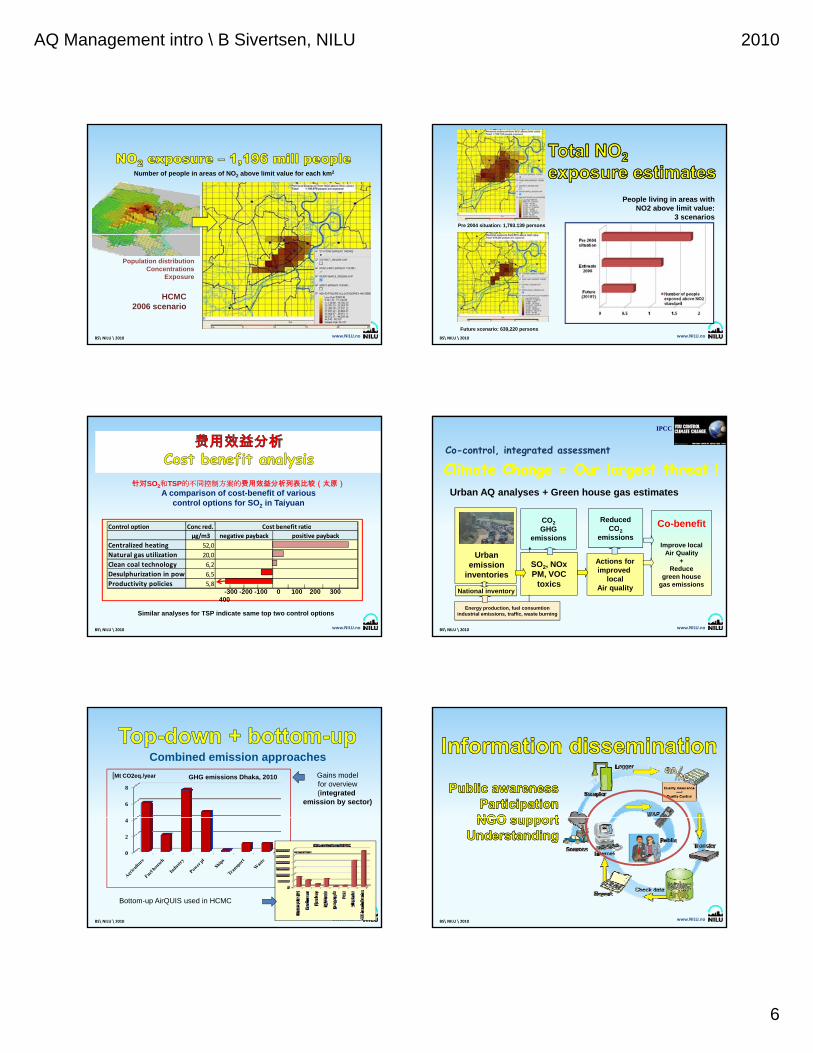
Number of people in areas of NO2 above limit value for each km2
www.NILU.noBS\ NILU \ 2010
Population distributionConcentrations
Exposure
HCMC2006 scenario
People living in areas withNO2 above limit value:
3 scenariosPre 2004 situation: 1,793.139 persons
www.NILU.noBS\ NILU \ 2010
Future scenario: 639,220 persons
针对SO2和TSP的不同控制方案的费用效益分析列表比较(太原)A comparison of cost-benefit of various
control options for SO2 in Taiyuan
Control option Conc red Cost benefit ratio
www.NILU.noBS\ NILU \ 2010
-300 -200 -100 0 100 200 300 400
Control option Conc red.µg/m3 negative payback positive payback
Centralized heating 52,0Natural gas utilization 20,0Clean coal technology 6,2Desulphurization in powe 6,5Productivity policies 5,8
Cost benefit ratio
Similar analyses for TSP indicate same top two control options
Co-control, integrated assessment
Urban AQ analyses + Green house gas estimates
Climate Change = Our largest threat !Climate Change = Our largest threat !
ReducedCO Co-benefitCO2
IPCC
www.NILU.noBS\ NILU \ 2010
Urban emission
inventoriesActions forimproved
localAir quality
CO2emissions
Co benefit
Improve localAir Quality
+Reduce
green housegas emissions
GHGemissions
SO2, NOxPM, VOC
toxicsNational inventory
Energy production, fuel consumtionindustrial emissions, traffic, waste burning
6
8
GHG emissions Dhaka, 2010[Mt CO2eq./year
Combined emission approachesGains modelfor overview(integrated
emission by sector)
www.NILU.noBS\ NILU \ 2010
0
2
4
Bottom-up AirQUIS used in HCMC
www.NILU.noBS\ NILU \ 2010

AQ Management intro \ B Sivertsen, NILU 2010
7
A valuable support tool for decision makers !
In spite of uncertainties in some input data;(emission inventory, e‐factors, meteorology) :
www.NILU.noBS\ NILU \ 2010
( y, f , gy)
The planning tools (models) are able to:Estimate source importanceExposure to the population (future)Relative exposure from trafficImpact of planned actionsEstimate greenhouse gas emissions
Needs input data !
www.NILU.noBS\ NILU \ 2010

52
NILU OR 84/2010

53
NILU OR 84/2010
Appendix E
Project Review Presentation

54
NILU OR 84/2010
AQ Management intro \ B Sivertsen, NILU 2010
1
www.NILU.noBS\ NILU \ 2010
Scott Randall
Kjeller, Norway
25 October 2010
SR \ NILU \ 2010www.NILU.noBS\ NILU \ 2010
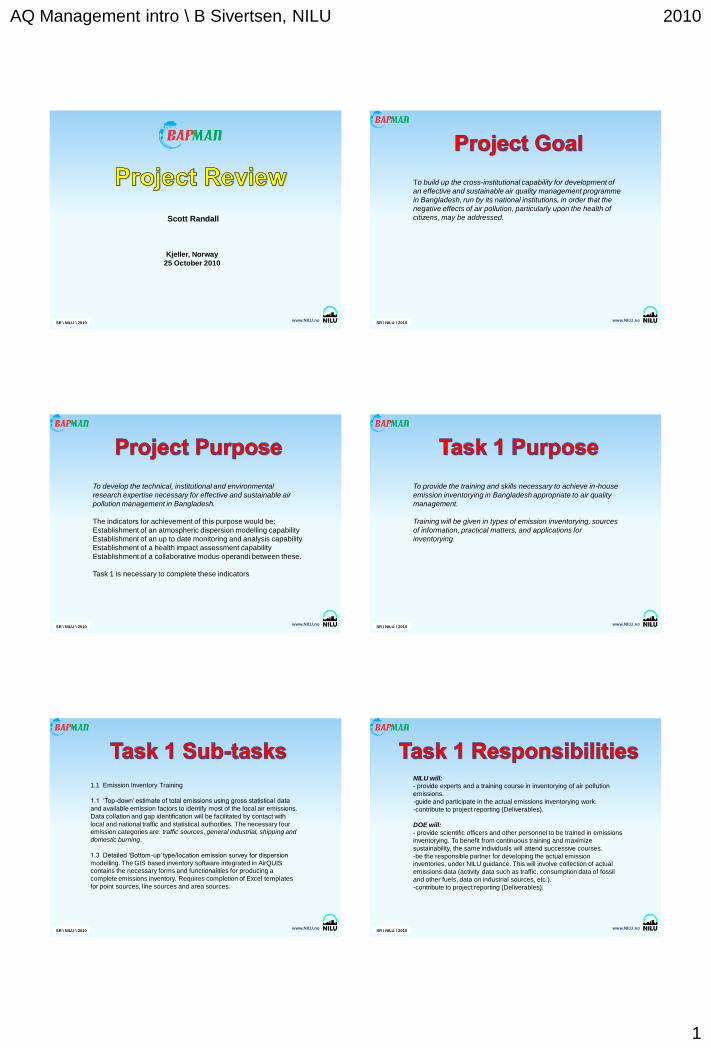
To build up the cross-institutional capability for development of
an effective and sustainable air quality management programme
in Bangladesh, run by its national institutions, in order that the
negative effects of air pollution, particularly upon the health of
citizens, may be addressed.
SR \ NILU \ 2010
www.NILU.noBS\ NILU \ 2010
To develop the technical, institutional and environmental
research expertise necessary for effective and sustainable air
pollution management in Bangladesh.
The indicators for achievement of this purpose would be:
Establishment of an atmospheric dispersion modelling capability
Establishment of an up to date monitoring and analysis capability
Establishment of a health impact assessment capability
Establishment of a collaborative modus operandi between these.
Task 1 is necessary to complete these indicators
SR \ NILU \ 2010www.NILU.noBS\ NILU \ 2010
To provide the training and skills necessary to achieve in-house
emission inventorying in Bangladesh appropriate to air quality
management.
Training will be given in types of emission inventorying, sources
of information, practical matters, and applications for
inventorying.
SR \ NILU \ 2010
www.NILU.noBS\ NILU \ 2010
1.1 Emission Inventory Training
1.1 ‘Top-down’ estimate of total emissions using gross statistical data
and available emission factors to identify most of the local air emissions.
Data collation and gap identification will be facilitated by contact with
local and national traffic and statistical authorities. The necessary four emission categories are: traffic sources, general industrial, shipping and
domestic burning.
1.3 Detailed ‘Bottom-up’ type/location emission survey for dispersion
modelling. The GIS based inventory software integrated in AirQUIS contains the necessary forms and functionalities for producing a
complete emissions inventory. Requires completion of Excel templates
for point sources, line sources and area sources.
SR \ NILU \ 2010www.NILU.noBS\ NILU \ 2010
NILU will:- provide experts and a training course in inventorying of air pollution
emissions.
-guide and participate in the actual emissions inventorying work.
-contribute to project reporting (Deliverables).
DOE will:
- provide scientific officers and other personnel to be trained in emissions
inventorying. To benefit from continuous training and maximize
sustainability, the same individuals will attend successive courses.
-be the responsible partner for developing the actual emission inventories, under NILU guidance. This will involve collection of actual
emissions data (activity data such as traffic, consumption data of fossil
and other fuels, data on industrial sources, etc.).
-contribute to project reporting (Deliverables).
SR \ NILU \ 2010

AQ Management intro \ B Sivertsen, NILU 2010
2
www.NILU.noBS\ NILU \ 2010
1. Preliminary analysis of Dhaka emissions related source data
and expereience with exercises.
2. Strengthen DoE/CASE Emission Inventory competence to begin
work back in Dhaka:• Data retreival
• Top-down inventory
• Bottom-up inventory
3. Trained staff to become leaders in work and associated sub-tasks at DoE/CASE
DISSCUSION AND QUESTIONS DURING THE ENTIRE
TRAINING SEMINAR IS HIGHLY ENCOURAGED!
SR \ NILU \ 2010

57
NILU OR 84/2010
Appendix F
Initial Project (Task 1) Meeting

58
NILU OR 84/2010

AQ Management intro \ B Sivertsen, NILU 2010
1
www.NILU.noBS\ NILU \ 2010
Scott Randall
Kjeller, Norway
26 October 2010
SR \ NILU \ 2010www.NILU.noBS\ NILU \ 2010
TASK 1 (VTD TL):
• Data needs sheet delivered and waiting for results
• Dhaka grid created and approved by DoE/CASE
• Training: this week, and Jan/February/March 2011 Missions
• Prelim Top-down assessment for Dhaka: GAINS
TASK 2 (LM TL):
• Waiting for station maintenance contract for Dhaka, Status?
• Waiting for new stations tender, Status?
TASK 3 (RuO TL):
• Delayed due to lack of monitoring data
• Februrary/March 2011 Mission to install and train AirQUIS
TASK 4 (KyS TL):
• Begin 2nd year
• Contact with Sarah Hossain
SR \ NILU \ 2010
www.NILU.noBS\ NILU \ 2010
1. Mission 1 Report delivered
2. Dhaka Training Seminar Report delivered
3. NILU Task 1 Training Seminar Report (D1.1, in progress).
4. Future Reports:
• Procedures for emissions inventorying for urban areas in
Bangladesh (D1.2); NILU and DoE/CASE
• NORAD 6 Month status report (February 1, 2011).
• AirQUIS establishment: The system established in
Dhaka, and personnel trained so that the system can be
used sustainably in Bangladesh (D3.1).
SR \ NILU \ 2010www.NILU.noBS\ NILU \ 2010
Mission 2: Passive Sampling Screening Study (Jan/Feb).
Include Task 1 Follow-up.
Mission 3: AirQUIS Installation and training (Feb/Mar).
Include Task 1 Follow-up.
Task 2 AirQUIS Training at NILU 2011.
Task 1 Emission Inventory Training at NILU 2011.
SR \ NILU \ 2010
www.NILU.noBS\ NILU \ 2010SR \ NILU \ 2010www.NILU.noBS\ NILU \ 2010
DoE/CASE
Kjeller, Norway
25 October 2010
SR \ NILU \ 2010

60
NILU OR 84/2010

61
NILU OR 84/2010
Appendix G
“Data Needs” Sheet

62
NILU OR 84/2010

63
NILU OR 84/2010
P
rio
rity
Re
sp.
Ava
ilab
le?
Age
ncy
/Co
nta
ct
No
.N
ame
De
fin
itio
nTy
pe
of d
ata
1R
egi
on
sA
dm
inis
tati
on
bo
rde
rs o
f dif
fere
nt
regi
on
leve
lsD
igit
al o
r p
ap
er
ma
ps,
GIS
pre
ferr
ed
1V
TDo
bta
ine
d
2P
op
ula
tio
nn
um
be
r o
f pe
op
le o
f ea
ch r
egi
on
sta
tist
ic n
um
be
r, G
IS p
refe
rre
d1
MR
yes
DC
C
3To
po
gra
ph
yH
eig
ht
ab
ove
ave
rage
se
e le
vel
Gri
dd
ed
(pre
fer)
or
po
inte
d d
ata
set
of t
err
ain
, GIS
3?
4R
oa
d m
ap
sM
ain
tra
ffic
sys
tem
of D
ha
kaG
IS s
ha
pe
file
of r
oa
d n
etw
ork
1V
TDo
bta
ine
dD
oE
No
.N
ame
De
fin
itio
nTy
pe
of d
ata
1A
ir q
ua
lity
da
taB
ack
gro
un
d a
nd
urb
an
co
nti
nu
ou
s m
ea
sure
me
nt
da
ta in
an
y ti
me
re
solu
tio
n: h
ou
rly,
da
ily,
we
ekl
y, a
nn
ua
l ave
rage
NO
x/N
O2
, O3
, CO
, PM
10
/PM
2.5
, SO
22
VTD
, Do
E
his
tori
cD
oE
2M
ete
oro
logy
da
taM
ete
oro
logy
da
ta fr
om
me
asu
rem
en
t st
ati
on
or
air
po
rt o
r
sate
lite
Win
d D
ire
stio
n (W
D),
Win
d S
pe
ed
(WS)
, Up
pe
r Te
mp
era
ture
(~2
5m
) (U
pp
erT
), L
ow
er
Tem
pe
ratu
re (~
2m
) (Lo
we
rT),
De
lta
Tem
pe
ratu
re (?
T), P
reci
pit
ati
on
, Re
lati
ve H
um
idit
y (R
H)
1V
TD
ob
tain
ed
No
.N
ame
De
fin
itio
nTy
pe
of d
ata
1So
urc
e s
ect
ors
Cla
ssif
yin
g a
ir p
oll
uti
on
ind
ust
ria
l so
urc
es.
• B
rick
s p
rod
uct
ion
• Sm
elt
ing
• P
ow
er
pla
nts
(co
al +
nat
ura
l gas
)
• C
em
en
t p
rod
uct
ion
• St
ee
l fu
rna
ce
• G
lass
furn
ace
• P
ap
er
pro
du
ctio
n
• P
last
ic
• Fo
od
pro
cess
ing,
No
od
le, V
ege
tab
le o
il
• B
eve
rage
• Fu
rnit
ure
• Te
xtil
e, d
ye
• To
ba
co
• P
est
icit
e
1M
R
litt
leD
oE
qu
est
ion
air
es
ne
ed
ed
2O
wn
er
an
d P
lan
t re
gist
er
Ad
min
istr
ati
ve in
form
ati
on
Na
me
, ad
dre
ss, c
on
tact
info
rma
tio
n2
ma
ybe
BU
ET
3St
ack
da
taTh
e p
hys
ica
l an
d g
eo
gra
ph
ica
l in
form
ati
on
of e
ach
sta
ck
wit
hin
an
ind
ust
ry
coo
rdin
ate
, sta
ck h
eig
ht,
dia
me
ter,
ga
s te
mp
era
ture
, ga
s
velo
city
, ga
s fl
ow
ra
te, h
eig
ht
an
d w
idth
of b
uil
din
gs a
rou
nd
th
e
sta
ck
2
ma
ybe
BU
ET
4C
lea
nin
g d
evi
ceC
lea
nin
g d
evi
ce a
nd
it’s
eff
icie
ncy
use
d b
y in
du
stry
pro
cess
es
Spe
cifi
c co
mp
on
en
ts r
ed
uct
ion
eff
icie
nci
es
an
d w
hic
h s
tack
it is
con
ne
cte
d t
o2
ma
ybe
BU
ET
5P
roce
ss d
ata
Co
nsu
mp
tio
n a
mo
un
t o
f a c
ert
ain
fue
l or
the
dir
ect
em
issi
on
am
ou
nt
for
ea
ch p
roce
ss
am
ou
nt
of a
ll t
ype
of f
ue
ls c
on
sum
pti
on
an
d/o
r e
mis
sio
n fr
om
th
e
pro
cess
2m
ayb
eB
UET
6P
roce
ss e
mis
sio
n fa
cto
r
Emis
sio
n fa
cto
rs a
re r
ati
os
tha
t re
late
em
issi
on
of
po
llu
tio
n t
o a
n a
ctiv
ity
at
a p
lan
t su
ch a
s a
mo
un
t o
f fu
el
use
d. P
roce
ss e
mis
sio
n fa
cto
rs fo
r e
ach
fue
l-co
mp
on
en
t
em
issi
on
fact
or
com
po
ne
nt,
em
issi
on
fact
or
valu
e2
ma
ybe
BU
ET
Ge
ogr
aph
ical
dat
a
Po
int
Sou
rce
s
His
tori
c M
eas
ure
me
nt
dat
a

64
NILU OR 84/2010
No
.N
ame
De
fin
itio
nTy
pe
of d
ata
1R
oa
d c
lass
es
Typ
es
of r
oa
d c
lass
es
nu
mb
er
of r
oa
d c
lass
es
an
d r
oa
d t
ype
s li
ke h
igh
wa
ys, n
ati
on
al
roa
ds,
cit
y m
ain
ro
ad
s, in
du
stri
al a
rea
ro
ad
s a
nd
so
me
imp
ort
an
t
min
or
roa
ds
1M
R
yes
2R
egi
stra
ted
Ve
hic
le
Cla
sse
s (R
VC
)Ty
pe
of v
eh
icle
sLi
ght,
He
avy
an
d v
ery
He
avy
Ve
hic
les
1M
R/G
Sye
s
3R
oa
d n
od
es
Ro
ad
no
de
s d
efi
ne
th
e s
tart
an
d e
nd
po
int
for
a r
oa
d li
nk
(x,y
) co
ord
ina
te a
nd
he
igh
t a
bo
ve g
rou
nd
of t
he
no
de
s1
VTD
yes
4St
ati
c tr
aff
ic d
ata
Sta
tic
pro
pe
rtie
s o
f th
e r
oa
d li
nk
Len
gth
, dir
ect
ion
, to
tal w
idth
(no
t in
clu
din
g si
de
wa
lks)
for
ea
ch
dir
ect
ion
, gra
die
nt
(%)
1V
TDye
s
5D
yna
mic
tra
ffic
da
ta
Dyn
am
ic d
ata
on
th
e r
oa
d li
nks
AD
T (a
nn
ua
l da
ily
tra
ffic
) is
tota
l nu
mb
er
of v
eh
icle
s o
f all
ve
hic
le
typ
es
for
the
ro
ad
lin
k d
ire
ctio
n, s
pe
ed
lim
it o
n t
he
ro
ad
lin
k in
km/h
.
3
no
6V
eh
icle
dis
trib
uti
on
pe
rce
nta
ge (%
) of R
egi
stra
ted
Ve
hic
le C
lass
es
(RV
C) a
nd
tim
e v
ari
ati
on
on
ea
ch r
oa
d li
nks
pe
rce
nta
ge o
f lig
ht,
he
avy
, ve
ry h
ea
vy v
eh
icle
s a
t e
ach
ro
ad
lin
k o
r
roa
d c
lass
for
ea
ch d
ire
ctio
n3
no
8Em
issi
on
Ca
lcu
late
d
Ve
hic
le C
lass
es
(EC
VC
)
The
su
b c
lass
of R
egi
stra
ted
Ve
hic
le c
lass
es
(RV
C) i
s n
am
ed
Emis
sio
n C
alc
ula
ted
Ve
hic
le C
lass
es
(EC
VC
). C
lass
ify
veh
icle
s in
to c
art
ego
ry li
ke m
oto
bik
es,
die
sel/
gaso
lin
e
cars
, lig
ht
tru
cks,
he
avy
du
ty t
ruck
s, b
uss
es,
…
Sep
ara
te b
etw
ee
n d
iffe
ren
t te
chn
olo
gie
s (P
reca
t, E
UR
O1
, 2,3
…)
Ave
rage
Mo
de
l Ye
ar,
Ave
rage
Dri
vin
g D
ista
nce
2SR
/VTD
no
9EC
VC
– R
VC
Dis
trib
uti
on
The
co
up
lin
g b
etw
ee
n t
he
Em
issi
on
Ca
lcu
late
d V
eh
icle
Cla
sse
s (E
CV
C) a
nd
Re
gist
ere
d V
eh
icle
Cla
sse
s (R
VC
)
pe
rce
nta
ge o
f EC
VC
s fo
r o
ne
RV
C. T
he
su
m o
f pe
rce
nta
ge v
alu
es
for
on
e R
VC
mu
st b
e 1
00
%.
2SR
/VTD
no
10
ECV
C –
Fu
el C
on
sum
pti
on
the
ra
nge
of f
ue
l co
nsu
mp
tio
n fo
r e
ach
EC
VC
de
pe
nd
ing
on
the
sp
ee
d
Dri
vin
g sp
ee
d (k
m/h
), F
ue
l co
nsu
mp
tio
n (l
/km
)
2SR
/VTD
no
11
ECV
C B
asi
c a
nd
Age
ing
Fact
orsTh
e b
asi
c fa
cto
r is
th
e fu
el o
r e
mis
sio
n fa
cto
r fo
r th
e
Ave
rage
Mo
de
l Ye
ar
for
a g
ive
n E
CV
C.
The
agi
ng
fact
or
ad
just
s th
e fu
el c
on
sum
pti
on
or
em
issi
on
for
the
calc
ula
tio
n y
ea
r
Ba
sic
fact
or
(g/l
if it
is
fue
l ba
sed
an
d g
/km
if it
is t
raff
ic b
ase
d),
Agi
ng
fact
or
for
the
EC
VC
.
2
SR/V
TD
no
12
ECV
C S
pe
ed
De
pe
nd
en
cy F
act
ors
Each
EC
VC
/em
issi
on
co
mp
on
en
t/sp
ee
d c
om
bin
ati
on
ha
s
its
ow
n s
pe
ed
de
pe
nd
en
cy fa
cto
r. O
nly
tra
ffic
ba
sed
em
issi
on
co
mp
on
en
ts a
re u
sin
g th
e s
pe
ed
de
pe
nd
en
cy
fact
ors
Dri
vin
g sp
ee
d (k
m/h
), S
pe
ed
de
pe
nd
en
cy fa
cto
r
2
SR/V
TD
no
No
.N
ame
De
fin
itio
nTy
pe
of d
ata
1So
urc
e s
ect
ors
Are
a s
ou
rce
s a
re m
ore
dif
fuse
so
urc
es
of p
oll
uti
on
, an
d a
re
pro
vid
ed
on
an
are
a b
asi
s e
ith
er
for
ad
min
istr
ati
ve a
rea
s,
such
as
cou
nti
es,
mu
nic
ipa
lity
etc
, or
for
regu
lar
grid
s
• e
mis
sio
ns
fro
m c
oa
l bu
rnin
g
• e
mis
sio
ns
fro
m B
rick
pla
nts
• e
mis
sio
n fr
om
wo
od
bu
rin
g
• e
mis
sio
ns
fro
m s
ma
ll r
oa
ds
• e
mis
sio
n fr
om
wa
ste
bu
rnin
g2
MR
ma
ybe
min
istr
y o
f en
erg
y, t
ita
s
2R
egi
on
va
lue
sA
rea
so
urc
e v
alu
es
give
th
e a
mo
un
t o
f co
nsu
mp
tio
n o
r
em
issi
on
da
ta fo
r e
ach
re
gio
n o
r gr
id c
ell
Typ
e a
nd
am
ou
nt
of f
ue
l, U
nit
(to
n/y
ea
r) o
r C
om
po
ne
nt
an
d
am
ou
nt
of e
mis
sio
n, U
nit
(to
n/y
ea
r) fo
r e
ach
re
gio
n o
r gr
id c
ell
2M
R
ma
ybe
min
istr
y o
f en
erg
y, t
ita
s
3R
egi
on
Em
issi
on
Fa
cto
r V
alu
esSp
eci
fy e
mis
sio
n fa
cto
rs fo
r e
ach
fue
l-co
mp
on
en
t -s
ou
rce
sect
or
an
d r
egi
on
Fue
l typ
e a
nd
th
e e
mis
sio
n fa
cto
r is
va
lid
for
it, U
nit
(kg/
ton
)2
MR
ma
ybe
min
istr
y o
f en
erg
y, t
ita
s
Lin
e s
ou
rce
s
Are
a so
urc
es

65
NILU OR 84/2010
Appendix H
Emissions Inventory Introduction Presentation

66
NILU OR 84/2010

11/23/2010
1
NILU
Making a difference for the environment
Agenda- Emission Inventory
• AirQUIS generally• Questionnaires• Emission Inventory Module• Geographical Module and Map Interface (GIS)• Emission Model
Information flow
Emission → Questionnair → Templates → AirQUIS
→ → →
Concept Of AirQUIS
POINT EMISSIONS
EmissionInventory
Models
Wind Field
Emission
Dispersion
Exposure
GISMeasurement
QA/QC
Statistics
ADACS(Automatic Data
Acquisition System)
Area Sources
Line Sources
Point Sources
Database
Data are located at one place only and entered only
once into the database
The same data are used at several places
Data are defined by references to existing data
AirQUIS Functionality Tools
• Toolbar
• Standard Windows functionality
• Help and tool tips
• Data import and data export
• Overwrite data
• Delete data

11/23/2010
2
Data Import and Export
Data collection
• Excel file templates for data collection
Data import
• Data are imported by drag and drop from xls-files
• Data imported into the presentation spread or import spread
Data export
• Data are exported by copying data from spread
Overwriting and Deleting Data
Overwrite
– It is possible to overwrite data in same way as importing data by using drag and drop. The system checks if the data are new or if a unique key exist.
Delete data
– Data are possible to delete in the presentation spread
Lookup Definition
Simple basis tables used for building more
complex data classes
Data that may be different for different
locations (projects)
Data that change little in time
General Lookup
Components (partly predefined): Any measured quantity (
pollution, meteorology)
Units (partly predefined): The system has a set of predefined
units. All units are assigned to a unit type (e.g. “mass”, “mass
per time”)
Validity period (user defined): Predefined time period to use in the system e.g time period to decide for example statistic calculations period and model calculation period
Questionnairs• First step in building an emission database
• Identify the sources
From industry
From traffic
From houses
Other
Questionnairs

11/23/2010
3
Questionnairs
What is an Emission Inventory?
Atmospheric emissions inventory is a compilation of all sources of air pollution within an area
Emission Inventory Features
Emission inventory Lookups
Point emission
Line emission
Area emission
Why Emission Inventory?Air quality assessment
Evaluating the sources
Air Quality Management
Abatement strategy
Measure trends over time
How to prepare an emission inventory?
Inventory of emission sources and air pollutants referred to specific geographical areas in defined periods of time

11/23/2010
4
Detailed description of an inventory:
– Geographic area (geographic domain for the inventory)
– Pollutants (purpose the inventory)
– Source Categories (Anthropogenic/Natural sources)
– Modelling (Geographically/time resolution, Pollutant species)
– Spatial resolutions
– Temporal resolution (variability of emissions over time)
– Base year (reference year)
Two different approaches:a) top-down inventory
– Activity statistics (consumption,production,vehicle type etc)
– Population statistics, land-use and emission factors
– Detailed information about
location not required
Two different approaches: b) bottom-up inventory
– Detailed knowledge of source types and locations
– Specific emissions for individual sources
– Consumption and or production
– Data using emission factors
AirQUIS organizes and stores data in a bottom up inventory coupled to the integrated GIS
• Static road data (Geography, road classification)
• Dynamic traffic data
• Emission factors• Time variation
• Consumption• Emission
• Production
• Source sector• Fuel /Raw material
• Emission factors
• Time variation
Point Sources Line Sources Area sources
Modeling
• Industry• Stacks
• Consumption
• Emission• Production
• Emission factors
• Time variation
Calculation of Emission
Geographical Information System (GIS)
Modelling
The Emission Inventory Module organizes the emission data by 3 types of sources
Model
calculations
Emissions from
point sources
Emissions from
area sources
Emission
distributed
as grid
Emission
distributed
as line
Emission
distributed
as point
Emissions from
line sources
(Temperature correction)
Classification of sources
Source sectors
– classification of emission source sectors, sub-
sectors and activities (e.g. Corinair,)
Fuels/Raw Material/Product
Time variations for individual sources and
source sectors

11/23/2010
5
Fuel
Fuel ID Name
8 Gasoline
19 Diesel
1 Coal
2 Coke
Examples of fuels and source sectors:
Source Sectors
Source Sector ID
Source Sector Name
1000 Stationary combustion
1100 Industry and energy sectors
1200 Primary industries
1300 Private services
1400 Public administration
Time Variations
Factors for scaling annual emissions/consumptions to weekly,
daily,hourly or half hourly emissions
Hierarchical structure (sub-time variations)
Specific validity period (1995, w1-w52 etc)
Sum of factors for all time steps is 1.0
Sub-factors are multiplied to find the most detailed factor
Time Variations - Example
Find traffic TV-factor for Monday 16. January 1998 at 0700:
TV-factor for any week in 1998 is 1/52
TV-factor for Mondays is 3/20
TV-factor for hour 7 on weekdays is 2/25
TV-factor for Monday 16. January 1998 at 0700 =(1/52) * (3/20) * (2/25)
Point sources are single sources
Stack
IndustryStack
Cleaning
device
Cleaning
deviceProcess
Process
Point source data:
• General facility identification
• Physical and geographical information of each stack
• Emission and release characteristics
Emission Inventory - Point Sources
Owners
Industries
Stack data
Position of stacks
Process data
Consumption or production data
Measured emission data
Source identification and
description
Emission Inventory-Ex.: Stack data
Stack ID Stack name
X Co-
ordinate
Y Co-
ordinate
Stack
height
(m)
Stack
Diameter
(m)
Gas
Temperat
ure (C)
Gas
Velocity
(m/s)
Gas Flow
Rate
(m^3/s)
Building
Height
Building
Width
Industrial Plant
Name
30100501 Pipe 301005-1 600669 6645282 10 0.5 130 16.27 3.19 5 10 Industry nr 301005
30100601 Pipe 301006-1 598856 6646044 20 0.5 178 10 2.00 5 10 Industry nr 301006
30101201 Pipe 301012-1 604096 6646518 46 0.9 250 20 6.67 18 28 Industry nr 301012
30101301 Pipe 301013-1 600071 6644966 14 0.4 190 12.6 10.00 6 10 Industry nr 301005
30101502 Pipe 301015-2 598835 6644487 40 3 225 5 35.34 18 40 Industry nr 301006
30101901 Pipe 301019-1 604474 6649890 30 0.8 110 20 10.00 12 18 Industry nr 301012
Stack data

11/23/2010
6
Emission Inventory-Ex.: Consumption data
Process ID Process Name Fuel name
Consu
mption
Amount Unit name
Time
variation
Name
Validity
Period
30100501 Prosess 301005-1 Hard coal 190.987 ton/year 1998
30100601 Prosess 301006-1 Brown coal 175.075 ton/year 1998
30101202 Prosess 301012-2 Natural gas 889.427 ton/year 1998
30101201 Prosess 301012-1 Heavy fuel oil 2.74308 ton/year 1998
30101302 Prosess 301013-2 Other liquid fuels 366.362 ton/year 1998
Process Fuel and Raw material Consumption Data
Concept of Area Sources
Area sources
Regions ID
Emission/Consumption Value
Emission factors
Area Sources
Stationary combustion
• Consumption dataset for combinations of source sectors and fuel
• Emission factors for different components for the same combinations
Process emissions and evaporation:
• Emission dataset for combinations of source sectors and components
Area Sources -Input
Regions (polygons) or grids
Fuels/components
Source sectors
Time Variations
Consumption or emission data
Emission factors
Order of Importing Area Sources
Area Source Definition:
– Defines the geographical properties
– Defines the emission properties
Area Source Values:
– Emission/consumption values for each geographical region
Emission Inventory - Area sources
Small or numerous sources not handle individually such as combustion, open air burning, dry cleaners etc. or nonpoint sources that emits over a geographical area e.g. residential cooking and heating • Consumption/production data for fuel or product for
each source sector
• Emission factors for the combination of fuel consumption or product produced for each source sector
Emissions and evaporation: • Estimated emissions and diffuse
leakages for different sources

11/23/2010
7
Area sources
Fuel combustion sources
– Stationary sources (residential cooking, heating etc.
– Open burning (agriculture, waste etc.)
Fugitive sources
– VOC -Domestic LPG, gasoline stations
– PM – dust from roads, agriculture, constructions
Emission Inventory-Ex.: Area sources
Data
set ID Data set name Source sector Name
Compo
net
Name
Dataset
unit ID Region level
Ground level
source(ground
level=0, not
ground level=1)
1 Emission from PM2.5 from woddburning COMBUSTION IN MANUFACTURING INDUSTRYPM25 ton/year 4 02 Emission from PM2.5 from industry Other furnaces PM25 ton/year 4 08 Emission from PM10 from industry WASTE TREATMENT AND DISPOSAL PM10 ton/year 4 0
Region Data Defintion Emission
Area source emission estimates
Emission factors and activity data
– E.g. fuel used, production rate
– Population/ households/land use
Surveys (measurement/ sampling)
Line Sources are sources emitting over a line Static data:
• geographical location
• static information (shape, width,
gradient, etc).
End
node
Lane 1
•Width
•ADT
•Speed
Start
node
Lane direction 1
(start to end)
Lane 2
• Width
• ADT
• Speed
Sub nodes
Dynamic data:
annual daily traffic
•average speed
•vehicle distributions for different
vehicle classes
Statistics on distribution of technology classes, fuels and age
Emission factors
Traffic Emission Factors
– Select the factor set year• Emission calculation vehicle classes (ECVC)
• Emission calculation vehicle classes – Registration vehicle class Distribution
• Average fuel consumption
• Basic and aging factors
• Speed dependency factors
• Road gradient factors
• NO2 percentage of NOx
• PM10 data
Emission inventory –Example traffic data
ID number Road Vehicle Class (RVC) Name
Heavy Duty (0 = not heavy
duty, 1= heavy duty)
1 Light duty vehicles 0
2 Heavy duty vehicles 1
3 Buses 1
Road Vehicle Classes (RVC)

11/23/2010
8
Data Type
Organize data in the Emission Inventory Module
• Consumption
• Emission data
Dataset Type
Organise input and model results data
• Region data set
• Field data set
• Building point data set
• Receptor point data set
• Stack data set
• Line data set
The success in urban scale modelling is in the description of the emission sources!
→ → →
No chain is stronger than the weakest link
The success in urban scale modeling is in the description of the emission sources!
Geographical Information System (GIS)
The GIS functionality of the AirQUIS system is designed to offer several possibilities for
understanding the problems of air pollution
Concept of Geographical Information System (GIS)
Visualization information
Showing relationships
Creating and updating data
Solving problems
Presenting results

11/23/2010
9
AirQUIS GIS GIS Features
Maps and GIS
• AirQUIS themes
• Shape themes
Presentation of data by using GIS
Searching the database through GIS
Entering and editing data through GIS
Regions and region levels
GIS Advantage (I of II)• GIS makes it easier to place the air pollution sources in the
correct locations for example by displaying the road link network in
a city.
• GIS makes it easier to search for geographical linked data in the
database
• GIS presentation of area distributed consumption and emission
data gives a good overview of where to expect high impact of air
pollution
• Viewing the measurements station on a map together with the
pollution sources will give an idea of what concentrations one
expect for different wind directions and the representatively of the
stations.
GIS Advantage (II of II)
• Display the model results on a map gives a visual
presentation of the geographical distribution of air
pollution and regions with high impact.
• Display the model results on a map can be used
for public information on pollution levels in different
parts of a city
GIS - Map Themes
Shape Themes
– Not connected to data in the AirQUIS database
AirQUIS Themes
– Geographically linked data from the AirQUIS database
Data and model results
NOx emissions from domestic wood
burning (t/y) and industrial sources (g/s)Annual Daily Traffic
Connecting emissions to GIS improves the ability to assess and manage the emissions

11/23/2010
10
Emission Inventory for Air Quality ModellingGeographical and temporal resolved emission
Pollutant species
QA/QC
All sources represented Model
calculations
Input from the Point
Source module
Input from Area
sources module
Emission
distributed
as grid
Emission
distributed
as line
Emission
distributed
as point
Input from the Line
source module
Emission Model
Emission Model
Area sources: – Uses emission factors, time variations and temperature variation
to calculate hourly emissions from annual consumption of fossil fuels for area sources
Line sources:– Uses road and traffic data, road and traffic classification, emission
factors, traffic dependencies and time variations to calculate emissions from line sources
Point sources– Uses physical stack data, process consumption or emission data,
emission factors and time variations to calculate emissions from point sources
Emission Model Input
Area source emissions
Line source emissions
Point sources emissions
Temperature, Relative Humidity and Precipitation
www.nilu.no

77
NILU OR 84/2010
Appendix I
AirQUIS Introduction Presentation

78
NILU OR 84/2010

23.11.2010
1
Agenda
Introduction to NILU’s Software and Hardware Development group
From Sensor to Web
AirQUIS Monitoring
AirQUIS Portal
AirQUIS Information
AirQUIS Modelling
Data Integration
Software
Hardware
Development
Software and Hardware Development (SHaDe)
- 8 software developers
- 2 hardware developers
- 2 project assistant
- 2 project coordinators
Software and Hardware Development (SHaDe)
What we do
• We develop innovative software and hardware products
• Working primarily within the .Net platform
• We focus on providing quality within theentire Development Life Cycle
DesignThink Implement
Planning
Phase
Specification
Phase
Design
Phase
Build
Phase

23.11.2010
2
Air Quality and Meteorology data from Sensor to Web The AirQUIS ProductsAirQUIS Monitoring
AirQUIS InformationModel data
Emission data
Monitoring data
AirQUIS Portal
AirQUIS Modelling
(CMS)
AirQUIS Web Page
lnstruments / data loggers
Existing Data
collection system
AirQUIS Information / Viewer
Monitoring data(Oracle)
Alternative 1:-Data exports regulary from the existing data collection system in a
well-defined file structure (ASCII or XML format).-Imports by the AirQUIS Import Schedule Module into the AirQUIS
database
Existing
Monitoring
database
Data Integration

81
NILU OR 84/2010
Appendix J
Brick Kiln Questionnaire (Draft)

82
NILU OR 84/2010

83
NILU OR 84/2010
EMISSIONS INVENTORY QUESTIONNAIRE: Brick Kilns
1. GENERAL COMPANY INFORMATION 1.1 Name of factory/field:
1.2 Address: 1.3 Brick Kiln Type (check type):
___BTK ___ZigZag ___FCK ___Hoffman ___OTHER:
1.4 Name of contact person: 1.5 Title of contact person:
1.6 Contact information (telephone/fax/email): 1.7 Other contact information:
1.8 Site coordinates (X,Y):
2. STACK DATA (One questionnaire form for each stack)
Stack Name/No. Stack
Height (m)
Stack Diameter
(m)
Exit Gas Temp.
(oC)
Exit Gas Velocity
(m/s)
Exit Gas Flow Rate
(state units)
Cleaning Device?
(If yes, specify type)
3. PROCESS/BATCH FUEL CONSUMPTION DATA
Process Name/No. Fuel Name (coal, wood, gas, etc.)
Sulphur Content (%)
Fuel Consumption Rate (State Units)
4. FUEL BURNING PROCESS/BATCH DATA
Process Name/No.
Production Rate (State Units)
Normal Operating Schedule
Start of production season
End of production season
Hrs/ Day
Days/ Wk
Wk/ Yr
Day, month Day, month
5. FACTORY PRODUCTION DATA
Factory Goods produced Production
(State Units) Year
Brick Kiln Bricks 2010
Bricks 2009
Bricks 2008
DoE/CASE Internal Information
Assigned Factory ID# Verify Coordinates (X,Y)
Notes: DoE QC person and date:

84
NILU OR 84/2010

85
NILU OR 84/2010
Appendix K
Other Industry Questionnaire Draft

86
NILU OR 84/2010

87
NILU OR 84/2010
EMISSIONS INVENTORY QUESTIONNAIRE: Other Industry (not Brick Kilns)
1. GENERAL COMPANY INFORMATION 1.3 Name of factory/field:
1.4 Address: 1.3 Industry (check type):
__Cement __Fertilizer __Power Prod. __Smelter __Gas __Other:
1.4 Name of contact person: 1.5 Title of contact person:
1.5 Contact information (telephone/fax/email): 1.7 Other contact information:
1.8 Site coordinates (X,Y):
2. STACK DATA
Stack Name/No. Stack
Height (m)
Stack Diameter
(m)
Exit Gas Temp.
(oC)
Exit Gas Velocity
(m/s)
Exit Gas Flow Rate
(state units)
Cleaning Device?
(If yes, specify type)
3. PROCESS/BATCH FUEL CONSUMPTION DATA
Process Name/No. Fuel Name (coal, wood, gas, etc.)
Sulphur Content (%)
Fuel Consumption Rate (State Units)
4. FUEL BURNING PROCESS/BATCH DATA
Process Name/No.
Production Rate (State Units)
Normal Operating Schedule
Start of production season
End of production season
Hrs/ Day
Days/ Wk
Wk/ Yr
Day, month Day, month

88
NILU OR 84/2010
4. FACTORY PRODUCTION DATA
Factory Goods produced Production
(State Units) Year
5. PROCESS EMISSION DATA (IF AVAILABLE) Process
Name/No. Stack
Name/No. (leave blank if
fugitive emission)
Components Emitted
Emission Rate (State Units)
Basis of Calculation (Measurement, emission
factor, mass balance)
Year of Measure-
ment
SO2
NOx
CO
PM10
TOC
Other:
SO2 NOx CO
PM10 TOC
Other:
SO2 NOx CO
PM10 TOC
Other: DoE/CASE Internal Information
Assigned Factory ID# Verify Coordinates (X,Y)
Notes:
DoE QC person and dates:

89
NILU OR 84/2010
Appendix L
GAINS Data Analysis for Dhaka

90
NILU OR 84/2010

AQ Management intro \ B Sivertsen, NILU 2010
1
www.NILU.noBS\ NILU \ 2010
Scott Randall
Kjeller, Norway
29 October 2010
SR \ NILU \ 2010www.NILU.noBS\ NILU \ 2010
The GAINS model (Greenhouse Gas and Air Pollution Interactions
and Synergies):
•developed at IIASA (International Institute for Applied Systems
Analysis)
•under the program ADP (Atmospheric Pollution and Economic
Development)/CIAM (Centre for Integrated Assessment Modelling)
•The primary purpose of GAINS is to provide linkages between air
pollution emissions and GHGs while considering mitigating control
options and related costs.
SR \ NILU \ 2010
www.NILU.noBS\ NILU \ 2010
•The model considers emissions of:
Carbon dioxide (CO2)
Methane (CH4)
Nitrogen oxides (NOx)
Nitrous oxide (N2O)
Particulate matter (TSP, PM10, PM2.5 and PM1)
Sulfur dioxide (SO2)
Volatile organic compounds (VOC)
Ammonia (NH3)
Carbon monoxide (CO)
Fluorinated greenhouse gases (F-Gases)
•Topics:
Economic Activity Pathways (sectors and activities)
Emission Control Strategies (mitigation)
Emissions Scenarios (user-specific)
Emission Control Costs (related to mitigation)
Impacts (health)
SR \ NILU \ 2010www.NILU.noBS\ NILU \ 2010
•Visit model: http://gains.iiasa.ac.at/gains/IND/index.login?logout=1
•Login
•Emissions tab
•Select PM
•Select ”Totals by GAINS Region”
•Select Scenario (baseline_08), Region (Dhaka), PM Fraction (PM10)
•”Show data table”
•Copy and paste into excel, format cells to numbers
•Insert graph
•Select data
•Format graph
SR \ NILU \ 2010
www.NILU.noBS\ NILU \ 2010
•Basic report analyzing following components:
•SO2,
•NOX,
•PM2.5,
•PM10,
•CO2,
•GHGs (which includes CO2, CH4, N2O, and FGAS)
• Utilizing the following topics:
•Activity (coal, wood, bensine)
•Sector (Transport, Residential, Industrial, Agricultural)
•Sub-Sectors (cars, brick kilns, cement factories, cooking stoves)
•Sector-Activity (sub-sectors ”ie. stoves” from activity ”ie. wood”)
•Controls (mitigation)
•Costs (associated with mitigations)
SR \ NILU \ 2010www.NILU.noBS\ NILU \ 2010SR \ NILU \ 2010
0
20
40
60
80
100
120
1990 1995 2000 2005 20102015
20202025
2030
Kt/year
Total Emissions - Dhaka
SO2
NOX
PM2.5
PM10

AQ Management intro \ B Sivertsen, NILU 2010
2
www.NILU.noBS\ NILU \ 2010SR \ NILU \ 2010
0
5
10
15
20
25
30
35
40
45
1990 1995 2000 2005 2010 2015 2020 2025 2030
Mt CO2 equivalent/year
Total GHG Emissions - Dhaka
CO2
CH4, N2O, FGAS
www.NILU.noBS\ NILU \ 2010SR \ NILU \ 2010
0
5
10
15
20
25
30
35
40
45
50
1990 1995 2000 2005 2010 2015 2020 2025 2030
kt PM/year
PM2.5 Emissions - Dhaka
www.NILU.noBS\ NILU \ 2010SR \ NILU \ 2010
0
5
10
15
20
25
30
35
40
1990 1995 2000 2005 2010 2015 2020 2025 2030
kt PM
PM2.5 Emissions Activity Distribution - Dhaka
Hard coal, grade 2
Biomass fuels
Agricultural residuals - direct use
Fuelwood direct
Heavy fuel oil
Medium distillates (diesel, light fuel oil)
Gasoline and other light fractions of oil
Natural gas (incl. other gases)
Non exhaust PM emissions - road abrasion
Non exhaust PM emissions - brake wear
Non exhaust PM emissions - tyre wear
No fuel use
www.NILU.noBS\ NILU \ 2010SR \ NILU \ 2010
0
5
10
15
20
25
kt PM
PM2.5 Emissions Activity Distribution - Dhaka, 2010
www.NILU.noBS\ NILU \ 2010SR \ NILU \ 2010
0
5
10
15
20
25
30
35
40
1990 1995 2000 2005 2010 2015 2020 2025 2030
kt PM
PM2.5 Emissions General Sector Distribution - Dhaka
Transport
Industry
Residential
Agricultural
www.NILU.noBS\ NILU \ 2010SR \ NILU \ 2010
0
2
4
6
8
10
12
14
16
kt PM
PM2.5 Emissions Specific Sector Distribution - Dhaka 2010

AQ Management intro \ B Sivertsen, NILU 2010
3
www.NILU.noBS\ NILU \ 2010SR \ NILU \ 2010
0
2
4
6
8
10
12
14
16
kt PM
PM2.5 Sector Emissons from Activity "No Fuel Use" - Dhaka 2010
www.NILU.noBS\ NILU \ 2010SR \ NILU \ 2010
0
1
2
3
4
5
6
7
8
9
kt PM
PM2.5 Sector Emissons from Activity "Fuelwood direct" - Dhaka 2010
www.NILU.noBS\ NILU \ 2010SR \ NILU \ 2010
0100020003000400050006000700080009000
t PM
Sector-Activity-Technology (Technology only for Control Emissions Scenario)
Sector-Activity PM2.5 Emissions for Control and No-Control Scenarios - Dhaka, 2010
Control Emissions
No Control Emissions
www.NILU.noBS\ NILU \ 2010SR \ NILU \ 2010
Control Measure Abbrwith Control (tons)
without Control (tons)
Difference (tons)
1. Residential-Commercial: Cooking stoves-Fuelwood direct-Biomass stove improved-[10^15 Joules]
DOM_STOVE_C-FWD-STV_IMP_B-[PJ]
167.96 8792.86 8624.90
2. Residential-Commercial: Cooking stoves-Hard coal, grade 2-Coal stove improved -[10^15 Joules]
DOM_STOVE_C-HC2-STV_IMP_C-[PJ]
9.88 278.01 268.13
3. Residential-Commercial: Heating stoves-Fuelwood direct-Biomass stove improved-[10^15 Joules]
DOM_STOVE_H-FWD-STV_IMP_B-[PJ]
14.14 740.45 726.31
4. Industry: Other combustion, grate firing-Hard coal, grade 2-Electrostatic precipitator: 1 field - industrial combustion-[10^15 Joules]
IN_OC1-HC2-IN_ESP1-[PJ]
1.15 114.49 113.34
5. Industry: Other combustion, pulverized-Hard coal, grade 2-Electrostatic precipitator: 1 field - industrial combustion-[10^15 Joules]
IN_OC3-HC2-IN_ESP1-[PJ]
39.42 494.49 455.07
6. Industry: Other combustion, pulverized-Hard coal, grade 2-Electrostatic precipitator: 2 fields - industrial combustion-[10^15 Joules]
IN_OC3-HC2-IN_ESP2-[PJ]
4.51 494.49 489.98
7. Ind. Process: Cement production-No fuel use-Cyclone - -industrial process-[Mt]
PR_CEM-NOF-PR_CYC-[Mt]
33.92 2999.34 2965.42
8. Ind. Process: Cement production-No fuel use-Electrostatic precipitator: 1 field - industrial processes-[Mt]
PR_CEM-NOF-PR_ESP1-[Mt]
67.84 2999.34 2931.50
9. Ind. Process: Cement production-No fuel use-Electrostatic precipitator: 2 fields - industrial processes-[Mt]
PR_CEM-NOF-PR_ESP2-[Mt]
38.76 2999.34 2960.58
10. Ind. Process: Small industrial and business facilities -fugitive-No fuel use-Good practice: ind.process - stage 2 (fugitive)-[M people]
PR_SMIND_F-NOF-PRF_GP2-[M people]
6.84 205.17 198.33
www.NILU.noBS\ NILU \ 2010SR \ NILU \ 2010
0
5
10
15
20
25
MEuro/Year (local cost)
Sector-Activity-Technology (Technology only for Control Emissions Scenario)
Costs for Sector-Activity PM Controls - Dhaka, 2010
www.NILU.noBS\ NILU \ 2010SR \ NILU \ 2010
Control Measure Abbr Cost Meuro/year
tons PM2.5 saved
cost Euro/ton PM2.5 saved
1. Residential-Commercial: Cooking stoves-Fuelwood direct-Biomass stove improved-[10^15 Joules]
DOM_STOVE_C-FWD-STV_IMP_B-[PJ]
0.6170 8624.9 71.54
2. Residential-Commercial: Cooking stoves-Hard coal, grade 2-Coal stove improved -[10^15 Joules]
DOM_STOVE_C-HC2-STV_IMP_C-[PJ]
0.0178 268.13 66.39
3. Residential-Commercial: Heating stoves-Fuelwood direct-Biomass stove improved-[10^15 Joules]
DOM_STOVE_H-FWD-STV_IMP_B-[PJ]
0.0649 726.31 89.36
4. Industry: Other combustion, grate firing-Hard coal, grade 2-Electrostatic precipitator: 1 field - industrial combustion-[10^15 Joules]
IN_OC1-HC2-IN_ESP1-[PJ]
0.0089 113.34 78.52
5. Industry: Other combustion, pulverized-Hard coal, grade 2-Electrostatic precipitator: 1 field - industrial combustion-[10^15 Joules]
IN_OC3-HC2-IN_ESP1-[PJ]
0.1366 455.07 300.17
6. Industry: Other combustion, pulverized-Hard coal, grade 2-Electrostatic precipitator: 2 fields - industrial combustion-[10^15 Joules]
IN_OC3-HC2-IN_ESP2-[PJ]
0.0309 489.98 63.06
7. Ind. Process: Cement production-No fuel use-Cyclone - -industrial process-[Mt]
PR_CEM-NOF-PR_CYC-[Mt]
0.0008 2965.42 0.27
8. Ind. Process: Cement production-No fuel use-Electrostatic precipitator: 1 field - industrial processes-[Mt]
PR_CEM-NOF-PR_ESP1-[Mt]
0.0192 2931.5 6.55
9. Ind. Process: Cement production-No fuel use-Electrostatic precipitator: 2 fields - industrial processes-[Mt]
PR_CEM-NOF-PR_ESP2-[Mt]
0.0234 2960.58 7.90
10. Ind. Process: Small industrial and business facilities -fugitive-No fuel use-Good practice: ind.process - stage 2 (fugitive)-[M people]
PR_SMIND_F-NOF-PRF_GP2-[M people]
3.2304 198.33 16288.00

94
NILU OR 84/2010

95
NILU OR 84/2010
Appendix M
Screening Study Introduction Presentation

96
NILU OR 84/2010

Air Quality Monitoring\ B Sivertsen 2010
1
Dhaka, Bangladesh
www.NILU.noBS\ NILU \ 2010
Bjarne Sivertsen, NILU
• Baseline air quality of Dhaka• Typical concentration levels?• Concentration distributions ?
www.NILU.noBS\ NILU \ 2010
• Hot spots?• Siting studies for new stations!
Where should we measure?What should we measure?How do we want to present the results?
Define site locationsEvaluate sources and possible impactPerform simple ”model
www.NILU.noBS\ NILU \ 2010
Investigate the areaSelect relevant indicatorsComplete report covering
InstrumentsSitesComponents
Perform simple model estimates”
www.NILU.noBS\ NILU \ 2010
Simple instruments forscreening the study
Simple instruments forscreening the study
Passive gassamplers:SO2, NO2, O3
www.NILU.noBS\ NILU \ 2010
Dust track
Passive PM Sampler (PM10, PM2,5)
Components: NO2, SO2, PM, OzoneCity Transects (Dhaka has primary northerly wind)
North of city suburban (but south of brick kilns)North of city urbanCity CenterSouth of city urban
MicroclimatesRoadside
www.NILU.noBS\ NILU \ 2010
Street canyonsUrban
Vertical2-3 meters over street level (majority)5 meters over street level (some)High over street level (one or two) – all components
Also at existing and planned monitoring station locations

Air Quality Monitoring\ B Sivertsen 2010
2
PrevailingWind
www.NILU.noBS\ NILU \ 2010
Urbanbackground
www.NILU.noBS\ NILU \ 2010
gUrban traffic
Urban residential SuburbanRoad side
SO2in Cairo city centreand industrialShoubraexceeded100 µg/m3
www.NILU.noBS\ NILU \ 2010 www.NILU.noBS\ NILU \ 2010
Dhaka , grid
Brickfactories
www.NILU.noBS\ NILU \ 2010
Stack emissionsGround based emissions
www.NILU.noBS\ NILU \ 2010

Air Quality Monitoring\ B Sivertsen 2010
3
AQMP, DoE, Bangladesh
Station: Sangsad BhabanWinter Season Wind Rose
November 2002 to January 2003
90
75
60
45
30
150
345
330
315
300
285
270
255
240
225
210
195180
165
150
135
120
105
0%
10%
20%
.1 to 1
1 to 2
2 to 4
4 to 6
> 6
Magnitude(m/s)34.61% calm
N
98.4% Valid Data present.
AQMP, DoE, Bangladesh May 2003 to July 2003
Winter
www.NILU.noBS\ NILU \ 2010
Station: Sangsad BhabanSummer Season Wind Rose
90
75
60
45
30
150
345
330
315
300
285
270
255
240
225
210
195180
165
150
135
120
105
0%
10%
20%
30%
.1 to 1
1 to 2
2 to 4
4 to 6
> 6
Magnitude(m/s)9.69% calm
N
99.8% Valid Data present.
Summer
Gabtali
Aricha road
Lalmatia
Kalabagan
Gabtali
Aricha road
Lalmatia
Kalabagan
www.NILU.noBS\ NILU \ 2010
CAMSBitac
www.NILU.noBS\ NILU \ 2010
Rajarbag
Lalbag
• Appoint personelle• Identify addresses• Select sites• Brief and train
www.NILU.noBS\ NILU \ 2010
• Brief and train• Distribute samplers and forms• Place samplers• Collect PM data (Dust track)
www.NILU.noBS\ NILU \ 2010
Gulshan
www.NILU.noBS\ NILU \ 2010

Air Quality Monitoring\ B Sivertsen 2010
4
www.NILU.noBS\ NILU \ 2010 www.NILU.noBS\ NILU \ 2010
www.nilu.no
www.nilu.no
www.NILU.noBS\ NILU \ 2010
NILUPOBox 100
No-2027 KjellerNorway
Fax: +4763898050E-mail: [email protected]
www.NILU.noBS\ NILU \ 2010

101
NILU OR 84/2010
Appendix N
Draft Screening Study Design for Dhaka

102
NILU OR 84/2010

103
NILU OR 84/2010
Bangladesh Department of Environment/CASE Project Poribesh Bhaban E-16, Agargaon, Shere Bangla Nagar Dhaka 1207 Bangladesh
Norwegian Institute for Air Research
PO Box 100 2027 Kjeller
Norway
Financed by: Norwegian Agency for Development Cooperation (NORAD) MEMO
Project: Bangladesh Air Pollution Management (BAPMAN)
Prepared by NILU:
Bjarne Sivertsen and Scott Randall
Screening study Design and planning
DRAFT
REPORT NO.: Memo 2010
NILU REFERENCE: O-110055
REV. NO.: November 2010
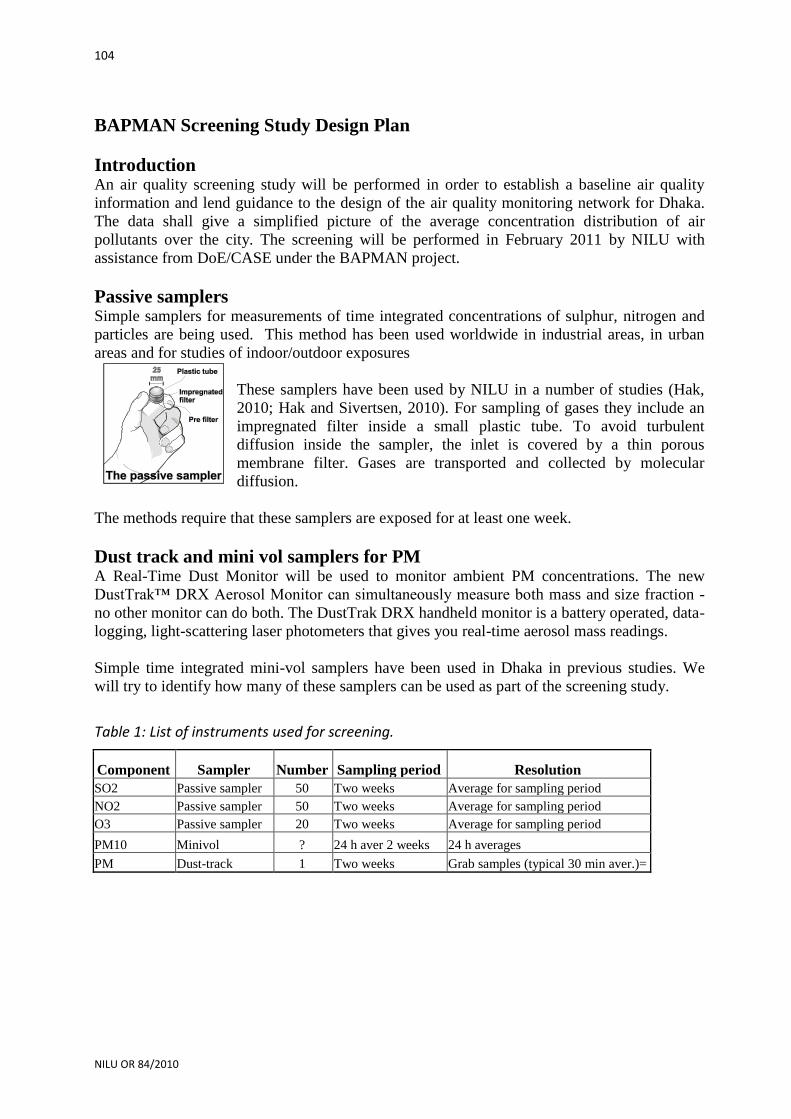
104
NILU OR 84/2010
BAPMAN Screening Study Design Plan
Introduction An air quality screening study will be performed in order to establish a baseline air quality
information and lend guidance to the design of the air quality monitoring network for Dhaka.
The data shall give a simplified picture of the average concentration distribution of air
pollutants over the city. The screening will be performed in February 2011 by NILU with
assistance from DoE/CASE under the BAPMAN project.
Passive samplers Simple samplers for measurements of time integrated concentrations of sulphur, nitrogen and
particles are being used. This method has been used worldwide in industrial areas, in urban
areas and for studies of indoor/outdoor exposures
These samplers have been used by NILU in a number of studies (Hak,
2010; Hak and Sivertsen, 2010). For sampling of gases they include an
impregnated filter inside a small plastic tube. To avoid turbulent
diffusion inside the sampler, the inlet is covered by a thin porous
membrane filter. Gases are transported and collected by molecular
diffusion.
The methods require that these samplers are exposed for at least one week.
Dust track and mini vol samplers for PM A Real-Time Dust Monitor will be used to monitor ambient PM concentrations. The new
DustTrak™ DRX Aerosol Monitor can simultaneously measure both mass and size fraction -
no other monitor can do both. The DustTrak DRX handheld monitor is a battery operated, data-
logging, light-scattering laser photometers that gives you real-time aerosol mass readings.
Simple time integrated mini-vol samplers have been used in Dhaka in previous studies. We
will try to identify how many of these samplers can be used as part of the screening study.
Table 1: List of instruments used for screening.
Component Sampler Number Sampling period Resolution
SO2 Passive sampler 50 Two weeks Average for sampling period
NO2 Passive sampler 50 Two weeks Average for sampling period
O3 Passive sampler 20 Two weeks Average for sampling period
PM10 Minivol ? 24 h aver 2 weeks 24 h averages
PM Dust-track 1 Two weeks Grab samples (typical 30 min aver.)=

105
NILU OR 84/2010
A number of selected points in Dhaka We will select a number of sampling positions in the Dhaka area. We depend upon the positive
response from owners of buildings where we might need to place a sampler.
We thus appreciate the co-operation with local authorities and individuals, who will contribute
to a better understanding of the air pollution in the area.The small instruments are totally
unharmful, and they will be collected by experts after a sampling period of about two weeks.
Passive samplers of NO2, SO2, O3 will be placed in up to 50 locations in Dhaka city and
surrounding suburban areas (see Table 1).
In addition we will use an automatic hand held sequential PM sampler (DustTrak) at a selected
number of monitoring sites in the city centre of Dhaka. These instruments will measure 30 min
average concentrations of PM10 and PM2.5.
We will also be interested in placing as many Minivol samplers for PM10 as possible in
Dhaka. These instruments may be available at DoE.
The map in Figure 1 gives a picture of the spatial distribution of the preliminary sampling sites
selected for Dhaka.
Site location design parameters:
1. City Transects (Dhaka has primary northerly wind)
a. North of city suburban (but south of brick kilns)
b. North of city urban
c. City Center
d. South of city urban
2. Microclimates
a. Roadside
b. Street canyons
c. Urban
3. Vertical
a. 2-3 meters over street level (majority)
b. 5 meters over street level (some)
c. High over street level (one or two) – all components
4. Also at existing and planned monitoring station locations

106
NILU OR 84/2010
Figure 1: Prelim picture showing transects (Yellow lines), prelim sites (S Markers), and grid
(Pink).
So far 14 sites have been appointed as possible measurement sites for the screening study (See
Table 2).
These sites were identified during the training seminar at NILU in October 2010. They were
selected at points in the city where we know that we have people that can take care of the
samplers and some of them are located hotels, where permissions can easily be taken.
We further want to identify another 30-40 sites preferably in areas where we know that people
can take care of the samplers (private homes or offices). Locations also have to meet the
criteria of spreading out samplers along traverses to obtain a good and representative
concentration distribution over the city.Some samplers should also be located within a
kilometre downwind from large industrial sources.
The 14 sites selected so far are presented in Table 2 below.

107
NILU OR 84/2010
Table 2: Preliminary selection of sites for the screening study.
All sites have to be classified according the international classification procedures as given in
the table below.
Sampling procedures All participants will be introduced to the sampling procedures used in screening studies. A
specific form will have to be filled in for each of the sampling locations.An example of this
form is given on the next page.
Site # Site Name Responsible Location Address Long Lat
BAEC Scott Randall 90.39671578 23.73044127
BUET Scott Randall 90.3929339 23.72649122
Masud Rana Site Masud Rana 90.36780797 23.78101156
DoE Site Masud Rana 90.37247542 23.77697864
Westin Site Scott Randall 90.41511871 23.79245226
Lalbagh Fort Site 90.38733361 23.71894983
Parliament Site 90.38770402 23.76003501
Farmgate Site 90.39292872 23.75912323
Hotel Sonargon Site Scott Randall 90.39445639 23.74982247
Sheraton Hotel Site Scott Randall 90.39704585 23.74144747
Golam Saroar Site Golar Saroar 90.42494955 23.78332682
Saroar Uncle Market Site Golar Saroar 90.42604765 23.77798141
IUCN Scott Randall 90.41732907 23.77813959
Norwegian Embassy Scott Randall 90.41721013 23.79027722
Type of zone Type of station Characterisation of zone
Urban (U) Traffic (T) Residential (R)
Suburban (S) Industrial (I) Commercial (C)
Rural (R) Background (B) Industrial (I)
Agricultural (A)
Natural (N)
Res. / Comm. (RC)
Comm. / Ind. (CI)
Ind. / Res. (IR)
Res. / Comm. / Ind. (RCI)
Agri. / Nat. (AN)

108
NILU OR 84/2010
PASSIVE SAMPLER FORM FOR BANGLADESH

109
NILU OR 84/2010
References
Guerreiro, C., Laupsa, H. and Sivertsen, B. (2005). Passive sampling of SO2 and NO2 in
ambient air in Dakar. Kjeller (NILU OR 46/2005).
Hak, C. (2010). Planning ambient air pollution screening study in Burgas, Bulgaria. Winter
2009/2010. Kjeller (NILU OR 27/2010).
Hak, C. and Sivertsen, B. (2010). Ambient air pollution screening study in Burgas March
2010. Kjeller (NILU OR 40/2010).

110
NILU OR 84/2010

111
NILU OR 84/2010
Appendix O
Final Project (Task 1) Meeting Agenda

112
NILU OR 84/2010

AQ Management intro \ B Sivertsen, NILU 2010
1
www.NILU.noBS\ NILU \ 2010
Scott Randall
Kjeller, Norway
29 October 2010
SR \ NILU \ 2010www.NILU.noBS\ NILU \ 2010
TASK 0 (SR TL):a. Put all training documents on project portal (SR)
b. Report: Training Seminar, D1.1 (SR)
TASK 1 (VTD TL):
a. Data needs sheet and prioritization assignments(see sheet for assignments, VTD/SR will coordinate)
VTD send mail for coordinate system for GIS files (GS)
Check for traffic data with traffic auth (MR)
Enter historic data (2003?) into AirQUIS (VTD)
b. Questionaire draft (SR -> MR,GS - DoE/CASE)c. Report: Procedures for emissions inventorying for urban areas in Bangladesh
(D1.2) (VTD -> MR,GS - DoE/CASE)
d. Review AirQUIS manuels (GS,MR – DoE/CASE)
e. Screening study: feedback on site locations (MR/GS – DoE/CASE), mini-vol
samplers available for use during this campaign (GS – DoE)
TASK 2 (LM TL):
a. Keep NILU updated of status of maintenance contract and G-01
(CASE/DoE).
SR \ NILU \ 2010
www.NILU.noBS\ NILU \ 2010
Mission 2: Passive Sampling Screening Study (Jan/Feb 2011).
Include Task 1 Follow-up. 10 days
Mission 3: AirQUIS Installation and training (Summer 2011).
Include Task 1 Follow-up.
Task 3 AirQUIS Training at NILU Fall 2011. 10 days+
Task 1 Emission Inventory Training at NILU approx. mid2011.
10 days+
DR. NASIR to NILU December 2010?
SR \ NILU \ 2010www.NILU.noBS\ NILU \ 2010
1. NILU Task 1 Training Seminar Report (D1.1, in progress).
2. All ppt and other files from training were given on memory
stick and will be available on BAPMAN portal.
3. Future Reports:
• Procedures for emissions inventorying for urban areas in
Bangladesh (D1.2); NILU and DoE/CASE
• NORAD 6 Month status report (February 1, 2011).
• AirQUIS establishment: The system established in
Dhaka, and personnel trained so that the system can be
used sustainably in Bangladesh (D3.1).
4. Thinking of future scientific publications
SR \ NILU \ 2010
www.NILU.noBS\ NILU \ 2010SR \ NILU \ 2010www.NILU.noBS\ NILU \ 2010
Scott Randall
Kjeller, Norway
29 October 2010
SR \ NILU \ 2010

AQ Management intro \ B Sivertsen, NILU 2010
2
www.NILU.noBS\ NILU \ 2010
•AQMP and AQMS overview (BS)
•AirQUIS overview and methods (KiG)
•Emission Inventory templates (KiG)
•Building AirQUIS database (KiG)
•AirQUIS structure and AirQUIS monitoring (RuO)
•Inventory Questionairres and excercises (KiG)
•Dispersion demonstration (KiG)
•AirQUIS excercies using basic Dhaka data (VTD)
•GAINS S.ASIA model (SR)
•Passive Sampler Screeing Study methods (BS)
SR \ NILU \ 2010www.NILU.noBS\ NILU \ 2010
•Training for Institutional-building
•DoE/CASE capacity to understand all aspects, and later
sustainably perform work needed
•2 Experts as leaders in this task
SR \ NILU \ 2010
www.NILU.noBS\ NILU \ 2010
1. Preliminary analysis of Dhaka emissions related source data
and expereience with exercises.
2. Strengthen DoE/CASE Emission Inventory competence to begin
work back in Dhaka:• Data retreival
• Top-down inventory
• Bottom-up inventory
3. Trained staff to become leaders in work and associated sub-tasks at DoE/CASE
SR \ NILU \ 2010www.NILU.noBS\ NILU \ 2010SR \ NILU \ 2010
www.NILU.noBS\ NILU \ 2010SR \ NILU \ 2010

115
NILU OR 84/2010
Appendix P
Final Project (Task 1) Meeting Summary

116
NILU OR 84/2010

117
NILU OR 84/2010
Norwegian Institute for Air Research P.O. Box 100, N-2027 Kjeller, Norway
Tel.: +47 63 89 80 00 – Fax: +47 63 89 80 50 Associated with CIENS and the Environmental Research Alliance of Norway
ISO certified according to NS-EN ISO 9001
Meeting Summary/Assignments
SUBJECT: BAPMAN Project Meeting (TASK 1 Focus)
MEETING PLACE: NILU, Room UB TIME: 14:30-15:30
PARTICIPANTS:
SR, BS, VTD (NILU) MR, GS (CASE/DoE)
DISTRIBUTION:
All participants and Dr. Nasiruddin, BAPMAN internal website
OUR REF.: BAPMAN 110055 DATE: October 29, 2010
ITEM# ITEM RESPONSIBLE √?
1 TASK 0 (Admin)
A Put all training documents on project portal
AirQUIS manuels
Emission Inventory Templates
Training Presentations
Screening Study Design
SR √
B Preparation of Training Seminar Report as part of D1.1, see also 5A. SR
C 6 Month status report due to NORAD on 01 Feburary 2011. SR
2. TASK 1 (Emission Inventories)
A Data Needs sheet assignments and prioritization (see separate Excel sheet)! NILU will request GIS files and proper format to GS. Check for possible data traffic or flow reports with Dhaka Traffic Authority. Enter historic Dhaka data into AirQUIS for prelim analysis.
! VTD MR VTD
√
B 2 draft questionnaires will be made (one simple, one advanced) and sent to MR/GS for review and comment.
SR √
C Review AirQUIS manuels and Excel Templates in preparation for AirQUIS installation Summer 2011.
GS/MR
D Transfer of Screening Study Design Plans (and GE files) to MR/GS. Check for available CASE/DoE staff to participate in Screening Study in Jan/Feb 2011 and help coordinate their home location in GE file. Check if MiniVol Samplers will be available for use during Screening Study.
SR MR/GS
MR/GS
√
3 TASK 2 (Instruments)
A Please keep NILU updated of status of CAMS Maintenance Contract and GS

118
NILU OR 84/2010
ITEM# ITEM RESPONSIBLE √?
G-01 Tender so LM can properly plan Task 2.
4 Future Missions and Training (Preliminary)
A NILU Mission 2 to Dhaka Jan/Feb 2011 for Screening Study, including Task 1 follow-up meetings and discussion. Solidify design plan and procurement of equipment (samplers, satellites, DT)
SR/BS
SR/BS
B NILU Mission 3 to Dhaka Summer 2011 for AirQUIS installation and training, including Task 1 follow-up meetings and discussion.
RuO/VTD
C Task 1 additional Emission Inventory training at NILU in 2011. VTD/SR
D Task 3 AirQUIS training at NILU in 2011. RuO/VTD/SR
E Administration and technical meetings with Dr. Nasir at NILU possibly in December?
BS/SR
F NILU must discuss these preliminary Mission and Training plans with Dr. Nasir.
SR/BS
5 Reports
A D1.1 preparation “Training Seminar” and publication as part of future D1.1, see also 1B.
SR
B D1.2 planning “Procedures for emissions inventorying for urban areas in Bangladesh” in coordination with MR/GS.
VTD

NILU – Norwegian Institute for Air Research P.O. Box 100, N-2027 Kjeller, Norway
Associated with CIENS and the Environmental Research Alliance of Norway
ISO certified according to NS-EN ISO 9001
REPORT SERIES
PROJECT REPORT
REPORT NO. OR 84/2010
ISBN: 978-82-425-2335-8 (print) 978-82-425-2336-5 (electronic)
ISSN: 0807-7207
DATE
SIGN. NO. OF PAGES
118
PRICE
NOK 150.-
TITLE
Bangladesh Air Pollution Management (BAPMAN)
Emission Inventory Training Seminar
NILU, 25 - 29 October 2010
PROJECT LEADER
Scott Randall
NILU PROJECT NO.
O-110055
AUTHOR(S)
Scott Randall, Bjarne Sivertsen, Vo Thanh Dam, and Karl Idar Gjerstad
CLASSIFICATION *
A
CONTRACT REF.
REPORT PREPARED FOR
BAPMAN Project
NILU
ABSTRACT A training seminar was held at NILU 26-29 October 2010 for Task 1 of the Bangladesh Air Pollution Management (BAPMAN) project. The training was conducted by NILU for two experts from the Bangladeshi Department of Environment, Clean Air and Sustainable Environment Program (DoE/CASE). The specific goals of the training were to strengthen DoE/CASE Emission Inventory competence to begin work back in Dhaka, where specifically the experts were trained in data collection, top-down inventory, and bottom-up inventory. The experts were trained to become leaders in this Task 1 work and associated sub-tasks at DoE/CASE.
NORWEGIAN TITLE
KEYWORDS
Bangladesh
Air Quality Management
Emission Inventory
ABSTRACT (in Norwegian)
* Classification A B C
Unclassified (can be ordered from NILU) Restricted distribution Classified (not to be distributed)

REFERENCE: O-110055 DATE: NOVEMBER 2010 ISBN: ISBN: 978-82-425-2335-8 (print)
978-82-425-2336-5 (electronic) NILU is an independent, nonprofit institution established in 1969. Through its research NILU increases the understanding of climate change, of the composition of the atmosphere, of air quality and of hazardous substances. Based on its research, NILU markets integrated services and products within analyzing, monitoring and consulting. NILU is concerned with increasing public awareness about climate change and environmental pollution.