Biopolymer Stabilised Earthen Construction Materials
215
Biopolymer Stabilised Earthen Construction Materials Thesis by Sravan Muguda Viswanath Submitted as partial consideration towards the degree of Doctor of Philosophy September 2019 Department of Engineering Durham University United Kingdom ISA BTP - SIAME University of Pau and Pays de l'Adour France
-
Upload
khangminh22 -
Category
Documents
-
view
0 -
download
0
Transcript of Biopolymer Stabilised Earthen Construction Materials

Biopolymer Stabilised Earthen
Construction Materials
Thesis by
Sravan Muguda Viswanath
Submitted as partial consideration towards
the degree of Doctor of Philosophy
September 2019
Department of Engineering
Durham University
United Kingdom
ISA BTP - SIAME
University of Pau and Pays de l'Adour
France

(i)
Abstract
Earthen structures (i.e. structural units manufactured from soil) are often regarded as
sustainable forms of construction due to their characteristically low carbon footprint.
Unstabilised earthen construction materials have low embodied energy, excellent hygroscopic
properties and recycling potential. However, in this form, the material is susceptible to
deterioration against water ingress and most modern earthen construction materials rely on
cement to improve their durability properties. Using cement leads to compromises in
hygroscopic properties and recyclability potential. In this situation, it is imperative to look for
alternatives to cement, which can address these issues without compromising on the desired
engineering properties of these materials. This thesis explores the use of biopolymers, namely
guar and xanthan gum, as stabilisers for earthen construction materials. As an initial step, an
experimental campaign was undertaken to understand biopolymer stabilisation and optimise
their use to stabilise earthen construction materials. The results from this campaign reveal that
biopolymer stabilised soils derive their strength through a combination of soil suction and
hydrogel formation. The intrinsic chemical properties of the biopolymer affect the nature of
hydrogel formation and in turn strength. In a subsequent campaign of experimental work,
hydraulic and mechanical properties of these biopolymer stabilised soils were determined. The
hydraulic properties of the biopolymer stabilised soils indicate that for the range of water
contents, the suction values of biopolymer stabilised soils are higher than unamended soils. The
soil water retention curves suggest that both biopolymers have increased the air entry value of
the soil while affecting the void size distribution. Shear strength parameters of biopolymer
stabilised soils were obtained through constant water triaxial tests, and it was noted that both
biopolymers have a significant and yet different effect on soil cohesion and internal friction
angle. With time, guar gum stabilised soils derive strength through the frictional component of
the soil strength, while xanthan gum stabilised soil strength has a noticeable contribution from
soil cohesion. Macrostructural analysis in the form of X-RCT scans indicate that both
biopolymers form soil agglomerations and increase overall porosity. The void size distribution
curves obtained from XRCT scanning complement the findings of the suction tests. As a final
study, the performance of biopolymer stabilised earthen construction materials was assessed as
a building material. Durability performance of these materials against water ingress was
evaluated, and it was noted both biopolymers provide satisfactory stabilisation to improve the
erosional resistance of the material. In conclusion, unlike cement, biopolymer stabilised earthen
materials do not compromise on hygroscopic properties and have better mechanical performance
than unamended earthen construction materials. Finally, recyclability tests suggest that apart
from improving the strength, durability and hygroscopic properties of the material, biopolymer
stabilised earthen construction materials have a better potential for recycling without any
environmental concerns.

(ii)
Résumé
Les constructions en terre crue, soit fabriquées à partir de sol, sont considérées comme des
constructions durables en raison de leur faible empreinte environnementale : les matériaux de
construction à base de terre crue non stabilisée ont une faible énergie intrinsèque, d'excellentes
propriétés hygroscopiques et un fort potentiel de recyclage. Cependant, sous cette forme, les
matériaux sont susceptibles de se détériorer au contact de l’eau. Ainsi, les éléments de
constructions modernes en terre crue utilisent du ciment pour améliorer leur durabilité, mais
entachent de ce fait leurs propriétés hygroscopiques et leur potentiel de recyclable. Il est donc
impératif de développer des solutions alternatives à l’incorporation de ciment, pouvant
améliorer la résistance à l’eau sans pour autant compromettre les propriétés qui constituent les
atouts de ces matériaux durables. Ces travaux de doctorat étudient l'utilisation de deux
biopolymères, la gomme de guar et le xanthane, comme stabilisants naturels pour les matériaux
de construction en terre crue. Dans un premier temps, une campagne expérimentale a été menée
pour comprendre le mécanisme de stabilisation de la terre par ces biopolymères et optimiser
cette technique. Les résultats révèlent que la nature intrinsèque des biopolymères induit la
formation d’hydrogels qui participent à renforcer le matériau et à modifier les phénomènes de
succion. L’addition d’environ 2,0 % de biopolymère en masse de sol sec est suffisant pour obtenir
un comportement mécanique comparable à la stabilisation au ciment à un taux de 8,0 %. Afin
de mieux caractériser l’influence des biopolymères, les propriétés hydrauliques et mécaniques
des sols ainsi stabilisés ont été étudiées. Les tests de caractérisation prouvent que, pour une
même gamme de teneur en eau, la succion des sols stabilisés par les biopolymères est supérieure
à celle des sols non stabilisés. Les courbes de rétention d'eau sol démontrent que la valeur
d'entrée d'air est augmentée en présence des biopolymères, ce qui affecte la distribution de la
taille des vides. Les paramètres de résistance au cisaillement ont été obtenus par des essais
triaxiaux à teneur d’eau constante. Les deux biopolymères ont un effet significatif, et pourtant
différent, sur la cohésion du sol et l'angle de friction interne. Dans le temps, la modification de
résistance des sols stabilisés à la gomme de guar est liée à la variation de la composante de
friction, tandis que pour les sols stabilisés à la gomme de xanthane cette variation est pilotée
par la cohésion du sol. L'analyse microstructurale par micro tomographie X-RCT montre que les
biopolymères favorisent l’agglomération des particules de sol, ce qui modifie la porosité globale.
Les courbes de distribution de la taille des vides obtenues par balayage XRCT confirment les
résultats des essais de succion. Pour finir, les performances en termes de durabilité de ces
matériaux de construction stabilisés aux biopolymères en présence d'eau ont été validées par
différents tests ainsi que leur potentiel de recyclage. Il apparait donc que l'utilisation de ces
biopolymères comme stabilisant améliore la résistance mécanique des matériaux en terre crue
et leur durabilité ; et que contrairement à la stabilisation au ciment le comportement
hygroscopique est conservé - voire amélioré-, ainsi que le potentiel de recyclage.

(iii)
Declaration
The work in this thesis is based on research carried out in the Sustainable Infrastructure group,
Department of Engineering, Durham University, United Kingdom and SIAME laboratory,
University of Pau and Pays de l’ Adour, France. No part of this report has been submitted
elsewhere for any other degree or qualification and it all my own work unless referenced to the
contrary in the text.
Copyright © 2019 by Sravan Muguda Viswanath.
“The copyright of this thesis rests with the author. No quotations from it should be published
without the authors prior written consent and information derived from it should be
acknowledged."

(iv)
Dedicated to my spiritual master HH Jayapataka Swami Maharaj

(v)
Table of Contents Abstract ............................................................................................................................................... i
Résumé ............................................................................................................................................... ii
Declaration........................................................................................................................................ iii
Acknowledgements .......................................................................................................................... ix
Publications ........................................................................................................................................ x
Nomenclature ................................................................................................................................... xi
Chapter 1 Introduction...................................................................................................................... 1
1.1 “Earth” as a building material ......................................................................................... 1
1.2 Revival of earthen construction ....................................................................................... 1
1.3 Earthen materials – Modern perspective ...................................................................... 4
1.3.1 Problems with modern earthen construction ........................................................... 6
1.4 Research aims and objectives........................................................................................... 7
1.5 Thesis structure .................................................................................................................. 8
References ........................................................................................................................................ 9
Chapter 2 Literature Review ......................................................................................................... 11
2.1 Chapter introduction........................................................................................................ 11
2.2 Earthen construction techniques .................................................................................. 11
2.2.1 Rammed earth wall construction .............................................................................. 11
2.2.1.1. Overview of rammed earth construction ................................................................... 11
2.2.1.2. Construction procedure for a rammed earth wall ................................................... 14
2.2.2 Compressed earth blocks ............................................................................................ 15
2.2.2.1. Overview of compressed earth blocks ........................................................................ 15
2.2.2.2. Manufacturing procedure for compressed earth blocks ......................................... 16
2.2.3 Suitable soils for earthen materials ......................................................................... 17
2.2.3.1. Particle size distribution .............................................................................................. 17
2.2.3.2. Plasticity and Shrinkage properties of earthen construction material .............. 19
a) Clay mineralogy .................................................................................................................... 19
b) Plasticity properties of earthen construction material ................................................ 21
c) Shrinkage properties of earthen material ....................................................................... 22
2.2.4 Desired engineering properties of earthen material ............................................. 23
2.2.4.1. Strength characteristics of earthen material ........................................................... 24
2.2.4.2. Durability characteristics of earthen material ........................................................ 28
2.2.4.3. Hygroscopic characteristics of earthen material ..................................................... 30
2.2.4.4. Recyclability potential of earthen material .............................................................. 32

(vi)
2.3 Role of unsaturated soil mechanics in earthen materials ....................................... 33
2.3.1 Phase relationships ...................................................................................................... 33
2.3.2 Strength of soils ............................................................................................................ 34
2.3.3 Suction in unsaturated soils ....................................................................................... 35
2.3.3.1. Matric suction ................................................................................................................. 35
2.3.3.2. Osmotic suction ............................................................................................................... 36
2.3.3.3. Total suction .................................................................................................................... 36
2.3.4 Soil-water retention curve .......................................................................................... 36
2.3.5 Role of soil suction in earthen construction materials ......................................... 39
2.4 Bio-stabilisation techniques ........................................................................................... 43
2.4.1 Bio-stabilisation of soils .............................................................................................. 43
2.4.2 Biopolymer soil stabilisation ...................................................................................... 44
2.4.3 Biopolymer stabilisation in geotechnical engineering .......................................... 45
2.4.3.1. Guar Gum ........................................................................................................................ 46
2.4.3.2. Xanthan Gum .................................................................................................................. 47
2.4.3.3. Effect of biopolymer stabilisation on different soil properties ............................. 47
2.4.3.4. Summary of biopolymer soil stabilisation ................................................................ 53
2.4.4 Biopolymer soil stabilisation for earthen construction materials ...................... 53
2.5 Concluding remarks ......................................................................................................... 54
References ...................................................................................................................................... 55
Chapter 3 Biopolymer Stabilisation ............................................................................................... 61
3.1 Introduction ....................................................................................................................... 61
3.2 Materials ............................................................................................................................. 61
3.2.1 Engineered soil mixture .............................................................................................. 61
3.2.2 Biopolymers.................................................................................................................... 64
3.2.3 Cement ............................................................................................................................ 65
3.3 Experimental programme ............................................................................................... 65
3.3.1 Effect of biopolymers on plasticity and shrinkage properties of the soil mix.. 65
3.3.1.1. Methodology .................................................................................................................... 65
3.3.1.2. Test results ...................................................................................................................... 65
3.3.2 Strength characteristics of biopolymer stabilised earthen construction
materials ......................................................................................................................................... 68
3.3.2.1. Unconfined compressive strength of biopolymer stabilised earthen
construction materials ................................................................................................................. 68
3.3.2.2. Tensile strength of biopolymer stabilised earthen construction materials ....... 74
(vii)
3.3.2.3. Discussion on strength test results ............................................................................ 77
3.3.3 Synergistic behaviour of biopolymers ...................................................................... 81
3.3.3.1. Plasticity and shrinkage characteristics ................................................................... 81
3.3.3.2. Strength characteristics................................................................................................ 83
3.3.4 Macrostructural investigation through X-Ray computed tomography ............. 84
3.3.4.1. X-Ray computed tomography....................................................................................... 84
3.3.4.2. Sample preparation and scanning .............................................................................. 86
3.3.4.3. Qualitative analysis ....................................................................................................... 87
3.3.5 Preliminary durability tests ....................................................................................... 88
3.3.5.1. Sample preparation and testing methodology ......................................................... 88
3.3.5.2. Test results ...................................................................................................................... 89
3.4 Concluding remarks ......................................................................................................... 90
References ...................................................................................................................................... 92
Chapter 4 Geotechnical characterisation of biopolymer stabilised earthen construction
material............................................................................................................................................. 95
4.1 Chapter Introduction ....................................................................................................... 95
4.2 Shear Strength of Unsaturated soils ............................................................................ 95
4.3 Experimental Programme .............................................................................................. 97
4.4 Suction tests ....................................................................................................................... 98
4.4.1 Testing methodology .................................................................................................... 98
4.4.2 Test results ..................................................................................................................... 99
4.4.2.1. Suction test results ........................................................................................................ 99
4.4.2.2. Soil water retention curve .......................................................................................... 103
4.4.2.3. Scanning curve .............................................................................................................. 107
4.5 Constant water content triaxial tests ........................................................................ 109
4.5.1 Testing methodology .................................................................................................. 109
Figure 4.14. Typical setup for triaxial test ........................................................................... 110
4.5.2 Stress – strain relationship ...................................................................................... 111
4.5.3 Determination of shear strength parameters ...................................................... 115
4.5.4 Strength characteristics of engineered soil mix ................................................... 120
4.6. Macrostructural investigation using X-ray computed tomography .................... 125
4.6.1 Specimen Preparation ............................................................................................... 125
4.6.2 Test results ................................................................................................................... 127
4.6.2.1. X-RCT scans .................................................................................................................. 127
4.6.2.2. Porosity and void size distribution curves .............................................................. 131

(viii)
Table 4.7. Porosity for all samples at different curing periods. ....................................... 131
4.7. Concluding remarks ....................................................................................................... 134
References .................................................................................................................................... 137
Chapter 5 Assessment of biopolymer stabilised earthen construction material as a building
material........................................................................................................................................... 139
5.1 Chapter Introduction ..................................................................................................... 139
5.2 Sample preparation ........................................................................................................ 139
5.2.1 Materials ....................................................................................................................... 139
5.2.2 Sample preparation .................................................................................................... 140
5.2.2.1. Small cylindrical specimens ....................................................................................... 141
5.2.2.2. Tile specimens ............................................................................................................... 141
5.2.2.3. Large cylindrical samples ........................................................................................... 142
5.2.2.4. Brick samples ................................................................................................................ 142
5.3 Durability tests ............................................................................................................... 145
5.3.1. Rainfall induced erosional tests .............................................................................. 146
5.3.1.1. Testing methodology .................................................................................................... 146
5.3.1.2. Results and discussion ................................................................................................ 148
5.3.2. Contact tests ................................................................................................................ 150
5.3.2.1. Test procedure ............................................................................................................... 151
5.3.2.2. Test results .................................................................................................................... 151
5.3.3. Suction tests ................................................................................................................. 152
5.3.3.1. Test procedure ............................................................................................................... 152
5.3.3.2. Test results .................................................................................................................... 154
5.3.4. Dip tests ........................................................................................................................ 154
5.3.4.1. Test procedure ............................................................................................................... 154
5.3.4.2. Test results .................................................................................................................... 155
5.3.5. Discussion on durability tests .................................................................................. 156
5.4 Hygroscopic behaviour of earthen construction materials. ................................... 158
5.4.1. Test methodology ........................................................................................................ 158
5.4.2. Test results ................................................................................................................... 160
5.4.2.1. Moisture absorption curves ........................................................................................ 160
5.4.2.2. Moisture buffering value ............................................................................................ 162
5.5 Recyclability potential of earthen construction materials. ................................... 166
5.5.1. Materials ....................................................................................................................... 166
5.5.2. Recycling Procedure ................................................................................................... 167

(ix)
5.5.3. Test method and results ............................................................................................ 167
5.5.3.1. Particle size analysis ................................................................................................... 167
5.5.3.2. Atterberg limits and Linear Shrinkage tests ......................................................... 168
5.5.3.3. Chemical tests on water.............................................................................................. 170
5.5.4. Discussion on test results ......................................................................................... 171
5.6. Concluding remarks ....................................................................................................... 172
References .................................................................................................................................... 174
Chapter 6 Conclusions .................................................................................................................. 176
6.1 Chapter introduction...................................................................................................... 176
6.2 Research highlights ........................................................................................................ 176
6.2.1 Biopolymer stabilisation ........................................................................................... 176
6.2.2 Geotechnical characterisation .................................................................................. 177
6.2.2.1. Suction tests ............................................................................................................. 177
6.2.2.2. Triaxial tests ............................................................................................................ 178
6.2.2.3. Macrostructure analysis ........................................................................................ 179
6.2.3 Assessment as building material ............................................................................ 179
6.2.3.1. Durability tests ....................................................................................................... 179
6.2.3.2. Hygroscopic behaviour ........................................................................................... 180
6.2.3.3. Recycling potential ................................................................................................. 180
6.3 Implications of biopolymer stabilisation ................................................................... 180
6.3.1 In geotechnical engineering ...................................................................................... 180
6.3.2 Application in earthen building construction ....................................................... 181
6.4 Potential future research work .................................................................................... 182
6.4.1 Microstructure analysis ............................................................................................ 182
6.4.2 Durability tests ........................................................................................................... 182
6.4.3 Life cycle assessment for biopolymer stabilised earthen materials ................ 183
6.4.4 Field Implementation ................................................................................................ 183
6.5 Concluding remarks ....................................................................................................... 184
References .................................................................................................................................... 185
Appendix…………………………………………………………………………………………………………………………………186

(i)
List of Tables Chapter 2 Literature Review ......................................................................................................... 11
Table 2.1. Theoretical manufacturing output of CEBs (Rigassi, 1985). ........................... 17
Table 2.2. Recommended soil proportions for unstabilised earthen materials ............... 19
Table 2.3. Recommended soil proportions for cement stabilised earthen materials ..... 20
Table 2.4. Recommended plasticity properties for cement stabilised earthen materials
.......................................................................................................................................................... 22
Table 2.5. Design and characteristic compressive strength for compressed earth blocks
as per different national regulations ........................................................................................ 27
Table 2.6. Design and characteristic compressive strength for rammed earth as per
different national regulations .................................................................................................... 27
Table 2.7. Recommended durability tests in practice in different countries ................... 29
Chapter 3 Biopolymer Stabilisation ............................................................................................... 61
Table 3.1. Physical properties of the unstabilised soil mixture. ........................................ 64
Table 3.2. Physical properties of biopolymers used (Intralabs, 2016a, 2016b). .............. 65
Table 3.3. Different proportions of biopolymer used in this study. ................................... 69
Table 3.4. Tensile to unconfined compressive strength ratios ............................................ 80
Table 3.5. Synergistic combinations of biopolymer used in this study. ............................ 81
Table 3.6. Atterberg limits and linear shrinkage values. .................................................... 82
Table 3.7. Tests results of preliminary durability tests. ...................................................... 90
Chapter 4 Geotechnical characterisation of biopolymer stabilised earthen construction
material............................................................................................................................................. 95
Table 4.1. Soil Modulus at different curing periods ............................................................ 111
Table 4.2. Shear strength parameters, total suction and water content values for
unamended soil specimens ....................................................................................................... 116
Table 4.3. Shear strength parameters, total suction and water content values of guar
gum stabilised soil specimens .................................................................................................. 117
Table 4.4. Shear strength parameters, total suction and water content values for
xanthan gum stabilised soil specimens ................................................................................. 118
Table 4.5. Shear strength parameters, total suction and water content values for
xanthan gum stabilised soil specimens ................................................................................. 123
Table 4.6. Comparison of shear strength parameters of different earthen construction
materials from literature and data from present study..................................................... 124
Table 4.7. Porosity for all samples at different curing periods. ....................................... 131
Chapter 5 Assessment of biopolymer stabilised earthen construction material as a building
material........................................................................................................................................... 139
Table 5.1. Different sample configurations considered in this assessment. .................. 140

(ii)
Table 5.2. Classification of earthen construction material as per NZS 4298 (1998) ... 146
Table 5.3. Classification of compressed earth blocks as per DIN 18945 (2013). .......... 157
Table 5.4. Classification of earthen construction materials as per DIN 18945 (2013).
........................................................................................................................................................ 157
Table 5.5. Results for the chemical tests of water ............................................................... 171

(iii)
List of Figures
Chapter 2 Literature Review ......................................................................................................... 11
Figure 2.1. Rammed earth portion of The Great Wall of China at Gansu, China. Photo
retrieved from https://www.murailledechine.com/voyage-jiayuguan-gansu ................... 12
Figure 2.2. Chapel of Reconciliation in Berlin, Germany, Photo by Reitermann (2001)
.......................................................................................................................................................... 13
Figure 2.3. Illustration of rammed earth wall construction ............................................... 15
Figure 2.4. Illustration of manufacturing compressed earth blocks ................................. 16
Figure 2.5. Recommended particle size distribution for rammed earth and compressed
earth blocks .................................................................................................................................... 18
Figure 2.6. Recommended soil plasticity range for rammed earth and compressed
earth blocks .................................................................................................................................... 21
Figure 2.7. Illustration as presented by Burroughs (2008) to determine the suitability
of soils for rammed earth construction based on particle size gradation, plasticity and
shrinkage properties .................................................................................................................... 23
Figure 2.8 Relationship of wet compressive strength with (a) dry density and (b)
placement moisture content (Reddy and Kumar, 2011a) .................................................... 25
Figure 2.9 Relationship between mechanical properties of earthen material with dry
density and stabiliser content (Reddy and Kumar, 2011b) ................................................. 25
Figure 2.10 Variation of stiffness and strength of earthen materials for different
compacting pressures (Bruno et al., 2016) .............................................................................. 26
Figure 2.11 Extrapolation for unstabilised rammed earth wall (Bui et al., 2009) ....... 29
Figure 2.12 Moisture buffering values of different earthen materials as per Rode et
al., (2005) categorisation. ............................................................................................................ 32
Figure 2.13 presents a typical life cycle of earthen construction material ...................... 33
Figure 2.14 Different states of soil element ............................................................................ 34
Figure 2.15 A typical soil water retention curve as presented by Toll et al., (2015) ..... 37
Figure 2.16 Effect of clay mineralogy on soil water retention in the high suction
regime (Likos, 2000) ..................................................................................................................... 38
Figure 2.17 Plot showing the variation of deviator stress and suction for different
initial water contents, Reproduced from Jaquin et al., (2009). .......................................... 39
Figure 2.18 Variation of suction with water content (Bui et al., 2014) ............................ 40
Figure 2.19 UCS of 5-1-4 and 7-1-2 mixes against humidity and temperature (Beckett
and Augarde, 2012) ...................................................................................................................... 41
Figure 2.20 Planar EMC failure envelope for California sandy loam used for rammed
earth construction (Beckett et al., 2017) ................................................................................. 42
Figure 2.21 An example of how the monosaccharide units combine to form a
biopolymer ...................................................................................................................................... 45

(iv)
Figure 2.22 typical interaction of biopolymer with granular media as presented by
Qureshi et al., (2014).................................................................................................................... 45
Figure 2.23. Typical chemical structure of guar gum........................................................... 46
Figure 2.24. Typical chemical structure of xanthan gum. ................................................... 47
Figure 2.25. ESEM images of mine tailings treated with (a) xanthan gum (b) guar
gum (Chen et al., 2013) ............................................................................................................... 48
Figure 2.26. Comparison of compressive strength for dry and wet mixing methods
(Chang et al., 2015) ...................................................................................................................... 49
Figure 2.27. SEM Images of xanthan gum treated soils (Chang et al., 2015) ................ 50
Figure 2.28. SEM Images of xanthan gum treated sand for different curing times (a)
1h, (b) 1 week and (c) 3 week (Ayeldeen et al., 2016) ........................................................... 50
Figure 2.29. Particle size analysis tests (a) bentonite (b) kaolinite (Latifi et al., 2016)
.......................................................................................................................................................... 52
Chapter 3 Biopolymer Stabilisation ............................................................................................... 61
Figure 3.1. Particle size distribution for the engineered soil mix ...................................... 62
Figure 3.2. Plasticity properties of the engineered soil mix ................................................ 63
Figure 3.3. Compaction characteristics of the engineered soil mix ................................... 64
Figure 3.4. Effect of biopolymers on Atterberg limits of the soil. ...................................... 66
Figure 3.5. Effect of biopolymers on plasticity properties of the soil ................................ 67
Figure 3.6. Effect of biopolymers on linear shrinkage of the soil....................................... 67
Figure 3.7. Setup for preparation of UCS test specimens (a) Mould, (b) Static
compactor........................................................................................................................................ 70
Figure 3.8. Testing of UCS test specimens (a) universal testing machine, (b) dewpoint
potentiometer................................................................................................................................. 71
Figure 3.9. Stress–strain behaviour in UC tests (for each %stabiliser only one test
among three replicates is shown): (a) guar gum, 7 days, (b) guar gum, 28 days, (c)
xanthan gum, 7 days, (d) xanthan gum, 28 days ................................................................... 72
Figure. 3.10. UC test results for guar gum (average values of peak strength based on
three replicates), (a) peak strength, (b) soil modulus ........................................................... 73
Figure. 3.11. UC test results for xanthan gum (average values of peak strength based
on three replicates), (a) peak strength, (b) soil modulus ..................................................... 73
Figure 3.12. Direct tension tests a) NDTT illustration (b) Test-setup ............................. 74
Figure 3.13. Stress–strain behaviour in Tensile tests (for each %stabiliser only one
test among three replicates is shown): (a) guar gum, 7 days, (b) guar gum, 28 days, (c)
xanthan gum, 7 days, (d) xanthan gum, 28 days ................................................................... 76
Figure 3.14. Failure patterns for 28-day tensile specimens for a) guar gum (b) xanthan
gum .................................................................................................................................................. 77
Figure. 3.15. Tensile test results (average values of tensile strength based on three
replicates), (a) guar gum, (b) xanthan gum ............................................................................ 77

(v)
Figure. 3.16. Suction and water content values after UC tests (a) guar gum, (b)
xanthan gum .................................................................................................................................. 78
Figure 3.17. Effect of synergistic behaviour of biopolymers on plasticity properties of
the soil ............................................................................................................................................. 82
Figure 3.18. Comparison of strength characteristics of synergistic combinations (a)
UC peak strength and stiffness, (b) peak tensile strength .................................................. 83
Figure 3.19. Typical X-RCT machine setup. ........................................................................... 85
Figure 3.20. Typical XRCT scan of soil. ................................................................................... 86
Figure 3.21. XRCT Scan images for guar gum (a & b) and xanthan gum (c & d)
stabilised specimens after 7 and 28 days respectively. ........................................................ 87
Figure 3.22. Test setup for durability test as per NZS 4298 (1998) .................................. 89
Figure 3.23. Eroded surface after durability tests (a) guar gum and (b) xanthan gum90
Chapter 4 Geotechnical characterisation of biopolymer stabilised earthen construction
material............................................................................................................................................. 95
Figure 4.1 Illustration of the extended Mohr-Coulomb failure criterion. ........................ 96
Figure 4.2. Suction tests, (a) Specimen mould used to prepare suction specimens and
(b) Moisture content tin containing suction cup and specimen. ......................................... 98
Figure 4.3. Variation of total suction and change in gravimetric water content with
drying time of unamended specimens. ................................................................................... 100
Figure 4.4. Variation of total suction and change in gravimetric water content with
drying time of guar gum stabilised specimens ..................................................................... 101
Figure 4.5. Variation of total suction and change in gravimetric water content with
drying time of xanthan gum stabilised specimens .............................................................. 101
Figure 4.6. Comparison of variation of total suction and change in gravimetric water
content with time of all specimens ......................................................................................... 102
Figure 4.7. Soil water retention curve of unamended soil specimen .............................. 104
Figure 4.8. Soil water retention curve of guar gum stabilised soil specimen ............... 105
Figure 4.9. Soil water retention curve of xanthan gum stabilised soil specimen ......... 105
Figure 4.10. Comparison of soil water retention curve for all combinations ................ 106
Figure 4.11. Total suction versus gravimetric water content of unamended soil in
residual condition ....................................................................................................................... 107
Figure 4.12. Total suction versus gravimetric water content of guar gum stabilised
soil in residual condition ........................................................................................................... 108
Figure 4.13. Total suction versus gravimetric water content of xanthan gum stabilised
soil in residual condition ........................................................................................................... 108
Figure 4.14. Typical setup for triaxial test ........................................................................... 110
Figure 4.15. Stress-strain plots of unamended soil specimens for curing periods, 1, 4,
7, 10, 14 and 28 days are plotted from a to f respectively. ................................................ 112

(vi)
Figure 4.16. Stress-strain plots of guar gum stabilised soil specimens for curing
periods, 1, 4, 7, 10, 14 and 28 days are plotted from a to f respectively. ........................ 113
Figure 4.17. Stress-strain plots of xanthan gum stabilised soil specimens for curing
periods, 1, 4, 7, 10,14 and 28 days are plotted from a to f respectively. ......................... 114
Figure 4.18. p-q diagram of unamended soil specimens at different curing periods ... 116
Figure 4.19. p-q diagram of guar gum stabilised soil specimens at different curing
periods ........................................................................................................................................... 117
Figure 4.20. p-q diagram of xanthan gum stabilised soil specimens at different curing
periods ........................................................................................................................................... 118
Figure 4.21. Deviator stress/strain plots and typical failure pattern of guar gum
stabilised soil specimens (a) 1 day, (b) 7 days, (c) 28 days ................................................ 121
Figure 4.22. Deviator stress/strain plots and typical failure pattern of xanthan gum
stabilised soil specimens (a) 1 day, (b) 7 days, (c) 28 days ................................................ 122
Figure 4.23. p-q diagram of guar gum stabilised soil specimens at different curing
periods ........................................................................................................................................... 123
Figure 4.24. p-q diagram of xanthan gum stabilised soil specimens at different curing
periods ........................................................................................................................................... 124
Figure 4.25. Flow chart of different steps involved in image processing and analyses
using Avizo ................................................................................................................................... 126
Figure 4.26. X-RCT scans of unamended soil specimens at 1 – day curing period, (a)
soil (b) porosity and (c) soil with porosity .............................................................................. 128
Figure 4.27. X-RCT scans of unamended soil specimens at 7 – day curing period, (a)
soil (b) porosity and (c) soil with porosity .............................................................................. 128
Figure 4.28. X-RCT scans of unamended soil specimens at 28 – day curing period, (a)
soil (b) porosity and (c) soil with porosity .............................................................................. 128
Figure 4.29. X-RCT scans of guar gum stabilised soil specimens at 1 – day curing
period, (a) soil (b) porosity and (c) soil with porosity .......................................................... 129
Figure 4.30. X-RCT scans of guar gum stabilised soil specimens at 7 – day curing
period, (a) soil (b) porosity and (c) soil with porosity .......................................................... 129
Figure 4.31. X-RCT scans of guar gum stabilised soil specimens at 28 – day curing
period, (a) soil (b) porosity and (c) soil with porosity .......................................................... 129
Figure 4.34. X-RCT scans of xanthan gum stabilised soil specimens at 28 – day curing
period, (a) soil (b) porosity and (c) soil with porosity .......................................................... 130
Figure 4.35. Void size distribution of all the specimens after 1 day of curing .............. 132
Figure 4.36. Void size distribution of all specimens after 7 days of curing ................... 133
Figure 4.37. Void size distribution of all specimens after 28 days of curing ................. 134
Chapter 5 Assessment of biopolymer stabilised earthen construction material as a building
material........................................................................................................................................... 139
Figure. 5.1. Comparison of particle size gradation of sands used ................................... 140

(vii)
Figure. 5.2. Preparation of tile specimens, (a) Denison T60C hydraulic press and (b)
150 mm cube mould ................................................................................................................... 141
Figure. 5.3. Manufacturing of large cylinders, (a) Zwick Roell press and (b) Mould for
cylinders ........................................................................................................................................ 142
Figure. 5.4. Manufacturing of bricks, (a) 3R RP 3000 TC/TH press, (b) dismantled
open compaction mould, and (c) assembled compaction mould ........................................ 143
Figure. 5.5. Steps for manufacturing bricks ......................................................................... 144
Figure. 5.6. Test setup for Geelong erosion test .................................................................. 147
Figure. 5.7. Average depth of erosion for (a) tile specimens and (b) cylindrical
specimens ..................................................................................................................................... 148
Figure. 5.8. Rate of erosion for (a) guar gum, 7 days, (b) guar gum, 28 days, (c)
xanthan gum, 7 days, (d) xanthan gum, 28 days ................................................................. 149
Figure. 5.9. Test Setup for Contact test................................................................................. 150
Figure. 5.10. Conditions of bricks before and after contact tests for, (a) unamended
bricks, (b) guar gum stabilised bricks, and (c) xanthan gum stabilised bricks............. 151
Figure. 5.11. Test setup for the suction test ......................................................................... 152
Figure. 5.12. Condition of bricks before and after the suction tests ............................... 153
Figure. 5.13. Test setup for dip tests ...................................................................................... 154
Figure. 5.14. Loss of mass for all the bricks after dip tests .............................................. 155
Figure. 5.15. Conditions of bricks after dip tests: (a) unamended brick, (b) guar gum
stabilised brick and (c) xanthan gum stabilised brick ........................................................ 155
Figure. 5.16. Moisture buffering tests, (a) Climatic chamber and (b) Cylindrical
samples and (c) Brick samples ................................................................................................. 159
Figure. 5.17. Moisture absorption versus time for all cylindrical samples.................... 160
Figure. 5.18. Moisture absorption versus time for all biopolymer stabilised samples 161
Figure. 5.19. Comparison of moisture absorption for the last stable cycle, (a) guar gum
and (b) xanthan gum .................................................................................................................. 162
Figure. 5.20. Moisture buffering value (uptake versus release) – guar gum samples 163
Figure. 5.21. Moisture buffering value (uptake versus release) – xanthan gum
samples ......................................................................................................................................... 163
Figure. 5.22. Moisture buffering value (MBVpractical) for all samples ............................... 164
Figure. 5.23. Comparison of moisture buffering values of present study with literature
data ................................................................................................................................................ 165
Figure. 5.24. Comparison of particle size distribution of engineered soil mix with
recycled soil mixes ...................................................................................................................... 168
Figure 5.25. Plasticity properties of the unamended, stabilised and recycled material
........................................................................................................................................................ 169
Figure 5.26. Variation of Linear Shrinkage ......................................................................... 170

(viii)
Chapter 6 Conclusions .................................................................................................................. 176
Figure 6.1 Field implementation, (a) constructed rammed earth wallets, (b) cracks
and (c) water retention in rammed earth wallet ................................................................. 184

(ix)
Acknowledgements
When I received the offer to work as a Marie Curie Early Stage Researcher, I was overwhelmed
with joy and excitement to start my career as a researcher. From the day I joined Durham
University to this day in the University of Pau and Pays de L’Adour, where I am submitting my
research thesis, I see myself to have grown to be a confident researcher. This is entirely due to
the support which I have received from my supervisors. I humbly thank Dr Paul Hughes,
Professor Charles Augarde, Dr Celine Perlot and Professor Domenico Gallipoli for their support,
guidance and inspiration.
I acknowledge the support of the European Commission through the Marie Skłodowska-
Curie Innovative Training Networks (ITN-ETN) project TERRE ‘Training Engineers and
Researchers to Rethink geotechnical Engineering for a low carbon future’ for providing this
fellowship. Being part of TERRE was inspirational as I was able to meet fellow Early Stage
Researchers and other reputed research fraternity in geotechnical engineering. I thank the
entire network led by Professor Alessandro Tarantino for organising various doctoral schools
and workshops at different research institutes. These research programmes helped me to
improve my research skills and gain knowledge of unsaturated soil mechanics. I thank Dr.
Agostino Walter Bruno for his timely and helpful guidance during the project.
Working in two universities, I had to get adjusted to two different work cultures and
administrative procedures. Relocating to different country posed many challenges in terms of
visa applications and accommodation. Further, as an experimental research programme, there
were many issues faced in the laboratory. I was able to solve all these challenges with the
support of administrative staff, laboratory staff and fellow colleagues. Though I cannot name
each one of them here, I thank one and all who have supported me whenever I needed a helping
hand.
I thank my family members who have been a constant support to me. I thank Professor
H B Nagaraj from BMS College of Engineering for constant encouragement. Lastly and more
importantly, I thank my ever-supporting wife, Mamatha and sweet little son Nikunj who have
given me their unwavering support in completing my research thesis.
Regards,
Sravan
(x)
Publications
The research findings presented in this thesis have been published, presented
or submitted. The list of research publications from the thesis is as follows
• Muguda S, Booth SJ, Hughes PN, Augarde CE, Perlot C, Bruno AW, and Gallipoli
D. 2017. Mechanical properties of biopolymer-stabilised soil-based construction
materials. Géotechnique Letters, 7(4), 309–314.
• Muguda S, Booth SJ, Hughes PN, Augarde CE, Perlot C, Bruno AW, and Gallipoli
D. 2018. Preliminary study on use of biopolymers in earthen construction. In The
7th International conference on Unsaturated soils. Hong Kong.
• Muguda S, Lucas G, Hughes PN, Augarde CE, Cuccurullo A, Perlot C, Bruno AW
and Gallipoli D. 2018. Advances in using biological stabilisers and hyper-
compaction for sustainable earthen construction materials. In International
Symposium on Earthen Structures 2018. Bengaluru.
• Muguda S, Hughes PN, Augarde CE, Perlot C, Bruno AW, and Gallipoli D. 2019.
Geotechnical characterisation of recycled biopolymer-stabilised earthen materials.
In Proceedings of the XVII ECSMGE-2019. Reykjavik, Iceland.
• Muguda S, Hughes PN, Augarde CE, Perlot C, Bruno AW, and Gallipoli D.
Geotechnical characterisatics of biopolymer-stabilised earthen materials.
Submitted to Géotechnique.
• Muguda S, Hughes PN, Augarde CE, Perlot C, Bruno AW, and Gallipoli D.
Durability, Hygroscopic and Recycability properties of biopolymer-stabilised
earthen construction materials. Submitted to Construction and Building Materials.

(xi)
Nomenclature
Abbreviations
CEB Compressed earth block
CSB Cement stabilised block
CSEB Compressed stabilised
earth block
COV Co-efficient of variation
LS Linear Shrinkage
PI Plasticity Index
MDD Maximum Dry Density
OWC Optimum Water content
MBV Moisture buffering value
ESEM Environmental scanning
electron microscopy
SEM Scanning electron
microscopy
UC Unconfined Compression
NDTT Newcastle Direct Tensile
test
SWCC Soil water characteristic
curve
SWRC Soil water retention curve
CT Computed Tomography
XRCT X-Ray Computed
Tomography
ORP Oxidation reduction
potential
DO Dissolved oxygen
WHO World Health Organisation
Symbols
𝑒 Void ratio 𝑉𝑣 Volume of voids 𝑉𝑠 Volume of solids 𝑛 Porosity 𝑉 Total Volume of soil 𝑆𝑟 Degree of Saturation 𝜏 Total shear strength of soil 𝜏′ Effective shear strength of
soil
𝑐 Cohesion of soil 𝑐′ Effective cohesion of soil 𝜎 Total normal stress of soil 𝜎′ Effective normal stress of
soil Angle of internal friction
under total stress condition ′ Angle of internal friction
under total stress condition
𝑏 Angle indicating the rate of
increase in shear strength
relative to the matric
suction.
𝑠 Soil suction 𝑢𝑎 Pore air pressure 𝑢𝑤 Pore water pressure Total Suction 𝑚 Matric suction of soil 𝑜 Osmotic suction of soil 𝑟 Residual soil suction 𝐶 Capillary component of
matric suction of soil Water-air curvature 𝐴 Adsorptive component of
suction 𝑡 Film thickness 𝛾𝑑𝑚𝑎𝑥 Maximum dry density 𝑤𝐿 Liquid Limit 𝑤𝑃 Plastic Limit 𝜌𝑤 Density of water
R Universal gas constant
T Absolute temperature
RH Relative Humidity 𝑤𝑣 Molecular mass of water
vapour 𝑤 Gravimetric water content 𝑤𝑠𝑎𝑡 Saturated gravimetric
water content
𝐶(𝑠) Correction function 𝑎, 𝑚 & 𝑛 Fitting parameters 𝑞 Deviator stress 𝑝 Mean stress 𝐶 Intercept of failure
envelope 𝑀 Slope of failure envelope

1
Chapter 1
Introduction
1.1 “Earth” as a building material
Earth as a building material is an idea inspired by nature. Living organisms such as termites
and ovenbirds extensively use earth to build their homes, which provide them suitable
habitation against harsh environmental forces (Gould and Gould, 2012). Humans have been
using earth as a building material for over 10,000 years. From the earliest known use as sun-
dried adobe blocks in Jericho, Palestine (9000 BC), remains of rammed earth foundations in
Assyria (5000 BC), portions of Great Wall of China and other earthen structures suggest that
earth was used historically in various forms suited to the social, economic, geological and
climatic conditions (Jaquin and Augarde, 2012; Schroeder, 2016; Vyncke et al., 2018). Earthen
materials can be divided into three categories, namely, adobe or compressed earth blocks, cob,
and rammed earth (Houben and Guillaud, 1994; Keefe, 2005; Pacheco-Torgal and Jalali, 2012).
Adobe and compressed earth blocks are unit-based materials, while cob and rammed
earth are in-situ based earthen construction techniques. Adobe blocks are hand moulded sun-
dried bricks where a wet soil mixture is made into a brick using a wooden mould. In compressed
earth blocks, a moist earth mixture is placed in a brick mould and compacted to a specific
pressure using a mechanical or hydraulic press. Cob is a wet mixture of soil and straw, set in
layers to form a structure in-situ. Similar to adobe, the final cob structure is left to dry. Rammed
earth walls are layers of moist earth compacted within formwork. On reaching the final wall
height, the formwork is removed, and the solid wall is left to dry. In simple terms, earthen
materials can be defined as a compacted mixture of soil and water placed as a building unit. On
drying, these earthen materials gain strength providing stability to the earthen structure.
However, in this form, these materials are susceptible to deterioration against wind and rainfall.
To improve durability, traditionally, these materials have been stabilised through the inclusion
of straw or organic compounds such as plant extracts and animal dung (Ngowi, 1997; Plank,
2004). The stabilisations have improved the durability of these materials and ensured the
longevity of earthen structures. Though these vernacular building techniques utilising earth
have existed in the past, its relevance in the present-day construction has dwindled due to the
advent of modern building materials such as timber, steel and concrete.
1.2 Revival of earthen construction
There was an enlivened interest for earthen materials in the early part of the twentieth century
where these materials were studied under the framework of pavement geotechnics (Olivier and
Mesbah, 1987). However, since 1970, the interest in earthen materials has primarily arisen to
develop an alternative low-cost walling material and to fulfil housing needs in developing

Chapter 1. Introduction
2
countries. Another source of interest for earthen materials was in maintenance and restoration
of historic earthen structures (Germen, 1979). Initial attempts to promote earth as a building
material was taken up in 1950 via the United Nations; subsequently, earthen building was
promoted during the 1976 Vancouver Assembly of the United Nations Conference on Human
Settlements (UN Bulletin No. 4, 1950; UNHCS, 1976; UNIDO, 1980; Kerali, 2001). During these
promotions, it was noted that earthen materials were perceived to be primitive and inferior to
cement-based materials concerning its durability (Etzion and Saller, 1987). Subsequently, to
eradicate this perception scientifically, much research work has focussed on different aspects of
earthen materials. Soil characterisation, suitability of stabilisers and improvement in
production and construction techniques are a few of the initial research areas investigated.
Sub soil, which is the main ingredient of earthen construction materials, is necessarily
a mixture of different components namely gravel, sand, silt and clay. The clay ensures bonding,
sand and gravel act as a skeleton and silt fills up the voids making the material denser (Etzion
and Saller, 1987). Unlike sand and silt which are inert, clay is sensitive to water, hence prior
understanding of the clay behaviour in soil is essential. Clays are usually made of three types
of minerals, namely, kaolin, illite and montmorillonite. Usually, soils having kaolinite as the
primary clay mineral are preferred for earthen construction as they are less susceptible to
volume change. Desired proportions of sand, silt and clay vary depending on the earthen
construction technique adopted (Etzion and Saller, 1987). Hence, several researchers across the
world have studied the suitability of various soils based on soil gradation, plasticity and
shrinkage properties for different earthen construction techniques and have reported acceptable
limits of these parameters. Though there are reported variations in the recommended limits, in
general, for adobe, higher clay contents at about 30-50%, 0-20% silt and 50-70% sand is
acceptable. In the case of rammed earth and compressed earth blocks, lower clay contents at
about 0-20%, 0-50% silt and 50-80% sand are recommended (Cytryn, 1957; Olivier and Mesbah,
1987; Houben and Guillaud, 1994; Hall and Djerbib, 2004; Reddy et al., 2007; Burroughs, 2008).
In terms of soil plasticity, soils having a liquid limit in the range of 30-50% and plasticity index
less than 20% are preferred for earthen materials (Fitzmaurice, 1958; Bryan, 1988). Recently,
characterisation in terms of shrinkage properties suggests that soils having linear shrinkage
less than 5.0% are preferable for earthen materials (Burroughs, 2010). Soils which fall within
these categories are deemed to be suitable for earthen construction.
To be competitive in modern construction, the mechanical and durability properties of
earthen materials need enhancement. In order to achieve this, “soil stabilisation”, a technique
effectively employed in pavement geotechnics has been considered in earthen construction.
Whilst different stabilisers such as cement, lime, bitumen and polymers have been explored, it
is “cement” which tends to be the most popular amongst these stabilisers. Hence, extensive
research studies have been undertaken to understand the role of cement as a stabiliser for
earthen construction materials. A number of references indicate that to compete with
conventional fired bricks, the wet compressive strength of cement stabilised earthen blocks

Chapter 1. Introduction
3
should be in the range of 1.5-3.5 MPa (Fitzmaurice, 1958; Houben and Guillaud, 1994; Webb,
1994; IS 1725, 2013). Earthen blocks when stabilised with cement at 7-12% of soil mass achieve
this desired strength and in turn durability (Fitzmaurice, 1958; Spence, 1975; Bryan, 1988;
Reddy and Jagadish, 1989; Houben and Guillaud, 1994; Walker and Stace, 1997; Ciancio and
Boulter, 2012). For rammed earth walls, the recommended characteristic compressive strength
should be higher than 2MPa; this corresponds to the minimum strength required for one-storey
external walls of 300mm thickness (Middleton and Schneider, 1987; Walker, 2002). The addition
of 5-10% cement by soil mass is sufficient to produce this desired strength and durability in
rammed earth walls (Webb, 1994; Reddy and Kumar, 2009). Soil stabilisation has been an
important innovation which has not only improved the strength and durability of earthen
materials but has also helped to eradicate the perception of earthen materials being an inferior
building material.
Soil mixtures used in adobe and cob essentially have higher clay contents and are mixed
at higher water contents. In order to have improved mechanical performance, it is necessary
that the clay in the soil mixture is uniformly distributed (Hamard et al., 2016). Hence, soil
mixtures are usually pre-soaked and mixed thoroughly. Traditionally, mixing for adobe and cob
was done manually; however, modern innovations have developed mechanised mixing which
has improved mixing action and reduced labour (Hamard et al., 2016). Attempts to improve soil
mixing have been made through the use of concrete mixers, mortar mixers and rotavators
(Keefe, 2005). On the other hand, compressed earth blocks and rammed earth are mixed at lower
water contents and compacted to a specific pressure. Hence, compaction plays a vital role in
these materials. As an initial step towards improvement in earth blocks, CINVA-Ram, an earth
block making machine, was developed in 1956 (Webb, 1983). Subsequently, many block making
machines such as ASTRAM, CETA-Ram, CTA Triple-Block Press have been developed in
different countries (Webb, 1983; Mukerji, 1986). Production of compressed earth blocks through
block making machines has ensured control over their material properties and dimensional
accuracies. Rammed earth walls have undergone two significant innovations. Pneumatic
backfill tampers powered with air compressors have replaced traditional wooden rammers
which has ensured better ramming (Easton and Easton, 2012) and the traditional wooden
formwork has been replaced with different varieties of modern formwork which enables the
construction of continuous rammed earth walls with precise geometries. Both of these
developments have modernised rammed earth construction and made it a construction material
which is highly durable and aesthetically pleasing.
Extensive laboratory research and field implementations carried over four decades on
the above topics have led to the development of technical standards for different earthen
materials in a few countries around the world. These standards ensure quality control over
material characterisation, structural design, construction techniques and material testing. Not
only has the revival of earthen construction ensured the development of competitive building
materials but it has also increased understanding of functionality, energy costs and
sustainability of these construction products. With these developments, modern earth

Chapter 1. Introduction
4
construction has redefined the past notion of being inferior, primitive structures to
architecturally pleasing durable structures. However, even with these developments, the
general uptake of earthen construction materials in construction industry is still low.
1.3 Earthen materials – Modern perspective
With the revival of earthen construction, the modern perspective of earthen material is that it
is a building material which has inherent sustainable characteristics. Characteristics such as
low embodied energy, low operational energy, fire resistant and recycling capabilities have made
earthen materials an attractive sustainable building material in modern construction.
• Embodied energy. Earthen materials have less embodied energy compared to fired
bricks or concrete. They require a mere 1% of the required energy to manufacture and
process an equivalent quantity of cement concrete (Deboucha and Hashim, 2011).
Another example is the cumulative energy demand of compressed stabilised earth blocks
at nearly half of traditional fired bricks (Schroeder, 2016).
• Energy efficiency. With proper design, earth buildings over their lifetime consume
less operational energy when compared to conventional structures. Due to the synergy
of thermal conductivity and hygroscopic properties of earthen materials, the indoor
environment of earth buildings tends to be comfortable during both summer and winter
(Gallipoli et al., 2014). As earthen materials can acclimatise themselves to any natural
environment, they help to reduce operational costs of heating or cooling in an earth
building.
• Carbon emissions. Unlike concrete and steel buildings, earth structures have the
least carbon emissions associated with them (Pacheco-Torgal and Jalali, 2012). As a
natural product, earthen materials undergo less processing for construction which
ensures less carbon is emitted (Keefe, 2005). With a small carbon footprint, earth
buildings can reduce the annual carbon emissions contributed by building construction.
• Recycling. On demolition, earthen materials are recycled easily. As these materials
would have undergone the least modification during construction, they need less energy
to recycle them (Schroeder, 2016). The recycled material can be reused or safely
disposed of with the least environmental impact. The potential to recycle these materials
prevents the generation of demolition waste which is one of the most significant
contributors of waste worldwide.
• Acoustic insulation. Earth buildings have excellent acoustic insulating properties
(Calkins, 2008). Gallipoli et al., (2014) have reported that a 0.3m thick rammed earth
wall prepared at a dry density of 2100 kg/m3 has a relatively high sound reduction index
of 58.3 dB; this should be compared to UK building regulations which recommend a
sound reduction index value should be a minimum of 40dB.

Chapter 1. Introduction
5
• Fire Resistance. Earth materials are naturally fire resistant and harden on exposure
to fire. Many chimneys and fireplaces which have been constructed using earthen
materials have not undergone any damage due to fire (Ciurileanu and Horvath, 2012).
With these inherent characteristics, earthen materials are often considered “green” and
“sustainable” building materials. However, earthen materials do have few drawbacks which
limit their adoption into mainstream construction.
• Soil suitability. For all kinds of earthen construction techniques, only soils having the
desired proportion of sand, silt and clay are considered suitable for construction. This
may limit the possibility of using any soil available in a given locality. If locally available
soil is deemed unfit, suitable soil must be sourced from different localities. Sourcing of
suitable soil involves transportation which would increase the carbon footprint and
energy consumption associated with the material.
• Construction standards. Unlike concrete structures, design and construction using
earthen construction materials depend upon standards which have often been
empirically derived rather than obtained from engineering science The empirical design
approach has not always brought out the potential benefits of earthen materials which
if accurately quantified can bring down the construction costs (Gallipoli et al., 2017). .
• Workmanship. For earth buildings, two levels of quality control are necessary, one
during selection, processing and storage of the soil, and another during construction to
ensure that each unit of earthen materials achieves the required density. These checks
ensure that the earth building meets the required design strength and durability. Hence,
the built quality of earth buildings highly relies on the workmanship carried out at the
site (Crowley, 1997).
• Durability. The main drawback of any earthen material is its inability to withstand
deterioration against surface erosion. Research studies have shown that unstabilised
earthen materials are highly susceptible to damage in wet climates and persistent
rainfall leads to deterioration of the structure(Bui et al., 2009). For instance,
extrapolated results indicate 25 to 80mm erosion over a period of 100 years which is
unacceptable in modern construction.
• Dependence on chemical stabilisers. In order to improve durability, earthen
materials are often treated with chemical stabilisers such as cement and lime. Though
the treatment leads to improved engineering properties, the dependence on chemical
stabilisers represents a compromise on cost and reduces the green credentials of these
materials (Gallipoli et al., 2017).
• Seismic vulnerability. Earth buildings have a high seismic vulnerability because they
are dense and possess low tensile strength. Hence, earth materials usually exhibit
brittle failure which is usually avoided in structural design. Hence, earth buildings are
usually limited to geographical locations which are which is less prone to seismic
activity.

Chapter 1. Introduction
6
• Poor insulation. At extreme climatic conditions, earth buildings pose problems with
regards to insulation. The earthen walls require proper insulation in order to make the
earthen building habitable(Krayenhoff, 2012).
1.3.1 Problems with modern earthen construction
Of all the drawbacks mentioned above, the dependency of earthen materials on chemical
stabilisers has a direct impact on the inherent characteristics which make them sustainable.
The inclusion of chemical stabilisers, whilst improving durability, has to an extent reduced the
“green” credentials of earthen materials. Research has shown that the inclusion of chemical
stabilisers to earthen materials has led to increased embodied energy and carbon footprint,
increased operational energy and reduced recyclability potential (Gallipoli et al., 2017).
Cement production, which contributes 7-8% to global carbon emissions annually, is the
most popular stabiliser in earthen construction. Studies have shown that the addition of cement
affects embodied energy and carbon footprint of earthen materials. Reddy and Kumar (2010)
report that in cement stabilised rammed earth walls, embodied energy of cement significantly
contributes to the overall embodied energy of the earthen material. Typically, earthen materials
stabilised with cement at 9% have an equivalent carbon footprint to that of a fired brick or weak
concrete (Lax, 2010). Maskell et al.,(2014) studied the environmental impact of different
chemical stabilisers used in earthen construction. It was reported that in practice, the optimum
dosage of the stabiliser is determined on the basis of achieving maximum strength and
durability, but it is seldom determined in terms of sustainability. As an example, the acceptable
cement content to have a sustainable 100mm thick rammed earth wall was estimated to be 6.9%,
however, in practice, the walls are much thicker and recommended cement contents are much
higher. These studies reveal that the dependence on cement for strength and durability has led
to increased embodied energy and carbon footprint which are above the threshold values of
sustainability.
Hygroscopic behaviour of earthen materials controls the indoor environment of the
building and has a direct impact on air-conditioning. McGregor et al., (2014) undertook a
comparative study on the hygroscopic behaviour of unstabilised and stabilised compressed earth
blocks. Different chemical stabilisers, namely cement, lime and sodium hydroxide were used in
this study. It was noted that the unstabilised blocks had slightly higher moisture buffering value
(MBV) than the stabilised blocks, indicating better hygroscopic behaviour. Within the stabilised
versions, cement had better performance than lime and sodium hydroxide stabilised blocks.
Recently, Arrigoni et al.,(2017) undertook a study to understand the impact of stabilisation on
the hygroscopic behaviour of rammed earth. Cement and calcium carbide residue were used as
stabilisers in this study. It was reported that stabilisation had a drastic reduction in the
hygroscopic behaviour of the stabilised rammed earth. Research findings from these studies
indicate that unstabilised earthen materials have better hygroscopic behaviour than stabilised
alternatives. The construction technique and the stabiliser used further influences the
Chapter 1. Introduction
7
hygroscopic performance of the earthen materials. As hygroscopic behaviour has a direct impact
on the operational energy of the building, it is necessary that the stabilised versions match the
performances of unstabilised earthen materials.
Stabilised earthen structures which commonly rely on chemical stabilisers for durability
pose a severe obstacle in recycling the material on demolition. On stabilisation, the soil particles
are firmly bonded through strong cementitious bonds which are hard to disintegrate. Unlike
unstabilised earthen materials which can be recycled and reused easily, the demolished
stabilised versions are usually downcycled or dumped in landfill (Schroeder, 2016). The inability
to recycle the modern earthen material leads to the production of construction demolition waste
which is one of the most significant contributors to the total waste globally. Hence, modern
earthen construction needs to employ alternative stabilisers which ensure the stabilised
material is both durable and recyclable on demolition.
1.4 Research aims and objectives
In a pursuit to compete with modern building materials, earthen construction materials have
compromised their inherent green credentials. In modern construction, earthen construction
materials were initially preferred for their green credentials, and now these materials are
scrutinised for their dependence on stabilisers with high carbon costs. With the growing global
interest in sustainability, future construction is expected to utilise sustainable materials. In this
regard, earthen materials have the potential be the most appropriate building materials
provided they re-establish their inherent green credentials. Bio-stabilisation is an exciting
stabilisation technique which is being investigated actively in geotechnical engineering
applications. In particular, microbial induced calcium precipitation and biopolymers have been
viewed as possible alternatives for conventional stabilisers especially in soil treatment and
improvement (Ivanov and Stabnikov, 2016; Pacheco-Torgal et al., 2016). This situation motivates
this study to find a suitable bio-stabiliser as an alternative to high energy consuming stabilisers
which may provide desirable strength and durability to earthen materials.
The main aim of this thesis is to identify a suitable bio-stabiliser, understand its potential
as a stabiliser through geotechnical characterisation and assess the performance of bio-
stabilised earthen material as a building material. In order to achieve this the following
objectives for the research programme are considered.
• Bio-stabilisation. To identify and optimise the identified bio-stabilisation technique
for earthen construction materials
• Geotechnical characterisation. To establish mechanical and hydraulic behaviour of
the bio-stabilised earthen material through soil mechanics principles.
• Building material assessment. To evaluate the durability, hygroscopic behaviour and
recycling potential of bio-stabilised earthen materials.

Chapter 1. Introduction
8
1.5 Thesis structure
In Chapter 2 of the thesis, three important aspects which are interlinked in this work namely,
earthen construction, unsaturated soil mechanics and bio-stabilisation are discussed. Detailed
discussions on the earthen construction techniques for which bio-stabilisation is employed in
this study are presented herein. Further, a brief introduction to unsaturated soil mechanics is
presented which contributes to an understanding of the mechanical and hydraulic behaviours
of earthen materials. As the thesis aims in utilising a bio-stabilisation technique in earthen
construction, discussions on different bio-stabilisation techniques, advantages and
disadvantages of these techniques and the literature relating to the shortlisted bio-stabilisers
are presented. In this study, biopolymers namely guar and xanthan gum are chosen as potential
stabilisers.
Chapter 3 presents the test results of a preliminary experimental campaign undertaken to
understand biopolymer soil stabilisation. Results of air-dried compressive and tensile strengths
for earthen material stabilised with different biopolymer dosages are presented. The test results
yielded an understanding of how both strengths are influenced by biopolymer interactions and
soil suction. On comparing the strengths with those of unamended and cement stabilised
earthen material an optimum stabiliser content is determined. Further, results of preliminary
durability tests and X-ray computed tomography scans are presented. Understanding of
biopolymer stabilisation is crucial for subsequent campaigns of geotechnical characterisation
and building material assessment.
Chapter 4 investigates the mechanical and hydraulic behaviour of biopolymer stabilised
earthen construction materials. To evaluate the mechanical behaviour, constant water content
triaxial tests are done on air-dried biopolymer stabilised earthen material. Soil-water retention
properties are determined to understand the hydraulic behaviour of the biopolymer stabilised
material. The effect of biopolymer stabilisation on macropore structure at different curing
periods are presented through x-ray computed tomography scans.
Assessment of biopolymer stabilised materials as a building material are presented in
Chapter 5. Durability performance of biopolymer stabilised earthen construction materials is
evaluated through different tests namely erosional resistance, immersion, contact and suction
tests, and the results of these tests are presented in this chapter. Tests results of the hygroscopic
behaviour (via moisture buffering tests) and recyclability potential (through standard
geotechnical tests) of these materials are also presented. Further, the performance of biopolymer
stabilised material is compared with unamended and cement stabilised earthen materials in
this chapter.
Conclusions of the research findings from Chapters 3 to 5, as well as potential implications
of biopolymer soil stabilisation and future recommendations, are presented in Chapter 6.

Chapter 1. Introduction
9
References
Arrigoni A, Grillet AC, Pelosato R, Dotelli G, Beckett
C, Woloszyn M, and Ciancio D. 2017. Reduction
of rammed earth’s hygroscopic performance
under stabilisation: an experimental
investigation. Building and Environment, 115,
358–367.
Bryan AJ. 1988. Criteria for the suitability of soil for
cement stabilization. Building and
Environment, 23(4), 309–319.
Bui QB, Morel JC, Venkatarama Reddy B, and Ghayad
W. 2009. Durability of rammed earth walls
exposed for 20 years to natural weathering.
Building and Environment, 44(5), 912–919.
Burroughs S. 2008. Soil Property Criteria for Rammed
Earth Stabilization. Journal of Materials in Civil
Engineering, 20(3), 264–273.
Burroughs S. 2010. Recommendations for the
Selection, Stabilization, and Compaction of Soil
for Rammed Earth Wall Construction. Journal
of Green Building, 5(1), 101–114.
Calkins M. 2008. Materials for Sustainable Sites: A
Complete Guide to the Evaluation, Selection,
and Use of Sustainable Construction Materials.
John Wiley & Sons.
Ciancio D, and Boulter M. 2012. Stabilised rammed
earth: a case study in Western Australia.
Proceedings of the Institution of Civil Engineers
- Engineering Sustainability, 165(2), 141–154.
Ciurileanu GT, and Horvath IB. 2012. Modular
Building Using Rammed Earth. Acta Technica
Napocensis: Civil Engineering & Architecture,
55(2), 173–181.
Crowley M. 1997. Quality control for earth structures.
Australian Institute of Building Papers, 8, 109–
118.
Cytryn S. 1957. Soil Construction: Its Principles and
Application for Housing. Jerusalem: The
Weizman Science Press of Israel.
Deboucha S, and Hashim R. 2011. A review on bricks
and stabilized compressed earth blocks, 6(3),
499–506.
Easton D, and Easton T. 2012. Modern rammed earth
construction techniques. In M. R. Hall, R.
Lindsay, & M. B. T.-M. E. B. Krayenhoff (Eds.),
Modern Earth Buildings (pp. 364–384). Elsevier.
Etzion Y, and Saller M. 1987. Earth Construction—A
Review of Needs and Methods. Architectural
Science Review, 30(2), 43–48.
Fitzmaurice R. 1958. Manual on stabilized soil
construction for housing. New York: United
Nations, Technical Assistance Programme.
Gallipoli D, Bruno AW, Perlot C, and Mendes J. 2017.
A geotechnical perspective of raw earth building.
Acta Geotechnica, 12(3), 463–478.
Gallipoli D, Bruno AW, Perlot C, and Salmon N. 2014.
Raw earth construction: is there a role for
unsaturated soil mechanics. Taylor & Francis
Group, London, UK.
Germen A. 1979. The endurance of earths as building
material and the discreet but continuous charm
of adobe. METU Journal of the Faculty of
Architecture, 5(1), 37–68.
Gould JL, and Gould CG. 2012. Animal architects:
building and the evolution of intelligence. Basic
Books.
Hall M, and Djerbib Y. 2004. Rammed earth sample
production: context, recommendations and
consistency. Construction and Building
Materials, 18(4), 281–286.
Hamard E, Cazacliu B, Razakamanantsoa A, and
Morel JC. 2016. Cob, a vernacular earth
construction process in the context of modern
sustainable building. Building and
Environment, 106, 103–119.
Houben H, and Guillaud H. 1994. Earth construction:
a comprehensive guide. Intermediate
Technology Publications.
IS 1725. 2013. Indian Standard IS 1725: Stabilized soil
blocks used in general building construction —
Specification. New Delhi: Bureau of Indian
Standards.
Ivanov V, and Stabnikov V. 2016. Construction
Biotechnology: Biogeochemistry, Microbiology
and Biotechnology of Construction Materials
and Processes. Springer.
Jaquin PA, and Augarde C. 2012. Earth building:
history, science and conservation. Bracknell:
IHS BRE Press.
Keefe L. 2005. Earth Building Methods and Materials,
repair and conservation. Taylor & Francis.
Kerali AG. 2001. Durability of Compressed and
Cement Stabilised Building Blocks. University
of Warwick.
Krayenhoff M. 2012. North American modern earth
construction. In Modern Earth Buildings (pp.
561–608). Elsevier.
Lax C. 2010. Life cycle assessment of rammed earth.
University of Bath. Retrieved from
http://www.ebuk.uk.com/docs/Dissertation_Clar
e_Lax.pdf
Maskell D, Heath A, and Walker P. 2014. Comparing
the Environmental Impact of Stabilisers for
Unfired Earth Construction. Key Engineering
Materials, 600, 132–143.
McGregor F, Heath A, Fodde E, and Shea A. 2014.

Chapter 1. Introduction
10
Conditions affecting the moisture buffering
measurement performed on compressed earth
blocks. Building and Environment, 75, 11–18.
Middleton GF, and Schneider LM. 1987. Bulletin 5:
Earth-Wall Construction (Vol. 5). Sydney,
Australia: CSIRO.
Mukerji K. 1986. Soil block presses. Publication of
Deutsches Zentrum fr
Entwicklungstechnologien – GATE, a Division of
the Deutsche Gesellschaft fr Technische
Zusammenarbeit (GTZ) GmbH.
Ngowi AB. 1997. Improving the traditional earth
construction: a case study of Botswana.
Construction and Building Materials, 11(1), 1–7.
Olivier M, and Mesbah A. 1987. Influence of different
parameters on the resistance of earth, used as a
building material. In International Conference
on Mud Architecture, Trivandrum, India (Vol.
25).
Pacheco-Torgal F, Ivanov V, Karak N, and Jonkers H.
2016. Biopolymers and Biotech Admixtures for
Eco-Efficient Construction Materials. Woodhead
Publishing.
Pacheco-Torgal F, and Jalali S. 2012. Earth
construction: Lessons from the past for future
eco-efficient construction. Construction and
Building Materials, 29, 512–519.
Plank J. 2004. Applications of biopolymers and other
biotechnological products in building materials.
Applied Microbiology and Biotechnology, 66(1),
1–9.
Reddy B, and Jagadish JS. 1989. Properties of soil–
cement block masonry. Masonry International,
3(2), 80–84.
Reddy B, and Kumar PP. 2009. Role of clay content and
moisture on characteristics of cement stabilised
rammed earth. In Proceedings of the 11th
International Conference on Non- Conventional
Materials and Technologies (NOCMAT). Bath
University.
Reddy B, and Kumar PP. 2010. Embodied energy in
cement stabilised rammed earth walls. Energy
and Buildings, 42(3), 380–385.
Reddy B, Lal R, and Rao KN. 2007. Optimum Soil
Grading for the Soil-Cement Blocks. Journal of
Materials in Civil Engineering, 19(2), 139–148.
Schroeder H. 2016. Sustainable Building with Earth.
Sustainable Building with Earth. Cham:
Springer International Publishing.
Spence RJS. 1975. Predicting the performance of soil-
cement as a building material in tropical
countries. Build. Sci., 10, 155.
UN Bulletin No. 4. 1950. Housing, Town and Country
Planning. New York: United Nations.
UNHCS. 1976. Report of HABITAT, A/CONF.
Vancouver.
UNIDO. 1980. Appropriate Industrial Technology for
Construction and Building Materials.
Monographs on Appropriate Industrial
Technology, No.12. New York: UNIDO.
Vyncke J, Kupers L, and Denies N. 2018. Earth as
Building Material - An overview of RILEM
activities and recent Innovations in Geotechnics.
MATEC Web of Conferences, 149, 1–7.
Walker P. 2002. Standards Australia, 2002. HB 195:
The Australian Earth Building Handbook.
Walker P, and Stace T. 1997. Properties of some cement
stabilised compressed earth blocks and mortars.
Materials and Structures/Materiaux et
Constructions, 30(203), 545–551.
Webb D. 1983. Stabilized soil construction in Kenya. In
International conference on economical housing
in developing countries. Paris: UNESCO.
Webb D. 1994. Stabilised soil and the built
environment. Renewable Energy, 5(5–8), 1066–
1080

11
Chapter 2
Literature Review
2.1 Chapter introduction
In this thesis, bio-stabilisation is employed for the development of new earthen construction
materials for techniques such as rammed earth and compressed earth blocks. Here a historical
overview of these techniques is presented and along with their construction procedures, suitable
soils and desired engineering properties are discussed. Earthen construction materials which
are essentially compacted soil can be understood considering it in terms of unsaturated soil
mechanics (Jaquin et al., 2009); hence, subsequent sections in this chapter gives an overview of
the basics of soil mechanics and unsaturated soil mechanics. Finally, the chapter concludes with
literature focussing on the chosen bio-stabilisation technique, i.e. biopolymer stabilisation.
2.2 Earthen construction techniques
2.2.1 Rammed earth wall construction
2.2.1.1. Overview of rammed earth construction
Rammed earth construction is one of the most widely used earthen construction techniques
across the world. A detailed chronological study on historic rammed earth structures scattered
around the world suggests that rammed earth construction may have originated independently
in ancient China and Mediterranean, and later spread throughout the world with human
migration (Jaquin et al., 2008). Studies on these traditional earthen constructions have led to
the development of design guidelines for the present-day rammed earth construction.
In China, though rammed earth structures existed in the late Neolithic period (2000-
3000 BC), Schroeder (2016) suggests that Fu Yueh, a minister in Shang Dynasty’s (around 1320
BC) was the first “rammed earth master builder”. Excavations at Shang Dynasty capital in
Anyang, Henan Province have revealed a rammed earth wall 70 m long and 2-4 m thick (Houben
and Guillaud, 1994). Later, rammed earth construction techniques spread across Henan and
Shandong provinces under Zhou and Qin dynasties. It is during this era that sections of the
Great Wall of China were initially built using rammed earth technique (Beckett, 2011). Houben
and Guillaud (1994) mention that the ‘true’ rammed earth technique using formwork was
constructed during the Three Kingdoms period (221-581 AD). The Tang Dynasty developed
many cities with fortified rammed earth walls along the Silk Route (Jiyao and Weitung, 1990).
For instance, the Tang Fort of Baishui, located at the western end of the Silk Route is solely
constructed using rammed earth techniques (Jaquin et al., 2008). Regulated trade might have
led to the development of rammed earth structures with Japan; a classic example is the

Chapter 2. Literature review
12
renowned Buddhist monastery in Horyuji (607 AD), the earliest known rammed earth structure
in Japan). Later, the rise of the Ming Dynasty (1368-1644 AD) after the fall of the Jin empire
led to Chinese expansionism. This expansion led to the development of rammed earth structures
across China (Jaquin et al., 2008). The largest and most well-known sections of the Great Wall
using rammed earth techniques were built during this period. Later, the use of rammed earth
technology spread across Asia. Historic rammed earth structures are found in Himalayan
regions like Tibet, Bhutan, Nepal and India (Jaquin et al., 2008).
Figure 2.1. Rammed earth portion of The Great Wall of China at Gansu, China. Photo
retrieved from https://www.murailledechine.com/voyage-jiayuguan-gansu
In the Mediterranean, it seems that rammed earth was initially used in Phoenician settlements,
where excavations have revealed the use of rammed earth construction. This seems to be
independent of the rammed earth technique developed by the ‘‘oasis dwellers’ of North Africa
(Michon, 1990). Excavations of third century AD sites reveal many rammed earth walls in
Southern France (Houben and Guillaud, 1994). In the eighth century, there was a re-
introduction of rammed earth construction through the Muslim invasions in Europe and North
Africa. The Almoravid and Almohad Berber Dynasties, that originated from the Sahara and
ruled North Africa and Iberia, used rammed earth extensively (Jaquin et al., 2008), and example
being the city walls and El Badi Palace constructed in 1578 in Marrakesh, Morocco. Much of the
vernacular architecture in Morocco at that time used rammed earth construction techniques.
After the fall of Muslim rulers in 1492, the Christian rulers employed Muslim artisans and

Chapter 2. Literature review
13
craftsmen and used rammed earth techniques which later spread across Spain. In Spain,
rammed earth was used for military buildings and this vernacular architecture lasted until the
end of nineteenth century (Font and Hidalgo, 1991; Gerrard, 2003). Colonial expansion to North
and South America, Australia and New Zealand led to the introduction of rammed earth
structures in these countries. Prior to colonial expansion, there were no reported earth
structures in these countries (Beckett, 2011). Around 1556 AD, colonists built the first rammed
earth structure in North America at St Augustine, Florida. Subsequently, the use of rammed
earth construction spread across North America with colonisation between 1607 and 1703.
Colonists also took rammed earth construction to northern regions of South America. In São
Paulo, the cathedral of Taubaté was built in 1645 using the rammed earth technique (Jaquin et
al., 2008). Subsequently, many rammed earth structures were built in São Paulo, where it was
the most widely used construction technique between the 18th and 19th century. European
explorers introduced rammed earth construction technique to Australia and New Zealand.
Similar to America, rammed earth construction spread across the Australian continent with
colonial expansion.
Figure 2.2. Chapel of Reconciliation in Berlin, Germany, Photo by Reitermann (2001)
In late 18th century and throughout the 19th century, there was a strong revival of earthen
construction due to the initiative of the Lyonnais architect and professor Francois Cointeraux.
Cointeraux conducted several experiments on rammed earth technique and detailed the
specification for constructing earthen building in this publication ‘‘Ecole d’Architecture Rurale’’

Chapter 2. Literature review
14
(1791). This later led to dissemination of earthen construction in Europe, United States of
America and Australia (Gallipoli et al., 2017). In the early 20th century, the interest in earthen
materials was primarily to develop low-cost buildings. However, with its aesthetic appeal,
rammed earth is recognized by various architects across the globe. From the early 21st century,
countries like Australia, New Zealand, United States of America, Canada, India, and many
European countries have seen the construction of rammed earth buildings. With better
construction quality and technology, modern rammed earth structures have seen several
innovations. With better ramming equipment, modern rammed earth walls are thinner and
taller, while flexible formwork has paved the way to curved walls (Niroumand et al., 2012;
Wallis, 2012). With these developments, many modern rammed earth structures have been
constructed across the globe. Some examples are the Chapel of Reconciliation in Germany, the
Naked Stables Private Reserve in China and the Nk’Mip Desert Cultural Center in Canada
(Krayenhoff, 2012; Niroumand et al., 2012; Wallis, 2012). Figure 2.2 shows the first of these
which is an iconic representation of the reunion of East Germany and West Germany and is
constructed using rammed earth techniques.
2.2.1.2. Construction procedure for a rammed earth wall
Figure 2.3 illustrates a typical onsite construction sequence of a rammed earth wall.
Traditionally, rammed earth walls were constructed using the sub-soil available at the site,
however, modern rammed earth tends to adhere to strict guidelines delineating the desired soil
properties. A detailed section on desired soil properties appears later in this chapter. Generally,
a well-graded soil mixture consisting of 50-80% sand and gravel, 10-30% silt and 5-20% clay is
preferred (Walker et al., 2005). Initially, all the ingredients, i.e. sand, gravel and fines (silt and
clay) are dry mixed thoroughly. For stabilised versions, the required quantity of the chemical
stabiliser (cement and/or lime) is introduced to this dry mixture. A predetermined quantity of
water is then added to this mixture and mixed thoroughly either manually or through
mechanised mixing. Each rammed earth wall is manufactured as a collection of large blocks,
with each block prepared with layers of compacted earth within formwork. The formwork is
made of sturdy material and is ensured plumb through vertical supports. The moist soil mixture
is introduced into this formwork arrangement and rammed into layers until the desired density
is achieved. Ramming is done either through hand-held rammers or pneumatically powered
tampers (Niroumand et al., 2012).
The process of introducing the soil mixture into the formwork and ramming is done until
the maximum height to which the wall can be compacted within the formwork (lift). Usually the
first lift of wall is constructed onto an earthen foundation or concrete stem wall depending upon
the design specifications. Once a lift is completed, the formwork is loosened and re-mounted on
top of the freshly rammed wall section. The process of introducing the moist soil mixture into
the formwork, ramming it up to lift height and re-mounting of formwork is repeated till the

Chapter 2. Literature review
15
required wall height is achieved. Once the wall is completed, the formwork is removed and wall
is left to dry to gain strength. In the case of stabilised rammed earth walls, where cement or
lime is used to achieve design strength, suitable curing techniques are employed.
Figure 2.3. Illustration of rammed earth wall construction
2.2.2 Compressed earth blocks
2.2.2.1. Overview of compressed earth blocks
Compressed earth blocks (CEBs) are the modern variant of the hand moulded “Adobe” blocks.
Compared to adobe blocks which have a history of about 9000 years, CEBs are relatively newer
forms of earthen materials. In the 18th century, the concept of manufacturing earthen blocks
using a wooden press became popular in Europe (Deboucha and Hashim, 2011; Vyncke et al.,
2018). However, the pivotal point for compressed earth blocks came with the invention of a small
mechanical press CINVA-RAM by engineer Raul Ramirez at Inter-American Housing and
Planning Centre (CINVA), Bogota, Colombia (Webb, 1983; Reddy et al., 2007; Deboucha and
Hashim, 2011). In the United Nations Conference on Human Settlement held in Vancouver
Assembly, CEBs were promoted as alternative low-cost walling units (UNHCS, 1976; Kerali,
2001). Since this promotion, CEBs have been considered as a low-cost alternative to conventional
fired bricks and have been used extensively in many countries across Asia, North America and
Africa. CEBs later adopted soil stabilisation, leading to the development of Cement Stabilized
Blocks (CSBs), which have comparable mechanical and other performances to that of traditional
fired bricks. Many pilot housing projects were undertaken using CSBs manufactured using the
CINVA-RAM (Fullerton, 1967; Selvanayagam, 1970; Moriarty et al., 1975; Spence, 1975;
Hughes, 1983). The houses constructed using CSBs were found to have better inner climatic
conditions than modern materials (Fullerton, 1967; Hughes, 1983). However, these projects

Chapter 2. Literature review
16
reported concerns over long-term durability of CSBs. Subsequently, importance was given to
both compression and stabilisation which led to the development of Compressed Stabilized
Earth Blocks (CSEBs). Modern variants of block making presses such as ASTRAM, CETA-Ram,
CTA Triple-Block Press developed improved the compacting effort during the manufacture of
the blocks (Webb, 1983; Mukerji, 1986). Furthermore, many completed automated production
units which manufacture CSEBs of different sizes and shapes were developed (Rigassi, 1985).
With regards to stabilisation, many research studies have documented the role of different
stabilisers in preparing CSEBs with improved strength and durability performances
(Fitzmaurice, 1958; Olivier and Mesbah, 1987; Houben and Guillaud, 1994; Reddy and Jagadish,
1995; Walker and Stace, 1997; Reddy and Kumar, 2009; Nagaraj et al., 2016). With this
evolution, earthen blocks of these types now are formidable competitors to traditional fired
bricks.
2.2.2.2. Manufacturing procedure for compressed earth blocks
Figure 2.4. Illustration of manufacturing compressed earth blocks
Preparation of CEBs involves batching, mixing, placing the mix, compaction, ejection and curing
of the blocks. The required quantities (mass basis) of the ingredients namely, soil components
and the stabilizer (in case of CSEBs) are initially mixed in the dry condition. Similar to rammed
earth walls, a well-graded soil mixture consisting of 50-80% sand and gravel, 10-30% silt and 5-
20% clay is preferred for making compressed earth blocks (Walker et al., 2005). Stabiliser
content for CSEBs varies in range of 7-12% of the soil mass (Fitzmaurice, 1958; Spence, 1975;
Bryan, 1988; Reddy and Jagadish, 1989; Houben and Guillaud, 1994; Walker and Stace, 1997;
Ciancio and Boulter, 2012). A pre-determined water which is sufficient enough to make the soil
mixture mouldable is sprinkled on the dry mix and thoroughly mixed until a uniform
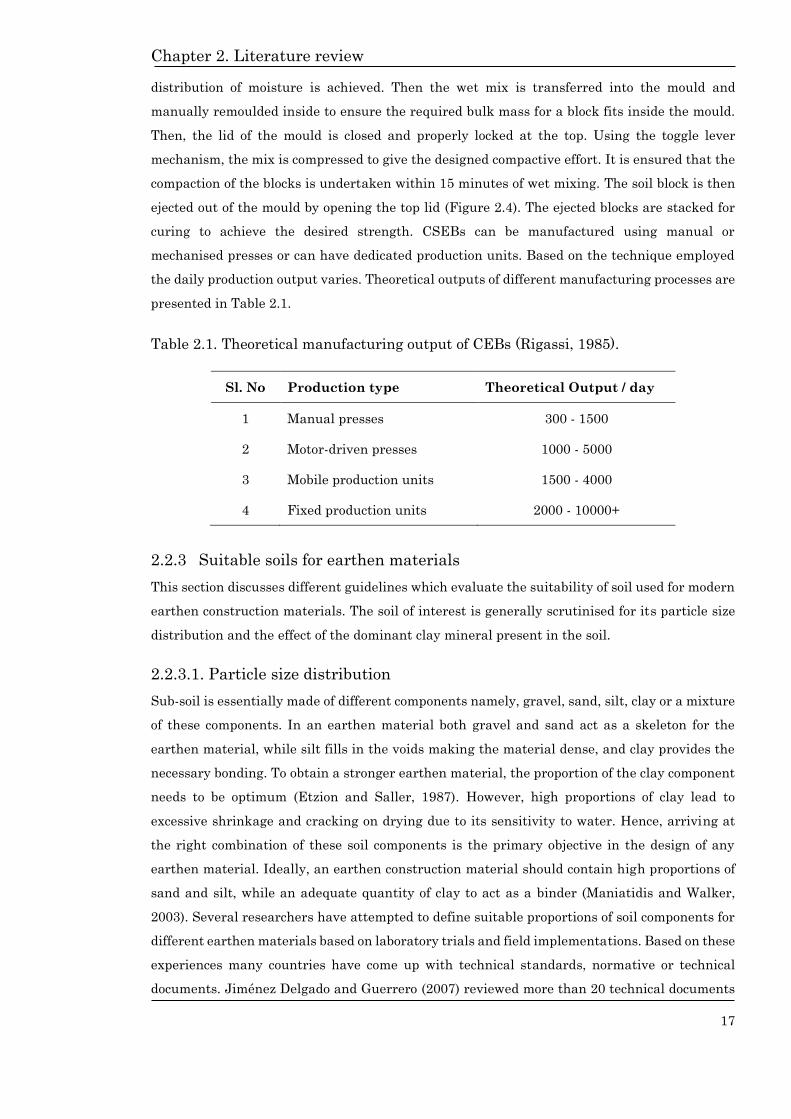
Chapter 2. Literature review
17
distribution of moisture is achieved. Then the wet mix is transferred into the mould and
manually remoulded inside to ensure the required bulk mass for a block fits inside the mould.
Then, the lid of the mould is closed and properly locked at the top. Using the toggle lever
mechanism, the mix is compressed to give the designed compactive effort. It is ensured that the
compaction of the blocks is undertaken within 15 minutes of wet mixing. The soil block is then
ejected out of the mould by opening the top lid (Figure 2.4). The ejected blocks are stacked for
curing to achieve the desired strength. CSEBs can be manufactured using manual or
mechanised presses or can have dedicated production units. Based on the technique employed
the daily production output varies. Theoretical outputs of different manufacturing processes are
presented in Table 2.1.
Table 2.1. Theoretical manufacturing output of CEBs (Rigassi, 1985).
Sl. No Production type Theoretical Output / day
1 Manual presses 300 - 1500
2 Motor-driven presses 1000 - 5000
3 Mobile production units 1500 - 4000
4 Fixed production units 2000 - 10000+
2.2.3 Suitable soils for earthen materials
This section discusses different guidelines which evaluate the suitability of soil used for modern
earthen construction materials. The soil of interest is generally scrutinised for its particle size
distribution and the effect of the dominant clay mineral present in the soil.
2.2.3.1. Particle size distribution
Sub-soil is essentially made of different components namely, gravel, sand, silt, clay or a mixture
of these components. In an earthen material both gravel and sand act as a skeleton for the
earthen material, while silt fills in the voids making the material dense, and clay provides the
necessary bonding. To obtain a stronger earthen material, the proportion of the clay component
needs to be optimum (Etzion and Saller, 1987). However, high proportions of clay lead to
excessive shrinkage and cracking on drying due to its sensitivity to water. Hence, arriving at
the right combination of these soil components is the primary objective in the design of any
earthen material. Ideally, an earthen construction material should contain high proportions of
sand and silt, while an adequate quantity of clay to act as a binder (Maniatidis and Walker,
2003). Several researchers have attempted to define suitable proportions of soil components for
different earthen materials based on laboratory trials and field implementations. Based on these
experiences many countries have come up with technical standards, normative or technical
documents. Jiménez Delgado and Guerrero (2007) reviewed more than 20 technical documents

Chapter 2. Literature review
18
concerning soil suitability for unstabilised earthen materials. The documents included technical
standards and normative documents of different countries, and technical recommendations from
different researchers. This review concluded that clay content should be in a range of 10-22%
for CEBs and 10-15% for rammed earth. Figure 2.5 presents limits of particle size distributions
for both compressed earth blocks and rammed earth as recommended by various standards
(MOPT, 1992; Houben and Guillaud, 1994; CRATerre-EAG: Rigassi, 1995; CRATerre-EAG.,
1998; AFNOR, 2001). Table 2.2 tabulates the recommended soil proportions by different
researchers. Though there are anomalies between these recommended values, the most
recommended soil proportion is one containing a high sand content at about 70% and a fine
fraction (silt and clay) of about 30% (Maniatidis and Walker, 2003).
In the case of stabilised earthen construction, the recommended soil proportions vary
slightly due to the addition of the stabiliser. In modern earthen construction, cement is the most
popular amongst a variety of stabilisers used. Due to the better stabilising effect of cement with
sand grains, cement stabilised earthen materials tend to have higher sand and gravel and lower
fine fractions (Maniatidis and Walker, 2003). Table 2.3 presents recommended soil proportions
for cement stabilised rammed earth and compressed earth blocks.
Figure 2.5. Recommended particle size distribution for rammed earth and compressed
earth blocks
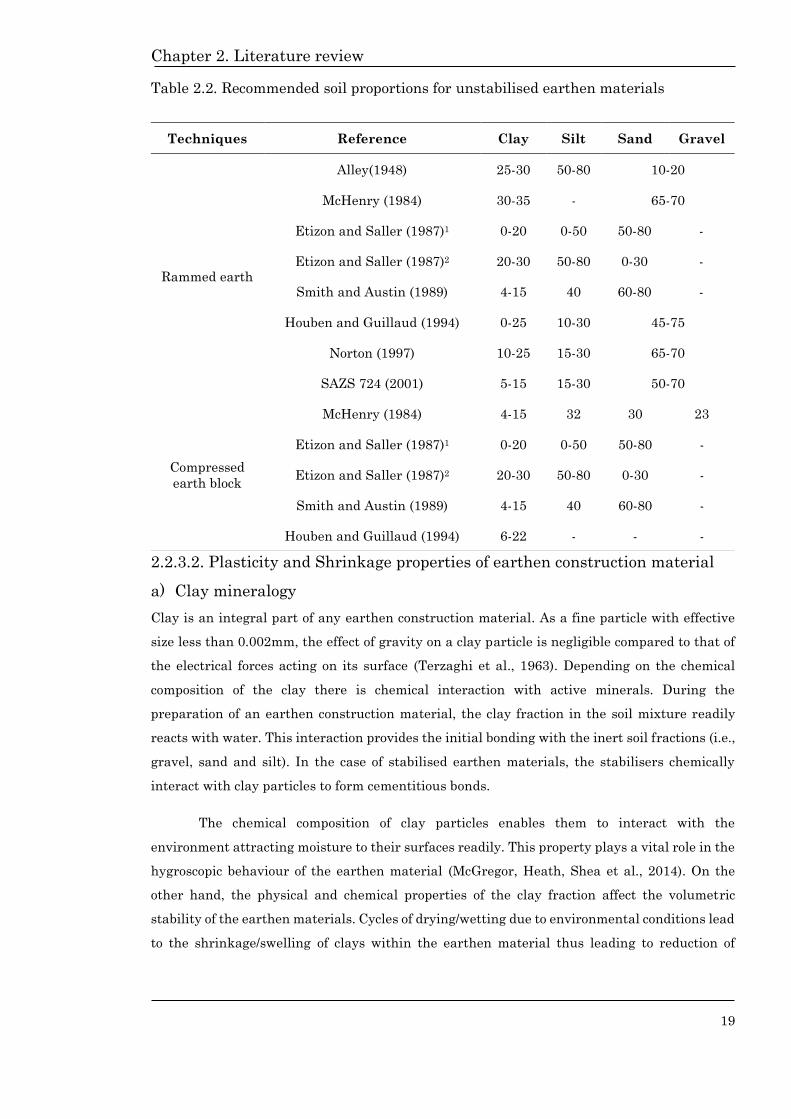
Chapter 2. Literature review
19
Table 2.2. Recommended soil proportions for unstabilised earthen materials
2.2.3.2. Plasticity and Shrinkage properties of earthen construction material
a) Clay mineralogy
Clay is an integral part of any earthen construction material. As a fine particle with effective
size less than 0.002mm, the effect of gravity on a clay particle is negligible compared to that of
the electrical forces acting on its surface (Terzaghi et al., 1963). Depending on the chemical
composition of the clay there is chemical interaction with active minerals. During the
preparation of an earthen construction material, the clay fraction in the soil mixture readily
reacts with water. This interaction provides the initial bonding with the inert soil fractions (i.e.,
gravel, sand and silt). In the case of stabilised earthen materials, the stabilisers chemically
interact with clay particles to form cementitious bonds.
The chemical composition of clay particles enables them to interact with the
environment attracting moisture to their surfaces readily. This property plays a vital role in the
hygroscopic behaviour of the earthen material (McGregor, Heath, Shea et al., 2014). On the
other hand, the physical and chemical properties of the clay fraction affect the volumetric
stability of the earthen materials. Cycles of drying/wetting due to environmental conditions lead
to the shrinkage/swelling of clays within the earthen material thus leading to reduction of
Techniques Reference Clay Silt Sand Gravel
Rammed earth
Alley(1948) 25-30 50-80 10-20
McHenry (1984) 30-35 - 65-70
Etizon and Saller (1987)1 0-20 0-50 50-80 -
Etizon and Saller (1987)2 20-30 50-80 0-30 -
Smith and Austin (1989) 4-15 40 60-80 -
Houben and Guillaud (1994) 0-25 10-30 45-75
Norton (1997) 10-25 15-30 65-70
SAZS 724 (2001) 5-15 15-30 50-70
Compressed
earth block
McHenry (1984) 4-15 32 30 23
Etizon and Saller (1987)1 0-20 0-50 50-80 -
Etizon and Saller (1987)2 20-30 50-80 0-30 -
Smith and Austin (1989) 4-15 40 60-80 -
Houben and Guillaud (1994) 6-22 - - -

Chapter 2. Literature review
20
strength and stiffness (Fabbri et al., 2018). The shrinkage/swelling of the earthen materials is
directly related to the chemical composition of the clay fraction.
Table 2.3. Recommended soil proportions for cement stabilised earthen materials
Clay minerals are crystalline hydrous alumino-silicates having a lattice structure in
which the atoms are arranged in the form of layers. The arrangement of these layers and the
chemical composition of these layers determine the type of clay mineral (Terzaghi et al., 1963).
The basic units of a clay mineral are silica tetrahedra and alumina octahedra. Different
arrangements of these basic units produce different clay minerals. Kaolinite, Illite and
Montmorillonite are the most commonly occurring clay minerals in soils. A unit of kaolinite
consists of a single layer silica tetrahedron layer and a single layer of alumina octahedron. Illite
has 2:1 sandwich of a tetrahedron– octahedron–tetrahedron layers, with poorly hydrated
potassium cations in between. A unit of montmorillonite is similar to illite; however, calcium
and sodium ions are situated at the exterior of the sheets. Amongst these three clay minerals,
kaolinite has the least affinity to water and is less susceptible to volume changes, while
Techniques Reference Clay Silt Sand Gravel
Rammed earth
Verma and Mehra(1950) - - >35 -
United Nations (1964) 20-55 - 45-80
Gooding (1993) 10-25 15-25 45-90 -
Montgomery (1998) 15-25 10-30 40-75 -
Standards Australia (2002) 25 15 45 -
Walker et al (2005) 5-20 10-30 45-80 -
Compressed
earth block
Fitzmaurice (1958) 5-20 - 20 Minimum
United Nations (1964) 10-25 - - -
Spence(1975) <35 - -
VITA(1975) 5-30 33 -
Norton (1997) 10-25 - - -
Olivier and Mesbah (1987) 20 - 70 -
Reddy and Jagadish (1995) - - 70 5 -
Walker (1995) 20-35 - 70-85 -
Walker and Stace(1997) 15-30 - - -
Reddy et al (2007) 14-16 - - -
Reddy and Latha (2014) 10-14 - - -

Chapter 2. Literature review
21
montmorillonite has the highest affinity to water and is most susceptible to volume changes.
Hence, an ideal soil for making earthen material usually contains a clay fraction high in
kaolinite, and the least desirable will contain montmorillonite (Etzion and Saller, 1987). A
natural soil may consist of all these clay minerals, but the predominant clay mineral controls
the clay behaviour. To understand the effect of the predominant clay mineral and to assess the
suitability of the soil, plasticity and shrinkage properties of the soil are determined.
b) Plasticity properties of earthen construction material
When a soil slurry consisting sufficient clay portion starts drying, it passes from the liquid
state through a plastic state and finally into a solid state (Terzaghi et al., 1963). The transition
of the soil from one state to another occurs at critical values of water content. In geotechnical
engineering, water content of the soil is defined as the ratio of mass of water to the mass of soil
solids in a given mass of soil. The water content at which the transition of the soil takes place
from a plastic state to a liquid state is the liquid limit, while the minimum water content
required to make the soil plastic is the plastic limit. These limits are commonly referred to as
Atterberg limits. Between these two limits, the soil behaves as a plastic material, i.e. it deforms
continuously in ductile fashion. This range of water content between liquid and plastic limits is
referred to as the plasticity index and is dependent on the clay minerals present in the soil. To
determine the soil plasticity, the numerical values of plasticity index are plotted against the
liquid limit on a plasticity chart which categorises the soil into different categories of plasticity,
a standard practice in the classification of soils in geotechnical engineering (BS 1377-2, 1990).
In their review, Jiménez Delgado and Guerrero (2007) noted that very few recommendations
were available in the literature in regards to soil plasticity. Figure 2.6 presents the
recommended range of soil plasticity for unstabilised rammed earth and compressed earth
blocks (Houben and Guillaud, 1994; CRATerre-EAG., 1998; AFNOR, 2001).
Figure 2.6. Recommended soil plasticity range for rammed earth and compressed earth blocks

Chapter 2. Literature review
22
For cement stabilised earthen materials, the recommended soil plasticity properties vary due to
the addition of the stabiliser. The average recommended liquid limit of the soil used for cement
stabilised earthen construction materials is 30-40%, while the plasticity index is 15-20%.
Recommended plasticity properties of cement stabilised earthen materials are tabulated in
Table 2.4.
Table 2.4. Recommended plasticity properties for cement stabilised earthen materials
c) Shrinkage properties of earthen material
Unlike particle size distribution and plasticity properties, studies on classifying soils based on
shrinkage properties for earthen construction are limited. Soils having clay minerals which
undergo excessive shrinkage/swelling lead to cracks and should be avoided in earthen
construction (NZS 4298, 1998). Cracks are a concern to an earthen material in terms of
durability and more particularly for rammed earth considering its monolithic nature. While
early studies attempted to understand the shrinkage characteristics of the manufactured
earthen materials (Walker, 1995), subsequent studies have tended to categorise soils based on
the shrinkage properties (Walker et al., 2005). Burroughs (2008, 2010) undertook a detailed
study in classifying suitable soils for rammed earth construction based on soil gradation,
plasticity and shrinkage properties. Figure 2.7 illustrates the steps in determining soil
suitability for rammed earth construction based on this study. It can be observed from the figure
that, based on the linear shrinkage and plasticity index values of the soil, the probability of
constructing rammed earth walls that meet or exceed a compressive strength criterion of 2 MPa
can be evaluated. This would eliminate the necessity of determining unconfined compressive
strength of the soil in order to evaluate its suitability in preparing earthen construction
material. Further, Burroughs (2010) categorised favourable soils into four categories and
Techniques Reference Liquid limit (%) Plasticity
Index (%)
Rammed earth
Verma and Mehra(1950) <25 8.5-10.5
IS 2110 (1980) <27 8.5-10.5
Houben and Guillaud (1994) 25-50 10-25
Walker (2002) 35-45 10-30
Walker et al (2005) <45 2-30
Compressed earth
block
Fitzmaurice (1958) <40 2.5-22
Spence(1975) - <20
Walker (1995) - 5-15

Chapter 2. Literature review
23
recommended the required stabiliser content needed to achieve the compressive strength
criterion of 2 MPa. Research findings from these studies suggests both plasticity and shrinkage
properties of the soil would be sufficient not only to categorise the suitability of soil for preparing
earthen construction materials, but also arrive at the required stabiliser content for
stabilisation.
Figure 2.7. Illustration as presented by Burroughs (2008) to determine the suitability of soils
for rammed earth construction based on particle size gradation, plasticity and shrinkage
properties
2.2.4 Desired engineering properties of earthen material
This section discusses the different desired engineering properties of earthen construction
material namely strength characteristics, durability and hygroscopic properties, and
recyclability potential.

Chapter 2. Literature review
24
2.2.4.1. Strength characteristics of earthen material
Strength is the most common parameter used to assess the performance of earthen construction
material. Similar to concrete and masonry units, evaluation of earthen materials is mostly done
through the determination of compressive strength (Walker, 1997; Jean Claude Morel et al.,
2007; Aubert et al., 2016). Compressive strength is the most commonly used test method
primarily due to the relatively simple procedures needed to obtain values. It also provides
valuable insights in forecasting the durability performance of the material (Reddy and Jagadish,
1995). Along with compressive strength, tensile, flexural or shear strengths are also sometimes
used to evaluate the suitability of earthen construction materials.
Factors like density, placement water content, compaction and stabiliser content define
the strength characteristics of an earthen material. Many studies have attempted to understand
the influence of these factors (Houben and Guillaud, 1994; Walker, 1995; Jean Claude Morel et
al., 2007; Kouakou and Morel, 2009; Reddy and Kumar, 2011a, 2011b). Based on twenty years
of consistent test data, Houben and Guillaud (1994) reported a strong relationship between
compressive strength and density of compressed earth blocks. Walker (1995) studied the
strength characteristics of cement stabilised earth blocks prepared with eleven modified soils
having a broad spectrum of plasticity. Soil-cement blocks treated with three different cement-
soil ratios were prepared for each modified soil and each were tested for saturated compressive
strength. For a given combination with a sample size of ten blocks, the saturated compressive
strength showed an increasing trend with increasing block density. Morel et al., (2007) showed
that the compressive strength of unstabilised and cement stabilised soils had similar increasing
trends with density. International standards such as IS 1725 (2013) recommend manufacturing
compressed earth blocks under controlled density signifying the prominent relation between
density and strength.
Reddy and Kumar (2011a, 2011b) undertook an extensive study to understand the effect
of compaction characteristics, placement water content and stabiliser content on the strength
characteristics of cement stabilised rammed earth. Five soils of varying soil gradation and three
stabiliser contents (5%, 8% and 12%) were chosen for this study. Compaction characteristics (i.e.
maximum dry density (MDD) and optimum water content (OWC)) for the five soils and all
cement treated combinations were determined. To establish a relation between dry density,
placement water content and compressive strength, cylindrical specimens of 76mm height and
38mm diameter with different water contents were prepared. It is interesting to note that in
this study compressive strength not only showed a strong relation to the density of the material
but also to the placement water content (Figure 2.8).

Chapter 2. Literature review
25
Figure 2.8 Relationship of wet compressive strength with (a) dry density and (b) placement
moisture content (Reddy and Kumar, 2011a)
Also, in this study, cement stabilised rammed earth prisms (150mm x 150mm x 300mm)
were manufactured for a particular soil for different densities and stabiliser contents (5%, 8%
and 12%) and different mechanical properties were determined. It was noted that mechanical
behaviour was strongly related to the dry density of the earthen material and stabiliser content.
(Figure 2.9). The results from these studies clearly indicate that the strength characteristics of
earthen materials are in direct relation to density, stabiliser content and placement conditions.
Figure 2.9 Relationship between mechanical properties of earthen material with dry density
and stabiliser content (Reddy and Kumar, 2011b)
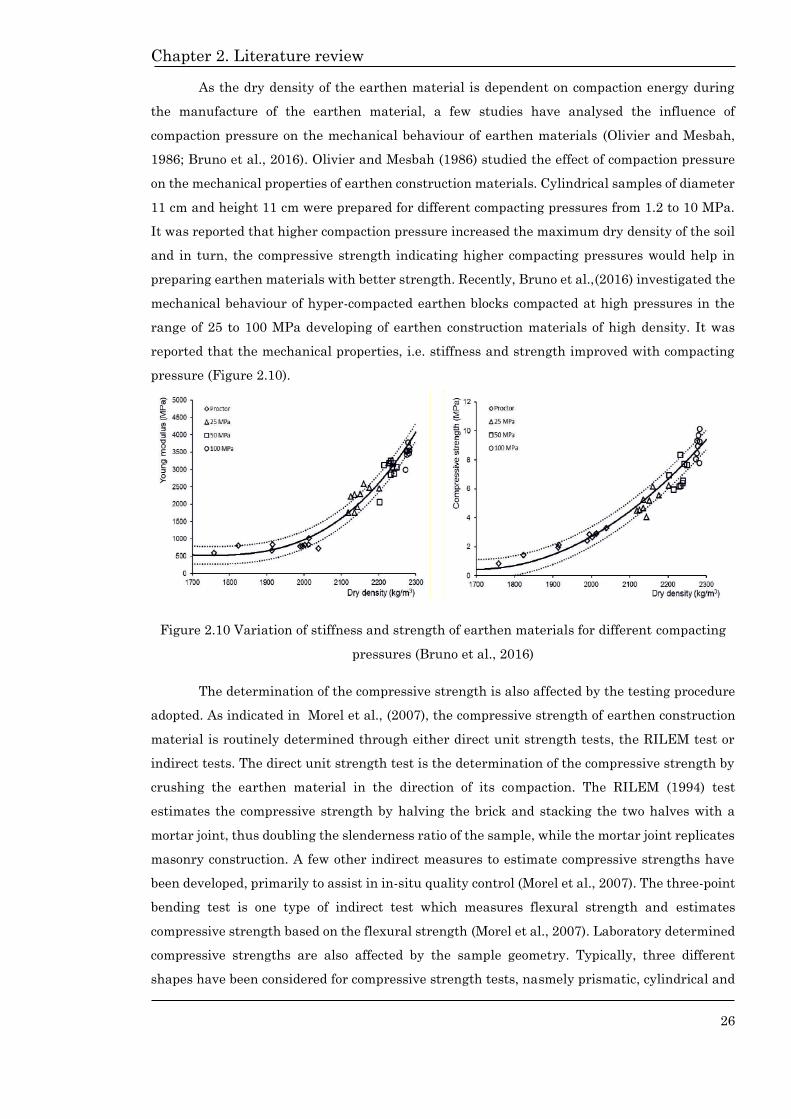
Chapter 2. Literature review
26
As the dry density of the earthen material is dependent on compaction energy during
the manufacture of the earthen material, a few studies have analysed the influence of
compaction pressure on the mechanical behaviour of earthen materials (Olivier and Mesbah,
1986; Bruno et al., 2016). Olivier and Mesbah (1986) studied the effect of compaction pressure
on the mechanical properties of earthen construction materials. Cylindrical samples of diameter
11 cm and height 11 cm were prepared for different compacting pressures from 1.2 to 10 MPa.
It was reported that higher compaction pressure increased the maximum dry density of the soil
and in turn, the compressive strength indicating higher compacting pressures would help in
preparing earthen materials with better strength. Recently, Bruno et al.,(2016) investigated the
mechanical behaviour of hyper-compacted earthen blocks compacted at high pressures in the
range of 25 to 100 MPa developing of earthen construction materials of high density. It was
reported that the mechanical properties, i.e. stiffness and strength improved with compacting
pressure (Figure 2.10).
Figure 2.10 Variation of stiffness and strength of earthen materials for different compacting
pressures (Bruno et al., 2016)
The determination of the compressive strength is also affected by the testing procedure
adopted. As indicated in Morel et al., (2007), the compressive strength of earthen construction
material is routinely determined through either direct unit strength tests, the RILEM test or
indirect tests. The direct unit strength test is the determination of the compressive strength by
crushing the earthen material in the direction of its compaction. The RILEM (1994) test
estimates the compressive strength by halving the brick and stacking the two halves with a
mortar joint, thus doubling the slenderness ratio of the sample, while the mortar joint replicates
masonry construction. A few other indirect measures to estimate compressive strengths have
been developed, primarily to assist in in-situ quality control (Morel et al., 2007). The three-point
bending test is one type of indirect test which measures flexural strength and estimates
compressive strength based on the flexural strength (Morel et al., 2007). Laboratory determined
compressive strengths are also affected by the sample geometry. Typically, three different
shapes have been considered for compressive strength tests, nasmely prismatic, cylindrical and

Chapter 2. Literature review
27
cubical samples. In addition strengths for prismatic and cylindrical samples are affected by the
specimen aspect ratio (Walker, 1997; Morel et al., 2007; Aubert et al., 2016). From the above
discussions, it can be concluded that the estimation of compressive strength is affected by
various physical properties of the earthen material and the test procedure adopted.
Table 2.5. Design and characteristic compressive strength for compressed earth blocks
as per different national regulations
Table 2.6. Design and characteristic compressive strength for rammed earth as per
different national regulations
During actual earthen construction, the workmanship affects the physical factors which
control the strength (Schroeder, 2016). In order to reduce the effects of workmanship and
maintain quality, international standards specify either design or characteristic strengths of
earthen material. Design or permissible strength is the factored strength arrived through
Country Reference Compressive strength (MPa)
Comments Design Characteristic
Germany DIN 18945 (2013) - 2.5-7.5 For bricks Class
1-7
India IS 1725 (2013) - 3.5 Cement stabilised
New
Zealand
NZS 4297 (1998)
NZS 4298 (1998) 0.5 >1.6
For both
unstabilised and
stabilised units
Country Reference Compressive strength (MPa) Stabilisation
condition Design Characteristic
Australia
CSIRO(1987) 0.7 - Unstabilised
EBAA(2004) 1.0 - Cement stabilised
Germany Lehmbau Regeln (2009) 0.3-0.5 -
India IS 2110 (1980) - 1.4 Cement stabilised
Spain MOPT (1992) 0.2 (dry)
0.1(wet) 0.6-1.8 Cement stabilised
Switzerland SIA (1994) 0.3-0.5 2-4
For both
unstabilised and
stabilised units
New
Zealand
NZS 4297 (1998)
NZS 4298 (1998) 0.5 >1.6
For both
unstabilised and
stabilised units
USA CID-GCB-NMBC-
14.7.4(2006)
- <2.07
>1.725

Chapter 2. Literature review
28
appropriate strength reduction considering the likely worst-case scenarios that may affect the
earthen material. The characteristic compressive strength is the strength obtained from
material testing. The recommended design and characteristic compressive strengths vary
according to the standard of practice followed. Table 2.5 and 2.6 tabulates these recommended
strengths for compressed earth blocks and rammed earth as per different international
standards respectively.
2.2.4.2. Durability characteristics of earthen material
Ability to withstand environmental forces without disrupting the functional requirement of the
structure is the durability performance of an earthen structure. Parts of the Great Wall of China,
the Horyuji Temple in Japan and traditional rammed earth houses in France are time tested
examples which display satisfactory durability performance (Bui et al., 2009). The durability
performance of an earthen material is generally assessed through its ability to resist erosion
against moisture ingress. Erosion would lead to the breakdown of aggregated soil particles
(unstabilised or stabilised) leading to the degradation of the material (Beckett and Ciancio,
2016). It can be conjectured that the durability of traditional unstabilised earth structures was
ensured through appropriate building design (suitable roof or basement avoiding capillary rise)
which has enabled the longevity of these structures (Bui et al., 2009). Though these structures
are time tested examples of earthen structures, traditional earthen construction materials fail
to the requirement of modern-day durability standards. In order to comply with these durability
requirements, modern earthen construction materials rely on chemical stabilisation. Several
durability tests emulating rainfall induced erosion and capillary rise deterioration have been
proposed to assess earthen materials (Heathcote, 1995; Morel et al., 2012). Drip tests, wire brush
tests, and spray tests simulate erosion, while immersion, suction and contact tests assess the
earthen material for capillary rise deterioration ( Morel et al., 2012).
In the literature, durability studies mainly deal with the performances of
stabilised earthen materials. Walker (1995) investigated the durability characteristics of cement
stabilised earth blocks prepared with soils having different plasticity properties, as discussed
above in Section 2.2.3.2. Durability tests were conducted as per ASTM D559 (1989), and it was
noted that soils with plasticity index below 15-20 performed adequately, while a higher cement
content of 10% was needed for soils with a plasticity index above 25. Guettala et al., (2006)
investigated the performance of stabilised compressed blocks (with cement and/or lime) both
under laboratory confined testing and environmental exposure. It was noted that after four
years, exposed walls of the test materials showed less sign of deterioration. Bui et al., (2009)
investigated the durability characteristics of rammed earth walls which were exposed to natural
weathering for 20 years. It was reported that the mean erosion depth was only 2 mm (0.5% wall
thickness) for lime stabilised rammed earth walls, while it was 6.4 mm (1.6 % wall thickness)
for unstabilised rammed earth walls. On extrapolation, the lifespan of these unstabilised

Chapter 2. Literature review
29
rammed earth walls was then determined to be about 60 years (Figure 2.11). Beckett and
Ciancio (2016) obtained core samples from 32-year-old cement stabilised rammed earth (CSRE)
walls and compared strength and durability properties with 28-day old rammed earth cores. It
was noted that there was a significant loss of compressive strength in aged samples as compared
to the freshly prepared samples. Furthermore, it was concluded that the rate of erosion was
about 0.1 to 0.2 mm/year for CSRE when exposed to severe climatic conditions.
Figure 2.11 Extrapolation for unstabilised rammed earth wall (Bui et al., 2009)
Table 2.7. Recommended durability tests in practice in different countries
Note: # CEBs, * RE, $ both CEB & RE and Soil-cement mixtures
Without the addition of cement as stabiliser, earthen construction materials would fail
to pass some of the standard durability tests, and several researchers opine that these tests are
too severe and unrealistic (Heathcote, 1995; Ogunye and Boussabaine, 2002; Guettala et al.,
2006). Recently, Bruno et al., (2017) investigated the effect of alternative stabilisers on the
Reference Wire
brush Spray Drip Immersion Contact Suction
Brazil# NBR 13354(1996)
Indian# IS 1725 (2013)
Germany# DIN 18945(2013)
New
Zealand$ NZS 4298 (1998)
Spain# UNE 41410(2008)
Sri Lanka# SLS 1382-3(2009)
USA ASTM D559
(1989)
Zimbabwe* SAZ 724 (2001)

Chapter 2. Literature review
30
mechanical and durability properties of hyper-compacted earthen materials. The study
employed immersion, contact and suction tests as prescribed by DIN 18945 (2013). The results
indicated inclusion of alternative stabilisers improved durability deeming the material to be
classed better than those of unstabilised material prepared using standard compaction. Many
recommended durability tests are primarily aimed to assess cement stabilised earthen
materials; however, use of these tests to assess earthen materials which are stabilised using
alternative stabilisers may be inconclusive. Hence, based on the stabiliser chosen, and the
proposed use of the material, an appropriate test procedure needs to be adopted. Table 2.7
presents preferred durability tests in practice in different countries.
2.2.4.3. Hygroscopic characteristics of earthen material
Hygroscopic properties of a building material determine the indoor air quality and humidity
levels within a building. Padfield (1998) recognised that unfired clay masonry is one building
material that has high potential to self-regulate indoor humidity levels. The experimental
measurement of the hygroscopic behaviour of a building material is termed as the Moisture
Buffering Value (MBV) or hygric inertia value and was originally proposed in the NORDTEST
project (Rode, 2005). MBV is a single parameter which can be used to compare humidity
buffering potential between building materials. The practical definition of MBVpractical as
presented by Rode (2005):
“The practical Moisture Buffering Value MBV indicates the amount of water that is transported
in or out of a material per open surface area, during a certain period of time, when it is subjected
to variations in relative humidity of the surrounding air. When the moisture exchange during the
period is reported per open surface area and per %RH variation, the result is the MBVpractical. The
unit for MBVpractical is kg/m2 %RH”
Experimentally, MBVpractical is determined in an experimental setup where the material
of interest is subjected to cycles of high and low humidity at a constant temperature. As in the
literature, there are different proposed test procedures which differ in the recommended
humidity levels and duration over which these humidity levels are maintained. Though there
are many recognised procedures as prescribed by Fraunhofer IBP, Lund University, DIN
standard, Japanese industrial standard and ISO standard to determine MBVpractical, the most
common method used for earthen materials is the NORDTEST method (McGregor et al., 2016).
In NORDTEST method, each cycle corresponds to an exposure of higher humidity of 75% RH for
8 hours and followed by lower humidity of 33% RH for 16 hours. For the stable cycle, the
MBVpractical for a given material is determined by the following equation (2.1):
𝑀𝐵𝑉𝑝𝑟𝑎𝑐𝑡𝑖𝑐𝑎𝑙 = ∆𝑚
𝑆∆%𝑅𝐻 (2.1)

Chapter 2. Literature review
31
were, m is change in mass of the sample due to change in relative humidity, S is the total
exposure surface area and %RH is difference between the humidity levels. Based on several
round robin experiments, Rode et al., (2005) categorised different building materials having
“negligible” to “excellent” hygroscopic behaviour. This categorization has helped subsequent
research to compare hygroscopic behaviour of different building materials.
Detailed studies in understanding the hygroscopic behaviour of earthen construction
materials are recent developments in earthen construction. Allinson and Hall (2012)
investigated the hygroscopic behaviour of stabilised rammed earth materials with varying soil
gradations. Three soil gradations denoted by 613, 433 and 703 were considered. (The
designations indicate the respective soil proportions (e.g., 613 indicating 60% sand, 10% gravel
and 30% fines by mass). Disc-shaped specimens of 105 mm diameter and 40 mm height were
prepared for each gradation and cured for 28 days. After curing, the hygroscopic behaviour of
these materials was characterised using the NORDTEST method. It was reported that samples
took about five days to reach equilibrium and the stabilised rammed earth specimens had
moisture buffering value in the range of 0.68 - 1.29 g/m2 %RH which was higher than other
conventional building materials such as gypsum boards and fired bricks which had moisture
buffering value of 0.64 and 0.48 g/m2 %RH respectively. Among earthen construction materials,
samples with the highest sand content showed better performance indicating the importance of
soil grading in the hygroscopic behaviour of earthen materials. Using similar testing procedures,
McGregor et al., (2014) investigated the effect of clay mineralogy on the hygroscopic behaviour
of earthen materials. Seven combinations of earthen materials with varying clay minerals
namely kaolin, illite and smectite were considered. It was noted that the moisture buffering
values of these earthen materials were in the range of 1.13 and 3.73 g/m2 %RH. It was reported
that the predominant clay mineral greatly influenced the MBV of the materials. Fine and active
clay minerals like montmorillonite significantly contributed to moisture buffering but had
secondary negative effects such as increased swelling and shrinkage. This study brings out the
importance of the clay minerals in their contribution to forming the hygroscopic properties of
earthen construction materials.
McGregor et al.,(2014) undertook a comparative study on the hygroscopic behaviour of
unstabilised and stabilised compressed earth blocks. Different chemical stabilisers (cement,
lime and sodium hydroxide) were used in this study. It was noted that unstabilised blocks had
slightly better performance than the stabilised blocks. Within the stabilised versions, cement
had performed better than lime and sodium hydroxide-stabilised earth blocks. Recently,
Arrigoni et al.,(2017) undertook a study to understand the impact of stabilisation on the
hygroscopic behaviour of rammed earth. Cement was used as a stabiliser in this study. It was
reported that addition of the cement reduced the moisture buffering values of the stabilised
rammed earth to 0.82 g/m2 %RH, while the value for unstabilised rammed earth was 2.05 g/m2

Chapter 2. Literature review
32
%RH. This study clearly indicates that addition of chemical stabiliser compromises the
hygroscopic behaviour of the material. In another study, Oudhof et al., (2015) determined the
moisture buffering value of straw-clay mixture which is a type of earthen material usually
prepared as a mixture of unprocessed earth, straw and water. Based on the Rode et al., (2005)
categorisation, the moisture buffering values of different earthen materials as reported in these
studies and others is presented in Figure 2.12.
Figure 2.12 Moisture buffering values of different earthen materials as per Rode et al., (2005)
categorisation.
2.2.4.4. Recyclability potential of earthen material
From the Figure 2.13, it can be observed that recycling is the last step in completing the life
cycle of earthen material. Modern earthen construction materials which were primarily
developed as a low-cost walling unit have also got the perception that these materials can be
recycled (Treloar et al., 2001). However, unlike unstabilised earthen materials which need less
energy to recycle, modern earthen materials which rely on chemical stabilisation for good
durability hinders the recycling process (Gallipoli et al., 2017). Cement stabilised earthen
materials need high energy intensive process to completely recycled which is usually
uneconomically. Hence, usually at the end of their life, stabilised earthen materials are
downcycled through energy-intensive processes or easily dumped in a landfill (Schroeder, 2016).
Disposal leads to accumulation of construction waste which is a significant contributor to overall
global waste. This situation prompts one to explore ways to recycle these materials or to look for
alternative stabilisers which can make the earthen material both durable and recyclable.

Chapter 2. Literature review
33
Figure 2.13 presents a typical life cycle of earthen construction material
2.3 Role of unsaturated soil mechanics in earthen materials
Earthen materials are compacted soil-mixtures which are primarily in an “unsaturated”
condition in their lifetime. Therefore the behaviour of earthen construction materials can be
understood by considering them in terms of unsaturated soil mechanics (Jaquin et al., 2009).
This section presents the basic principles associated with unsaturated soil mechanics and
related research studies in earthen materials.
2.3.1 Phase relationships
Soil is a three-phase material consisting of soil solids, water and air. Soil components such as
gravel, sand, silt and clay constitute the soil solids which form the skeleton of a soil element. Air
and water occupy the void space between the soil particles. A soil element is considered to be
“saturated” if water fills up the voids, and when only air occupies the voids it is considered to be
in “dry” state. In between these two extremities, where both air and water occupy voids the soil
element is considered to be “unsaturated”. A typical illustration of these three states is presented
in Figure 2.14.

Chapter 2. Literature review
34
Figure 2.14 Different states of soil element
Phase relationships describe the soil skeleton and voids within a soil element. A
selection relationship is given below.
1. The void ratio (e), is the ratio of volume of voids present in the soil (Vv), to the volume of
solid particles (Vs):
𝑒 = 𝑉𝑣
𝑉𝑠
(2.2)
2. Porosity (n), is the ratio of volume of voids to the total volume(V), where 𝑉 = 𝑉𝑣 + 𝑉𝑠
𝑛 = 𝑉𝑣
𝑉=
𝑒
1 + 𝑒 (2.3)
3. The degree of saturation (Sr). For a fully saturated soil, the degree of saturation is one, while
for dry soil it is zero. Degree of saturation is expressed as the ratio of volume of water (Vw)
to the volume of voids (Vv):
𝑆𝑟 = 𝑉𝑤
𝑉𝑣
(2.4)
2.3.2 Strength of soils
Strength of the soil is the resistance to mass deformation developed from a combination of
interparticle friction and adhesion and is reduced by presence of pore pressure. The resistance
to deformation is shear strength of the soil unlike compressive or tensile strength of other
engineering materials. The soil strength is measured in terms of two parameters: cohesion and
angle of internal friction. Cohesion is the interparticle attraction, while angle of internal friction
determines resistance to interparticle slip. The strength of the soil in terms of total stresses is
expressed as
Air Water Soil particle
Dry Unsaturated Saturated

Chapter 2. Literature review
35
𝜏 = 𝑐 + 𝜎 tan (2.5)
While in terms of effective stress,
𝜏′ = 𝑐′ + 𝜎′ tan ′ (2.6)
where,
𝜏 and 𝜏′ is shear strength under total and effective stress conditions respectively
𝑐 and 𝑐′ is cohesion under total and effective stress conditions respectively,
and ′ is angle of internal friction under total and effective stress conditions respectively,
𝜎 and 𝜎′ is normal stress under total and effective stress conditions respectively. In effective
stress conditions, 𝜎′ = 𝜎 − 𝜇, where 𝜇 is pore water pressure
2.3.3 Suction in unsaturated soils
Soil suction is defined as the energy required to extract unit volume of pore water, in other
words, it is the potential energy of the pore water in an unsaturated soil (Lu and Likos, 2004).
In other words, suction is the difference between pore air pressure and pore water pressure, i.e.
𝑠 = 𝑢𝑎 − 𝑢𝑤. In terms of stress variables, as soil suction increases as the negative pore pressure
increases, which in turn increases the effective stress of the soil and thus the shear strength.
However, as additional stress parameter which aids in the bonding of particles, suction is
required to be considered as an independent stress variable to characterise unsaturated soil
(Alonso et al., 1991; Gallipoli et al., 2003; Tarantino, 2007). Major components of suction are
matric suction (m) and osmotic suction (o). The sum of these two components is referred to as
total soil suction ( ).
2.3.3.1. Matric suction
Suction arising from the combined effects of capillarity of the pore water in soil and short-range
adsorption of water on the particle surface is termed as Matric suction, m. It is expressed as
follows
𝑚 = 𝐶() + 𝐴 (𝑡) (2.5)
where C is the capillary component described in its simplest form as a function of the water-air
curvature , and A is the adsorptive component which is a function of the film thickness t (Philip,
1977).
The development of menisci and liquid bridges between soil particles due to the surface
tension and interface curvature results in a difference between water and air pressure. This
differential pressure leads to inter-particle forces stabilising the soil particles. This inter-
particle forces contribution to the matric suction can be described by the capillary component
C() (Tuller and Or, 2005; Gens, 2010). In addition to capillarity, soils exhibit adsorption, which

Chapter 2. Literature review
36
leads to hydration envelopes over the particle surfaces. The adsorption of water on soil particles
primarily occurs through electrostatic and van der Waals forces within the regions of the soil-
water interface. The electrostatic forces arise due to the net negative charge on the clay surface,
and the quantum of these forces depends on the clay mineralogy and net surface of area of the
clay. Van der Waals forces arise from the atomic interactions occurring between the surface of
the soil particle and water molecules (Lu and Likos, 2004). In a given soil, quantification of these
two components of matric suction is very difficult and also their effects on mechanical behaviour
of soil cannot be considered to be equivalent (Baker and Frydman, 2009). At a high degree of
saturation, the pore water in the soil matrix exists as a funicular (continuous) regime, and the
capillary component will dominate, however, at relatively lower degrees of saturation, the pore
water exists as a pendular (discontinuous) regime and the adsorptive component of suction will
be prominent (Lu and Likos, 2004).
2.3.3.2. Osmotic suction
Osmotic suction arises due to the dissolved solutes in the pore water. Dissolved solutes may
occur due to the introduction of salts into the pore water, either by externally induced solutes
(e.g. natural leaching process) or due to naturally occurring solutes adsorbed by the soil mineral
surfaces (e.g. exchangeable cations adsorbed by clay) (Lu and Likos, 2004). The introduction of
these salts decreases the chemical potential of pore water resulting in difference of pressure
between pore water and free water. This differential pressure is termed the Osmotic suction, o
(Lu and Likos, 2004).
2.3.3.3. Total suction
Based on the above discussion, it can be understood that the suctions developed in unsaturated
soils are due to combination of matric and osmotic suctions. The algebraic sum of these suctions
is usually termed the Total suction, (Lu and Likos, 2004; Gens, 2010). Total suction can be
written as follows
= 𝑚 + 𝑜 = 𝐶() + 𝐴 (𝑡) + 𝑜 (2.6)
2.3.4 Soil-water retention curve
In unsaturated soil mechanics, soil suction and gravimetric water content are the two most
important state variables. The functional relationship between these two variables is the soil
water characteristic curve (SWCC). The use of the word ‘characteristic’ would suggest that the
soil has a unique relationship between suction and water content, however, in reality, the
relationship between these two variables depends on the hydraulic and stress history of the soil
(Lu and Likos, 2004). Nuth and Laloui (2008) suggested that it is therefore more appropriate to
use the word ‘retention’ rather than ‘characteristic’ to express the relationship between soil
suction and water for a given condition. Since then subsequent research studies now refer to

Chapter 2. Literature review
37
this functional relationship as the soil water retention curve (SWRC). Figure 2.15 presents a
typical soil water retention curve presenting its prominent features.
When subjected to drying, a saturated soil starts to follow a primary drying curve on a
SWRC. The largest pores start to desaturate first, and at this stage, air starts to enter the soil.
This transition stage where air starts to enter the soil is known as the Air Entry Value (AEV).
Beyond this point, the water content tends to reduce sharply as finer pores start to desaturate.
At a value of suction known as the Residual Suction (corresponding to residual water content),
the curve may flatten indicating small changes of water resulting from higher variations of
suction. In this residual zone, the water is primarily held as adsorbed water on clay particles
rather than capillary water (McQueen and Miller, 1974). In order to achieve zero water content,
a suction of 1GPa is required (Fredlund and Xing, 1994)
Figure 2.15 A typical soil water retention curve as presented by Toll et al., (2015)
On wetting the soil which is in the residual zone, the suction will decrease and follows
the primary wetting curve path on the SWRC. At the water entry value, a significant increase in
water content is noticed as many pores start to fill with water (Toll et al., 2015). The wetting
continues until the soil becomes completely saturated; however, the final water content may be
lower than the initial saturated water content. The primary drying and wetting curves present
a hysteretic envelope within which the soil can exist (Toll et al., 2015). Within these primary
curves, a soil may be wetted partway during the drying process; at this stage, the soil may follow
a flatter scanning curve until it reaches the primary wetting curve. Similarly, if wetting is halted
partway, the soil will follow a scanning curve, until the primary curve is reached. Within this
scanning region, the behaviour is thought to be reversible while water retention along the

Chapter 2. Literature review
38
primary curves is irreversible (Tarantino, 2009). The hysteresis effect of drying and wetting the
soil shows that the suction required to dry a wet soil to given water content is not the same as
the suction required to wet a dry soil to achieve the same water content (Nishimura and
Fredlund, 2002; Rojas and Rojas, 2005).
The primary factors which influence the shape of SWRC are soil type and its gradation,
pore size distribution, density and clay mineralogy (H. Yang et al., 2004; Lu and Likos, 2004).
Being inert and having a less specific surface area, the adsorption component of suction for sands
is relatively low. Over the unsaturated water content range, capillarity is the predominant
contributor to the suction component for sands (Lu and Likos, 2004). Compared to clay, the air
entry value for sand is lower, and the pore size distribution controls the overall shape and slope
of the SWRC (Hillel, 1998; H. Yang et al., 2004; Lu and Likos, 2004). Sands having lower
porosities such as uniformly graded or dense sands have steeper slopes, lesser hysteresis, higher
air entry value and residual suction in their SWRCs (H. Yang et al., 2004). With higher specific
surface area and charged surfaces, the adsorption component of the suction dominates in clays.
The air entry value and residual suction of the clays are relatively higher than sand and in
addition, the shape of the SWRC for clays is affected by the clay mineralogy. As seen from Figure
2.16, high plasticity clays such as smectite may sustain extremely high suctions over a wide
range of water contents, while low plasticity clay such as kaolin may adsorb less water in the
high suction regime (Likos, 2000).
Figure 2.16 Effect of clay mineralogy on soil water retention in the high suction regime (Likos,
2000)

Chapter 2. Literature review
39
2.3.5 Role of soil suction in earthen construction materials
Several researchers have tried to understand the behaviour of earthen materials through
unsaturated soil mechanics principles (Jaquin et al., 2009; Nowamooz and Chazallon, 2011;
Beckett and Augarde, 2012; Bui et al., 2014; Al Aqtash and Bandini, 2015; Gerard et al., 2015;
Beckett et al., 2017). A selection of the essential works undertaken on this subject is herein
discussed.
In order to understand the influence of suction on the strength of drying earthen
construction material, a study was undertaken by Jaquin et al.,(2009) in which coarse
aggregate, sand and clay/silt (0.25:0.60:0.15) were blended and sieved through a 14 mm sieve to
prepare a rammed earth mixture. Compaction tests were performed on this rammed earth
mixture to obtain the optimum water content which was nearest to saturation. This water
content (i.e. 12.0%) was used to prepare cylindrical samples of the rammed earth mixture.
Cylindrical samples were compacted in five layers using 15 blows of a 4.5 kg hammer. Dry
densities between 2017 and 2061 Mg/m3 were achieved using the same compactive effort each
time. These cylindrical samples were subjected to air drying, and once a target water content
was achieved, samples were sheared using a triaxial rig. During shearing, a high-capacity
tensiometer was employed for continuous measurement of suction. The results indicate that
there is a clear relationship between initial water content and both suction and strength. Under
constant gravimetric water content, samples with initially low suctions showed an increase in
suction during shearing, whereas samples with high suction showed the opposite indicating the
existence of a unique water content – suction relationship at the critical state (Figure 2.17). The
study further suggests that stiffness of the material is suction dependant.
Figure 2.17 Plot showing the variation of deviator stress and suction for different initial water
contents, Reproduced from Jaquin et al., (2009).
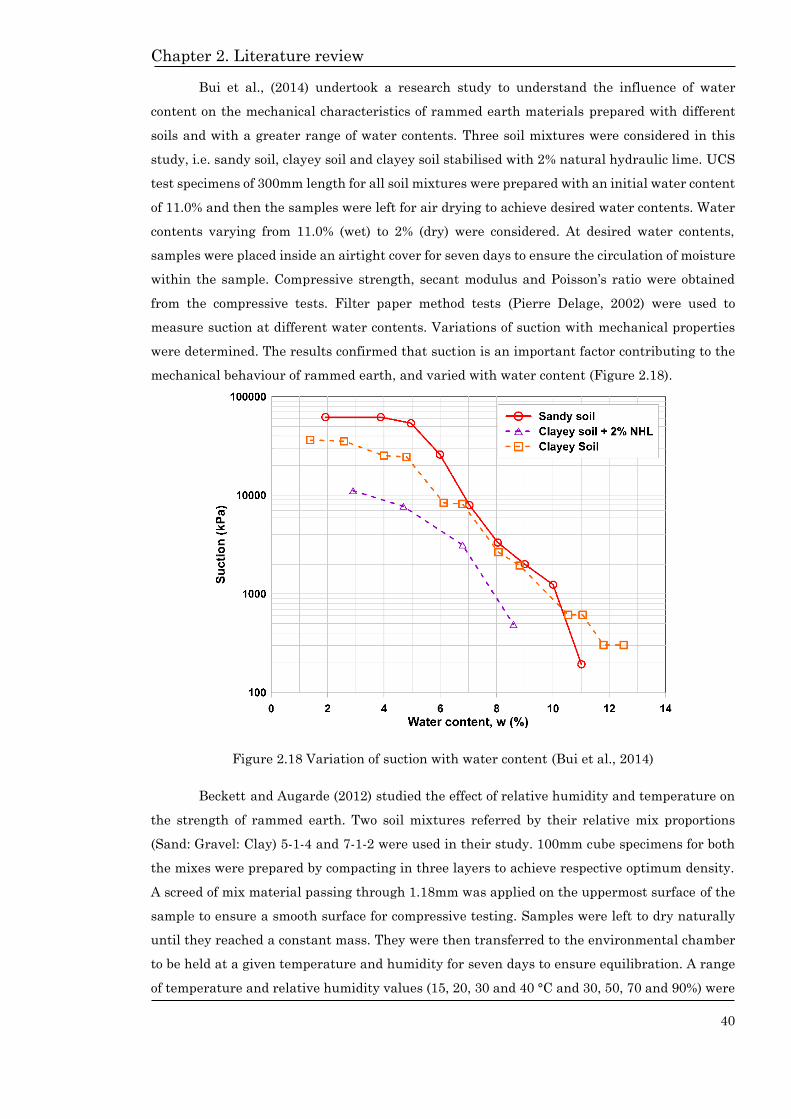
Chapter 2. Literature review
40
Bui et al., (2014) undertook a research study to understand the influence of water
content on the mechanical characteristics of rammed earth materials prepared with different
soils and with a greater range of water contents. Three soil mixtures were considered in this
study, i.e. sandy soil, clayey soil and clayey soil stabilised with 2% natural hydraulic lime. UCS
test specimens of 300mm length for all soil mixtures were prepared with an initial water content
of 11.0% and then the samples were left for air drying to achieve desired water contents. Water
contents varying from 11.0% (wet) to 2% (dry) were considered. At desired water contents,
samples were placed inside an airtight cover for seven days to ensure the circulation of moisture
within the sample. Compressive strength, secant modulus and Poisson’s ratio were obtained
from the compressive tests. Filter paper method tests (Pierre Delage, 2002) were used to
measure suction at different water contents. Variations of suction with mechanical properties
were determined. The results confirmed that suction is an important factor contributing to the
mechanical behaviour of rammed earth, and varied with water content (Figure 2.18).
Figure 2.18 Variation of suction with water content (Bui et al., 2014)
Beckett and Augarde (2012) studied the effect of relative humidity and temperature on
the strength of rammed earth. Two soil mixtures referred by their relative mix proportions
(Sand: Gravel: Clay) 5-1-4 and 7-1-2 were used in their study. 100mm cube specimens for both
the mixes were prepared by compacting in three layers to achieve respective optimum density.
A screed of mix material passing through 1.18mm was applied on the uppermost surface of the
sample to ensure a smooth surface for compressive testing. Samples were left to dry naturally
until they reached a constant mass. They were then transferred to the environmental chamber
to be held at a given temperature and humidity for seven days to ensure equilibration. A range
of temperature and relative humidity values (15, 20, 30 and 40 °C and 30, 50, 70 and 90%) were

Chapter 2. Literature review
41
selected to replicate different climatic conditions. After equilibration, the samples were removed
from the chamber and were tested for unconfined compression. Figure 2.19 shows the UCS
results for both the soil mixes. It was reported that the UCS’s for both the mixes were
significantly affected by humidity and temperature. Results suggested that there was only a
slight variation in wetting and drying suction due to very low water contents. For a given applied
suction, soil mix 5-1-4 had higher water content, and relatively higher adsorbed water contents
than soil mix 7-1-2 due to the presence of a higher clay content. With respect to UCS, at a given
suction 7-1-2 achieved higher strength than 5-1-4 due to the former’s lower relative adsorbed
water content. It is clear from this study that the strength of these unsaturated earthen
construction materials is significantly affected by changes in temperature, relative humidity
and clay content.
Figure 2.19 UCS of 5-1-4 and 7-1-2 mixes against humidity and temperature (Beckett and
Augarde, 2012)
Champiré et al., (2016) investigated the role of clay mineralogy on the mechanical
behaviour of unstabilised earthen materials under different relative humidity levels. For this
purpose, soils denoted as STR and CRA which had varying clay mineralogy were collected from
an existing rammed earth house in South-East of France. The physical properties of these
earthen materials, such as particle size distribution, Atterberg limits, clay activity and
dominant clay minerals of the earthen materials were determined. These earthen materials had
similar soil gradation to each other consisting of 15% clay, 20% silt, 65% sand and similar dry
density, but varying clay activity. Cylindrical samples with a diameter of 64.4mm and length of

Chapter 2. Literature review
42
140mm were prepared. Compressive strengths of these cylinders were determined at a constant
temperature of 24 20C and varying relative humidity levels (25%, 75% and 95%). It was noted
that these materials exhibited different mechanical behaviour under similar ambient
conditions. The sample with higher clay activity (i.e., CRA) was less rigid and less resistant than
the other samples. Differing mechanical behaviour between these earthen materials at similar
ambient conditions can be related to the clay mineralogy which contributes differently to the
adsorption component of suction.
Beckett et al., (2017) predicted rammed earth strength based on extended Mohr-
Coulomb (EMC) framework. Unconfined compressive strength and indirect tensile strength
(ITS) were determined for cylindrical specimens prepared for mixtures used in their previous
work (Beckett and Augarde, 2012). For these strengths at residual suction, failure envelopes
based on an ‘extended’ Mohr-Coulomb criterion were constructed and methods to predict
strengths were derived. Excellent agreement was found between the measured and predicted
strengths of the earthen materials. A simplified experimental procedure for field practitioners
was also recommended for predicting strengths based on the EMC framework. Using this
procedure an existing rammed earth facility predicted strengths of a compacted Californian
sandy loam. Figure 2.20 presents the planar EMC failure envelope for the Californian sandy
loam.
Figure 2.20 Planar EMC failure envelope for California sandy loam used for rammed earth
construction (Beckett et al., 2017)

Chapter 2. Literature review
43
2.4 Bio-stabilisation techniques
In most historical earthen structures, the mechanical properties of the soil were improved
through either mechanical tamping or with the additions of bio-material in the form of egg-
whites or proteins (Plank, 2004; F. Yang et al., 2010). Now industrial stabilisers like cement
have replaced these bio-stabilisers for improved strength and durability. The current state of
practice of using cement and lime for improving engineering properties of earthen materials
have been criticised for a lack of sustainability (Lax, 2010; Maskell et al., 2014). This has
prompted research effort to find suitable alternatives for energy intensive and CO2 producing
stabilisers (Chang et al., 2016). Bio-stabilisation methods used historically may have the
potential to replace cement and provide sustainable soil stabilisation.
2.4.1 Bio-stabilisation of soils
The use of biological process or products to improve soil properties is termed “bio-stabilisation”
of soils. Bio-stabilisation is not a new process known to humanity. The Romans used bio-
stabilisers like proteins as set retarders for gypsum used in building construction (Plank, 2005),
while the Chinese used sticky rice mortar as a construction binder for the Great Wall of China
(F. Yang et al., 2010). Today, bio-stabilisation techniques have been proposed as a potential
alternative to chemical stabilisers and are being actively investigated in different geotechnical
engineering applications.
Based on the requirements, bio-stabilisation methods can be classified broadly under
eight categories (Stabnikov et al., 2015):
1. Bioaggregation of soil: to increase the effective size of the soil particles to reduce soil erosion
and dust emission.
2. Biocrusting: formation of a crust on the soil surface to resist wind and water erosions and to
reduce dust emission and water erosion.
3. Biocoating: formation of a layer on a solid surface so that the colonization or aesthetics, or
corrosion protection of the surface is improved.
4. Bioclogging: filling in the pores of the soil or rock fissures in order to reduce the permeability
of the material.
5. Biocementation: binding of soil particles in order to improve soil strength significantly.
6. Bio desaturation: to produce biogas bubbles in-situ to reduce saturation and liquefaction
potential of soil
7. Bioencapsulation: to increase the strength by encapsulating soil particles like soft clay, loose
sand, quick sand and muck soil
8. Bioremediation: biodegradation of the soil pollutants in contaminated soils.

Chapter 2. Literature review
44
In earthen construction materials, as a potential replacement to chemical stabilisers, the
bio-stabilisation method of interest should be that which binds the soil particles to increase
shear strength, i.e. Biocementation. Within biocementation, microbial-induced calcite
precipitation (MICP) and biopolymer stabilisation techniques have been considered as potential
alternatives to traditional stabilisers (Ivanov and Stabnikov, 2016; Pacheco-Torgal et al., 2016).
MICP employs micro-organisms to precipitate calcium carbonate into the soil voids and to
provide particle bonding (Fujita et al., 2000). While MICP has been found to be applicable to soil
remediation and CO2 sequestration (Renforth et al., 2009), it has several shortcomings with
respect to field implementation for fine-grained soils, transportation, cultivation and possible
toxic residues (Rong et al., 2011; Pacheco-Torgal and Labrincha, 2013; Chang et al., 2016;
Pacheco-Torgal et al., 2016). Other the other hand, biopolymer stabilisation is another
biocementation process which has been used in the recent past for soil stabilisation. Unlike
MICP, biopolymers have a relatively simple application procedure and provide enhanced soil
stabilisation for different soil types (Chang et al., 2016). In addition, there is an excellent
diversity of biopolymers available, and the market share of biopolymers is expected to increase
due to growing interest in using biodegradable building materials (Babu et al., 2010).
2.4.2 Biopolymer soil stabilisation
Biopolymers are naturally occurring polymers synthesised through biological processes. These
biopolymers are polysaccharides composed of a large network of bonded monosaccharide units.
These monosaccharide units maybe the simplest form of carbohydrates, which have carbon
atoms bonded with hydroxyl groups (e.g. glucose, fructose or galactose). When mixed in water,
the hydroxyl groups of each monosaccharide unit in the polysaccharide readily interact with
water to form “hydrogels”. Figure 2.21 presents an example of how the monosaccharide units
link with each other to form a long chain polymer. This long chain of monosaccharide is the
backbone, while the outer hydroxyl groups are cross-links of the biopolymer.
These “hydrogels” can be defined as chemically or physically as cross-linked polymers
having a hydrophilic structure which allows them to absorb water into their three-dimensional
porous structure and swell without dissolving (Brax et al., 2017). Their ability to absorb water
arises from hydrophilic functional groups attached to the polymer backbone, while their
resistance to dissolution comes from the cross-links between network chains (Gerlach and Arndt,
2009). When mixed with soil and water, these hydrogels form a complex structure connecting
soil particles. In the case of granular material, these hydrogels coat themselves to the surface of
soil particles and bind them together to provide the stabilisation effect (Chang, Prasidhi et al.,
2015). While in clays, the stabilisation is primarily achieved through either hydrogen and/or
ionic bonding with clay particles depending on the intrinsic properties of the biopolymers chosen
(Chen et al., 2013; Chang et al., 2015). Figure 2.22 shows a typical interaction of biopolymer
with granular media as presented by Qureshi et al., (2014).

Chapter 2. Literature review
45
Figure 2.21 An example of how the monosaccharide units combine to form a biopolymer
Figure 2.22 typical interaction of biopolymer with granular media as presented by Qureshi et
al., (2014)
2.4.3 Biopolymer stabilisation in geotechnical engineering
In geotechnical engineering applications, biopolymers were initially used to reduce soil
permeability and have consequently found application in seepage barriers. It was reported that
introduction of biopolymers in small quantities ensured reduction of hydraulic conductivity of
the soil by three to four orders of magnitude indicating the pore plugging effect (Bouazza et al.,
2009; Aminpour and O’Kelly, 2015). More recently, researchers have used different biopolymers
Monosaccharide unit
for glucose
Polymer chain with glucose as backbone chain, while CH2OH (alcohol
group) as cross-linked unit of the polymer

Chapter 2. Literature review
46
to improve the engineering properties of particular soils (e.g. sand or clay) and attempted to
understand different aspects of biopolymer stabilisation such as suitable curing conditions, its
suitability for different soil types, and effects on physical, mechanical, hydraulic and durability
properties of the soil (Cabalar and Canakci, 2011; Khatami and O’Kelly, 2013; Chang, Im et al.,
2015; Ayeldeen et al., 2016; Latifi et al., 2016; Qureshi et al., 2017). Biopolymers such as
xanthan gum and guar gum which have not only shown promising stabilising effects (Bouazza
et al., 2009; Cabalar and Canakci, 2011; Chang, Im et al., 2015), but are also have better stability
against pH and temperature variations (Chudzikowski, 1971; Katzbauer, 1998). With these
credentials, guar gum and xanthan gum are chosen as potential biopolymers in this study hence,
the focus of the literature review has been limited to these biopolymers.
2.4.3.1. Guar Gum
Guar gum is powdered endosperm of cluster bean (Cyamopsis tetragonolobus) which belongs to
Leguminosae plant family (Chudzikowski, 1971; Mudgil et al., 2011). The process of extracting
endosperm involves different stages and varies according to the quality and species of the plant.
Detailed information on manufacturing process are reported by Mudgil et al.,(2011) and
Thombare et al., (2016). The extracted endosperm undergoes purification and the efficiency of
purification determines the quality of guar gum (Thombare et al., 2016). Based on the seed
quality, amount of impurities present, viscosity potential and rate of hydration different grades
of guar gum are manufactured which have different industrial applications (Chudzikowski,
1971; Thombare et al., 2016).
Figure 2.23. Typical chemical structure of guar gum.
Chemically, guar gum is a neutrally charged polysaccharide made of galactose and
mannose groups (Figure 2.23). Mannose groups form the backbone of the guar gum, while
galactose groups which are attached to the mannose groups are the side chains of the polymer.
This rich hydroxyl polymer readily reacts with water through hydrogen bonding, significantly
imparting the viscosity and thickens the solution. Apart from being thickener, guar gum

Chapter 2. Literature review
47
dissolves in cold water and has wide pH and thermal stability (Chudzikowski, 1971; Thombare
et al., 2016). With these properties, guar gum has found applications in many industries.
2.4.3.2. Xanthan Gum
Xanthan gum was discovered in 1961 by the research laboratories of the US Department of
Agriculture (Katzbauer, 1998). Xanthan gum is produced from plant-pathogenic bacterium
Xanthomonas campestris. To produce xanthan gum, the bacterium is cultured in a well aerated
and agitated fermenter. The medium consists of carbohydrate source, nitrogen source and
nutrient salts which aid in fermentation process. After fermentation, the bacteria are removed
by heating and xanthan gum is recovered through precipitation. The polymer is then dried,
milled and packed. Factors such as carbohydrate source, fermentation process and heating
temperature define the quality of xanthan gum. Detailed manufacturing process of xanthan gum
is reported by Garcia-Ochoa et al.,(2000). Figure 2.24 illustrates typical chemical structure of
xanthan gum. Chemically, xanthan gum is an anionic polymer whose backbone consisting
repeated pentasaccharide units formed by two glucose units, two mannose units and glucuronic
acid unit. Trisaccharide side chains contain glucuronic acid between two mannose units (Becker
et al., 1998; Katzbauer, 1998; Garcıa-Ochoa et al., 2000). Similar to guar gum, the hydroxyl
groups of the group readily with water which significantly increases viscosity of the solution.
Xanthan gum easily dissolves in cold water and has good stability against pH and temperature
variations (Katzbauer, 1998). Another important property of xanthan gum is that they work in
synergy with plant galactomannans as guar gum to increase viscosity (Garcıa-Ochoa et al.,
2000).
Figure 2.24. Typical chemical structure of xanthan gum.
2.4.3.3. Effect of biopolymer stabilisation on different soil properties
Cabalar and Canakci (2011) investigated the effect of xanthan gum on the strength of
sand using direct shear tests. In their study, loose sand was mixed with xanthan gum solutions
of 1.0, 3.0 and 5.0% by mass of the soil to form a homogeneous paste. This paste was then poured

Chapter 2. Literature review
48
into a mould to cure at room temperature for 7, 26 and 50 days. After these curing periods, the
treated sand was tested in direct shear. It was reported that the samples with higher xanthan
gum solutions of 3.0% and 5.0% had a higher angle of internal friction than those of untreated
samples indicating improvement in soil strength due to the addition of xanthan gum. More
importantly, it was noted that the improvement in strength was noticed within seven days of
curing and the impact of curing time was not significant.
Chen et al., (2013) conducted a feasibility study to understand the stabilisation effect of
guar gum and xanthan gum on mine tailings. The fall cone method was used to determine the
liquid limit and undrained strength of sun-dried mine tailings mixed with xanthan gum and
guar gum solutions. Microstructural imaging was undertaken using environmental scanning
electron microscopy (ESEM). The study found that the addition of biopolymers increased both
the liquid limit and the undrained strength of the treated mine tailings. Being a neutral
polysaccharide, guar gum induced slight aggregation of the mine tailing particles with only
hydrogen bonding. In the case of xanthan gum which is an anionic polysaccharide provided a
higher degree of aggregation due to additional ionic bonding along with hydrogen bonding.
Figure 2.25 presents the ESEM images of xanthan gum and guar gum treated mine tailings as
presented by Chen et al., (2013). From the ESEM scans, it can be observed that guar gum form
smaller soil agglomerations than xanthan gum, at the same time xanthan gum induces higher
void spaces within the soil matrix.
Figure 2.25. ESEM images of mine tailings treated with (a) xanthan gum (b) guar gum (Chen
et al., 2013)

Chapter 2. Literature review
49
Chang et al.,(2015) describes a study of the strengthening effect of xanthan gum on
different soil types namely sand, poorly graded sand, natural lean clay and kaolinitic clay. Soils
were treated with 1% of xanthan gum and tested for compressive strength on 40mm cubes cured
at 2000C for 28 days. It was reported that xanthan gum was more effective in improving the
strength and stiffness of clays and well-graded soils. In order to determine an efficient mixing
method, two methods were adopted: dry mixing the xanthan gum with soil before the addition
of water and wet mixing in which the xanthan gum was premixed in water before its application
to the soil. The compressive strength of the samples of dry mixing was found to be more effective
than wet mixing indicating that the former was an appropriate method for practical applications
(Figure 2.26). Scanning electron microscope (SEM) images were obtained at the end of 28 days
for three of the samples, i.e. sand, clay and red yellow soil (Figure 2.27). It can be observed from
Fig 2.27a, for sand, xanthan gum coated the grain surfaces and increased the interparticle
contact area, while in clays xanthan gum strands directly linked the clay particles and these
links are caused due to hydrogen bonding (Fig 2.27b and 2.27c). To understand the effect of
biopolymer content, the soils were treated with different xanthan gum contents, i.e. 0.5, 1.0 and
1.5 % of dry soil mass and tested for unconfined compressive strength. It was reported that the
strength increased with biopolymer content, however, at 1.5% content, the soil mixture was
found to be less workable due to increased viscosity. These research findings give an insight into
various aspects of bio-stabilisation of soils, i.e. soil composition, mixing techniques, biopolymer
proportions and interactions.
Figure 2.26. Comparison of compressive strength for dry and wet mixing methods (Chang et
al., 2015)

Chapter 2. Literature review
50
Figure 2.27. SEM Images of xanthan gum treated soils (Chang et al., 2015)
Figure 2.28. SEM Images of xanthan gum treated sand for different curing times (a) 1h, (b) 1
week and (c) 3 week (Ayeldeen et al., 2016)

Chapter 2. Literature review
51
Ayeldeen et al (2016) treated sand and silt with biopolymers ( xanthan gum, modified
starch and guar gum) and then studied the effect of these biopolymers on compaction, strength
and permeability characteristics. Biopolymer concentrations of 0.25, 0.5, 1.0 and 2.0 % of dry
soil mass were considered in this study. The addition of biopolymers increased the strength of
the soils with time, while the permeability decreased. It was reported that the optimum water
content increased with increasing biopolymer content for both soils. However, the maximum dry
density of the sand showed a steep increase for biopolymer contents from 0.25% - 1.0%, after
which there was only marginal increase. In the case of silt, the behaviour was different: the
maximum dry density decreased with increase of the biopolymer content. From these findings,
it can be concluded that though the addition of biopolymer has improved strength and
permeability properties of both soils, it had a different effect on compaction characteristics
depending on the soil type. In addition, the study used SEM imaging to understand the effect of
curing on the hydrogels formed. From Figure 2.28, it can be observed that at the early stages of
biopolymer application, the hydrogels formed are in a thick gel state which transforms to a
thinner glassy state with time. It was reported that the change of these hydrogels to glassy state
is the reason for higher compressive strength with ageing.
Latifi et al., (2016) studied the effect of xanthan gum on two fine-grained clays namely,
bentonite and kaolinite. The two soils were treated with 0.5, 1, 1.5, 2 and 2.5% of xanthan gum
and tested for its unconfined compressive strength at 3, 7, 28 and 90 days. Based on these tests,
it was concluded that 1.5% was the optimum stabiliser content for both soils. Direct shear tests
and one-dimensional consolidation tests were performed for both the soils treated with the
optimum stabiliser content at 7, 28 and 90 days. It was reported that there was a significant
increase in cohesion for both soils with curing, while the increase in angle of internal friction
was marginal. It was reported that the significant changes for the treated soils occur within 28
days of curing. Based on one-dimensional consolidation tests, it was concluded that the
compressibility for both soils improved, i.e. specimen compressibility decreased with curing
time. These changes were thought due to the formation of hydrogen bonds between the xanthan
gum and clay particles which led to the formation of large, firm biopolymer-soil matrices (with
flocculated structure) having lesser void space. In order to understand the stabilising effect on
particle size distribution, laser diffraction was performed. Figure 2.29 presents the results of
these tests for both the soils. Based on these results, it was concluded that the soil-biopolymer
interactions lead to particle agglomerations and reduced overall external surface area of the
particles.

Chapter 2. Literature review
52
Figure 2.29. Particle size analysis tests (a) bentonite (b) kaolinite (Latifi et al., 2016)
Qureshi et al., (2017) treated a desert sand with different proportions of xanthan gum,
i.e. 1.0, 2.0, 3.0 and 5.0%, and 10.0% cement of dry soil mass. Durability performance of these
specimens was assessed by conducting slake durability tests. In these durability tests, ten pieces
of each dry specimen weighing about 40-50 g were introduced into a wire mesh drum. Then, this
drum was half-submerged in a water bath and then rotated at 20 revolutions for a minute. The
specimens were then removed from the drum and dried at 105 0C for 2 hours. From the
placement of the dry specimen into the drum to the removal of the sample after required
revolutions and drying it constitutes one slaking cycle. The slake durability index is expressed
as the percentage ratio of the total mass of specimens after two cycles to the original total mass.
After two slaking cycles, it was noted that the slake durability index of the sand treated with
3.0% of xanthan gum was higher than that of the sand treated with 10.0% cement, indicating
better durability performance of xanthan gum treated sand.
Very recently, Chen et al., (2019) investigated the effect of drying on xanthan gum
treated sand. Sand treated with varying concentrations of xanthan gum (0.25-0.50% by mass)
were prepared for different drying conditions. After preparation, the samples were fully
immersed in water to achieve an initial state of 100% saturation. One set of samples were then
dried at a room temperature of 200C, while another set of samples were dried in an oven at 400C.
Drying of samples was done until target water content corresponding to 66%, 33% and 0% was
achieved. At these saturation levels, direct shear tests were then performed under 50, 100, 200
and 300 kPa vertical stresses. It was reported that the oven dried samples showed a gradual
improvement in strength with drying. Samples dried at room temperature showed variability in
its strength, this was because the inner part of the samples remained moist, while the exterior
surface was cemented and crystallised. For both drying conditions, the strengthening effect of
xanthan was at a maximum when samples were completely dry.

Chapter 2. Literature review
53
2.4.3.4. Summary of biopolymer soil stabilisation
Based on the literature study, important aspects of biopolymer soil stabilisation are summarised
herein.
1. The stabilisation mechanism of biopolymers varies depending on the soil type. In the case of
sand, hydrogels coat the soil particles and increase the interparticle contact area, while in
clays, biopolymers establish chemical bonds to provide stabilising effect (Chang et al., 2015).
The intrinsic properties of biopolymer determine whether the nature of chemical bonding,
i.e. hydrogen bonding and with or without ionic bonding (Chen et al., 2013).
2. The time taken to achieve significant strength for biopolymer treated soils seems to be
relatively short. For sand, an improvement in strength was seen within 7 days of curing
(Cabalar and Canakci, 2011), while for clays, significant improvements occur well within 28
days of curing (Latifi et al., 2016)
3. On drying, the nature of hydrogels tends to change from a thick rubbery state to a thin
glassy state. This change leads to a higher compressive strength of soil as noted by Ayeldeen
et al., (2016). Further, drying affects the time taken to achieve complete strength gain (C.
Chen et al., 2019)
4. Chang et al., (2015) noted that, mixing soil and biopolymer in dry condition yielded higher
compressive strength than wet mixed samples. This is an essential guideline for using
biopolymers in practical applications.
5. Biopolymer concentrations in the range of 1.0 – 3.0% appear to be sufficient to achieve
significant soil stabilisation to improve both strength and durability (Cabalar and Canakci,
2011; Chang, Im et al., 2015; Qureshi et al., 2017). Higher concentrations of biopolymer
affect soil workability (Chang, Im et al., 2015).
2.4.4 Biopolymer soil stabilisation for earthen construction materials
Though bio-stabilisation techniques have been used historically for improving the strength and
durability performance of earthen materials, the use of biopolymers for stabilisation in modern
earthen construction is a novel idea. Only in the recent past have researchers attempted to use
biopolymers as a stabiliser for earthen materials (Aguilar et al., 2016; Nakamatsu et al., 2017).
Aguilar et al., (2016) attempted to stabilise a low plasticity clay used for manufacturing adobe
with chitosan which is a synthetically substituted cellulose (varying concentration up to 3.0%).
The performance of the biopolymer was evaluated both as a stabiliser and as a coating material.
The mechanical behaviour of biopolymer treated samples was assessed through compressive,
flexural and bending tests. Resistance against water-induced degradation was assessed via
erosional tests. Based on the test results, it was reported that the mechanical performance of
biopolymer treated materials was better than that of the untreated material. Further, the
erosional tests indicated addition of chitosan improved resistance against water induced erosion

Chapter 2. Literature review
54
either as a surface coat or as a stabiliser. It was concluded that chitosan at 3.0% was sufficient
to improve the strength and durability properties of earthen construction materials. On similar
lines, Nakamatsu et al., (2017) investigated the effect of carrageenan (which is a biopolymer
derived from algae) on mechanical and durability properties for the same soil used by Aguilar
et al., (2016). It was reported that in the case of carrageenan, about 2.0% of concentration was
sufficient to achieve significant stabilisation of the earthen material. These fairly rudimentary
studies provide a brief outlook of using biopolymers as potential stabilisers for earthen
materials. With this research background, this thesis aims to assess the potential of using
biopolymer treated earthen material through geotechnical characterisation and assessment as
a building material.
2.5 Concluding remarks
This chapter has discussed the historical overview of rammed earth and compressed earth blocks
which led to the development of technical recommendations for manufacturing modern day
earthen materials. Particle size distribution and soil plasticity have become the main
parameters which define the suitability of the soil for its use in manufacturing earthen
materials. Strength, durability, hygroscopic behaviour and recyclability potential are the
desired engineering properties of modern earthen materials. Based on the past research, factors
which influence these properties were discussed. It was noted that the addition of chemical
stabilisers though has improved strength and durability, it has compromised hygroscopic
behaviour and recyclability potential of the earthen material.
Basics of unsaturated soil mechanics were discussed in subsequent sections of the
chapter. Phase relationships, soil suction and soil water retention curve, were discussed. Though
limited studies report the role of suction in earthen materials, it was noted that suction plays a
crucial role in the mechanical behaviour of earthen materials. Further, it was noted that a
constitutive model to predict the strength of an earthen material could be developed based on
the concepts of unsaturated soil mechanics.
The chapter ended with a discussion on biopolymer stabilisation, which can be a
potential alternative to chemical stabilisers. Based on the literature review, it was noted that
biopolymers have been effectively used to improve strength, permeability and durability of the
soils in many geotechnical applications. It was noted that biopolymers provide stabilisation
effect through the formation of hydrogels. Further, essential aspects concerning biopolymer
stabilisation were summarised.
In the next chapter, findings from the preliminary study undertaken to understand the
stabilisation effect of two biopolymers namely guar gum and xanthan gum is discussed.

Chapter 2. Literature Review
55
References
AFNOR. 2001. XP P13-901; Compressed earth blocks
for walls and partitions: definitions –
Specifications – Test methods – Delivery
acceptance conditions.
Aguilar R, Nakamatsu J, Ramírez E, Elgegren M,
Ayarza J, Kim S, … Ortega-San-Martin L. 2016.
The potential use of chitosan as a biopolymer
additive for enhanced mechanical properties and
water resistance of earthen construction.
Construction and Building Materials, 114, 625–
637.
Al Aqtash U, and Bandini P. 2015. Prediction of
unsaturated shear strength of an adobe soil from
the soil-water characteristic curve. Construction
and Building Materials, 98, 592–599.
Alley PJ. 1948. Rammed Earth Construction. New
Zealand Engineering.
Allinson D, and Hall M. 2012. Humidity buffering
using stabilised rammed earth materials.
Proceedings of the Institution of Civil Engineers
- Construction Materials, 165(6), 335–344.
Alonso EE, Gens A, and Josa A. 1991. Discussion: A
constitutive model for partially saturated soils.
Géotechnique, 41(2), 273–275.
Aminpour M, and O’Kelly BC. 2015. Applications of
biopolymers in dam construction and operation
activities. In D. I. and S. R. Pina C., Portela E.,
Caldeira L., Batista A. (Ed.), Proceedings of the
Second International Dam World Conference
(DW2015) (pp. 937–946). Lisbon, Portugal:
LNEC.
Arrigoni A, Grillet AC, Pelosato R, Dotelli G, Beckett
C, Woloszyn M, and Ciancio D. 2017. Reduction
of rammed earth’s hygroscopic performance
under stabilisation: an experimental
investigation. Building and Environment, 115,
358–367.
ASTM-D559. 1989. Wetting and Drying Compacted
Soil- Cement Mixtures. Philadelphia: American
Society for Testing and Materials.
Aubert JE, Maillard P, Morel JC, and Al Rafii M. 2016.
Towards a simple compressive strength test for
earth bricks? Materials and Structures, 49(5),
1641–1654.
Australia S. 2002. The Australian Earth Building
Handbook. Sydney, Australia.
Ayeldeen MK, Negm AM, and El Sawwaf MA. 2016.
Evaluating the physical characteristics of
biopolymer/soil mixtures. Arabian Journal of
Geosciences, 9(5), 329–339.
Babu NGR, Anitha N, and Rani RHK. 2010. Recent
trends in biodegradable products from
biopolymers. Recent Trends in Biodegradable
Products from Biopolymers, 9(11), 30–34.
Baker R, and Frydman S. 2009. Unsaturated soil
mechanics. Engineering Geology, 106(1–2), 26–
39.
Becker A, Katzen F, Pühler A, and Ielpi L. 1998.
Xanthan gum biosynthesis and application: A
biochemical/genetic perspective. Applied
Microbiology and Biotechnology, 50(2), 145–152.
Beckett C. 2011. The Role of Material Structure in
Compacted Earthen Building Materials:
Implications for Design and Construction.
Durham University. Retrieved from
http://etheses.dur.ac.uk/3313/
Beckett C, and Augarde C. 2012. The effect of humidity
and temperature on the compressive strength of
rammed earth. In Unsaturated Soils: Research
and Applications (pp. 287–292). Berlin,
Heidelberg: Springer Berlin Heidelberg.
Beckett C, Augarde CE, Easton D, and Easton T. 2017.
Strength characterisation of soil-based
construction materials. Géotechnique.
Beckett C, and Ciancio D. 2016. Durability of cement-
stabilised rammed earth: a case study in
Western Australia. Australian Journal of Civil
Engineering, 14(1), 54–62.
Bouazza A, Gates WP, and Ranjith PG. 2009.
Hydraulic conductivity of biopolymer-treated
silty sand. Géotechnique, 59(1), 71–72.
Brax M, Buchmann C, and Schaumann GE. 2017.
Biohydrogel induced soil-water interactions:
how to untangle the gel effect? A review. Journal
of Plant Nutrition and Soil Science, 180(2), 121–
141.
Bruno AW, Gallipoli D, Perlot C, and Mendes J. 2016.
Effect of very high compaction pressures on the
physical and mechanical properties of earthen
materials. In P. Delage, Y.-J. Cui, S. Ghabezloo,
J.-M. Pereira, & A.-M. Tang (Eds.), 3rd
European Conference on Unsaturated Soils – “E-
UNSAT 2016” (Vol. 9, p. 14004).
Bruno AW, Gallipoli D, Perlot C, and Mendes J. 2017.
Effect of stabilisation on mechanical properties,
moisture buffering and water durability of
hypercompacted earth. Construction and
Building Materials, 149, 733–740.
Bryan AJ. 1988. Criteria for the suitability of soil for
cement stabilization. Building and
Environment, 23(4), 309–319.
BS 1377-2. 1990. Methods of test for Soils for civil
engineering purposes - Part 2 : Classification
tests. London: BSI.
Bui QB, Morel JC, Hans S, and Walker P. 2014. Effect
of moisture content on the mechanical
characteristics of rammed earth. Construction
and Building Materials, 54, 163–169.
Bui QB, Morel JC, Venkatarama Reddy B, and Ghayad
W. 2009. Durability of rammed earth walls
exposed for 20 years to natural weathering.
Chapter 2. Literature Review
56
Building and Environment, 44(5), 912–919.
Burroughs S. 2008. Soil Property Criteria for Rammed
Earth Stabilization. Journal of Materials in Civil
Engineering, 20(3), 264–273.
Burroughs S. 2010. Recommendations for the
Selection, Stabilization, and Compaction of Soil
for Rammed Earth Wall Construction. Journal
of Green Building, 5(1), 101–114.
Cabalar AF, and Canakci H. 2011. Direct shear tests
on sand treated with xanthan gum. Proceedings
of the ICE - Ground Improvement, 164, 57–64.
Champiré F, Fabbri A, Morel J-C, Wong H, and
McGregor F. 2016. Impact of relative humidity
on the mechanical behavior of compacted earth
as a building material. Construction and
Building Materials, 110, 70–78.
Chang I, Im J, and Cho G-C. 2016. Introduction of
Microbial Biopolymers in Soil Treatment for
Future Environmentally-Friendly and
Sustainable Geotechnical Engineering.
Sustainability, 8(3), 251.
Chang I, Im J, Prasidhi AK, and Cho G-C. 2015. Effects
of Xanthan gum biopolymer on soil
strengthening. Construction and Building
Materials, 74(10), 65–72.
Chang I, Prasidhi AK, Im J, and Cho G-C. 2015. Soil
strengthening using thermo-gelation
biopolymers. Construction and Building
Materials, 77(2015), 430–438.
Chen C, Wu L, Perdjon M, Huang X, and Peng Y. 2019.
The drying effect on xanthan gum biopolymer
treated sandy soil shear strength. Construction
and Building Materials, 197, 271–279.
Chen R, Zhang L, and Budhu M. 2013. Biopolymer
Stabilization of Mine Tailings. Journal of
Geotechnical and Geoenvironmental
Engineering, 139(October), 130128212232006.
Chudzikowski RJ. 1971. Guar gum and its
applications. Journal of the Society of Cosmetic
Chemists, 22(1), 43–60.
Ciancio D, and Boulter M. 2012. Stabilised rammed
earth: a case study in Western Australia.
Proceedings of the Institution of Civil Engineers
- Engineering Sustainability, 165(2), 141–154.
CID-GCB-NMBC-14.7.4. 2006. New Mexico Earthen
Building Materials Code. Santa Fe, NM.:
Construction Industries Division of the
Regulation and Licensing.
Cointeraux F. 1791. Ecole d’architecture rurale.
Premier, deuxie`me, troisie`me et quatrie`me
cahier. Vezard & Le Normant.
CRATerre-EAG: Rigassi V. 1995. Compressed earth
blocks, vol. 1:manual of production.
Braunschweig, Allemagne: Friedrich Vieweg &
Sohn.
CRATerre-EAG. 1998. CDI, Compressed earth blocks:
Standards – Technology series No.11.
Brussels:CDI.
Dachverband Lehm e.V. 2009. Lehmbau Regeln –
Begriffe, Baustoffe, Bauteile (3rd Editio).
Wiesbaden, Germany,: Vieweg + Teubner.
Deboucha S, and Hashim R. 2011. A review on bricks
and stabilized compressed earth blocks, 6(3),
499–506.
Delage P. 2002. Experimental unsaturated soil
mechanics. Proc. 3rd Int. Conf. on Unsaturated
Soils, UNSAT, 1961(3), 973–996.
DIN18945. 2013. Earth blocks - Terms and definitions,
requirements, test methods.
EBAA. 2004. Building with earth bricks & rammed
earth in Australia. Wangaratta: Earth Building
Association of Australia EBAA.
Etzion Y, and Saller M. 1987. Earth Construction—A
Review of Needs and Methods. Architectural
Science Review, 30(2), 43–48.
Fabbri A, Morel J-C, and Gallipoli D. 2018. Assessing
the performance of earth building materials: a
review of recent developments. RILEM
Technical Letters, 3, 46–58.
Fitzmaurice R. 1958. Manual on stabilized soil
construction for housing. New York: United
Nations, Technical Assistance Programme.
Font F, and Hidalgo P. 1991. El Tapial–Una Technica
Constructiva Mil Lenaria.
Fredlund D., and Xing A. 1994. Equations for the soil-
water characteristic curve. Canadian
Geotechnical Journal, 31(4), 521–532.
Fujita Y, Ferris FG, Lawson RD, Colwell FS, and Smith
RW. 2000. Subscribed content calcium carbonate
precipitation by ureolytic subsurface bacteria.
Geomicrobiology Journal, 17(4), 305–318.
Fullerton RLC. 1967. Building construction in warm
climates.
Gallipoli D, Bruno AW, Perlot C, and Mendes J. 2017.
A geotechnical perspective of raw earth building.
Acta Geotechnica, 12(3), 463–478.
Gallipoli D, Gens A, Sharma R, and Vaunat J. 2003. An
elasto-plastic model for unsaturated soil
incorporating the effects of suction and degree of
saturation on mechanical behaviour.
Géotechnique, 53(1), 123–136.
Garcıa-Ochoa F, Santos VE, Casas JA, and Gomez E.
2000. Xanthan gum: production, recovery, and
properties. Biotechnology Advances, 18(7), 549–
579.
Gens A. 2010. Soil–environment interactions in
geotechnical engineering. Géotechnique, 60(1),
3–74.

Chapter 2. Literature Review
57
Gerard P, Mahdad M, Robert McCormack A, and
Fran??ois B. 2015. A unified failure criterion for
unstabilized rammed earth materials upon
varying relative humidity conditions.
Construction and Building Materials, 95, 437–
447.
Gerlach G, and Arndt K-F. 2009. Hydrogel sensors and
actuators: engineering and technology (Vol. 6).
Springer Science & Business Media.
Gerrard C. 2003. Paisaje y sen˜orı´o. La casa
conventual de Ambel (Zaragoza): arquitectura e
historia de las o´rdenes militares del Temple y
del Hospital. Zaragoza.
Gooding D. 1993. Soil Testing for Soil-Cement Block
Preparation (No. Working Paper No. 38.).
Guettala A, Abibsi A, and Houari H. 2006. Durability
study of stabilized earth concrete under both
laboratory and climatic conditions exposure.
Construction and Building Materials, 20(3),
119–127.
Heathcote KA. 1995. Durability of earthwall buildings.
Construction and Building Materials, 9(3), 185–
189.
Hillel D. 1998. Environmental Soil Physics. California
(USA): Academic Press.
Houben H, and Guillaud H. 1994. Earth construction:
a comprehensive guide. Intermediate
Technology Publications.
Hughes R. 1983. Material and structural behaviour of
soil constructed walls. Monumentum, 26(3),
175–188.
IS-2110. 1980. Code of practice for in-situ construction
of walls, in buildings with soil-cement. New
Delhi: Bureau of Indian Standards.
IS 1725. 2013. Indian Standard IS 1725: Stabilized soil
blocks used in general building construction —
Specification. New Delhi: Bureau of Indian
Standards.
Ivanov V, and Stabnikov V. 2016. Construction
Biotechnology: Biogeochemistry, Microbiology
and Biotechnology of Construction Materials
and Processes. Springer.
Jaquin PA, Augarde CE, Gallipoli D, and Toll DG.
2009. The strength of unstabilised rammed
earth materials. Géotechnique, 59(5), 487–490.
Jaquin PA, Augarde CE, and Gerrard CM. 2008.
Chronological Description of the Spatial
Development of Rammed Earth Techniques.
International Journal of Architectural Heritage,
2(4), 377–400.
Jiménez Delgado MC, and Guerrero IC. 2007. The
selection of soils for unstabilised earth building:
A normative review. Construction and Building
Materials, 21(2), 237–251.
Jiyao H, and Weitung J. 1990. Earth-culture-
architecture: the protection and development of
rammed earth and adobe architecture in China.
In 6th International Conference on the
Conservation of Earthen Architecture: Adobe 90
preprints: Las Cruces, New Mexico, USA,
October 14-19, 1990 (pp. 72–76).
Katzbauer B. 1998. Properties and applications of
xanthan gum. Polymer Degradation and
Stability, 59(1–3), 81–84.
Kerali AG. 2001. Durability of Compressed and
Cement Stabilised Building Blocks. University
of Warwick.
Khatami HR, and O’Kelly BC. 2013. Improving
mechanical properties of sand using
biopolymers. Journal of Geotechnical and
Geoenvironmental Engineering, 139(8), 1402–
1406.
Kouakou CH, and Morel JC. 2009. Strength and elasto-
plastic properties of non-industrial building
materials manufactured with clay as a natural
binder. Applied Clay Science, 44(1–2), 27–34.
Krayenhoff M. 2012. North American modern earth
construction. In Modern Earth Buildings (pp.
561–608). Elsevier.
Latifi N, Horpibulsuk S, Meehan CL, Abd Majid MZ,
Tahir MM, and Mohamad ET. 2016.
Improvement of Problematic Soils with
Biopolymer—An Environmentally Friendly Soil
Stabilizer. Journal of Materials in Civil
Engineering, 29(2).
Lax C. 2010. Life cycle assessment of rammed earth.
University of Bath. Retrieved from
http://www.ebuk.uk.com/docs/Dissertation_Clar
e_Lax.pdf
Likos WJ. 2000. Total Suction–Moisture Content
Characteristics for Expansive Soils. Colorado
School of Mines,Golden, CO. Retrieved from
https://mountainscholar.org/handle/11124/7853
0
Lu N, and Likos WJ. 2004. Unsaturated Soil
Mechanics. Wiley.
Maniatidis V, and Walker P. 2003. A Review of
Rammed Earth Construction. Bath, United
Kingdom.
Maskell D, Heath A, and Walker P. 2014. Comparing
the Environmental Impact of Stabilisers for
Unfired Earth Construction. Key Engineering
Materials, 600, 132–143.
McGregor F, Heath A, Fodde E, and Shea A. 2014.
Conditions affecting the moisture buffering
measurement performed on compressed earth
blocks. Building and Environment, 75, 11–18.
McGregor F, Heath A, Maskell D, Fabbri A, and Morel
J-C. 2016. A review on the buffering capacity of
earth building materials. Proceedings of the
Institution of Civil Engineers - Construction
Materials, 169(5), 241–251.

Chapter 2. Literature Review
58
McGregor F, Heath A, Shea A, and Lawrence M. 2014.
The moisture buffering capacity of unfired clay
masonry. Building and Environment, 82, 599–
607.
McHenry PG. 1984. Adobe and rammed earth
buildings: design and construction. University of
Arizona.
McQueen IS, and Miller RF. 1974. Approximating soil
moisture characteristics from limited data:
Empirical evidence and tentative model. Water
Resources Research, 10(3), 521–527.
Michon J-L. 1990. Mud castles (kasbas) of south
Morocco-will they survive? In 6th International
Conference on the Conservation of Earthen
Architecture: Adobe 90 preprints: Las Cruces,
New Mexico, USA, October 14-19, 1990 (pp. 99–
104).
Middleton GF, and Schneider LM. 1987. Bulletin 5:
Earth-Wall Construction (Vol. 5). Sydney,
Australia: CSIRO.
Montgomery D. 1998. Physical characteristics of soils
that encourage SSB breakdown during moisture
attack. (Stabilised Soil Research Progress
Report SSRPR03).
MOPT. 1992. Bases Para el Diseño y Construcción con
Tapial. Madrid, Spain: Centro de Publicaciones,.
Secretaría General Técnica, Ministerio de Obras
Públicas y Transportes.
Morel JC, Bui QB, and Hamard E. 2012. Weathering
and durability of earthen material and
structures. In Modern Earth Buildings (pp. 282–
303). Elsevier.
Morel JC, Pkla A, and Walker P. 2007. Compressive
strength testing of compressed earth blocks.
Construction and Building Materials, 21(2),
303–309.
Moriarty J, Svare T, and Therkildsen O. 1975. Soil-
cement for low-cost housing. Norges
Byggforsknings Institutt.
Mudgil D, Barak S, and Khatkar BS. 2011. Guar gum:
processing, properties and food applications—A
Review. Journal of Food Science and Technology,
51(6), 409–418.
Mukerji K. 1986. Soil block presses. Publication of
Deutsches Zentrum fr
Entwicklungstechnologien – GATE, a Division of
the Deutsche Gesellschaft fr Technische
Zusammenarbeit (GTZ) GmbH.
Nagaraj HB, Rajesh A, and Sravan MV. 2016.
Influence of soil gradation, proportion and
combination of admixtures on the properties and
durability of CSEBs. Construction and Building
Materials, 110, 135–144.
Nakamatsu J, Kim S, Ayarza J, Ramírez E, Elgegren
M, and Aguilar R. 2017. Eco-friendly
modification of earthen construction with
carrageenan: Water durability and mechanical
assessment. Construction and Building
Materials, 139, 193–202.
NBR-13354. 1996. Solo-cimento - Ensaio de
durabilidade por molhagem e secagem. Rio de
Janeiro: ABNT-Associação Brasileira de Normas
Técnicas.
Niroumand H, Zain MFM, and Jamil M. 2012. Modern
Rammed Earth in Earth Architecture. Advanced
Materials Research, 457–458, 399–402.
Nishimura T, and Fredlund DG. 2002. Hysteresis
effects resulting from drying and wetting under
relatively dry conditions. In Proceeding of the
3th International Conference of Unsaturated
Soil (pp. 301–306). The Netherlands.
Norton J. 1997. Building with Earth. A handbook
(Second Edi). London: Intermediate Technology
Publications.
Note-164. 1994. Recommendations for the Testing and
Use of Constructions Materials, RILEM
Technical committee.
Nowamooz H, and Chazallon C. 2011. Finite element
modelling of a rammed earth wall. Construction
and Building Materials, 25(4), 2112–2121.
Nuth M, and Laloui L. 2008. Advances in modelling
hysteretic water retention curve in deformable
soils. Computers and Geotechnics, 35(6), 835–
844.
NZS 4297. 1998. Engineering design of earth buildings
(Vol. 4297). Wellington: Standards New
Zealand.
NZS 4298. 1998. Materials and workmanship for earth
buildings [Building Code Compliance Document
E2 (AS2)]. New Zealand Technical Committee.
Wellington: Standards New Zealand.
Ogunye FO, and Boussabaine H. 2002. Diagnosis of
assessment methods for weatherability of
stabilised compressed soil blocks. Construction
and Building Materials, 16(3), 163–172.
Olivier M, and Mesbah A. 1986. Le matériau terre:
Essai de compactage statique pour la fabrication
de briques de terre compressées. Bull.liaison
Labo P. et Ch, 146(January), 37–43.
Olivier M, and Mesbah A. 1987. Influence of different
parameters on the resistance of earth, used as a
building material. In International Conference
on Mud Architecture, Trivandrum, India (Vol.
25).
Oudhof N, Labat M, Magniont C, and Nicot P. 2015.
Measurement of the hygrothermal properties of
straw-clay mixtures. In First International
Conference on Bio-based Building Materials (pp.
474–479).
Pacheco-Torgal F, Ivanov V, Karak N, and Jonkers H.
2016. Biopolymers and Biotech Admixtures for
Eco-Efficient Construction Materials. Woodhead
Publishing.

Chapter 2. Literature Review
59
Pacheco-Torgal F, and Labrincha J a. 2013.
Biotechnologies and bioinspired materials for
the construction industry: an overview.
International Journal of Sustainable
Engineering. Taylor & Francis.
Padfield T. 1998. The role of absorbent building
materials in moderating changes of relative
humidity. Department of Structural
Engineering and Materials, Lyngby, Technical
University of Denmark.
Philip JR. 1977. Unitary approach to capillary
condensation and adsorption. The Journal of
Chemical Physics, 66(11), 5069–5075.
Plank J. 2004. Applications of biopolymers and other
biotechnological products in building materials.
Applied Microbiology and Biotechnology, 66(1),
1–9.
Plank J. 2005. Applications of Biopolymers in
Construction Engineering. In A. Steinbüchel
(Ed.), Biopolymers Online. Weinheim, Germany:
Wiley-VCH Verlag GmbH & Co. KGaA.
Qureshi MU, Bessaih N, Al K, Al-Falahi S, and Al-
Mandhari A. 2014. Shear Strength of Omani
sand Treated with Biopolymer. In 7th
International Congress on Environmental
Geotechnics. Melbourne, Australia.
Qureshi MU, Chang I, and Al-Sadarani K. 2017.
Strength and durability characteristics of
biopolymer-treated desert sand. Geomechanics
and Engineering, 12(5), 785–801.
Reddy B, and Jagadish JS. 1989. Properties of soil–
cement block masonry. Masonry International,
3(2), 80–84.
Reddy B, and Jagadish KS. 1995. Influence of soil
composition on the strength and durability of
soil-cement blocks. Indian Concrete Journal,
69(9), 517–524.
Reddy B, and Kumar PP. 2009. Role of clay content and
moisture on characteristics of cement stabilised
rammed earth. In Proceedings of the 11th
International Conference on Non- Conventional
Materials and Technologies (NOCMAT). Bath
University.
Reddy B, and Kumar PP. 2011a. Cement stabilised
rammed earth. Part A: Compaction
characteristics and physical properties of
compacted cement stabilised soils. Materials
and Structures/Materiaux et Constructions,
44(3), 681–693.
Reddy B, and Kumar PP. 2011b. Cement stabilised
rammed earth. Part B: compressive strength
and stress–strain characteristics. Materials and
Structures, 44(3), 695–707.
Reddy B, Lal R, and Rao KN. 2007. Optimum Soil
Grading for the Soil-Cement Blocks. Journal of
Materials in Civil Engineering, 19(2), 139–148.
Reddy B, and Latha MS. 2014. Influence of soil grading
on the characteristics of cement stabilised soil
compacts. Materials and Structures, 47(10),
1633–1645.
Reitermann R. 2001. Chapel Of Reconciliation.
Retrieved from
https://www.archilovers.com/projects/503/galler
y?333517
Renforth P, Manning DAC, and Lopez-Capel E. 2009.
Carbonate precipitation in artificial soils as a
sink for atmospheric carbon dioxide. Applied
Geochemistry, 24(9), 1757–1764.
Rigassi V. 1985. Compressed Earth Blocks : Manual of
Production. Network (Vol. I).
Rode C. 2005. Moisture Buffering of Building Materials
Department of Civil Engineering Technical
University of Denmark.
Rode C, Peuhkuri R, Mortensen LH, Hansens K, Time
B, Gustavsen A, … Harderup LE. 2005. Moisture
Buffering of Building Materials, Report BYG•
DTU R-126, ISSN 1601-2917. ISBN 87-7877-
195.
Rojas E, and Rojas F. 2005. Modeling hysteresis of the
soil-water characteristic curve. SOILS AND
FOUNDATIONS, 45(3), 135–145.
Rong H, Qian C, and Wang R. 2011. A cementation
method of loose particles based on microbe-based
cement. Science China Technological Sciences,
54(7), 1722–1729.
SAZS-724. 2001. Standard Code of Practice for
Rammed Earth Structures. Harare.
Schroeder H. 2016. Sustainable Building with Earth.
Sustainable Building with Earth. Cham:
Springer International Publishing.
Selvanayagam P. 1970. Soil Cement Blocks For Low
Cost Housing -- Correlation of Experimental
Results With Site Observations.
SIA. 1994. Regeln zum Bauen mit Lehm/Lehmbau-
Atlas, Dokumentationen. Zurich, Switzerland:
Schweizerischer Ingenieur- und Architekten-
Verein.
SLS-1382-3. 2009. Specification for compressed
stabilized earth blocks. Part 3: Guidelines on
production, design and construction. Sri Lanka:
SLSI.
Smith EW, and Austin GS. 1989. Adobe, pressed-earth,
and rammed-earth industries in New Mexico.
Spence RJS. 1975. Predicting the Performance of Soil-
cement as a Building Material in Tropical
Countries. Building Science, 10.
Stabnikov V, Ivanov V, and Chu J. 2015. Construction
Biotechnology: a new area of biotechnological
research and applications. World Journal of
Microbiology and Biotechnology, 31(9), 1303–
1314.
Chapter 2. Literature Review
60
Tarantino A. 2007. A possible critical state framework
for unsaturated compacted soils. Géotechnique,
57(4), 385–389.
Tarantino A. 2009. A water retention model for
deformable soils. Géotechnique, 59(9), 751–762.
Terzaghi K, Peck BR, and Mesri G. 1963. Soil
Mechanics in Engineering Practice (Third Edit).
A Wiley-Interscience Publication.
Thombare N, Jha U, Mishra S, and Siddiqui MZ. 2016.
Guar gum as a promising starting material for
diverse applications: A review. International
Journal of Biological Macromolecules, 88(April),
361–372.
Toll D, Asquith J, Fraser A, Hassan A, Liu G, Lourenço
S, … Stirling R. 2015. Tensiometer techniques
for determining soil water retention curves. In
Unsaturated Soil Mechanics - from Theory to
Practice (pp. 15–22). CRC Press.
Treloar G, Fay R, Ilozor B, and Love P. 2001. Building
materials selection: greenhouse strategies for
built facilities. Facilities, 19(3/4), 139–150.
Tuller M, and Or D. 2005. WATER RETENTION AND
CHARACTERISTIC CURVE. In Encyclopedia of
Soils in the Environment (pp. 278–289).
Elsevier.
UNE41410. 2008. Compressed earth blocks for walls
and partitations. Definitions, specifications and
test methods. Madrid (Spain): Spanish
Association for Standardisation and
Certification.
UNHCS. 1976. Report of HABITAT, A/CONF.
Vancouver.
United Nations. 1964. Soil-cement, its use in building.
New York.
Verma PL, and Mehra SR. 1950. Use of soil-cement in
house construction in the Punjab. Indian Concr
J, 24(4), 91–96.
VITA. 1975. Making buildings blocks with the CINVA-
Ram block press, volunteers in technical
assitance. London: Intermediate Technology
Publications.
Vyncke J, Kupers L, and Denies N. 2018. Earth as
Building Material - An overview of RILEM
activities and recent Innovations in Geotechnics.
MATEC Web of Conferences, 149, 1–7.
Walker P. 1995. Strength, durability and shrinkage
characteristics of cement stabilised soil blocks.
Cement and Concrete Composites, 17(4), 301–
310.
Walker P. 1997. Characteristics of Pressed Earth
Blocks in Earth Blocks. In 11th International
Brick/Block Masonry Conference in Tonji
University (pp. 14–16). Shangai, China.
Walker P. 2002. Standards Australia, 2002. HB 195:
The Australian Earth Building Handbook.
Walker P, Keable R, Martin J, and Maniatidis V. 2005.
Rammed earth: design and construction
guidelines. BRE Bookshop Watford.
Walker P, and Stace T. 1997. Properties of some cement
stabilised compressed earth blocks and mortars.
Materials and Structures/Materiaux et
Constructions, 30(203), 545–551.
Wallis RK. 2012. Modern rammed earth construction
in China. Modern Earth Buildings: Materials,
Engineering, Constructions and Applications,
688–711.
Webb D. 1983. Stabilized soil construction in Kenya. In
International conference on economical housing
in developing countries. Paris: UNESCO.
Yang F, Zhang B, and Ma Q. 2010. Study of sticky rice−
lime mortar technology for the restoration of
historical masonry construction. Accounts of
Chemical Research, 43(6), 936–944.
Yang H, Rahardjo H, Leong E-C, and Fredlund DG.
2004. Factors affecting drying and wetting soil-
water characteristic curves of sandy soils.
Canadian Geotechnical Journal, 41(5), 908–920.

61
Chapter 3
Biopolymer Stabilisation
3.1 Introduction
To understand the potential of using biopolymers as an alternative stabiliser for earthen
materials, an exploratory campaign involving strength tests, qualitative macrostructural
analyses and preliminary durability tests were conducted. The testing methodology and findings
of this campaign are presented in this chapter.
3.2 Materials
3.2.1 Engineered soil mixture
In order to obtain an earthen construction material with acceptable compressive strength, the
particle size distribution of the soil used in the preparation of the material should be within the
recommended limits given by different international standards (Houben and Guillaud, 1994).
However, in many scenarios, the natural soil at the site may not satisfy these requirements. In
this situation, the soil is usually engineered by combining the dry soil components in required
proportions to obtain a material possessing the desired particle gradation (Hall and Djerbib,
2004). Thus, soils used to prepare rammed earth or compressed earth blocks are appropriately
termed as “soil mixes” indicating that the material is manufactured(Beckett, 2011). Engineering
a soil mix ensures that the properties of the prepared mix remains consistent in regards to its
particle size distribution and plasticity properties. The most commonly recommended soil
proportion used for manufacturing earthen construction material is the one containing 70% sand
and clay content at around 15% (Maniatidis and Walker, 2003; Jiménez Delgado and Guerrero,
2007). In adherence with these recommendations, an engineered soil mix denoted as ‘2-7-1’
containing 20% fine fraction, 70% sand and 10% gravel by mass is considered in this and
subsequent investigations of the thesis. By choosing this soil proportion, it was ensured that the
soil mix is favourable for preparing both unstabilised and cement stabilised earthen construction
materials.
To prepare the soil mix, all the ingredients namely the fine fraction, sand and gravel
were initially assembled. For the fine portion, industrial kaolin was procured from M/s IMERYS,
United Kingdom, while sand and gravel were procured from M/s J T Dove limited, United
Kingdom. The clay mineralogy is described as kaolinite and chemical analysis by X-ray
fluorescence showed SiO2 47% and Al2O3 38% by dry mass (IMERYS, 2007). By choosing kaolin,
it is ensured that the principal clay mineral in the soil mix is kaolinite, which is recommended
for earthen construction as it is less susceptible to volume changes on drying and wetting (Etzion
and Saller, 1987; Walker et al., 2005). Sharp sand passing through a 2.36mm sieve was
prepared. The gravel-sized particles from the sand were removed in order to ensure that the

Chapter 3. Biopolymer Stabilisation
62
gravel content in the soil mix was precisely added. The gravel component of the soil mix was
prepared by sieving it through a 10mm sieve. These three components were combined in the
appropriate proportion to obtain the required soil mix. For the prepared soil mix different
physical properties such as particle size distribution, Atterberg limits, linear shrinkage, and
compaction characteristics (using the 2.5kg Proctor test) were determined.
The particle size gradation for the soil mix was obtained through wet sieving and
sedimentation analysis as specified by BS 1377-2 (1990). Sieve analysis was performed for the
coarse fraction retained on a 63 µm sieve and sedimentation analysis for the fine fraction which
passed through the 63 µm sieve. Figure 3.1 shows the particle size distribution curve for the
engineered soil mix along with the recommended limits of soil grading (MOPT, 1992; Houben
and Guillaud, 1994; AFNOR, 2001). It can be observed from the figure that the particle size
distribution of the engineered soil mix lies within the recommended limits of soil grading for
both rammed earth and compressed earth blocks.
Figure 3.1. Particle size distribution for the engineered soil mix
For the engineered soil mix, Atterberg limits and linear shrinkage are determined for
the soil fraction passing the 425 µm sieve. For determining Atterberg limits, the sieved soil
fraction was mixed thoroughly with deionized water until a stiff consistency was achieved. After
mixing, the mixture was left to equilibrate in air-tight polythene bags for 24 hours, after which
Atterberg limits and linear shrinkage were determined in accordance with the British standard
(BS 1377-2, 1990) and results are tabulated in Table 3.1. The cone penetration method was used
to determine the liquid limit of the soil mixture. The test was conducted progressively from stiff

Chapter 3. Biopolymer Stabilisation
63
to soft consistency on the equilibrated soil mix, so as to obtain a minimum of five points for
plotting the flow curve. It was ensured that these points fell within the consistency range
corresponding to 15 mm to 25 mm of penetration depth. Liquid limit of the specimen, i.e. the
water content corresponding to 20 mm cone penetration was later extrapolated from the flow
curve. For determining the plastic limit, the equilibrated sample in stiff consistency was spread
across a glass plate to dry and at regular intervals the sample was worked along to achieve a
uniform dry mixture. This process of drying and mixing the soil was continued until visible
cracks started to appear on the soil surface when rolled into 3 mm threads. The water content
corresponding to this point was noted as the plastic limit of the soil. The plastic limit values are
average of two trials. To obtain linear shrinkage, some portion of the soil from the liquid limit
test corresponding to liquid limit consistency, i.e. (around 20 mm cone penetration) was spread
uniformly into a shrinkage tray. Air pockets were carefully removed and the tray was left to air
dry for 24 hours. After 24 hours, the soil in the tray was oven dried for another 24 hours. Based
on the initial and final lengths of the sample the linear shrinkage of the sample was calculated.
Figure 3.2. Plasticity properties of the engineered soil mix
In Figure 3.2, the liquid limit and the plasticity index of the engineered soil mix are
plotted on the plasticity chart along with recommended limits for earthen materials (Houben
and Guillaud, 1994; CRATerre-EAG., 1998; AFNOR, 2001). From the figure, it can be noted that
the plasticity properties of the engineered soil mix are well within the recommended limits. In
addition, based on the plasticity properties and linear shrinkage values, it can be considered
that the soil is favourable for cement stabilisation as per the recommendations given by
Burroughs (2008).

Chapter 3. Biopolymer Stabilisation
64
Figure 3.3. Compaction characteristics of the engineered soil mix
Following the work of Hall and Djerbib (2004), Walker et al., (2005) and Bui and Morel
(2009), the compaction properties of the engineered soil mix, i.e. optimum water content (OWC)
and max dry density (d,max) were determined by performing light Proctor tests as per BS 1377-
4 (1990). For the engineered soil, the OWC was found to be 9.8% and dmax was 19.62 kN/m3. The
results of the compaction tests are presented in Figure 3.3. In this thesis, all earthen
construction materials (unstabilised, biopolymer and cement stabilised) are manufactured
under controlled density to achieve the maximum dry density of the engineered soil mix. Table
3.1 summarises the different physical properties of the soil mixture used in this study.
Table 3.1. Physical properties of the unstabilised soil mixture.
Soil Clay
(%)
Silt
(%)
Sand
(%)
Gravel
(%)
Liquid
Limit
(%)
Plastic
Limit
(%)
Linear
Shrinkage
(%)
OWC
(%)
dmax
(kN/m3)
2-7-1 16 04 70 10 36.2 18.4 05 9.8 19.62
3.2.2 Biopolymers
The two chosen biopolymers namely guar gum and xanthan gum were procured from M/s
Intralabs, United Kingdom. The physical properties of these biopolymers as provided by the
manufacturer are given in Table 3.2.

Chapter 3. Biopolymer Stabilisation
65
Table 3.2. Physical properties of biopolymers used (Intralabs, 2016a, 2016b).
Properties Guar gum Xanthan Gum Remarks
Colour White Yellow white
Viscosity (cP),
1% biopolymer
solution
3500 1200-1700 Guar gum: Water solution
Xanthan gum: 1% Potassium
chloride solution
Particle Size 97% passing 75
µm
95% passing
180 µm
pH 6.5-7.5 6.0-8.0
3.2.3 Cement
In this thesis, the performance of biopolymer stabilised earthen construction materials are
compared with unstabilised and cement stabilised materials. The cement used for stabilisation
was CEM II type which conforms to the specifications set out in BS EN 197-1 (2011). The cement
was procured from M/s Lafarge Cement UK Limited, United Kingdom.
3.3 Experimental programme
In this initial exploratory campaign to understand biopolymer stabilisation, the effect of
biopolymers on plasticity, shrinkage and strength characteristics of the earthen construction
material was studied. Subsequent sections present the testing methodology and results of this
investigation.
3.3.1 Effect of biopolymers on plasticity and shrinkage properties of the soil
mix
3.3.1.1. Methodology
To understand the effect of biopolymers on plasticity and shrinkage properties of the soil, the
portion of engineered soil mix passing through a 425 µm sieve was dry mixed thoroughly with
biopolymers at varying contents of 0.5. 1.0, 2.0 and 3.0% by mass. Deionised water was then
added to these mixtures and mixed thoroughly until a uniform stiff consistency was achieved.
The wet mixtures were then stored in air-tight polythene bags to equilibrate for 24 hours.
Atterberg limits namely liquid limit and plastic limits, and linear shrinkage of these
equilibrated stabilised soil mixtures were determined as per British standard (BS 1377-2, 1990).
3.3.1.2. Test results
a) Effect of biopolymers on plasticity properties of the soil mix
Figure 3.4 presents the effect of biopolymers on the Atterberg limits of the soil. The liquid and
plastic limits of unamended soil mix were 36.2 % and 18.4 % respectively. The effect of
biopolymers was different with respect to the biopolymer used. On addition of guar gum both

Chapter 3. Biopolymer Stabilisation
66
the liquid and plastic limits increased with the increase in biopolymer content. The increase in
liquid limit was more significant than the plastic limit, indicating that the amount of water
retained by guar gum is more significant at higher water contents. It was interesting to note
that xanthan gum had a different effect on the liquid limit. For 0.5% of xanthan gum, the liquid
limit was about 53.2% which was higher than that of the liquid limit of the unamended soil mix.
After that, liquid limit decreased with increasing biopolymer content. The plastic limit of
xanthan stabilised soil increased with the increase in biopolymer content. In order to understand
how these variations would affect the plasticity characteristics of the soil, the plasticity indices
with respective liquid limits for both the gums at each biopolymer content were plotted on a
plasticity chart (Figure 3.5). As per BS 1377-2 (1990), the fines portion of the unamended soil
mix was initially classified as Clay of intermediate compressibility i.e., CI. While on addition of
guar gum, the classification of the fine portion changed to CH, indicating the behaviour of the
biopolymer to be Clay with higher compressibility. In case of xanthan gum, classification
changed to CH at lower biopolymer content, while at higher content the classification shifted
back again to CI.
Figure 3.4. Effect of biopolymers on Atterberg limits of the soil.

Chapter 3. Biopolymer Stabilisation
67
b) Effect of biopolymers on linear shrinkage
Figure 3.6 presents the results of linear shrinkage tests. The linear shrinkage of the unamended
soil mix was 5.0%. The linear shrinkage of the guar gum stabilised soil mix increased with
biopolymer content. The linear shrinkage increased up to 12.5% at 3.0% biopolymer content
indicating that the guar stabilised soil may be prone to high shrinkage effects. For the xanthan
gum, on addition of 1.0% of the biopolymer, the linear shrinkage rose to 7.3%. While on
subsequent increase of biopolymer content from 1.0%, the linear shrinkage of the soil reduced.
For soil mixes stabilised with 3.0% xanthan gum, the linear shrinkage was about 5.3%, which
was about the same as the value for the unamended soil mixture.
Figure 3.5. Effect of biopolymers on plasticity properties of the soil
Figure 3.6. Effect of biopolymers on linear shrinkage of the soil

Chapter 3. Biopolymer Stabilisation
68
c) Discussion on test results
Nugent et al.,(2009) reports that on addition of biopolymer, two important interactions occur
within the soil-water matrix. Firstly, the hydroxyl groups of the biopolymer readily interact with
pore water which increases its viscosity and tends to increase liquid limit. Secondly, the
interaction between biopolymer chains and clay particles leads to soil agglomerations which
reduces the overall surface area of soil particles. Thus, lower amounts of water are required to
hydrate these agglomerations and this tends to lower the liquid limit. The combination of these
two interactions determine the final liquid limit of the soil.
Being a neutral polysaccharide with large hydroxyl groups, guar gum essentially
interacts with pore water and soil particles through formation of hydrogen bonds
(Chudzikowski, 1971). Compared to soil agglomerations, interactions which increase the
viscosity are more predominant for guar gum (Nugent et al., 2009) . Thus, the liquid limit of the
soil proportionately increases with guar gum content. As a consequence, soil plasticity increases
with higher guar gum content (Figure 3.5). Conversely, it would mean that on disappearance of
these hydrogen bonds (i.e., drying of hydrogels) and with fewer soil agglomerations, guar gum
stabilised soil would excessively shrink. This hypothesis may be confirmed from the higher
linear shrinkage values of guar gum stabilised soil mixes (Figure 3.6).
In the case of xanthan gum, which is an anionic polysaccharide, the biopolymer readily
interacts with net negative clay particles and forms many soil agglomerations bonded through
ionic and hydrogen bonds (Katzbauer, 1998; Nugent et al., 2009; Chang et al., 2018). Nugent et
al.,(2009) reports that after the initial peak, xanthan gum has a higher impact on soil
agglomerations than its viscosity with increasing biopolymer content. Thus, higher
concentrations of xanthan gum lead to greater soil agglomerations which reduce the overall
surface area of the soil particles and thus reduces liquid limit (Figure 3.5). On drying, with
better stabilisation, the xanthan gum stabilised soil mix may have better volumetric stability as
noticed from linear shrinkage values (Figure 3.6).
3.3.2 Strength characteristics of biopolymer stabilised earthen construction
materials
3.3.2.1. Unconfined compressive strength of biopolymer stabilised earthen construction
materials
The main objective of this investigation is to arrive at the biopolymer concentration which can
provide comparable compressive strength to a cement stabilised earthen construction material.
It was noted from the literature review that biopolymer concentration in the range of 1.0 – 3.0%
of the dry soil mass is sufficient to achieve requisite strength and durability (Cabalar and
Canakci, 2011; Chang et al., 2015; Qureshi et al., 2017), while higher concentrations of
biopolymer affected workability (Chang et al., 2015). Hence, different biopolymer concentrations
within this range were considered in this investigation (Table 3.3). For the cement stabilised

Chapter 3. Biopolymer Stabilisation
69
specimens, the stabiliser content was kept constant at 8.0% which conforms to the literature
recommendations for stabilised earthen construction materials (Fitzmaurice, 1958; Houben and
Guillaud, 1994; Walker and Stace, 1997; Bui et al., 2014).
Unconfined compression (UC) tests were performed on compacted cylindrical specimens
of 38 mm diameter and 76 mm length. As this parametric study involves preparation of a large
set of samples considering five varying stabiliser contents for both biopolymers along with
unstabilised and cement stabilised specimens, manufacturing smaller cylindrical specimens was
considered to be appropriate to understand the relative performances. Use of smaller cylindrical
specimens is a quick and reliable approach which is commonly followed to assess the relative
performances between materials of varying properties especially in geotechnical engineering
(Reddy et al., 2007; Cristelo et al., 2012; Chan and Low, 2014). In addition, the test results were
seen to potentially provide valuable insights to forecast other engineering properties of the
stabilised earthen construction materials (Reddy and Jagadish, 1995).
Table 3.3. Different proportions of biopolymer used in this study.
Biopolymer
content by
mass (%)
UCS
tests
Tensile
tests
Additional water added above OWC (%)
Guar gum Xanthan gum
0.5 - 0.50 0.25
1.0 1.00 0.50
1.5 1.50 0.75
2.0 2.00 1.00
2.5 - 2.50 1.25
3.0 3.00 1.50
a) Sample preparation
In order to make the UC test specimens, the required quantities (mass basis) of the ingredients
(sand, gravel, kaolin and biopolymer) were weighed and initially mixed in the dry condition. The
biopolymer was pre-mixed with the dry ingredients of the soil-mixture in order to achieve better
interactions with the soil mixture before the formation of hydrogels on later addition of water.
The dry mixing enables the biopolymer to interact with the clay fraction more efficiently (Chang
et al., 2015; Latifi et al., 2016), while for the sand portion, biopolymer coats the grain surfaces
and increase the contact area of soil particles (Chang et al., 2015; Ayeldeen et al., 2016). After
dry mixing, water equivalent to optimum water content obtained through the compaction test
was added and mixed thoroughly. As biopolymer forms hydrogels when in contact with water,
there was a necessity to add additional water in order to make the soil mix workable. The
amount of additional water required varied with respect to the biopolymer used and values are
given in Table 3.3. After adding the additional water and mixing thoroughly, the required bulk
mix was weighed and introduced into the specimen mould in three layers (Figure 3.7). Each
layer was statically compacted to achieve the desired density and the surfaces of the first and

Chapter 3. Biopolymer Stabilisation
70
second layers were scratched in order to ensure proper bonding between layers. The compacting
pressure to achieve the required density varied between 2.0-2.5 MPa. Finally, the compacted
specimen was carefully removed from the mould. Following the preparation, samples were left
to dry naturally in laboratory atmosphere (relative humidity (RH) of 50% and temperature of
21°C) and were then tested after 7 and 28 days. UCS test specimens of unamended and cement
stabilised specimens were prepared similarly.
b) Testing Methodology
Three replicates of specimens were prepared for each biopolymer content and tested for
unconfined compression as per the British standard (BS 1377-7, 1990) at designated curing
periods. On the day of testing, mass and dimensions of the test specimens were recorded prior
to testing. Test specimens were then set under the loading frame of a Shimadzu universal
testing machine (Figure 3.8a). As the surface of the test specimens was level no capping was
used for testing. The specimen was uniaxially loaded at a controlled displacement rate of 0·5
mm/min until failure. The displacement rate of 0.5 mm/min was chosen based on the previous
testing conducted by Jaquin et al.,(2009) and Beckett et al.,(2017). Loads and displacements
were automatically recorded by the TRAPEZIUM LITE X Software. After the completion of the
test, some portion of the soil from the specimen was collected to measure the water contents,
while another portion was collected to measure total suction using the WP4C dewpoint
potentiometer (Decagon Devices, 2007).
Figure 3.7. Setup for preparation of UCS test specimens (a) Mould, (b) Static compactor
(a) (b)

Chapter 3. Biopolymer Stabilisation
71
As the test specimens were left to dry naturally under relative humidity (RH) of 50% and
temperature of 21°C, it can be expected that these conditions impose high suction on the test
specimens. In order to have a measurement at this high suction regime, a dew point
potentiometer was used to measure the total suction (Figure 3.8b). The dew point potentiometer
works on the principle of equilibrating the sample with the ambient conditions within the
sample chamber. The dew point potentiometer used here has a working range of 1-300 MPa and
enables suction measurement of soils having very low water contents, e.g. earthen construction
materials. Dewpoint potentiometer can obtain suction measurements through three different
reading modes, i.e. precise, fast and continuous modes (Decagon Devices, 2007). In precise mode,
the measurements are obtained until the successive suction readings are within the preset
tolerance level of 0.03MPa. In fast mode, the suction measurement happens only once, however,
the readings are less precise. In continuous mode, the measurements are obtained continuously
for as long as the specimen is kept in the sample chamber. In this investigation, precise mode
was chosen to obtain suction measurements. In general, each sample took about 15-30 min to
equilibrate within the sample chamber before the suction reading was displayed. The final
suction readings reported herein are mean of the three replicates.
Figure 3.8. Testing of UCS test specimens (a) universal testing machine, (b) dewpoint
potentiometer
c) Test results
Axial stress/strain plots recorded during the compressive tests are shown in Figure 3.9. The
initial low stiffness at low axial strains are due to sample bedding in and the key conclusions
are drawn from the results at > 0.5% strain. After 7 days of curing, for both guar and xanthan
gum stabilised specimens, there is an appreciable difference in the modulus between different
(a)
(b)

Chapter 3. Biopolymer Stabilisation
72
concentrations, with higher concentrations leading to higher modulus. At 28 days curing,
however, modulus had peaked at 1.5% of biopolymer content (Figure 3.10 and 3.11). These
variations of the modulus provide evidence of the change of state of the hydrogel products formed
by the biopolymers, which is discussed in more detail below.
Figure 3.9. Stress–strain behaviour in UC tests (for each %stabiliser only one test among three
replicates is shown): (a) guar gum, 7 days, (b) guar gum, 28 days, (c) xanthan gum, 7 days, (d)
xanthan gum, 28 days
For each sample, the peak strength was derived from the peak stress obtained from the
stress-strain plot, while the slope of the stress-strain curve in the elastic region was considered
as the soil modulus. UC peak strength and soil modulus are plotted against % stabiliser for both
biopolymers in Figures 3.10 and 3.11 respectively. Entire test results are presented in Appendix.
It can be seen that an addition of 2.0% guar gum provides soil with compressive strength higher
than the cement-stabilised sample: approximately 30% higher after 7 days and 35% after 28
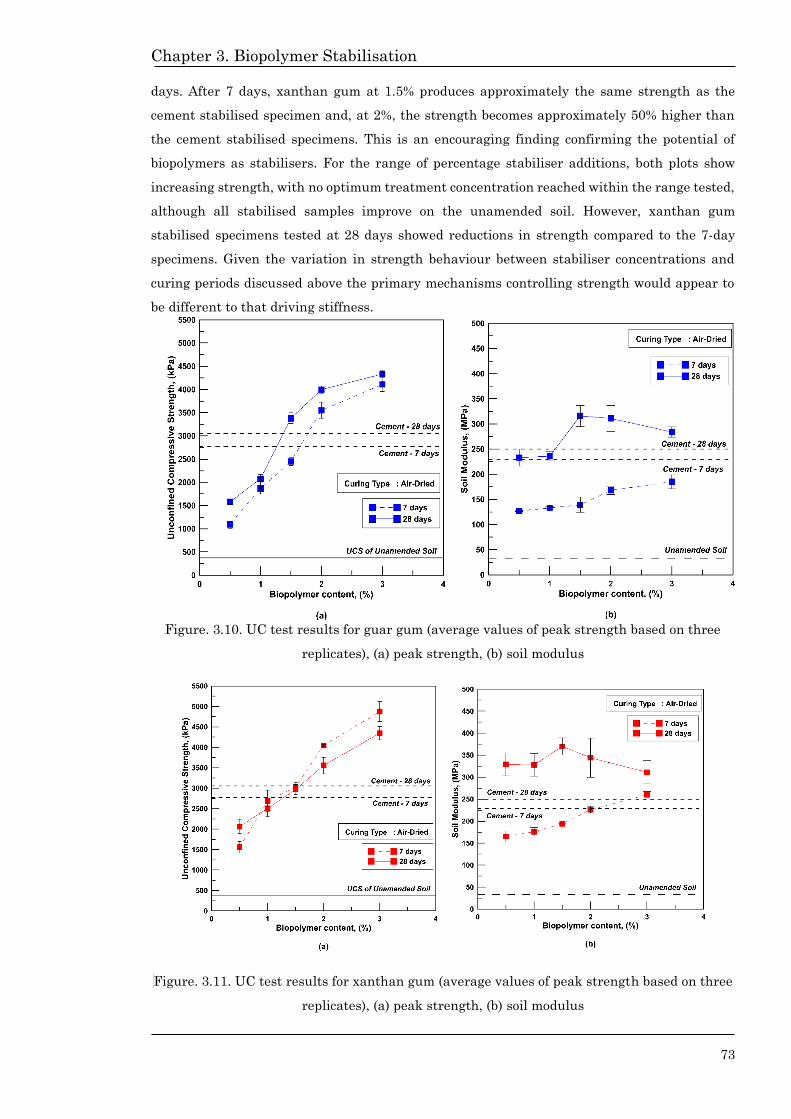
Chapter 3. Biopolymer Stabilisation
73
days. After 7 days, xanthan gum at 1.5% produces approximately the same strength as the
cement stabilised specimen and, at 2%, the strength becomes approximately 50% higher than
the cement stabilised specimens. This is an encouraging finding confirming the potential of
biopolymers as stabilisers. For the range of percentage stabiliser additions, both plots show
increasing strength, with no optimum treatment concentration reached within the range tested,
although all stabilised samples improve on the unamended soil. However, xanthan gum
stabilised specimens tested at 28 days showed reductions in strength compared to the 7-day
specimens. Given the variation in strength behaviour between stabiliser concentrations and
curing periods discussed above the primary mechanisms controlling strength would appear to
be different to that driving stiffness.
Figure. 3.10. UC test results for guar gum (average values of peak strength based on three
replicates), (a) peak strength, (b) soil modulus
Figure. 3.11. UC test results for xanthan gum (average values of peak strength based on three
replicates), (a) peak strength, (b) soil modulus

Chapter 3. Biopolymer Stabilisation
74
3.3.2.2. Tensile strength of biopolymer stabilised earthen construction materials
Bui et al.,(2014) noted that unlike other characteristics of an earthen construction material,
studies of tensile behaviour are limited. In fact, tensile strength of earthen construction material
is considered to be very low and its direct determination is often neglected. However, tensile
strength of the soil is a key indicator of its cracking propensity, as it depends on soil suction and
water content (Towner, 1987). Furthermore, tensile strength is necessary to evaluate the seismic
performance of an earthen building (Gomes et al., 2011; Araki et al., 2016).
Figure 3.12. Direct tension tests a) NDTT illustration (b) Test-setup
Though being an important parameter, determination of and earthen material’s tensile
strength experimentally is a difficult task. The methods to determine tensile strength are
different for saturated and unsaturated soils as these two classes of soils require different
equipment and testing procedures (Nearing et al., 2010). Tensile tests are further classified into
direct or indirect tension tests. Direct tension tests apply an axial tensile load, while indirect
tests (such as the Brazilian test) exploit the application of compressive loading such that the
specimen fails in tension (Stirling et al., 2015). Determination of tensile strength either through
direct or indirect approaches has its own advantages and limitations. Recently, Stirling et al.,
(2015) developed a new method to determine the tensile strength of soils having relatively low
saturation. The method known as the Newcastle Direct Tensile Test (NDTT) requires simple
reversible modification of existing direct shear apparatus. The tensile strength determined
through this new method compares well with the strength obtained from the well-known
Brazilian method (an indirect tension test).
a) Sample preparation
To determine the tensile strength of biopolymer stabilised earthen construction materials,
similar testing arrangements as outlined by Stirling et al.,(2015) was used. Based on UC test
(a) (b)

Chapter 3. Biopolymer Stabilisation
75
results, it was noted that about 1.5% of biopolymer content was sufficient to obtain a comparable
strength of cement stabilised earthen material. Hence, for determining tensile strength,
biopolymer contents higher than 1.5% were chosen (Table 3.3). The tensile specimens are
manufactured in the shape of a bow-tie (Figure 3.12b) and preparation procedure of these
specimens are similar to that of UC test specimens, i.e. compacting the soil in three layers in a
sample mould to achieve the required dry density. The specimen possesses a mirrored isosceles
trapezium plan cross-section (27 x 16 x 46 mm), this constraint, i.e. reduced cross-sectional area
induces failure at the neck of the specimen. Biopolymer stabilised tensile specimens were cured
under similar conditions as that of UC test specimens and tested after 7 and 28 days. Tensile
strengths of unamended and cement stabilised specimens were also obtained similarly.
On the day of testing, mass and dimension of the cured specimen was noted. The test
specimen was introduced into the modified 60mm square direct shear testing rig. The sample
was secured between the loading jaws of the modified rig (Figure 3.12). By propelling the motor
of the testing rig, the carriage jaw moves away from the restrained jaw uniaxially which induces
tension on the sample. The rate of deformation can be controlled similarly to a direct shear test,
in this case it was maintained at 0.5 mm/min. The loading on the sample continued until obvious
failure. Load and displacement values were recorded manually. For all the specimens tested,
the testing duration was about 8 -10 min. After the test was completed, some portion of the
tested specimen was collected to measure the water contents, while another portion was
collected to measure total suction using the WP4C dewpoint potentiometer (Decagon Devices,
2015).
b) Test results
Stress/strain plots recorded during the tensile tests are shown in Figure 3.13. After 7
days of curing, for both guar and xanthan gum stabilised specimens, there is a fairly linear
relationship between stress and strain for both. All specimens softened after reaching the peak
stress. It was observed that beyond peak stress, the specimens started to fail across the neck of
the specimen. After 28 days, the observed peak strengths and stiffness for all concentrations of
guar gum specimens were less than the 7 day cured specimens. In the case of xanthan gum
stabilised specimens, all concentrations led to higher strength and stiffness than 7 day cured
specimens. Furthermore, after reaching the peak strength specimens failed immediately with
well-defined brittle failure without any signs of softening.
Peak tensile strength is plotted against stabiliser concentration in Figure 3.15 indicating
a clear relationship between stabiliser concentration and tensile strength. The error bars show
the greater variation for these tests which can be explained by the different modes of failure.
Tensile strength will be critically affected by the presence and nature of microcracking which
will vary between samples and be difficult to predict or control. Shear failure in the UC tests
show much less scatter as the resistance to failure is more distributed over a surface. Unlike the
UC results, the tensile strength of the guar gum samples reduced with time whereas the
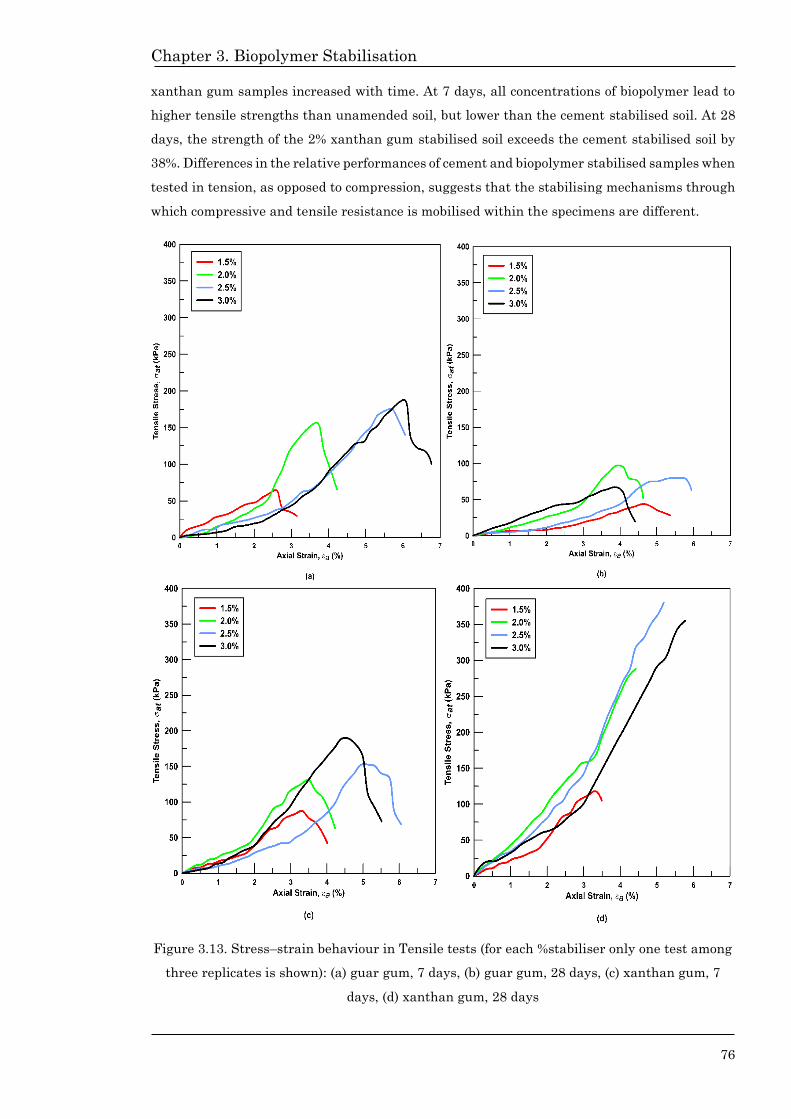
Chapter 3. Biopolymer Stabilisation
76
xanthan gum samples increased with time. At 7 days, all concentrations of biopolymer lead to
higher tensile strengths than unamended soil, but lower than the cement stabilised soil. At 28
days, the strength of the 2% xanthan gum stabilised soil exceeds the cement stabilised soil by
38%. Differences in the relative performances of cement and biopolymer stabilised samples when
tested in tension, as opposed to compression, suggests that the stabilising mechanisms through
which compressive and tensile resistance is mobilised within the specimens are different.
Figure 3.13. Stress–strain behaviour in Tensile tests (for each %stabiliser only one test among
three replicates is shown): (a) guar gum, 7 days, (b) guar gum, 28 days, (c) xanthan gum, 7
days, (d) xanthan gum, 28 days

Chapter 3. Biopolymer Stabilisation
77
Figure 3.14. Failure patterns for 28-day tensile specimens for a) guar gum (b) xanthan gum
Figure. 3.15. Tensile test results (average values of tensile strength based on three replicates),
(a) guar gum, (b) xanthan gum
3.3.2.3. Discussion on strength test results
a) Effect of suction and hydrogel formation on strength characteristics
As noted in Jaquin et al.,(2009) and Bui et al., (2014), a significant component of the strength of
unstabilised soil-based construction materials can be linked to the suction present due to the
very low in-situ water contents and presence of fine soil fractions. Lakshmikantha et al., (2012)
reports tensile strength in soils to be essentially a product of soil cohesion and soil suction.
Further, Zhao (2014) and Cao et al., (2017) using Tempe cell measured soil water characteristic
curves (SWCCs) for poorly graded sand initially saturated with water and biopolymer solutions.
It was noted that higher matric suction was needed to desaturate sand treated with xanthan
gum solution at 2g/L concentration, indicating that addition of biopolymer will have an effect on
the suction present in a stabilised soil. It was therefore instructive to measure suction for the
(a) (b)

Chapter 3. Biopolymer Stabilisation
78
materials tested here to understand the effect of biopolymer addition on suction and potentially
strength.
Figure. 3.16. Suction and water content values after UC tests (a) guar gum, (b) xanthan gum
Figure 3.16 shows suction and water content data recorded immediately after UC strength
testing. Similar relations between suction and water content were noted for tensile test
specimens. Some observations are as follows:
• All biopolymer stabilised samples exhibit higher suctions than the unamended and
cement stabilised specimens indicating a contribution from osmotic suction from
biopolymer products (indeed suctions are evident in samples of plain hydrated
biopolymer confirming this). The effect is not dependent on % stabiliser at 28 days but
at 7 days there is a variation indicating that as the hydrogels change state, their
contribution to suction varies.
• At 28 days, the water content of guar gum stabilised samples was higher than 7 days,
while for xanthan stabilised samples it was lower. This variation may be due to their
interaction with surrounding atmosphere. As noted by Kocherbitov et al., (2010), the
vapour sorption/diffusion of a biopolymer is dependent on its state, temperature and
humidity. Hence, by the end of 28 days, guar gum stabilises through water absorption
from the atmosphere, while xanthan gum, uses as much free water as it needs, with the
remainder of the water evaporating.
• At 7 days, the suction measured in the unamended samples corresponds to the value
calculated using Kelvin’s equation, given the average RH and temperature in the
laboratory. For the amended samples, however, suction equilibrates at a higher level,
between 125 and 135 MPa, further confirming osmotic suction contributions from the
presence of the biopolymer products.

Chapter 3. Biopolymer Stabilisation
79
• Water contents increase with % stabiliser throughout which is linked to the additional
water required to achieve workable mixes. As % stabiliser of biopolymer more hydrogels
are formed with which it retains more water in the soil mix.
• After 7 days, high suctions are linked to low water contents for both gums indicating a
more significant contribution to suction from pore water than at 28 days.
However, when the suction results are reviewed in parallel with the UC strength data (Figure
3.8 and 3.9) clear conflicts are evident. For the guar gum samples, suctions are seen to reduce
between 7 and 28 days, while compressive strengths increase. Equally, for the xanthan gum
samples, suctions increase while UC strengths decrease. Changes in UC strength must therefore
be explained through additional mechanisms besides suction induced capillary bonding.
Conversely, suction changes shown in Figure 3.11 correspond well with changes in tensile
strength of the biopolymer stabilised soils in that decreases in suction of guar gum samples after
28 days correspond to lower strengths, and increases in suction in xanthan gum samples
correspond to higher strengths. The higher suctions and strengths of the biopolymer stabilised
specimens compared to the unamended specimens suggest that the strength gains are caused
by a combination of suction and hydrogel bonding. The nature of the bonding of these hydrogels
with soil particles depends on the biopolymer type.
Guar gum, being a neutrally charged polysaccharide with large hydroxyl groups
(Chudzikowski, 1971), forms a network of hydrogels between soil particles and free water via
hydrogen bonds (Chen et al., 2013). At 7 days, these hydrogels (predominantly being in a rubbery
state) may contribute to matric suction and hence the stabiliser content contributes to the
measured suction (Figure 3.11). Thereby, the combination of suction and hydrogels contribute
to the observed higher compressive strength of the soil. Tensile strength is also believed to be
driven by a combination of suction and hydrogel bonding. However, as hydrogels are more elastic
and weaker than cement bonds in tension, the tensile strengths are lower than the cement
stabilised specimens. Once the hydrogels transform to a glassy state, the suctions tend to reduce
and reach constant values irrespective of stabiliser content (Figure. 3.11). However, the increase
in compressive strength and soil modulus may be attributed to the network of hydrogels now in
a glassy state connecting the soil particles. Being a weaker chemical bond, the hydrogen bonds
may not contribute to tensile strength with aging.
Xanthan gum is an anionic polysaccharide (Katzbauer, 1998; Garcıa-Ochoa et al., 2000)
and the gum may interact with cations of the clay portion of the soil mix to form chemically
stronger ionic bonds in addition to hydrogen bonds (Chang et al., 2015a). This combination of
ionic and hydrogen bonds will result in better aggregation of the soil particles (Chen et al., 2013).
Similar to guar gum, at 7 days, the combination of suction and hydrogel bonding contributes to
both compressive and tensile behaviour of xanthan gum stabilised soils. Whilst there is a slight
decrease in compressive strength at 28 days, ionic bonding and transformation of hydrogels is
reflected in higher suction which in turn results in higher soil modulus (Figure. 3.10) and
increases in tensile strength with time for xanthan gum stabilised soils.

Chapter 3. Biopolymer Stabilisation
80
b) Comparison of unconfined compressive and tensile strengths
Though tensile strength of earthen construction material is a key indicator in understanding its
cracking propensity and seismic behaviour, characterisation of these materials is rarely done on
the basis of tensile strength (perhaps due to perceived difficulties in tensile testing). Where it is
considered, the tensile strength is suggested to be about 10% of the unconfined compressive
strength of the material (NZS 4297, 1998). Reported tensile to unconfined compressive strength
ratio values suggest that soil gradation and stabilisation effect have an influence on this ratio.
Araki et al., (2016) studied the effect of both direct and indirect tensile tests on unstabilised
rammed earth materials. It was reported that the tensile strengths were in the range of 5.0 –
12.5% of the corresponding unconfined compressive strengths at the same water content range.
Liu and Tong (2017) studied engineering properties of unstabilised rammed earth mixtures with
varying clay contents. It was reported that with the increase in clay content of the soil mixture,
the tensile to unconfined compressive strength ratio tended to reduce. The strength ratios were
in the range of 0.17-0.23. Hallal et al., (2018) reports that the compressive strength of earthen
material increased proportionately with cement content, while the improvement in tensile
strength was not significant. The reported tensile to unconfined compressive strength ratio
reduced from 0.12 for the unstabilised earthen mixture to 0.08 for the stabilised earthen
material.
Table 3.4. Tensile to unconfined compressive strength ratios
Series UCS
(MPa)
Tensile
(MPa)
Tensile to UCS ratio
Soil 2-7-1 0.37 0.03 0.08
Cement – 8.0% 3.05 0.22 0.06
Guar gum – 2.0% 3.99 0.11 0.02
Xanthan gum – 2.0% 3.55 0.29 0.08
From the UC and tensile tests conducted, it can be observed that about 1.5-2.0% of
biopolymer content was sufficient to achieve comparable compressive strength to 8% cement
stabilised specimens. In case of tensile tests, even at higher concentrations of guar gum, the
tensile strengths could not match the strengths of cement stabilised specimens. For xanthan
gum stabilised specimens, at about 2.0% of the biopolymer content, the tensile strengths
surpassed those of cement stabilised specimens. At this biopolymer content, a comparison of
unconfined compressive to tensile strength ratio has been made for biopolymer stabilised
specimens unamended and cement stabilised specimens in Table 3.4. It can be observed from
the table that all soil mixes have lesser tensile to unconfined compressive strength ratio as
suggested by NZS 4297 (1998). Comparing soil mixes, it can be noted that the unamended soil
mix has a ratio of 0.08. Addition of cement and guar gum reduced this ratio, with guar gum
having the least value. For xanthan gum stabilised specimens, the ratio was identical to the

Chapter 3. Biopolymer Stabilisation
81
unamended soil mix, indicating that the addition of xanthan gum has proportional stabilising
effects on both compressive and tensile strengths.
3.3.3 Synergistic behaviour of biopolymers
It has been reported in the literature that xanthan gum interacts synergistically with
galactomannans like guar gum and improves stabilisation (Katzbauer, 1998; Casas et al., 2000).
Casas et al., (2000) observed that combinations of xanthan and guar gum solutions showed a
higher viscosity than that occurring in each separate gum. This synergistic interaction was
further affected by the gum ratio in the mixture and dissolution temperature of both gums.
There are very few reported studies which have attempted to utilise these biopolymers in
synergy to stabilise soil. Chen (2014) evaluated the dust resistance of mine tailings stabilised
with guar gum, xanthan gum and combination of these gums in a wind tunnel test. It was noted
that the rate of erosion for synergistically stabilised mine tailing specimens were lesser than the
individually stabilised specimens. At the end of 10 cycles of exposure to wind, the observed loss
of mass for all biopolymer stabilised mine tailings specimens was lesser than the unstabilised
specimens.
To explore the potential of biopolymer synergy, the engineered soil mix was stabilised
with three combinations of guar and xanthan gum (Table 3.5). Based on the unconfined
compression and tensile test results, it was decided that the biopolymer content at 2.0% of dry
soil mass would be sufficient to achieve adequate strengths and hence combined stabiliser
content for these combinations was maintained at this level. For these soil mixes, Atterberg
limits, linear shrinkage and strength tests were performed following the experimental
procedures as described in previous sections.
Table 3.5. Synergistic combinations of biopolymer used in this study.
Combination Guar gum
(%)
Xanthan gum
(%)
Additional water added
above OWC, (%)
1. 1.5 0.5 1.75
2 1.0 1.0 1.50
3 0.5 1.5 1.25
3.3.3.1. Plasticity and shrinkage characteristics
Table 3.6 tabulates the Atterberg limits and linear shrinkage values of synergistically stabilised
soil mixes. The results are compared with unamended and individually stabilised biopolymer
soil mixes where the stabiliser content was maintained at 2.0%. It can be observed from the
tabulated results that, similar to individually stabilised soil mixes, the synergistically stabilised
soil mixtures have higher liquid and plastic limits than the unamended soil mix. Within these
combinations, lower liquid limit was achieved for the combination having the highest xanthan
gum content. The plastic limits of the three combinations were in a similar range and higher

Chapter 3. Biopolymer Stabilisation
82
than those of individually stabilised soil mixes. To understand the effect of stabilisation on soil
plasticity, liquid limit and plasticity indices for all soil mixes were plotted on plasticity chart
(Figure 3.17). It can be noted from the plasticity chart, that the classification of the fine portion
for all these combinations changed from the original CI to CH. Linear shrinkage test results
indicate that the combination having highest xanthan gum achieved a lower linear shrinkage
value. The test results suggest that there is no drastic improvement in plasticity or shrinkage
properties of synergistically stabilised soil mixes, however, it can be noted that combination of
xanthan and guar gum performs better than the soil mix stabilised with only guar gum.
Table 3.6. Atterberg limits and linear shrinkage values.
Combination Liquid limit
(%)
Plastic Limit
(%)
Plasticity Index
(%)
Linear
Shrinkage (%)
Soil 2-7-1 36.2 18.4 17.8 5.0
Guar gum (GG) – 2.0% 78.7 21.5 57.2 12.1
Xanthan gum (XG) – 2.0% 49.4 20.7 28.7 6.0
1.5% GG + 0.5% XG 80.0 23.4 56.6 11.6
1.0% GG + 1.0% XG 72.1 23.2 48.9 8.4
0.5% GG + 1.5% XG 53.0 23.3 29.7 6.0
Figure 3.17. Effect of synergistic behaviour of biopolymers on plasticity properties of the soil

Chapter 3. Biopolymer Stabilisation
83
3.3.3.2. Strength characteristics
Compressive and tensile test specimens for the synergistic combinations mentioned in Table
3.11 were prepared and tested in a similar procedure as described in section 3.3.2.1. During
sample preparation, the additional water above OWC which is needed to make soil workable
varied proportionally with the gum ratios considered. The additional water required for these
combinations are tabulated in Table 3.9. Strength tests were performed at 7 and 28 days and
results were compared with the strengths of individually stabilised and cement stabilised
specimens (Figure 3.18). It can be noted that both compressive and tensile strengths of all
biopolymer combinations are higher than those of the cement stabilised specimens. Amongst
biopolymer combinations, peak compressive strengths of synergistically stabilised specimens
were in a similar range to those of individually stabilised specimens at 7 and 28 days. At 7 days,
all synergistic combinations had soil modulus than individually stabilised specimens, however,
modulus values at 28 days were similar. The synergistic behaviour of biopolymers is more
noticeable in tensile strengths. After 28 days, it can be noticed that, even small proportion of
xanthan gum (i.e. 0.5%) in combination with guar gum ensured higher tensile strengths than
2.0% guar gum stabilised specimens. Furthermore, the other two combinations which have
higher concentrations of xanthan gum achieved higher tensile strengths than 8.0% cement
stabilised specimens.
Figure 3.18. Comparison of strength characteristics of synergistic combinations (a) UC peak
strength and stiffness, (b) peak tensile strength
It is important to note here that currently there are no reported detailed studies which
report environmental sustainability of using biopolymers as soil stabilisers. It is known that
xanthan gum sequesters CO2 during production (Krishna Leela and Sharma, 2000; Chang et al.,

Chapter 3. Biopolymer Stabilisation
84
2016) in contrast to cement which emits carbon and this fact may prompt one to classify these
biopolymers as sustainable. However, the energy required in the production of these gums may
be much greater than for an equivalent amount of cement (Lo et al., 1997). Full Life Cycle
Assessment (which is currently not available) is needed to provide firm guidance here. Research
findings from this investigation which highlights the potential of biopolymer synergy may be
useful from a mechanical point of view, if use of biopolymers in combination is found to be more
environmentally sustainable.
3.3.4 Macrostructural investigation through X-Ray computed tomography
Soil is a three-phase material consisting of solids (soil particles), fluid (pore water) and gas (air
voids). In a soil element, these constituents form a complex internal architecture which is
diverse over a range of scales (-mm to -µm scale). For this reason, soil is often considered to be
‘the most complex material in the planet’ (Young and Crawford, 2004). From a soil mechanics
perspective, structure plays a vital role in contributing to the mechanical and hydraulic
properties of the soil. Soil structure includes shape, size, distribution and arrangement of soil
particles and pore space within the soil. Historically, to understand the soil structure, soil
specimens were impregnated with a hardening agent such as resin which would replace air and
water from pore spaces. Once the soil specimen was hardened, it was cut into thin slices,
polished and analysed (Jang et al., 1999). However, this kind of procedures are time consuming
and potentially alter the soil properties. As an alternative, many non-destructive testing
techniques have evolved which determine the physical condition of soil specimen without
causing any major damage. One such technique is Computed tomography (CT) which creates 2D
or 3D reconstructions of internal features of objects (Roscoe, 1970; Wellington and Vinegar,
1987).
3.3.4.1. X-Ray computed tomography
X-Ray Computed tomography (XRCT) is an improved version of CT which has increased
scanning resolution: currently XRCT devices can achieve scans with maximum resolutions of
roughly 0.05 µm and resolutions of 10 µm for objects that are a few millimetres across (Rigby et
al., 2011). Similar to CT scanning, XRCT enables one to visualise the object in 2D and 3D based
on the principle of attenuation of electromagnetic waves by different materials (Helliwell et al.,
2013). A typical XRCT setup is shown in Figure 3.19 and consists of an X-ray source, sample
manipulation stage and a detector. The source of an electromagnetic wave may be a conventional
X-ray tube or synchrotron light. The sample is mounted on a sample stage which can rotate such
that X-ray images can be obtained at incremental angular positions. The detector is either an
X-ray detector or a scintillator screen followed by a CCD camera.

Chapter 3. Biopolymer Stabilisation
85
Figure 3.19. Typical X-RCT machine setup.
In an X-ray tube, electrons (negatively charged atomic particles) are made to travel in
vacuum from cathode to anode. When this focused electron beam hit the anode, X-rays are
generated. The generated X-ray beam upon leaving the tube is then shaped into a cone as it
passes through a circular aperture. The emitted X-rays from the source then pass through the
sample securely placed on sample stage and are then progressively attenuated (i.e. a loss of
energy as the ray passes through the sample) by absorption and scattering due to the sample.
Due to the attenuation, the sample becomes a secondary source of X-rays and electrons through
atomic interactions (Mooney et al., 2012). The physical characteristics of the sample determine
whether they absorb or scatter a photon (free electron) which determines the extent of
attenuation. The attenuated X-rays are then picked up by the detector which produces a 2D
grey-scale image of the sample at the given orientation. By rotating the sample in small
increments on the sample stage, a series of grey-scale attenuated images or 2D projections are
captured. which are then used to perform mathematical reconstruction of the sample. Through
mathematical filtered back-projection algorithms cross sectional 2D image slices are generated
from attenuated images. Each of these tomographic ‘slices’ consists of discrete units known as
pixels. When these slices are stacked one above the other, on 3D tomography the discrete unit
is known as voxels (i.e. volume pixels) which represent the spatial resolution of the scan
(Helliwell et al., 2013).The reconstructed 3D model of the scanned sample can be used for visual
inspection and quantitative analysis.
A processed image from XRCT scan consists of soil particles and pore spaces (both water
and air-filled). Based on the attenuation density which is dependent on the material property,
the grey values in the image are ordered. The soil particles being denser have the brightest
voxels (highly attenuating), while pore spaces, being less denser are shown as darker voxels (low
attenuation) (Helliwell et al., 2013). A typical XRCT scan image consisting of different soil
components is presented in Figure 3.20.

Chapter 3. Biopolymer Stabilisation
86
Figure 3.20. Typical XRCT scan of soil.
3.3.4.2. Sample preparation and scanning
As noted from the strength tests, the biopolymer stabilisation is achieved through combination
of soil suction and hydrogels. These “hydrogels” can be defined as chemically or physically cross-
linked polymers having a hydrophilic structure which allows them to absorb water into their
three-dimensional porous structure and to swell without dissolving (Brax et al., 2017). From
this definition, it appears that the hydrogels form porous structures whose physical state is
between a liquid and a solid phase. Further to this, Ayeldeen et al.,(2016) through the use of
Scanning Electron Microscopy (SEM) imaging reported that the hydrogels of biopolymers
transform from a “rubbery” to “glassy” state with time. The nature of these transformations may
further be linked with functional groups of polymer backbone and side chains (Gerlach and
Arndt, 2009). However, the mechanical properties of these hydrogels during the transformation
is still uncertain. As XRCT scanning produces tomographs based on material properties, an
exploratory investigation was undertaken to obtain scans for biopolymer stabilised soil
specimens to visually inspect the physical nature of hydrogels in comparison to soil particles.
In this investigation, cylindrical specimens of dimension 36 mm diameter and 78 mm
height of soil mix 2-7-1 stabilised with 2% of biopolymer were prepared according to the
preparation method mentioned in section 3.3.2.1. The samples were prepared to achieve similar
density as those of UC test specimens and were cured in similar laboratory conditions. XRCT
images were obtained using an XRadia/Zeiss XRM-410 machine based at the Durham
University XCT service (ZEISS, 2014). Smith (2015) noted that the XRM-410 can perform scans
for samples up to 300mm diameter at different resolution from 1 to 40 µm, however, it was also
reported that XRM-410 took a considerable amount of time to scan samples with large
dimensions at higher resolutions. Effectively one has to balance the desire for high resolution
with a corresponding smaller field of view. Hence, arriving at optimised scan parameters for a
Voids
(least dense
space)
Soil particle
(highly
dense space)

Chapter 3. Biopolymer Stabilisation
87
sample with known dimensions, could enable one to reduce the scan time. In this investigation,
a resolution of 8.5 µm was obtained, which was similar to the study in Beckett et al.,(2013) also
for earthen construction materials. For a given specimen, after 7 days of curing, the sample was
scanned in the XRCT machine. For this resolution, the typical scan lasted about 14-16 hours.
After the completion of the scan, the sample was then shifted back to the laboratory to cure. The
specimen was scanned again after 28 days of curing.
3.3.4.3. Qualitative analysis
XRCT tomographies were processed into 2-D slices across the diameter of the specimens. Due to
the restriction of space here, only one slice for each sample at particular curing period is
presented. Figs 3.21a and 3.21b, show the 2-D slice for the samples stabilised with guar gum at
7 and 28 days respectively, while Figs 3.16c and 3.16d are for the xanthan gum stabilised
specimens.
Figure 3.21. XRCT Scan images for guar gum (a & b) and xanthan gum (c & d) stabilised
specimens after 7 and 28 days respectively.

Chapter 3. Biopolymer Stabilisation
88
The brightest regions correspond to the densest material in the specimen such as gravel or
coarse sand portions of the soil mix, while the darkest regions correspond to pore spaces which
have low or zero density. The main intention of these scans was to capture the transformation
of hydrogels from “rubbery” to “glassy” state as noted by Ayeldeen et al.,(2016), however,
hydrogels are necessarily three-dimensional porous structure(Brax et al., 2017). Being porous,
hydrogels may also have less significant attenuation effects on x-rays and thus at this resolution
it was not possible to capture the network of hydrogel formation, which was expected to be there.
However, it was noted that both the biopolymer stabilised earthen materials had slight
variations in void spaces between 7 and 28 days of curing period (highlighted portions shown in
Fig 3.21). Compared to the xanthan gum stabilised earthen material, this rearrangement was
more evident for guar gum stabilised specimens. Though this preliminary investigation was not
able to capture hydrogel formation at this level of resolution, it is evident that the addition of
biopolymer has a noticeable effect on the macrostructure of the stabilised material. Scanning
was undertaken on a sample with smaller dimensions and results were quantitatively analysed
to compare the differences between unamended and stabilised samples. Detailed discussions
about these analyses are presented in the next chapter.
3.3.5 Preliminary durability tests
Durability is a key parameter which determines the acceptance of earthen construction material
as a building material. As noted in the previous chapter, international standards across the
world recommend different durability tests. Standard durability tests like ASTM D559(1989)
and IS 1725(2013) are primarily aimed at the assessment of cement stabilised earthen
materials; however, use of these tests to assess earthen materials amended using alternative
stabilisers may not be appropriate. Hence, based on the stabiliser chosen an appropriate
durability test procedure needs to be adopted. In this preliminary campaign to assess durability
performance of biopolymer stabilised earthen material, the water erosional test, i.e. the
“Geelong” test as prescribed by New Zealand technical standard (NZS 4298, 1998) was chosen.
3.3.5.1. Sample preparation and testing methodology
To assess the durability performance of biopolymer stabilised earthen construction materials,
earthen cubes with 150 mm sides, stabilised with 1.5% of biopolymer content, were prepared.
For the preparation, all the ingredients were dry mixed initially and later water was added and
mixed thoroughly for 10-15 minutes using a mechanical mixer. The bulk soil mix was then
divided into three equal parts and introduced to the mould one part at a time. Using a vibratory
hammer, each layer was compacted to the required density. These steps were repeated for all
the three portions. All blocks were compacted to achieve identical initial dry density as that of
the unconfined compressive test specimens described in section 3.3.2.1. Once the block was
moulded, it was taken out carefully and left to air cure at a relative humidity of 50% and

Chapter 3. Biopolymer Stabilisation
89
temperature of 210C. After 7 and 28 days of curing, the earthen blocks were tested for resistance
against water erosion as per the test procedure described in the code.
Figure 3.22. Test setup for durability test as per NZS 4298 (1998)
Figure 3.22 shows the test setup for performing the Geelong test. The test procedure
involves dripping 100ml of water from a height of 400mm on to the surface of a prepared earthen
block kept at an inclination of 2H:1V. 100ml of water is applied within a time period of 20-60
minutes. After dripping is complete, the surface of the block is wiped using a wire brush to
remove the eroded soil particles and the depth of erosion is measured using a Vernier calliper
with a depth gauge having a precision of 0.02mm. According to the standard, if the depth of
erosion is within 5mm from surface, the earthen construction material is considered to have
passed the erosion tests.
3.3.5.2. Test results
Figures 3.23a and 3.23b show the eroded surfaces of the earthen blocks stabilised with guar
gum and xanthan gum respectively at 7 days of aging. Table 3.7 presents the depth of erosion
for both earthen blocks are 7 and 28 days respectively. The measured depth of erosion for both
blocks was within 5 mm and this eroded depth is well within permissible limits of NZDS 4298
(1998) corresponding to an erodibility index of 3. Similar behaviour was observed at 28 days. It
was noted that the surface exposed to dripping was intact after durability tests for both the

Chapter 3. Biopolymer Stabilisation
90
blocks stabilised with guar gum and xanthan gum respectively. Against varying atmospheric
conditions, the physical appearance of earthen materials was also assessed. It was noted that
for the guar gum stabilised block, the sides and edges had worn off, while for the xanthan gum
stabilised block these areas remained intact.
Figure 3.23. Eroded surface after durability tests (a) guar gum and (b) xanthan gum
Table 3.7. Tests results of preliminary durability tests.
Combination Depth of erosion (mm)
7 day 28 day
Guar gum 0.75 0.85
Xanthan gum 0.25 0.30
This preliminary campaign was to assess the potential of these biopolymers as
stabilisers for earthen construction materials, it being important that any new materials were
both strong enough and possessed good durability. The results suggest that biopolymer
stabilised earthen materials perform satisfactorily and indicate both biopolymers have potential
of being an alternative to cement as a stabiliser. Further erosional tests have been carried out
with varying sample geometry. Furthermore, other durability tests such as dip, contact and
suction tests which emulate capillary rise deterioration and sudden submergence have been
performed for biopolymer stabilised earthen construction materials. Results of this detailed
durability studies are presented in Chapter 5 of the thesis.
3.4 Concluding remarks
Based on this initial investigation on biopolymer stabilisation, important aspects of biopolymer
soil stabilisation are summarised below.
(a) (b)

Chapter 3. Biopolymer Stabilisation
91
1. Based on the strength tests, it can be noted that under ambient conditions, both soil suction
and hydrogel formation appear to contribute to the overall strength of the biopolymer
stabilised earthen material.
2. The nature in which these hydrogels interact with soil particles is dependent on the intrinsic
characteristics of the biopolymer used. As a neutrally charged polysaccharide, guar gum
essentially interacts with soil and water through hydrogen bonding, while xanthan gum
which is an anionic polysaccharide interacts through hydrogen and ionic bonding.
3. The nature of hydrogel interaction with soil particles has due influence on mechanical
behaviour especially the tensile strength and soil modulus. It was noted that the additional
ionic bonding of xanthan gum appeared to lead to higher tensile strengths of the stabilised
earthen material.
4. For both biopolymers, about 1.5% of biopolymer content of the dry soil mass was sufficient to
achieve comparable compressive strength of 8.0% cement stabilised earthen material.
However, comparable tensile strength was only achieved by xanthan gum stabilised earthen
material at 2.0% of biopolymer content.
5. There was no drastic improvement in strength for earthen construction materials stabilised
with biopolymers in synergy. However, research findings from this investigation which
highlights the potential of biopolymer synergy may be useful from a mechanical point of view
if use of biopolymers in combination is found to be more environmentally sustainable.
6. Initial XRCT scans could not capture the hydrogel formation at the chosen resolution.
However, slight changes in particle re-arrangement were noted for scans between 7- and 28-
days curing period.
7. Preliminary durability tests indicate that earthen materials stabilised with these
biopolymers have satisfactory performance. Between biopolymers, xanthan gum stabilised
earthen material had better performance.
It can be observed from strength tests that both soil suction and hydrogel formation
contribute to strength of biopolymer stabilised earthen material. While, XRCT scans reveal
addition of biopolymer may have an influence on soil structure. To further the understanding of
biopolymer stabilisation, geotechnical characterisation of biopolymer stabilised earthen
construction material is undertaken which is presented in the next chapter of the thesis.
Preliminary durability tests indicate both guar and xanthan gums show potential of being an
alternative stabiliser for earthen construction materials. In order to understand the potential of
biopolymer stabilised earthen material as a building material, detailed durability performance,
hygroscopic behaviour and recycling potential have been evaluated. The results of this
assessment are presented in Chapter 5 of the thesis.

Chapter 3. Biopolymer Stabilisation
92
References
AFNOR. 2001. XP P13-901; Compressed earth blocks
for walls and partitions: definitions –
Specifications – Test methods – Delivery
acceptance conditions.
Araki H, Koseki J, and Sato T. 2016. Tensile strength
of compacted rammed earth materials. Soils and
Foundations, 56(2), 189–204.
ASTM-D559. 1989. Wetting and Drying Compacted
Soil- Cement Mixtures. Philadelphia: American
Society for Testing and Materials.
Ayeldeen MK, Negm AM, and El Sawwaf MA. 2016.
Evaluating the physical characteristics of
biopolymer/soil mixtures. Arabian Journal of
Geosciences, 9(5), 329–339.
Beckett C. 2011. The Role of Material Structure in
Compacted Earthen Building Materials:
Implications for Design and Construction.
Durham University. Retrieved from
http://etheses.dur.ac.uk/3313/
Beckett C, Augarde CE, Easton D, and Easton T. 2017.
Strength characterisation of soil-based
construction materials. Géotechnique.
Beckett C, Hall MR, and Augarde CE. 2013.
Macrostructural changes in compacted earthen
construction materials under loading. Acta
Geotechnica, 8(4), 423–438.
Brax M, Buchmann C, and Schaumann GE. 2017.
Biohydrogel induced soil-water interactions:
how to untangle the gel effect? A review. Journal
of Plant Nutrition and Soil Science, 180(2), 121–
141.
BS-EN-197-1. 2011. Cement Part 1: Composition,
specifications and conformity criteria for
common cements. London: BSI.
BS 1377-2. 1990. Methods of test for Soils for civil
engineering purposes - Part 2 : Classification
tests. London: BSI.
BS 1377-4. 1990. Methods of test for Soils for civil
engineering purposes - Part 4 : Compaction
tests. London: BSI.
BS 1377-7. 1990. Methods of test for Soils for civil
engineering purposes - Part 7 : Shear strength
tests (total stress). London: BSI.
Bui QB, and Morel JC. 2009. Assessing the anisotropy
of rammed earth. Construction and Building
Materials, 23(9), 3005–3011.
Bui QB, Morel JC, Hans S, and Walker P. 2014. Effect
of moisture content on the mechanical
characteristics of rammed earth. Construction
and Building Materials, 54, 163–169.
Bui TT, Bui QB, Limam A, and Maximilien S. 2014.
Failure of rammed earth walls: From
observations to quantifications. Construction
and Building Materials, 51, 295–302.
Burroughs S. 2008. Soil Property Criteria for Rammed
Earth Stabilization. Journal of Materials in Civil
Engineering, 20(3), 264–273.
Cabalar AF, and Canakci H. 2011. Direct shear tests
on sand treated with xanthan gum. Proceedings
of the ICE - Ground Improvement, 164, 57–64.
Cao J, Jung J, Song X, and Bate B. 2017. On the soil
water characteristic curves of poorly graded
granular materials in aqueous polymer
solutions. Acta Geotechnica.
Casas JA, Mohedano AF, and García‐Ochoa F. 2000.
Viscosity of guar gum and xanthan/guar gum
mixture solutions. Journal of the Science of Food
and Agriculture, 80(12), 1722–1727.
Chan C-M, and Low L-P. 2014. Development of a
Strength Prediction Model for “Green”
Compressed Stabilised Earthbricks. Journal of
Sustainable Development, 3(3), 140–150.
Chang I, Im J, and Cho G-C. 2016. Introduction of
Microbial Biopolymers in Soil Treatment for
Future Environmentally-Friendly and
Sustainable Geotechnical Engineering.
Sustainability, 8(3), 251.
Chang I, Im J, Prasidhi AK, and Cho G-C. 2015. Effects
of Xanthan gum biopolymer on soil
strengthening. Construction and Building
Materials, 74(10), 65–72.
Chang I, Kwon Y-M, Im J, and Cho G-C. 2018. Soil
consistency and inter-particle characteristics of
xanthan gum biopolymer containing soils with
pore-fluid variation. Canadian Geotechnical
Journal, (October), cgj-2018-0254.
Chen R. 2014. Bio Stabilisation for Geopolymer
Enchancement and Mine tailings Dust Control.
The University of Arizona. Retrieved from
http://hdl.handle.net/10150/319999
Chen R, Zhang L, and Budhu M. 2013. Biopolymer
Stabilization of Mine Tailings. Journal of
Geotechnical and Geoenvironmental
Engineering, 139(October), 130128212232006.
Chudzikowski RJ. 1971. Guar gum and its
applications. Journal of the Society of Cosmetic
Chemists, 22(1), 43–60.
CRATerre-EAG. 1998. CDI, Compressed earth blocks:
Standards – Technology series No.11.
Brussels:CDI.
Cristelo N, Glendinning S, Miranda T, Oliveira D, and
Silva R. 2012. Soil stabilisation using alkaline
activation of fly ash for self compacting rammed
earth construction. Construction and Building
Materials, 36, 727–735.
Decagon Devices. 2015. WP4C WATER POTENTIAL
METER. Retrieved June 8, 2017, from
http://www.decagon.com/en/soils/benchtop-
instruments/wp4c-water-potential-meter/
Decagon Devices I. 2007. Dewpoint PotentiaMeter.
WP4C PotenciaMeter. Operator`s Manual,
Version 2, 66. Retrieved from www.decagon.com

Chapter 3. Biopolymer Stabilisation
93
Etzion Y, and Saller M. 1987. Earth Construction—A
Review of Needs and Methods. Architectural
Science Review, 30(2), 43–48.
Fitzmaurice R. 1958. Manual on stabilized soil
construction for housing. New York: United
Nations, Technical Assistance Programme.
Garcıa-Ochoa F, Santos VE, Casas JA, and Gomez E.
2000. Xanthan gum: production, recovery, and
properties. Biotechnology Advances, 18(7), 549–
579.
Gerlach G, and Arndt K-F. 2009. Hydrogel sensors and
actuators: engineering and technology (Vol. 6).
Springer Science & Business Media.
Gomes MI, Lopes M, and de Brito J. 2011. Seismic
resistance of earth construction in Portugal.
Engineering Structures, 33(3), 932–941.
Hall M, and Djerbib Y. 2004. Rammed earth sample
production: context, recommendations and
consistency. Construction and Building
Materials, 18(4), 281–286.
Hallal MM, Sadek S, and Najjar SS. 2018. Evaluation
of Engineering Characteristics of Stabilized
Rammed-Earth Material Sourced from Natural
Fines-Rich Soil. Journal of Materials in Civil
Engineering, 30(11), 4018273.
Helliwell JR, Sturrock CJ, Grayling KM, Tracy SR,
Flavel RJ, Young IM, … Mooney SJ. 2013.
Applications of X-ray computed tomography for
examining biophysical interactions and
structural development in soil systems: a review.
European Journal of Soil Science, 64(3), 279–
297.
Houben H, and Guillaud H. 1994. Earth construction:
a comprehensive guide. Intermediate
Technology Publications.
IMERYS. 2007. Speswhite China Clay - Data sheet
(Vol. 44). Ilford, Essex.
Intralabs. 2016a. Guar gum: product information.
Retrieved May 17, 2019, from
http://www.intralabs.co.uk/guar-gum.html
Intralabs. 2016b. Xanthan gum: product information.
Retrieved May 17, 2019, from
http://www.intralabs.co.uk/xanthan-gum.html
IS 1725. 2013. Indian Standard IS 1725: Stabilized soil
blocks used in general building construction —
Specification. New Delhi: Bureau of Indian
Standards.
Jang D-J, Frost JD, and Park J-Y. 1999. Preparation of
epoxy impregnated sand coupons for image
analysis. Geotechnical Testing Journal, 22(2),
153–164.
Jaquin PA, Augarde CE, Gallipoli D, and Toll DG.
2009. The strength of unstabilised rammed
earth materials. Géotechnique, 59(5), 487–490.
Jiménez Delgado MC, and Guerrero IC. 2007. The
selection of soils for unstabilised earth building:
A normative review. Construction and Building
Materials, 21(2), 237–251.
Katzbauer B. 1998. Properties and applications of
xanthan gum. Polymer Degradation and
Stability, 59(1–3), 81–84.
Kocherbitov V, Ulvenlund S, Briggner L-E, Kober M,
and Arnebrant T. 2010. Hydration of a natural
polyelectrolyte xanthan gum: Comparison with
non-ionic carbohydrates. Carbohydrate
Polymers, 82(2), 284–290.
Krishna Leela J, and Sharma G. 2000. Studies on
xanthan production from Xanthomonas
campestris. Bioprocess Engineering, 23(6), 687–
689.
Lakshmikantha MR, Prat PC, and Ledesma A. 2012.
Experimental evidence of size effect in soil
cracking. Canadian Geotechnical Journal, 49(3),
264–284.
Latifi N, Horpibulsuk S, Meehan CL, Majid MZA, and
Rashid ASA. 2016. Xanthan gum biopolymer: an
eco-friendly additive for stabilization of tropical
organic peat. Environmental Earth Sciences,
75(9).
Liu Q, and Tong L. 2017. Engineering properties of
unstabilized rammed earth with different clay
contents. Journal of Wuhan University of
Technology-Mater. Sci. Ed., 32(4), 914–920.
Lo Y-M, Yang S-T, and Min DB. 1997. Ultrafiltration
of xanthan gum fermentation broth: Process and
economic analyses. Journal of Food Engineering,
31(2), 219–236.
Maniatidis V, and Walker P. 2003. A Review of
Rammed Earth Construction. Bath, United
Kingdom.
Mooney SJ, Pridmore TP, Helliwell J, and Bennett MJ.
2012. Developing X-ray Computed Tomography
to non-invasively image 3-D root systems
architecture in soil. Plant and Soil, 352(1–2), 1–
22.
MOPT. 1992. Bases Para el Diseño y Construcción con
Tapial. Madrid, Spain: Centro de Publicaciones,.
Secretaría General Técnica, Ministerio de Obras
Públicas y Transportes.
Nearing MA, Parker SC, Bradford JM, and Elliot WJ.
2010. Tensile Strength of Thirty-Three
Saturated Repacked Soils. Soil Science Society of
America Journal, 55(6), 1546.
Nugent RA, Zhang G, and Gambrell RP. 2009. Effect of
Exopolymers on the Liquid Limit of Clays and
Its Engineering Implications. Transportation
Research Record: Journal of the Transportation
Research Board, 2101(1), 34–43.
NZS 4297. 1998. Engineering design of earth buildings
(Vol. 4297). Wellington: Standards New
Zealand.
NZS 4298. 1998. Materials and workmanship for earth
buildings [Building Code Compliance Document
E2 (AS2)]. New Zealand Technical Committee.
Wellington: Standards New Zealand.
Qureshi MU, Chang I, and Al-Sadarani K. 2017.
Strength and durability characteristics of

Chapter 3. Biopolymer Stabilisation
94
biopolymer-treated desert sand. Geomechanics
and Engineering, 12(5), 785–801.
Reddy B, and Jagadish KS. 1995. Influence of soil
composition on the strength and durability of
soil-cement blocks. Indian Concrete Journal,
69(9), 517–524.
Reddy B, Lal R, and Rao KN. 2007. Optimum Soil
Grading for the Soil-Cement Blocks. Journal of
Materials in Civil Engineering, 19(2), 139–148.
Rigby SP, Chigada PI, Wang J, Wilkinson SK,
Bateman H, Al-Duri B, … Miri T. 2011.
Improving the interpretation of mercury
porosimetry data using computerised X-ray
tomography and mean-field DFT. Chemical
Engineering Science, 66(11), 2328–2339.
Roscoe K. 1970. The Influence of Strains in Soil
Mechanics. Géotechnique, 20(2), 129–170.
Smith J. 2015. Examining Soil Based Construction
Materials through X-Ray Computed
Tomography. Durham University.
https://doi.org/ear
Stirling RA, Hughes P, Davie CT, and Glendinning S.
2015. Tensile behaviour of unsaturated
compacted clay soils - A direct assessment
method. Applied Clay Science, 112–113, 123–
133.
Towner GD. 1987. The mechanics of cracking of drying
clay. Journal of Agricultural Engineering
Research, 36(2), 115–124.
Walker P, Keable R, Martin J, and Maniatidis V. 2005.
Rammed Earth: Design and Construction
Guidelines. Watford: BRE Bookshop Watford.
Walker P, and Stace T. 1997. Properties of some cement
stabilised compressed earth blocks and mortars.
Materials and Structures/Materiaux et
Constructions, 30(203), 545–551.
Wellington SL, and Vinegar HJ. 1987. X-ray
computerized tomography. Journal of Petroleum
Technology, 39(8), 885–898.
Young IM, and Crawford JW. 2004. Interactions and
self-organization in the soil-microbe complex.
Science, 304(5677), 1634–1637.
ZEISS. 2014. ZEISS Xradia 410 Versa Submicron X-
ray Imaging : Bridge the Gap in Lab-based
Microscopy. Jena, Germany: Carl Zeiss
Microscopy GmbH. Retrieved from
https://www.zeiss.com/microscopy/int/products/
x-ray-microscopy/zeiss-xradia-410-versa.html
Zhao X. 2014. Measurements and transient multistep
outflow simulation of soil-water characteristic
curve for soils modified with biopolymers.

95
Chapter 4
Geotechnical characterisation of
biopolymer stabilised earthen construction
material
4.1 Chapter Introduction
Geotechnically, an earthen construction material can be considered to be a compacted soil
mixture placed to form a structural unit such as a wall (Gallipoli et al., 2014). The compacted
soil mixture is placed at a certain water content, the material is then allowed to dry to gain
strength and in this condition the material is unsaturated. Further, during its time in-situ, the
earthen construction material is exposed to different in-situ conditions which would alter the
water content of the material and thereby its strength. In the case of unstabilised earthen
construction materials, the change in material strength occurring due to water content
variations can be linked with soil suction. Works by Jaquin et al.,(2009) and Bui et al.,(2014)
describe the role of soil suction influencing the mechanical properties of earthen construction
materials. Subsequent research studies have attempted to characterise earthen construction
materials through concepts of unsaturated soil mechanics (Gerard et al., 2015; Beckett et al.,
2017). Results from unconfined compression and tensile tests presented in Chapter 3 indicate
that the strength of a biopolymer stabilised soil is derived from a combination of soil suction and
hydrogel formation. As a continuation to understand the role of soil suction and hydrogel
formation on hydraulic and mechanical properties of biopolymer stabilised soils, further
investigations were carried out. The testing procedure and results of these investigations are
presented in this chapter.
4.2 Shear Strength of Unsaturated soils
As discussed in Chapter 2, the shear strength of saturated soil is usually evaluated in terms of
the Mohr Coulomb (MC) failure criterion (see Section 2.3). In the case of unsaturated soil, the
strength behaviour is typically described through an extended Mohr Coulomb (EMC) failure
criterion as formulated by Fredlund et al.,(1973). The stress state variables namely, net normal
stress (𝜎 − 𝑢𝑎) and matric suction (𝑢𝑎 − 𝑢𝑤) are commonly used to define the EMC failure
envelope. In the form of an equation, the shear strength of unsaturated soil is expressed as
follows:
𝜏𝑓 = 𝑐′ + (𝜎 − 𝑢𝑎)𝑓 tan ′ + (𝑢𝑎 − 𝑢𝑤)𝑓tan 𝑏
(4.1)

Chapter 4. Geotechnical Characterisation
96
where,
𝜏𝑓 is the shear stress at failure,
𝑐′ is intercept of the “extended” Mohr-Coulomb failure envelope on the shear stress axis where
the net normal stress and the matric suction at failure are equal to zero.
(𝜎 − 𝑢𝑎)𝑓 is net normal stress state on the failure plane at failure
𝜎 is the total normal stress at failure
(𝑢𝑎 − 𝑢𝑤)𝑓 is the matric suction on the failure plane at failure
𝑢𝑤 is the pore-water pressure at failure
𝑢𝑎 is the pore-air pressure at failure
′ is the effective angle of internal friction
𝑏 is the angle indicating the rate of increase in shear strength relative to the matric suction.
Figure 4.1 Illustration of the extended Mohr-Coulomb failure criterion.
The first two terms on the right hand side of the extended Mohr-Coulomb equation (4.1)
describes the relation between shear strength and normal stress. Similar to a saturated soil, the

Chapter 4. Geotechnical Characterisation
97
shear strength of unsaturated soil increases with net normal stress. On the other hand, the
effect of matric suction on shear strength is different to that of normal stress (Jennings and
Burland, 1962). The effect of matric suction is captured by the last term on the right hand side
of Equation 4.1, i.e. (𝑢𝑎 − 𝑢𝑤)𝑓 tan 𝑏. In the extended Mohr-Coulomb failure envelope, Mohr
circles corresponding to the failure are plotted in three-dimensions. Figure 4.1 illustrates a
typical extended Mohr-Coulomb failure envelope for unsaturated soils. In the three-dimensional
plot, shear stress,𝜏 is ordinate, while the two stress variables namely, net normal stress (𝜎 − 𝑢𝑎)
and matric suction (𝑢𝑎 − 𝑢𝑤) are abscissas. The Mohr circles for unsaturated soils are plotted
with respect to net normal stress axis, similar to Mohr circles of saturated soils. However, in the
plot, the location of the Mohr circle is a function of matric suction of the soil. The planar surface
which is tangent to all the Mohr circles at different matric suctions is referred to as the extended
Mohr-Coulomb failure envelope for the unsaturated soil. It is clear from the above description
that to develop an EMC failure envelope for an unsaturated soil, laboratory determination of
net normal stress and soil suction are essential.
Gerard et al., (2015) measured total suction for air dried rammed earth materials using
the vapour equilibrium method. It was observed that under the ambient conditions (40 %
relative humidity and 200C temperature), the total suction of the air-dried rammed earth was
125 MPa. When the humidity level was changed to 97 %, the total suction of the material reduced
to 4 MPa. Beckett et al.,(2017) in their study to characterise air dried rammed earth material
observed total suctions in the range of 14 – 174 MPa under constant temperature of 200C and
varying humidity levels of 30 – 90%. In Chapter 3, the values of total suction of the material
determined through dew point potentiometer after the strength tests were in range of 80 – 125
MPa. From the above discussion, it is clear that, under ambient conditions, an earthen
construction material has high suction (> 4 MPa). In this scenario, it is appropriate to
understand the mechanical and hydraulic behaviour of the earthen construction material which
is under this high suction regime. However, laboratory estimation of matric suction presents
difficulties as current available laboratory techniques measure suction values only up to 1.5
MPa (Lu and Likos, 2004). Hence, in this study, to characterise earthen construction materials
determination of total suction was considered to be more appropriate rather than matric suction.
Further, in high suction regimes, values of total and matric suctions are comparable as the effect
of osmotic suction in this regime would be negligible.
4.3 Experimental Programme
As discussed previously, the shear strength of an unsaturated soil is dependent on soil suction.
The strength tests presented in Chapter 3 suggest that the strength of biopolymer stabilised
soils is due to the combination of soil suction and hydrogel formation. In order to obtain a deeper
understanding on how biopolymers affect shear strength parameters and soil suction with aging,
an experimental programme to determine hydraulic and mechanical properties of guar and

Chapter 4. Geotechnical Characterisation
98
xanthan gum stabilised soils was formulated. To obtain hydraulic properties, soil-water
retention curves for biopolymer stabilised soils were determined, while for the mechanical
properties, strength tests in the form of triaxial tests at different designated curing periods were
conducted. Further, to understand the effect of biopolymers on soil structure with aging due to
hydrogel formation, X-ray computed tomography scanning of biopolymer stabilised soils at
designated curing periods was undertaken.
4.4 Suction tests
4.4.1 Testing methodology
In the study of Beckett et al.,(2017), total suction for an air dried rammed earth material varied
from 14 MPa (at higher humidity) to 174 MPa (at low humidity). Considering these high suction
values, it was decided for the present investigation, total suction measurement would be
undertaken using a WP4c dew point potentiometer(Decagon Devices, 2015). In the present
investigation, suction specimens of 35 mm diameter and 8 mm thickness which can easily fit
into the sample cup of the WP4c dew point potentiometer were prepared to obtain total suction
values in the high suction regime. In order to eliminate the effect of maximum particle size on
the sample, an engineered soil mix passing through a 2.0 mm sieve was used to prepare the
specimen. Unamended, guar and xanthan gum stabilised suction specimens were prepared for
this investigation. The stabiliser content for biopolymer stabilised specimens was maintained at
2.0% of dry soil mass.
Figure 4.2. Suction tests, (a) Specimen mould used to prepare suction specimens and (b)
Moisture content tin containing suction cup and specimen.
In order to make suction specimens, the required quantities (on a mass basis) of the
ingredients (80% sand passing through 2.0 mm sieve, 20 % kaolin and biopolymer) were weighed
and initially dry mixed. For the stabilised specimens, biopolymer was pre-mixed with the dry
soil mixture. After dry mixing, water equivalent to optimum water content and additional water
required for making soil mix workable (for biopolymer stabilised specimens) was added and
mixed thoroughly (See Section 3.3.2.1). The bulk soil mix was then introduced into a mould
specifically fabricated for preparing suction specimens (Figure 4.2a). The bulk soil mix was then
(b) (a)

Chapter 4. Geotechnical Characterisation
99
compacted to achieve the desired density. The freshly prepared specimen was then carefully
transferred to the suction cup (used for determining total suction using WP4c dew point
potentiometer) to determine total suction. Subsequently, the time and the mass of the moisture
content tin cup containing the suction cup with soil specimen were recorded. The specimen was
then left to dry under laboratory conditions (temperature of 21°C and relative humidity (RH)
varying between 45 – 70%). Total suction, time and mass of specimen were recorded periodically
for 28 days. At the end of 28 days, after recording the final mass, the specimen was removed
from the suction cup and water content was determined using the same moisture content tin.
Based on the mass of suction cup and final dry mass of the specimen, the water content of the
specimen at different periods was back calculated. From this exercise, total suction and
corresponding gravimetric water content at different time periods were obtained. The tests were
performed for three replicates of specimens.
4.4.2 Test results
4.4.2.1. Suction test results
The results obtained from suction tests, i.e. total suction and corresponding gravimetric water
content values were plotted against time for unamended, guar and xanthan gum stabilised soils
in Figures 4.3, 4.4 and 4.5 respectively. The total suction values corresponding to maximum and
minimum humidity levels of the laboratory were determined using the Kelvin equation (4.1). As
a reference, total suction values corresponding to maximum and minimum humidity changes
have been included in these plots. The Kelvin equation is given by,
= − 𝜌𝑤𝑅𝑇
𝑤𝑣
ln(𝑅𝐻) (4.1)
where,
is Total suction, R is universal gas constant, T is absolute temperature, 𝜌𝑤 is the density of
water, and 𝑤𝑣 is the molecular mass of water vapour (Lu and Likos, 2004).
From Figures 4.3 to 4.5, it is obvious that under ambient conditions in the laboratory,
the specimen starts to dry, which increases soil suction while water content decreases. In each
of the plots, the change in water content due to drying can be divided into three distinct regions.
These three distinct regions relate to different stages of evaporation which occur from the soil.
As reported by Hillel(1980), the drying of water from the soil surface occurs in three different
phases. The maximum rate of drying occurs when the soil is near to its saturation and the drying
is controlled by climatic conditions. During this phase, within the soil, the largest pores start to
desaturate when it reaches its limiting suction, and at this stage, air starts to enter the soil. In
the second phase of drying, the soil conductive properties no longer allow easy movement of
water molecules within the soil pores. In this phase, there is a steep decrease in water content
as finer pores start to desaturate. Lastly, in the residual phase, the drying of water occurs slowly
and mainly due to the process of vapour diffusion. In this residual phase, the suction is basically

Chapter 4. Geotechnical Characterisation
100
in the residual zone of the SWRC, where only small changes in water content occur even from a
high variation of suction. In this phase, water is primarily held as absorbed water on clay
particles rather than capillary water(McQueen and Miller, 1974). Wilson(1994) notes that the
rate of drying during this phase is controlled by ambient conditions and soil properties such as
hydraulic conductivity and vapour diffusivity.
Figure 4.3. Variation of total suction and change in gravimetric water content with drying
time of unamended specimens.
Initial observations may suggest that the rate of drying for all the three combinations is
similar during the first two phases of drying, however, on closer examination it can be seen that
there are slight variations. To have a better insight to the rate of drying for all combinations, an
additional graph has been plotted which compares the first two phases of drying for unamended,
guar and xanthan gum stabilised specimens (Figure 4.6). As seen from Figure 4.6, the higher
initial water contents for biopolymer stabilised specimens may be linked to the additional water
added on top of optimum moisture content to the soil-mix to make it workable. It is interesting
to note that, in the second phase of drying, the rate of drying for guar gum stabilised specimens
is higher than unamended and xanthan gum stabilised specimens. The plots for the guar gum
stabilised specimens have steeper slopes than unamended and xanthan gum stabilised
specimens. Though guar gum has higher affinity towards water than xanthan gum (Nugent et
al., 2009), it appears that, on drying, water tends to escape easily from the stabilised soil
specimen. This may be due to the fact that the water molecules are loosely held by biopolymer
chains through weak chemical bonds such as hydrogen bonds. In the case of the xanthan gum
stabilised specimens, the rate of drying is similar to that of unamended soil specimen, indicating
that the hydrogel bonding is not so significant during this phase to slow the rate of drying.

Chapter 4. Geotechnical Characterisation
101
Figure 4.4. Variation of total suction and change in gravimetric water content with drying
time of guar gum stabilised specimens
Figure 4.5. Variation of total suction and change in gravimetric water content with drying
time of xanthan gum stabilised specimens

Chapter 4. Geotechnical Characterisation
102
Figure 4.6. Comparison of variation of total suction and change in gravimetric water content
with time of all specimens
In the residual phase of drying, the change in water content of the soil primarily occurs
through vapour diffusion, which is dependent on ambient conditions and soil properties (Wilson
et al., 1994). In the present investigation, drying was undertaken in a laboratory having a
controlled temperature facility but varying humidity conditions. In this condition, it may be
expected that when the specimen is in the residual zone, it may diffuse or absorb water from the
immediate surroundings due to humidity changes. The effect of humidity changes can be noticed
through variation of total suction in residual zone. In the case of an unamended specimen, apart
from the humidity changes, the total suction may also be affected due to vapour absorption or
diffusion caused by the principal clay mineral. Compared to an unamended specimen,
biopolymer stabilised specimens have lower total suction variations which means they retain
more water and are less susceptible to humidity changes. The vapour absorption/diffusion of
biopolymer stabilised specimens is dependent on biopolymer type, state, temperature and
humidity (Kocherbitov et al., 2010; Chen et al., 2019). Under similar ambient conditions, the
variation in total suction values of biopolymer stabilised specimens may be associated with the
biopolymer type and hydrogel state. As regards biopolymer type, xanthan gum, which has better
water absorption capabilities than guar gum (Torres et al., 2012), has retained more water and
hence the observed total suction values are lower. With respect to hydrogel state, they may be
in the process of transformation from being in a rubbery to a glassy state. In this condition they

Chapter 4. Geotechnical Characterisation
103
may have not reached complete equilibrium with the laboratory conditions which may also affect
vapour absorption/diffusion of biopolymer stabilised specimens.
4.4.2.2. Soil water retention curve
A soil water retention curve is the most appropriate way to present the functional relationship
between soil suction and water content (Nuth and Laloui, 2008). Suction measurements during
strength tests as presented in Chapter 3 indicate that the biopolymers affect soil water retention
properties of the stabilised soil. In the past, very few studies have attempted to understand the
effect of biopolymers on soil water retention. Zhao(2014) and Cao et al.,(2017) using a Tempe
cell measured soil water retention curves (SWRCs) for poorly graded sand initially saturated
with water and biopolymer solutions. It was noted that the suction of sand treated with xanthan
solution at 2 g/l concentration was higher than that of unamended sand. Tran et al.,(2017) using
capillary rise open tube method found difficulty in estimating the wetting SWRC of xanthan
gum stabilised sand, due to the long periods required for the material to come to equilibrium
during the tests. It is evident from these two studies that biopolymers affect soil water retention
properties and it is important to determine SWRCs for biopolymer stabilised earthen
construction materials to understand the effect of biopolymer on soil suction, water content and
potentially relate it to its strength.
There are reported studies which have attempted to determine SWRCs of soil used for
manufacturing earthen construction material (Bui et al., 2014; Beckett et al., 2015; Gerard et
al., 2015; Beckett et al., 2017). Gerard et al.,(2015) arrived at retention curves for unstabilised
rammed earthen material which was helpful for developing a unified failure criterion based on
Bishop’s effective framework to predict the strength of the material. Beckett et al.,(2015)
studied the effect of a flocculating agent on two soil mixes (used for rammed earth construction)
by determining SWRCs for both untreated and treated soil mixes. It was noted that the addition
of flocculating agents increased the residual suction and residual degree of saturation of the
treated material. Later, based on the water retention properties developed for untreated soil
mixes, Beckett et al.,(2017) characterised the strength of rammed earth material through an
extended Mohr-Coulomb theory. From this discussion, it is evident that recent past studies have
used SWRCs to characterise the mechanical behaviour of earthen construction material is
essential.
In the present investigation, soil water retention curves are expressed in terms of total
suction and gravimetric water content. SWRCs for all the combinations considered are plotted
for total suction and water content readings obtained until the end of second phase of drying.
Figures 4.7, 4.8 and 4.9 present the SWRCs for unamended, guar gum and xanthan gum
stabilised soil mixes respectively. SWRCs are plotted for all three replicates specimens tested.
In each of the plots, the experimental data was fitted as per the fitting parameters recommended
by Fredlund and Xing (1994). Though the fitting parameters recommended by Fredlund and
Xing (1994) are primarily used for volumetric water content or degree of saturation, its use is
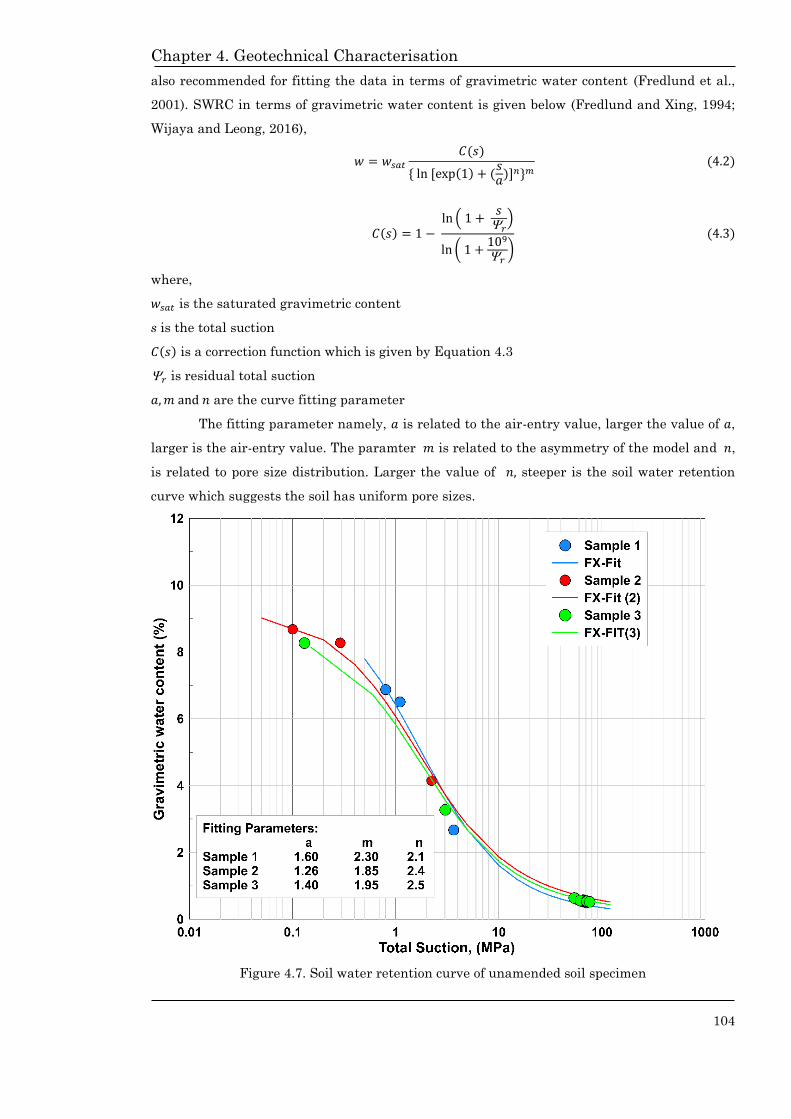
Chapter 4. Geotechnical Characterisation
104
also recommended for fitting the data in terms of gravimetric water content (Fredlund et al.,
2001). SWRC in terms of gravimetric water content is given below (Fredlund and Xing, 1994;
Wijaya and Leong, 2016),
𝑤 = 𝑤𝑠𝑎𝑡
𝐶(𝑠)
{ ln [exp(1) + (𝑠𝑎
)]𝑛}𝑚 (4.2)
𝐶(𝑠) = 1 − ln ( 1 +
𝑠𝑟
)
ln ( 1 +109
𝑟)
(4.3)
where,
𝑤𝑠𝑎𝑡 is the saturated gravimetric content
s is the total suction
𝐶(𝑠) is a correction function which is given by Equation 4.3
𝑟 is residual total suction
𝑎, 𝑚 and 𝑛 are the curve fitting parameter
The fitting parameter namely, 𝑎 is related to the air-entry value, larger the value of 𝑎,
larger is the air-entry value. The paramter 𝑚 is related to the asymmetry of the model and 𝑛,
is related to pore size distribution. Larger the value of 𝑛, steeper is the soil water retention
curve which suggests the soil has uniform pore sizes.
Figure 4.7. Soil water retention curve of unamended soil specimen

Chapter 4. Geotechnical Characterisation
105
Figure 4.8. Soil water retention curve of guar gum stabilised soil specimen
Figure 4.9. Soil water retention curve of xanthan gum stabilised soil specimen

Chapter 4. Geotechnical Characterisation
106
The SWRC for all combinations shows, the fitted suction is in the range of 0.5 – 120
MPa, while the experimentally determined suction is in the range of 0.5 – 65 MPa. For each
combination, the SWRC was determined for three specimens and it can be observed that the
curves for all specimens are consistent. In order to compare the water retention properties of
unamended, guar gum and xanthan gum stabilised specimens, SWRCs of each combination were
plotted together in Figure 4.10. It can be observed from Figure 4.10, for the range of water
contents, the suction values observed by the biopolymer stabilised soil specimens are higher
than unamended ones indicating that during the initial stages of biopolymer stabilisation when
the hydrogels are predominantly in “rubbery” state contributes in soil suction. Even at high
suctions, the amount of water retained by xanthan gum stabilised specimens are higher than
the other two combinations. The effect of biopolymer stabilisation is evident through increased
value of fitting parameter, 𝑎. With the addition of biopolymer, the absorbtive capacity of the
stabilised soil mix may have increased, which would have increased the air entry value. Between
biopolymers, the effect of xanthan gum on 𝑎 is higher than that of guar gum. With the changes
in fitting parameter, 𝑛 it appears that for the biopolymer stabilised specimens there would be
variation in its void size distribution.
Figure 4.10. Comparison of soil water retention curve for all combinations

Chapter 4. Geotechnical Characterisation
107
4.4.2.3. Scanning curve
An earthen construction material in service may either absorb or diffuse water from its
surroundings when exposed to ambient conditions. The variations in ambient conditions will
affect soil suction and corresponding water content. These conditions primarily reflect the water
retention properties of soil in residual conditions of SWRC. In residual conditions, the pore water
is primarily held as absorbed water on clay particles and to achieve this condition high suction
is required(McQueen and Miller, 1974). The change in residual water content of the soil
primarily occurs due to vapour diffusion(Hillel, 1980). On the other hand, wetting of the soil
occurs through vapour absorption. The variations of ambient conditions which affect soil suction
and water content can be related to scanning curves of SWRCs. As discussed in Chapter 2, when
a soil on a wetting path of SWRC is made to dry midway, it follows a flatter drying curve known
as scanning curve until the primary SWRC curve is reached (See Figure 2.15). Similarly, when
the soil is on a drying path of SWRC and made to wet midway, it follows a flatter wetting curve
until it reaches the primary wetting SWRC. In the present study, the soil specimens were left
to dry under ambient conditions to emulate the in-situ conditions of an earthen construction
material. It can be observed from the time versus suction graphs presented in Section 4.4.2.1,
that when the soil specimens are in the residual zone, there are variations in measured total
suction and water content readings. These variations can be expressed as scanning curves. The
scanning curves for unamended, guar gum and xanthan gum stabilised soils are presented in
Figures 4.11, 4.12 and 4.13 respectively.
Figure 4.11. Total suction versus gravimetric water content of unamended soil in residual
condition

Chapter 4. Geotechnical Characterisation
108
Figure 4.12. Total suction versus gravimetric water content of guar gum stabilised soil in
residual condition
Figure 4.13. Total suction versus gravimetric water content of xanthan gum stabilised soil in
residual condition
From Figure 4.11, it can be observed that for unamended soil, as soil dries under
ambient conditions, total suction increases and water content decreases. Subsequent variation
in ambient conditions, which causes soil to absorb or diffuse water create intermediate scanning
curves which are flatter than the primary curve. This behaviour matches with the earlier

Chapter 4. Geotechnical Characterisation
109
description of the scanning curve typically observed in unsaturated soils. In the case of
biopolymer stabilised soils, the behaviour of both guar and xanthan gum stabilised specimens
are atypical to that of unamended soil. From Figure 4.12 and 4.13, it can be observed that in
general stabilised soils hold less water at high suctions, however, drying or wetting caused due
to changes in humidity does not lead to intermediate scanning curves but to apparently random
variations of suction and water content. It can be observed that for a given water content, two
or more different suctions are noted. These random variations between total suction and water
content may have been caused due to the evolution of hydrogels which may have been further
affected by changes in ambient conditions. As noted by Ayeldeen et al.,(2016), hydrogels formed
due to the interaction of biopolymer, water and soil particles undergo significant changes in
shape, size and state with aging. Hence, during the initial stages of application, the hydrogel
formations within the soil specimen may be thick and rubbery which with time may change to
thin glassy structures (Eichler et al., 1997; Ayeldeen et al., 2016). These variations of hydrogel
morphology may affect the soil pore size distribution which is directly linked with soil water
retention properties (Fredlund et al., 2006). Further, the vapour absorption and diffusion of
hydrogels is affected by its state, temperature and humidity (Kocherbitov et al., 2010; Chen et
al., 2019). Hence, the random variations of total suction and water content for biopolymer
stabilised specimens in residual conditions may be attributed to the variation in ambient
conditions coupled with changes in hydrogel morphology.
4.5 Constant water content triaxial tests
4.5.1 Testing methodology
In parallel to suction tests, constant water content triaxial tests for cylindrical specimens using
the same soil used for preparing suction specimens were undertaken. In this type of triaxial test,
the water content of the specimen remains constant throughout the test although the tests are
not “undrained” in the conventional soil mechanics sense. With triaxial tests, one can get an
insight which component of the shear strength contributes to the strength of the earthen
construction material (i.e. cohesion or friction). Also, results from triaxial tests might help one
to understand the stabilising mechanisms involved in biopolymer stabilisation. In the past,
many studies have understood the performance of different earthen construction materials
using this approach (Araki et al., 2011; Cheah et al., 2012; El-Nabouch et al., 2018). Adopting
similar approach of using triaxial tests, the stabilising mechanisms of biopolymer stabilised
earthen construction materials which contribute to strength gain is investigated in this section.
In practice, an earthen construction material is allowed to dry under ambient conditions
to gain strength and it is at very low water content during its service. It is appropriate to study
the performance of these materials from its inception to service condition under these conditions
for their true assessment. This is true even for biopolymer stabilised earthen construction
materials, considering much of the strength gain occurs within seven days of curing (as seen

Chapter 4. Geotechnical Characterisation
110
from strength test results in previous chapter). In order to understand the stabilising
mechanisms of biopolymer stabilised earthen construction from its inception under ambient
conditions, this investigation was considered to be appropriate.
For the triaxial tests, cylindrical specimens of 38 mm diameter and 76 mm height were
prepared in accordance to the procedure described in Section 3.3.2.1. Unamended, guar and
xanthan gum stabilised cylindrical specimens were prepared for this investigation. The
stabiliser content for biopolymer stabilised specimens was maintained at 2.0% of dry soil mass.
After preparation, the cylindrical specimens were left to cure under similar conditions as that
of the suction test specimens. Samples were tested at designated curing periods of 1, 4, 7, 10, 14
and 28 days. Constant water content triaxial tests were conducted as per the procedure
described in BS 1377-7 (1990).
On the day of testing, the dimensions and mass of the cylindrical specimen was noted.
The specimens were then fitted inside a single wall triaxial cell and sheared for different
confining pressures using TRITECH 50 kN rig. Typical sample setup for triaxial tests is
presented in Figure 4.14. For this investigation three confining pressures 100, 200 and 300 kPa
were chosen. After the application of the confining pressure the specimen was then sheared until
failure. Similar to the unconfined compressive tests, the displacement rate was maintained at
0.5 mm/min. Loads and axial displacements were recorded manually. After the completion of
the test, the specimen was removed from the triaxial cell and visually examined to check the
failure pattern. Some portion of the soil from the specimen was collected to measure the water
contents, while another portion was collected to measure total suction using the WP4c dewpoint
potentiometer. Unlike other unsaturated triaxial tests where the measurement of suction is
done during the test, in this investigation, suction measurement was done only after the
completion of the test primarily because of the specimen status. As discussed previously, it can
be expected that the specimens which are left to dry under ambient conditions to have high
suctions in the range of 4 – 100 MPa. In this condition, the most feasible option is to determine
suction after the completion of the test.
Figure 4.14. Typical setup for triaxial test

Chapter 4. Geotechnical Characterisation
111
4.5.2 Stress – strain relationship
Figures 4.15. 4.16 and 4.17 respectively are deviator stress/strain plots recorded during the
triaxial tests for unamended, guar gum and xanthan gum stabilised soil specimens. Stiffness of
unamended soil specimens increases as they dry, and once they reach an equilibrium with
ambient conditions (within 7 days), the observed stiffness tends to remain constant for
subsequent curing periods. Peak stresses of the specimen increase with higher confining
pressures, while stiffness remain unaffected.
On viewing the stress/strain plots for guar and xanthan gum stabilised specimens
(Figure 4.16 and 4.17), the effect of stabilisation seems to be apparent. At 1-day curing, beyond
peak stress, the specimens sustained residual stresses with large plastic deformations (Fig 4.16a
and Fig 4.17a). These deformations of the specimen may be attributed to the physical state of
the hydrogels. At early stages of stabilisation, the hydrogels with higher absorbed water are
essentially thick and in a rubbery state (Ayeldeen et al., 2016). In this state, the hydrogels within
the specimen may not take up additional stresses after reaching peak stress, but may still keep
the soil particles bonded through plastic hydrogels resulting in large deformations. However,
this state is short-lived, as the soil specimens dry, the ductile behaviour of specimen transforms
to semi-brittle at 4-day curing, while it is brittle after 7 days. During this transformation, the
hydrogels start to shrink and change to glassy state having higher stiffness (Eichler et al., 1997).
This transformation is reflected as an appreciable increase in peak stresses and soil modulus
for both guar and xanthan gum stabilised specimens after 7 days of curing. The change in stress-
strain behaviour after 7 days and until 28 days seems to be minimal for both guar and xanthan
gum stabilised specimens. Under similar conditions of testing, between biopolymers, it appears
guar gum stabilised specimens have higher peak stresses while xanthan gum stabilised
specimens have higher stiffness. In comparison to unamended specimens, biopolymer stabilised
specimens have higher peak strength and stiffness at all curing periods. Soil Modulus of soil
specimens at different curing are presented in Table 4.1.
Table 4.1. Soil Modulus at different curing periods
Curing Period
(days)
Soil Modulus (MPa)
Unamended Guar gum Xanthan Gum
1 96 87 75
4 100 166 186
7 105 261 275
10 125 266 289
14 119 260 265
28 132 255 260

Chapter 4. Geotechnical Characterisation
112
Figure 4.15. Stress-strain plots of unamended soil specimens for curing periods, 1, 4, 7, 10, 14
and 28 days are plotted from a to f respectively.

Chapter 4. Geotechnical Characterisation
113
Figure 4.16. Stress-strain plots of guar gum stabilised soil specimens for curing periods, 1, 4, 7,
10, 14 and 28 days are plotted from a to f respectively.

Chapter 4. Geotechnical Characterisation
114
Figure 4.17. Stress-strain plots of xanthan gum stabilised soil specimens for curing periods, 1,
4, 7, 10,14 and 28 days are plotted from a to f respectively.

Chapter 4. Geotechnical Characterisation
115
4.5.3 Determination of shear strength parameters
The two shear strength parameters namely, cohesion 𝑐 and angle of internal friction define the
strength characteristics of a soil for given loading and drainage conditions (Terzaghi et al.,
1963). Typically, the shear parameters are obtained graphically by constructing a Mohr circle
for normal and shear stresses obtained from strength tests. As discussed previously in Section
4.2, this holds good even for unsaturated soils, where EMC failure envelope is arrived by plotting
Mohr circles for different suction values which is defined by additional shear parameter related
to soil suction 𝑏
. However, in case of biopolymer stabilised soils it was observed from suction
tests for a given water content, two or more different suctions were noted. In this condition,
characterisation of strength based on EMC criterion may not be possible, as for a given suction
two or three sets of Mohr circles would be plotted which may prove erroneous in determining
the strength parameters. As an alternative, one can plot 𝑝 − 𝑞 diagram, to derive and compare
shear parameters for different soil specimens at the same time (Wood, 1990). In 𝑝 − 𝑞 diagram, 𝑞
which is deviator stress is plotted against 𝑝 which is mean stress. 𝑝 and 𝑞 are expressed as
follows,
𝑝 =1
3 (𝜎1 + 𝜎2 + 𝜎3) (4.4)
𝑞 = √(𝜎1 − 𝜎2)2 + (𝜎2 − 𝜎3)2 + (𝜎1 − 𝜎3)2
2 (4.5)
where, 𝜎1, 𝜎2 and 𝜎3 are principal stresses acting along three different axes.
However, in case of triaxial compression 𝜎2 = 𝜎3. Thus,
𝑝 = 1
3 (𝜎1 + 2𝜎3) (4.6)
𝑞 = (𝜎1 − 𝜎3) (4.7)
The strength envelope for the soil in terms of 𝑝 and 𝑞 is expressed as,
𝑞 = 𝐶 + (𝑀 𝑝) (4.8)
where the coefficients 𝐶 and 𝑀 are respectively the intercept and slope of the failure or strength
envelope that defines shear strength of soils at different stresses. These coefficients can be
converted into corresponding values of cohesion 𝑐 and angle of internal friction by means of
the following equations:
𝑀 =6 𝑠𝑖𝑛
3 − 𝑠𝑖𝑛 → 𝑠𝑖𝑛 =
3 𝑀
6 + 𝑀 (4.9)

Chapter 4. Geotechnical Characterisation
116
𝐶 =6 𝑐 𝑐𝑜𝑠
3 − 𝑠𝑖𝑛 → 𝑐 =
(3 − 𝑠𝑖𝑛) 𝐶
6 𝑐𝑜𝑠 (4.10)
For the triaxial tests conducted, the parameters 𝑝 and 𝑞 were determined for each
specimen tested. 𝑝 − 𝑞 diagrams for unamended, guar and xanthan gum stabilised specimens
are presented in Figures 4.18, 4.19 and 4.20 respectively. The shear strength parameters, i.e.
cohesion 𝑐 and angle of internal friction were calculated through Equations 4.9 and 4.10
respectively from the coefficients 𝐶 and 𝑀 obtained from respective 𝑝 − 𝑞 diagrams. The
calculated shear strength parameters, total suction and water content values at respective
curing periods are presented in Table 4.2, 4.3 and 4.4 for unamended, guar and xanthan gum
stabilised specimens respectively.
Figure 4.18. p-q diagram of unamended soil specimens at different curing periods
Table 4.2. Shear strength parameters, total suction and water content values for
unamended soil specimens
Curing
Period
(days)
Shear Strength Parameters Total Suction
(MPa)
Water Content
(%) 𝑐 (kPa) (0)
1 160 30.4 1.1 4.86
4 190 30.6 61.4 2.82
7 170 32.9 66.1 0.57
10 210 31.1 75.0 0.46
14 220 30.0 76.3 0.40
28 200 30.5 79.7 0.39

Chapter 4. Geotechnical Characterisation
117
From 𝑝 − 𝑞 diagrams of unamended soil specimens (Figure 4.18), it can be observed that,
the stress path of 1-day cured soil specimens is below and separated from other specimens.
Having comparatively higher water content, it can be expected that 1-day cured specimens to
take lower normal stresses than other specimens. However, once dried, stress paths of soil
specimens at different curing periods are grouped together and essentially parallel to each other.
The slight variations of shear strength parameters of unamended soil specimens noted at
different curing periods may have occurred due to the humidity changes. However, it is to be
noted that these changes have not changed the shear strength parameters of unamended soil
specimens drastically. It can be concluded that, for unamended soil specimens, the cohesion is
about 200 kPa and angle of internal friction to be about 310.
Figure 4.19. p-q diagram of guar gum stabilised soil specimens at different curing periods
Table 4.3. Shear strength parameters, total suction and water content values of guar
gum stabilised soil specimens
Curing
Period
(days)
Shear Strength Parameters Total Suction
(MPa)
Water content
(%) 𝑐 (kPa) (0)
1 200 40.7 0.7 6.64
4 620 39.7 6.8 2.82
7 1050 39.7 66.2 0.70
10 620 50.3 73.2 0.72
14 560 54.3 57.6 0.40
28 550 54.4 60.4 0.72

Chapter 4. Geotechnical Characterisation
118
For guar gum stabilised soil specimens, it can be observed from the 𝑝 − 𝑞 diagram
(Figure 4.19), that the stabilised specimen gain strength rapidly within 7 days of curing.
However, after 7 days, the change in strength is not so significant. Between 1 and 7 days of
curing, the cohesion of guar gum stabilised specimens rises from 200 kPa to 1050 kPa, while the
angle of internal friction is about 400. Thereafter, the stabilised specimen tends to lose its
cohesion with aging, while there is steady increase in angle of internal friction. By the end of 28
days, for the guar gum stabilised specimens the cohesion is about 550 kPa and angle of internal
friction is about 540.
Figure 4.20. p-q diagram of xanthan gum stabilised soil specimens at different curing periods
Table 4.4. Shear strength parameters, total suction and water content values for
xanthan gum stabilised soil specimens
Curing
Period
(days)
Shear Strength Parameters Total Suction
(MPa)
Water content
(%) 𝑐 (kPa) (0)
1 350 33.3 0.8 7.52
4 840 26.7 7.3 2.95
7 760 46.0 63.9 0.86
10 660 50.3 54.5 1.00
14 760 44.5 55.6 0.95
28 960 40.3 65.0 0.87
Chapter 4. Geotechnical Characterisation
119
Similar to guar gum, xanthan gum stabilised specimen gains strength rapidly within 7
days of curing. However, the change of shear strength parameters with aging for xanthan gum
is not similar to that of guar gum stabilised specimens. Unlike guar gum, xanthan gum
stabilised soil specimen retains its cohesion, while the angle of internal friction decreases with
time. By end of 28 days, for the xanthan gum stabilised specimens the cohesion is about 960 kPa
and angle of internal friction to be about 400. Compared to unamended soil specimens, the
change in shear strength parameters observed for biopolymer stabilised specimen between
curing periods is more significant. As noted in the Chapter 3, the strength of the biopolymer
stabilised soils is caused by a combination of hydrogel bonding and soil suction. Hence, the
changes observed in shear strength parameters with aging may be linked with the evolution of
hydrogel bonding and changes in ambient conditions.
Guar gum is a neutrally charged polysaccharide having numerous hydroxyl ions which
would essentially interact with soil particles through hydrogen bonding (Chudzikowski, 1971;
Mudgil et al., 2011). With no ionic bonding, the variation in shear strength parameters for guar
gum stabilised specimens can be primarily associated with the physical state of the hydrogels.
As reported by Ayeldeen et al.,(2016), at early stages of biopolymer stabilisation (~7 days), the
hydrogels which bind soil particles are essentially in rubbery state. It can be observed that at 7
days, guar gum specimens have higher water content than unamended soil specimens, however,
soil suction is in the similar range, indicating that hydrogels in rubbery state contribute to
matric suction and in turn soil cohesion. However, with aging, guar gum stabilised specimens
lose cohesion but increase angle of internal friction. This again may be linked with hydrogel
state and intrinsic characteristics of the guar gum. As hydrogels transform to a glassy state,
they shrink in size but become stiffer (Eichler et al., 1997). In this condition, hydrogels primarily
act as a stiff network of interconnected bonds which may increase the effective inter-particle
contact area and aid in the frictional component of the shear strength. On the other hand, the
hydrogels bond with soil particles through weak hydrogen bonds, in this state, soil suction may
be reduced and in turn suction related cohesion. The value of the angle of internal friction, soil
suction and water content values between 10 and 28 days seem to support this hypothesis.
Similar to guar gum, during the early stages of curing (~7 days), the hydrogels in
xanthan gum stabilised specimens are expected to be in rubbery state which later turns to glassy
state. As xanthan gum interacts with clay particles through ionic bonding, the variation of shear
strength parameters may not be completely dependent only on the transformation of hydrogels.
As an anionic polysaccharide xanthan gum interacts with clay particles through ionic bonding
apart from hydrogen bonding and form stable soil agglomerations (Katzbauer, 1998; Garcıa-
Ochoa et al., 2000; Chen et al., 2013; Chang et al., 2015). Further, Chen et al.,(2013) reports
that while forming stable soil agglomerations, the hydrogels formed tend to push apart the soil
agglomerations which induce larger void spaces. When xanthan gum interacts with sand
particles, they act as a coat across the surface of the sand grain and link it with other sand
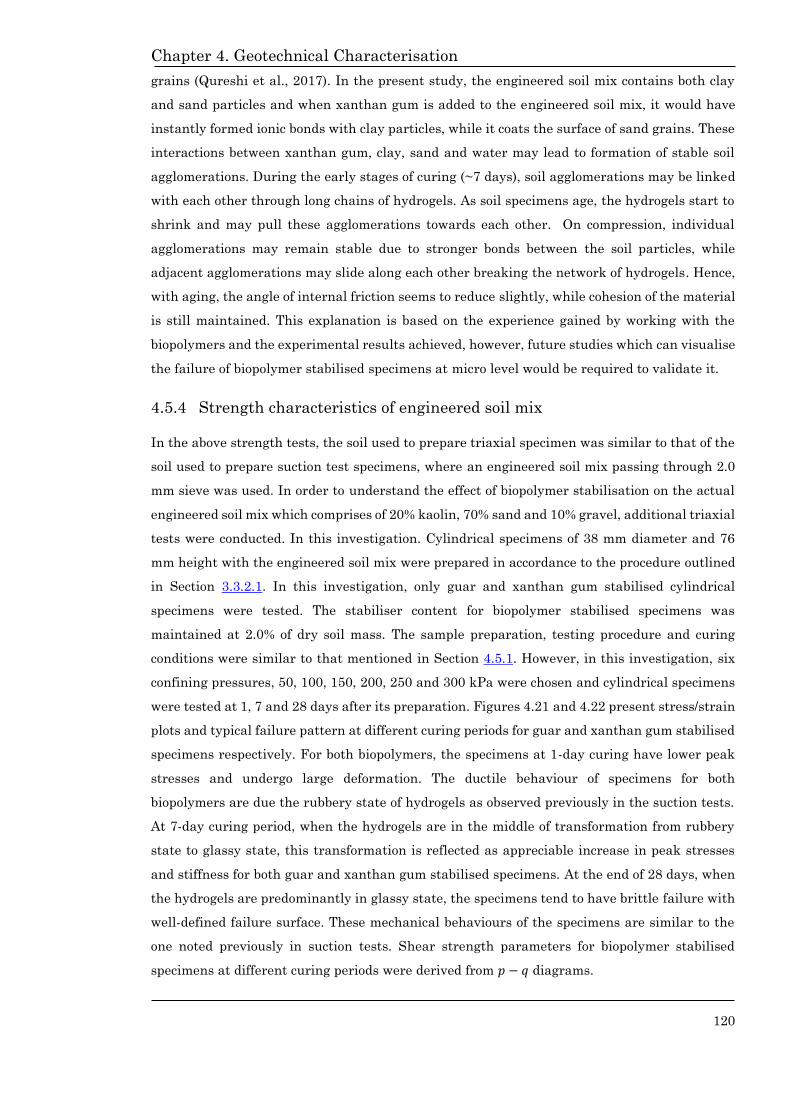
Chapter 4. Geotechnical Characterisation
120
grains (Qureshi et al., 2017). In the present study, the engineered soil mix contains both clay
and sand particles and when xanthan gum is added to the engineered soil mix, it would have
instantly formed ionic bonds with clay particles, while it coats the surface of sand grains. These
interactions between xanthan gum, clay, sand and water may lead to formation of stable soil
agglomerations. During the early stages of curing (~7 days), soil agglomerations may be linked
with each other through long chains of hydrogels. As soil specimens age, the hydrogels start to
shrink and may pull these agglomerations towards each other. On compression, individual
agglomerations may remain stable due to stronger bonds between the soil particles, while
adjacent agglomerations may slide along each other breaking the network of hydrogels. Hence,
with aging, the angle of internal friction seems to reduce slightly, while cohesion of the material
is still maintained. This explanation is based on the experience gained by working with the
biopolymers and the experimental results achieved, however, future studies which can visualise
the failure of biopolymer stabilised specimens at micro level would be required to validate it.
4.5.4 Strength characteristics of engineered soil mix
In the above strength tests, the soil used to prepare triaxial specimen was similar to that of the
soil used to prepare suction test specimens, where an engineered soil mix passing through 2.0
mm sieve was used. In order to understand the effect of biopolymer stabilisation on the actual
engineered soil mix which comprises of 20% kaolin, 70% sand and 10% gravel, additional triaxial
tests were conducted. In this investigation. Cylindrical specimens of 38 mm diameter and 76
mm height with the engineered soil mix were prepared in accordance to the procedure outlined
in Section 3.3.2.1. In this investigation, only guar and xanthan gum stabilised cylindrical
specimens were tested. The stabiliser content for biopolymer stabilised specimens was
maintained at 2.0% of dry soil mass. The sample preparation, testing procedure and curing
conditions were similar to that mentioned in Section 4.5.1. However, in this investigation, six
confining pressures, 50, 100, 150, 200, 250 and 300 kPa were chosen and cylindrical specimens
were tested at 1, 7 and 28 days after its preparation. Figures 4.21 and 4.22 present stress/strain
plots and typical failure pattern at different curing periods for guar and xanthan gum stabilised
specimens respectively. For both biopolymers, the specimens at 1-day curing have lower peak
stresses and undergo large deformation. The ductile behaviour of specimens for both
biopolymers are due the rubbery state of hydrogels as observed previously in the suction tests.
At 7-day curing period, when the hydrogels are in the middle of transformation from rubbery
state to glassy state, this transformation is reflected as appreciable increase in peak stresses
and stiffness for both guar and xanthan gum stabilised specimens. At the end of 28 days, when
the hydrogels are predominantly in glassy state, the specimens tend to have brittle failure with
well-defined failure surface. These mechanical behaviours of the specimens are similar to the
one noted previously in suction tests. Shear strength parameters for biopolymer stabilised
specimens at different curing periods were derived from 𝑝 − 𝑞 diagrams.

Chapter 4. Geotechnical Characterisation
121
Figure 4.21. Deviator stress/strain plots and typical failure pattern of guar gum stabilised soil
specimens (a) 1 day, (b) 7 days, (c) 28 days
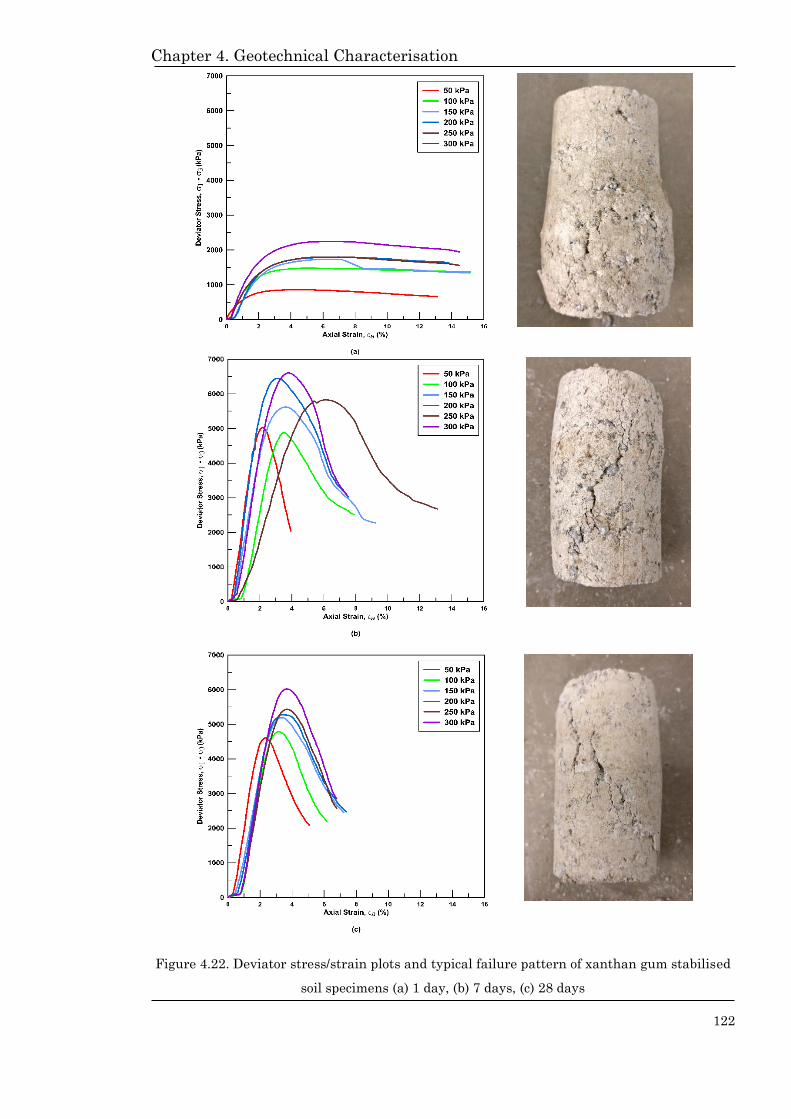
Chapter 4. Geotechnical Characterisation
122
Figure 4.22. Deviator stress/strain plots and typical failure pattern of xanthan gum stabilised
soil specimens (a) 1 day, (b) 7 days, (c) 28 days
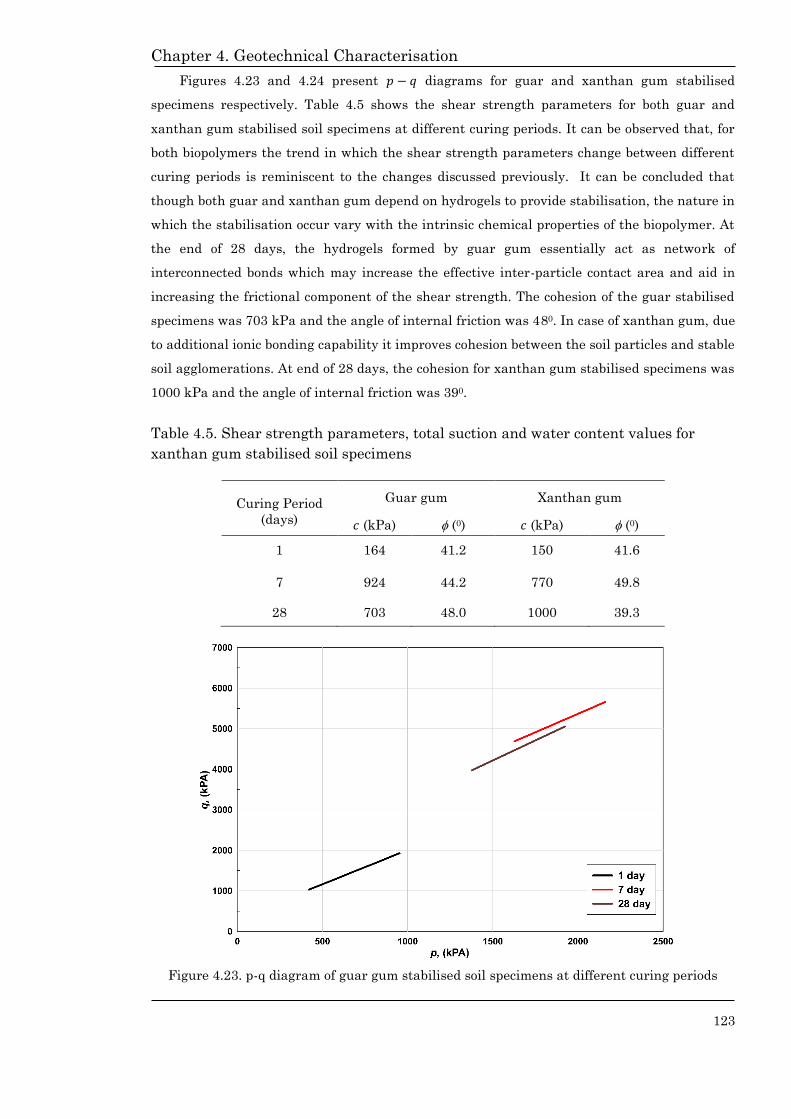
Chapter 4. Geotechnical Characterisation
123
Figures 4.23 and 4.24 present 𝑝 − 𝑞 diagrams for guar and xanthan gum stabilised
specimens respectively. Table 4.5 shows the shear strength parameters for both guar and
xanthan gum stabilised soil specimens at different curing periods. It can be observed that, for
both biopolymers the trend in which the shear strength parameters change between different
curing periods is reminiscent to the changes discussed previously. It can be concluded that
though both guar and xanthan gum depend on hydrogels to provide stabilisation, the nature in
which the stabilisation occur vary with the intrinsic chemical properties of the biopolymer. At
the end of 28 days, the hydrogels formed by guar gum essentially act as network of
interconnected bonds which may increase the effective inter-particle contact area and aid in
increasing the frictional component of the shear strength. The cohesion of the guar stabilised
specimens was 703 kPa and the angle of internal friction was 480. In case of xanthan gum, due
to additional ionic bonding capability it improves cohesion between the soil particles and stable
soil agglomerations. At end of 28 days, the cohesion for xanthan gum stabilised specimens was
1000 kPa and the angle of internal friction was 390.
Table 4.5. Shear strength parameters, total suction and water content values for
xanthan gum stabilised soil specimens
Curing Period
(days)
Guar gum Xanthan gum
𝑐 (kPa) (0) 𝑐 (kPa) (0)
1 164 41.2 150 41.6
7 924 44.2 770 49.8
28 703 48.0 1000 39.3
Figure 4.23. p-q diagram of guar gum stabilised soil specimens at different curing periods

Chapter 4. Geotechnical Characterisation
124
Figure 4.24. p-q diagram of xanthan gum stabilised soil specimens at different curing periods
Table 4.6. Comparison of shear strength parameters of different earthen construction
materials from literature and data from present study.
Study Sample Shear test type
Shear Parameters
𝑐 (kPa) (0)
Araki et al., (2011) USRE Tri-axial 626 49
Cheah et al., (2012) CSRE CW – Triaxial 724 48
Corbin and Augarde (2015) USRE Shear box 55-80 23-65
Gerard et al., (2015) USRE CU – Triaxial 6.2 36.5
Beckett et al., (2017) USRE UC 150 39.7
Present study
Unamended*
CW – Triaxial
200 30.5
GG 2.0% 703 48.0
XG 2.0% 1000 39.3
*For unamended specimens, the shear strength parameters are for the specimens prepared with
engineered soil mix passing through 2.0mm sieve.
Table 4.6 compares the shear strength parameters of specimens from the present study
with literature data. Though in geotechnical engineering, the strength of the soil is dealt in
terms of shear strength parameters, characterisation of earthen construction materials by many
international standards is mostly done in terms of unconfined compressive strength (Schroeder,

Chapter 4. Geotechnical Characterisation
125
2016). Apart from the guideline recommended by Middleton (1992) that the minimum angle of
friction of rammed earth material should be 270, no other technical document delineates the
requirements of earthen construction materials in terms of shear strength parameters.
However, in the recent past, attempts have been made to characterise earthen construction
materials in terms of geotechnical engineering (Jaquin et al., 2009; Cheah et al., 2012; Gerard
et al., 2015; Beckett et al., 2017). Few of these studies have however attempted to determine the
shear strength parameters through different types of shear tests. Shear strength parameters
presented in Table 4.6 are from studies where the soil gradation and curing conditions are
similar to the conditions incorporated in the present study. Having cohesion of 200 kPa and
angle of internal friction of 300, the shear strength parameters of unamended soil are lower in
comparison to the literature reported data. However, the shear strength parameters of
biopolymer stabilised earthen construction material are higher than the literature reported data
and comparable to the shear strength parameters of cement stabilised rammed earth materials
as presented by Cheah et al.,(2012).
4.6. Macrostructural investigation using X-ray computed
tomography
The drying of soil and hydrogel transformation may have an effect on the pore structure of
biopolymer stabilised soils. The differences in the fitting parameter, 𝑛 used in the construction
of SWRCs of unamended, guar gum and xanthan gum stabilised specimens certainly suggest
that there are variations in void size distribution between specimens. Visual inspection of XRCT
scans of biopolymer stabilised specimens between 7- and 28-days curing periods presented in
Chapter 3 also indicate that the biopolymers have an effect on pore structure. As a continuation
to this investigation, further XRCT scanning was taken up to understand the effect of
biopolymers on macrostructure at different curing periods. The results obtained from the XRCT
scans were compared with the scans of unamended specimens to understand the effect of
biopolymer stabilisation. Considering the wide range of particle sizes used in earthen
construction material (as in case of the engineered soil mix used in the present study),
macrostructural study using X-Ray computed tomography was considered more appropriate as
the XRCT scans are obtained from large sized samples and are more representative than other
techniques (Augarde, 2015).
4.6.1 Specimen Preparation
Ketcham and Carlson (2001) suggest that the specimens for X-RCT scanning should be at least
1000 times larger than the desired resolution. It was noted in the preliminary studies conducted
in Chapter 3, that the resolution of about 8.5 μm was sufficient to obtain good quality scans for
the earthen construction material. Similar resolution was adopted by Beckett et al., (2013) to
scan for earthen construction materials with similar soil gradation. Corresponding to the

Chapter 4. Geotechnical Characterisation
126
resolution of 8.5 μm resolution, the minimum thickness of the specimen comes to 8.5 mm thick,
which is about the size of the suction specimens considered in suction tests in Section 4.4. Hence
for this investigation, specimens of 35 mm diameter and 8 mm thickness were considered. Test
specimens were prepared for unamended, guar and xanthan gum stabilised specimens. The
biopolymer content for the stabilised specimens was maintained at 2.0 % of the dry mass of soil
mix. The specimens were prepared and cured in a similar manner as described in Section 4.4.1.
X-RCT scanning was done using XRadia/Zeiss XRM-410 machine based at Durham
University XCT service (ZEISS, 2014). Smith (2015) noted that the XRM-410 can perform scans
for samples up to 300mm diameter at different resolutions from 1 to 40 μm which is sufficient
for obtaining the scans for the test specimens for the required resolution of 8.5 μm. For a given
specimen, after 1 day of curing, the sample was scanned in the XRCT machine. For this
resolution, a typical scan lasted about 14 -16 hours. After the completion of the scan, the sample
was then transferred back to the laboratory to cure. The specimen was scanned again at 7 and
28 days of curing. The raw data obtained from XRM-410 was analysed using Avizo Fire software.
As an image processing and analysing software, Avizo contains various modules to edit, view
and analyse the raw data. The X-RCT scans were analysed in the form of 2-D slices across the
diameter of the sample in Avizo. Roughly 1600 slices were available for analysis per sample.
Figure 4.25 presents the steps involved in image processing and analyses using Avizo. Label
analysis counts and categorises macropores based on its volume, while the volume fraction
analysis obtains the percentage of masked volume to the total volume which is porosity of the
specimen.
Figure 4.25. Flow chart of different steps involved in image processing and analyses using
Avizo
1. Load the scan data volume into Avizo
2. Create a sub cylindrical volume (70%) to remove boundary distortion (~ 25 mm diameter)
3. Thresholding for air voids (intensity < 1) and create mask
4. Obtain XRCT scans for desired slice
5. For the masked portion, perform Volume fraction analysis to obtain porosity
6. For the masked portion, perform Label analysis to obtain pore volume information

Chapter 4. Geotechnical Characterisation
127
4.6.2 Test results
4.6.2.1. X-RCT scans
Re-constructed X-RCT scans for unamended, guar gum and xanthan gum stabilised specimens
at different curing periods are presented in Figures 4.26 to 4.34 respectively. Among the
thousands of slices, only one representative slice for each specimen at a particular curing period
is presented here. However, key observations discussed herein are based on examination of
slices at various locations of a specimen. In each figure, three re-constructed scans corresponding
to soil (a), porosity (b) and combination of soil and porosity (c) are presented. In the X-RCT scan
corresponding to the soil, the brightest regions of the scan represent the densest particles of the
soil mix such as gravel or sand, while darkest regions represent the least dense particles like air
voids. In X-RCT scan corresponding to porosity, the coloured portion represent the voids, while
soil particles are in black colour. Lastly, both scans of soil and porosity are overlapped which is
presented in part (c) of each figure.
On visual inspection of X-RCT scans for unamended and biopolymer stabilised
specimens, it appears that the unamended samples have less void space and are more compact.
However, it is important to note here that, the hydrogels are three-dimensional porous networks
of bonds connecting soil particles (Brax et al., 2017). As a porous material, it may be expected
that the hydrogels have a low attenuation factor which may limit its identification in X-RCT
scans and the space occupied by hydrogels to be classified as void. With this limitation, an
attempt has been made to analyse the macrostructure of biopolymer stabilised samples. As
mentioned, compared to unamended specimens, the void spaces observed in biopolymer
stabilised samples appear to be higher. However, it is also possible that the presence of
hydrogels has increased the overall void space of biopolymer stabilised samples. Through
Scanning Electron Microscopy, it was observed by Chen et al.,(2014) that, apart from connecting
the soil particles, hydrogels push aside soil particles which create higher void space. As noted
previously, the chemical properties of the biopolymers determine the nature in which the
hydrogels interact with soil particles and in turn this may affect the soil structure. Chen et
al.,(2014) further notes that, guar gum as a neutral polysaccharide essentially coats the soil
particles and form smaller soil aggregations. In case of xanthan gum which is anionic
polysaccharide is effective in interacting with clay particles which creates larger soil
agglomerations, but induce higher void spaces which is filled with air or biopolymer solution.
Though this study was done at high water contents, it is evident that both biopolymers have
influence on soil structure. Similar to the observations made by Chen et al.,(2014), visual
inspection of X-RCT scans from the present study indicate that the xanthan gum stabilised
samples create higher void space than guar gum stabilised samples at macro level. In order to
obtain a better perspective on the effect of biopolymers on macrostructure of the soil,
quantitative analyses were performed which is discussed in the next section.

Chapter 4. Geotechnical Characterisation
128
Figure 4.26. X-RCT scans of unamended soil specimens at 1 – day curing period, (a) soil (b)
porosity and (c) soil with porosity
Figure 4.27. X-RCT scans of unamended soil specimens at 7 – day curing period, (a) soil (b)
porosity and (c) soil with porosity
Figure 4.28. X-RCT scans of unamended soil specimens at 28 – day curing period, (a) soil (b)
porosity and (c) soil with porosity
(c) (b) (a)
(c) (b) (a)
(c) (b) (a)
~ 25 mm

Chapter 4. Geotechnical Characterisation
129
Figure 4.29. X-RCT scans of guar gum stabilised soil specimens at 1 – day curing period, (a)
soil (b) porosity and (c) soil with porosity
Figure 4.30. X-RCT scans of guar gum stabilised soil specimens at 7 – day curing period, (a)
soil (b) porosity and (c) soil with porosity
Figure 4.31. X-RCT scans of guar gum stabilised soil specimens at 28 – day curing period, (a)
soil (b) porosity and (c) soil with porosity
(a) (b) (c)
(a) (b) (c)
(a) (b) (c)
~ 25 mm

Chapter 4. Geotechnical Characterisation
130
Figure 4.32. X-RCT scans of xanthan gum stabilised soil specimens at 1 – day curing period,
(a) soil (b) porosity and (c) soil with porosity
Figure 4.33. X-RCT scans of xanthan gum stabilised soil specimens at 7 – day curing period,
(a) soil (b) porosity and (c) soil with porosity
Figure 4.34. X-RCT scans of xanthan gum stabilised soil specimens at 28 – day curing period,
(a) soil (b) porosity and (c) soil with porosity
(a) (b) (c)
(a) (b) (c)
(a) (b) (c)
~ 25 mm

Chapter 4. Geotechnical Characterisation
131
4.6.2.2. Porosity and void size distribution curves
Based on the volume fraction analysis in Avizo, porosity of all specimens at different
curing periods were obtained and presented in Table 4.7. It can be observed that the porosity of
biopolymer stabilised specimens is comparatively higher than that of unamended samples at all
curing periods. Between biopolymers, xanthan gum stabilised specimens have higher porosity
than guar gum stabilised specimens at all curing periods. The variations in the measured
porosity values of samples complement to the earlier discussion based on the visual inspection
of X-RCT scans which indicated that both biopolymers induce void spaces.
Table 4.7. Porosity for all samples at different curing periods.
Curing Period
(days)
Porosity for different samples (%)
Unamended Guar Xanthan
1 6.83 9.03 13.68
7 9.10 9.67 15.07
28 9.68 9.86 13.47
The results obtained from label analysis from Avizo can be presented in the form of void
size distribution curves. In X-RCT obtained void size distribution, cumulative void volume as a
percentage of the total sample volume is plotted against void volumes(Smith, 2015). The
gradient of the curve at a particular void volume can be used to identify the number of voids of
that volume within the sample, i.e. a steep curve suggests there are a high number of voids of
that volume, while a flat region within the void size distribution curve suggests there are no
voids of the given volume within the sample. Void size distributions of unamended, guar and
xanthan gum stabilised soil specimens obtained from label analysis of XRCT scans at different
curing periods are presented in Figures 4.35 to 4.37 respectively. As a general observation, it
can be noted that all specimens contain voids in a similar range of 103 – 108 µm3 connected to
larger void having a volume in the range of 1010 - 1011 µm3. Compared to unamended soil
specimen, the size of the large interconnecting void for biopolymer stabilised specimens is larger.
After 1-day curing, the porosity of unamended, guar gum and xanthan gum stabilised
specimens were 6.83%, 9.03% and 13.68%. In the initial phase of drying, the soil specimens at
1-day curing period will have higher water content and less air voids than at 7 and 28 days. The
soil specimens may have air voids in discontinuous phase where many smaller voids may be
present and the size of the interconnecting air void may be small (refer Figures 4.26b, 4.29b and
4.32b). From the void distribution curves (Figure 4.35), it can be observed that, unlike
unamended soil specimens, much of the void volume in biopolymer stabilised soil specimens is
occupied by the large interconnecting void than the cumulative volume of voids within the range
of 103 – 108 µm3. For guar gum stabilised sample there are very few voids in the range of 103 –

Chapter 4. Geotechnical Characterisation
132
108 µm3 , this may be due to its high affinity towards water which may ensure that many of the
pores are hydrated (Nugent et al., 2009). With better interactions with clay particles and having
lesser affinity to water than guar gum, the observed number of voids within the range of 103 –
108 µm3 of xanthan stabilised specimen is lesser than unamended soil specimens, but higher
than guar gum stabilised specimens.
Figure 4.35. Void size distribution of all the specimens after 1 day of curing
After 7 days of curing, the observed porosity values of unamended, guar gum and
xanthan gum stabilised specimens were 9.10%, 9.67% and 15.07% respectively. From Figure
4.36, it can be seen that the number of voids for guar gum stabilised specimens has significantly
increased compared to 1-day specimen. Further, the number of pores between 107 – 108 µm3 are
higher than unamended and xanthan gum stabilised specimens. As observed from suction
versus time plots, the rate of drying for guar gum stabilised specimens is comparatively higher
than unamended and xanthan gum stabilised specimens and the largest pores are the one which
dry faster than finer pores. These results complement the results of suction versus time plots.
Compared to unamended and guar gum stabilised specimens, the number of voids for xanthan
gum stabilised specimens in the range of 103 – 108 µm3 are lower. Further, compared to 1 day, 7
days specimens have fewer number of voids in the range of 103 – 107 µm3, while there are no
voids in the range of 107 – 108 µm3. However, the size of the interconnecting void becomes bigger.
This clearly shows that, on addition of xanthan gum, the soil particles form larger stable soil
agglomerations which would reduce the number of smaller pores, but as soil agglomerations

Chapter 4. Geotechnical Characterisation
133
they induce higher void spaces which would increase the size of interconnecting void. These
results compliment the discussions of triaxial test results and the visual interpretations made
earlier.
Figure 4.36. Void size distribution of all specimens after 7 days of curing
At 28 days, the porosity values of unamended, guar gum and xanthan gum stabilised
specimens were 9.68%, 9.86% and 13.47% respectively. It can be observed from Figure 4.37, that
by 28 days, unamended soil specimen has large number of voids in the range of 107 – 108 µm3.
With aging, it can be expected that the specimen is much drier which would induce larger
number of air voids within the specimen. In case of biopolymer stabilised specimens, the number
of air voids in the range of 107 – 108 µm3 remain almost similar indicating that in the residual
conditions, much of the water is retained within the soil structure which would not affect its
pore structure. These results support the findings of suction tests which suggest more water is
retained by biopolymer stabilised soil even after 28 days.
Based on the above discussion, it is evident that both biopolymers have significant and
yet different effect on pore structure of the soil mix at macro level. However, due to the
limitations of the X-RCT scanning, precise estimate of hydrogel volume in void space could not
be estimated. Further, this investigation was limited to understand the effect of biopolymers at
macrolevel pore spaces. Considering the intrinsic chemical properties of both biopolymers, it
would be certain that they would have significant effect on microstructure of the soil. Any future
studies which would quantify the variation in porosities of biopolymer stabilised soils at both

Chapter 4. Geotechnical Characterisation
134
micro and macro level, would certainly help to understand the interactions of biopolymers with
soil.
Figure 4.37. Void size distribution of all specimens after 28 days of curing
4.7. Concluding remarks
Based on the geotechnical characterisation, key research conclusions on strength and hydraulic
properties of biopolymer stabilised soils and effect of biopolymers on soil macrostructure are
summarised below:
1. Suction tests:
a. From suction versus time plots, it was observed that the rate of drying of guar gum
stabilised specimens is higher than unamended and xanthan gum stabilised specimens.
This indicates that, though guar gum has high affinity to water, on drying water tends
to escape quickly, as the water molecules are held loosely by the biopolymer chains.
b. In case of xanthan gum stabilised specimen, the rate of drying is similar to that of
unamended soil specimen, indicating that the hydrogel bonding is not so significant to
slow the rate of drying.
c. The SWRC of unamended and biopolymer stabilised specimens suggests that for the
range of water contents observed, the suction values observed for biopolymer stabilised
soils are marginally higher than unamended soil mix.

Chapter 4. Geotechnical Characterisation
135
d. The effect of biopolymer stabilisation is evident through increased value of fitting
parameter, 𝑎𝑓. With the variation of fitting parameter, 𝑛𝑓 it appears that for the
biopolymer stabilised specimens there would be variation in its void size distribution.
e. The scanning curves of unamended soil mix in residual conditions matches the
description of scanning curves typically observed in unsaturated soils. In case of
biopolymer stabilised soils, there is random variation of total suction. It was observed
that for a given water content, two or more different suctions were noted. The random
variations may be due to the evolution of hydrogels.
2. Constant water triaxial tests:
a. Stiffness of unamended soil specimens increase as they dry, and once they reach an
equilibrium with ambient conditions (within 7 days), the observed stiffness tends to
remain similar for subsequent curing periods.
b. Peak stresses of the unamended soil increase with higher confining pressures, while
stiffness remains unaffected.
c. In case of biopolymer stabilised soils, ductile behaviour was observed for 1-day cured
specimens. However, this state was short-lived, as the soil specimens dry, the ductile
behaviour of specimen transforms to semi-brittle at 4-day curing, while it is brittle after
7 days.
d. For unamended soil specimens, after 28 days the cohesion was about 200 kPa and angle
of internal friction was about 310.
e. Guar gum stabilised specimens gained strength rapidly within 7 days of curing,
however, after 7 days, the change in strength was not so significant. It was also noticed
that with aging, the specimens lost cohesion, while the angle of internal friction
increased. By the end of 28 days, for the guar gum stabilised specimens the cohesion is
about 550 kPa and angle of internal friction is about 540.
f. Similar to guar gum, xanthan gum stabilised specimen gain strength rapidly within 7
days of curing. Unlike guar gum, xanthan gum stabilised soil specimen retains its
cohesion, while the angle of internal friction decreases with time. By end of 28 days, for
the xanthan gum stabilised specimens the cohesion is about 960 kPa and angle of
internal friction is about 400.
g. For the biopolymer stabilised soils, the change in shear strength parameters with aging
can be related to the evolution of hydrogels and the intrinsic properties of the
biopolymer.
h. The shear strength parameters of biopolymer stabilised earthen construction material
are higher than the literature reported data and are comparable to the shear strength
parameters of cement stabilised rammed earth materials.

Chapter 4. Geotechnical Characterisation
136
3. Macrostructure analysis:
a. As a three-dimensional porous structure, it may be expected that hydrogels have less
attenuation factor which may limit its identification in X-RCT scans and the space
occupied by hydrogels may be classified as a void.
b. Visual inspection of X-RCT scans from the present study indicate that the xanthan gum
stabilised specimen creates higher void space than unamended and guar gum stabilised
specimens at macro level.
c. The computed macro level porosity of biopolymer stabilised specimens is comparatively
higher than that of unamended specimens at all curing periods. Between biopolymers,
xanthan gum stabilised specimens have higher porosity than guar gum stabilised
specimens at all curing periods.
d. Void size distribution suggests both biopolymers have significant and yet different effect
on pore structure of the soil mix at macro level. The results of void size distribution
curves compliment the findings of suction and strength tests.
e. Due to the limitations of the X-RCT scanning, precise estimate of hydrogel volume in
void space may not be determined.

Chapter 4. Geotechnical Characterisation
137
References
Araki H, Koseki J, and Sato T. 2011. Mechanical
Properties Of Geomaterials Used For
Constructing Earthen Walls In Japan. Builletin
of ERS (Vol. 44).
Augarde CE. 2015. Earthen construction : a
geotechnical engineering perspective. In First
International Conference on Rammed Earth
Construction. Perth, Australia.
Ayeldeen MK, Negm AM, and El Sawwaf MA. 2016.
Evaluating the physical characteristics of
biopolymer/soil mixtures. Arabian Journal of
Geosciences, 9(5), 329–339.
Beckett C, Augarde CE, Easton D, and Easton T. 2017.
Strength characterisation of soil-based
construction materials. Géotechnique.
Beckett C, and Ciancio D. 2015. Tensile strengths of
flocculated compacted unsaturated soils,
(October).
Brax M, Buchmann C, and Schaumann GE. 2017.
Biohydrogel induced soil-water interactions:
how to untangle the gel effect? A review. Journal
of Plant Nutrition and Soil Science, 180(2), 121–
141.
BS 1377-7. 1990. Methods of test for Soils for civil
engineering purposes - Part 7 : Shear strength
tests (total stress). London: BSI.
Bui QB, Morel JC, Hans S, and Walker P. 2014. Effect
of moisture content on the mechanical
characteristics of rammed earth. Construction
and Building Materials, 54, 163–169.
Cao J, Jung J, Song X, and Bate B. 2017. On the soil
water characteristic curves of poorly graded
granular materials in aqueous polymer
solutions. Acta Geotechnica.
Chang I, Im J, Prasidhi AK, and Cho G-C. 2015. Effects
of Xanthan gum biopolymer on soil
strengthening. Construction and Building
Materials, 74(10), 65–72.
Cheah JSJ, Walker P, Heath A, and Morgan TKKB.
2012. Evaluating shear test methods for
stabilised rammed earth. Proceedings of the
Institution of Civil Engineers - Construction
Materials, 165(6), 325–334.
Chen C, Wu L, Perdjon M, Huang X, and Peng Y. 2019.
The drying effect on xanthan gum biopolymer
treated sandy soil shear strength. Construction
and Building Materials, 197, 271–279.
Chen R. 2014. Bio Stabilisation for Geopolymer
Enchancement and Mine tailings Dust Control.
The University of Arizona. Retrieved from
http://hdl.handle.net/10150/319999
Chen R, Zhang L, and Budhu M. 2013. Biopolymer
Stabilization of Mine Tailings. Journal of
Geotechnical and Geoenvironmental
Engineering, 139(October), 130128212232006.
Chudzikowski RJ. 1971. Guar gum and its
applications. Journal of the Society of Cosmetic
Chemists, 22(1), 43–60.
Corbin A, and Augarde C. 2015. ’Investigation into the
shear behaviour of rammed earth using shear
box tests. In Proceedings of the First
International Conference on Bio-based Building
Materials. Clermont-Ferrand, France: RILEM.
Retrieved from
http://www.rilem.org/gene/main.php?base=5002
18
Decagon Devices. 2015. WP4C WATER POTENTIAL
METER. Retrieved June 8, 2017, from
http://www.decagon.com/en/soils/benchtop-
instruments/wp4c-water-potential-meter/
Eichler S, Ramon O, Ladyzhinski I, Cohen Y, and
Mizrahi S. 1997. Collapse processes in shrinkage
of hydrophilic gels during dehydration. Food
Research International, 30(9), 719–726.
El-Nabouch R, Bui QB, Plé O, and Perrotin P. 2018.
Characterizing the shear parameters of rammed
earth material by using a full-scale direct shear
box. Construction and Building Materials, 171,
414–420.
Fredlund D., Rahardjo H, and Fredlund M. 2006.
Unsaturated Soil Mechanics in Engineering
Practice (Vol. 132). John Wiley & Sons, Inc.
Retrieved from
http://ascelibrary.org/doi/10.1061/%28ASCE%29
1090-0241%282006%29132%3A3%28286%29
Fredlund D., and Xing A. 1994. Equations for the soil-
water characteristic curve. Canadian
Geotechnical Journal, 31(4), 521–532.
Fredlund DG. 1973. Volume change behavior of
unsaturated soils. Phd Thesis.
Fredlund DG, Rahardjo H, Leong EC, and Ng CW.
2001. Suggestions and
recommendationsfortheinterpretationofsoil-
watercharacteristic curves. In Southeast Asian
Geotechnical Conference (pp. 503–508). Hong
Kong.
Gallipoli D, Bruno AW, Perlot C, and Salmon N. 2014.
Raw earth construction: is there a role for
unsaturated soil mechanics. Taylor & Francis
Group, London, UK.
Garcıa-Ochoa F, Santos VE, Casas JA, and Gomez E.
2000. Xanthan gum: production, recovery, and
properties. Biotechnology Advances, 18(7), 549–
579.
Gerard P, Mahdad M, Robert McCormack A, and
Fran??ois B. 2015. A unified failure criterion for
unstabilized rammed earth materials upon
varying relative humidity conditions.
Construction and Building Materials, 95, 437–
447.
Hillel D. 1980. Fundamentals of soil physics. Academic

Chapter 4. Geotechnical Characterisation
138
Press, New York. Fundamentals of Soil Physics.
Academic Press, New York.
Jaquin PA, Augarde CE, Gallipoli D, and Toll DG.
2009. The strength of unstabilised rammed
earth materials. Géotechnique, 59(5), 487–490.
Jennings JEB, and Burland JB. 1962. Limitations to
the Use of Effective Stresses in Partly Saturated
Soils. Géotechnique, 12(2), 125–144.
Katzbauer B. 1998. Properties and applications of
xanthan gum. Polymer Degradation and
Stability, 59(1–3), 81–84.
Ketcham RA, and Carlson WD. 2001. Acquisition ,
optimization and interpretation of X-ray
computed tomographic imagery : applications to
the geosciences, 27, 381–400.
Kocherbitov V, Ulvenlund S, Briggner L-E, Kober M,
and Arnebrant T. 2010. Hydration of a natural
polyelectrolyte xanthan gum: Comparison with
non-ionic carbohydrates. Carbohydrate
Polymers, 82(2), 284–290.
Lu N, and Likos WJ. 2004. Unsaturated Soil
Mechanics. Wiley.
McQueen IS, and Miller RF. 1974. Approximating soil
moisture characteristics from limited data:
Empirical evidence and tentative model. Water
Resources Research, 10(3), 521–527.
Middleton GF. 1992. Earth wall construction. North
Ryde, Australia.: Commonwealth Scientific and
Industrial Research Organisation (Division of
Building Construc- tion and Engineering).
Mudgil D, Barak S, and Khatkar BS. 2011. Guar gum:
processing, properties and food applications—A
Review. Journal of Food Science and Technology,
51(6), 409–418.
Nugent RA, Zhang G, and Gambrell RP. 2009. Effect of
Exopolymers on the Liquid Limit of Clays and
Its Engineering Implications. Transportation
Research Record: Journal of the Transportation
Research Board, 2101(1), 34–43.
Nuth M, and Laloui L. 2008. Advances in modelling
hysteretic water retention curve in deformable
soils. Computers and Geotechnics, 35(6), 835–
844.
Qureshi MU, Chang I, and Al-Sadarani K. 2017.
Strength and durability characteristics of
biopolymer-treated desert sand. Geomechanics
and Engineering, 12(5), 785–801.
Schroeder H. 2016. Sustainable Building with Earth.
Sustainable Building with Earth. Cham:
Springer International Publishing.
Smith J. 2015. Examining Soil Based Construction
Materials through X-Ray Computed
Tomography. Durham University.
https://doi.org/ear
Terzaghi K, Peck BR, and Mesri G. 1963. Soil
Mechanics in Engineering Practice (Third Edit).
A Wiley-Interscience Publication.
Torres MD, Moreira R, Chenlo F, and Vázquez MJ.
2012. Water adsorption isotherms of
carboxymethyl cellulose, guar, locust bean,
tragacanth and xanthan gums. Carbohydrate
Polymers, 89(2), 592–598.
Tran TPA, Im J, Cho G-C, and Ilhan Chang. 2017. Soil
– water characteristics of xanthan gum
biopolymer containing soils. In Proceedings of
the 19th International Conference on Soil
Mechanics and Geotechnical Engineering, Seoul.
Wijaya M, and Leong EC. 2016. Equation for unimodal
and bimodal soil-water characteristic curves.
Soils and Foundations, 56(2), 291–300.
Wilson GW, Fredlund DG, and Barbour SL. 1994.
Coupled soil-atmosphere modelling for soil
evaporation. Canadian Geotechnical Journal,
31(2), 151–161.
Wood DM. 1990. Soil behaviour and critical state soil
mechanics. Cambridge university press.
ZEISS. 2014. ZEISS Xradia 410 Versa Submicron X-
ray Imaging : Bridge the Gap in Lab-based
Microscopy. Jena, Germany: Carl Zeiss
Microscopy GmbH. Retrieved from
https://www.zeiss.com/microscopy/int/products/
x-ray-microscopy/zeiss-xradia-410-versa.html
Zhao X. 2014. Measurements and transient multistep
outflow simulation of soil-water characteristic
curve for soils modified with biopolymers.

139
Chapter 5
Assessment of biopolymer stabilised
earthen construction material as a building
material
5.1 Chapter Introduction
In Chapter 3, a few preliminary durability tests were performed to investigate the potential of
both guar and xanthan gum as stabilisers for earthen construction materials. The results
indicated that the biopolymer stabilised material had satisfactory durability performance
against erosion. In continuation to this durability assessment, further investigations which
emulate different in-situ conditions have been carried out to assess performance of both of the
biopolymers as stabilisers. The results of these investigations are presented in this Chapter.
Further, earthen construction materials are often considered sustainable due to their inherent
characteristics of having low embodied energy, low operational energy, they are easily
recyclable, provide acoustic insulation and are naturally fire resistant(Calkins, 2008; Ciurileanu
and Horvath, 2012; Gallipoli et al., 2014; Schroeder, 2016). In this Chapter, two further aspects
are investigated, namely hygroscopic behaviour and recyclability potential of biopolymer
stabilised earthen construction materials which can be linked to sustainability characteristics
namely low operational energy and recyclability.
5.2 Sample preparation
In this section, the manufacturing process of samples used in different investigations is detailed.
These investigations were carried out at the geotechnical engineering laboratory of Durham
University, United Kingdom and the SIAME laboratory of University of Pau and Pays de l'Adour
(UPPA), France.
5.2.1 Materials
In order to maintain material consistency between the two laboratories, it was ensured that the
kaolin, gravel and biopolymers used at Durham University were shipped to UPPA. However,
due to the large quantities of sand involved, rather than shipping, the sand available in the
SIAME laboratory was suitably modified to match the particle size gradation of the sand used
at Durham University. To achieve particle size consistency, the unmodified sand was dried at
1050C in an oven for 24 hours. The dried sand was then sieved through series of sieves ranging
from 5.0 mm to 0.080 mm. The portions of sand retained on each sieve were collected separately.
These portions were then mixed proportionately so as to obtain sand having a similar particle

Chapter 5. Assessment as building material
140
size gradation originally used in Durham University. The particle size gradation of the two
sands used is presented in Figure 5.1.
Figure. 5.1. Comparison of particle size gradation of sands used
5.2.2 Sample preparation
For the different investigations carried out in this chapter, the size and geometry of the samples
used varied. However, in most instances, the manufacturing process of samples with similar
size and geometry remained the same. Hence, prior to the discussions regarding different
investigations conducted, the manufacturing process is discussed below. Table 5.1 presents the
sample size and shape of samples used in the different investigations.
Table 5.1. Different sample configurations considered in this assessment.
Sample configuration Durability
tests
Hygroscopic
tests
Recyclability
tests
Laboratory
Small cylinder
(38 mm diameter and 76mm
height)
- - Durham
University
Tile
(150 mm x 150mm x 20mm) - -
Larger cylinder
(50 mm diameter and 100 mm
height)
UPPA
Brick
(200 mm x 100mm x 50mm) -

Chapter 5. Assessment as building material
141
5.2.2.1. Small cylindrical specimens
All cylindrical samples of dimension 38 mm and 76 mm height were prepared in the geotechnical
engineering laboratory at Durham University and in a similar procedure as described in Section
3.3.2.1.
5.2.2.2. Tile specimens
Tile specimens of 150 mm x 150 mm x 20 mm were manufactured in the geotechnical
engineering laboratory at Durham University. In order to make the tiles, the required quantities
(mass basis) of the ingredients (sand, gravel, kaolin and biopolymer) were weighed and initially
mixed in the dry condition. For the biopolymer stabilised samples, the chosen biopolymer was
pre-mixed with the dry ingredients of the soil mixture. After dry mixing, water equivalent to the
optimum water content obtained through the compaction test and the additional water required
to make the soil workable was added to the soil mixture and mixed thoroughly as explained in
Section 3.3.2.1. After mixing, the required bulk mix was weighed and introduced into the 150
mm cube mould and statically compacted to achieve the maximum dry density of the unamended
soil mix using a Denison T60C hydraulic press (Figure 5.2). To avoid drainage and ensure safe
extrusion of the sample, the cube mould was lined with Teflon paper. In order to achieve the
required thickness of 20 mm, the compacting pressure had to be maintained around 2.0 - 2.3
MPa. Once compacted, the cube mould was dismantled and the tile specimen was removed
carefully. The tiles were then left to cure in the laboratory atmosphere with relative humidity
(RH) of 50% and temperature of 21°C.
Figure. 5.2. Preparation of tile specimens, (a) Denison T60C hydraulic press and (b) 150 mm
cube mould
(a)
(b)

Chapter 5. Assessment as building material
142
Figure. 5.3. Manufacturing of large cylinders, (a) Zwick Roell press and (b) Mould for cylinders
5.2.2.3. Large cylindrical samples
All cylindrical samples of dimension 50 mm diameter and 100 mm height were manufactured
in the SIAME laboratory at UPPA. Similar procedures of mixing, compacting and extrusion as
involved for the small cylinders were followed to make the larger cylindrical samples. After
extrusion, the samples were left to cure at laboratory atmosphere with relative humidity (RH)
of 50% and temperature of 23°C. The samples were compacted in a cylindrical mould using a
Zwick Roell hydraulic press (Figure 5.3).
5.2.2.4. Brick samples
All brick samples of dimension 200 mm width, 100 mm length and 50 mm thickness were
manufactured in the SIAME laboratory at UPPA. The chosen dimensions of the brick are similar
to those of the standard fired clay bricks commonly used in the United Kingdom (BS 3921, 1985),
i.e. 215 mm x 102.5 mm x 65 mm. Unlike cylindrical and tile specimens, the bricks were
compacted from both sides simultaneously using an open-ended compaction mould in a 3R RP
3000 TC/TH press (Figure 5.4). The manufacturing process of bricks involved dry mixing of the
ingredients required for the soil mix (i.e. sand, kaolin, gravel and biopolymer). The soil mix was
later introduced to an electric cement mixer and water equivalent to the optimum water content
and the additional water required to make the soil workable was added to the soil mix
(a)
(b)

Chapter 5. Assessment as building material
143
progressively. Once the soil mix achieved uniform consistency, the soil mix was used to make
bricks.
Figure. 5.4. Manufacturing of bricks, (a) 3R RP 3000 TC/TH press, (b) dismantled open
compaction mould, and (c) assembled compaction mould
The procedure for assembling the mould, double compaction of the soil mix and extrusion of the
brick is detailed below:
• The lower piston is placed on the bottom plate of the press along with the four spacers which
are 10 mm shorter than the lower piston (Figure 5.5a). Each spacer is used to support four
different parts of the open mould.
• The four parts of the open mould are positioned on top of the spacers so that parts 3 and 4
fit inside the indentations of parts 1 and 2 (Figure 5.5b and 5.5c). These parts are assembled
together by tightening the two M42 bolts. In this condition, the lower piston is 10 mm inside
the open mould.
• The prepared wet soil mixture is then introduced into the mould and distributed uniformly
(Figure 5.5d).
(c) (a)
(b)
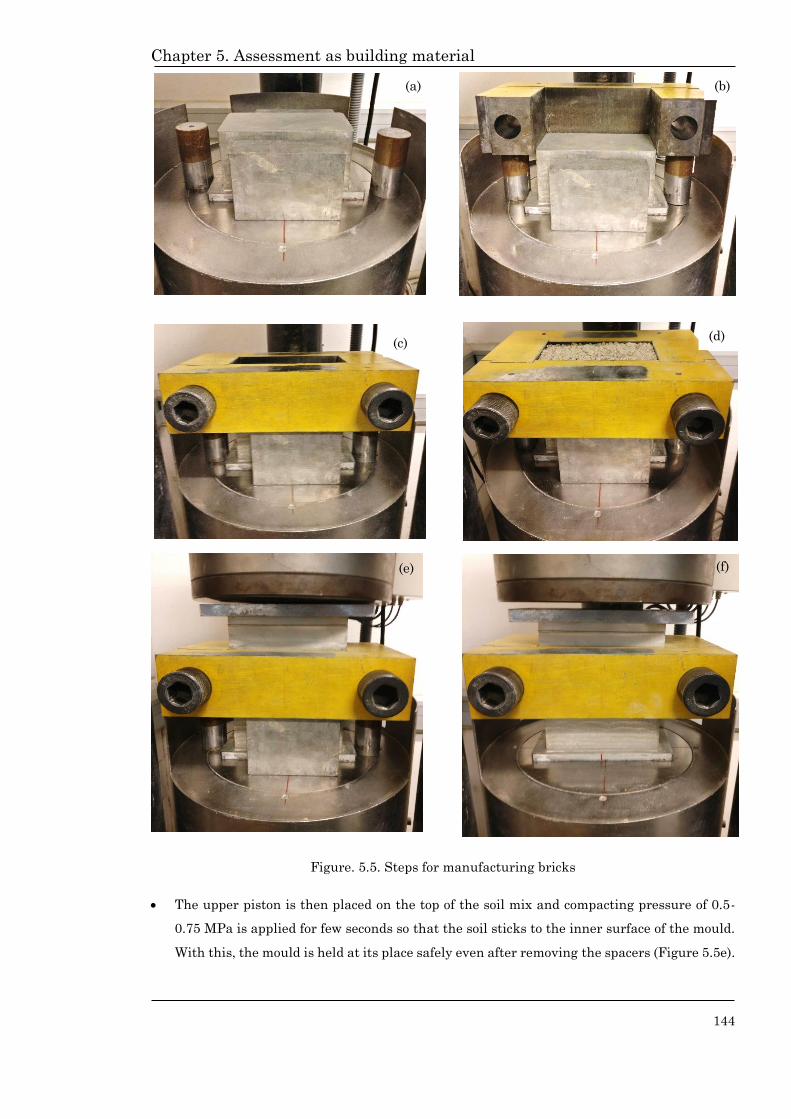
Chapter 5. Assessment as building material
144
Figure. 5.5. Steps for manufacturing bricks
• The upper piston is then placed on the top of the soil mix and compacting pressure of 0.5-
0.75 MPa is applied for few seconds so that the soil sticks to the inner surface of the mould.
With this, the mould is held at its place safely even after removing the spacers (Figure 5.5e).
(a) (b)
(d) (c)
(e) (f)
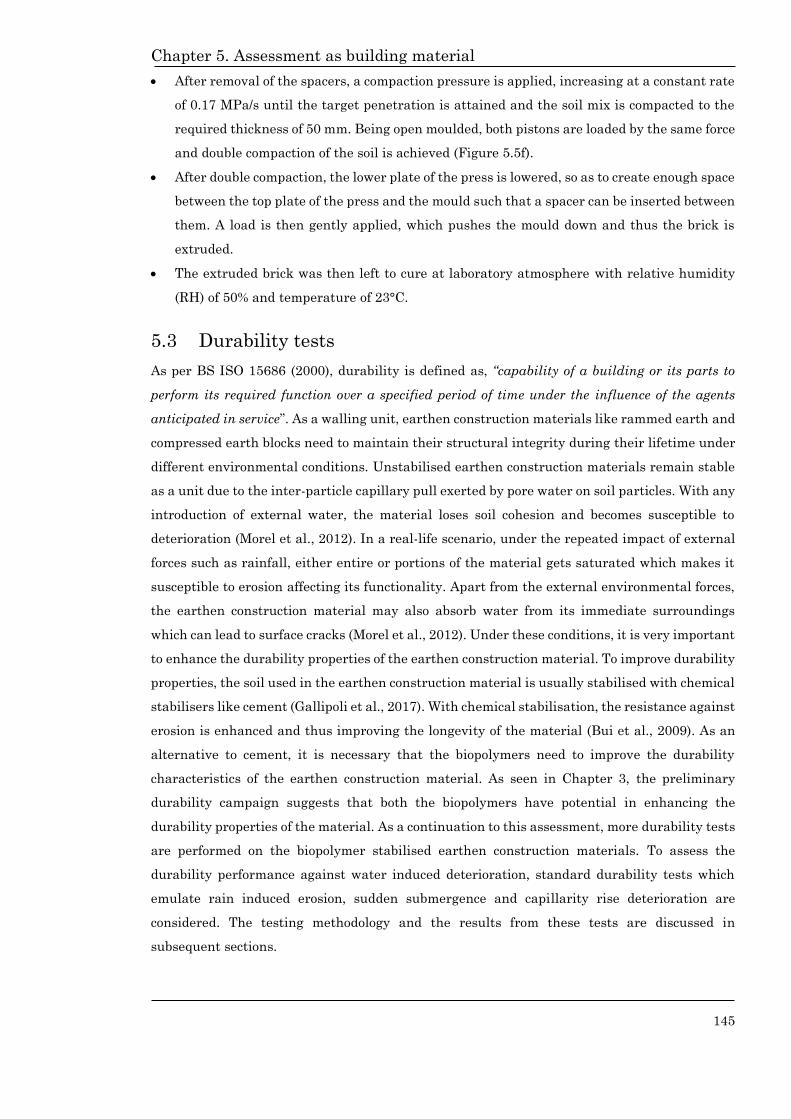
Chapter 5. Assessment as building material
145
• After removal of the spacers, a compaction pressure is applied, increasing at a constant rate
of 0.17 MPa/s until the target penetration is attained and the soil mix is compacted to the
required thickness of 50 mm. Being open moulded, both pistons are loaded by the same force
and double compaction of the soil is achieved (Figure 5.5f).
• After double compaction, the lower plate of the press is lowered, so as to create enough space
between the top plate of the press and the mould such that a spacer can be inserted between
them. A load is then gently applied, which pushes the mould down and thus the brick is
extruded.
• The extruded brick was then left to cure at laboratory atmosphere with relative humidity
(RH) of 50% and temperature of 23°C.
5.3 Durability tests
As per BS ISO 15686 (2000), durability is defined as, “capability of a building or its parts to
perform its required function over a specified period of time under the influence of the agents
anticipated in service”. As a walling unit, earthen construction materials like rammed earth and
compressed earth blocks need to maintain their structural integrity during their lifetime under
different environmental conditions. Unstabilised earthen construction materials remain stable
as a unit due to the inter-particle capillary pull exerted by pore water on soil particles. With any
introduction of external water, the material loses soil cohesion and becomes susceptible to
deterioration (Morel et al., 2012). In a real-life scenario, under the repeated impact of external
forces such as rainfall, either entire or portions of the material gets saturated which makes it
susceptible to erosion affecting its functionality. Apart from the external environmental forces,
the earthen construction material may also absorb water from its immediate surroundings
which can lead to surface cracks (Morel et al., 2012). Under these conditions, it is very important
to enhance the durability properties of the earthen construction material. To improve durability
properties, the soil used in the earthen construction material is usually stabilised with chemical
stabilisers like cement (Gallipoli et al., 2017). With chemical stabilisation, the resistance against
erosion is enhanced and thus improving the longevity of the material (Bui et al., 2009). As an
alternative to cement, it is necessary that the biopolymers need to improve the durability
characteristics of the earthen construction material. As seen in Chapter 3, the preliminary
durability campaign suggests that both the biopolymers have potential in enhancing the
durability properties of the material. As a continuation to this assessment, more durability tests
are performed on the biopolymer stabilised earthen construction materials. To assess the
durability performance against water induced deterioration, standard durability tests which
emulate rain induced erosion, sudden submergence and capillarity rise deterioration are
considered. The testing methodology and the results from these tests are discussed in
subsequent sections.

Chapter 5. Assessment as building material
146
5.3.1. Rainfall induced erosional tests
To assess durability performance against rainfall induced erosion, different approaches such as,
spray tests, wire brush tests, wet to dry strength ratio and drip tests are commonly employed.
Several researchers opine that the test conditions of spray tests (NZS 4298, 1998) and wire brush
tests (ASTM-D559, 1989; IS 1725, 2013) are more severe than the actual climatic condition
observed on site (Heathcote, 1995; Ogunye and Boussabaine, 2002; Walker et al., 2005; Guettala
et al., 2006; Morel et al., 2012). Assessment of durability through wet to dry strength ratio
approach is considered to be too severe and unrealistic in simulating the actual field conditions
(Kerali and Thomas, 2004; Morel et al., 2012). Furthermore, these tests may be considered
appropriate only for cement stabilised earthen construction materials. Considering the
uncertainties involved in these test methods, drip tests as recommended by NZS 4298 (1998)
were chosen in this study to assess durability performance against water erosion. Drip tests
emulate the erosional resistance of earthen construction material against impact of rainfall. In
the drip tests, within a fixed time span a known quantity of water is made to drip on the surface
of the test specimen and the eroded depth on the surface is measured. Based on the eroded
depth, the ability of the specimen to resist erosion is assessed. The drip test was originally
developed in Deakin University, Geelong to assist adobe owner-builders to determine the
suitability of the soil to prepare abode blocks (Yttrup et al., 1981). Later, Frencham(1982) based
on the performance of 20 earthen buildings against rainfall erosion developed a concept of
classifying the material based on Erodibility Index which correlates the drip test results with
real life performance. Based on the recommendations of Yttrup et al.,(1981) and
Frencham(1982), NZS 4298 (1998) describes the procedure of drip tests and associated material
categorisation. As an acknowledgement to the original inventors, NZS 4298 (1998) has named
the drip test as “Geelong” erosion test. Table 5.2 presents the classification of earthen
construction material based on drip test results as per NZS 4298 (1998)
Table 5.2. Classification of earthen construction material as per NZS 4298 (1998)
Property Criteria Erodibility Index
Depth of
Erosion
(mm)
5 D < 10 3
10 D < 15 4
D > 15 5 (fail)
5.3.1.1. Testing methodology
The main objective of this investigation was to compare the durability performance against
water erosion of biopolymer stabilised earthen constuction materials with unamended and
cement stabilised materials. For this comparative study, samples in the form of small cylinders
Chapter 5. Assessment as building material
147
(36mm diameter and 76 mm length) and thinner tiles (150 mm x 150mm x 20 mm) were
considered. As observed from the preliminary durability test results (refer Section 3.3.5)
biopolymer stabilised earthen cubes were less susceptible to erosion, hence preparation of
thinner tiles was considered to be more appropriate for this comparative study. Since the
thickness of the test specimen was reduced, it was possible to carry out a much larger number
of test replicates within a shorter duration of time. This increased the confidence in the
conclusions drawn from the test results which showed reduced variation.
Cylindrical samples were prepared via a similar procedure as described in Section
3.3.2.1, while tiles were prepared as described in Section 5.2.2.2. All samples were compacted to
achieve the maximum dry density of the engineered soil mix, i.e. 19.62 kN/m3. The Geelong
erosion tests were then performed on samples cured for 7 and 28 days. In total five different
biopolymer combinations were chosen for this investigation: two individually stabilised samples
and three synergistic combinations (see Section 3.3.3). For the individually stabilised specimens,
the biopolymer content was maintained at 2.0%. The performance of these samples was
compared with unamended and 8.0% cement stabilised specimens. A total of 35 cylinders and
35 tiles were prepared for this investigation.
Figure. 5.6. Test setup for Geelong erosion test
The test procedure involves dripping of 100 ml of deionised water within 60 minutes
from a height of 400 mm on to the surface of the sample, this simulates the effect of 500 mm of
annual rainfall (Heathcote, 1995). Morris (1994) observed that when a saturated wick was used
to generate water drops, the drip rate was not controllable. Similar observation was noted when
dripping of water was done thorugh burette during the preliminary durability tests. In order to
avoid this discrepancy and maintain a steady dripping rate of water, a peristaltic pump was
used. For the tile samples, the surface was kept at an inclination of 2H:1V, while for cylindrical
specimens the surface of erosion was held perpendicular (Figure. 5.6). As well as noting the final

Chapter 5. Assessment as building material
148
erosion at 60 minutes as recommended by the standard, the eroded depths were also noted at
intermediate 15 minutes intervals. The results presented herein are the average values of five
replicates (Figure 5.7). .
Figure. 5.7. Average depth of erosion for (a) tile specimens and (b) cylindrical specimens
5.3.1.2. Results and discussion
Figures 5.6a and 5.6b presents the final eroded depth after 60 minutes for both tile and
cylindrical samples for all the combinations considered. In each plot, for each combination, the
erosional depths measured at 7 and 28 days are plotted adjacent to each other. It can be observed
from the results that the unamended samples have higher depths of erosion for both tile and
cylindrical samples, while cement stabilised samples have negligible erosion. Based on the
recommendations of NZDS 4298 (1998), the erodibility indices for unamended and cement
stabilised specimens are 4 and 3 respectively, indicating that unamended specimens are more
prone to more erosion. For all combinations of biopolymer stabilised specimens, the final
erosional depths are well within 5 mm. Amongst biopolymer combinations, specimens with
higher combinations of xanthan gum have performed better. In addition, excluding unamended
specimens, all other tiled specimens have higher erosion depth than the cylindrical specimens.
The variation in erosion depth may be related to the angle of incidence at which the impact of
water occurs. Eassey(1997) suggested that the rate of erosion of the earthen construction
material is dependant on the angle of incidence and concluded that the highest rate of erosion
occurs when the impact is at an angle of 300 to the specimen surface, while least erosion occurs
when the impact is at an angle of 900. For tile specimens, the angle of incidence was maintained
at 270 which is very near to 300 where highest impact of erosion occurs. In the case of cylindrical
specimens, the impact occurred normal to the surface of the specimen, hence the observed depth
of erosion for cylindrical specimens are lesser than tile specimens.

Chapter 5. Assessment as building material
149
Figure. 5.8. Rate of erosion for (a) guar gum, 7 days, (b) guar gum, 28 days, (c) xanthan gum, 7
days, (d) xanthan gum, 28 days
To compare the individual performances of the biopolymers, the rate of erosion determined
during the drip tests was plotted (Figure 5.7). It can be observed from Figure 5.8, the rate of
erosion for xanthan gum stabilised specimens was less than that of guar gum stabilised
specimens. Further, a linear extrapolation was carried out in order to arrive at the time required
to achieve an erosion depth of 5 mm. Practically, a linear relationship of erosion with time is an
highly unlikely situation, as the factors which influence erosion such as rainfall intensity, angle
of impact and duration of rainfall are highly variable. However, past studies have incorporated

Chapter 5. Assessment as building material
150
linear extrapolation of erosion to obtain fair indication on the erosional resistance of the material
(Bui et al., 2009). It can be observed from Figure 5.7, in comparison to 7 day specimens, the rates
of erosion for guar gum stabilised specimens at 28 days are higher, indicating with aging, the
specimens tend to erode faster. As noted in Chapter 3, guar gum stabilised samples tend to lose
tensile strength when the nature of hydrogels change to “glassy” state. In this state, the network
of hydrogels which connects soil particles with weaker hydrogen bonds can be easily broken
under low tensile stresses. On repeated impact of water in erosion tests, it can therefore be
expected of 28-day specimens with lower tensile strength to have higher erosion rates than 7-
day specimens. In the case of xanthan gum, the additional ionic bonds which provide higher
tensile strength after 28 days (Figure 3.14b), may provide necessary resistance against erosion
even when the hydrogels are in glassy state. This could explain why the observed rates of erosion
are similar for 7-day and 28-day xanthan gum stabilised specimens. The test results clearly
indicate that the addition of biopolymers certainly improves the erosional resistance of earthen
construction materials, and since it possesses better stabilisation mechanisms, xanthan gum
has better performance. Any future studies to understand the durability performance of
biopolymer stabilised earthen construction materials in an in-situ condition would improve the
confidence on these novel stabilisers.
5.3.2. Contact tests
The prime objective of a contact test in this context is to assess the response of a brick to moisture
absorption in a condition which stimulates the application of a mortar joint, so this test would
be only appropriate when the earthen construction material is used as compressed earth blocks.
Contact tests were performed for unamended, guar gum and xanthan gum stabilised bricks.
Bricks were prepared in accordance with the procedure described in Section 5.2.2.4 and the
stabiliser content for biopolymer stabilised bricks was kept constant at 2.0 % of the dry soil
mass. The contact tests were performed after 28 days of brick preparation. Prior to the start of
the test, the brick specimens were left to equalise in a climatic chamber under 50% RH and 23°C
for 48 hours.
Figure. 5.9. Test Setup for Contact test
Test Brick
Absorbent Cloth

Chapter 5. Assessment as building material
151
5.3.2.1. Test procedure
The test procedure used in this study is in accordance to DIN 18945 (2013). It consists of
applying a wet cellulose cloth on the intermediate face of the brick, which simulates the mortar
joint or coating (Figure 5.9). The amount of water in the wet cloth is set equivalent to 0.5 g/cm2
which is an average amount of water contained in a 15 mm thick mortar layer (Schroeder, 2016).
The brick along with the wet cloth is then placed in a container and is supported by a metallic
block. It is ensured that the container is filled with some water at the bottom to ensure humid
environment. The container is then sealed for 24 hours. After 24 hours, the brick is removed
from the container and exposed to atmospheric conditions for 48 hours. The brick is then visually
examined for any cracks or swelling which would lead to permanent deformations due to water
absorption.
Figure. 5.10. Conditions of bricks before and after contact tests for, (a) unamended bricks, (b)
guar gum stabilised bricks, and (c) xanthan gum stabilised bricks
5.3.2.2. Test results
Figure 5.10 shows the condition of bricks before and after the completion of contact tests for
unamended, guar gum and xanthan gum stabilised bricks. It can be observed that all bricks
showed no signs of visible cracks after completion of the tests. As noted in Chapter 3, the soil
mix, which has kaolinite as the principal clay mineral, has a linear shrinkage value of 5.0 %,
indicating the soil is less prone to cracking (NZS 4298, 1998). With this property, the
unstabilised brick may be less susceptible to cracks under these experimental conditions. It is
interesting to note, biopolymer stabilised soil mixes which exhibited higher linear shrinkage
values showed no visible cracks (see Section 3.3.1.2). As the tests were conducted after 28 days
(a) (b) (c)

Chapter 5. Assessment as building material
152
of curing, it may be expected that the hydrogels formed due to biopolymer stabilisation were in
a glassy state and therefore might resist shrinkage thus inhibiting crack formation on the brick
surfaces.
5.3.3. Suction tests
Suction tests investigate the durability of earthen blocks when exposed to an excess supply of
water. Suction tests emulates the capillarity water rise from the foundation to the walls of the
earthen building (Bruno, 2016). Similar to the contact test, suction tests were performed for
unamended, guar gum and xanthan gum stabilised bricks. The bricks used in suction tests were
prepared as per the procedure described in Section 5.2.2.4. Once again, the stabiliser content for
biopolymer stabilised bricks was kept constant at 2.0 % of the dry soil mass. Suction tests were
performed after 28 days of brick preparation. Test bricks were conditioned under standard
atmospheric condition (23 ± 20C, 50 ± 5% RH) for about 48 hours.
5.3.3.1. Test procedure
The test procedure followed is in accordance with DIN 18945 (2013). A support made of a
conventional fired brick with an absorbent cloth on top is placed inside a container. The
container is then filled with water up to 1-5 mm below the upper edge of the fired brick (Figure
5.11). After this, the test brick is placed over the absorbent cloth, which marks the start of the
suction test. Water is maintained at this level, as it is absorbed by the earthen bricks. Samples
are then visually assessed at intervals of 30 minutes, 3 hours and 24 hours from the beginning
of the test in order to detect cracks and permanent deformations owing to swelling.
Figure. 5.11. Test setup for the suction test
Absorbent Cloth
Test Brick
Water Level

Chapter 5. Assessment as building material
153
Series Before the test After 24 hours
Unamended bricks
Guar gum – 2.0%
Xanthan gum – 2.0%
Figure. 5.12. Condition of bricks before and after the suction tests

Chapter 5. Assessment as building material
154
5.3.3.2. Test results
Figure 5.12 shows the condition of bricks before and after the completion of suction tests for
unamended, guar gum and xanthan gum stabilised bricks. Similar to contact tests, all bricks
showed no signs of cracking or swelling, however it was observed that the surface of the brick
(about 2-3 mm) was softened at the end of the test. As discussed previously, the unamended soil
mix has a linear shrinkage value of 5.0%. This indicates that the soil mix has better volumetric
stability and less suspectible to cracking or swelling. With these characteristics, it can be
expected that the unamended bricks to resist deterioration in suction tests. In case of biopolymer
stabilised bricks, after 28 days of preparation, it can be expected that the hydrogel formations
to be predominantly in glassy state which would resist deterioration within the time frame of
the test.
5.3.4. Dip tests
The dip test, as described in DIN 18945 (2013) assesses resistance of earthen materials to
deterioration during suspension in water rather than absorption (Schroeder, 2016). This test
emulates sudden flooding or immersion of earthen material in water, e.g. the effect on a wall in
a flooding incident, and is clearly a seriously difficult test for an uncemented material. Dip tests
were performed on unamended, guar gum and xanthan gum stabilised bricks.
5.3.4.1. Test procedure
Figure 5.13 shows the test setup for dip tests. Before the start of the test, the mass of the test
bricks are recorded. Using a mounting device, the brick is lowered 10 cm into water for 10
minutes. After this specified time, the brick is removed from the water bath and allowed to dry
at 400C, and is then placed under atmospheric conditions to cool before its final mass is
measured. The loss of mass is then calculated through the differences of initial and final masses
weighed.
Figure. 5.13. Test setup for dip tests
Test brick
10 cm

Chapter 5. Assessment as building material
155
5.3.4.2. Test results
Figure 5.14 shows the mass loss for all the bricks tested. It can be observed that the loss of mass
of unamended bricks are significantly higher than for biopolymer stabilised bricks; the loss of
mass of unamended bricks is greater than 15 %. However, in the cases of both guar and xanthan
gum stabilised bricks the observed loss of mass was less than 5 %. Furthermore, it was noticed
that for guar stabilised bricks, after drying the sample at 400C, the immersed portion of brick
was slightly moist as compared to the unimmersed portion of the brick. Figure 5.15 shows the
conditions of bricks immediately after removing from water for all bricks.
Figure. 5.14. Loss of mass for all the bricks after dip tests
Figure. 5.15. Conditions of bricks after dip tests: (a) unamended brick, (b) guar gum stabilised
brick and (c) xanthan gum stabilised brick
(a) (b) (c)

Chapter 5. Assessment as building material
156
5.3.5. Discussion on durability tests
The primary objective of contact and suction tests is to assess the resistance of earthen
construction material against moisture ingress caused by capillary phenomenon of water. Under
the given test conditions, when the test specimen comes in contact with the wet absorbent cloth,
water enters the specimen and is held within the pores of the soil through capillary and
adsorbtive action. Later, on drying, the water evaporates leaving the pore spaces filled with air.
Under this cycle of wetting and drying, the ability of the clay mineral to swell due to absorption
of water determines the overall extent of swelling of the earthen material and in turn, the
formation of cracks. The unamended soil mixture used consists of refined kaolin which has
kaolinite as the principal clay mineral, which amongst all the clay minerals has least affinity
towards water and it is less suspectible to volume changes (Terzaghi et al., 1963). As supported
by the linear shrinkage values presented in Chapter 3, it can be expected that the unamended
bricks would therefore anyway be less prone to crack formation due to capillary action and this
is confirmed here by the test results of contact and suction tests. In the case of biopolymer
stabilised earthen bricks, though the observed linear shrinkage values were higher than an
unamended soil mix (as seen in Chapter 3), the effect of capillary action of water on volume
changes of the test specimens seem to be less pronounced than unamended bricks. This may be
linked to the age of the bricks on which these tests were conducted. Both the contact and suction
tests were performed on bricks left to cure for 28 days. At this stage, it can be expected the
hydrogels formed within the bricks due to the presence of biopolymers will primarily be in a
glassy state and thus provide necessary resistance against moisture ingress caused due to
capillary action.
Test results obtained from dip tests clearly show the inability of unamended bricks to
withstand immersion. During the dip test, as the mounted brick is half immersed , the immersed
portion saturates rapidly which significantly reduces the soil suction which binds the soil
particles when in an unsaturated condition. In addition, under the action of gravity, the
immersed portion of the brick tends to settle down in water, while the other end of the brick is
fixed, this tends to create tensile stresses within the immersed portion of the brick. As observed
in Chapter 3, the tensile strength of the unamended engineered soil mix in unsaturated
condition was lesser than cement and biopolymered stabilised soil mix. It can therefore be
expected during immersion when the soil suction is less, the mobilised tensile strength will be
negligible. In this condition, the unamended brick can be expected to deteriorate rapidly. In the
case of biopolymer stabilised samples, when subjected to immersion, the hydrophilic hydroxyl
groups at the outer chains of the biopolymer absorb and hold water (Gulrez et al., 2011). Further
as water is absorbed within the chains of biopolymer and fills up the voids, the hydrogels within
the soil matrix tend to swell slightly before starting dilution. The amount of water absorbed and
held within the chains of biopolymer and the time taken for dilution depends on the intrinsic
chemical properties of the biopolymer (Gulrez et al., 2011). It can be observed from the test

Chapter 5. Assessment as building material
157
results, there is negligible loss of mass for both guar and xanthan gum stabilised bricks, while
for the guar gum stabilised bricks, even after drying the sample at 400C, the immersed portion
of the brick was slightly moist. From this observation, it may be concluded that within the time
period of the test, the biopolymer chains may have only absorbed water and hydrogels may not
have reached the stage of dilution to cause any deterioration. Furthermore guar gum’s higher
affinity towards water may hold more water between polymer chains and soil pores on
immersion (Nugent et al., 2009).
Compressed earth blocks can be classified into different categories based on their
performances against different durability tests as per the recommendation given by DIN 18945
(2013) (Table 5.3). Based on these recommendations, the tested specimens in this study are
classified in Table 5.4. It can be noted that, apart from dip tests, unamended bricks fare well in
contact and suction tests, however, with the addition of biopolymers, earthen bricks have
acceptable performance also in dip tests which enhances their classification to Ia. With this
improvement, biopolymer stabilised earthen blocks could potentially be competitive for external
walls exposed to natural weathering.
Table 5.3. Classification of compressed earth blocks as per DIN 18945 (2013).
Class Application Contact tests Suction tests
(h)
Dip tests
Mass loss (%)
Ia External wall exposed to
natural weathering No cracks and
no permanent
swelling
deformation
24 h 5%
Ib Coated external wall 3 h 5%
II Internal wall 0.5 h 15%
III Dry applications No requirement No requirement No requirement
Table 5.4. Classification of earthen construction materials as per DIN 18945 (2013).
Series Contact tests Suction tests Dip tests
Unamended Ia Ia III
Guar gum Ia Ia Ia
Xanthan gum Ia Ia Ia
The beneficial effect of biopolymer stabilisation is also more evident in another adverse
durability test, i.e. the “Geelong” erosion test. The depths of erosion as observed in these tests
were as low as 2.0 mm for biopolymer stabilised earthen materials, while for unamended
samples it was in the range of 8.0 - 10.0 mm. Based on the recommendations given by
Frencham(1982), biopolymer stabilised earthen material having depth of erosion less than 5.0
mm can be classified as “slightly erodible”. In terms of NZS 4298 (1998), biopolymer stabilised
bricks which have depth of erosion less than 5.0 mm should then be subjected to a more precise

Chapter 5. Assessment as building material
158
durability assessment undertaken by more adverse durability test such as spray test. From
these observations, it can be concluded that the addition of biopolymers has certainly improved
the erosional resistance of earthen material and this also arises a scope for future studies to
assess their durability performances through more vigorous durability tests such as spray tests.
5.4 Hygroscopic behaviour of earthen construction materials.
The hygorscopicity of the earthen construction materials is the ability of the material to achieve
equilibrium with vapour pressure in its environment. This property of the material determines
the indoor air quality and humidity within the building in which they are employed. Padfield
(1998) and Padfield and Jensen(2011) have previously recognized that unstabilised earthen
construction materials have better hygroscopic characteristics which can self-regulate indoor
humidity and hence add to these material’s utility and green credentials. However, as noted by
McGregor et al.,(2014) and Arrigoni et al.,(2017), addition of chemical stabilisers like cement
reduces the hygroscopic property of the stabilised earthen construction materials. On the other
hand, as noted from the suction tests (in Chapter 3 and Chapter 4), under similar environmental
conditions, biopolymer stabilised soils tend to retain more water compared to unamended soils.
This property of biopolymers to retain more water within soil may aid the hygroscopic behaviour
of biopolymer stabilised earthen construction materials and it is this topic which is the subject
of the following sections.
5.4.1. Test methodology
To assess the hygroscopic behaviour of biopolymer stabilised earthen construction materials,
the moisture buffering values (See 2.2.4.3) of these materials were compared with unamended
and cement stabilised materials. As discussed in Chapter 2, though there are different test
procedures to obtain moisture buffering values, the most commonly used method for earthen
construction materials is the NORDTEST method (McGregor et al., 2016). It was considered
appropriate to follow the NORDTEST for the present investigation, so that the moisture
buffering values of biopolymer stabilised specimens could be easily compared with other
reported literature data. As per the NORDTEST, the minimum exposed surface area of the
specimen should be 0.010 m2, in order to satisfy this test requirement, cylindrical specimens of
50 mm diameter and 100 mm length were considered. During the test, the cylindrical specimens
are placed in disposable aluminium cups exposing its top and lateral surfaces while sealing its
bottom surface (Figure 5.14b). Under this condition, the exposed surface area for a cylinder
would be about 0.018 m2 which is higher than the minimum requirement. Three identical
specimens were prepared for unamended, cement and biopolymer stabilised samples. For
biopolymer stabilised specimens, the stabiliser content was maintained at 2.0% of the dry soil
mass, while for cement stabilised samples it was 8.0% of dry soil mass. Cylindrical samples were
prepared according to the procedure described in Section 5.2.2.3.

Chapter 5. Assessment as building material
159
Further in order to investigate the influence of sample scale on the hygroscopic
properties of the material, a comparison of hygroscopic behaviour was made between cylindrical
samples and bricks for biopolymer stabilised specimens. For both biopolymers, bricks were
prepared according to the procedure described in Section 5.2.2.4. For the bricks, all but one
largest face (200 mm x 100 mm) was sealed using aluminium tape to obtain an exposed surface
area of 0.020 m2 (Figure 5.14c). After preparation, all samples were left to cure for 28 days in
laboratory atmosphere with relative humidity of 50% and temperature of 23°C. Practically,
cement stabilised earthen materials are wet cured in order to maximise the efficiency of cement
stabilisation. It was considered that it would be appropriate to compare the hygroscopic
behaviour of cement stabilised samples in these conditions. Hence, cement stabilised cylinders
were wet cured by ensuring they stay moist by wrapping the samples by wet cloth. The
temperature during the test was maintained constant at 23°C. It is important to note here that
the effect of temperature on moisture buffering tests is negligible for temperatures between 20°C
and 70°C (Kast and Jokisch, 1972; Padfield and Jensen, 2011). Moisture buffering tests were
performed inside the climatic chamber CLIMATS Type EX2221-HA at SIAME Laboratory in
UPPA (Figure 5.16a).
Figure. 5.16. Moisture buffering tests, (a) Climatic chamber and (b) Cylindrical samples and
(c) Brick samples
(a)
(b)
(c)

Chapter 5. Assessment as building material
160
Prior to the start of the test, the initial dimensions of all samples were recorded and samples
were then left to equalise under a temperature of 23°C and relative humidity of 33% until the
observed mass variation of a sample was less than 0.1%. All samples took about 15-18 days to
equalise under the set ambient conditions. After equalisation, sample dimensions were noted
for any variation with the initial dimensions. The samples were then exposed to cycles of a high
humidity level of 75% RH for 8 hours and followed by a low humidity level of 33% RH for 16
hours as per the NORDTEST requirements. Sample masses were recorded at regular intervals
by means of a weighing scale having a resolution of 0.01 grams. After all samples reached two
stable cycles, they were removed from the climatic chamber and their final dimensions were
recorded. For the stable cycle, the MBVpractical for a given material is determined using equation
(2.1).
5.4.2. Test results
5.4.2.1. Moisture absorption curves
The results of moisture buffering tests are presented in the form of moisture absorption curves.
Moisture absorption is defined as ratio of mass variation (i.e. difference in sample mass between
two different readings) to its exposed surface area. Total exposed surface area of each sample
was calculated based on their measured dimensions. At the end of moisture buffering test, it
was observed that all samples had negligible variation between initial and final dimensions.
Figure 5.17 shows moisture absorption curves for all cylindrical samples, while Figure 5.16
shows moisture absorption curves for biopolymer stabilised samples for both cylindrical and
brick samples.
Figure. 5.17. Moisture absorption versus time for all cylindrical samples

Chapter 5. Assessment as building material
161
From Figure 5.18, it can be observed that, for all samples after initial two cycles, the amount
of water absorbed during high humidity (uptake) is equal to the amount of water released
(release) during low humidity. At this condition, the material is said to be in equilibrium with
the selected humidity conditions and for this condition the moisture buffering value of the
material can be determined. Comparing cylindrical and brick samples for both biopolymers
(Figure 5.16), bricks took longer to achieve equilibrium. This may be due to the sample geometry
and direction in which moisture movement (i.e. adsorption and desorption) occurs. In the case
of cylinders, the moisture movement occurs across the lateral radial and top surfaces of the
cylinder, this would ensure that the interior parts of the cylinder achieve equilibrium quickly.
In the case of a brick, where all but one surface is sealed, moisture movement occurs only in one
direction and hence more time may be needed to ensure the lower portion of the brick (i.e. the
portion adjacent to the sealed surface) is in equilibrium.
Figure. 5.18. Moisture absorption versus time for all biopolymer stabilised samples
Figures 5.19a and 5.19b show the moisture absorption curves at the last stable cycle for both
guar gum and xanthan gum stabilised samples respectively. Moisture absorption curves for
unamended and cement stabilised samples are also plotted. It can be noted from these figures,
at the given ambient conditions, biopolymer stabilised earthen materials retain more water
within the soil matrix than unamended and cement stabilised earthen materials. Moisture
absorption of unamended samples is primarily dependent on the clay mineral present in the soil
mix, i.e. kaolinite. Having least affinity towards water, it can be expected that the amount of
moisture absorbed by unamended samples would be correspondingly low (McGregor et al., 2014).
In the case of cement stabilised samples, the addition of cement leads to the formation of

Chapter 5. Assessment as building material
162
cementitous products which cover the clay surface and thus reduce the moisture absorption
capabilities (Arrigoni et al., 2017). In the case of biopolymer stabilised samples, in addition to
the clay activity, the ability of hydrogels to absorb or diffuse moisture under varying ambient
conditions may affect moisture absorption (Kocherbitov et al., 2010). Having natural affinity
towards water, it can be expected that the biopolymer stabilised earthen materials will absorb
more water at higher humidities. Between the biopolymers, xanthan gum stabilised samples
have slightly higher moisture absorption than guar stabilised samples. These results concur
with the observed soil-water retention behaviour of biopolymer stabilised soils as discussed in
Chapter 4, which clearly show that xanthan gum retains more water than guar gum over a
range of water contents. With better moisture retention capabilities, it is therefore no surprise
that both guar and xanthan gum stabilised earthen materials have retained more moisture
during the test.
Figure. 5.19. Comparison of moisture absorption for the last stable cycle, (a) guar gum and (b)
xanthan gum
5.4.2.2. Moisture buffering value
The characteristic moisture buffering value of a material is the one which has same MBV value
during the uptake and release portions of the humdity cycle (i.e, MBVuptake is equal to
MBVrelease). To determine this parameter, moisture buffering values during uptake and release
over the cycles in the tests have been plotted for both guar and xanthan gum stabilised
specimens along with unamended and cement stabilised specimens in Figures 5.20 and 5.21
respectively. For the final characteristics moisture buffering values obtained, a comparison is
made for all specimens considered in this study in Figure 5.20.
(a) (b)

Chapter 5. Assessment as building material
163
Figure. 5.20. Moisture buffering value (uptake versus release) – guar gum samples
Figure. 5.21. Moisture buffering value (uptake versus release) – xanthan gum samples
It can be observed from Figure 5.22, that the final moisture buffering values of biopolymer
stabilised samples are higher than unamended and cement stabilised samples. With lower

Chapter 5. Assessment as building material
164
moisture absorption capabilities it can be expected that the moisture buffering values of cement
stabilised samples are lesser than unamended samples. This is in concurrence with the
literature which states that cement stabilisation of earthen materials reduces the moisture
buffering value and thus its hygroscopic behaviour (McGregor et al., 2014; Arrigoni et al., 2017).
However, it is interesting to note that unlike cement stabilisation, biopolymer stabilisation
improves the hygroscopic properties of the earthen material as judged by the increase in MBV.
As noted previously, the interactions of hydrogels with moisture due to changes in ambient
conditions enables it to retain more water leading to its improved hygroscopic behaviour. This
is an important finding further supporting the practical use of biopolymer stabilisation
considering that while the addition of cement improves mechanical and durability properties, it
comprises the hygroscopic properties of the earthen construction material. As an alternative to
cement, biopolymers appear to be prospective alternative stabilisers which not only provide
necessary mechanical and durability properties, but also improve the hygroscopic behaviour of
earthen construction materials. .
Figure. 5.22. Moisture buffering value (MBVpractical) for all samples
Figure 5.23 presents the moisture buffering values of all the tested samples along with
other materials taken from the literature. In this comparison, moisture buffering values of test
specimens determined only through the NORDTEST method have been considered. A
comparison is made with the moisture buffering values of fired brick and concrete as determined
by Rode et al., (2005). Further, MBV values of earthen construction materials as determined by
Allinson and Hall, (2012), Mcgregor et al., (2014; 2014), Oudhof et al., (2015). Arringoni et al.,
(2017) are also plotted along with the MBV classification as proposed by Rode et al., (2005). The
moisture buffering values for the specimens tested in this study varied from 0.55 – 1.05
g/m2%RH, and with these values most of the samples tested can be classified into the “moderate”

Chapter 5. Assessment as building material
165
category, and only the xanthan gum stabilised brick falls into “good” category (Figure 5.21). It
can be noted from the figure that the hygroscopic properties of biopolymer stabilised earthen
construction materials are better than some conventional building materials such as fired brick
and concrete. Also, in concurrence to the findings of McGregor et al. (2014) and Arrigoni et al.
(2017), the moisture buffereing values of cement stabilised samples from the present study were
found to be lower than for the unamended samples. At the same time, it can be observed that
the moisture buffering values of unamended and cement stabilised samples from the present
study seem to be lower than the reported values in the literature. These lower values may be
attributed to the factors which control hygroscopic properties of earthen materials, i.e. soil
gradation and principal clay mineral in the soil mix. It is well known that under similar
hygrothermal conditions, finer soil particles retain more water than coarser particles (Jaquin et
al., 2008; Beckett and Augarde, 2012). Hence, higher percentages of fine particles in the soil mix
would contribute to higher moisture buffering values. The reported higher moisture buffering
values of compressed earth blocks by McGregor et al., (2014) could therefore be attributed to a
difference in percentage of clay than the material in the current study.
Figure. 5.23. Comparison of moisture buffering values of present study with literature data
Arrigoni et al.,(2017) studied the effect of chemical stabilisers on the hygroscopic
properties of stabilised rammed earth materials prepared also using an engineered soil mixture
and moisture buffering values were obtained also for a natural soil. It can be noted from Figure
5.21, the hygroscopic properties of the earthen construction material prepared with natural soil
(denoted as RE_Pise) is quite high in comparison with those prepared with engineered soil mix
(ELS). Further, the addition of cement has even more reduced the moisture buffering value of

Chapter 5. Assessment as building material
166
the material. From this study it is evident that the type of soil used for manufacturing earthen
construction materials controls its hygroscopic behaviour, which is of course somewhat obvious.
In the present study, the earthen construction materials were also prepared using an engineered
soil mix consisting of a clay fraction of refined kaolin. Refined kaolin was preferred over natural
kaolinitic soils primarily to control the effect of clay mineralogy while understanding the
behaviour of biopolymer stabilisation; a similar approach has been considered in past studies of
earthen construction materials (Liuzzi et al., 2013; Corbin and Augarde, 2015). By using refined
kaolin, however, the engineering behaviour of the prepared soil may be atypical to that of
natural soil due to its defined particle size gradation and plasticity properties (Rossato et al.,
1992). Having only kaolinite as the dominant clay mineral, which has least affinity towards
water of the clay minerals (Etzion and Saller, 1987), it can be expected that moisture buffering
values of the material prepared here to be lower than those of materials prepared with natural
soils. Clearly, further work is necessary to assess the behaviours of biopolymer stabilisation on
earthen materials with different dominant clay minerals, but the results to date are
encouraging.
5.5 Recyclability potential of earthen construction materials.
Unlike unstabilised earthen construction materials, which can be easily recycled by being
broken up, chemically stabilised materials can present issues for recycling (Gallipoli et al.,
2017). Cement stabilised earthen construction materials are usually downcycled rather than
getting completely recycled, due to the high energy intensive processes involved to recycle it and
retrieve back the original soil properties (Schroeder, 2016). As noted in Chapter 3, the
stabilisation process for both the biopolymers is different from cement, where stabilisation is
achieved through “hydrogels” rather than cementitous products. Considering the physical
characteristics of hydrogels, lower energy intensive processes may be needed to recycle
biopolymer stabilised earthen construction materials. If biopolymer stabilised materials require
less energy intensive processes to recycle, that may become attractive and economically viable
building material leading to lower production of construction waste. In this section a brief study
of the recycling potential for biopolymer stabilised earthen construction materials is presented.
5.5.1. Materials
The tile specimens used in the durability tests detailed in Section 5.3.1 were used to assess the
recyclability potential of biopolymer stabilised earthen construction materials. The aim of
recyclability tests was to compare physical properties of the recycled material with the original
engineered soil mix which comprised 20% kaolin, 70% sand and 10% gravel by mass.

Chapter 5. Assessment as building material
167
5.5.2. Recycling Procedure
True recycling of earthen construction materials means retrieval of the original desired soil
properties, i.e. soil gradation and plasticity, so that it can be re-used again for earthen
construction (Schroeder, 2016). To achieve this, soil washing, a water-based process which
separates the coarse soil fraction from finer particles was considered in this study (Griffiths,
1995). The surface of the tiles was cleaned off using a wire brush. The tiles were then broken
down gently into smaller pieces using a wooden mallet. A known mass of this disintegrated
earthen material was soaked in deionised water. After 1 hour of soaking, any lumps of soil were
disintegrated manually and a slurry consistency was achieved. The slurry was then left to settle
for 24 hours before being tested for particle size analysis, Atterberg limits and linear shrinkage
tests. Additionally, chemical tests were performed on the water collected after soil washing.
5.5.3. Test method and results
5.5.3.1. Particle size analysis
The prepared slurry was washed through a 63 µm sieve to separate the coarse fraction of the
soil mixture from the finer particles. Both soil fractions were then oven dried at 100 50C for 24
hours, after which, the dried coarse fraction was weighed and particle size variation was
obtained through dry sieve analysis as per BS 1377-2 (1990). Sedimentation analysis by the
pipette method was performed for the fine fraction of the soil mixture as per BS 1377-2 (1990).
Particle size distributions were obtained for both biopolymer stabilised soils and the unamended
soil mixture and the results are plotted in Figure 5.22.
From Figure 5.24, it can be noted that the recycled soil mixtures have larger coarser
fractions and smaller finer fractions in comparison to the unamended soil mixtures. These larger
coarser fractions of the recycled soil mixtures can be attributed to the formations of soil
agglomerations due to biopolymer stabilisation (Latifi et al., 2017). On recycling much of these
agglomerations have however disintegrated for the guar gum stabilised soil mixture, while many
agglomerations have remained intact for the xanthan gum stabilised soil mixture. Compared to
guar gum, xanthan gum form ionic bonds with clay particles in addition to hydrogen bonds which
are chemically stronger (Chen et al., 2013; Chang et al., 2015). Due to these additional stronger
bonds, xanthan stabilised soil mixture could be expected to have many agglomerations which
resist washing, certainly under these test conditions. In both cases, the recycled soil mixture
cannot be used as it is again for preparing earthen construction materials as per the
recommendation given by MOPT (1992) and AFNOR(2001), however slight modifications to the
recycled soil mixtures would ensure that the soil gradation falls within the recommended limits.
Certainly were a soil mix chosen more to the middle of the allowable range, recycling would
appear to be directly possible.

Chapter 5. Assessment as building material
168
Figure. 5.24. Comparison of particle size distribution of engineered soil mix with recycled soil
mixes
5.5.3.2. Atterberg limits and Linear Shrinkage tests
For these tests, the recycled soil mixtures slurry as mentioned in Section 5.5.2 was placed on a
425 µm sieve and washed thoroughly using deionised water. Washing was continued until clear
water and no visible soil fines passed through the 425 µm sieve. The soil fraction passing was
collected and oven dried for 24 hours at 100 50C. After 24 hours, the dried soil fraction was
broken down into smaller fractions and mixed thoroughly with deionised water until a stiff
consistency was achieved. This mixture was left to equilibrate in air-tight polythene bags for 24
hours, after which Atterberg limits and linear shrinkage tests were performed as per BS 1377-
2 (1990). The results are presented in Figures 5.23 and 5.24 respectively.
Figure 5.25 presents plasticity characteristics of unamended, stabilised and recycled
earthen materials along with standard recommendations for earthen materials (Houben and
Guillaud, 1994; AFNOR, 2001). The liquid and plastic limits of the unamended soil mixture were
36.1% and 18.7% respectively. When the soil mixture was stabilised with 2.0% biopolymer
content, the Atterberg limits for both biopolymer stabilised soils increased and this increase was
more significant for guar gum stabilised soils. The fines fraction of the soil mixture was initially
classified as CI i.e., clay of intermediate plasticity. In the biopolymer stabilised soils, for guar
gum, the fines fraction of the soil mixture was classified as CH i.e., clay of high plasticity, while
for xanthan gum it was classified as CI. These differences in Atterberg limits for guar and

Chapter 5. Assessment as building material
169
xanthan stabilised soils are mainly due to the different stabilizing mechanisms of the
biopolymers (as discussed in Chapter 3).
Figure 5.25. Plasticity properties of the unamended, stabilised and recycled material
Compared to xanthan gum, guar gum has higher affinity towards water (Nugent et al., 2009)
and this may have led to the higher water contents at Atterberg limits for the guar gum
stabilised soil mixture. After recycling, the plasticity properties of the guar gum stabilised
specimens were similar to that of the unamended soil mixture. As indicated the primary bonding
for guar gum stabilised soils is achieved only through hydrogen bonds and on recycling these
bonds are easily broken and the stabilisation is lost (Nugent et al., 2009; Chen et al., 2013).
Thus, the stabilised material can be recycled easily ensuring the original plasticity
characteristics of the soil mixture are retrieved back.
In the case of the xanthan gum stabilised soil mixture, bonding of the soil particles occurs via
a different mechanism (as discussed above) and with these bonds, the xanthan gum stabilised
soil mixture may form a complex network of soil agglomerations, thus stabilising soil and
trapping free water (Chen et al., 2013). Interestingly, the Atterberg limits of the recycled soil
mixture were different to the stabilised soil mixture, changing the fines fraction classification
to CH. As noted in the previous section, even after soil washing, it appears that many soil
agglomerations remained stable. At the liquid limit, these agglomerations require more water
for remoulding to achieve the liquid limit consistency. Hence, the observed liquid limit for
recycled soil mixture is higher than that of stabilised soil mixture. However, the plastic limits
for both the stabilised and recycled soil mixtures were similar.

Chapter 5. Assessment as building material
170
Figure 5.26. Variation of Linear Shrinkage
Switching to shrinkage tests, it can be observed that the linear shrinkage of the unamended soil
mixture was 5.0% (see Fig 3) while the linear shrinkage of the guar gum stabilised samples was
higher. This increased value of linear shrinkage may be linked to the high affinity of guar gum
towards water (Nugent et al., 2009) leading to formation of hydrogels through hydrogen bonding.
However, on recycling, these bonds are removed and thus the recycled material has similar
linear shrinkage value as that of the unamended soil mixture at 6.2%. In the case of xanthan
gum, the additonal stronger ionic bonds with weaker hydrogen bonds has lead to more stable
soil agglomerations and hence the lower shrinkage value. On recycling, the outer chains of
hydrogel which primarily bond through hydrogen bonding may have been completely removed
and at the same time the soil agglomerations which are bonded through stronger ionic bonds
may have been disturbed. Further as noticed from particle size distribution, lesser clay fraction
of the soil mix is available after washing. With lesser clay content to bind the soil particles and
weakly linked soil agglomerations, the soil mix may be susceptible to volumetric changes on
drying. This hypothesis is supported by the higher linear shrinkage value of the recycled
material as observed in Figure 5.26.
5.5.3.3. Chemical tests on water
In a real life scenario, the water used for washing a soil during recycling would need to be safely
disposed of or treated. This requires us to understand the effect of the presence of the
biopolymers on the water used for soil washing to ensure its safe disposal. In order to understand
this, the surplus surface water of the slurry which was left to settle for 24 hours (mentioned
above) was collected in air-tight 250 mL Duran bottles and stored in a dark environment at

Chapter 5. Assessment as building material
171
210C. Chemical properties of these water samples were then tested after 1 and 7 days
respectively. Standard chemical tests such as pH, oxidation reduction potential (ORP), dissolved
oxygen (DO) and electric conductivity tests were performed using a HANNA digimeter with
respective probes. The results were compared with the chemical properties of tap water and
World Health Organisation (WHO) recommendations (2011).
Table 5.5. presents the chemical properties of the water samples collected on the 1st and
7th days after recycling. The chemical properties suggest that compared to tap water, pH for
water collected for washing guar and xanthan gum stabilised soils is slightly more alkaline.
Lower ORP and DO values on the 7th day indicate that the water used for recycling for both
biopolymers may be prone to microbial activity which has consumed the dissolved oxygen in the
water. Electric conductivity results, which are an indirect measurement of total dissolved solids,
indicate that there is slight increase of dissolved solids for xanthan gum treated water, while
the increase in guar gum treated water is negligible. However, it can be concluded that no special
disposal treatment may be necessary if the water is disposed immediately after washing.
Table 5.5. Results for the chemical tests of water
Test Conducted Tap water Guar gum Xanthan gum WHO
1d 7d 1d 7d 1d 7d
pH 6.9 6.7 7.7 7.0 7.9 6.5 6.5-9.5
ORP (mV) 291 96.7 278 12.4 302 55 -
DO (mg/L) 6.6 6.4 6.1 1.1 6.7 1.7 10-12
Temperature (C) 19.8 19.9 20.4 20 20.5 19.9 15
Electric
Conductivity(µs/cm)
181 199 135 153 127 239 <1500
5.5.4. Discussion on test results
Based on the test results, it can be concluded that the soil washing technique used was sufficient
to recycle and retrieve back much of the original soil gradation and plasticity properties for guar
gum stabilised samples. For xanthan gum stabilised samples, the soil washing technique was
not so successful in recycling it completely. The recycled material resisted washing, leading to a
higher coarser fraction. Furthermore, the original plasticity properties of the soil were not
retrieved and the recycled material had higher plasticity properties than unamended soil
mixture(i.e. liquid limit and linear shrinkage values). In both cases, the water collected after
washing showed an increased demand for oxygen with time indicating potential microbial
activity. Thus, it would be appropriate to dispose the water immediately after washing to ensure

Chapter 5. Assessment as building material
172
safe disposal. Clearly, the results here relate to a single reuse of these materials and to a
particular washing procedure however, as an alternative to cement, biopolymers may have
potential not only in improving the strength and durability of earthen construction material,
but also has potential for recycling.
5.6. Concluding remarks
Based on the experimental findings key research conclusions on durability performance,
hygroscopic behaviour and recyclability potential of biopolymer stabilised earthen construction
materials are summarised below:
1. Durability tests
a. Results from contact and suction tests indicate that the compressed earth blocks without
any amendment performed satisfactorily against capillary action of water. This is
primary due to the nature of clay mineral present in the engineered soil mix used to
prepare the brick. Being less suspectible against cracking, artificial kaolin was able to
withstand against deterioration under capillary action of water.
b. The beneficial effect of biopolymer stabilisation was more evident for adverse durability
tests such as erosional resistance and dip tests. For these tests, unamended earthen
construction materials failed to satisfy the test requirements, while biopolymer stabilised
earthen construction materials performed well.
c. In erosion resistance tests, biopolymer stabilised earthen construction materials with
higher percentages of xanthan gum had lower depths of erosion. Also, the observed rate
of erosion was lesser for xanthan gum stabilised samples. Between biopolymers, xanthan
gum has better stabilisation effect to improve durability properties of the stabilised
earthen materials.
d. Based on the recommendation given by NZDS 4298 (1998), precise durability
performance of biopolymer stabilised earthen materials against erosion may be
performed through spray tests, as the observed depth of erosion in Geelong tests was less
than 5.0 mm.
e. In case of dip tests, the observed loss of mass for unamended bricks was higher than
15.0%, while for the biopolymer stabilised bricks the loss of mass was negligible.
f. Based on the classification of DIN 18945 (2013), unamended compressed earth blocks can
be classified as Class III brick suitable for dry applications, while compressed earth
bricks stabilised either through guar gum or xanthan gum can be classified as Class Ia
suitable for external wall exposed to natural weathering.
2. Hygroscopic behaviour
a. Moisture buffering values of all the test samples tested in this study were higher than
conventional building materials such as fired brick and concrete. The moisture buffering

Chapter 5. Assessment as building material
173
values for biopolymer stabilised samples are nearly twice to that of conventional building
materials.
b. The results from moisture buffering tests are in concurrence with previous literature
findings that the addition of cement reduces the hygroscopic behaviour of the stabilised
earthen construction materials.
c. Unlike cement, addition of biopolymers improved the hygroscopic properties of the
earthen construction materials. The observed moisture buffering values of biopolymer
stabilised earthen materials were higher than both unamended and cement stabilised
bricks.
d. As per Rode et al., (2005) MBV classificaton, most of the tested samples can be classified
into “moderate” category, while only xanthan gum stabilised brick falls into “good”
category.
3. Recycling potential
a. Simple washing technique which is typically employed in geotechnical applications can
be employed to recycle and retrieve original soil properties for guar gum stabilised
earthen material.
b. For xanthan gum stabilised earthen material, soil washing technique was not entirely
successful to recycle it completely. The recycled material resisted washing leading to
coarser fractions.
c. Based on the chemical tests on water which was used for washing it may be concluded
that the water if disposed immediately it may not pose any environmental concerns.
d. Biopolymers may have potential not only in improving the strength and durability of
earthen construction material, but also has potential for recycling. This would enable the
completion of life cycle of the earthen material without generation of construction waste.

Chapter 5. Assessment as building material
174
References
AFNOR. 2001. XP P13-901; Compressed earth blocks
for walls and partitions: definitions –
Specifications – Test methods – Delivery
acceptance conditions.
Allinson D, and Hall M. 2012. Humidity buffering
using stabilised rammed earth materials.
Proceedings of the Institution of Civil Engineers
- Construction Materials, 165(6), 335–344.
Arrigoni A, Grillet AC, Pelosato R, Dotelli G, Beckett
C, Woloszyn M, and Ciancio D. 2017. Reduction
of rammed earth’s hygroscopic performance
under stabilisation: an experimental
investigation. Building and Environment, 115,
358–367.
ASTM-D559. 1989. Wetting and Drying Compacted
Soil- Cement Mixtures. Philadelphia: American
Society for Testing and Materials.
Beckett C, and Augarde C. 2012. The effect of humidity
and temperature on the compressive strength of
rammed earth. In Unsaturated Soils: Research
and Applications (pp. 287–292). Berlin,
Heidelberg: Springer Berlin Heidelberg.
Bruno AW. 2016. Hygro-mechanical characterisation of
hypercompacted earth for sustainable
construction, 166.
BS 1377-2. 1990. Methods of test for Soils for civil
engineering purposes - Part 2 : Classification
tests. London: BSI.
BS 3921. 1985. Specification for Clay Bricks. London:
BSI.
BS ISO. 2000. BS ISO 15686-1:2000 - Buildings and
constructed assets - Service life planning. Part
1 : General principles, 54. Retrieved from
https://bsol-bsigroup-
com.ezproxy.napier.ac.uk/Bibliographic/Bibliogr
aphicInfoData/000000000030029472
Bui QB, Morel JC, Venkatarama Reddy B, and Ghayad
W. 2009. Durability of rammed earth walls
exposed for 20 years to natural weathering.
Building and Environment, 44(5), 912–919.
Calkins M. 2008. Materials for Sustainable Sites: A
Complete Guide to the Evaluation, Selection,
and Use of Sustainable Construction Materials.
John Wiley & Sons.
Chang I, Im J, Prasidhi AK, and Cho G-C. 2015. Effects
of Xanthan gum biopolymer on soil
strengthening. Construction and Building
Materials, 74(10), 65–72.
Chen R, Zhang L, and Budhu M. 2013. Biopolymer
Stabilization of Mine Tailings. Journal of
Geotechnical and Geoenvironmental
Engineering, 139(10), 1802–1807.
Ciurileanu GT, and Horvath IB. 2012. Modular
Building Using Rammed Earth. Acta Technica
Napocensis: Civil Engineering & Architecture,
55(2), 173–181.
Corbin A, and Augarde C. 2015. ’Investigation into the
shear behaviour of rammed earth using shear
box tests. In Proceedings of the First
International Conference on Bio-based Building
Materials. Clermont-Ferrand, France: RILEM.
Retrieved from
http://www.rilem.org/gene/main.php?base=5002
18
DIN18945. 2013. Earth blocks - Terms and definitions,
requirements, test methods.
Eassey A. 1997. The Effect of the Angle of Raindrops
on Earthwall Buildings. University of
Technology Sydney.
Etzion Y, and Saller M. 1987. Earth Construction—A
Review of Needs and Methods. Architectural
Science Review, 30(2), 43–48.
Frencham GJ. 1982. The Performance of Earth
Buildings. Deakin University, Geelong,
Australia.
Gallipoli D, Bruno AW, Perlot C, and Mendes J. 2017.
A geotechnical perspective of raw earth building.
Acta Geotechnica, 12(3), 463–478.
Gallipoli D, Bruno AW, Perlot C, and Salmon N. 2014.
Raw earth construction: is there a role for
unsaturated soil mechanics. Taylor & Francis
Group, London, UK.
Graham N. 2011. Guidelines for Drinking-Water
Quality, 2nd edition, Addendum to Volume 1 –
Recommendations, World Health Organisation,
Geneva, 1998, 36 pages (Vol. 1). Geneva: Urban
Water.
Griffiths RA. 1995. Soil-washing technology and
practice. Journal of Hazardous Materials, 40(2),
175–189.
Guettala A, Abibsi A, and Houari H. 2006. Durability
study of stabilized earth concrete under both
laboratory and climatic conditions exposure.
Construction and Building Materials, 20(3),
119–127.
Gulrez S, Al-Assaf S, and Phillips G. 2011. Hydrogels:
methods of preparation, characterisation and
applications. In Progress in molecular and
environmental bioengineering—from analysis
and modeling to technology applications (pp.
117–150). Intech.
Heathcote KA. 1995. Durability of earthwall buildings.
Construction and Building Materials, 9(3), 185–
189.
Houben H, and Guillaud H. 1994. Earth construction:
a comprehensive guide. Intermediate
Technology Publications.
IS 1725. 2013. Indian Standard IS 1725: Stabilized soil
blocks used in general building construction —
Specification. New Delhi: Bureau of Indian
Standards.

Chapter 5. Assessment as building material
175
Jaquin PA, Augarde CE, and Legrand L. 2008.
Unsaturated characteristics of rammed earth. In
First European conference on unsaturated soils,
Durham, England (pp. 417–422).
Kast W, and Jokisch F. 1972. Überlegungen zum
Verlauf von Sorptionsisothermen und zur
Sorptionskinetik an porösen Feststoffen
(Considerations on the Course of Sorption
Isotherms and Sorption Kinetics on Porous
Solids). Chemie Ingenieur Technik - CIT, 44(8),
556–563.
Kerali AG, and Thomas TH. 2004. Simple durability
test for cement stabilized blocks. Building
Research & Information, 32(2), 140–145.
Kocherbitov V, Ulvenlund S, Briggner L-E, Kober M,
and Arnebrant T. 2010. Hydration of a natural
polyelectrolyte xanthan gum: Comparison with
non-ionic carbohydrates. Carbohydrate
Polymers, 82(2), 284–290.
Latifi N, Horpibulsuk S, Meehan CL, Majid MZA,
Tahir MM, and Mohamad ET. 2017.
Improvement of Problematic Soils with
Biopolymer—An Environmentally Friendly Soil
Stabilizer. Journal of Materials in Civil
Engineering, 29(2).
Liuzzi S, Hall MR, Stefanizzi P, and Casey SP. 2013.
Hygrothermal behaviour and relative humidity
buffering of unfired and hydrated lime-stabilised
clay composites in a Mediterranean climate.
Building and Environment, 61, 82–92.
McGregor F, Heath A, Fodde E, and Shea A. 2014.
Conditions affecting the moisture buffering
measurement performed on compressed earth
blocks. Building and Environment, 75, 11–18.
McGregor F, Heath A, Maskell D, Fabbri A, and Morel
J-C. 2016. A review on the buffering capacity of
earth building materials. Proceedings of the
Institution of Civil Engineers - Construction
Materials, 169(5), 241–251.
McGregor F, Heath A, Shea A, and Lawrence M. 2014.
The moisture buffering capacity of unfired clay
masonry. Building and Environment, 82, 599–
607.
MOPT. 1992. Bases Para el Diseño y Construcción con
Tapial. Madrid, Spain: Centro de Publicaciones,.
Secretaría General Técnica, Ministerio de Obras
Públicas y Transportes.
Morel J-C, Bui QB, and Hamard E. 2012. Weathering
and durability of earthen material and
structures. In Modern Earth Buildings (pp. 282–
303). Elsevier.
Morris H. 1994. Unpublished Comments for
consideration on Draft Standard “Engineering
Design of Earth Walled Buildings.” Joint
Technical CommitteeMeeting BD/83 Earth
Building.
Nugent RA, Zhang G, and Gambrell RP. 2009. Effect of
Exopolymers on the Liquid Limit of Clays and
Its Engineering Implications. Transportation
Research Record: Journal of the Transportation
Research Board, 2101(1), 34–43.
NZS 4298. 1998. Materials and workmanship for earth
buildings [Building Code Compliance Document
E2 (AS2)]. New Zealand Technical Committee.
Wellington: Standards New Zealand.
Ogunye FO, and Boussabaine H. 2002. Diagnosis of
assessment methods for weatherability of
stabilised compressed soil blocks. Construction
and Building Materials, 16(3), 163–172.
Oudhof N, Labat M, Magniont C, and Nicot P. 2015.
Measurement of the hygrothermal properties of
straw-clay mixtures. In First International
Conference on Bio-based Building Materials (pp.
474–479).
Padfield T. 1998. The role of absorbent building
materials in moderating changes of relative
humidity. Department of Structural
Engineering and Materials, Lyngby, Technical
University of Denmark.
Padfield T, and Jensen L. 2011. Humidity buffering of
building interiors by absorbent materials. In 9th
Nordic Symposium on Building Physics - NSB
2011 (Vol. 1, pp. 475–482). Retrieved from
http://www.conservationphysics.org/ppubs/humi
dity_buffering_building_interiors_nsb2011.pdf
Rode C, Peuhkuri R, Mortensen LH, Hansens K, Time
B, Gustavsen A, … Harderup LE. 2005. Moisture
Buffering of Building Materials, Report BYG•
DTU R-126, ISSN 1601-2917. ISBN 87-7877-
195.
Rossato G, Ninis NL, and Jardine RJ. 1992. Properties
of some kaolin-based model clay soils.
Geotechnical Testing Journal, 15(2), 166–179.
Schroeder H. 2016. Sustainable Building with Earth.
Sustainable Building with Earth. Cham:
Springer International Publishing.
Terzaghi K, Peck BR, and Mesri G. 1963. Soil
Mechanics in Engineering Practice (Third Edit).
A Wiley-Interscience Publication.
Walker P, Keable R, Martin J, and Maniatidis V. 2005.
Rammed earth: design and construction
guidelines. BRE Bookshop Watford.
Yttrup P, Diviny K, and Sottile F. 1981. Development
of a Drip Test for the Erodability of Mud Bricks.
Deakin University.

176
Chapter 6
Conclusions
6.1 Chapter introduction
As a concluding chapter, major research findings of the thesis, implication of biopolymer
stabilisation in geotechnical engineering and earthen construction, and potential future
research are discussed. The main aim of the thesis was to identify a suitable bio-stabiliser for
earthen construction materials, to understand the potential of the stabiliser through
geotechnical characterisation and to assess the performance of bio-stabilised earthen
construction material as a building material. In order to achieve this, different bio-stabilisation
techniques which are currently used in different geotechnical applications were assessed. From
these techniques, biopolymers were chosen as a potential stabiliser as they have a relatively
simple application procedure and can be applied for different types of soil (Chang et al., 2016).
Biopolymer stabilisation changes soil properties through hydrogels which are formed due to the
interaction of biopolymer, soil and free water in the soil. On drying, the water molecules tend to
escape from hydrogels leading to the formation of complex interconnected polymer chains which
bind soil particles. In addition, during drying, the hydrogels transform from what is termed a
‘rubbery’ to a ‘glassy’ state (Eichler et al., 1997; Ayeldeen et al., 2016). In the current research
programme, two biopolymers, namely guar gum and xanthan gum, were chosen as stabilisers
due to their availability and good stability properties with respect to temperature and pH
variations (Mudgil et al., 2011). In order to evaluate the potential of these biopolymers as
stabilisers, a research programme was formulated. From this research programme, an
understanding of biopolymer stabilisation has been established, mechanical and hydraulic
properties of biopolymer stabilised soils derived and assessment of biopolymer stabilised
earthen construction materials undertaken. The major findings of this research programme are
highlighted below.
6.2 Research highlights
6.2.1 Biopolymer stabilisation
The initial step of the research programme was to understand the potential of using biopolymers
as an alternative stabiliser for earthen construction materials. To achieve this, an exploratory
campaign to understand the effect of biopolymers on plasticity, shrinkage and strength of
earthen construction material was undertaken. It was observed that, the intrinsic chemical
characteristics of both biopolymers had significant influence on the observed plasticity and
shrinkage characteristics of the stabilised soil. Guar gum increased both liquid limit and linear
shrinkage with biopolymer content, while, with xanthan gum after an initial increase at lower

Chapter 6. Conclusions
177
biopolymer content (0.5% by dry soil mass), both liquid limit and linear shrinkage reduced with
higher biopolymer content.
In the strength tests campaign, unconfined compression and tensile strengths of
biopolymer stabilised earthen material were compared with unamended and cement stabilised
earthen construction materials. As noted in Jaquin et al., (2009), a significant component of the
strength of unstabilised earthen construction materials can be linked to the suction present due
to water content and fine soil fractions. Hence, after the completion of each strength test, total
suction and water content were determined. Based on the test results it was noted that, unlike
cement, in which stabilisation is achieved through formation of cementitious products, the
stabilisation for biopolymer stabilised soils is achieved through combination of soil suction and
hydrogel formation. The nature in which these hydrogels interact with the soil particles is
dependent on the intrinsic characteristics of the biopolymer. As a neutrally charged
polysaccharide, guar gum essentially interacts with soil and water through hydrogen bonding,
while xanthan gum, which is an anionic polysaccharide, interacts through hydrogen and ionic
bonding (Chudzikowski, 1971; Chen et al., 2013; Chang et al., 2015). The nature of hydrogel
interaction with soil particles has due influence on mechanical behaviour especially the tensile
strength and stiffness. It was noted that the additional ionic bonding of xanthan gum led to
higher tensile strengths of the stabilised earthen material. About 1.5% of biopolymer content of
the dry soil mass was sufficient to achieve comparable compressive strength of 8.0% cement
stabilised earthen material. However, comparable tensile strength was only achieved by
xanthan gum stabilised earthen material at 2.0% of biopolymer content.
6.2.2 Geotechnical characterisation
After obtaining an insight on how biopolymer stabilisation influences plasticity, shrinkage and
strength characteristics, further investigation was carried out to understand the role of soil
suction and hydrogel formation on hydraulic and mechanical properties of biopolymer stabilised
soils. In this campaign, to obtain the hydraulic properties, soil-water retention curve for
biopolymer stabilised soils was determined, while for the mechanical properties, strength tests
in the form of triaxial tests at different curing periods were conducted. Further, to understand
the effect of biopolymers on soil structure due to hydrogel formation with aging, X-ray computed
tomography scanning for biopolymer stabilised soils at different curing periods were carried out.
6.2.2.1. Suction tests
Results from the suction tests indicate that though guar gum has higher affinity towards water
than xanthan gum (Nugent et al., 2009), on drying, water tends to escape rather quickly from
guar gum stabilised specimens. This may be due to the fact that the water molecules are loosely
held by biopolymer chains through a weak chemical bonding, i.e. hydrogen bonds. In the case of
xanthan gum stabilised specimens, the rate of drying was similar to that of unamended soil
specimen, indicating that the hydrogel bonding is not so significant to slow the rate of drying
during the initial phase of drying.

Chapter 6. Conclusions
178
Soil water retention curves expressed in terms of total suction and gravimetric water
content for unamended, guar gum and xanthan gum stabilised soils were determined. In each
of these SWRCs, the experimental data was fitted as per the fitting parameters recommended
by Fredlund and Xing (1994). For the range of water contents in SWRC, the suction values
observed by the biopolymer stabilised soil specimens were higher than unamended soil specimen
indicating that hydrogels formed due to biopolymer stabilisation appeared themselves to
contribute to soil suction. The effect of biopolymer stabilisation was evident through the
increased value of fitting parameter, 𝑎. With the addition of biopolymer, the absorbtive capacity
of the soil mix may have increased, which would have increased the air entry value in the SWRC.
Between biopolymers, the effect of xanthan gum on 𝑎 was higher than that of guar gum. With
the changes in fitting parameter, 𝑛 it was noted that for the biopolymer stabilised specimens
there might be variation in their void size distribution.
The changes in suction and gravimetric water content in residual zone were plotted as
scanning curves for all combinations. For unamended specimens, the scanning behaviour
matched with the typical description of scanning curves usually observed in unsaturated soils.
In the case of biopolymer stabilised soils, the behaviour of both guar and xanthan gum stabilised
specimens were atypical to that of unamended soil. It was observed that for a given water
content, three or more different suctions were noted. These random variations of total suction
and water content are assumed to be associated with the evolution of hydrogels.
6.2.2.2. Triaxial tests
The results from constant water triaxial tests suggest that the mechanical behaviour of
biopolymer stabilised soils is related to the evolution of the hydrogel state. Both guar and
xanthan gum stabilised soils showed ductile behaviour during early curing periods. With aging,
the specimens showed appreciable increase in stiffness and peak strength while the specimen
had brittle behaviour. Compared to unamended specimens, biopolymer stabilised specimens
showed higher peak strength and stiffness at all curing periods. The shear strength parameters
for unamended and biopolymer stabilised specimens were obtained from 𝑝 − 𝑞 diagram (Wood,
1990). For guar gum stabilised soil specimens, the variation in shear strength parameters can
be primarily associated with the physical state of hydrogels. With the transformation of
hydrogels from rubbery to glassy state, cohesion of guar gum stabilised soil reduced, while angle
of internal friction increased. Unlike guar gum, xanthan gum stabilised soil specimen retained
its cohesion, while the angle of internal friction decreased with time. The variation of shear
strength parameters for xanthan gum stabilised soil was dependent on both, the transformation
of hydrogels and how the hydrogels interact with soil particles. Xanthan gum stabilised soils
form large soil agglomerations caused due to ionic bonding and these agglomerations are linked
through chains of hydrogels. With aging, these soil agglomerations remain stable on
compression, however, adjacent soil agglomerations slide across each other breaking the
network of hydrogels. Hence, with aging, the angle of internal friction seems to reduce slightly,
while cohesion of the material is still retained.
Chapter 6. Conclusions
179
6.2.2.3. Macrostructure analysis
In order to understand the effect of biopolymers on pore structure, x-ray computed tomography
scans were obtained for unamended, guar and xanthan gum stabilised specimens at different
curing periods namely 1, 7 and 28 days. The resolution of the scan was maintained at 8.5 μm
based on the preliminary study as noted in Chapter 3. Using Avizo software, porosity and void
size distribution of all combinations at different curing periods were obtained. On visual
inspection of X-RCT scans for unamended and biopolymer stabilised specimens, it was noted
that the unamended samples had reduced void space and were more compact. Based on the
quantitative analysis, it was noted that the porosity of biopolymer stabilised specimens was
higher than unamended specimens. Between biopolymers, xanthan gum stabilised specimens
had higher porosity than guar gum stabilised specimens at all curing periods. As a general
observation, it was noted that all specimens contained voids in a similar range of 103 – 108 µm3
connected to an interconnecting void having a volume in the range of 1010 - 1011 µm3. Void size
distribution suggests both biopolymers have significant and yet different effect on pore structure
of the soil mix at macro level. Both biopolymer stabilised specimens showed fewer small pores
than unamended specimens indicating soil aggregations caused due to stabilisation. Between
biopolymers, xanthan gum stabilised specimens had lesser number of voids in the range of 103
– 108 µm3. However, compared to unamended soil specimen, the size of the interconnecting void
for biopolymer stabilised specimens was larger.
6.2.3 Assessment as building material
As the main aim of the thesis is to understand the potential of the biopolymers as a stabiliser
for earthen construction material, it was necessary to explore a range of behaviours as
associated with its use as a building material. For this assessment, durability performance,
hygroscopic behaviour and recyclability potential of the stabilised material were assessed.
6.2.3.1. Durability tests
Results from contact and suction tests indicate that the compressed earth blocks without any
amendment performed satisfactorily against capillary action of water. This is primary due to
the nature of clay mineral present in the engineered soil mix used to prepare the brick. Being
less susceptible against cracking, artificial kaolin was able to withstand against deterioration
under capillary action of water. However, the beneficial effect of biopolymer stabilisation was
more evident for adverse durability tests such as erosional resistance and dip tests. In these
tests, unamended earthen construction materials failed to satisfy the test requirements, while
biopolymer stabilised earthen construction materials performed well. In erosion resistance tests,
biopolymer stabilised earthen construction materials with higher percentages of xanthan gum
had lesser depths of erosion. Also, the observed rate of erosion was lower for xanthan gum
stabilised samples. Between biopolymers, xanthan gum showed a better stabilisation effect to
improve durability properties of the stabilised earthen materials. In the case of dip tests, the
observed loss of mass for unamended bricks was higher than 15.0%, while for the biopolymer

Chapter 6. Conclusions
180
stabilised bricks the loss of mass was negligible. Based on the classification of DIN 18945 (2013),
unamended compressed earth blocks were classified as Class III brick suitable for dry
applications, while compressed earth bricks stabilised either through guar gum or xanthan gum
were classified as Class Ia brick which are suitable for external wall exposed to natural
weathering.
6.2.3.2. Hygroscopic behaviour
Moisture buffering values of all combinations of earthen construction materials tested were
higher than conventional building materials such as fired brick and concrete. The moisture
buffering values for biopolymer stabilised samples were nearly twice to that of conventional
building materials. The results from moisture buffering tests were in concurrence with previous
literature findings that on addition of cement the hygroscopic properties of earthen construction
material are reduced. Addition of biopolymers however have improved the hygroscopic
properties of earthen construction materials. The observed moisture buffering values of
biopolymer stabilised earthen materials were higher than both unamended and cement
stabilised bricks. As per MBV classification by Rode et al., (2005), most of the tested samples
can be classified into “moderate” category, while only xanthan gum stabilised brick falls into
“good” category. Considering the ability of biopolymers to improve both strength and durability
properties without comprising on hygroscopic properties of the stabilised material which is not
displayed by cement as a stabiliser makes them promising alternative stabilisers for earthen
construction material.
6.2.3.3. Recycling potential
Simple washing technique which is typically employed in geotechnical applications was
employed to recycle and retrieve original soil properties of guar gum stabilised earthen material.
For xanthan gum stabilised earthen material, soil washing technique was not entirely successful
to recycle it completely. For xanthan gum, the recycled material resisted washing leading to
coarser soil fractions. Based on the chemical tests on water which was used for washing, it was
concluded that the water, if disposed immediately may not pose any environmental concerns.
Biopolymers may have potential not only in improving the strength and durability of earthen
construction material, but also has potential for recycling. This would enable the completion of
the life cycle of earthen material without generating construction waste.
6.3 Implications of biopolymer stabilisation
6.3.1 In geotechnical engineering
Only in the past decade, biopolymers have been introduced in geotechnical applications to
improve soil properties. Researchers have explored the possibility of using biopolymers as soil
stabilisers, and it has been reported that, when added to soil biopolymers have reduced soil
permeability (Bouazza et al., 2009; Aminpour and O’Kelly, 2015), increased shear strength
(Cabalar and Canakci, 2011; Chang et al., 2015), improved compressibility (Latifi et al., 2016)

Chapter 6. Conclusions
181
and enhanced durability (Qureshi et al., 2017). Further, biopolymers can stabilise different
types of soils with simple application procedure(Chang et al., 2016). Though past literature have
reported promising stabilising effects, very few studies have attempted to understand the
stabilisation mechanisms of biopolymers (Chang et al., 2015, 2016; Ayeldeen et al., 2016).
Further, very few studies have been attempted to understand the soil-water retention properties
of biopolymer stabilised soils (Zhao, 2014; Tran et al., 2017).
The research findings from the current study would further the understanding on
biopolymer soil stabilisation. While, the Atterberg limits of biopolymer stabilised soils obtained
in this study are in agreement with previous studies (Nugent et al., 2009), the linear shrinkage
values indicate that xanthan gum provides better volumetric stability than guar gum. The
strength tests presented in Chapter 3, suggest that only small quantities of biopolymer (~2.0 %
of dry mass of the soil) are required to stabilise earthen construction material to reach
comparable compressive strengths of 8.0% cement stabilised soils. Further, the tensile strength
test results indicate that the xanthan gum stabilised earthen construction materials can have
higher tensile strength than cement stabilised materials. Unlike cement, both biopolymers do
not require any special curing conditions for strength gain. In practical applications, large
quantities of soil can be stabilised using small quantities of biopolymer without any special
curing arrangement. The hydraulic and mechanical properties of biopolymer stabilised soils
presented in Chapter 4 suggest that the biopolymer stabilised soils retain more water than
unamended soils, but provide better mechanical performance. With better water retentivity and
mechanical behaviour, biopolymers can be used in wide range of geotechnical applications where
fluctuations of water in the soil affect the performance of the earthen structure, such as earthen
slopes, desiccated soils, retaining structures and ground improvement.
6.3.2 Application in earthen building construction
Over the last two decades there has been increasing interest in earthen construction materials
due to their inherent green credentials. However, use of energy consuming stabilisers like
cement to improve the durability of earthen construction materials have raised concerns on their
sustainability. Recent research studies suggest that the carbon footprint of modern day
stabilised earthen construction material is equivalent to that of weak concrete (Lax, 2010). In
this scenario, any stabiliser which can provide necessary stabilisation without comprising on
green credentials would be promising alternative to cement and biopolymers may be viable
option. As observed from strength tests in Chapter 3, about 1.5 – 2.0% of biopolymer content by
mass of the dry soil was sufficient to achieve comparable compressive strength of 8.0% cement
stabilised earthen construction material. Further, no special type of curing is needed in
manufacturing biopolymer stabilised earthen construction material. In practical scenario, lesser
quantity of stabiliser content may be needed to prepare good quality material. With no special
curing techniques, less energy may be needed for production of biopolymer stabilised earthen
construction materials. If the cost of biopolymers is competitive to that of chemical stabilisers,
biopolymers may successfully replace cement as a stabiliser in earthen building construction.

Chapter 6. Conclusions
182
In Chapter 5, biopolymer stabilised compressed earth blocks were tested for durability
and hygroscopic performance. Results from different durability tests certainly suggest that
biopolymer stabilised earthen construction materials could be competitive earthen building
materials. Further, hygroscopic properties of biopolymer stabilised earthen construction
materials are better than unamended and cement stabilised materials, indicating, earthen
building made out of biopolymer stabilised materials would need less energy for air conditioning.
Further, on demolition, biopolymer stabilised earthen construction materials can be recycled
without causing any environmental concerns, which ensures no construction waste is generated
and completes the life cycle of the earthen construction material. From its production to
demolition, biopolymer stabilised earthen construction material may require less energy than
cement stabilised materials. Further, biopolymer stabilised materials may have less carbon
emissions associated with it. With these credentials, biopolymers as stabilisers may help modern
day stabilised earthen construction materials to retain their tag of being sustainable.
6.4 Potential future research work
6.4.1 Microstructure analysis
Plasticity and shrinkage characteristics are attributes of the fine fraction of the soil, especially
the clay content. Results of Atterberg limits and linear shrinkage values of biopolymer stabilised
soils as presented in Chapter 3, certainly indicate that both biopolymers interact with clay
portion of the soil which influence plasticity and shrinkage properties. These interactions may
have a significant impact on soil structure and the results from macrostructure analysis
presented in Chapter 4 certainly suggests there are noticeable variations in void size
distribution at macrolevel for biopolymer stabilised soils. Both biopolymers, i.e. guar and
xanthan gum stabilised soils showed significant and yet different variation in the void size
distribution and porosity. With this background, it is expected that the introduction of
biopolymers to soil may have an impact on soil microstructure too. SEM images of biopolymer
stabilised mine tailings by Chen et al.,(2013) suggests that biopolymers increase void spaces of
the soil. However, there is no published work which quantifies the effect of biopolymers on
microstructure in terms of void size distribution or porosity. Any future studies on this aspect
would certainly improve understanding of biopolymer-clay interactions.
6.4.2 Durability tests
In the present study, durability properties of biopolymer stabilised earthen construction
materials against action of water were evaluated. The various durability tests conducted as
prescribed by different international standards are primarily developed to assess unamended or
cement stabilised earthen construction materials. Though biopolymer stabilised earthen
construction materials have performed satisfactorily against these durability tests, they may be
susceptible to other issues. As an example, biopolymers are organic compounds, which are
basically food for microbes and under a microbial attack the hydrogels may deteriorate
Chapter 6. Conclusions
183
hindering the performance of biopolymer stabilised earthen material. In this scenario,
resistance of the material against microbial attack needs to be evaluated. Thus, future studies
should recognise potential threats to durability for biopolymer stabilised earthen construction
materials which are not commonly described in any international standards, and assess their
resistance against it.
6.4.3 Life cycle assessment for biopolymer stabilised earthen materials
The ability of unstabilised earthen construction material to be recycled, completes the life cycle
of the material and this ability makes them sustainable. However, cement stabilised earthen
construction materials are usually downcycled rather than being recycled (Schroeder, 2016).
Recyclability tests as presented in Chapter 5 suggests that biopolymer stabilised earthen
construction materials can be recycled, while water used for recycling can be disposed of safely
without any environmental concerns. Any future studies which can assess the entire life cycle
of biopolymer stabilised earthen construction materials would certify the green credentials of
these innovative materials.
6.4.4 Field Implementation
Based on the experience gained through the experimental programme, an informal empirical
investigation was undertaken in India to understand the implications of using biopolymers as a
stabiliser in constructing a rammed earth wall. In an earthen building construction site, using
walling construction equipment, four rammed earth wallets of 200 mm thick and 1.0 m height
were constructed. The soil used to make the rammed earth wallets conformed to the requirement
of standard recommendations. One rammed earth wallet was unstabilised, while other three
wallets were cement, guar gum and xanthan gum stabilised wallets. Figure 6.1a presents the
freshly constructed rammed earth wallets for all combinations. During the entire process of
construction, from mixing of the soil, compaction of layers in the wall and to the removal of
shuttering, the problems encountered for constructing biopolymer stabilised rammed earth
wallets were noted. It was observed that unlike cement stabilised soil, biopolymer stabilised soil
mixes form soil agglomerations very quickly and these pose problems while compacting the soil
in layers. After the construction of wall, it was noted that there were cracks between compacted
layers of the wallet (Figure 6.1b). The width and length of the cracks increased with aging.
However, individual compacted layers for biopolymer stabilised wallets remained intact and
hard similar to that of cement stabilised wallets. After 28 days, the interior part of the
biopolymer stabilised wallets remained moist, while the outer part of it was dry (Figure 6.1c).
Though this particular exercise was purely empirical, the observations made during this
investigation certainly suggest there are many field associated problems which would pose
issues for using biopolymers as stabilisers. Apart from laboratory testing, future studies should
also focus on full scale models and field trials which would bring out the shortcomings of using
biopolymers. These studies would also develop suitable guidelines for using biopolymers in
actual construction.
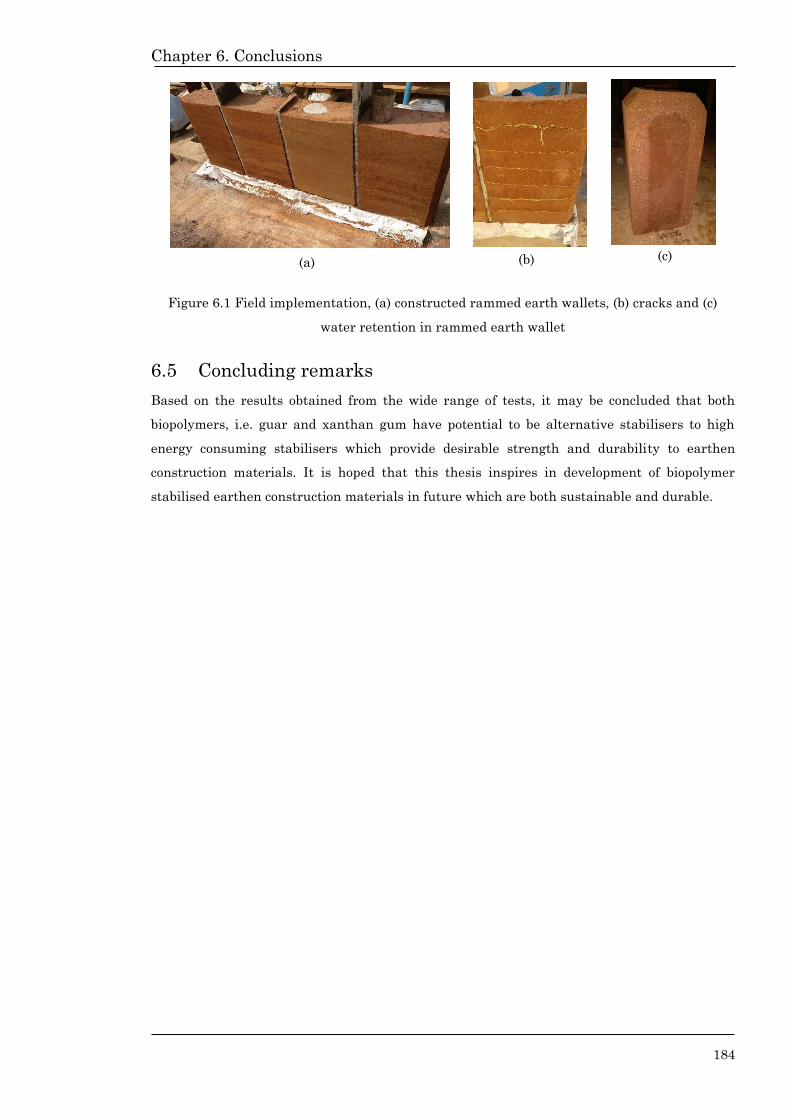
Chapter 6. Conclusions
184
Figure 6.1 Field implementation, (a) constructed rammed earth wallets, (b) cracks and (c)
water retention in rammed earth wallet
6.5 Concluding remarks
Based on the results obtained from the wide range of tests, it may be concluded that both
biopolymers, i.e. guar and xanthan gum have potential to be alternative stabilisers to high
energy consuming stabilisers which provide desirable strength and durability to earthen
construction materials. It is hoped that this thesis inspires in development of biopolymer
stabilised earthen construction materials in future which are both sustainable and durable.
(a) (b) (c)

Chapter 6. Conclusions
185
References
Aminpour M, and O’Kelly BC. 2015. Applications of
biopolymers in dam construction and operation
activities. In D. I. and S. R. Pina C., Portela E.,
Caldeira L., Batista A. (Ed.), Proceedings of the
Second International Dam World Conference
(DW2015) (pp. 937–946). Lisbon, Portugal:
LNEC.
Ayeldeen MK, Negm AM, and El Sawwaf MA. 2016.
Evaluating the physical characteristics of
biopolymer/soil mixtures. Arabian Journal of
Geosciences, 9(5), 329–339.
Bouazza A, Gates WP, and Ranjith PG. 2009.
Hydraulic conductivity of biopolymer-treated
silty sand. Géotechnique, 59(1), 71–72.
Cabalar AF, and Canakci H. 2011. Direct shear tests
on sand treated with xanthan gum. Proceedings
of the ICE - Ground Improvement, 164, 57–64.
Chang I, Im J, and Cho G. 2016a. Geotechnical
engineering behaviors of gellan gum biopolymer
treated sand. Canadian Geotechnical Journal,
53(10), 1658–1670.
Chang I, Im J, and Cho G-C. 2016b. Introduction of
Microbial Biopolymers in Soil Treatment for
Future Environmentally-Friendly and
Sustainable Geotechnical Engineering.
Sustainability, 8(3), 251.
Chang I, Im J, Prasidhi AK, and Cho G-C. 2015. Effects
of Xanthan gum biopolymer on soil
strengthening. Construction and Building
Materials, 74(10), 65–72.
Chen R, Zhang L, and Budhu M. 2013. Biopolymer
Stabilization of Mine Tailings. Journal of
Geotechnical and Geoenvironmental
Engineering, 139(10), 1802–1807.
Chudzikowski RJ. 1971. Guar gum and its
applications. Journal of the Society of Cosmetic
Chemists, 22(1), 43–60.
DIN18945. 2013. Earth blocks - Terms and definitions,
requirements, test methods.
Fredlund D., and Xing A. 1994. Equations for the soil-
water characteristic curve. Canadian
Geotechnical Journal, 31(4), 521–532.
Jaquin PA, Augarde CE, Gallipoli D, and Toll DG.
2009. The strength of unstabilised rammed
earth materials. Géotechnique, 59(5), 487–490.
Latifi N, Horpibulsuk S, Meehan CL, Majid MZA, and
Rashid ASA. 2016. Xanthan gum biopolymer: an
eco-friendly additive for stabilization of tropical
organic peat. Environmental Earth Sciences,
75(9).
Lax C. 2010. Life cycle assessment of rammed earth.
University of Bath. Retrieved from
http://www.ebuk.uk.com/docs/Dissertation_Clar
e_Lax.pdf
Mudgil D, Barak S, and Khatkar BS. 2011. Guar gum:
processing, properties and food applications—A
Review. Journal of Food Science and Technology,
51(6), 409–418.
Nugent RA, Zhang G, and Gambrell RP. 2009. Effect of
Exopolymers on the Liquid Limit of Clays and
Its Engineering Implications. Transportation
Research Record: Journal of the Transportation
Research Board, 2101(1), 34–43.
Qureshi MU, Chang I, and Al-Sadarani K. 2017.
Strength and durability characteristics of
biopolymer-treated desert sand. Geomechanics
and Engineering, 12(5), 785–801.
Rode C, Peuhkuri R, Mortensen LH, Hansens K, Time
B, Gustavsen A, … Harderup LE. 2005. Moisture
Buffering of Building Materials, Report BYG•
DTU R-126, ISSN 1601-2917. ISBN 87-7877-
195.
Schroeder H. 2016. Sustainable Building with Earth.
Sustainable Building with Earth. Cham:
Springer International Publishing.
Tran TPA, Im J, Cho G-C, and Ilhan Chang. 2017. Soil
– water characteristics of xanthan gum
biopolymer containing soils. In Proceedings of
the 19th International Conference on Soil
Mechanics and Geotechnical Engineering, Seoul.
Wood DM. 1990. Soil behaviour and critical state soil
mechanics. Cambridge university press.
Zhao X. 2014. Measurements and transient multistep
outflow simulation of soil-water characteristic
curve for soils modified with biopolymers.
186
Appendix
In Appendix, the test results of various experimental investigations conducted in the thesis are
presented in full. The results shall be read in conjunction with the various discussions
undertaken in different chapters of the thesis.
Chapter 3
Unconfined compression test results
Table 1. Compression strength data in kPa for guar gum stabilised specimens (For
Figure 3.10)
Biopolymer
concentration (%)
0.5 1.0 1.5 2.0 3.0
Curing period
(day)
7 28 7 28 7 28 7 28 7 28
Sample 1 1262 1762 1874 2018 2455 3563 3444 3887 3759 4407
Sample 2 1096 1676 1966 2136 2204 3166 3890 4156 4209 4188
Sample 3 935 1580 1576 1841 2475 3415 3990 3949 4209 4403
Mean 1097 1673 1805 1998 2378 3381 3775 3997 4059 4333
Standard
deviation 164 91 204 148 151 201 291 141 260 125
Co-efficient of
variation 0.15 0.05 0.11 0.07 0.06 0.06 0.08 0.04 0.06 0.03
Table 2. Soil modulus data in MPa for guar gum stabilised specimens (For Figure
3.11)
Biopolymer
concentration (%) 0.5 1.0 1.5 2.0 3.0
Curing period
(day)
7 28 7 28 7 28 7 28 7 28
Sample 1 127 267 132 245 156 312 156 326 213 303
Sample 2 130 211 130 218 104 321 166 348 166 268
Sample 3 125 221 137 246 122 379 184 261 177 282
Mean 127 233 133 236 127 337 169 312 185 284
Standard
deviation 2.5 29.9 3.6 15.9 26 36.4 14.2 45.2 24.6 17.6
Co-efficient of
variation 0.02 0.13 0.03 0.07 0.21 0.11 0.08 0.15 0.13 0.06

187
Table 3. Compression strength data in kPa for xanthan gum stabilised specimens (For
Figure 3.10)
Biopolymer
concentration (%)
0.5 1.0 1.5 2.0 3.0
Curing period
(day)
7 28 7 28 7 28 7 28 7 28
Sample 1 1504 2386 2351 2648 2789 2893 4091 2805 4460 3313
Sample 2 1828 1789 2520 1939 2916 2812 4027 3696 5220 4239
Sample 3 1347 2024 3201 2367 3160 3202 4022 4166 4525 4455
Mean 1560 2066 2691 2318 2955 2969 4047 3556 4735 4002
Standard
deviation 245 301 450 357 188 206 38 691 421 607
Co-efficient of
variation 0.16 0.15 0.17 0.15 0.06 0.07 0.01 0.19 0.09 0.15
Table 4. Soil modulus data in MPa for xanthan gum stabilised specimens (For Figure
3.11)
Biopolymer
concentration (%) 0.5 1.0 1.5 2.0 3.0
Curing period
(day)
7 28 7 28 7 28 7 28 7 28
Sample 1 147 270 157 353 195 363 221 300 280 275
Sample 2 160 329 189 260 195 393 203 461 305 277
Sample 3 189 389 183 372 194 450 195 272 286 382
Mean 165 329 176 328 195 402 206 344 290 311
Standard
deviation 22 60 17 60 1 44 13 102 13 61
Co-efficient of
variation 0.13 0.18 0.10 0.18 0.01 0.11 0.06 0.30 0.04 0.20
Table 5. Compressive strength in kPa for unamended and cement stabilised samples.
(For Figures 3.10 and 3.11)
Sample Unamended Cement – 7d Cement -28d
Sample 1 326 2253 2453
Sample 2 446 3289 3689
Sample 3 336 2786 2956
Mean 369 2776 3033
Standard deviation 67 518 622
Co-efficient of variation 0.18 0.19 0.20

188
Table 6. Soil Modulus in MPa for unamended and cement stabilised samples (For
Figures 3.10 and 3.11)
Sample Unamended Cement – 7d Cement -28d
Sample 1 25 190 235
Sample 2 46 230 265
Sample 3 26 240 255
Mean 32 220 252
Standard deviation 12 26 15
Co-efficient of variation 0.37 0.12 0.06
Tensile Strength test results
Table 7. Tensile strength data in kPa for guar gum stabilised specimens (For Figure
3.15)
Biopolymer concentration
(%) 1.5 2.0 2.5 3.0
Curing period (day) 7 28 7 28 7 28 7 28
Sample 1 65 44 160 97 94 79 138 57
Sample 2 49 30 157 150 177 50 239 67
Sample 3 30 110 150 91 164 220 188 226
Mean 48 61 156 113 145 116 188 117
Standard deviation 17 43 5 32 45 91 51 95
Co-efficient of variation 0.36 0.70 0.03 0.29 0.31 0.78 0.27 0.81
Table 8. Tensile strength data in kPa for xanthan gum stabilised specimens (For
Figure 3.15)
Biopolymer concentration
(%) 1.5 2.0 2.5 3.0
Curing period (day) 7 28 7 28 7 28 7 28
Sample 1 81 178 131 157 140 251 168 79
Sample 2 92 168 171 287 152 193 124 411
Sample 3 82 158 76 402 201 535 189 354
Mean 85 168 126 282 164 326 160 281
Standard deviation 6 10 48 123 32 183 33 178
Co-efficient of variation 0.07 0.06 0.38 0.43 0.20 0.56 0.21 0.63

189
Table 9. Tensile strength in kPa for unamended and cement stabilised samples. (For
Figure 3.15)
Sample Unamended Cement – 7d Cement -28d
Sample 1 33 220 235
Sample 2 29 200 218
Sample 3 33 198 228
Mean 32
22
206 227
Standard deviation 2 12 9
Co-efficient of variation 0.07 0.06 0.04
Synergistic behaviour of biopolymers
Table 10. Compression strength data in kPa for synergistic combinations (For Figure
3.18)
Combination 1 2 3
Curing period (day) 7d 28d 7d 28d 7d 28d
Sample 1 3071 4782 4319 4244 3664 4150
Sample 2 3771 4416 3927 3928 3669 4323
Sample 3 3867 3780 4019 3374 3926 4351
Mean 3570 4326 4088 3849 3753 4275
Standard deviation 435 507 205 440 150 109
Co-efficient of variation 0.12 0.12 0.05 0.11 0.04 0.03
Table 11. Soil modulus data in MPa for synergistic combinations (For Figure 3.18)
Combination 1 2 3
Curing period (day) 7d 28d 7d 28d 7d 28d
Sample 1 166 270 368 380 254 290
Sample 2 263 276 248 264 314 294
Sample 3 260 259 344 285 332 315
Mean 230 268 320 310 300 300
Standard deviation 55 9 63 62 41 13
Co-efficient of variation 0.24 0.03 0.20 0.20 0.14 0.04

190
Table 12. Tensile strength data in kPa for synergistic combinations (For Figure 3.15)
Combination 1 2 3
Curing period (day) 7d 28d 7d 28d 7d 28d
Sample 1 87 209 148 234 190 261
Sample 2 171 215 171 270 171 236
Sample 3 145 185 145 230 206 283
Mean 134 200
16
155 245 189 261
Standard deviation 43 16 14 23 18 24
Co-efficient of variation 0.32 0.08 0.09 0.09 0.09 0.09
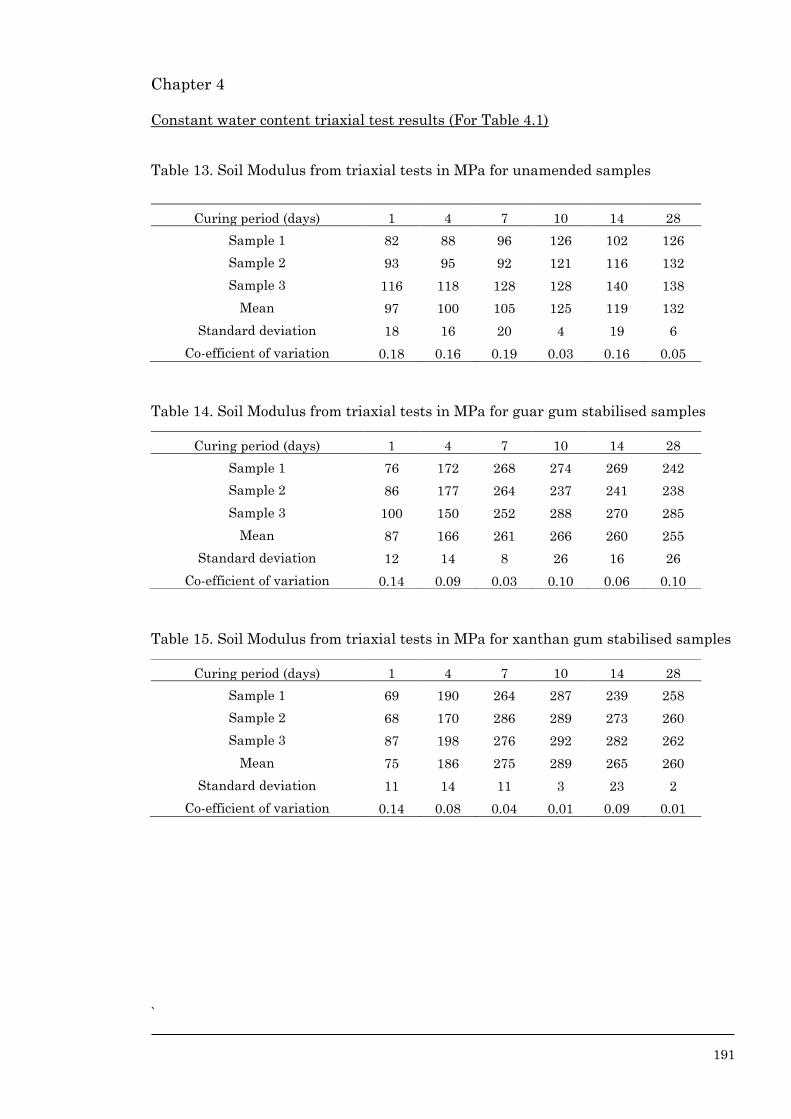
191
Chapter 4
Constant water content triaxial test results (For Table 4.1)
Table 13. Soil Modulus from triaxial tests in MPa for unamended samples
Table 14. Soil Modulus from triaxial tests in MPa for guar gum stabilised samples
Table 15. Soil Modulus from triaxial tests in MPa for xanthan gum stabilised samples
`
Curing period (days) 1 4 7 10 14 28
Sample 1 82 88 96 126 102 126
Sample 2 93 95 92 121 116 132
Sample 3 116 118 128 128 140 138
Mean 97 100 105 125 119 132
Standard deviation 18 16 20 4 19 6
Co-efficient of variation 0.18 0.16 0.19 0.03 0.16 0.05
Curing period (days) 1 4 7 10 14 28
Sample 1 76 172 268 274 269 242
Sample 2 86 177 264 237 241 238
Sample 3 100 150 252 288 270 285
Mean 87 166 261 266 260 255
Standard deviation 12 14 8 26 16 26
Co-efficient of variation 0.14 0.09 0.03 0.10 0.06 0.10
Curing period (days) 1 4 7 10 14 28
Sample 1 69 190 264 287 239 258
Sample 2 68 170 286 289 273 260
Sample 3 87 198 276 292 282 262
Mean 75 186 275 289 265 260
Standard deviation 11 14 11 3 23 2
Co-efficient of variation 0.14 0.08 0.04 0.01 0.09 0.01

192
Chapter 5
Geelong erosion test results (For Figure 5.7)
Table 16. Depth of erosion in mm for tile specimens after 7 days of curing
Table 17. Depth of erosion in mm for tile specimens after 28 days of curing
Sample Unamended Cement Guar
gum
Xanthan
gum
1.5%GG
+
0.5%XG
1.0%GG
+
1.0%XG
0.5%GG
+
1.5%XG
Sample 1 8.6 0.12 2.47 2.06 2.95 2.27 1.85
Sample 2 8.7 0.1 2.36 2.46 2.76 2.27 2.08
Sample 3 7.6 0.15 3.14 1.61 2.54 3.87 1.43
Sample 4 7.7 0.1 2.28 1.31 3.22 2.98 1.98
Sample 5 7.8 0.12 2.98 1.87 2.81 2.92 1.43
Mean 8.1 0.12 2.65 1.86 2.86 2.86 1.75
Standard
deviation 0.53 0.1 0.39 0.44 0.25 0.66 0.31
Co-efficient of
variation 0.07 0.15 0.15 0.23 0.09 0.23 0.17
Sample Unamended Cement Guar
gum
Xanthan
gum
1.5%GG
+
0.5%XG
1.0%GG
+
1.0%XG
0.5%GG
+
1.5%XG
Sample 1 8.1 0.1 2.36 2.37 3.10 2.67 2.35
Sample 2 8.2 0.12 2.24 2.42 2.72 2.89 3.06
Sample 3 7.1 0.14 3.05 1.57 2.48 4.20 2.50
Sample 4 7.1 0.1 2.22 1.30 3.20 3.44 2.48
Sample 5 7.2 0.13 2.97 1.96 2.85 3.66 2.33
Mean 7.5 0.12 2.36 1.93 2.87 3.37 2.54
Standard
deviation 0.55 0.1 2.24 0.49 0.29 0.61 0.30
Co-efficient of
variation 0.07 0.15 3.05 0.25 0.10 0.18 0.12

193
Table 18. Depth of erosion in mm for cylindrical specimens after 7 days of curing
Table 19. Depth of erosion in mm for cylindrical specimens after 28 days of curing
Dip tests (For Figure 5.14)
Table 20. Loss of mass in percentage for bricks
Sample Unamended Cement Guar
gum
Xanthan
gum
1.5%GG
+
0.5%XG
1.0%GG
+
1.0%XG
0.5%GG
+
1.5%XG
Sample 1 9.45 0.01 1.30 1.05 1.65 0.80 1.37
Sample 2 11.20 0.01 1.61 1.38 0.97 1.88 0.72
Sample 3 10.20 0.02 1.81 1.10 2.59 1.86 1.08
Sample 4 10.05 0.01 1.90 1.51 0.98 0.82 1.32
Sample 5 9.55 0.01 0.93 1.22 1.15 1.11 1.19
Mean 10 0.01 1.51 1.25 1.47 1.29 1.14
Standard
deviation 0.70 0.00 0.40 0.19 0.69 0.54 0.26
Co-efficient of
variation 0.07 0.17 0.26 0.15 0.47 0.42 0.23
Sample Unamended Cement Guar
gum
Xanthan
gum
1.5%GG
+
0.5%XG
1.0%GG
+
1.0%XG
0.5%GG
+
1.5%XG
Sample 1 8.00 0.01 2.58 1.68 2.64 1.36 1.92
Sample 2 9.05 0.01 2.82 1.73 1.93 3.75 1.44
Sample 3 8.15 0.02 3.53 1.27 4.27 3.28 1.91
Sample 4 8.50 0.01 3.52 1.74 1.84 1.55 1.91
Sample 5 8.65 0.01 1.83 1.40 2.14 2.18 2.10
Mean 8.5 0.01 2.85 1.56 2.56 2.42 1.85
Standard
deviation 0.42 0.00 0.71 0.21 1.00 1.06 0.25
Co-efficient of
variation 0.05 0.17 0.25 0.14 0.39 0.44 0.13
Sample Unamended Guar gum Xanthan gum
Sample 1 18.85 0.80 0.72
Sample 2 20.50 1.15 1.05
Sample 3 16.95 0.90 0.80
Mean 18.77 0.95 0.86
Standard deviation 1.78 0.18 0.17
Co-efficient of variation 0.09 0.19 0.20
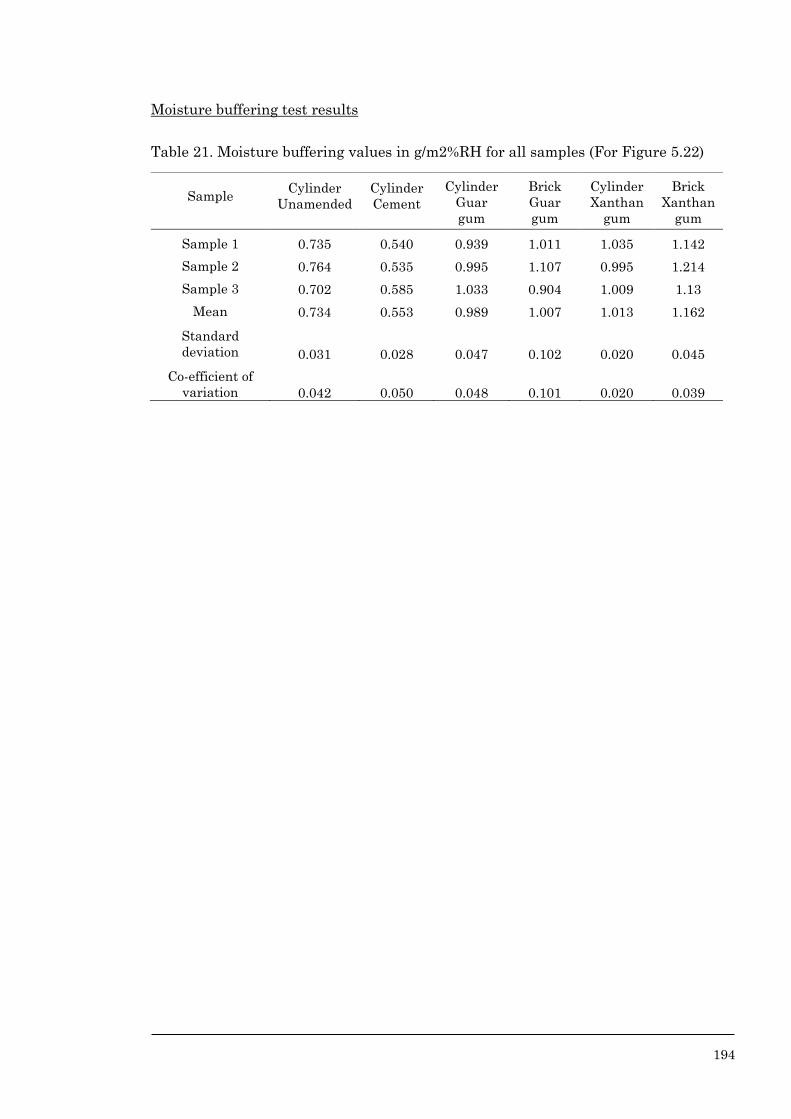
194
Moisture buffering test results
Table 21. Moisture buffering values in g/m2%RH for all samples (For Figure 5.22)
Sample Cylinder
Unamended
Cylinder
Cement
Cylinder
Guar
gum
Brick
Guar
gum
Cylinder
Xanthan
gum
Brick
Xanthan
gum
Sample 1 0.735 0.540 0.939 1.011 1.035 1.142
Sample 2 0.764 0.535 0.995 1.107 0.995 1.214
Sample 3 0.702 0.585 1.033 0.904 1.009 1.13
Mean 0.734 0.553 0.989 1.007 1.013 1.162
Standard
deviation 0.031 0.028 0.047 0.102 0.020 0.045
Co-efficient of
variation 0.042 0.050 0.048 0.101 0.020 0.039


![[(Diphenoxyphosphinyl)methylidene] triphenylphosphorane - the double P+-stabilised carbanion: A crystallographic, computational and solution NMR comparative study on the ylidic bonding](https://static.fdokumen.com/doc/165x107/6317fad54de2f6960b03e3a8/diphenoxyphosphinylmethylidene-triphenylphosphorane-the-double-p-stabilised.jpg)