the components of leaf water potential - CSIRO Publishing
20
THE COMPONENTS OF LEAF WATER POTENTIAL I. OSMOTIC AND MATRIC POTENTIALS By J. WARREN WILSON* WITH AN APPENDIX BY C. W. ROSEt [Manuscript received June 6, 1966] Summary Osmotic potential ('IT) resulting from solutes should be distinguished from matric potential (T) resulting from adsorption by the tissue matrix. The usual methods of measuring so·called "osmotic potential" actually give not only 'IT but also part or all of T. In sunflower and rape leaves 'IT+T varied with change in relative water content (R) more than would be expected from alteration in solute concentration. The discrepancy is attributed to a certain proportion (B) of the water being "bound" by matric forces. For these two leaf types B is estimated at about 0·3 and 0·4 of the turgid water content. There are indications that the bound water content decreases as R falls. A simple model is proposed of the distribution of solute, matrix, and water in tissue, and expressions are derived for calculating 'IT and T for any R, given B and the value of ('IT+T) at full turgor. For these leaves T was small at high R but exceeded 'IT at low R. Assumptions underlying estimates of the components of water potential are discussed; current approaches are not satisfactory. The estimates of T given here are inexact, but their magnitude shows that omission of T from quantitative treatments of internal water relations will cause errors. I. INTRODUCTION (a) Difficulties in Quantifying the Components of Water Potential (i) Spatial Variation in the Components.-The water potential at any point in a tissue can be partitioned into (1) the osmotic potential, which is due to solutes; (2) the matric potential, due to adsorption of water on the tissue matrix; (3) the pressure potential, due to turgor. Other components of water potential are usually insignificant (gravitational potential, if appreciable, is easily measured), and the water potential at a point is thus effectively the sum of these three components. Provided there is equilibrium within a tissue, the water potential is uniform throughout. On the other hand, the three components vary spatially, though their sum is everywhere the same. It is well known that they differ among cell types; still * Division of Plant Industry, CSIRO, Canberra; present address: Glasshouse Crops Research Institute, Littlehampton, Sussex, England. t Division of Land Research, CSIRO, Canberra. AU8t. J. Biol. Sci., 1967,20, 329-47
-
Upload
khangminh22 -
Category
Documents
-
view
0 -
download
0
Transcript of the components of leaf water potential - CSIRO Publishing

THE COMPONENTS OF LEAF WATER POTENTIAL
I. OSMOTIC AND MATRIC POTENTIALS
By J. WARREN WILSON*
WITH AN APPENDIX BY C. W. ROSEt
[Manuscript received June 6, 1966]
Summary
Osmotic potential ('IT) resulting from solutes should be distinguished from matric potential (T) resulting from adsorption by the tissue matrix. The usual methods of measuring so·called "osmotic potential" actually give not only 'IT but also part or all of T.
In sunflower and rape leaves 'IT+T varied with change in relative water content (R) more than would be expected from alteration in solute concentration. The discrepancy is attributed to a certain proportion (B) of the water being "bound" by matric forces. For these two leaf types B is estimated at about 0·3 and 0·4 of the turgid water content. There are indications that the bound water content decreases as R falls.
A simple model is proposed of the distribution of solute, matrix, and water in tissue, and expressions are derived for calculating 'IT and T for any R, given B and the value of ('IT+T) at full turgor. For these leaves T was small at high R but exceeded 'IT at low R.
Assumptions underlying estimates of the components of water potential are discussed; current approaches are not satisfactory. The estimates of T given here are inexact, but their magnitude shows that omission of T from quantitative treatments of internal water relations will cause errors.
I. INTRODUCTION
(a) Difficulties in Quantifying the Components of Water Potential
(i) Spatial Variation in the Components.-The water potential at any point in a tissue can be partitioned into
(1) the osmotic potential, which is due to solutes;
(2) the matric potential, due to adsorption of water on the tissue matrix;
(3) the pressure potential, due to turgor.
Other components of water potential are usually insignificant (gravitational potential, if appreciable, is easily measured), and the water potential at a point is thus effectively the sum of these three components.
Provided there is equilibrium within a tissue, the water potential is uniform throughout. On the other hand, the three components vary spatially, though their sum is everywhere the same. It is well known that they differ among cell types; still
* Division of Plant Industry, CSIRO, Canberra; present address: Glasshouse Crops Research Institute, Littlehampton, Sussex, England.
t Division of Land Research, CSIRO, Canberra.
AU8t. J. Biol. Sci., 1967,20, 329-47

330 J. WARREN WILSON
greater differences are to be expected among the structural phases (wall, cytoplasm, vacuole) of a single cell, and within each phase according to microstructure. Since there are no methods of measuring osmotic, matric, or pressure potentials on a micro scale within tissue, estimates for the cell or tissue as a whole have to be accepted. These estimates are spatial averages for the quantities in the equation:
water potential = osmotic potential + matric potential + pressure potential,
where these quantities are essentially point functions. The averages are weighted according to the proportions of water in each type of cell or structural phase in the tissue.
The partitioning of water potential can be represented symbolically by
f = 17+T+P, (1)
where the symbols indicate respectively the average values of water, osmotic (solute), matric, and pressure potentials in a tissue. The terminology and symbols are those recommended by Taylor and Slatyer (1961). Equation (1) is comparable to the more familiar
diffusion pressure deficit = osmotic pressure - turgor pressure,
except that (1) there are changes of sign (values of f, 17, and T are usually negative, and a rise in diffusion pressure deficit or osmotic pressure corresponds to a fall in f or 17); these changes arise because the potentials are defined in terms of the work done in transporting water from a reference pool to the tissue; (2) T is introduced to recognize that the tissue water is held partly by matric forces.
(ii) Matric Potential and Bound Water.-The matric potential originates in forces of capillarity, adsorption, and hydration. Capillary menisci occur in the intercellular spaces and at the outer surface of the cell walls. Within the walls, spaces between the microfibrils are so small-usually less than 100 A (Preston 1952; Siegel 1962)that the forces can be regarded as adsorptive rather than capillary. Adsorptive (imbibitional) forces are likely to predominate in the protoplasm and are present in the vacuole also since it contains colloids. Whether forces of hydration are assigned to the matric or to the osmotic component depends somewhat arbitrarily on definition or measurement technique.
All these forces depend on surfaces of the tissue matrix, and they and the associated local differences in pressure and osmotic forces (from adsorbed ions) are short-range phenomena. There are no methods of measuring them separately but it is possible to measure their sum, the matric potential (Bolt and Miller 1958; Bolt and Frissel 1960).
The boundary between matric and osmotic potentials is not always clear, for example in the hydration of larger molecules as mentioned above, but the distinction is nevertheless valuable in separating forces which characteristically differ in nature and behaviour. In particular, osmotic potential has a special concentration dependence which does not apply to matric potential.
These potentials can be defined for plant tissues in much the same way as has been proposed for soils by the International Society of Soil Science (Aslyng 1963).

THE COMPONENTS OF LEAF WATER POTENTIAL. I 331
The osmotic potential is the work done per unit quantity of water in transporting reversibly and isothermally an infinitesimal quantity of water from a pool of pure water to a pool containing a solution identical in solute composition with the tissue solution but in all other respects identical with the reference pool. The matric potential is the work done in transporting water from a pool containing a solution identical in solute composition with the tissue solution to the tissue. In both cases it is assumed that there is no difference between the pools and the tissue in gravitational or pressure potential. For the purposes of this paper, "solutes" are substances showing the characteristic concentration dependence of osmotic solutes; but for measurement purposes "solutes" might be those substances separated by a dialysis.
As Bolt and Frissel point out, osmotic and matric potentials are not independent. When both solute and matrix are present in a certain amount of water the water potential is not usually equal to the sum of the osmotic and matric potentials that would be exerted by the solutes and matrix when present separately in similar amounts of water: there is a discrepancy. When the osmotic and matric components of the water potential are to be evaluated separately this discrepancy may be assigned to either component, according to the definition (or measurement method) used. The definitions proposed in the preceding paragraph assign the discrepancy to the matric potential, which indeed becomes a measure of all departures from ideal osmotic behaviour.
Water held by matric forces roughly corresponds to "bound" water (see Dainty 1963) for the latter is generally regarded as being held by capillary or colloidal adsorption or hydration (Crafts, Currier, and Stocking 1949; Kramer 1955). The distinction between bound water and free or mobile water, like that between matric and osmotic forces, is not precise. In practice, bound water is defined in terms of the method used to measure it. Many methods have been used; comparisons between some of these show that when applied to similar material they yield estimates that, though not identical, agree reasonably well (Kramer 1955). These methods depend on measuring deviations from properties expected of simple solutions; for example, observed changes in vapour pressure or freezing point when a known amount of sucrose is added are compared with changes expected from simple osmotic concentration; departures from expectation are explained in terms of a certain quantity of water being bound and consequently unable to participate in osmotic solution.
It is useful to recognize the rough equivalence of bound water to water held by matric forces; for whereas the relevance of 7 to tissue water relations has only recently been pointed out (raylor and Slatyer 1961) and no estimates of its magnitude have been published, bound water has been much studied and many estimates of its magnitude are available.
(iii) Measurement of Potentials.-Estimates of tissue potentials given by psychrometer and vapour-exchange methods depend on the equilibrium vapour pressure, and hence on 71', 7, and P. Thus the so-called "osmotic potential" yielded when these methods are used with entire killed tissue (for which P is assumed to be zero) is in fact not 71', but 71'+7. The same is true for cryoscopic methods-cryoscopy provides one of several techniques for estimating bound water (Kramer 1955)-but the use of expressed sap removes unknown proportions of water, solutes, and matrix,

332 J. WARREN WILSON
and the value of Tr+T obtained is likely to differ from that of the entire tissue: Boyer (1965) found 1-3 bars difference for cotton leaves. Methods in which tissue is immersed in osmotic solutions exclude cell wall water from the equilibration process (Carr and Gaff 1961); results from such methods are not considered here.
"Osmotic potential" (actually Tr+T) is estimated on tissue that has been killed. It is assumed that in dead tissue P = 0, whence from equation (1) the water potential of the dead tissue gives Tr+T. An additional assumption here is that killing does not alter Tr+T. This is unlikely to be true, since killing alters the distribution of water and solutes; however, the extent of the resulting change in Tr+T is not known.
Difficulties in partitioning water potential have been discussed in this introduction not because suggestions can be made for overcoming them but because it is desirable to make explicit the unsatisfactory assumptions which underlie current theory including what follows below.
The following pages consider how the quantities in equation (1) vary with the water content of the tissue. The symbol R is used for the relative water content, given by
R = water content/water content at full turgor.
The subscripts "t" and "0" are used to refer to the states of full turgor (,pt = 0; R t = 1) and zero turgor (Po = 0) as observed in living tissue. Since killing does not alter water content the use of R can be extended to tissue killed for estimation of (Tr+T); in this case the water content at full turgor is observed on parallel, living tissue.
(b) Relation of Osmotic and Matric Potentials to Relative Water Content
It is generally accepted that loss or gain of water alters Tr according to the equation
TrR = TrtRt . (2)
This assumes:
(1) That solute content does not vary with R.
(2) That Tr is proportional to the weight of solute per unit weight of water. Departures from this assumption are not large for pure solutions at the concentrations found in tissue: less than 0·2 % for glucose up to 1 ·0 molal; at most a small percentage (positive or negative) for many salts, acids, and simple organic compounds up to 0·5 molal; less than 5 % for sucrose up to 1·0 molal concentration (Morse 1914; Robinson and Stokes 1959). For sucrose at higher concentrations and for large molecules the fall in Tr (Tr being defined as negative) is proportionately greater than the change in molality, but the additional drop in potential is due to water bound by hydration and grades into T.
(3) That the relation of Tr to R is independent of P and T. In support of this (i) P is in any case negligible in the killed tissue on which osmotic potentials are measured; (ii) the definition of Tr given above is for a matrix-free state, and any potential due to solute-matrix interaction is assigned to T; indeed, equation (2) is taken to define the variation with R in Tr as distinct from r.

THE COMPONENTS OF LEAF WATER POTENTIAL. I 333
Since R t = 1, equation (2) gives
7r = 7rt/R . (3)
This relationship has been used by Slatyer (1960), Slavik (1963), and Gardner and Ehlig (1965).
A somewhat similar relationship, in which the weight (or volume) of water is replaced by the volume of solution or vacuole, has been widely used in studies of water relations:
7roVO = 7rV = 7rtVt. (4)
This is inaccurate except at low concentrations, owing to the volume occupied by the solute; errors of 10% can easily occur. Where volume of the cell or tissue is used, further inaccuracy arises owing to the volume of cytoplasm, wall, and air spaces. These errors have not always been appreciated.
Estimates of 7r (actually including T) and V, usually at Ro and at one other water content, have often shown deviations from equation (4). These have been explained as being due either to the effective volume being less than that observed (e.g. Levitt and Scarth 1936):
7rO( Yo-x) = 7r(V -x) , (5)
or to the existence of some potential additional to that observed (e.g. Bennet-Clark, Greenwood, and Barker 1936):
(7ro+Y)Vo = (7r+Y) V . (6)
The former interpretation has been taken as evidence of bound water, and the latter of active water uptake. To decide between these interpretations other evidence is needed; for example, in dead tissue the bound water concept is preferable.
These observations on 7r and V are of little use for present purposes because (a) some of the methods adopted are now known to involve errors, e.g. the entry of reference solute in estimation of 7r; (b) the false assumption that V is equal or proportional to R can account for some of the deviation (Haines 1950); (c) observations were usually confined to two water contents and do not reveal the form of the relation between 7r and V.
Two recent publications examine more adequately the relation between 7r
(actually including T) and R. Slavik (1963) found that in Nicotiana sanderae leaves 7r fell more rapidly with decrease in R than equation (2) suggests, and he attributed the discrepancy to part of the water being bound. He proposed in effect that
7r(R-B) = 7rt(Rt-B) , (7)
whence 7r = 7rt[(I-B)/(R-B)] , (8)
where B is given by
B = bound water content/water content at full turgor.
This relation satisfactorily fitted his data, and on the basis of over 200 measurements he estimated B at about 0·2 and 0·4 for two sets of leaves.

334 J. WARREN WILSON
Slavik measured R on entire tissue but 7T on expressed sap. It is clearly preferable to use similar material for both quantities, and Gardner and Ehlig (1965) used entire tissue both for R and for 7T; 7T was measured by psychrometry of tissue that had been frozen. They considered that their data, for leaves of four species, did not depart appreciably from equation (3).
Thus the two most adequate investigations of the relation between 7T and R differ as to whether there is deviation from the ideal osmotic relation. The matter is of some importance since if bound water commonly occurs in the amounts suggested by Slavik the quantitative treatments of osmotic relations that assume no bound water are seriously in error, as Figure 1 shows.
Ir o
" Ir ::>
-' f-" 2 - -' f- -' Z ::> "' .. f-of-
a. " U "' - ::> Ir -' f- " 3 " > :lO .. + 0 u z i= Q Of-:lO Ir Ul 0 o ~ 4
Ir a. Ul
"
5
RELATIVE WATER CONTENT
0·2
Fig. I.-Relation between relative water
content and the sum of osmotic and matric
potentials (expressed in proportion to the
value at full turgor) for tissue with various
proportions of bound water; from equation
(16).
This paper therefore re-examines the relations of 7T and T to Rand B. First a simple model is proposed, and then further data are studied in the light of this model.
Figure 2 illustrates three systems:
System 1 consists of a body of pure water; it represents the reference pool;
System 2 consists of a body of water plus a certain quantity of solute; it represents the tissue solution;
System 3 consists of the same quantity of water and solute as system 2 plus a colloidal matrix; this system represents the (killed) tissue.
The proportion of water bound by matric adsorption in a system of type 3 has been investigated by Koets (1931), using silica gel as the matrix. With sucrose as the solute, only water was adsorbed; but with an electrolyte as the solute, some solute ions were adsorbed as well as water. In plant tissue some adsorption of ions is to be expected and in the following discussion the solute adsorbed in tissue from fully

THE COMPONENTS OF LEAF WATER POTENTIAL. I 335
turgid leaves is regarded as part of the matrix: only substances in free solution are taken as solutes.
It is assumed here (and, implicitly, in previous studies of bound water) that system 3 consists of two phases. One phase contains matrix and water, but no solute; the other contains solute and water, but no matrix. If the total water content is R, and the water content in the matric phase is B, the water content in the solute phase is (R-B).
The water potentials of systems 1, 2, and 3 are respectively 0, 7T, and 7T+'T, from the definitions given earlier. In system 3 the water potential in the matric phase, though wholly matric in nature since no solutes are present, is equal in magnitude to (7T+'T), while the water potential in the osmotic phase, though wholly osmotic, is also equal in magnitude to (7T+'T), for the two phases are assumed to be in equilibrium.
WATER CONTENT
WATER POTENTIAL
SYSTEM 1 WATER
D o
SYSTEM 2 SYSTEM 3 WATER + SOLUTE WATER + SOLUTE + MATRIX
~~ LJij ~ ~~
R R-B B
17 (17+ T)
Fig. 2.-Diagrams of the three systems discussed in the text; stippling and hatching represent solute and matrix respectively.
System 2, of osmotic potential 7T, has the same solute content as the osmotic phase of system 3, of osmotic potential equal to (7T+'T); but the amount of water available for solution is R instead of (R-B). If osmotic potential is proportional to solute concentration,
7T = (7T+T)(R-B)/R, (9)
from which it follows that T = (7T+T)B/R . (10)
Alternatively, equations (9) and (10) can be regarded as giving the values of osmotic and matric potentials averaged over the whole system (see comments above on spatial averaging of component potentials), thus:
osmotic potential of whole system =
water content of osmotic phase osmotic potential of osmotic phase X water content of whole system'
. and correspondingly for the matric potential.
This treatment assumes that at any point in the tissue the potential is either wholly matric or wholly osmotic, i.e. that the potentials are mutually exclusive. In fact this is not the case: there are gradients in these potentials with distance from matrix surfaces, though their sum is everywhere the same. A particular molecule of

336 J. WARREN WILSON
water may be affected by both osmotic and matric forces. The proposed model is therefore a simplification and is justifiable only as a first approximation.
Further, where matric potential arises not from adsorptive but from capillary forces there is no basis for treating osmotic and matric forces as mutually exclusive; rather, they are independent. Thus the model assumes that matric forces are mainly adsorptive, not capillary. In living tissue, capillary forces may be largely restricted to intercellular spaces, the outer surface of cell walls, and dead cells such as xylem vessels; and adsorptive forces may indeed predominate in the tissue as a whole. In the killed tissue used for measurement of (7T+T), capillary forces are probably negligible when the tissue is from near-turgid leaves: in the observations described below, killed disks bore liquid sap on their surfaces when R exceeded 0·8. At lower water contents capillary forces presumably rise, but their magnitude relative to adsorptive forces is unknown.
From equations (9) or (10),
7TB = T(R-B) .
Also, applying these equations to tissue from fully turgid leaves,
7Tt = (7Tt+ Tt)(l-B),
Tt = (7Tt+Tt}B.
From equations (3), (H), and (12) it follows that
(I-B) 7T = (7Tt+Tt)-R-'
B(l-B) T = (7Tt+Tt)R(R_B)'
(H)
(12)
(13)
(14)
(15)
whence values of 7T and T can be calculated for any R, given (7Tt+Tt) and B; while values of (7T+T) are given by
(I-B) (7T+T) = (7Tt+Tt)(R_B)'
This can alternatively be written
(7T+T)(R-B) = (7Tt+Tt)(l-B),
or, for a particular tissue with known values of (7Tt+Tt) and B,
(7T+T)(R-B) = constant.
(16)
(17)
(18)
These equations are derived on an intuitive basis, but the Appendix shows that a more fundamental physical treatment leads to an equation of form comparable to equation (18), with only minor differences in the quantity B.
Equations (16) and (17) resemble equations (8) and (7) proposed by Slavik except that his 7T and 7Tt are replaced by (7T+T) and (7Tt+Tt). It was pointed out above that the quantities measured as "osmotic potential" in fact usually include matric

THE COMPONENTS OF LEAF WATER POTENTIAL. I 337
potential. In what follows, therefore, equations (8) and (7) are rejected and replaced by equations (16) and (17) respectively. However, since the quantity symbolized by 7T in equation (7) is the same as that symbolized by (7T+T) in equation (16), namely, the measured water potential of killed tissue, both equations give the same fit to measured quantities: the difference is to this extent one of terminology.
Sla,vik assumes that B does not vary with R, and the same assumption is initially made below. However, there are reasons for expecting the bound water content to fall as R decreases, and towards the end of this paper an attempt is made to estimate the variation in bound water content with R, and the errors introduced by assuming B to be constant are examined.
II. MATERIAL AND METHODS
Plants of sunflower (Helianthus annuus L. cv. Jupiter) and rape (Brassica napus L. cv. Giant) were grown in aerated nutrient culture during autumn in the open at Deniliquin, N.S.W. Leaves that had recently reached full expansion were detached, brought into a constant-temperature room, placed in a moist chamber with their petioles in water for about an hour to become near-turgid, and weighed. From previous experience this fresh weight roughly indicated the water loss that would reduce R to a desired level. The leaves were then placed on wire mesh and allowed to lose an appropriate amount of water. For R above 0·7-0·8 this took little time, but for lower values water loss was slower owing to stomatal closure; even when leaves were placed in front of a fan the drying took some hours, and for the most severely wilted leaves it lasted overnight.
Five groups of 10 disks (8 mm diam.) were cut from each leaf, equally spaced over its area, main veins being avoided. Cutting and all subsequent transfers of disks were carried out in a moist chamber to minimize errors from water loss during transfer. One group of disks was used to estimate R by the method of Barrs and Weatherley (1962), with a 6-hr floating period at 20°C. Two groups of disks were used to estimate 0/, using the gravimetric method of Slatyer (1958) with a 6-hr period at 20°C for vapour exchange. The remaining two groups were used to estimate (7T+T), using the same vapour exchange method but. first freezing the disks at -20°C, which was found to give similar results to freezing with solid carbon dioxide. Because sap exuded from killed disks they were placed on stainless steel gauze before freezing and remained on this gauze for all subsequent transfers. Where leaves were too small to give 50 disks two leaves were allowed to lose equal proportions of water and three groups of 10 disks were cut from each, one for R and two for 0/ or (7T+T).
III. RESULTS AND DISCUSSION
(a) Results
The data on (7T+T) and R were used to estimate the constants (7Tt+Tt) and B of equation (16). The values of (7Tt+Tt} and B are not independent, and an iterative least squares method was used to compute their values. The pairs of estimates for each constant given in Table 1 are for the regressions of R on (7T+T), and of (7T+T)

338 J. WARREN WILSON
on R. The true values of (7Tt+Te) and B are likely to lie between these two estimates, but depend on the relative sizes of errors in (7T+T) and R, which are not known. However, the values of B are highly significant for both regressions in both species.
TABLE 1
ESTIMATES OF (7Tt+Tt) AND B AND THEIR STANDARD ERRORS FOR
LEAVES OF SUNFLOWER AND RAPE
Paired values are for (upper) regression of Ron (7T+T) and (lower) regression of (7T+T) on R
Species 7Tt+Tt B (bars)
Sunflower -2·8±O·2 O·31±O·O3 -3·4±O·3 O·23±O·O2
Rape -2·5±O·2 O·53±O·O3 -4·5±O·6 O'34±O'O4
Figure 3 shows (1) points, representing the original data; (2) continuous lines, based on equation (16) .and the estimates of (7Tt+Tt) and B, showing variation in (7T+T) with R; (3) broken lines, based on equation (3) and the same estimates of
m 0: .. e oJ
RELATIVE WATER CONTENT 0·2 0·4 0·6 0·8 1·0
01 I I i
_--~x " .... --;:;--=- .-. y
/"" .... . /' // ..
-5
0·2 0'4 0·6 0·6 1·0 0' iii
-5 ........ ------:;::: ,," ~ ;
,," " " ......
/'" ,,/
x y
.. -10 ;:
/'//
.I -10 ,,"
" Z w
~ /
-15 -15 ,t'
-20 -20
SUNFLOWER RAPE
Fig. 3.~Relation between relative water content and the sum of osmotic and matric potentials (continuous lines), and between relative water content and the potential expected if the potential at full turgor were solely osmotic (broken lines). Curves marked X are based on regressions of Ron (7T+T), curves marked Yon regressions of
(7T+T) on R.
(7Tt+Tt), showing the variation in 7T expected in the absence of matric potentials and bound water. The continuous and broken lines increasingly diverge with fall in R, and it is this discrepancy which is the basis for estimates of B.

THE COMPONENTS OF LEAF WATER POTENTIAL. I 339
(b) Possibility of Spurious Discrepancies
The possibility must be considered that the discrepancies used as evidence of B arose through some bias introduced by the methods:
(1) No defects of the measuring techniques are known that could give discrepancies of the size found. Some check of technique is given by the fact that leaves made fully turgid in a moist chamber gave values of Rand IjJ close to 1·00 and 0 ·0 respectively.
(2) The relation of (7T+T) to R varied with season and node, but only very slightly within the data presented above. Since there were no systematic trends of season or node with water status among these data, such variations contributed to sampling error rather than to the discrepancy used as evidence of B.
(3) A spurious discrepancy could arise from changes in metabolism during the drying of the leaves or the 6-hr period of water uptake or vapour exchange. The largest effect may be through gain in sugar by starch hydrolysis. This is accelerated by wilting, and in sunflower leaves might lower 7T by 0·5 bar in 12 hr (Spoehr and Milner 1939); the hydrolysis ceases in tissue that has been frozen. Slatyer (1958) found that IjJ estimated by vapour exchange tended to fall with time, by about 0·5 bar in 12 hr.
Thus it seems that the methods used do not introduce any bias sufficient to account for the discrepancies used as evidence of B.
(c) Other Data
Slatyer (1957), Begg et al. (1964), and Gardner and Ehlig (1965) have published data on Rand (7T+T) which can be analysed statistically for evidence of B. Their results are mostly for leaves slowly stressed by drying of soil, and leaf properties may have changed in the period of up to 25 days taken to reach low R; however, the results of Slatyer (1960) suggest that slow drying does not always modify the relation of IjJ to R.
Table 2 shows estimates of B based on data from these sources. It includes values for leaves of maize (Zea mays cv. Standfast) examined together with the sunflower and rape described above; because the maize data were less reliable they were not quoted in full.
For two of these nine leaf types there is no indication of bound water, but for the others the values of B are not inconsistent with the presence of water bound by matric forces.
(d) Bound Water Content, and its Variation with Relative Water Content
The results in Tables 1 and 2, together with those of Slavik (1963), show that the relation of (7T+T) to R is often such as to suggest the presence of bound water. It seems that the proportion of bound water is in some cases negligible, is often about 0·2, and may reach 0·4. These proportions accord with earlier estimates by cryoscopic and calorimetric methods, which have given values of B from 0 ·02 to 0 ·35 for leaves (Kramer 1955).
340 J. WARREN WILSON
Cell constituents are such that water bound by matric forces is to be expected in all three structural phases of the cells. Evidence on matric forces of the wall and cytoplasm is discussed by Babbitt (1942), Gaff and Carr (1961), Walter (1963), and Kreeb (1965); Kreeb leached solutes from leaf tissue of four species and found that water adsorbed by the remaining matrix reached between 0 ·18 and 0·63 of the total water content at full turgor. The vacuole too is likely to contain bound water, for the sap is known to contain colloidal materials (e.g. Crafts, Currier, and Stocking 1949); the bound water content of expressed sap may be increased through cytoplasmic contamination, but there are other indications of vacuolar bound· water (Levitt and Scarth 1936).
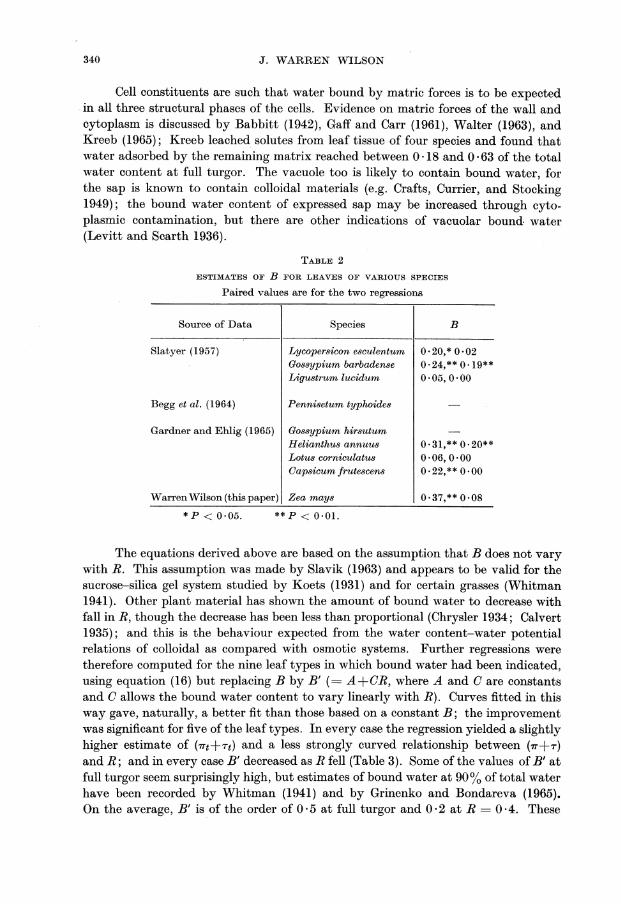
TABLE 2
ESTIMATES OF B FOR LEAVES OF VARIOUS SPECIES
Paired values are for the two regressions
Source of Data
Slatyer (1957)
Begg et al. (1964)
Species
Lycopersicon esculentum Gossypium barbadense Ligustrum lucidum
Pennisetum typhoides
Gardner and Ehlig (1965) I Gossypium hirsutum H elianthus annuus Lotus corniculatus Capsicum frutescens
Warren Wilson (this paper) I Zea mays
*p < 0·05. ** P < 0·0l.
B
0'20,* 0·02 0'24,** 0'19** 0'05,0'00
o· 31, ** O' 20** 0·06,0'00 0'22,** 0·00
0·37,** 0·08
The equations derived above are based on the assumption that B does not vary with R. This assumption was made by Slavik (1963) and appears to be valid for the sucrose-silica gel system studied by Koets (1931) and for certain grasses (Whitman 1941). Other plant material has shown the amount of bound water to decrease with fall in R, though the decrease has been less than proportional (Chrysler 1934; Calvert 1935); and this is the behaviour expected from the water content-water potential relations of colloidal as compared with osmotic systems. Further regressions were therefore computed for the nine leaf types in which bound water had been indicated, using equation (16) but replacing B by B' (= A+CR, where A and C are constants and C allows the bound water content to vary linearly with R). Curves fitted in this way gave, naturally, a better fit than those based on a constant B; the improvement was significant for five of the leaf types. In every case the regression yielded a slightly higher estimate of (7Tt+Tt) and a less strongly curved relationship between (7T+T) and R; and in every case B' decreased as R fell (Table 3). Some of the values of B' at full turgor seem surprisingly high, but estimates of bound water at 90% of total water have been recorded by Whitman (1941) and by Grinenko and Bondareva (1965). On the average, B' is of the order of 0·5 at full turgor and 0·2 at R = 0·4. These

THE OOMPONENTS OF LEAF WATER POTENTIAL. I 341
estimates are, however, not reliable quantitatively. Statistical assessment of variation in bound water with R depends on deviation from a deviation from a relation that, as discussed above, is not exact; satisfactory estimates are not to be expected.
TABLE 3
ESTIMATES OF B' AT FOUR LEVELS OF R FOR LEAVES OF VARIOUS SPECIES
Values of B' (= A+CR) are means between estimates yielded by the two regressions. Values are not given for levels of R below those observed for each leaf type
Values of B' at R =
Source of Data Species 0·4 0·6 0·8 1·0
Slatyer (1957) Lycopersicon esculentum 0·20 0·38 0·55 0·73 Gossypium barbadense 0·24 0·35 0·47 0·59 Ligustrum lucidum 0·07 0·17 0·27 0·37
Gardner and Ehlig H elianthus annuus 0·26 0·26 (1965) Lotus corniculatu8 0·09 0·15 0·20
Cap8icum frutescens 0·16 0·35 0·53
Warren Wilson H elianthus annuus 0·26 0·32 0·38 0·45 (this paper) Brassica napus 0·52 0·69 0·85
Zea mays 0·34 0·53 0·71
Consequently, the following sections, except where otherwise stated, retain as a first approximation the simplifying assumption that bound water content does not vary with R, recognizing that B so treated is an average for the range of R considered.
(e) Relative Magnitudes of Osmotic and Matric Potentials
From equations (9) and (10), the proportions in which 7T and T contribute to (7T+T) are given by (R-B)jR and BjR respectively (Fig. 4). For material from fully
1·0. ,0-0
o·a
1-.0'6 + t: ~O'4
0·2
0.01 I J I 11'0 0'2 0'4 0·6 o·a 1·0
RELATIVE WATER CONTENT
Fig. 4.-The variation with R in the
proportions contributed by 1T and T to
(1T+T), for various values of B.
turgid leaves these contributions simplify to (I-B) and B; thus the estimates of bound water given in Tables 1-3 suggest that for such material 7T usually exceeds T.
As R falls, the relative contribution by T rises except in those cases where B falls proportionately more than R; consequently it is not uncommon for T to approach

342 J. WARREN WILSON
and even exceed 7T at low levels of R, though there are big differences between leaf types. A limitation of the treatment developed above is that as R falls near to B the solute concentration rises rapidly and departure from "ideal" behaviour [equation (3)] is likely.
Not enough is known of the physical properties of the matrix to predict the quantitative relationships between T and R; but colloid studies suggest that T will vary more than 7T with change in R, and this agrees with most of the results described above. For tissue in which T and 7T vary in roughly similar manner with R, methods used here cannot distinguish T from 7T and yield B = 0; this may explain why two leaf types gave this result, for in fact T is likely to be appreciable in all droughted tissue. This difficulty stresses the need for methods of estimating T by direct measurement.
RELATIVE WATER CONTENT
0·2 0·4 0'6 O'S '·0 0'2 0'4 0'6 0·8 ',0 01 OJ I
-5
"' 0:
" ~ -10
.J
" i= Z -15 .. ... ~
-20
-25
17
7"
(17+7")
SUNFLOWER
17 -5
-10
-15
-2T 7"
(17+7") -25
RAPE
Fig. 5.~Relation between relative water content and osmotic and matric potentials and their sum.
Figure 5 shows variation in 7T and T with R, for the sunflower and rape leaves, based on equations (14) and (15) and arbitrarily taking as (7Tt+T,) and B the means between values for the two regressions given in Table 1. Though most other leaf types have lower potentials than these two, and a relatively smaller contribution by T, the general pattern is usmtlly rather similar. If B' is used instead of B, 7T is higher and T
lower at all values of R excepting occasionally the lowest, but the difference is in most leaf types not large, and the general form of the relationship is not essentially different. The effect of assuming B to be constant, if it in fact falls as R falls, is thus (within the general framework accepted here) to overestimate the contribution of 7T to (7T+T) and to underestimate the contribution of T.
The treatment presented above rests on various assumptions. Most of these are generally accepted in studies of tissue water relations, often implicitly. This paper seeks to make these assumptions explicit, and to examine some conclusions that they lead to, especially as regards the osmotic and matric components of water potential. Since many of the assumptions have not yet been checked, the quantitative estimates obtained are not reliable. Moreover, they are for killed tissue (as are most estimates of "osmotic potential"), and they are average values for quantities which vary from

THE COMPONENTS OF LEAF WATER POTENTIAL. I 343
point to point in the tissue. Nevertheless, the estimates suggest that the magnitudes of'T and B are often such that if they are ignored in studies of tissue water relations serious errors may result. Thus there is a need of reliable methods of assessing the osmotic and matric potentials-as well as the pressure potential-and ideally these components of water potential should be separately evaluated for the various structural phases of the tissue.
IV. ACKNOWLEDGMENTS
I am much indebted to several colleagues, and especially Dr. H. D. Barrs, Dr. A. J. Peck, and Dr. R. O. Slatyer, for helpful discussions and advice, to Mr. J. Tunny for technical assistance, and to Mr. G. A. McIntyre for statistical advice and for arranging computation.
V. REFERENCES
ASLYNG, H. C. (Chairman) (1963).-Soil physics terminology. Bull. Int. Soc. Soil Sci. No. 23. pp.7-10.
BABBITT, J. D. (1942).-On the adsorption of water vapour by cellulose. Can. J. Res. A20, 143-72. BARRS, H. D., and WEATHERLEY, P. E. (1962).-A re-examination of the relative turgidity
technique for estimating water deficits in leaves. AWlt. J. Biol. Eci. 15, 413-28. BEGG, J. E., BIERHUIZEN, J. F., LEMON, E. R., MISRA, D. K., SLATYER, R. 0., and STERN, W. R.
(1964).-Diurnal energy and water exchanges in bulrush millet in an area of high solar radiation. Agric. Met. 1, 294-312.
BENNET-CLARK, T. A., GREENWOOD, A. D., and BARKER, J. W. (1936).-Water relations and osmotic pressures of plant cells. New Phytol. 35,277-91.
BOLT, G. H., and FRISSEL, M. J. (1960).-Thermodynamics of soil moisture. Neth. J. Agric. Sci. 8,57-78.
BOLT, G. H., and MILLER, R. D. (1958).-Calculation of total and component potentials of water in soil. Trans. Am. Geophys. Un. 39, 917-28.
BOYER, J. S. (l965).-Effects of osmotic water stress on metabolic rates of cotton plants with open stomata. Plant Physiol. 40, 229-34.
CALVERT, J. (1935).-Diurnal variation in "bound" and "free" water and other factors in the sap expressed from the leaves of Phalaris tuberosa. Protoplasma 24, 525-30.
CARR, D. J., and GAFF, D. F. (1961).-The role of the cell-wall water in the water relations of leaves. In "Plant-Water Relationships in Arid and Semi-arid Conditions". pp. 117-25. (UNESCO: Paris.)
CHRYSLER, H. L. (1934).-Amounts of bound and free water in an organic colloid at different degrees of hydration. Plant Physiol. 9, 143-55.
CRAFTS, A. S., CURRIER, H. B., and STOCKING, C. R. (1949).-"Water in the Physiology of Plants." p.240. (Chronica Botanica: Waltham, Mass.)
DAINTY, J. (1963).-Water relations of plant cells. Adv. Bot. Res. 1, 279-326. GAFF, D. F., and CARR, D. J. (1961).-The quantity of water in the cell wall and its significance.
Aust. J. Biol. Sci. 14, 299-311. GARDNER, W. R., and EHLIG, C. F. (1965).-Physical aspects of internal water relations of plant
leaves. Plant Physiol. 40, 705-10. GLASSTONE, S., and LEWIS, D. (1961).-"Elements of Physical Chemistry." p. 758. (Macmillan:
London.) GRINENKO, V. V., and BONDAREVA, Y. S. (1965).-On protective reactions of the grapevine and
its adaptation to winter conditions. Soviet Pl. Physiol. 12, 82-90. HAINES, F. M. (1950).-The relation between cell dimensions, osmotic pressure and turgor pressure.
Ann. Bot., Lond. (N.S.) 14, 385-94. KLOTZ, 1. M. (1958).-Protein hydration and behaviour. Science 128, 815-22. KOETS, P. (193l).-Water adsorption on silica gel. Proc. Sect. Sci. K. Ned. Akad_ Wet. 34, 420-6.

344 J. WARREN WILSON
KRAMER, P. J. (1955).-Bound water. In "Handbuch der Pflanzenphysiologie." (Ed. W. Ruhland.) Vol. 1. pp.223-42. (Springer·Verlag: Berlin.)
KREEB, K. (1965).-Die Bedeutung des Quellungswassers der Zelle bei der kryoskopischen Bestimmung des osmotischen Wertes. Ber. dt. bot. Ges. 78, 159-66.
KRUYT, H. R. (Ed.) (1952).-"Colloid Science." Vol. 1. Irreversible systems. p. 389. (Elsevier Publ. Co.: Amsterdam.)
LEVITT, J., and SCARTH, G. W. (1936).-Frost.hardening studies with living cells. 1. Osmotic and bound water changes in relation to frost resistance and the seasonal cycle. Can. J. Res. C 14, 267-305.
MORSE, H. N. (1914).-"The Osmotic Pressure of Aqueous Solutions." p. 222. (Publ. Carnegie Inst. Wash. No. 198.)
PRESTON, R. D. (1952).-"The Molecular Architecture of Plant Cell Walls." p. 211. (Chapman & Hall: London.)
ROBINSON, R. A., and STOKES, R. H. (1959).-"Electrolyte Solutions." p. 559. (Butterworths Scientific Publications: London.)
SIEGEL, S. M. (1962).-"The Plant Cell Wall." p. 123. (Pergamon Press: Oxford.) SLATYER, R. O. (1957).-The influence of progressive increases in total soil moisture stress on trans
piration, growth, and internal water relationships of plants. Aust. J. Biol. Sci. 10, 320-36. SLATYER, R. O. (1958).-The measurement of diffusion pressure deficit in plants by a method of
vapour equilibration. Aust. J. Biol. Sci. 11, 349-65. SLATYER, R. O. (1960).-Aspects of the tissue water relationships of an important arid zone
species (Acacia aneura F. Muell.) in comparison with two mesophytes. Bull. Res. Coun. Israel D 8, 159-68.
SLAVIK, B. (1963).-Relationship between the osmotic potential of cell sap and the water saturation deficit during the wilting of leaf tissue. Biologia Pl. 5, 258-64.
SPOEHR, H. A., and MILNER, H. W. (1939).-Starch dissolution and amylolytic activity in leaves. Proc. Am. Phil. Soc. 81, 37-78.
TAYLOR, S. A., and SLATYER, R. O. (1961).-Proposals for a unified terminology in studies of plant-soil-water relationships. In "Plant-Water Relationships in Arid and Semi-arid Conditions." pp.339-49. (UNESCO: Paris.)
WALTER, H. (1963).-Zur Kliirung des spezifischen Wasserzustandes im Plasma und in der Zellwand bei der h6heren Pflanze und seine Bestimmung. Ber. dt. bot. Ges. 76, 40-71.
WHITMAN, W. C. (1941).-Seasonal changes in bound water content of some prairie grasses. Bot. Gaz. 103, 38-63.
ApPENDIX
THEORETICAL RELATION OF OSMOTIC AND MATRIC POTENTIALS TO RELATIVE WATER
CONTENT
Note on Terminology
The two most complete proposals defining the total and component potentials of water in situations relevant to this paper are those due to Taylor and Slatyer (1961), and the International Society of Soil Science (Aslyng 1963). The effect of adsorption, for example by tissue matrix, on the potential of water is implicitly included as a component of matric or capillary potential (Aslyng 1963). In this paper Taylor and Slatyer's (1961) explicit suggestion has been followed that adsorption can be considered to contribute to the matric potential, a potential component also affected by any capillary effects present.

THE COMPONENTS 0]' LEAF WATER POTENTIAL. I 345
Theory
As described in Section II of this paper, the sum of component potentials (7T+r) was determined on plant material in which cells were ruptured by freezing, so that turgor pressure was zero. The following theory assumes plant material to be in this condition.
Whereas capillary forces may contribute to matric potential of water in the walls of plant cells, within the cell protoplasm and vacuole matric potential would appear to have its origin chiefly if not entirely in adsorptive rather than capillary forces. '
It is characteristic of the adsorptive force field that it decreases rapidly with distance from the site of adsorption (Kruyt 1949), being negligibly small at a distance ofthe order of lO-6 cm (Bolt and Miller 1958). Close to the site or surface of adsorption the adsorptive forces acting on water may be very large, and the water is frequently referred to as "bound".
From these properties of adsorptive force fields a possible model is that the total number of moles of water (w) present within a cell at any time can be partitioned into two categories which will be called "bound" (WIJ moles) and "free" (wf moles), where W = wlJ+wf. The consequence of this model will be explored, with fraction WIJ
regarded as effectively part of the matrix. The bound fraction will therefore be excluded from physicochemical equations.
The concept of water being bound in the immediate proximity of macromolecules as well as small molecules has been used in interpreting a variety of phenomena. For example, in reviewing a range of unique features of protein behaviour, Klotz (1958) showed that they could all be interpreted by assuming the hydration sheath enclosing the protein molecule to have an ice-like lattice structure.
The fundamental thermodynamic relation between the component potentials of water and its vapour pressure (e) is
where
7T+T = -(RT/V w) In e/e8 , (dyne cm-2)
R = universal gas constant (8·32 joules per degree per mole),
T = absolute temperature (OK),
V w = partial molal volume of water,
(AI)
e8 = saturation vapour pressure of water at the same temperature (T) at which e is measured.
With quite adequate accuracy for present purposes we can set V w = V w, the molar volume of water.
An "effective" mole fraction of solute (x) will be defined by excluding bound water. Thus
x = s/(wf+s) , (A2)
where S = number of moles of solute in the cell.

346 J. WARREN WILSON
If it is further assumed that Raoult's Law is applicable, as for an "ideal" solution (Glasstone and Lewis 1961)
e/es = I-x.
From (AI) and (A3), (7T+T)VW = -RTln(l-x).
Assuming also that the solution is dilute,
In(l-x) ~ -x, and then
(7T+T) V w[(Wf+S)/s] = RT.
In terms of the symbols defined above, relative water content R is defined by
R = (Wb+wf)/(Wbt+wftl ,
where the extra suffix "t" refers to the special situation of full turgor.
(A3)
(A4)
(A5)
Elimination of wf between equations (A4) and (A5) and rearrangement gives
(7T+T)(R- Wb- S ) = RTs = K Wbt+wft V w(Wbt+wft} ,
(A6)
where K is a constant provided cell solute content (s), water molality at full turgor, and temperature are constant.
Equation (A6) may be written
(7T+T)(R-f3) = K,
which is the same form as equation (IS), except that
f3 = (Wb-S)/(Wbt+Wftl
replaces B, which is defined in Section I as
B = bound water content/water content at full turgor
= Wb/(Wbt+wft) .
(A7)
(AS)
(A9)
The discrepancy between equations (IS) and (A7) is that between Band f3, which depends on the magnitude of S in relation to Wb. In fact S must be small compared to W for equation (A6) to be valid, since the solution has been assumed dilute in its derivation. A relation will now be derived from which S may be compared to Wb using experimental data.
Since W = wb+wf,
S 8 (W ) Wb = Wf Wb- l . (AlO)
From equations (A5) and (A9),
W/Wb = RjB. (All)

THE COMPONENTS OF LEAF WATER POTENTIAL. I 347
Substitution from equation (All) into (AlO) gives
;b = ~A~-l). (A12)
Table 3 gives values of Rand B [or B', which is the value of B obtained by regression analysis of experimental data as described in Section III(d)] for a range of species, thus giving (RjB) in equation (A12). Mole ratio (sjwf) was estimated assuming no change in solutes with change in R, and also that the cell solution was sucrose. Solute molality was obtained from osmotic potential at full turgor ('ITt), using the relation between 'ITt and molality for sucrose at 20°0 (Morse 1914). This was converted to the ratio (sjwf).
The maximum value of (sjwb) for the data in Table 3 was for Ligustrum lucidum at R = 0 ·4, the value of 'ITt (12·6 atm) being calculated as described in Section III(d) assuming B to vary with R. This maximum value of (sjwb), calculated using equation (A12), was 4·1 %, and this is a measure of the maximum difference between Band f1 for this set of data.
Since the discrepancy between Band f1 is small, equation (A7) may be written with little error in a form identical with equation (18):
('IT+T)(R-B) = K. (A13)
If the several assumptions made in deriving (A13) are justified, then a theoretical basis for equation (18) has been provided.
Finally it may be noted that equation (All) predicts a dependence of Bon R as suggested in Section III(d). From equation (All)
BjR = 1j[1+(wfjwb)] . (A14)
As R decreases it would be expected that the ratio (wfjwb) would also decrease, so that the ratio (BjR) would be expected to increase.