
CSIRO Electric Driveway Project Supporting Electric Vehicle ...
156
CSIRO Electric Driveway Project Supporting Electric Vehicle Adoption in Australia: Barriers and Policy Solutions AN ELECTRIC DRIVEWAY PROJECT REPORT
-
Upload
khangminh22 -
Category
Documents
-
view
0 -
download
0
Transcript of CSIRO Electric Driveway Project Supporting Electric Vehicle ...

CSIRO Electric Driveway Project
Supporting Electric Vehicle Adoption in
Australia: Barriers and Policy Solutions
AN ELECTRIC DRIVEWAY PROJECT REPORT
Final Report

ABOUT THE CSIRO ELECTRIC DRIVEWAY PROJECT The CSIRO Electric Driveway Project is undertaking a comprehensive assessment of potential
electric vehicle (EV) uptake and use under Australian conditions, exploring potential future
synergies between the different components of Australia‘s electricity and transport sectors. The
research project is hosted by CSIRO‘s Energy Transformed Flagship and draws on the strengths
of CSIRO, a Victorian Government consortium, university collaborators and industry in a
creative and effective partnership.
For further information visit www.electricdriveway.com.au
ABOUT THE INSTITUTE FOR SUSTAINABLE FUTURES, UTS
The Institute for Sustainable Futures (ISF) was established by the University of Technology,
Sydney in 1996 to work with industry, government and the community to develop sustainable
futures through research and consultancy. Our mission is to create change toward sustainable
futures which protect and enhance the environment, human well-being and social equity. We seek
to adopt an inter-disciplinary approach to our work and engage our partner organisations and
clients in a co-operative process that emphasises strategic decision making.
For further information visit www.isf.uts.edu.au
CITATION Cite this report as:
Dunstan, C., Usher, J., Ross, K., Christie, L., Paevere, P. (2011). Supporting Electric Vehicle
Adoption in Australia: Barriers and Policy Solutions (An Electric Driveway Project Report).
Prepared for Australian Commonwealth Scientific and Industrial Research Organisation
(CSIRO), by the Institute for Sustainable Futures, UTS: Sydney.
Copyright and Disclaimer
© 2011 CSIRO To the extent permitted by law, all rights are reserved and no part of this
publication covered by copyright may be reproduced or copied in any form or by any means
except with the written permission of CSIRO.
Important Disclaimer
CSIRO advises that the information contained in this publication comprises general statements
based on scientific research. The reader is advised and needs to be aware that such information
may be incomplete or unable to be used in any specific situation. No reliance or actions must
therefore be made on that information without seeking prior expert professional, scientific and
technical advice. To the extent permitted by law, CSIRO (including its employees and
consultants) excludes all liability to any person for any consequences, including but not limited
to all losses, damages, costs, expenses and any other compensation, arising directly or indirectly
from using this publication (in part or in whole) and any information or material contained in it.

Contents
Abbreviations .............................................................................................................. 4
Executive Summary .................................................................................................... 1
1. Introduction ......................................................................................................... 3 1.1 Framework for analysis .............................................................................................. 4 1.2 Prioritising policies for Australia ................................................................................. 8
1.2.1 Why prioritising policy options is important ............................................................... 8 1.2.2 Criteria to prioritise options ....................................................................................... 8
2. Key Barriers and Possible Policy Solutions .................................................... 11 2.1 Technical Barriers and Solutions ............................................................................. 11
2.1.1 Technology characteristics ...................................................................................... 12 2.1.2 Technology costs .................................................................................................... 17
2.2 Institutional Barriers and Solutions .......................................................................... 18 2.2.1 Regulatory Barriers - Regulatory Reform ................................................................ 18 2.2.2 Inefficient Pricing – Price Reform ............................................................................ 22 2.2.3 Payback Gap – Enticement (Incentives) ................................................................. 23 2.2.4 Split Incentives - Facilitation .................................................................................... 26 2.2.5 Imperfect information – Information Provision ......................................................... 27 2.2.6 Cultural Values - Targets ........................................................................................ 29 2.2.7 Confusion and Interaction between Barriers - Coordination .................................... 31
2.3 Solutions Matrix ........................................................................................................ 34
3. Australian Initiatives ......................................................................................... 37
4. A Snapshot of International EV Policies and Initiatives ................................. 39 4.1 Canada ..................................................................................................................... 39 4.2 United States ............................................................................................................ 39 4.3 Europe ...................................................................................................................... 40 4.4 Japan ....................................................................................................................... 41 4.5 China ........................................................................................................................ 42
5. Summary of International Policies ................................................................... 45 5.1 Regulation ................................................................................................................ 45 5.2 Pricing ...................................................................................................................... 46 5.3 Incentives ................................................................................................................. 48 5.4 Facilitation ................................................................................................................ 51 5.5 Information ............................................................................................................... 52 5.6 Targets ..................................................................................................................... 53 5.7 Coordination ............................................................................................................. 54
6. Suggested Policies for Australia ...................................................................... 55 6.1 Introduction .............................................................................................................. 55 6.2 Policy Selection ........................................................................................................ 57 6.3 Policy Option Summaries ......................................................................................... 67
I6: Common metric for lifetime cost comparison .................................................................. 68 C7: Coordinating federal and state EV strategies ................................................................ 73 F5: Connecting renewable energy targets to EV sales ........................................................ 78 P8: Green registration discounts .......................................................................................... 81 P2: Time of use pricing ........................................................................................................ 85 E1/P9: EV cost reductions and fuel economy based fee at the time of vehicle purchase .... 89

4 Barriers to and Policy Solutions for EV Adoption in Australia • March 2011
Appendices ............................................................................................................... 94 Appendix 1. Summary of Canadian Policies ..................................................................... 94 Appendix 2. Summary of US Policies................................................................................ 97 Appendix 3. Summary of European Policies ................................................................... 119 Appendix 4. Summary of Japanese Policies ................................................................... 124 Appendix 5. Summary of Chinese Policies ..................................................................... 128 Appendix 6. SUMMARY OF AUSTRALIAN INITIATIVES ............................................... 131
6.1 Australian Green Car Innovation Fund ......................................................................... 131 6.2 Smart Grid, Smart City ................................................................................................. 132 6.3 Solar Cities .................................................................................................................. 134 6.4 Victorian EV trial .......................................................................................................... 135 6.5 Queensland EV Roadmap and Green Taxis Scheme .................................................. 141 6.6 ACT Green Vehicles Duty Scheme .............................................................................. 143 6.7 UWA Australia Renewable Energy Vehicle (REV) Trial ............................................... 144
REFERENCES ......................................................................................................... 145
ABBREVIATIONS
BEV Battery Electric Vehicle
DE Distributed Energy
ED Electric Driveway
EV Electric Vehicle
EVSE Electric Vehicle Supply Equipment
HEV Hybrid Electric Vehicle
ICEV Internal Combustion Engine Vehicle
MSRP Manufacturer‘s Suggested Retail Price
PHEV Plug-in Hybrid Electric Vehicle
V2G Vehicle to Grid

Barriers to and Policy Solutions for EV Adoption in Australia • March 2011 1
EXECUTIVE SUMMARY
The Electic Vehicle revolution has begun.
The world‘s major car manufacturers, including General Motors, Nissan and Mitsubishi, have started to mass-
produce Electric Vehicles (EVs). Widespread and rapid adoption of EVs in Australia has major potential
benefits for the environment, the economy and the electricity system. Coordinated government policy
leadership could be instrumental in both tapping these benefits and in mitigating costs and risks.
This report examines barriers to the widespread adoption of electric vehicles (EVs) and suggests possible
policy solutions. In particular, the report focuses on current and likely future technical and institutional
barriers. Understanding these barriers can inform consideration of potential policy instruments to encourage a
smooth and rapid transition of the current vehicle fleet to electric drive. The report describes a broad, but not
exhaustive, list of over 50 potential policy options to address these technical and institutional barriers.
The research casts a broad net to consider policy options from every scale of government (local to national)
and and a range of stakeholders (manufacturer, customer, etc) with case studies drawn from Australia and
overseas. While such a broad list of options is useful in canvassing the opportunities for change, it is also
important to prioritise options into a set of harmonised policies that could maximise the impact in terms of
increased EV uptake, in the shortest possible time, at least cost to individuals, industry and government.
Accordingly, a novel multi-criteria analysis approach was used to develop a short-list of prioritised policy
options for Australia, based on a broad examination of potential policies. To this end, policy options were
evaluated according to the following criteria:
Effectiveness at increasing adoption of EVs in Australia
Implementation cost for government and industry
Expected level of public support for the measures
Urgency of implementation
Importance of additional benefits not related directly to EV adoption.
Through this process, the policy options list was narrowed down and synthesised to 20 priority policies for
ease of analysis and discussion by ISF. The list has then been further refined down to 13 via a survey
circulated among stakeholders. The 13 options were then discussed and narrowed down further at a
stakeholder workshop.
After reaching consensus on a list of six priority policy options (from the original list of over 50), ISF further
analysed these selected options in terms of the broad costs, resources and timelines for potential
implementation, drawing on international case studies of related policy. The six priority policy options are:
Common metric for lifetime cost comparison.
The creation of a consistent measurement tool for comparing the lifetime costs of vehicle ownership including
factors such as purchase price, fuel and maintenance would provide a simple method for consumers to
compare all types of vehicles including ICEVs, HEVs and EVs.
Coordinating federal and state EV strategies.
Not so much a policy option, but a framework for coordinating options, this involves the federal government
and state governments developing coordinated strategies on how best to work with industry and the public to
encourage adoption of EVs and ensure a smooth and rapid transition to EVs.

Connecting renewable energy targets to EV sales.
Relating renewable energy targets to EV sales will ensure that future growth in electricity demand associated
with EVs is linked to growth in low carbon energy. As Australia has one of the most carbon intensive
electricity systems in the world, EVs will need to be charged using renewable energy to ensure significant
greenhouse gas emission reductions. This policy is important not just to reduce emissions but to address
market resistance to EVs.
Green registration discounts.
Related to the previous option, this policy involves offering discounts on annual vehicle registration costs for
EV drivers who purchase Green Power or otherwise use renewable energy to power their vehicles. This will
encourage zero emission driving and support customer acceptance of EVs.
Time of Use pricing.
Consumers have historically paid a flat rate for electricity. Under Time of Use pricing, electricity can be
priced according to demand throughout the day and year, resulting in significant savings for consumers who
opt to charge their EVs at off-peak times, and reduced impacts on electricity supply infrastructure.
Upfront EV cost reductions and fuel economy based fee.
Charging a fee to consumers based on the fuel economy of the vehicle at the time of purchase will push the
market towards vehicles that are more fuel-efficient. Providing cost reductions or exemptions for EVs at the
time of purchase, including sales tax waivers, income tax deduction or cash back rebates, will pull the market
towards greater uptake of EVs. Together these ―feebate‖ policies can offer a ‗budget neutral‘ strategy.
________________
This research has been conducted by the Institute for Sustainable Futures (ISF) for the CSIRO Electric
Driveway (ED) project. The ED project is a three-year comprehensive assessment of potential EV use and
adoption under Australian conditions, exploring potential synergies between the different components of
Australia’s electricity and transport sectors and barriers to change. The research project is hosted by
CSIRO’s Energy Transformed Flagship and draws on the strengths of CSIRO, universities and industry in a
creative and effective partnership.
This report sits within one of the key areas of the ED project: task 1.3 – A3, which focuses on technical,
economic, environmental and institutional assessments of widespread EV adoption. The analysis completed
in this report will be continued with future work under the ED project including expanded policy options and
modelling of the impact of policies on EV adoption.
This report does not represent in any way a political endorsement by any political body.

INTRODUCTION
Barriers to and Policy Solutions for EV Adoption in Australia • March 2011 3
1. INTRODUCTION
Energy use by households and, in particular, electricity use in the home and petrol use in vehicles constitutes a
large share of greenhouse gas emissions both nationally and internationally. Emissions from these two
sources must be significantly curtailed if emission targets are to be met. While there has been much separate
research into emissions reduction for either homes or for vehicles, the potential for emission reduction via
synergies between these two areas warrants greater attention. Such synergies are the focus of the Electric
Driveway (ED) Project.
The Electric Driveway Project is a three-year comprehensive assessment of potential electric vehicle (EV) use
under Australian conditions, exploring potential synergies between the different components of Australia‘s
electricity and transport sectors and barriers to change. The research project is hosted by CSIRO‘s Energy
Transformed Flagship and draws on the strengths of CSIRO, universities and industry in a creative and
effective partnership.
This report addresses of one of the Electric Driveway Project aims to focus on institutional, technical and
regulatory barriers to EV adoption and integration with buildings and the grid.
This is the second research report by the Institute for Sustainable Futures (ISF) for the Electric Driveway
Project. The previous report contains pertinent background information including an overview of EV
technology and an analysis of state and local electricity impacts of various EV charging and vehicle to grid
(V2G) scenarios.
This report first explores key barriers to the widespread adoption of EV and points of possible government
intervention. These barriers and solutions are then shown in a matrix presenting the areas of impact of each
potential policy solution. A status review of domestic and international policy is then presented and
summarised in a second set of matrices. Lastly, a summary section on priority policy options for Australia is
provided.
This report focuses on EVs, including battery electric vehicles (BEVs) and plug-in hybrid electric vehicles
(PHEVs) and does not directly address hybrid electric vehicles (HEVs) or internal combustion engine vehicles
(ICEVs) as only the vehicles that plug-in will have impacts on homes and electricity systems which are the
focus of the Electric Driveway Project. The differences between these vehicles are outlined in Table 1-1
below.1
This work, combined with the other work in the Technical, Economic, Environmental & Institutional
Assessment area of the Electric Driveway Project, will lead ultimately to a policy and technology options
report to inform a strategy for optimal uptake of EV technologies.
1 Notes taken from Phase 1 report.

INTRODUCTION
Table 1-1: Vehicle configurations
ICEV HEV PHEV BEV
Power Train Engine Engine / Motor Engine / Motor Motor
Energy Source Liquid fuel Liquid fuel Liquid fuel /
electricity
Electricity
Net Efficiency
(approx) –
(Ornelas 2008)
12-15% 18-30% 33-77% (depending
on EV distance
driven)
62-77%
Benefits Low relative
capital cost
Quick to
refuel
Reduced fuel
costs
Quick to refuel
CO2 reduction
compared to
ICEV (by
~30%)
Significantly
reduced fuel costs
Quick to refuel
Can travel short
distances with
electricity alone
CO2 reduction from
ICEV and HEV
Largest CO2 reduction
when compared to all
others if charged with
Green Power
Drawbacks Reliance on
non-renewable
fuel source
High running
cost
High CO2
output
Reliance on
non-renewable
fuel source
Higher relative
capital cost
than ICEV
Higher relative
capital cost than
HEV
Potentially limited range
High capital costs with
current battery prices
Charging can be slow
(potentially overnight)
1.1 Framework for analysis
The current industry consensus has been summarised as:, ―electric vehicles are coming – again – but this time
it is different‖ (Hyde, 2010). New technology and support from all the major automakers, including
introductions over the past few years of several new EVs, has convinced many people that, this time, EVs are
here to stay. With several pieces of research (Albrecht, 2009a and Simpson, 2009) concluding that EVs will
bring substantial environmental benefits, many stakeholders are looking for strategies that will increase
vehicle adoption. However, numerous interrelated barriers exist that will inhibit the rapid transition of vehicle
fuel from petrol to electricity. These barriers span multiple agencies, sectors and levels of government.
Overcoming these barriers will therefore require a significant and coordinated response from Governments at
all levels. These barriers and a suite of proposed solutions are the focus of this report.
In order to systematically address the various barriers, they must first be identified through an examination of
the major aspects influencing EV adoption in Australia. This report not only draws on the research of experts
from within Australia, but also uses international research to ensure that all key barriers are identified.
Once identified, barriers to EV adoption can be analysed and classified in numerous ways. The classification
of barriers should seek to include categories that are mutually exclusive and collectively exhaustive. For this
paper we have adopted the ―barrier mapping‖ tool developed by ISF as part of CSIRO Intelligent Grid
Research Program (Dunstan and Daly, 2009) (Figure 1-1). While this tool focuses on institutional barriers
rather than technical barriers, it provides a systematic structure for classifying barriers and illustrating the
relationship between them. It also allows a direct mapping of barriers against potential policy instruments to
address these barriers using the Policy Palette (Figure 1-3).

INTRODUCTION
Barriers to and Policy Solutions for EV Adoption in Australia • March 2011 5
The barriers can be fundamentally classified as either technical barriers or institutional barriers. The
following, as described by the Intelligent Grid (iGrid) Research Program, sums up the distinction: technical
barriers relate to the technological characteristics and limits; and costs associated with the technology –
meaning ‗what they do‘ and ‗what they cost‘. Institutional barriers are those created as a result of how
humans relate to the EVs, through laws, regulations, values and culture.
Figure 1-1: Barriers to changing practice
Barriers
Technical Institutional
Current
Technology
Current
Costs
Regulatory
Barriers
Externalities
and Price
Structures
Payback
Gap
Split
Incentives
Lack of
Information
Cultural
Barriers
The figure below describes conceptually the distinction between technical barriers and institutional barriers.
Overcoming both types of barriers will lead to different economic, social and environmental outcomes.
Technical barriers form the limit of optimum outcomes, e.g. outcomes that are both technologically possible
and economically feasible. If we relax the institutional barriers, we are able to move current practice closer to
attaining wide-scale ―best practice‖.
Figure 1-2: Conceptual Framework of Technical and Institutional Barriers to EVs
Economic
outcomes
Environmental &
Social outcomes
Technology
Frontier
Institutional
Barriers
In an emerging area of rapid technological change, such as EVs and associated infrastructure and components,
it can be tempting to focus on the technical barriers to increase the use of the technology. From a global
perspective this is probably appropriate. However, as technological improvement can quickly diffuse around
the world, the relative success of different countries in taking advantage of these technological changes
depends crucially on reducing and removing the institutional barriers to their adoption. So while policy

INTRODUCTION
measures to support technological innovation in EV in Australia are important, it is equally important to
understand and address the institutional barriers that can retard the growth of a receptive market for this
technology in Australia.
The classification for institutional barriers is more complex that technical barriers (function and cost), and can
be described as follows:
1. Regulatory barriers: regulation biased against the technology;
2. Externalities and price structures: failure to reflect costs (including environmental costs) accurately in
prices;
3. Payback gap: the gap in acceptable payback periods between stakeholders, and in particular between
infrastructure providers and consumers;
4. Split incentives: the challenge of capturing benefits spread across numerous stakeholders;
5. Lack of information: absence of or difficulty in accessing relevant, reliable information;
6. Cultural values: insufficient attention given by individuals and organisations to new opportunities and
technologies; and
7. Confusion: the additional barriers created by the interaction of these barriers.
These categories of institutional barriers (in grey, and categories of possible policy reponse - in black) are
illustrated in Figure 1-3 and discussed below.

INTRODUCTION
Barriers to and Policy Solutions for EV Adoption in Australia • March 2011 7
Figure 1-3: Institutional Barriers and the Policy Palette
Facilitation
Pricing
Targets
Regulation Enticement
Information
Regulation
Information
Coordination
Regulatory
failure
Externalities &
inefficient pricing
Payback
gap
Split
incentives
Lack of Information
Cultural
barriers
Confusion
The purpose of analysing barriers is to aid in the creation of effective policy options to address these barriers.
The key objective in creating good policy in this context is to increase the rate of EV uptake in a setting where
many of the drivers such as peak oil, climate change and industry competiveness require urgent responses.
Therefore, in this context, the test of effective policies will be the level of EV uptake. That is to say that there
are issues with both supply and demand; and analogously barriers to achieving both availability and uptake.
According to the general principles of supply and demand, if demand for a good increases or the cost of
supply decreases (while the other aspect is constant) then consumption, or adoption, of that good will increase.
Therefore, policy options can increase adoption by either lowering the cost of supply, by for example,
manufacturing subsidies or supporting technological innovation, or they can work to increase actual or
effective demand by reducing transaction costs or other barriers.
In an ideal market, participants would be able to respond instantaneously to new information and new
policies. However, in practice, policies are created in a context of shifting consumer preferences and
technological change. While the dynamic element of both markets and government policy is considered
below, the detailed analysis of diffusion of technologies and policy impacts is outside the scope of this report.
The analysis of policy options is further developed in this report using the framework developed under the
Intelligent Grid Research Program – Project 4 (Dunstan et al., 2009) to classify options using the following
seven categories:

INTRODUCTION
1. Regulation: ‗establish laws and rules‘ to require desirable outcomes and discourage undesirable outcomes
2. Pricing: reflect true costs and benefits (including environmental) in fuel and vehicle purchases
3. Enticement (or Incentives): reduce payback periods to levels acceptable to consumers by offering
financial or other rewards
4. Facilitation: ensure that benefits spread across numerous stakeholders are adequately captured and
distributed
5. Information: provide accessible, timely and relevant information to all stakeholders
6. Targets: generate attention and interest by individuals and organisations by ‗generating specific objectives
and measuring performance against these objectives‘.
7. Coordination: ensure policies work together to not only address specific barriers, but also barriers created
by their interaction.
It should be noted that while there are analogous policy option and barrier categories, a policy option in one
category may be designed to address a barrier in a category that is not its direct analogue. This is described in
more detail in Section 2.2.7 of the report.
1.2 Prioritising policies for Australia
1.2.1 Why prioritising policy options is important
There is a virtually unlimited set of policy options that could be designed to increase EV adoption in
Australia. However, implementing such an enormous set of options would require virtually unlimited
resources. Furthermore, coordination between policies is often as important as the individual policies
themselves. Therefore, it is prudent to prioritise options and implement a set of harmonised policies that will
maximise the impact in terms of increased EV uptake in the shortest possible time at least cost to individuals,
industry and government.
1.2.2 Criteria to prioritise options
To ensure that government resources are maximised in facilitating the widespread adoption of EVs,
appropriate criteria by which to prioritise policy options need to be articulated and used. When selecting
policy options, the government should prioritise options against internal criteria as well as external criteria.
Internal criteria, particularly in relation to EV policy development, means that government should ensure that
the policy options appropriately harmonise with the role of government in technical change and generally fall
within the government‘s mandate.
The role of government in technological change was originally thought best to be a linear model, where the
role of government is limited to the funding of basic R&D and sometimes applied R&D in the public interest
(Freeman, 1995). With the inherent uncertainty involved in technological development, a more complex
process oriented model should replace the linear model where interaction and learning processes are at the
core. A process oriented model of policies to support technical change could include:
Policies that acknowledge the key features of technical change, such as uncertainty, learning, path
dependence and accumulation of knowledge (Soete and Arundel,1995 ad Kemp et al., 1998 in Ahman,
2004)
Policies that modulate the market by for example taxes, legislation and ‗‗niche-market management‘‘,
thereby allowing government to act as strategic niche market organisers

INTRODUCTION
Barriers to and Policy Solutions for EV Adoption in Australia • March 2011 9
Policies that provide support, to some extent, in all development phases at the same time and not in a
sequential order (Ahman, 2004).
Therefore, the internal criteria selected for this policy analysis incorporate the following considerations:
Does the suite of policies provide support for development in all, or the majority of, phases?
Do the policies fall within government‘s mandate?
Do the policies allow for the key features of technical change, including uncertainty, learning, path
dependence and accumulation of knowledge?
Policy options also need to be considered in relation to one another and the broader socio-economic-political
context. Therefore, the external criteria selected for this policy analysis include:
How effective would this policy be at increasing adoption of EVs in Australia, in comparison to other
options?
How much would the option cost government to implement?
How much would the option cost industry to implement?
What level of public support would this policy option be expected to have, in comparison to other
options?
How urgent is this reform option (e.g. when should this reform option be implemented?)
How important are the additional, or secondary, benefits of this policy (e.g. benefits related to air quality,
greenhouse gases, job creation and economic stimulus)?


KEY BARRIERS AND POSSIBLE POLICY SOLUTIONS
Barriers to and Policy Solutions for EV Adoption in Australia • March 2011 11
2. KEY BARRIERS AND POSSIBLE POLICY SOLUTIONS
Barriers to the adoption of EVs can be broadly classified as either technical barriers or institutional barriers.
Section 2.1 focuses on technical barriers, or in other words, barriers that relate to the technological
characteristics and financial characteristics of the EVs themselves – meaning ‗what they do‘ and ‗what they
cost‘. Section 2.2 introduces institutional barriers, or those barriers that are created as a result of how humans
relate to EVs, through laws, regulations, values and culture.
2.1 Technical Barriers and Solutions
Electric vehicle technology has come a long way since the 1996 release of the first modern consumer BEV:
the GM EV1. Shortly after the first few customer deliveries of the EV1, most major automotive manufacturers
either released their own EVs or were on the verge of doing so. However, today, not a single one of these
vehicles are in production, and less than 1,000 were sold or leased. As was depicted in the movie, ‗Who Killed
the Electric Car‘, most of the original EV1s were recalled and crushed. A significant reason for the collective
failure of this generation of EVs in the 1990s were the technical barriers with the components which did not
enable the performance, reliability, and low purchasing price that consumers required.
However, since the release of the Toyota Prius in 1997, the electrification of passenger cars has embarked on
a steady incremental path towards a zero emissions future. The advent of hybrid electric vehicles (HEVs) has
enabled a flourishing electric drivetrain2 and automotive energy storage industry. As of August 2, 2010
Toyota had sold more than 2.5 million hybrid vehicles (Loveday, 2010b). In addition to significant electric
drivetrain and battery technology improvements since the 1990s, there is now a clear precedent that
consumers are comfortable, and in many cases prefer, vehicles with greater fuel economy enabled by
electrification and electrochemical energy storage.
HEVs now provide a convenient platform upon which many advanced EV technologies can be proven and
subsequently implemented in PHEVs and BEVs. For all but a small handful of production HEVs, sufficient
energy storage has been achieved using nickel metal hydride batteries, a relatively old and mature battery
technology. Meanwhile, two or three generations of significantly more advanced lithium ion a batteries have
made it out of the laboratories and into the manufacturing plants. Substantial progress on energy storage and
drivetrain components has been made, but many technical barriers remain for EVs. These barriers have the
potential to substantially reduce the rate of vehicle uptake.
A technical barrier is a relative shortcoming when comparing an incumbent technology to a competing new
technology. For this comparison, ICEVs are the incumbents and EVs are the challengers. EVs have many
attractive features that ICEVs generally do not offer such as peak baseline torque, home charging, low noise,
low or zero emissions, and low maintenance. Despite all these attractive qualities and the recent progress with
EV technology some shortcomings persist. A reduction or elimination of these shortcomings will increase
consumer desirability and increase the rate of EV uptake. A useful and forward-looking basis for comparison
is the gap between ―nearly commercialized‖ EV technology and the most advanced commercially available
ICEVs.
The critical technical EV attributes that affect consumer desirability are range, charge time, reliability, cycle
life, calendar life, climate/temperature compatibility, safety, and cost. For each of these attributes, there may
be several underlying technical gaps that are responsible for the perceived barrier.
2 Encompassing components such as EV specific transmissions, motors and motor controllers.

KEY BARRIERS AND POSSIBLE POLICY SOLUTIONS
Barriers can also be explained in the context of tradeoffs. When one attribute of a technology is improved or
scaled up, other attributes may suffer. A classic example is the relationship between range and cost for BEVs.
A battery pack can be made much larger thus enabling an excellent range, however the cost and weight of this
pack will rise dramatically and acceleration will suffer. It is therefore simplistic to say that ―poor range is the
largest barrier to EV adoption‖ unless it is put into context with battery pack costs and vehicle performance.
2.1.1 Technology characteristics
2.1.1.1 Charge time
Some motorists may choose to charge exclusively at home due to the added convenience of avoiding a detour
in their driving route to recharge. However, many EV owners with irregular or demanding driving schedules
may require the ability to rapid charge. For consumers who do require rapid charging, it is unclear what
recharge time will be acceptable; however ICEVs can be used as a basis for comparison. The Nissan Leaf, for
example, has a range of 160 km and can be charged to 80 percent in 30 minutes using 60 kW ―level 3‖
charging (Squatriglia, 2009). By comparison, the 2010 Toyota Prius, has an 800 km range and can be
―recharged‖ (i.e. refuelled) in approximately 2 minutes at a standard Australian petrol station. In terms of
energy being transferred into the vehicle, this is equivalent to a 15,000 kW ―charger‖. Therefore, 250 units of
energy are being pumped into the Prius for every unit of energy being charged back into the Leaf‘s battery.
While some consumers may be willing to accept a 30-minute recharge time, it is certainly not what they are
used to. The barrier here can be framed simply as: how can that much electricity be put back into the battery
pack in a short period of time?
Fortunately there are two areas of research that hold substantial promise: quick charge and battery swapping.
One example of a commercially available EV with a rapid recharge time is the BYD e6. Using a 38 kW
charger, BYD claims the e6 can be recharged to 50% capacity in less than 10 minutes. Furthermore, a lithium
nickel manganese oxide battery created at MIT was shown to be capable of a sub 10-minute recharge (Hanlon,
2010). The clear leader in battery swapping is Project Better Place. Battery swapping has been demonstrated
to take less than 2 minutes, and can be done safely by a robotic service station (Better Place, 2010).
Another common strategy for addressing long charge times is through the use of petrol-based ―range
extenders‖ as applied in Plug-in Hybrid Electric Vehicles (PHEVs). By providing the options of reverting to
petrol as a source of either on board power generation or direct motive power, the drawbacks of long charge
time where this is inconvenient can be avoided.
2.1.1.2 Range
BEV Range is defined as the distance the vehicle can travel on a single charge, and no single international
standard exists for its measurement. Vehicle range is determined by drivetrain efficiency, aerodynamics,
rolling resistance, driver behaviour, accessory loads and energy capacity. Thus an improvement in any of
these vehicle attributes will result in an improvement in range. For BEVs, drivetrain efficiencies are already
very efficient, and further gains may not result in significant improvements to range. Larger gains could be
made by reducing vehicle weight and thus decreasing rolling resistance and breaking losses. Likewise, EV
aerodynamics have not yet been perfected. However, the largest technical barrier to achieving greater BEV
range is the energy capacity of the battery pack. Figure Table 2-1 below shows the number of daily journeys
in Australia versus journey distance for all motorized travel. From this data we can see that the vast majority
of journeys are less than 100km, and as such it would seem that EVs would be suitable for the mass market
with this relatively modest range. However, EV range can be reduced by up to 50% or more due to real world
driving conditions and user specific variations on the vehicles drive cycle. These variables include
temperature, wind, rain, snow, aggressive driving, high cargo loads, and internal accessories. For example, if

KEY BARRIERS AND POSSIBLE POLICY SOLUTIONS
Barriers to and Policy Solutions for EV Adoption in Australia • March 2011 13
an EV‘s range is normally 120 km, and while packed with four passengers and camping gear on a hot summer
day it drops to 60km unexpectedly, this will be a serious inconvenience to the motorist. In comparison, if an
ICEV range is cut from 500 km to 250 km, it might be a more expensive trip, but the inconvenience to the
motorist is minimal. Not only does the ICEV has plenty of range to spare, but the refuelling time is short and
there are many places to refuel. ICEVs have proven that there is strong consumer demand for vehicle ranges
far greater than 100km. Increased range enables longer infrequent trips and reduces range anxiety.
Table 2-1: Daily Travel Distance (Albrecht et al. 2009b)
Table 2-2 below shows a range of vehicles and their reported range for a single charge. The largest
differentiator between these vehicles is pack size. Tesla stands out with the largest range, and there are 8
vehicles with a range of 150 km or greater.
Table 2-2: Vehicle Range on a Single Charge (Albrecht et al. 2009b)

KEY BARRIERS AND POSSIBLE POLICY SOLUTIONS
2.1.1.3 Batteries
Energy and Power Density
In the past, EVs were perceived to be underpowered and have poor range. The two most influential figures of
merit for these discrepancies are energy and power density. Relative to both volume and weight, these figures
of merit help scientists and engineers compare battery packs of different sizes in a systematic and direct
manner. Both power densities and energy densities for a wide variety of lithium ion chemistries have
increased dramatically in the past fifteen years.
A123 Systems have a commercially available cell that has demonstrated a power density of 3 kW/kg (A123,
2010a). This is more than 10 times the typical power density of a lithium ion battery. Power densities have
increased sufficiently high as to no longer be a barrier to commercialization.
A typical high quality lithium ion cell can have a gravimetric energy density of 150 Wh/kg. In comparison,
petroleum has an energy density of approximately 12,500 Wh/kg or roughly 80 times the energy density.
Fortunately EVs are roughly 3 times more efficient than ICEVs, but by comparing the two it becomes
apparent why it is difficult to achieve a very high capacity battery pack in an EV.
Therefore, unlike power density, much remains to be desired with energy density. Despite excellent progress,
energy density of available battery technologies remain a limiting factor in the widespread adoption of EVs
(AA2020, 2010). In the current early commercialization phase, manufacturers such as BYD and Tesla are
using larger, heavier battery packs in order to achieve sufficient range. An example is the BYD e6 that has a
range of 300 km. Rather than use a high energy density pack, BYD has opted to use a chemistry that is
sufficiently cheap that they can simply add more batteries at the expense of weight (BYD, 2010).
Table 2-3 below shows the forecasted weight for a typical EV battery pack. If the current rate of progress
continues, it is predicted that a 160 km range battery pack will weight 55 kg.
Table 2-3: Forecasted Weight of a Typical Electric-Vehicle Battery. This assumes 3 miles (4.8km) per kilowatt-hour and
160 km range (US DOE 2010).
Cycle and Calendar Life

KEY BARRIERS AND POSSIBLE POLICY SOLUTIONS
Barriers to and Policy Solutions for EV Adoption in Australia • March 2011 15
Batteries degrade both due to use, as well as when not in use. Battery cycle life is defined as the number of
complete discharge cycles a pack can handle before reaching 80% of its original capacity. Shallow cycles
also cause degradation, however notably less than deep cycles. Calendar life differs from cycle life in that it is
time it takes a pack to degrade to 80% of its original capacity when not in use. For example, if a battery pack
has a 10 year calendar life and is being used regularly, it will have lost 20% of its original capacity after 10
years.
For most chemical variants of lithium ion batteries, such as lithium cobalt, lithium nickel cobalt manganese
(NCM), and lithium manganese, a typical cycle life is 800 cycles. This translates to a useful life inside an EV
of 4 to 8 years depending on usage, pack size and driving habits. Some variants, such as lithium iron
phosphate (LiFeP04), experience less degradation per cycle. An example is the M1 cell from A123 Systems
that has been shown to withstand 7,000 cycles at 25 degrees Celsius for a 1 hour discharge time.
Calendar life is unfortunately difficult to predict. The length of duration for state of the art cells being
manufactured today will not be known for many years from now. However, accelerated tests can be used to
simulate the effects of cell degradation over time with no external load on the cell. Additionally, there are
examples of lithium ion batteries that have been used in the radio controlled toy racing industry for the past
ten years with a proven track record for calendar life. For example, Dow Kokam produces a commercially
available cell, which they claim has a 10+ year calendar life (Dow Kokam, 2010).
Safety and Temperature Considerations
The technical aspects of EV design that ensure the safety of the passengers are of the utmost importance.
While EVs have the potential to be considerably safer than ICEVs due to the lack of a gas tank, at present they
remain unproven in this regard in the mainstream commercial market space. No breakthrough is required to
make EVs safe, however their remain technical barriers in the sense that battery packs and surrounding
systems must be engineered and manufactured such that they can handle high heat, vibrations, collisions and
abuse. The necessity of extra fuses, automatic disconnects, thermal management systems, and in some cases
firewalls adds to the cost of the battery pack. Any highly publicized safety incident with EVs could have
severe and long lasting effects on the perception of EVs in the eyes of consumers.
A near disaster occurred in June of 2008 when a converted Toyota Prius built by Hybrids Plus experienced a
fire resulting from an assembly error. A washer was placed on the wrong side of a piece of plastic that
resulted in a high electrical resistance. When the bolt came loose arcing occurred and started a fire that was
completely independent from the cells themselves aside from the proximity of said bolt to the cells
(Beauregard, 2008). This vehicle was a prototype and the incident does not seem to have irreparably harmed
the EV industry, however if a commercially available vehicle such as the Tesla Roadster were to have such an
incident, it is conceivable that it could have significant impacts on the whole industry.
The safety of a battery pack is highly influenced by thermal management. High temperature events pose the
risk of causing thermal runway, which would lead to a fire or possibly an explosion inside the battery pack.
While this is always a risk with gas tanks in ICEVs, considerable attention is being paid to ensure that EVs are
even safer than what the consumers have come to expect. Most lithium ion batteries require monitoring and
control to prevent cell failures. As such, temperature sensors are almost always included in EV battery
management systems (BMS). A well-designed BMS will limit or even cut-off the current from the battery
pack if a cell, or multiple cells, exceed the specified cut-off temperature. In order to prevent a high
temperature warning or cut-off event from occurring, EVs will often include a thermal management system
that utilizes either liquid or air to cool the battery pack. Liquid cooled systems can be used to cool the pack
quickly, however they are often more expensive and more complex than air-cooled systems.

KEY BARRIERS AND POSSIBLE POLICY SOLUTIONS
A notable example of an EV that uses air-cooling is the Nissan Leaf. It is speculated that the current draw
from the Leaf‘s pack is sufficiently low such that air-cooling is sufficient to avoid thermal incidents. In
contrast, the Tesla Roadster uses liquid cooling for its much larger battery pack. While Tesla representatives
claim liquid cooling to be superior, it is worth noting that the Roadster‘s pack uses cobalt in their cells, and it
is likely that their cell chemistry is intrinsically less safe than the Lithium Manganese cells used in the Nissan
Leaf.
In addition to drivetrain and battery pack thermal management systems, most BEVs have air conditioning
systems that rely on the energy stored in the battery pack. At higher temperatures the cooling systems can use
a substantial portion of available energy and as such decrease vehicle range. For ICEVs this is less of a
problem since the portion of energy devoted to cooling is small in comparison to the amount of energy used
by the powertrain.
Possible Policy Solutions
While there are many EV components that are not yet optimized, there remain only a few which are far from
optimal when compared to the ICEV equivalent. The largest technical gaps exist for battery technology and
charging infrastructure. As such the following incentives and funding arrangements are recommended to
address the most challenging technical barriers. Many of these recommendations are in alignment with the
Australian Automotive 2020 Technology Roadmap (AA2020 2010).
Research Funding
Tech1. Initiate funds for centres of excellence for advanced manufacturing and battery pack
development.
Tech2. Establish research partnerships between Australian centres of excellence and counterparts in
Asia.
Tech3. Increase cell chemistry research funding for next-level high energy density batteries with a
focus on increasing lifetime, reliability and reducing the cost of production.
Demonstration Projects
Tech4. Initiate, encourage and fund charging station and infrastructure demonstration programs.
Preference should be given to research that is pursuing high power, lower cost, and higher
reliability charging stations.
Tech5. Fund government EV fleet vehicle purchases with preference given to vehicles that are driven
by commuters. Critical information from these vehicles such as power usage, state of charge
and distance travelled should be fully monitored with GPS data acquisition. In addition the
motorist‘s qualitative experience should be recorded as well. Factors such driving enjoyment,
range anxiety, and sense of safety should be included. This will enable further study of
commuter habits and the ability of EVs to meet commuter demands.
Tech6. Demonstration projects that include advanced, high energy density battery packs. Preference for
funding projects should go to EVs that hold promising battery technologies in the areas of high
cycle life, high energy and power densities with low cell material costs.
Tech7. Fund or subsidize battery swapping stations for high daily use fleet applications such as taxis
and delivery vehicles.

KEY BARRIERS AND POSSIBLE POLICY SOLUTIONS
Barriers to and Policy Solutions for EV Adoption in Australia • March 2011 17
2.1.2 Technology costs
Battery Costs and Manufacturing Capacity
The single highest component cost for EVs is currently the battery pack. For the Tesla roadster, for example,
the battery pack cost is estimated to be $33,000. To reduce costs, engineers could choose to design vehicles
with substantially smaller packs, but consumers are used to ranges in excess of 400km. To achieve this range,
an approximately 60kWh battery pack is required. At an aggressive price target of $200/kWh, this equates to
$12,000 per battery pack.
Table 2-4 below shows the forecasted cost of a typical EV battery. Economies of scale will be largely
responsible for a pack cost of approximately $5,000 by 2020.
Table 2-4: Forecasted Cost of Typical EV Battery. Assumes 3 miles (4.8 km) for ever kilowatt hour and a 160 km range
(US DOE 2010)
To achieve these cost targets, very large factories must be built and production volumes must increase
dramatically. Some progress has been made in this regard. A123 Systems for example has opened a new
91,000 square-foot manufacturing facility in Livonia, MI, USA. This new facility is expected to expand
A123‘s manufacturing capacity by 600MW, or approximately 20,000 vehicles worth of cells (A123 2010b).
Another example is a joint venture between Thundersky and RUSNANO with enough capacity to build
15,000 cars per year (Nanowerk, 2010).
One concern with the long-term cost of battery packs is the availability of lithium and other metals used by
lithium ion batteries. Despite lithium being found in abundance in salt flats and in the ocean, the number of
high concentration mineable locations is relatively few. However, several studies have demonstrated that this
will not be a limiting factor in the rollout of EVs. Furthermore, with an annual production exceeding 6,000
tonnes, Australia is the second largest producer of lithium in the world. Australian lithium reserves are
estimated to be 580,000 tonnes (AA2020, 2010). Currently cobalt, lithium and nickel are the only battery
materials that are recovered in significant quantity from common smelting processes. Also, recovering battery
aluminium and copper may very well be economical in the near future. An example of a battery recycling
company that recovers both lithium and cobalt is Toxco Inc in British Columbia (Toxco, 2010).

KEY BARRIERS AND POSSIBLE POLICY SOLUTIONS
Manufacturing Assistance
Tech8. Enact an investment tax credit for domestic battery production facilities that encouraged local
manufacturing of low cost, high energy and power density batteries.
2.2 Institutional Barriers and Solutions
Even if all technical barriers were removed, the uptake of EVs may be limited by the habits and conventions
that have been established during the past century of dominance of ICEVs. This section introduces these
―institutional barriers‖, created as a result of how people relate to EVs, through market and government
structures, laws, regulations, values and culture.
2.2.1 Regulatory Barriers - Regulatory Reform
Regulatory barriers generally refer to those barriers created by the operation of laws and regulations. In
relation to EVs, a relatively rapidly emerging technology, regulatory barriers may more frequently arise due to
a lack of regulation needed to support widespread adoption.
Laws and regulations in relation to EVs that are needed, but are commonly lacking due to the new nature of
this market, include:
Standards for technology (e.g. batteries and charging systems) and safety
Interoperability between cars and chargers
Guidance on how and where to install charging equipment, and when this equipment can be used
Registration and insurance
Manufacturing and sales
Maintenance and servicing
Consumer protection including performance claims and warranties
Battery shipping and handling including recycling.
Regulation can also play an important role supporting the market development of EVs; however this
regulation has been slow to develop to date. Examples include:
Strict exhaust emissions standards
Requirements for EV acquisition for government fleets.
Some specific areas where regulatory barriers are more acute are discussed below.
Electricity System Infrastructure Regulation
As stated in the Phase 1 report, EVs have the potential to be either a costly new electrical load or a new
system resource depending primarily on the level of control utilities may have over the vehicles in their
service area and timing of charging. If these issues are not addressed soon, there may be significant opposition
to EVs from taxpayers who may end up paying higher electricity costs because of the additional peak system
load. This could act as a significant barrier to widespread adoption of EVs.

KEY BARRIERS AND POSSIBLE POLICY SOLUTIONS
Barriers to and Policy Solutions for EV Adoption in Australia • March 2011 19
There are significant challenges that need to be solved in order to maximise the utility of EVs as a distributed
energy (DE) resource and simultaneously eliminate any negative impacts related to the electricity system
associated with mass EV adoption. Several of the regulatory barriers associated with this are outlined in the
iGrid Working Paper 4.1 report including ―coupling‖ regulated utility revenue and profits to electricity sales
volumes. This approach can mean that utilities have strong incentives to supply power but few incentives to
purchase it back through vehicle to grid (V2G) applications.
A particular area of relevance for EVs is regulation pertaining to peak demand and network augmentation.
Several specific recommendations have been made within this context in the iGrid Working Paper 4.2
including decoupling of network business profits from electricity sales, fair treatments of DE in the national
electricity rules and streamlining of licensing requirements for DE.
Vehicle Clustering
Is it expected that, as with hybrids, uptake of EVs will group or cluster together in particular neighbourhoods
(Packard 2010). This will cause loads on particular transformers, feeders and substations to increase faster
than average as EV adoption rates increase. This increases the urgency of regulatory reform. While EV
penetration rates may not have significant near-term impacts on many network assets, particular areas are
likely to experience grid capacity stresses at relatively low levels of overall EV uptake.
Controlled Charging
EV companies anticipate customer demand for charging in under an hour for vehicles that are either being
used for longer trips, do not have a convenient place to charge at home, or for people who do not to or are not
able to wait. Level 3 fast changing can meet this demand by cutting charge times by more than half.
However, there is no specific global standard for this type of charging and a variety of terms (e.g. Level 3
charging, Super-Charging, etc) for this type of charging is creating confusion and frustration within the
industry.
Home Upgrades and Permitting
Many individuals who purchase EVs will install home charging electric vehicle supply equipment (EVSE).
This will often require upgrades and permits, especially if there is no spare capacity in the main electrical
service panel. Furthermore, for those who want to be able to feed energy back to the grid, additional permits
and potentially new regulations will be required, similar to solar PV home installations.
Vehicle Standards
As dsicussed earlier, standards for technology and safety are an important aspect of EV regulation that needs
to be developed rapidly in order to maximise adoption of EVs. The International Organization for
Standardization (ISO) and International Electrotechnical Commision (IEC) have already begun the process of
setting standards related to various aspects of EVs. These international standards include the newly revised
ISO 6469, a two-part standard intended to help manufacturers design fail-safe electrically propelled vehicles,
and 9 different standards documents have already been published under IEC TC69—Electric Road Vehicles
and Electric Industrial Trucks (Brown et al, 2010). If Australia adopts standards reflecting other national and
international standards as much as practicable, it will increase EV adoption both by encouraging automakers
to offer products in Australia and by maximizing safety and environmental outcomes. In order for standards to
become useful, they must also be adopted by regulatory agencies in documents such as the Australian Design
Rules (ADRs). These rules were created without consideration for EVs and require revision.

KEY BARRIERS AND POSSIBLE POLICY SOLUTIONS
Charging Infrastructure
EV charging both in the home in the public realm is an area that requires careful consideration with regards to
regulation. A number of current international standards exist relevant to EV battery charging infrastructure
and provide the basic electrical safety framework for the provisions of vehicle charging facilities at shopping
malls, parking buildings, parking lots and other such facilities. The SAE Electric Vehicle Conductive Charge
Coupler (J1772) for example covers the general physical, electrical, and performance requirements of one
type of electric vehicle conductive charge system and coupler. The area of interoperability, or which vehicles
will be able to charge at which stations, is an area where regulation is needed more urgently as there are
currently several competing local and international initiatives. There is also a need for standardisation of how
charging provider plans are communicated to the public especially if multiple business models emerge.
Vehicle Categories/Classifications
Australia is being denied many of the EVs products available globally because suitable regulatory
classifications/categories for these vehicles do not currently exist. These include the multitude of mini-cars,
3-wheelers, NEVs and other ―sub-car‖ products. A prominent example is Reva G-Wiz that was not eligible for
registration as a regular vehicle and Australia, unlike many other countries, does not have a ―quadracycle‖
vehicle category.
Battery Lifecycle
New regulations are needed for the manufacturing, shipment and recycling or disposal of EV batteries. This
regulation is required both to ensure safety as well as efficiency in the industry. Ongoing work related to
larger-scale battery packs includes a number of IEC initiatives and working groups related to developing
standards for lithium-ion batteries, lead-acid, and nickel batteries for automotive applications (Brown et al,
2010).
Environmental Performance
The environmental performance with regards to resource use, local air quality and GHG emissions is a
complex area of research. Regulations are needed to determine standards for consistent calculation of these
effects between vehicle types including EVs and ICEVs. One of the main challenges in this is the
determination of system boundaries.
Possible Policy Solutions
Given a significant requirement for either new regulation or regulatory reform in these areas, possible policy
options include:
R1. Develop standards for EVs and charging equipment in high priority areas
Lazar and McKenzie (2009) suggested that there are several areas related to EVs where
standards development is either progressing too slowly or not at all. This work was later
revised (Lazar & McKenzie 2010) to include a work plan. The areas of highest priority
identified in the report included standards for: occupant safety, aftermarket installations,
recharging interface, and vehicle labelling. All of these fell under the ‗market protection‘
classification used in the report. Where possible, these new standards should attempt to align
with existing or upcoming international standards such as ISO 6469 on safety specifications.
R2. Streamline EVSE code and permit requirements
This will reduce application and waiting times, reducing purchase barriers of new EVs from

KEY BARRIERS AND POSSIBLE POLICY SOLUTIONS
Barriers to and Policy Solutions for EV Adoption in Australia • March 2011 21
consumers requiring home upgrades. This is also important for businesses installing EVSE for
commercial public charging.
R3. Implement mandatory fuel economy standards
Voluntary standards are unlikely to sway manufacturers towards offering more efficient
vehicles, including EVs, as can be seen by relative fuel consumption in Australia versus many
countries in Europe. Several countries have implemented mandatory fuel standards with
additional credits for manufacturers that that offer vehicles significantly below the mandated
standards. These additional credits in addition to aggressive mandatory fuel economy
standards would be required to increase the rate of EV uptake in a significant manner.
R4. Develop mandatory low and zero emission vehicle requirements
As with legislation developed by the California Air Resources Board (CARB), regulation
requiring manufacturers to sell a minimum number of low and zero emission vehicles would
ensure that potential purchasers have access to vehicles.
R5. Ensure building codes for new or renovated sites to support EVs by requiring dedicated
electrical capacity and parking spaces
New buildings or renovations could be required to have the capacity to deal with the
additional load of an EV and have EV specific parking allocations. Many homes, and
particularly apartments, may have little or no spare electrical supply capacity. This also needs
to happen at the community level to ensure there is sufficient capacity for EV charging in the
network. There are international examples outlined in this report where jurisdictions have
implemented a minimum number of service points for new apartment buildings as an
example.
R6. Regulation to allow emergency load curtailment of EV charging
This would ensure that EVs do not threaten the integrity of the grid by allowing utilities to
stop EV charging in certain circumstances to prevent potential damage to network assets or
prevent a power outage.
R7. Require utilities to develop an EV infrastructure plan
This would ensure EV interoperability with the grid and address requirements and strategies
for infrastructure, cost recovery, smart grid integration, time of use (TOU) pricing, and billing
issues, an analysis of the types of power plants operating at different times of the day and year
so there is a clearer picture of the best times for EV charging to maximize GHG reductions
and an analysis of each utilities distribution system to identify areas where homes and/or the
distribution system will need to be improved in order to handle increased EV charging.
R8. Revision of ADRs to include new and converted EVs
The Australia Design Rules (ADRs), administered by the Department of Infrastructure and
Transport, are national standards that include vehicle safety and emissions for new and
second hand vehicles. The Third Edition ADRs were re-made as national vehicles standards
in September 2006 and have been created without consideration for EVs.
R9. Regulation for charger to vehicle interoperability
There are a growing number of international options for vehicle charging that include various
housings, pin configurations and communications protocols. While each technology may have
different merits, it would be advantageous to adopt and regulate a single standard as the US
has done with J1772 for Level 2 charging. This would allow any EV to charge at any station
and would therefore maximise the benefit of public charging infrastructure.
R10. Require municipalities to plan and prepare for EVs
Municipal planning and regulation at the suburb level is required to increase the rate of EV

KEY BARRIERS AND POSSIBLE POLICY SOLUTIONS
adoption. In addition to residential premises, this would need to include commercial premises
and public infrastructure like public transport facilities and curb-side parking.
R11. Expansion of vehicle categories
Several EVs currently available internationally do not easily fit in to the four categories in the
ADRs. A logical addition would be what several other countries call a quadracycle or low
speed compact vehicle that is not licensed to drive on highways.
2.2.2 Inefficient Pricing – Price Reform
There are two aspects to inefficient pricing that represent barriers to wide-spread adoption of EVs. These are:
unpriced ‗external costs‘ and the structure of prices. External costs are those costs that are caused by the
supply of a good but are not included in the price of that good (e.g. the costs associated with greenhouse gas
emissions).
The most obvious external cost of electricity supply is the cost of climate change caused by burning of fossil
fuels to generate electricity. This means that the average price of fossil fuel-based centralised electricity is set
below the true cost of supply, thus leading to excessive consumption and reducing the uptake of low emission
sources, such EVs.
Generally, efforts to mitigate climate change and improve energy security will be a major catalyst for EVs
(Brown et al., 2010). The current lack of a carbon price is a barrier to EV investment. Furthermore, any
future climate change legislation that increased the cost of electricity generation, but did not affect the cost of
petrol as with the proposed Carbon Pollution Reduction Scheme (CPRS) at the end of 2009, would act as a
double pricing bias against EVs.
A second component of inefficient price structures is that of undervaluing the demand management resource
that EVs offer. In Australia, there are very few, if any, utilities that offer net-metering tariffs for EVs as a
source of energy when the car is plugged in and the grid can draw energy from the car‘s battery pack.
Possible pricing policy options include:
P1. Introduce a Price on Carbon Emissions
A price on carbon, specifically including emissions from petrol would both encourage
individuals to purchase EVs due to the higher relative cost of transport fuels as well as
encourage adopters to purchase green electricity for their EVs.
P2. Time of use pricing
To both encourage prospective buyers to purchase EVs based on low overnight tariffs and to
encourage charging in off peak periods, reducing electricity network stress. This could
include as well critical peak pricing where the prices are more closely aligned with the pool
price on days of high distribution system stress which normally correspond to days of high
electricity demand.
P3. Net-metering with feed-in tariffs
To encourage EV owners to sell energy back through V2G. This would work best with a
dynamic time of use tariff structure.
P4. New or increased environmental, fuel or congestions charges or taxes
Bringing existing transport options in alignment with true costs including those of air
pollution and greenhouse gas emissions through the use of charges or taxes would allow EVs

KEY BARRIERS AND POSSIBLE POLICY SOLUTIONS
Barriers to and Policy Solutions for EV Adoption in Australia • March 2011 23
to compete on a more equitable basis. This could include policies such as a minimum price
for petrol (Lidicker et al., 2010) or an economy wide carbon tax that served to increase the
cost of carbon intensive fuels. These charges or taxes could be used to fund EV development
or other programs.
P5. Reduce or eliminate subsides for existing ICEV purchases, especially in fleets with
fringe benefit taxes
This would work in much the same way as the increased fees or taxes on existing ICEVs, but
would allow governments to simply remove ‗environmental loopholes‘. (Riedy, 2003; &
Bracks, 2008).
P6. Reduce or eliminate subsides for oil and petrol such as credits for oil exploration
This would work in the same manner as a reduction in subsidies for ICEV purchases.
(Diesendorf et al., 2008).
P7. Default network support payments
To be paid at no disadvantage to the network businesses to EV owners exporting power to the
grid. This should include the often significant value of avoided network system augmentation
and should allow utilities cost recovery authority for any distribution system upgrades needed
to facilitate EVs.
P8. Green Registration Discounts
This could be a requirement on the owner, manufacturer or seller or could be also be
introduced as a reduction in cost of Green Power for new EV owners or tied to the provision
of incentives such as rebates or discounts on registration fees etc. Governments or car dealers
can promote the voluntary purchase of green electricity by electric car owners while
electricity suppliers, local governments and companies that own and operate charging points
can ensure that renewable electricity is used for the charging points for these cars; national
governments could support these developments, for example through fiscal policies
(Kampman et al., 2010).
P9. Fuel-economy based fee at the time of purchasing a car
Research suggests that ‗‗feebate‘‘ programs, where consumers pay a fuel-economy based fee
at the time of purchase may be more effective at encouraging the purchase of high fuel-
economy vehicles than fuel-economy based registration or emissions testing fees. Moreover,
unlike a sales tax waiver, a feebate could be designed to be revenue neutral (Gallagher and
Muehlegger, 2010).
2.2.3 Payback Gap – Enticement (Incentives)
Payback gap refers to the idea that customers require a comparable payback period for EVs as compared to
ICEVs before they invest in EVs. Furthermore, the payback gap also refers to the differing expectations of
individuals with regards to rate of return on capital purchases versus other investments. For example, many
people hold cash in their bank accounts at interest rates of less than 5% while they are unwilling to invest in
efficient appliances for their home with payback periods of less than 4 years or equivalent compounded rate of
return on capital of greater than 19%. The payback gap also refers to the costs and slow return on investment
for installing infrastructure, developing EVs and components, and manufacturing EVs and components.
Electric vehicle proliferation requires EVs to be cheaper to operate than ICEVs (Hensley et al, 2009). Some
individuals and organisations will also be influenced in their purchase of EVs by desire to ‗be green.‘
Looking at factors that influence adoption, Kahn (2007) found that environmentalism was associated with

KEY BARRIERS AND POSSIBLE POLICY SOLUTIONS
hybrid ownership. However, Heffner et al. (2005) conducted detailed interviews with households in Northern
California that own HEVs, and determined that both anticipated cost savings and the ‗‗green image‘‘ of
hybrids influence purchase decisions. McManus and Berman (2005) also found that hybrid owners and
potential owners identified the desire to save money on gas and reduce pollution as significant motivating
factors for purchasing a hybrid. A 2004 marketing survey by ChangeWave Research concluded that hybrid
owners tend to be in the highest income demographics and are more sensitive to gas prices than environmental
benefits in purchasing their vehicles (Diamond, 2008a). This research shows that those currently buying cars
have money or other values that are motivating them to do so. For consumers who take the lifetime
ownership costs in to account in their purchase decision, addressing the payback gap will increase the EV
adoption rate.
The payback gap can be addressed in several ways: offering incentives to decrease the price of EVs, creating
‗feebates‘ to increase the pricing of ICEVs (which is covered in the barrier discussion on inefficient pricing)
or by supporting alternative or low cost financing options so that upfront costs are reduced in exchange for
increased operating costs. To stimulate all parts of the market, these incentives should cover new vehicles as
well as conversions, vehicles of different degrees of electrification (PHEVs and BEVs) and vehicles in
different classes from neighbourhood EVs to electric trucks or buses. Incentives could be linked to other
initiatives such as a bonus for EV manufacturers who purchase the Green Power equivalent to the average
energy use of the vehicle or special incentives for individuals who trade in high fuel consumption vehicles
(‗clunkers‘) at the time of purchase. Green Power should equate to less than $100 per year of ownership.
Similar financial incentives could be developed for EV service providers and manufacturers.
Possible policy options include financial enticements such as:
E1. Tax of fee reductions or exemptions or cash bonuses on EV or charging station
purchases
Reduce upfront purchase costs of EVs or related equipment through either reduced purchase
taxes such as GST or through end of year tax rebates or accelerated depreciation for
businesses or through cash back bonuses. These could be offered as variable credits
depending on degree of electrification, reduction in GHGs, and/or by vehicle size and class.
This could also come in the form of reduced insurance costs. Others have noted that BEVs
should receive enhanced tax credits, exceeding those for hybrids (Fontaine, 2008). There
should also be consideration for conversions from ICEVs to EVs.
E2. Low interest loans or grant funds
These could be used to both reduce financing costs and potentially to make EVs more
accessible to lower income families. Loans could cover the vehicle, EVSE and installation
costs.
E3. Subsidised battery rental programs
By removing the upfront capital costs of the batteries, many EVs would be cost competitive
with ICEVs today. A government supported or partially financed program to do this would
greatly increase adoption rates.
E4. Fleet purchase incentives
These could be structured in a variety of ways including accelerated asset depreciation or
FBT exemptions.
E5. Manufacturer subsidies or tax credits
These could be given to vehicle or EV related equipment such as EVSE manufactures on a
per unit basis to encourage rollout or to companies to encourage local manufacturing and
R&D.

KEY BARRIERS AND POSSIBLE POLICY SOLUTIONS
Barriers to and Policy Solutions for EV Adoption in Australia • March 2011 25
E6. Incentives for battery second life programs
Battery recycling program that would allow owners to sell vehicle batteries so they could be
used for example by utilities after their first life in the vehicle.
E7. Credits for low carbon fuels
If electricity and other low carbon fuels are subsidised, it will decrease ongoing costs for
vehicle owners.
E8. Ability to quantify and monetize lifetime of CO2 emission allowances
This was suggested by Fontaine (2008) as a way to compensate EV owners for the future
value of GHG reductions.
Other benefits that may encourage individuals to purchase EVs despite higher initial costs could include:
E9. Access to High Occupancy Lanes and exemption from highway tolls or potential future
congestion charges
There are several international examples where policies of this nature have helped to
encourage low emission vehicle adoption.
E10. Creation of low or zero-emission zones near city centres
This would reduce air pollution in select areas while creating an incentive for EV purchase.
E11. Access to free or prime parking spaces
This is another policy tool used in other jurisdictions that would encourage EV adoption. This
could potentially be combined with free public charging.
E12. Electricity rebate program
This would equate to subsidising free electricity for a set period of time for charging EVs
possibly in conjunction with the purchase of Green Power.
E13. Special recognition of EVs
This could be accomplished through for example special licence plates.
Finally, specific enticements that may bring down the costs of vehicles, increase availability or decrease the
costs of grid integration include:
E14. Grants/loans for R&D
Primary research and development funding will help reduce production costs and increase
vehicle performance. Funds should also be used for desktop research that helps better prepare
governments and the public for the introduction of EVs.
E15. Grants/loans or tax credits for manufactures
Initiatives such as the Green Car Fund discussed later in this report can help manufactures of
vehicles or EV related equipment to both create local jobs, help create growth in local
industries and increase vehicle availability while reducing costs.
E16. Grants/loans for EV pilot areas
As with the Solar Cities program discussed in more detail later in this report, the grants or
loans would help establish pilot areas where technical and institutional barriers could be
examined at a more localised scale.
E17. Funding to assist Utilities in planning/preparing for EV introduction
Planning initiatives funded in the near term will help utilities maximise the benefit of EVs as
a DE resource in the mid- to long- term.
E18. Subsidies/programs to upgrade local circuits in homes/buildings to allow faster charging
This will both encourage adoption of EVs as well as potentially be linked to emergency load

KEY BARRIERS AND POSSIBLE POLICY SOLUTIONS
curtailment programs allowing utilities to slow or stop charging during times of high grid
stress in exchange for providing Level 2 charging stations for homes.
2.2.4 Split Incentives - Facilitation
Split incentives refer to circumstances where the benefits and costs are shared unequally amongst a number of
agents resulting in a less than optimal outcome. If the parties that benefit the least can somehow receive
compensation from the parties that benefit the most, split incentives could be resolved. The greater the number
of parties involved in decisions related to EVs, the greater the transaction costs associated with devising and
negotiating a mutually acceptable outcome.
An example of this is rental car companies who are not responsible for the cost of fuel, but are exposed to the
capital costs of purchasing the vehicle. In this circumstance, the company has less incentive to purchase fuel
efficient or EVs while renters would prefer to drive a vehicle that has a lower cost of fuel.
Another example can be made with regards to building of infrastructure. Plug-in vehicles will require
supporting general infrastructure to be developed as they come to market. Some of this infrastructure can be
located within existing facilities, such as high voltage testing equipment and EV specific maintenance tools
that will be required at auto mechanic shops, while other infrastructure, such as charging and battery swapping
stations will require new sites. Much of this infrastructure has been the subject of a ‗chicken and egg‘ debate
of which should come first, the vehicles or the supporting infrastructure. Many international governments
supportive of EVs have implied through financial support that lack of widespread infrastructure is one of the
main barriers to widespread proliferation of EVs3 but manufactures or service providers are reluctant to invest
in infrastructure during early market development without a guaranteed return on investment. As there will
inevitably be individuals who will wait to purchase EVs until infrastructure is developed, policies that result in
larger initial infrastructure build-outs will encourage more rapid adoption. Similarly, manufacturers will also
be hesitant to develop EV manufacturing equipment or EV manufacturing components without proven
demand.
The role of government to the barriers created by split incentives is one of facilitation between stakeholders.
The following policy options could be deployed to create joint initiatives between government and industry:
F1. Government fleet purchase guarantees
Memorandum of agreement or understanding between governments and manufacturers to
purchase minimum quantities of particular makes and models of EVs over a fixed period of time.
Similar policies exist in other jurisdictions such as California. These could also be structured in
terms of fleet targets or other mechanisms such as an Oil Savings Performance Contract as
recommended by the Electric Drive Transportation Association (EDTA, 2009).
F2. Joint infrastructure projects
Public / private partnerships allow industry to deploy necessary infrastructure such as EVSE
related projects. One example of this is targeted pilot programs including parallel examples in the
DE space such as the Solar Cities program, discussed in more detail later in the report along with
several international examples.
F4. Funding of workforce training programs
Training programs such as the new TAFE EV program will help create the skill base necessary to
support the both vehicles and the corresponding infrastructure.
3 Through, for example, the $99.8 million awarded by the US DOE to the EV Project to deploy charging
infrastructure

KEY BARRIERS AND POSSIBLE POLICY SOLUTIONS
Barriers to and Policy Solutions for EV Adoption in Australia • March 2011 27
F5. Connecting renewable energy targets to EV sales
This will ensure that future growth in electricity demand associated with EVs is linked to growth
in low carbon energy resulting in low or zero carbon transportation outcomes.
F6. Government sponsored battery warranty program
This will help to reduce or spread the risks of advanced batteries. As stated by Fontaine (2008),
warranties are a principle means to overcome the information imbalance regarding product quality
between an informed manufacturer and an uninformed customer.
2.2.5 Imperfect information – Information Provision
Neoclassical economic theory states that for a market to be truly efficient, all actors must have access to
perfect information. Furthermore, as stated by Jaffe and Stavins (1994), market failures can be caused by
insufficient and incorrect information. This is especially relevant to EVs as the lack of available products has
left many individuals, including policy makers, guessing as to the technical nature of the vehicles as well as
impacts on electricity networks. To this point, there are several publically available resources devoted to
‗myth busting‘ common misconceptions about EVs.
Typical prevalent myths, often based on previous eras of EVs, and corresponding explanations include:
The range is extremely limited: PHEV ranges normally match or exceed existing ICEV while BEV
minimum range for existing vehicles varies from 100km for the Blade Electron produced in Australia to
393km for the Tesla Roadster while recently a converted Mira EV in Japan set an official record for an EV
at over 1000km range on a single charge (Barry, 2010). Furthermore, range requirements for a typical daily
driving cycle are much lower than these numbers with average distance travelled per person per day in
Victoria at 33km (Vic DoT, 2010).
Vehicles lack power and are slow: Several racing cars, including some made by Porsche are now electric
hybrids. Production BEVs including the Tesla Roadster and the Venturi Fetish have 0-60 mph acceleration
times of less than 4 seconds, which is faster than only a few ICEVs. Furthermore, as early as 1994, a
modified GM EV1 set the world speed record for an EV at 300 km/h. The Bukeye Bullet currently holds
the official land-speed record for a BEV at 495 km/h with instantaneous power production of more than
600kW.
Charge time is not quick enough: Using a standard 15A wall outlet, a typical EV requiring 160Wh/km
would require less than 2 hours of charge time to drive 33km. Several of the vehicles coming to market
will also be equipped with Level 3 charging capabilities. The second generation Nissan Leaf will be able to
recharge to 80% capacity in 30 minutes (Rowley, 2009). This is equivalent to being able to charge enough
for a typical daily drive of 33km in about 7 minutes. Furthermore, consumer vehicles are typically parked
for about 23 hours per day with a median travel time in Victoria of 78 minutes per day during the week
(Vic DoT, 2010),leaving ample time for charging.
EVs are more polluting: EVs do not directly emit pollutants such as carcinogens, nitrogen oxides,
hydrocarbons or carbon dioxide. However, some of these emissions are moved to power plants, which in
states such as Victoria can have significant emission profiles. Using full fuel cycle emission factors in
Victoria with estimated 160Wh/km BEV consumption, a typical BEV would emit approximately 216
gCO2-e/km. This can be compared to the new car average of 226 gCO2-e/km. However, this number is
relatively high when compared to the 2010 Toyota Prius that under NRMA independent testing produced
only 107 gCO2-e/km (Hudson, 2010). However, if Green Power is used for charging of BEVs, then
emissions are reduced to effectively zero.

KEY BARRIERS AND POSSIBLE POLICY SOLUTIONS
EVs consume more resources: This idea was first propagated by a CNW Marketing Research study in
which they estimated that the lifetime energy costs of a Toyota Prius were greater than a Hummer. This
was widely disputed and recently corrected in a recent update (CNW, 2010).
Batteries are unreliable: Experience with laptops and cell phones have led many consumers to believe
that batteries are not capable of lasting as long as the average life of a vehicle. This concern has been
widely resolved by recent warranty announcements on both the Nissan Leaf and the Holden Volt at 8 years
or 160,000 km for the batteries and related components. Several hybrid car battery packs have warranties
as long as 10 years, which is close to the average lifetime of a vehicle in Australia.
EVs will cause the power to go out: While impacts on the electricity grid from EV charging have the
potential to trigger early investments in infrastructure if the majority of charging is not done overnight, the
additional load from EVs will increase slowly allowing ample time for electricity utilities to plan future
investments. Further information on electricity grid impacts can be found in the Phase 1 report.
In addition to common misconceptions, for informed stakeholders, there is still a lack of available information
related to critical aspects of EV adoption and rollout. This includes information on potential current benefits
of EVs compared to ICEVs. There are several circumstances in which this lack of access to relevant
information may present a significant barrier.
Some of the following barriers have been adapted from the Institutional Barriers to Intelligent Grid Report
(Dunstan and Daly, 2009):
EV purchase costs and rate of return: Lack of reliable information on operating costs, creating difficulty
in justifying higher purchase or capital costs
Benchmarks for performance: Prospective consumers may not have information on low-emission
vehicles alternatives including EVS
Lack of precedents and product information: Information about EV driving and environmental
performance may be difficult to access even as it becomes more widely available
Pricing and operating cost knowledge: Lack of manufacturers suggested retail prices for upcoming EVs
along with operating cost information may be unavailable
Network planning information: As noted by Smith (2007), as with other potentially controllable loads,
network planners need to estimate the location, timing and amount of the load caused by the introduction
of EVs. The current lack of information both about EV adoption rates and charging locations as well as
the lack of planning information of network constraints and opportunities for investment makes it difficult
to assess both the problems and opportunities associated with EVs on the grid
Grid impacts: Related to information on network planning is the current lack of reliable information
related to the potential positive and negative impacts that EVs could have on the grid depending on how
controllable and what the capabilities of their charging and possibly discharging systems are
Technology winners: A lack of reliable information on the merits of various technology options, for
example in battery packs, makes it difficult to predict which technologies will become dominant with time
and what their associated implications are with regards for example to cost and impacts on the grid
Information on accessing infrastructure: Information about the capacity of networks could be a very
helpful tool to synergize, where appropriate and possible, the installation of EV networks, to best utilize
the ‗spinning reserves‘ offered by EV batteries.

KEY BARRIERS AND POSSIBLE POLICY SOLUTIONS
Barriers to and Policy Solutions for EV Adoption in Australia • March 2011 29
Policy options to help overcome information related barriers include:
I1. Provision of a central hub for EV information
This could include information on government programs and incentives, where to go for a test
drive and vehicle performance. Both a physical location and a website would be beneficial.
I2. Consumer education initiative
A centralised government sponsored initiative to help dispel EV myths and help individuals
and businesses to understand the benefits of EVs could potentially be a strong driver for
adoption.
I3. Requirements for separated EV electricity costs on utility bills
This would allow consumers to better understand the operating costs of EVs and could
potentially be accompanied by a comparison to what they would have paid in petrol.
I4. Require reporting of renewable energy used for vehicle charging
Mandatory reporting of the energy mix used for charging would allow policy makers to
calculate and better understand the environmental implications of EVs.
I5. Reports and case studies
Specific national and international case studies of EV incentives, regulation, and vehicle
characteristics will assist in good policy decision-making and help to keep stakeholders
informed of recent developments.
I6. Common metric for lifetime cost comparison of ICEVs, HEVs and EVs
Such as average cost per kilometre across all vehicles would help consumers make more
informed purchase decisions.
2.2.6 Cultural Values - Targets
Institutional barriers include any form of constraint devised by humans to shape interaction with technology
(Foxes, 2002). Whilst all institutional barriers are thus inherently embedded in cultural discourse, cultural
barriers can be identified as the social conventions, values and behavioural norms that dictate consumer
acceptance of technological innovation. Overcoming cultural barriers is crucial to encouraging the uptake of
EVs as ultimately it is the consumer who will need to be convinced of the technology‘s merits.
EVs represent the classic example of a ‗high learning product‘, that is, an innovation that requires a
considerable degree of behaviour change relative to existing behavioural norms (Kurani et al., 1994).
Generally, the greater the deviation from established routines, the greater the resistance to the innovation.
Innovation resistance is therefore the: ―resistance offered by consumers to an innovation, either because it
poses potential changes from a satisfactory status quo or because it conflicts with their belief structure‖
(Kurani et al., 1994).
Numerous frameworks have been proposed to explain the relationship between values, beliefs, attitudes and
behaviour. Ajzen‘s Theory of Planned Behaviour and the Values-Beliefs-Norms theory suggest consumer
behaviour is subject to cultural norms, personal values and attitudes in addition to external information. This
helps to explain why environmental concerns do not often translate into individual behavioural change. Lane
and Potter (2007) describe this as the ‗attitude-action gap‘, highlighting the role of conflicting values and
social conventions in influencing the adoption of new technology (Land, 2007). Whilst not mutually
exclusive, values and attitudes (shaped by social conventions) may be prioritised by the consumer in an order
that favours the rejection of EVs (refer to Table 2-5).

KEY BARRIERS AND POSSIBLE POLICY SOLUTIONS
Table 2-5. Social Norms and the Implications for EV adoption
Social norm Values/attitudes Behavioural implications Implications for EV
adoption
Symbolism and
appearances
(Sundareson and
Sheth, 1989)
Social status
Familiarity
What is considered
‗acceptable‘
Consideration of Image, brand,
appearance, novelty
‗Novelty‘ factor of EVs may
facilitate early adoption but
impede mainstreaming.
Consumer culture
(Sovacool, 2009)
Conceptions of
abundance
Reflected in a disinterest in life-
cycle costs. Australians have
traditionally enjoyed low cost
energy and increasingly affordable
personal mobility.
EVs need to compete with
ICVs on a cost basis.
Conformity and
scepticism of the
unfamiliar/change
(Sovacool and Hirsh,
2009)
Comfort, freedom of
control, trust, social
status, ritual, and habit
Psychological resistance to change:
strong preferences for the status-quo
mean familiar products attain higher
values.
Unfamiliar products with
high ‗disinterest‘ factor at
risk of consumer rejection.
EVs and required behaviour
change needs to be ‗sold‘
appropriately.
Convenience culture
and leisure demands
(Sovacool and Hirsh,
2009)
Leisure time
Convenience
Reliability
Preference for technology that
allows for leisure and convenience.
Desire for reliable transport
over long distances. Ease and
convenience of use of
conventional technology
(ICVs) – require no
behaviour change. Inadequate
EV infrastructure may lead to
slower uptake.
Social conventions ‗lock-in‘ existing technologies and can potentially ‗lock-out‘ the development of new
technologies. Foxes (2002) suggests new sustainable technologies are especially at risk of lock-out as they
have high unit costs and are yet to benefit from factors of increasing returns favouring incumbent
technologies. Nonetheless, cultural attitudes have the ability to favour the adoption of new technologies. The
novelty of EVs and environmental credentials for example offers the technology a clear point of difference in
the vehicle market and will no doubt appeal to early adopters. However, the technology must overcome other
cultural, institutional and technical barriers before becoming mainstream.
There is an obvious and inevitable link between imperfect information and reproduction of cultural values: the
former perpetuates the latter, compounding the effects of both barriers. The section below, which discusses
the interaction between EV barriers, explores this relationship in more detail, using examples of
misinformation and cultural attitudes. Conversely, ‗correct‘ information has the potential to empower and
enable a shift in cultural values and consequently, foster sustainable behaviours.
A comparison of EV policies in the US and France, and the resulting outcomes, showed that stricter regulation
in the US succeeded in the development of EVs and that the lack of public of awareness in France may have
been the reason for the lack of success. The comparison also highlighted that individual cultures still have
‗standard operating procedures‘ which reflect ‗deep-rooted national political and social cultures‘ despite
increasing globalization. It also suggests that governments should take into account the cultural dimension
when promoting policy change (Calef and Goble, 2007).
The role of government in helping overcome cultural barriers is to draw the attention and interest of
individuals and organisations by ‗generating specific objectives and measuring performance against these
objectives‘; in other words, by using targets at various scales (national, state, regional, local). Where

KEY BARRIERS AND POSSIBLE POLICY SOLUTIONS
Barriers to and Policy Solutions for EV Adoption in Australia • March 2011 31
prevailing culture, habits or tradition are not delivering appropriate outcomes, targets can be an effective
means of changing behaviour (Dunstan, et al., 2009). The Government also plays an important role in
recognising the technology as viable. Currently, the Federal Government does not recognise electricity as an
alternative transport fuel within its existing program (Australian Government, 2010).
T1. Firm national EV sales targets
Many Australian Government agencies and private organisations currently have targets for
reducing the GHG intensity of their vehicle fleets, including the integration of HEVs. These
targets could be modified to favour the adoption of EVs and PHEVs.
T2. Set government fleet targets for EVs
Many Australian government fleets have introduced targets for reducing the GHG intensity of
their fleets. Such policy would favour the adoption of EVs.
T3. Recognise electricity as an alternative road transport fuel within existing programs
Currently, the government recognizes biodiesel, ethanol, LPG, hydrogen and natural gas as
alternative transport fuels. If electricity were also recognised, then the Department of the
Environment, Water and Heritage would be involved in regulating and supporting electricity
as a transport fuel, as well as improving the information available about this fuel, its use and
its development in Australia.
Cultural barriers need to be targeted with the same level of scrutiny as technical barriers. As surmised by
Sovacool and Hirsh (2009); ―work to improve the technical performance of hardware must be coupled with
attempts to overcome economic, behavioural, cultural, and infrastructural obstacles. These latter types of
barriers do not fit neatly into the traditional R&D categories and remain deeply embedded in the social and
institutional fabric. Overcoming them may require a substantial effort that currently eludes much discussion‖
(Sovacool, 2009).
2.2.7 Confusion and Interaction between Barriers - Coordination
Whilst the simplest approach to implementing policy options is to identify barriers and counteract each barrier specifically
(known as a symmetric response, depicted in (Figure 2-1), in practice, this may be impractical due to resource or technical
constraints (Dunstan et al., 2009). Further, institutional barriers are invariably inter-dependent—the overcoming of one
barrier may actually require another to be addressed concurrently. Taking an asymmetric policy response approach (
Figure 2-2) can help address these issues and involves prioritising actions perceived to be most achievable or
cost effective. Stakeholder consultation will provide an opportunity to ensure the effectiveness of this
prioritisation process.
An obvious example of interaction between barriers is the relationship between the reproduction of imperfect
information and cultural attitudes. Misinformation can work to cement existing social conventions, and vice
versa—examples of which are outlined in Table 2-6.
The implications of not addressing the issues of imperfect information and cultural barriers concurrently can
be seen in the effect on further policy responses. Perpetuation of ‗EV myths‘ in cultural discourse potentially
gives way to flawed or wrongly prioritised fiscal policy responses in a context of limited time and resources.
Table 2-6. Example Interactions Between Imperfect Information and Cultural Values.
Lack of or
Misinformation
Cultural
values/attitudes
Examples
Perceived
limited ranges
Desire for reliable
transport over long
Several US studies have found values such as comfort, freedom,
flexibility, and mobility are quantified into monetary terms and
then surveyed drivers about their vehicle preferences, they found

KEY BARRIERS AND POSSIBLE POLICY SOLUTIONS
Lack of or
Misinformation
Cultural
values/attitudes
Examples
of EVs distances that owners believed EVs had a disutility of between US$10,000
and $16,250 (Sovacool and Hirsh, 2009)
EV purchase
costs and rate of
return
Desire for affordable
personal mobility
Lack of reliable information on operating costs, creating difficulty
in justifying higher purchase or capital costs.
A survey of Californian households found that not one factored in
the present value of fuel savings as part of a decision to purchase a
new vehicle (Green et al., 2007).
A 2007 US study found that not one respondent tracked fuel costs
over time and few considered transportation costs in household
budgets (Sovacool and Hirsh, 2009).
Charge time not
quick enough
Lifestyle demands –
‗on the go‘,
convenience, desire
for technology that
allows more leisure
time
EV companies anticipate customer demand for charging in under
an hour for vehicles that are either being used for longer trips, do
not have a convenient place to charge at home, or for people who
just do not like to wait.
Coordination of policy development is the critical directive for overcoming the compounding effects of
interacting barriers. The following policy responses have been adapted from the iGrid Working Paper 4.2 for
distributed energy.
C1. Agency to coordinate EV technology development and deployment
A key strategy often applied by government to address matters of major public interest is to
appoint an appropriate agency to coordinate policy and development activities. This existing or
new organisation must possess the appropriate skills, resources, commitment and authority for
managing EV policy objectives, e.g. the Office for Low Emission Vehicles in the UK.
C2. Development of Australian Standards for EV technology (in line with international
coordination on standards)
Victoria has taken the first steps in this regard by commissioning Standards Australia to undertake
a scoping study into developing Australian standards for EV technology. The study identifies a
list of recommendations for furthering the development of national EV standards.
C4. Join international efforts and organisations
For example, the Queensland, South Australian and Victorian State Governments have joined the
EV20 Accord, an international accord between global cities, states and countries to collaborate in
accelerating the development and deployment of EVs. This initiative is hosted by The Climate
Group, an international, non-partisan, not-for-profit organisation working to advance climate
change advocacy and the development of clean technology.
C7. Coordination federal and state EV strategies
This could include for example, a national strategy for EV development and deployment to
identify priority actions and outline strategic direction and implications for all stakeholders.

KEY BARRIERS AND POSSIBLE POLICY SOLUTIONS
Barriers to and Policy Solutions for EV Adoption in Australia • March 2011 33
Figure 2-1. Symmetric Policy Response Approach.
Figure 2-2. Asymmetric Policy Response Approach.

KEY BARRIERS AND POSSIBLE POLICY SOLUTIONS
2.3 Solutions Matrix
The matrix below categorises specific policy solutions by the category of policy response within which it fits
(e.g regulation, pricing, facilitation, etc) and the focus of the policy (e.g. batteries, vehicles, EV supply
equipment, electricity networks). Additionally, sometimes a single policy solution can have implications on
several or all aspects of EV adoption and integration. These broad-reaching policies are grouped and
presented at the bottom of the matrix. Furthermore, sometimes a single policy solution can be developed to fit
within several categories of policy responses, as can be seen below for solutions with check marks in multiple
columns. These two aspects demonstrate the challenge in classifying and categorising policy barriers and
solutions.
Table 2-7. Summary Matrix of Policy Solutions by Policy Category and Policy Focus
Policy
Category:
Policy Solution Class and Summary: Tec
hnolo
gy
Char
acte
rist
ics
Tec
hnolo
gy
Cost
s
Reg
ula
tio
n
Pri
cin
g
Ince
nti
ves
Fac
ilit
atio
n
Info
rmat
ion
Tar
get
s
Coord
inat
ion
Batteries
- Subsidised battery rental programs
- Incentives for battery second life programs
- Government sponsored battery warranty program
- Initiate and fund charging station and infrastructure
demonstration programs including battery swapping
Vehicles
- Credits for low carbon fuels
- Implement mandatory fuel economy standards
- Develop standards for EVs and charging equipment in high
priority areas
- Mandate the purchase of EVs in government fleets
- Develop mandatory low and zero emission vehicle
requirements
- Fleet purchase incentives including through fleet specific tax
exemptions
- New or increased environmental, fuel or congestions charges
or taxes
- Reduce or eliminate subsides for existing ICEV purchases,
especially in fleets with fringe benefit taxes
- Reduce or eliminate subsides for oil and petrol such as
credits for oil exploration
- Green registration discounts
- Ability to quantify and monetize lifetime of CO2 emission
allowances
- Access to High Occupancy Lanes and exemption from

KEY BARRIERS AND POSSIBLE POLICY SOLUTIONS
Barriers to and Policy Solutions for EV Adoption in Australia • March 2011 35
Policy
Category:
Policy Solution Class and Summary: Tec
hn
olo
gy
Ch
arac
teri
stic
s
Tec
hn
olo
gy
Cost
s
Reg
ula
tio
n
Pri
cin
g
Ince
nti
ves
Fac
ilit
atio
n
Info
rmat
ion
Tar
get
s
Co
ord
inat
ion
highway tolls or potential future congestion charges
- Access to free or prime parking spaces
- Special recognition of EVs
- A common metric for comparison between lifetime costs of
all vehicles including ICEVs, HEVs and EVs
- Firm national EV sales targets
- Development of Australian Standards for EV technology in
line with international coordination on standards
- Revision of ADRs to include new and converted EVs
- Expansion of vehicle categories
EV Supply Equipment and Other Infrastructure
- Streamline EVSE code and permit requirements
- Ensure building codes for new or renovated sites support
EVs by requiring dedicated electrical capacity and parking
spaces
- Subsidies/programs to upgrade local circuits in
homes/buildings to allow faster charging
- Coordinate vehicle purchase and home charging station
installation
- Regulation for charger to vehicle interoperability
Electricity Networks
- Streamlined network connection agreements
- Regulation to allow emergency load curtailment of EV
charging
- Require utilities to develop an EV infrastructure plan
- Time of use pricing
- Net-metering tariffs
- Default network support payments
- Electricity rebate program
- Funding to assist Utilities in planning/preparing for EV
introduction
- Connecting renewable energy targets to EV sales
- Requirements for separated EV electricity costs on utility
bills
- Require reporting of renewable energy used for vehicle
charging
- Green registration discounts

KEY BARRIERS AND POSSIBLE POLICY SOLUTIONS
Policy
Category:
Policy Solution Class and Summary: Tec
hn
olo
gy
Ch
arac
teri
stic
s
Tec
hn
olo
gy
Cost
s
Reg
ula
tio
n
Pri
cin
g
Ince
nti
ves
Fac
ilit
atio
n
Info
rmat
ion
Tar
get
s
Co
ord
inat
ion
- Use electricity rate base to lower cost of EV batteries
- Subsidies or programs to upgrade local circuits in homes or
buildings to allow faster charging
Impacts Across Multiple Areas
- Tax of fee reductions or exemptions or cash bonuses on EV
or charging station purchases
- Establish research partnerships between Australian centres of
excellence and counterparts in Asia
- Grants, loans or tax credits for R&D in battery, vehicle,
EVSE and grid integration technology
- Grants, loans or tax credits for EV, battery and charge station
manufacturers
- Low interest loans or grant funds for vehicle, battery or
related equipment purchase
- Creation of dedicated electric transportation government
agency to coordinate all EV related government activities
- Join international efforts and organisations
- Creation of low or zero-emission zones near city centres
- Provision of a central hub for EV information
- Grants or loans for energy hubs that include EVs
- Consumer education initiative
- Development of federal and state strategies and plans
- Funding of workforce training programs
- Joint infrastructure projects
- Reports and Case studies
- Require municipalities to plan and prepare for EVs
- Recognise electricity as an alternative road transport fuel
within existing programs

AUSTRALIAN INITIATIVES
Barriers to and Policy Solutions for EV Adoption in Australia • March 2011 37
3. AUSTRALIAN INITIATIVES
The adoption of EV policy has, until recently, been slow across all Australian jurisdictions in
comparison to overseas experience. Nonetheless, current initiatives now appear timely in the
wake of the first delivery of affordable, mass manufactured EVs in Australia (Mitsubishi
iMiEVs). Current Australian initiatives concerned with facilitating the adoption of EV
technology are largely focused on capacity building, that is, facilitation, information and
coordination. To date, Queensland and the Australian Capital Territory are the only jurisdictions
to provide incentives for the purchase of low emission vehicles. Whilst these are not directed
towards EVs or even PHEVs specifically, they have stimulated consumer preference for HEVs
and offer a policy response model that could be adapted to incentivise the adoption of EVs and
PHEVs.
The Federal Government has focused on stimulating R&D in the automotive sector (Green Car
Innovation Fund) and investment in broader strategies with positive implications for EV
technology, including the Solar Cities and Smart Grid, Smart City programs. Similar to air
conditioners, a national Demand Response standardisation is on the horizon for EV charging. A
2009 study of the Australian Standards in relation to EVs, recommended standard development
around five focus areas: vehicle design; power systems; recharging; rescue, repair and
recovery; and miscellaneous (GHG performance and use information) (Lazar and McKenzie,
2009). A more recent draft of the Standards Australia Workplan suggested the focus should be
on stipulating minimum requirements in relation to product safety, public safety and consumer
protection in order to minimise the risks of market development and public safety (Lazar and
McKenzie, 2010).
Victoria appears to be leading the charge with EV policy initiatives, having commissioned
Standards Australia to undertake a scoping study into developing Australian standards for EV
technology and infrastructure. The State Government has also committed $5m to a state-wide
passenger EV trial, is undertaking a hybrid-electric bus trial and has identified opportunities for
the integration of EV policy into existing policies including land use planning and R&D.
Queensland has similarly taken a progressive stance. The Queensland EV Roadmap gives
industry and the community a clear indication of the Queensland Government‘s position on EVs
and provides a tool to guide further policy responses.
Melbourne University have partnered with Better Place and Senergy Econnect Australia to
investigate: the effect of mass adoption of electric vehicles on the grid; the management of
electricity distribution by developing a smart grid; and meeting the challenge of transportation
over Australia‘s long distances by placement of charging stations.

AUSTRALIAN INITIATIVES
38 Barriers to and Policy Solutions for EV Adoption in Australia • March 2011
Appendix 6 provides more detail on each of the policy responses summarised in Table 3-1
below.
Table 3-1. Summary of Australian Initiatives.
Initiative Policy responses Jurisdiction
Australian Green Car
Innovation Fund
Facilitation Federal; Nation-wide
Smart Grid, Smart City Facilitation, Information,
Coordination
Federally sponsored; Sydney and
Hunter region trials
Solar Cities Facilitation, Information Federally sponsored; with seven
―solar cities‖.
Victoria EV initiatives Facilitation, Information,
Coordination
Victoria; (EV standards scoping
study for the national level)
Queensland EV Roadmap
and Green Taxis Scheme
Coordination, Incentives,
Regulation
Queensland
ACT Green Vehicles Duty
Scheme
Information, Incentives,
Regulation
ACT
UWA Australia Renewable
Energy Vehicle (REV) Trial
Facilitation, Coordination Perth; WA
Australian Standards for EVs Regulation Federal
CSIRO Electric Driveway Information Nation-wide
Melbourne Uni and Industry
Partnership – Study of
impact of mass-adoption of
EVs on the Australian Grid
Information Nation-wide
Government agency
GHG/HEV targets
Facilitation, Information Various Federal, State, and Local
Governments throughout
Australia

A SNAPSHOT OF INTERNATIONAL EV POLICIES AND INITIATIVES
Barriers to and Policy Solutions for EV Adoption in Australia • March 2011 39
4. A SNAPSHOT OF INTERNATIONAL EV POLICIES AND INITIATIVES
The sections below summarize the electric vehicle initiatives and current policies for several
countries and regions, including Canada, United States, Europe, Japan and China. The list of
policies presented is not exhaustive, but rather representative of the trends in each country. For
example, there have been hundreds of international studies and trials, both government and
private, that have taken place but could not exhaustively be covered in this report.
4.1 Canada
In Canada, HEV annual sales continue to grow both in numbers and as a proportion of the total
light-duty vehicle sales. In 2000, HEV sales represented only 0.03% of total light vehicle sales
in Canada; by 2007 this proportion had risen dramatically to 0.88%, e.g. from 426 cars sold in
2000 to 14,828 cars sold in 2007 (Chandra, et al., 2010). In terms of EV availability, two
models were available in 2000 (Honda Insight and Toyota Prius) and 13 were available in 2007
(Chandra et al., 2010).
Canada has safety and technical standards for EVs, as well as specific regulation for Low Speed
Vehicles, which are entirely electric and travel up to 40km/h.
Since 2009 Vancouver has required new multi-family developments to provide charging ports
in 20% of the parking stalls. The province now requires one- and two-family dwellings to have
plug-in vehicle charging capability.
Within Canada‘s Electric Vehicle Technology Roadmap the Government lays out their plan to
reach, by 2018 at least 500,000 highway-capable PHEVs.
The national ecoTechnology for Vehicles program conducts outreach activities across Canada.
This program also works with manufacturers to acquire and test new EV technology, as well as
address barriers to the introduction of these new technologies into Canada.
Five provinces offer sales tax rebates, with the largest rebate offered in Ontario ($8,500 CAD).
For more details, see Appendix 1. Summary of Canadian Policies.
4.2 United States
Sales of hybrids grew from less than 10,000 cars in 2000 to about 346,000 in 2007. It is
expected the market for plug-in hybrid and battery electric passenger cars and light duty trucks
will grow at a compound annual growth rate of 106% between 2010 and 2015, resulting in sales
of more than 3.24 million vehicles during that period (Pike Research, 2010). President Obama
has announced a goal of 1 million EVs on the road by 2015, while 8 states have their own
targets related to EVs.
The US has national technical standards for EVs. According to the National Conference of
State Legislatures (NCSL), 68 bills from 25 different States were introduced in 2009 that

A SNAPSHOT OF INTERNATIONAL EV POLICIES AND INITIATIVES
40 Barriers to and Policy Solutions for EV Adoption in Australia • March 2011
involved electric vehicles (12 have been enacted). The leadership shown in California has
paved the way for the US, in terms of EV policies and developments. In 1990, the introduction
by General Motors (GM) of its concept electric car, the Impact, inspired the California Air
Resources Board (CARB) to mandate that two percent of all new vehicles for sale in California
in 1998 and ten percent by 2003 be all-electrics. Policymakers chose a technology-forcing
approach, setting ambitious goals (e.g., zero emission vehicles), establishing strict deadlines and
issuing penalties for non-compliance. The policy process in California called for substantial
participation from the public, the media, the academic community and the interest groups
affected by the regulation (Calef and Goble, 2007).
In 2009, in the latest revision of its Zero Emission Vehicle (ZEV) standards, California
indirectly mandated the introduction of more than 50,000 PHEVs in the 2012-2014 timeframe
by implementing requirements for each manufacturer to produce a minimum percentage of zero
emission vehicles each year (e.g. 11% in 2010/2011) (EERE, 2010). To put this regulation into
perspective, California has about 20 percent of the U.S. automobile market. California Air
Resources Board (CARB) has directed its staff to begin developing new rules known as "ZEV
2.0" that will likely return the ZEV program to its original focus of pushing the envelope on
pure EV technology expansion. Ten other states have adopted California's ZEV rules.
To incentivise the production of EVs, national CO2 tailpipe (exhaust) standards have been
developed for cars and light trucks. Vehicles must emit less than 250g CO2/mi. PHEVs will be
counted as zero emission vehicles, even when operating on grid electricity (up to the first
200,000 vehicles produced by each manufacturer).
States are quickly developing regulations on where and how to install charging systems, as well
as requirements on when to use charging systems. An increasing majority of States have EV
coordination bodies, strategic partnerships, policy evaluation bodies, guidelines, resolutions or
roadmaps to support the widespread adoption of EVs.
In 2006, four States had EV purchasing requirements for government fleets. Currently, 29
States have Alternative Fuel Vehicle purchasing requirements.
In the US, electrified cars will be less expensive on a total-cost-of-ownership basis only if the
price of gasoline exceeds $4 a gallon and electric batteries can travel 40 miles before a recharge,
or if the government gives manufacturers incentives that subsidize the cost of production
(Hensley et al, 2009). To offset these costs, the federal government is providing tax credits up
to $7,500. Most of the State governments are providing tax incentives, grants, loans, rebates
and other ownership benefits to encourage wide-spread adoption of EVs.
A nation-wide training program has been developed to help fire-fighters and other first
responders prepare for the growing number of EVs on the road in the US. Other training and
education programs continue to grow for technicians and engineering students. For more
information, see Appendix 2. Summary of US Policies.
4.3 Europe
Most stakeholders within the EU assume a realistic market share for new, electrically
chargeable vehicles in the range of 3 to 10% by 2020 to 2025, or between 450,000 and
A SNAPSHOT OF INTERNATIONAL EV POLICIES AND INITIATIVES
Barriers to and Policy Solutions for EV Adoption in Australia • March 2011 41
1,500,000 units based on today‘s market, depending on how quickly some of the immediate
challenges can be addressed. The market share will increase progressively with every year that
passes (ACEA, 2010a). In 2009, the market share of cars emitting 120 gCO2/km had risen to
25%. Cars with emission above 160 gCO2/km accounted for 23% of the market, compared to
39% in 2006 and to 80% in 1995 (ACEA, 2010b).
More optimistically, the head of the Centre of Automotive Research at the University of
Applied Sciences in Gelsenkirchen, Germany, has forecasted: "By 2025, all passenger cars sold
in Europe will be electric or hybrid." Also optimistically, the Norwegian Finance Minister
announced a plan to ban the sales of petrol vehicles by 2015, however the plan has not been
implemented.
The European Union have set their 2012 exhaust emission goals for new vehicles at 130 grams
per kilometre. Beyond this, the European Union is proposing even tougher standards of 80
g/km by 2020 and 60 g/km by 2025. To achieve this, the majority of the European light duty
vehicle fleet will have to be almost entirely electrically (including hydrogen fuel cells) or
carbon-neutral biofuel-powered. The EU is proposing stringent fines for non-compliance, e.g.
fining carmakers €95 (US$120) per gram per model over the limit (EV World, 2010).
Many European countries are announcing their own targets for the number of EVs on the road.
For example, France committed $2.2 billion to put 2 million electric cars on the road by 2020.
Several European countries have also developed relationships with car-makers to develop new
plants, invest in charging networks and conduct wide-scale pilot projects.
As a member of the UN Economic Commission for Europe, most European countries will have
international safety standards for EVs imposed on them by 2010.
The incentives in Europe to purchase an EV are widespread. National and regional
governments of 15 EU member states have introduced incentives, including tax reductions and
exemptions, bonus payments and discounts.
Importantly, the European Commission published their strategy for clean and energy efficient
vehicles in April 2010.
Environmental groups in the EU are calling for all electric cars sold on the EU market to be
equipped with small metering technology that allows vehicles to be charged only when surplus
electricity is available on the power grid, which requires technology standardization,
enforcement through EU legislation and for member states to raise their renewable energy
targets, and policies to ensure that the additional electricity production for these vehicles is zero
emission (Kampman et al., 2010).
For more information, see Appendix 3. Summary of European Policies.
4.4 Japan
In 2001, over 50,000 HEVs were in use in Japan, and several new models of HEVs were being
introduced onto the market, e.g. the Toyota Estima, the Crown, and the second generation of the

A SNAPSHOT OF INTERNATIONAL EV POLICIES AND INITIATIVES
42 Barriers to and Policy Solutions for EV Adoption in Australia • March 2011
Toyota Prius. HEVs are now established as a commercial option to ICEVs in Japan (Ahman,
2004). Despite the success of the Prius and the Insight, HEVs only accounted for 1% of the
newly registered passenger cars in Japan in 2004 (Ahman, 2004). To date, Toyota has sold over
one million Prius hybrids in Japan, and in 2009, the Prius was the best-selling vehicle in Japan
(McGlaun, 2010).
Toyota is also currently testing smart-grid technology capabilities in conjunction with EVs in
Rokkasho, northern Japan. The new smart-grid technology is called the Toyota Smart Centre
and it allows the user of a Toyota plug-in hybrid to access information about their use of energy
in their home and by the hybrid from a mobile phone or a TV in the home. The Smart Centre
provides information on the amount of power consumed by the home, how much a hybrid
vehicle has charged, and how much power has been stored at the home. The Smart Centre will
then calculate the most efficient way to use the energy that is available to save power and
reduce pollution. It will be able to turn things off that are charging and use power when rates are
the lowest. Toyota believes that the Smart Centre could help reduce the power used in a home
by 75% (Kageyama, 2010).
The Japanese Government was early in identifying technical innovation as a way to mitigate the
environmental and energy problems associated with transport. In 1971, the government
identified electric vehicles as a long-term target for vehicle development and began to guide the
long-term development of vehicles (Ahman, 2004).
Ahman (2004) details the whole of government support in Japan, since the 1970s. He describes
the main role of government as a conductor in the development process supplying both R&D
support and artificially created niche markets, and easing the way for targeted technologies by
means of legislation and standards. He found that the recent market success of the HEV can
partly be attributed to the government support of the BEV technology.
Japan maintains their commitment to develop the EV market. The Ministry of Economy, Trade
and Industry (METI) issued a goal for EVs to account for 50% of new car sales by 2020. To
facilitate this, the government is spending US$135 million in 2010 to build country-wide
charging stations (Loveday, 2010a).
In mid-2010, Japan‘s METI began financing a three-month trial of a battery-swapping scheme
for EVs in partnership with Better Place and EV taxis in Tokyo, in 2010, the world‘s first
battery replacement station for EVs (O‘Connor, 2010). The project includes the recharging and
rapid battery replacement stations developed by Better Place (Ben-Gedalyahu, 2010).
Within Japan, the Electric Vehicle Association publishes the standards specific to EVs.
For more details, see Appendix 4. Summary of Japanese Policies.
4.5 China
Pike Research's EV market assessment report (2009) predicts that China will be the world
leader in charging stations, selling nearly half of the global total of 1.5 million units expected to
be sold in 2015.

A SNAPSHOT OF INTERNATIONAL EV POLICIES AND INITIATIVES
Barriers to and Policy Solutions for EV Adoption in Australia • March 2011 43
The Chinese government intends to be the largest global manufacturer of EVs and had a goal of
producing half a million EVs by 2011. Industry experts now predict that when China reaches
this goal, other countries will follow the EV trend.
China reveleaed a category based standard as decribed by the US Commercial Service (2009):
China’s MIIT unveiled new standards, which divides current alternative energy techs
into three categories: Start-Up, Developing, and Mature. Only “mature” technologies
will be permitted mass production, although “developing” technologies will be allowed
limited sales. Currently, only hybrid & electric vehicles with NiMH or lead-acid
batteries are classified as using mature technology. Government authorities are
pushing for use of only NiMH in the next three years, which will then be replaced by
lithium and/or fuel cells.
The country is well on its way to achieving these goals. For example, the new energy vehicles
and auto parts base in Jiading plans to have a production capacity of 10,000 new energy
vehicles by 2010; 100,000 units by 2012; and 300,000 units by 2015 (US Commercial Service,
2009). Revised sales forecast 700,000 vehicle sales in 2010 due to increased government
support.
One of the key barriers identified by China and the US to rapid EV development is the lack of
international standards for EV products and testing. Therefore, China has launched a joint US-
China Electric Vehicles Initiative to co-develop standards and testing procedures.
For more information please see Appendix 5. Summary of Chinese Policies.
The following example of wide-spread adoption of EVs is about two wheeled vehicles, but there
are lessons to be learned for EV market support in the policies employed China.
The Effect of Bans: China witnessed the world's most spectacular growth in electric vehicles
since 1998. China's annual sales of electric two-wheeled vehicles (bikes and scooters) grew
exponentially from fifty six thousand vehicles in 1998 to over twenty one million in 2008
(Yang, 2010). Before the late 1990s, there were sporadic attempts to commercialize electric
bikes and scooters. Those attempts all failed. The electric bike market in China never took off
until the late 1990s, facilitated by favourable local regulatory practices in the form of
motorcycle bans and loose enforcement of electric bike standards (Weinert, et al 2007, Weinert
et al 2009 in Yang, 2010). According to the motorcycle committee of the Society of
Automotive Engineers of China, the use of motorcycles is now banned or restricted in over
ninety major Chinese cities (Yang, 2010). The Taiwan Environmental Protection
Administration (TEPA) started to promote and subsidize electric scooters in 1998. It spent tens
of millions dollars (NT$ 1.8 billion) subsidizing electric scooters but without any restrictions on
the use of petrol-fueled scooters. The subsidies included tax reductions for electric scooter
manufacturers, subsidies for research and development, promotional activities, charging
facilities, and rebates for consumers amounting to nearly half of the scooters' retail prices. With
all of these subsidies, the cost of electric scooters was comparable to their petrol counterparts.
Nevertheless, sales of electric scooters remained very low. The TEPA administrator eventually
acknowledged this policy failure in 2002. Taiwan has so far been unsuccessful in establishing a
sustained demand for electric scooters (Tang, 2004 in Yang, 2010). Excerpt from Yang, 2010.


SUMMARY OF INTERNATIONAL POLICIES
Barriers to and Policy Solutions for EV Adoption in Australia • March 2011 45
5. SUMMARY OF INTERNATIONAL POLICIES
The sections below summarise the international EV policies and initiatives according to the type
of policy.
5.1 Regulation
Regulation categories emerging from our research for EVs can be broadly described as those
pertaining to:
Technical and safety (batteries, charging system design, installation and connection)
Emissions and fuel
EV acquisition
Manufacturers
Charging systems
EV specifics.
All of the countries investigated above have national standards, or are developing national
standards for EVs and have some form of EV regulation. It is important to reiterate that the list
below is not exhaustive, but rather representative of our findings and data reported in the
Appendices.
Table 5-1. Summary of International Regulation
AUS CAN US EU JP CHN
REGULATION
NATIONAL STANDARDS X X X X X
National Technical Standards x x x x x
National Safety Standards x x
REGULATION X X X X X
Emissions and fuel
Reductions in Exhaust Emissions x x x
Reduced Fuel Consumption in Federal Fleets x
Increased Alternative Fuel Consumption in Federal Fleets x
Reduction of Carbon Intensity of Transport Fuels x
Alternate fuels for Transport Corporations x
EV Acquisition
Acquisition of EVs in State and Federal Fleets x x
EV Acquisition for Taxi Fleets x
Authority to require EVs in fleet procurement contracts x
Manufacturers
Manufacturer Production Requirements for ZEVs x
Which Enterprises can Manufacture an EV x
Obtaining Product Permission to Produce EVs x
Regulation for Low Speed EVs x
Charging Systems
Where to Install Charging Systems x

SUMMARY OF INTERNATIONAL POLICIES
46 Barriers to and Policy Solutions for EV Adoption in Australia • March 2011
AUS CAN US EU JP CHN
When to Use Charging Systems x
Charging Infrastructure in Residential Developments x
EV Specifics
Registration and insurance of EVs x
No and Protection of EV Parking Spaces x
Outcomes of Regulatory Policy
California‘s Zero Emissions Vehicle (ZEV) mandate resulted in:
Heavy investment in BEV technology by manufacturers, as seen by Toyota, Nissan and
Honda (Mauro, 2000; Patchell, 1999 in Ahman, 2004).
Greater than 5,500 electric vehicles onto California's roads.
Spurring the development of innovative hybrid and fuel cell vehicles (Calef and Goble,
2007).
California‘s Low Carbon Fuel Standard is expected to:
Achieve a growth of 4.1 million EVs (Bailey and Morris, 2009).
China‘s ban on motorbikes resulted in:
Exponential growth in 2-wheeled electric vehicles from fifty six thousand vehicles in
1998 to over twenty one million in 2008 (Yang, 2010).
5.2 Pricing
Pricing policies mainly consisted of electricity tariffs approved by State agencies that are
specifically for EV charging. Another important aspect of pricing policies are taxes used to
equalize the costs of EVs versus ICEVs and/or taxes used to place a value on the environmental
footprint caused by ICEVs.
Table 5-2. Summary of International Pricing Policies
AUS CAN US EU JP CHN
PRICING
EV ELECTRICITY TARIFFS, (e.g.):
Net-metering
Rebates to stations providing off-peak EV charging
Time of use
Flat monthly fee
X
TAXES, (e.g.):
Fuel TaxCO2 Tax
Congestion Tax
Car Consumption Tax
X X X
COST ALLOCATION of incremental costs across all fleets X

SUMMARY OF INTERNATIONAL POLICIES
Barriers to and Policy Solutions for EV Adoption in Australia • March 2011 47
Outcome of Pricing Policies
One could argue that in order to promote electric vehicle use, governments should ―buy-down‖
the PHEV technology by offering incentives. Richard Duke proposed several criteria for
technologies that are appropriate for a buy-down strategy (Duke, 2002 in Yang, 2010). The
criteria include:
1. Competitive market structure
2. Strong experience curve with a low floor price
3. Low current sales but strong market acceleration with subsidies
4. Low market risk from substitutes, and
5. Public benefits.
According to Yang (2010), three issues arise from these criteria. Due to the lack of empirical
data, the experience curve for PHEV batteries is virtually unknown. The Taiwanese experience
in electric scooters suggests that subsidies may not be effective in accelerating market
penetration (referenced in Section 4.5). Also, there is a high risk from substitutes (i.e.
conventional vehicles and regular hybrid vehicles). These features suggest that a government
subsidized buy-down strategy may be an unreliable approach for launching PHEVs and EVs.
The technological buy-down for EVs and PHEVs could require a significant budget and long
time span. Therefore, there is a risk that the political support for the subsidy may wear off
before the electric vehicle technology can prevail (Yang, 2010).
Limiting the fossil-fuelled alternatives may be a more effective launching strategy for electric
vehicles. The reverse subsidy approach offers the advantage of not draining the government
budget and therefore may be more financially sustainable than a direct buy-down approach.
Whether governments will adopt restrictive policies on conventional fossil-fuelled vehicles may
a crucial determinant in the future of electric vehicles. Restrictive policies on conventional
fossil-fuelled vehicles deserve more serious consideration if policymakers wish to create stable
demand for clean vehicles. Subsidies resulting in comparable price and superior environmental
performance may be insufficient to make electric vehicles a commercial success, while limiting
the fossil-fuelled alternatives could be highly effective in forcing the market penetration of
electric vehicles (Yang, 2010).
Research suggests that ‗‗feebate‘‘ programs, where consumers pay a fuel-economy based fee at
the time of purchase may be more effective at encouraging the purchase of high fuel-economy
vehicles than fuel-economy based registration or emissions testing fees. Moreover, unlike a
sales tax waiver, a feebate could be designed to be revenue neutral (Gallagher and Muehlegger,
2010).
Since London introduced its stringent congestion fees, alternative cars that are exempted from
the charges are booming (Grunweg, 2008 in Yang, 2010). According to John Mason, head of
enforcement at Transport for London's Congestion Charge, the number of electric cars in
London increased from 90 in February 2003 to over 1600 in June 2008. Other eco-friendly cars,
such as hybrids, also rose from 1000 vehicles in 2003 to more than 20,000 in 2008.

SUMMARY OF INTERNATIONAL POLICIES
48 Barriers to and Policy Solutions for EV Adoption in Australia • March 2011
5.3 Incentives
A wide variety and large number of incentives were available in the countries researched. The
emerging categories, as summarised in Table 5-3, include incentives to:
Purchase and own an EV and infrastructure
Convert an EV
Install infrastructure
Develop EV and component
Manufacture EV and battery.
Table 5-3. Summary of International Incentives to Purchase an EV and EV Infrastructure
AUS CAN US EU JP CHN
INCENTIVES
Federal Tax Incentives for Consumers (e.g.):
Income tax credit for EV and infrastructure purchase
Fuel consumption tax reduction
Exemption from monthly vehicle tax
Road tax reduction or exemption
Registration tax reduction or exemption
Reduction or exemption from company car tax
Reduction or exemption from special pollution tax
X X X X X
Federal Funding for Cities and States (e.g.):
City purchases of EV and infrastructure
Department of Transport purchase of EV and infrastructure
Parks and Public Lands purchase of EV and infrastructure
Bonus for cars emitting zero or little carbon emissions
X X X X
State/Local Tax Incentives for Consumers (e.g.):
Income tax credit
Sales tax reduction or exemption
Excise tax exemption
Vehicle license tax reduction
Congestion tax exemption
X X X X
State Funds for Consumers & Governments (e.g.):
Rebates, Vouchers and Bonuses
Funds (grants and low interest loans)
X X
State Funds for Fleets and Transit Providers X
Local Funds for Fleets, Government and/or Consumers X X X

SUMMARY OF INTERNATIONAL POLICIES
Barriers to and Policy Solutions for EV Adoption in Australia • March 2011 49
More incentives are summarized in the following table, specifically, owner incentives that are
less focused on direct financial benefit as well as incentives to develop and manufactur EVs.
Table 5-4. Summary of International Incentives to Own, Develop and Manufacture EVs
INCENTIVES
Owner Benefits Benefits for Consumers
Access to High Occupancy Vehicle (HOV) lanes
Dedicated Green Lanes for EVs
Vehicle Emission Test Exemptions
Insurance for loan payments
Access to prime parking spots
Exemptions from time-of-day and day-of week restrictions
Parking fee reduction or exemption
Credits against ground transport fees
Free battery charging
Benefits for Transit Providers
Extension of taxicab registration for those with EVs
Development Low interest loans
Payroll income tax credit
Investment tax credits
High-tech growth tax credits
Property tax exemptions
Approval for tax increment financing
Manufacturing Funds and tax incentives to encourage:
To transform factories to produce EVs
To develop EVs
To sell EVs
Outcomes of Incentive Policies
State incentives, as well as average income and social preference have been found to be
significant in explaining state market shares of EVs in the US (Diamond, 2008a). More
specifically, a one-standard deviation increase in per-capita income is associated with a 32%
increase in hybrid sales (Gallagher and Muehlegger, 2010).
The positive relationship between income and hybrid adoption suggests that financial incentives
may disproportionately benefit higher income consumers who are more likely to purchase
hybrids in the first place. Lower income consumers are less able to afford the higher up-front
premium for a hybrid. Given the apparent weak or negligible effect of monetary incentives, this
could mean current monetary incentives for hybrids may be rewarding those who need the
incentive the least for a purchase they were likely to have made anyway (Diamond, 2008a).
The results of analyses on impacts of government incentives for hybrid-electric vehicles in the
US suggest a strong relationship between petrol prices and hybrid adoption, but a much weaker

SUMMARY OF INTERNATIONAL POLICIES
50 Barriers to and Policy Solutions for EV Adoption in Australia • March 2011
relationship between incentive policies and hybrid adoption. Beresteanu and Li (2008)
concluded that hybrid vehicle sales in 2006 would have been 37 percent lower had petrol prices
stayed at the 1999 levels, whereas federal income tax deductions explained less than 5 percent
of hybrid vehicle sales from 2001 to 2005. They did find that the more generous income tax
credits in 2006 accounted for about 20 percent of hybrid vehicles sales.
For high fuel-economy hybrids, a 10% increase in petrol price has led to an 8.6% increase in
per-capita sales of high fuel-economy hybrid vehicles; additionally, a $100 increase in annual
fuel savings relative to comparable non-hybrid vehicles is associated with a 13% increase in
sales (Gallagher and Muehlegger, 2010).
Regardless of the type of incentive, the disproportionate influence of fuel prices on market share
suggests that market-driven spikes in petrol prices are likely to crowd out any modest effects
from incentives or petrol taxes at current US levels (Diamond, 2008a).
A study in Canada also found that tax incentives may not be the most effective way to
encourage people to switch away from fuel inefficient vehicles, at least in the short or medium
run (Chandra et al., 2010). Specifically, the study found:
26% of the electric vehicles sold during the rebate programs can be attributed to the
rebate
The rebate programs subsidized many consumers who would have bought electric
vehicles in any case
The average cost of reducing carbon emissions from these programs is estimated to be
$195 per tonne
CAD$1000 increase in the sales tax rebate increases the market share of hybrid cars by
31–38%.
If the decision is made to offer incentives, providing incentives to consumers up-front might be
the most efficient use of government funds (Diamond, 2008a). Up-front excise or sales tax
waivers are more effective than delayed rebates or tax credits in influencing adoption
(Diamond, 2008a). A comparison of the current income tax credit program with a rebate
program found that the rebate program needs less government revenue to achieve the same level
of average fuel-efficiency of new vehicles (Beresteanu and Li, 2008).
Similarly, Gallagher and Muehlegger (2010) found that the form of incentives is as important a
factor in consumption adoption as incentive generosity. Specifically:
Sales tax waiver of mean value is associated with over three times the effect of an
income tax credit of mean value
Conditional on the value of the incentive, sales tax waivers have more than a ten-fold
greater impact on hybrid vehicle sales that income tax credits
Sales tax waiver equal to 1% of the retail price is associated with an 8.3% increase in
sales—a comparable income tax credit is associated with a 0.6% increase in retail sales.
In Virginia, HOV lane incentives, along with income and environmentalism, were significant
predictors of market share, but that the HOV lane effect was highly dependent on local

SUMMARY OF INTERNATIONAL POLICIES
Barriers to and Policy Solutions for EV Adoption in Australia • March 2011 51
conditions (Diamond, 2008b). Analysis by Gallagher and Muehlegger (2010) concur. They
found the effects of HOV access vary significantly by state; there is little evidence that single-
occupancy access to car pool lanes is correlated with adoption and only the State of Virginia
had a positive and significant coefficient, e.g. a 92% increase in sales as a result of unrestricted
access (most likely due to the extensive use to travel to and from Washington DC).
Many of the small incentives have been found to be of insufficient magnitude or generosity to
affect state-level sales, including (Gallagher and Muehlegger, 2010):
Exemptions from vehicle emissions tests
Parkingfee reductions or exemptions
Exemptions from registration fees, excise taxes and annual license fees.
In terms of incentives for manufacturers, Michigan's aggressive effort to develop a home-grown
advanced-battery industry via property tax exemptions resulted in four companies announcing
plans to invest more than $1.7 billion in advanced-battery manufacturing facilities in Michigan.
The projects created 6,683 new jobs in Michigan and were awarded state refundable tax credits
that helped the companies in their quest for some of the $2 billion in federal grants for
advanced-battery research and development.
Another conclusion is that market support, even in the early phases of development, is an
important complement to R&D for gaining experience and building markets (Ahman, 2004).
5.4 Facilitation
Each of the countries also had many similar facilitation policies in place.
Table 5-5. Summary of International Facilitation Policies
FACILITATION
Partnerships Partnership with manufacturers for testing and development
Bringing industry and stakeholders together
Funding Funding for technology development
Support for academic research
Hardware Wide-spread infrastructure commissioned by the government
Investigations into bulk purchasing for State agencies
Resolutions State resolutions for federal action
State resolutions for manufacturer production of EVs
Outcomes of Facilitation Policy
The influence of the Memorandum of Agreement between the vehicle manufacturers and the
Californian state, in regards to EVs that the government would purchase led to:
Rise in production of BEVs in 1998 and 1999 to approximately 500–550 units/year.
However, production fell directly after the agreement was fulfilled (Ahman, 2004).

SUMMARY OF INTERNATIONAL POLICIES
52 Barriers to and Policy Solutions for EV Adoption in Australia • March 2011
A lithium battery project, support by the Japanese government resulted in:
The development of a Li-ion battery by Shin-Kobe Electric machinery and currently
used in the Nissan Hypermini (Terada et al., 2001 in Ahman, 2004).
Since China‘s technology development pilot projects were initiated, significant progress had
been achieved between 2001 – 2005, including:
26 national standards were established,
796 patents in and out of China (including 413 invention patents) were granted (Zhang
et al, 2009).
During the Beijing Olympics, four auto manufacturers joined with three institutes to provide
their independently developed lithium-ion battery bus, 25 hybrid buses, 77 hybrid sedans, 20
fuel battery sedans, 3 fuel battery city buses, 415 electric terrain and application vehicles. All of
the 598 new energy vehicles formed the largest energy conservation and new energy vehicle
demonstration and application team in the history of Olympics, and realized zero emission of
automotive greenhouse gases in the central transportation zone of Beijing Olympics Park
(Zhang et al, 2009).
5.5 Information
All of the countries researched had an Electric Vehicle Association that acts as an important
information source. Other established and utilized sources of information available
internationally are summarised below.
Table 5-6. Summary of International Information Sources
INFORMATION
Information Resources Government and association websites and newsletters
Information sharing networks
Guidance on EV infrastructure
Tools Decision-making tools for fleet managers
Installation guides for EV charging stations
Training For fire-fighters and first responders
For mechanics
For engineering students
For fleet managers
Regulation Labelling requirements for EVs and charging stations
Requiring dealers to provide EV info
GHG reporting requirements for vehicle manufacturers

SUMMARY OF INTERNATIONAL POLICIES
Barriers to and Policy Solutions for EV Adoption in Australia • March 2011 53
INFORMATION
Reports Funding for studies and studies completed, e.g.:
Public opinion trials and research
EV impacts on roadway funding
EV impacts on CO2 emissions
Costs for charging infrastructure
Monitoring transport fuel trends
State-specific barriers to widespread EV adoption
Studies verifying the impacts of these information policies were not investigated.
5.6 Targets
All of the countries reviewed have some form of national EV target, as well as several regional
and local targets, which strive for:
Specific numbers or percentages of vehicles manufactured or sold or purchased by
government
Replacement or reductions in fossil fuels
Specific numbers or percentages of EV parking spaces or charging stations.
Table 5-7. Summary of International Targets
AUS CAN US EU JP CHN
TARGETS
National Targets X X X X X
No. of EVs on the
road
500,000
by 2018
1,000,000 by 2015 1,000,000
by 2014
(Spain);
2,000,000
by 2020
(France);
% of EVs on the
road
10% by
2020
(Ireland)
100% of
gov‘t
vehicles by
2004
Production of EVs 1,000,00
0 by
2011
No of EVs sold 5,000,000 by
2020
% of EVs as new
car sales
50% by 2010
State and City Targets
No or % of EVs on
the road
5% by
2020
(Ontario
1,000,000
by 2015
(London)
% Reduction in
gasoline, petroleum,
and diesel fuel
20% reduction by 2012,
from 2008 levels (IL);
50% reduction by 2015
(MN);

SUMMARY OF INTERNATIONAL POLICIES
54 Barriers to and Policy Solutions for EV Adoption in Australia • March 2011
AUS CAN US EU JP CHN
replace 900 million
gallons by 2020 (PA);
% of EVs purchased
and owned by state
agencies
50% HEVs and 15%
BEVs by 2025 (IL);
100% by 2010 (NY);
100% by 2015 (WA);
% of parking spaces
to be EV ready
10% of parking spaces will
be ready for EV charging by
2018 (WA)
No. of charging
stations
100,000 charging stations by
2012 (HI)
25,000 by
2015
(London)
Japan had an ambitious goal to replace 100% of all government vehicles by 2004. This first
program did not meet targets because of the more turbulent economy during the 1990s made the
more expensive vehicles unaffordable for government agencies (Ahman, 2004).
Spain, United States, China and London are all racing towards the goal of 1 million EVs on the
road. France has set their sights set to reach 2 million,EVs by 2020.
5.7 Coordination
Coordination policies have been developed at all levels within these countries, from
international initiatives to local resolutions.
Table 5-8. Summary of International Coordination
AUS CAN US EU JP CHN
COORDINATION X X X X X
International Coordination on
Standards
x x
Coordination Bodies and Partnerships 7 X X
Roadmaps and joint policy evaluation Queensland National 5 EU National
Guidelines, definitions and resolutions 3 X X

SUGGESTED POLICIES FOR AUSTRALIA
Barriers to and Policy Solutions for EV Adoption in Australia • March 2011 55
6. SUGGESTED POLICIES FOR AUSTRALIA
6.1 Introduction
As described in Section 1.2, several filters and processes have been used to determine a list of
potentially effective and appropriate policies for Australia, including:
1. Researcher review of policies against policy criteria
2. Survey among Electric Driveway stakeholders
3. Prioritisation at an Electric Driveway workshop
4. Final researcher review
Firstly, to narrow down the 50+ policy options presented in Section 2, four ISF researchers
independently applied key questions and considerations (listed below) to select 20 policy
options that would be appropriate for Electric Driveway stakeholders to review in a survey (any
more than 20 would have been ineffective for the survey process). The key questions developed
to select these 20 policy options included:
Do the policies fall within government‘s mandate?
Do the policies allow for the key features of technical change, including uncertainty,
learning, path dependence and accumulation of knowledge?
Do the suite of policies provide for progress in all, or the majority of, technology
development phases?
Other key considerations of the policy options included:
Effectiveness at increasing adoption
Cost to both government and industry
Difficulty of implementation
Urgency (e.g. when should these policies be implemented)
Additional policy benefits and implications
The four independent analyses resulted in nearly 75% concurrence over the list of 20 policy
options. The remaining policy options were selected through discussions in order to address
any policies that over-lapped and to fill any gaps. The top 20 policy instruments that were
selected by ISF based on these questions and considerations are presented in Table 6-1. It is
neither feasible nor appropriate at this stage to investigate each of these 20 options within the
scope of this report. Therefore, to further refine our list of policy options to investigate, ISF
developed and circulated a survey among stakeholders.
Based on the survey results, the policy options were narrowed down to 13 options (Note: the 13
italicised policy options in Table 6-1 are the priority options selected via the survey). ISF then
held an EV policy workshop with stakeholders, where the 13 policy options were discussed.
Based on the workshop discussions, ISF selected five policy options to research in more detail

SUGGESTED POLICIES FOR AUSTRALIA
56 Barriers to and Policy Solutions for EV Adoption in Australia • March 2011
(Note: the five bolded and italicised policies in Table 6-1 are those that ISF has researched in
more detail). These five policy instruments are discussed in more detail in this section, with a
summary of their unique considerations and how each policy could be structured.
Table 6-1. Priority policy options
Technology Policies
Tech 1. Establish Australian centres of excellence through the provision of grants or loans for
research, development and deployment of lower cost, longer lifetime batteries and
vehicles and connect these centres with international equivalents
Tech 4. Initiate, encourage and fund charging station and infrastructure demonstration
programs including battery swapping
Regulation Policies
R2 Creation of streamlined network connection agreements for electric vehicle supply
equipment
R3/R4 Implement mandatory fuel economy standards and/or low and zero emission vehicle
requirements
R5 Ensure building codes for new or renovated sites (residential, commercial, industrial)
support EVs by requiring dedicated electrical capacity and parking spaces
Pricing Reform
P2 Time of use electricity pricing
P4 New or increased environmental, fuel or congestion charges or taxes on ICEVs
P5 Reduce or eliminate subsides for existing ICEV purchases, e.g. in fleets with fringe
benefit taxes
Incentives / Enticement
E11 Access to free or prime parking spaces
E15 Grants/loans or tax credits for manufacturers
E17/R17 Funding and/or requirements for utilities in planning and preparing for EV
introduction
E1/P9 Tax reductions or exemptions for EV and charging station purchases and implement a
fuel-economy based fee at the time of purchasing a car including specific programs for
fleets
Facilitation
F1 Mandated purchase of and an increasing percentage of EVs in government fleets
and/or Memorandum of Agreement between government and manufacturers (e.g.
California‘s successful MOA)
F4 Funding of workforce training programs
F5 Connecting renewable energy targets to EV sales

SUGGESTED POLICIES FOR AUSTRALIA
Barriers to and Policy Solutions for EV Adoption in Australia • March 2011 57
Information
I1 Provision of a central hub for EV information
I6 Common metric for lifetime cost comparison of ICEVs, HEVs and EVs
Targets
T1 Firm national EV sales targets
Coordination
C1 Creation of a dedicated EV government agency that would coordinate all government
efforts with regards to EVs
C7 Coordination federal and State EV strategies
Note: Options prioritised via survey: Tech 1, R3/R4, R5, P2, P5, E11, E1/P9, F1, F5, I1, I6, T1, C7.
Note: Options selected by ISF after workshop: R5, P2, F5, I6, C7.
6.2 Policy Selection
As mentioned above, ISF narrowed down the list of 50+ policy options presented in Section 2 to
20 options. ISF further refined the list of appropriate policy options via a survey circulated
among stakeholders. Stakeholders were also sent a copy of this report, as a draft, in order to
provide background and contextual information about these policy options4. The survey asked
each respondent to rank the 20 policy options above from Very Important (1) to Not Important
(5). The survey then asked each respondent to select their top 5 options from the list of 20
above and order them from 1 (Most Important) to 5 (5th Most Important). The results are
presented in the table below.
4 Note: the process to narrow the policy options from 50+ to 5 was not designed to be
exhaustive, but rather representative. One vulnerability of this policy screening methodology
includes prioritisation potentially based on imperfect knowledge. Circulating the draft report
with the survey and before the workshop to stakeholders helped to address this vulnerability.
Another potential vulnerability is that the initial reduction from 50+ to 20 policy options may
have excluded policy options that would have been preferred by stakeholders. However,
stakeholders were encouraged to provide their alternatives during the survey process, to be
incorporated into the workshop.

SUGGESTED POLICIES FOR AUSTRALIA
58 Barriers to and Policy Solutions for EV Adoption in Australia • March 2011
Table 6-2. Survey Results: Scoring for each policy option5
Rank for Most Important
Policy Short description 1st 2nd 3rd 4th 5th Total Scoring6
T4 Fund charging stations 3 15
R3/4 Fuel and emission standards 1 1 1 1 12
R5 Building codes 1 1 1 10
C7 Government strategies 2 10
R2 Network connections 2 8
I6 Common metric 1 1 7
F1 Mandated government purchase 1 1 1 7
F5 Connect RE targets and EV sales 2 1 7
P2 Time of Use (ToU) pricing 1 1 5
T1 Centres of excellence 1 4
P4 Fuel or environmental charges 1 4
P5 Reduce subsidies for ICEVs 2 4
E1/P9 Incentives for EVs/Fee-bates 1 3
I1 Central hub of EV info 1 1
F4 Funding of workforce training 1 1
E11 Access to free or prime parking 1 1
T1 Firm EV sales targets 0
The survey respondents were then asked to classify the five policy options in relation to the
following comparative attributes (these questions were also revisited at the workshop and
therefore the results have not been provided):
5 Several respondents replied to the survey on the day of the workshop or several days after.
These survey results presented in Table 6-2were compiled after the workshop, therefore, the
results do not reflect the survey results compiled the day before the workshop. The main
differences are: the post-workshop survey data analysis showed T4 (Funding charging stations),
R2 (Streamlining network connections) and P4 (Fuel or environmental charges) as being within
the top 12 policy options, but they were not discussed at the workshop (as the pre-workshop
survey analysis did not rank these policies in the top 12). Additionally, E11 (Access to free or
prime parking) and I1 (central hub of EV info) were ranked in the top 12 in the pre-workshop
survey, but were not ranked in the top 12 in the post-workshop survey analysis. 6 To calculate the total scoring for each policy option, a weighted score was used. Each rank
was worth the following points: most important (5pts), 2nd
most important (4pts), 3rd
most
important (3pts), 4nd
most important (2pts), 5th most important (1pt).

SUGGESTED POLICIES FOR AUSTRALIA
Barriers to and Policy Solutions for EV Adoption in Australia • March 2011 59
How effective would these options be at increasing adoption of EVs in Australia? (pre-
requisite for mass adoption, very effective, quite effective, moderately effective)
How much would the options cost government to implement? (Very expensive,
expensive, moderately expensive, not expensive)
How much would the options cost industry to implement? (Very expensive, expensive,
moderately expensive, not expensive)
What level of public support would you expect these measures to have? (Very
challenging, moderately challenging, somewhat challenging, easy)
How urgent is it for these reforms or options to be implemented (i.e. when should they
be implemented)? (Right away, in the next 1-2 years, within 3-5 years, sometime in the
next 10 years)
How important are the additional benefits of the options not related directly to EV
adoption (e.g. benefits related to air quality, greenhouse gases, job creation or economic
stimulus)? (Very important, important, somewhat important, not important).
Respondents were also asked if they had any specific concerns regarding their top 5 options, if
there were any other important policy options that were not in the list of 20 and if there were
any topics or considerations with regards to process that they would like to have incorporated
into the workshop (responses are presented below with workshop discussion points).
The top 12 policy options from the survey (italicised in Table 6-1) were selected to discuss in
greater detail at a stakeholder workshop. ISF also added T1 Firm national EV sales targets to
the list of policy options because of the role Targets have in creating a national vision for new
technology and in order to have representation from each area of the Policy Palette at the
workshop.
The workshop process included:
1. Presentation and discussion on barriers to widespread EV adoptions
2. Presentation and discussion on policies to support widespread EV adoption
3. Group ranking of activity of 13 policy options based on: Cost to government verses cost
to industry; Efficiency verses industry; and Public support.
The following points around barriers to EVs were mentioned at the workshop (and in the
survey). Note: the discussion points listed below are not representative of any specific
stakeholder, nor are the discussion points an exhaustive summary of EV barriers from the
perspective of all stakeholders:
Questions around whether the motor vehicle industry has the capacity and skills to
facilitate EV manufacturing
Lack of incentives for companies to position themselves in this new market
Disincentives exist for one manufacturer in particular to sell EVs, until existing
previous models of cars have sold.
Policy options to address negative influences, such as those lobbying against the EV
industry

SUGGESTED POLICIES FOR AUSTRALIA
60 Barriers to and Policy Solutions for EV Adoption in Australia • March 2011
Costs associated for EV manufacturers and service provides to be first adopters is a big
barrier. Companies will wait until the next generation of technology, as they perceive
this to be safer
How can we partner EV measures with carbon measures? E.g. what types of barriers to
EVs would exist in Australia, where a carbon price also exists? How could EV
purchasing and renewable energy charging be linked to avoid any potential, although
unlikely, increase in carbon emissions in Victoria, because of the higher carbon
intensity of electricity? What are the business models to achieve this outcome? The
development and implementation of carbon policies and EV policies, their timeframe
and linkages, could have a big positive or negative impact on carbon emissions and EV
incentives
The additional benefit of EVs and reduced air pollution could play a very important role
in Victoria. The deaths, per annum, in Victoria from air pollution are around 300 to
400. How could the externality of dirty fuel sources be costed and benefited to EVs?
The lack of noise for EVs could be a barrier to EV in some respects, e.g. the impacts for
the visually impaired
The flow-on effects for the electricity industry will also need to be researched and
quantified. Currently, people do have any disincentive to not charge their vehicle at
6pm. How could charging EVs result in increased energy prices? Could this be a
barrier? Residential customers will be required to put in a separate charge point for the
vehicle (as residential customers do not have 10amp access), so essentially they will
have to notify their utility that they have an EV and an electrician will have to be
involved. Trials are being conducted in South Australia regarding peak power tariffs,
e.g. a customer is allocated with a 6 kW demand limit, and it is up to the customer as to
how they would like to allocate their power. Would this type of tariff have any
applicability? This tariff has been considered, but the meters need to be capable of
capturing both kW and kWh
Management of grid impacts/minimisation of electricity infrastructure investment is a
major issue/externality that may arise from unfettered adoption of EVs - key
considerations related to this issue include implementation of advanced metering
infrastructure and time-of-use tariff charging, and the market frameworks for metering
(specification, installation costs, accreditation) and re-selling of electricity
The focus on locked in charge point and energy supply is not in the best interests of the
consumer (driver) and is driven by commercial interests. The use (charging) of EVs
should not be linked to metering/ ToU pricing as this is a sensitive area that is causing
problems in the Smart meter deployment
Government needs to be taking action in this area in the right location, e.g. government
must have proof of a market failure for government to intervene. It is also important to
remember that government is not limited to intervening only where a barrier exists
Oil Company response needs to be considered - they will cut prices to stay competitive
and potentially delay mass adoption.
The wide-ranging discussion topics around policy options at the workshop (and in the survey)
included. Note: the discussion points listed below are not representative of any specific

SUGGESTED POLICIES FOR AUSTRALIA
Barriers to and Policy Solutions for EV Adoption in Australia • March 2011 61
stakeholder, nor are the discussion points an exhaustive summary of EV barriers from the
perspective of all stakeholders:
ToU tariffs will be a significant incentive because off-peak charging will be much
cheaper
How could registration of vehicles be linked to providing EV incentives? Registration
seems to be one of the levers that a State government has
Separate itemisation on utility bills (for EV usage)
Opportunities to link renewable energy with EV targets
Developing innovative finance options and/or identifying third party providers
Potential restrictions or disincentives for peak recharging of EVs
Revamp fringe benefit tax (FBT) for EVs (and encourage less kilometres travelled not
more)
Scalability of Electricity Distribution Company response to EV load
Electricity market reforms may be required to cater for "re-selling" of electricity by
charging infrastructure operators
Workplace charging may be a key enabler for would-be EV operators unable to charge
at home - this may require reforms to fringe benefit tax (FBT) calculations, incentives
for workplaces to provide infrastructure etc
EVs should not be connected (for commercial or other reasons) to ToU pricing
initiatives, smart meter deployments or any other charge point requirements (battery
exchange, fixed vendor for charging energy)
Some standardisation of how charging provider plans are communicated will likely be
required should no clear business model emerge initially
The whole area of energy supply for charging vehicles needs to be reviewed both from
an Australian Energy Regulator point of view and a State policy point of view to ensure
synchronisation of drivers for consumers and EV uptake.
In the last 45 minutes of the workshop, a ranking exercise was completed, in order to create a
composite analysis of policy options across multiple criteria. The participants collectively
analysed the policy options using 2x2 matrices on a sticky wall (see below).

SUGGESTED POLICIES FOR AUSTRALIA
62 Barriers to and Policy Solutions for EV Adoption in Australia • March 2011
To complete the exercise, each participant was handed an envelope containing 13 squares of
paper. Each piece of paper had one of the italicised policy options from Table 7-1. The
participants were divided up into two smaller groups. One group ranked the 13 policy options
according to their Costs and the second group ranked the 13 policy options according to their
Benefits. The Costs matrix (on the left hand side) allowed participants to compare the costs of
each policy option: the x-axis represented ‗Cost to Government‘ (More Expensive, Less
Expensive) and the y-axis represented ‗Cost to Industry‘ (More Expensive, Less Expensive).
The matrix on the right hand side allowed participants to compare the benefits of each policy
option: the x-axis represented Effectiveness (Less Effective, More Effective) and the y-axis
represented Urgency (5-10 years, Immediately).
The activity began with both groups placing the Regulatory policy options on the matrix all at
once. After each person placed his or her Regulatory policies on the matrix, one member of
each group would find the ‗centre of mass‘ for each policy and place a collective ‗Group‘
marker on the matrix in the centre of mass. This group ‗rank‘ for each Regulatory policy option
stayed on the wall, and all of the individual votes were removed. This process continued for
Pricing, Incentives, Facilitation, Information, Targets, Coordination and Technology policy
options, until all that was left on the two matrices, were collective group rankings for each of
the policy options.

SUGGESTED POLICIES FOR AUSTRALIA
Barriers to and Policy Solutions for EV Adoption in Australia • March 2011 63
A summary of results from the analysis exercise are presented below. Note: the summaries
below are not representative of any specific stakeholder, nor do they represent a thorough
analysis from the perspective of all stakeholders.
Table 6-3. Costs: Cost to government versus cost to industry
Co
st t
o I
nd
ust
ry
Les
s u
rgen
t
Low cost to industry, high cost to government:
Mandated purchase of EVs in government
fleets (F1)
Access to parking spaces (E11)
National EV sales target (T1)
Central Hub for EV info (I1)
Australian Centres of Excellence (Tech 1)
Low cost to industry, low cost to government:
ToU electricity pricing (P2)
Common metric for lifetime cost comparison of
ICEVs, HEVs and EVs (I6)
Coordinating federal and state EV strategies (C7)
Building codes that require dedicated electrical
capacity and parking spaces for EVs (R5)
High cost to industry, high cost to
government:
Tax benefits for EV purchases and fuel-
economy based fee at the time of car
purchases (E1/P9)
High cost to industry, low cost to government:
Mandatory fuel economy standards and/or low
and zero emission vehicle requirements (R3/R4)
Connect RE targets to EV sales (F5)
Reduce subsidies for ICEV purchases (P5)
Cost to Government
Table 6-4. Benefits: Efficiency versus urgency
Urg
ency
Les
s urg
ent
More urgent, less efficient:
Central Hub for EV info (I1)
Australian Centres of Excellence (Tech 1)
Access to parking spaces (E11)
National EV sales target (T1)
More efficient, more urgent:
ToU electricity pricing (P2)
Connect RE targets to EV sales (F5)
Common metric for lifetime cost comparison
of ICEVs, HEVs and EVs (I6)
Federal and state strategies and roadmaps for
EVS (C7)
Less urgent, less efficient:
Reduce subsidies for ICEV purchases (P5)
Mandated purchase of EVs in government
fleets (F1)
Less urgent, more efficient:
Mandatory fuel economy standards and/or
low and zero emission vehicle requirements
(R3/R4)
Tax benefits for EV purchases and fuel-
economy based fee at the time of car
purchases (E1/P9)
Building codes that require dedicated
electrical capacity and parking spaces for
EVs (R5)
Efficiency

SUGGESTED POLICIES FOR AUSTRALIA
64 Barriers to and Policy Solutions for EV Adoption in Australia • March 2011
After a group rank had been placed on both matrices for each policy option, the outcomes of the
process were summarised by ranking the policies in a linear fashion. The linear composite was
created by writing each policy option on the 45 degree line at its perpendicular angle of
intersection with the 45 degree line (demonstrated below with Policy R3/R4).
Figure 6-1. Costs: Cost to government versus cost to industry
Figure 6-2. Benefits: Efficiency verses effectiveness

SUGGESTED POLICIES FOR AUSTRALIA
Barriers to and Policy Solutions for EV Adoption in Australia • March 2011 65
A third matrix was then created to compare the ranking of the policy options in terms of Costs
versus Benefits. In the third matrix, the coordinates for each policy option were a sum of each
policy option‘s rankings from the first and second matrix. The policy options that the
stakeholders expected to have the greatest level of public support were then marked with a pink
piece of paper.
The above photo of the composite matrix (e.g. of mapping of the results of Costs versus
Benefits) has been translated into a summary chart, shown below in Figure 6-3. The four
policies with public support are noted with a border.

SUGGESTED POLICIES FOR AUSTRALIA
66 Barriers to and Policy Solutions for EV Adoption in Australia • March 2011
Figure 6-3. Composite: Benefits versus Costs
Please note: the strength of the workshop process is that it provides an analytical tool for
further investigation and prioritisation of policy options. We do not consider the analysis
described above to be exhaustive, nor final. Rather we consider this analysis to be introductory
and a starting point, and we consider the process a valuable tool for future discussions.
ISF‘s initial analysis of the policy options, the results of the survey and the discussions at the
stakeholder workshop were all helpful stages to select five specific policy options to research
further. Our final considerations for selecting the options to research in more detail include:
Selecting the policy options that require a more detailed explanation (e.g. ―Provision of
a Central Hub for EV information does not require much greater exploration in terms of
costs, benefits and potential implementation structures).
Selecting the policies that are more appropriately matched to the current stage of the EV
market in Australia (e.g. which policies should be investigated in the short-term)
ISF has selected the following policy options to research in greater detail:
I6: Common metric for lifetime cost comparison

SUGGESTED POLICIES FOR AUSTRALIA
Barriers to and Policy Solutions for EV Adoption in Australia • March 2011 67
C7: Coordination federal and state EV strategies
F5: Connecting renewable energy targets to EV sales
P8: Green registration discounts
P2: Time of use pricing
E1/P9: Upfront EV cost reductions and fuel economy based fee.
6.3 Policy Option Summaries
Below we present a brief summary on each of these policy options, their specific considerations
and potential outcomes7, including:
A general description, an explanation of why the policy is needed and the barriers the
policy addresses
The financial and non-financial benefits. Note: We have not quantified the financial
and non-financial implications, but we have given a summary of the potential direction
and magnitude of these implications
The steps required to implement the policy. Note: these steps for implementation are
not prescriptive or definitive but rather are meant to facilitate discussion
A brief description of how the policy relates to other EV policies
The potential obstacles and risks
A reference of national and international examples.
7 In the next phase of the Electric Driveway project, several of these policies will be further analysed and
recommendations for key inputs for CSIRO‘s Diffusion Model will be provided. Specifically, a short list
of 2-3 policies will be analysed to determine their impact on facilitating EV adoption. The Diffusion
Model will analyse parameters such as: size ($) of the policy; conditions for the policy (e.g. means test,
amount for each vehicle type); timing of introduction; projected vehicle and battery costs, etc.
Additionally, the model can test several scenarios of project costs (e.g. best, average, worst).

SUGGESTED POLICIES FOR AUSTRALIA
68 Barriers to and Policy Solutions for EV Adoption in Australia • March 2011
I6: Common metric for lifetime cost comparison Information
CONTEXT
General Description:
The creation of a common metric for comparing the lifetime costs of vehicle ownership would provide a
simple source of information to consumers when comparing ICEVs and HEVs to EVs. Consumer guides
for automobiles have existed, vehicle metrics such as fuel efficiency, and a rough estimate for projected
maintenance costs. However, with the exception of fleet vehicle customers, it is unlikely that consumers
will do a full lifetime cost of ownership comparison when making a purchase decision. The need for such
a metric may have been limited in the past since ICEVs can be compared to one another with each aspect
of performance and cost compared side by side. In contrast, EVs fundamentally change the cost structure
since the initial costs are high, but the operating costs are far lower. An easier comparison of the total
cost of ownership of an EV to an ICEV of a similar vehicle class may make EVs more attractive to
consumers.
The creation of a national standard for evaluating the average cost per kilometre for all vehicles (ICEV,
HEV, PHEV and EVs), would help consumers make more informed purchase decisions. Such a metric
would take into account:
Vehicle purchase price
Vehicle purchase consumer tax /incentive
Cost of fuel
Fue tax
Insurance
Schedule maintenance
Unscheduled maintenance
Scrap value
Discount rate
Depreciation
Cost of a replacement battery pack
Battery pack lifetime
Cost of electricity
Cost of home charging infrastructure.
Further factors that may play a greater role in the future:
Carbon taxes and incentives
Second life of battery pack
Electricity rebates.

SUGGESTED POLICIES FOR AUSTRALIA
Barriers to and Policy Solutions for EV Adoption in Australia • March 2011 69
Need:
There is a lack of reliable information about the costs of PHEVs and EVs relative to ICEVs. Adoption
rates will depend in part on the consumer‘s perception of cost. There are several circumstances in which
this lack of access to relevant cost information may present a significant barrier. An example is the
common lack of understanding for the difference in purchase price between ICEVs and EVs. For EVs,
the battery pack cost is high, but the operating costs (for a reliable battery) will be much lower. There is
also a lack of reliable information on maintenance costs, creating difficulty in justifying higher purchase
or capital costs.
There are very few standards for understanding long term battery pack related costs. Many consumers
fear that if they were to buy an EV, they may have to buy a very expensive replacement battery pack. In
general, there is a lack of information regarding these types of costs. A single lifetime cost estimate
would reduce the confusion and perceived cost related risks of EV ownership.
Barriers addressed:
The barrier addressed is ‗Imperfect information‘ concerning the total cost of vehicle ownership.
EXPECTED OUTCOMES
Upfront costs and on-going costs to consumer:
This policy is not expected to have an impact on direct upfront costs or ongoing costs to the consumer.
Benefits in terms of convenience, decreased risk and appeal:
It is expected that a common cost metric would provide substantial convenience to consumers who might
otherwise not be able to make such a cost comparison. There is a decreased risk to the consumer since
they will have a greater visibility of the true cost of ownership. The appeal of EVs is also expected to
increase when compared to other vehicles on a total cost of ownership basis.
General outcomes for EV market:
The metric effectively unlocks a great deal of hidden value that would otherwise be overlooked by the
consumer. With the use of a common cost metric, it is likely that more EVs will be sold. Furthermore,
automotive OEMs will be further incentivised to keep maintenance, refuelling, and other ongoing
operating costs to a minimum.
IMPLEMENTATION
Steps to implement and level of government and potential department:
As the lead department in the creation and administration of the Green Vehicle Guide (GVG), the
Department of Infrastructure and Transport, would be well placed to lead the development of this
common cost metric. Stakeholder consultation would be important in determining the weighting placed
on various factors. The rollout could be implemented in stages with the first stage being a voluntary or
optional metric being applied to the vehicle, with a national requirement for all vehicle classes being
implemented at a later date.
Cost:
The largest cost to implement such a metric will likely be incurred during the stakeholder consultation
phase and would be affected by the method for calculating the metric. An inclusive and collaborative
process would need to be used to ensure stakeholders are treated fairly.
There will also be a cost associated with the ongoing acquisition of reliable performance data that is
needed as an input to calculate the metric for each vehicle. Further, there will be a likely small cost for
distributing the information to the consumers.

SUGGESTED POLICIES FOR AUSTRALIA
70 Barriers to and Policy Solutions for EV Adoption in Australia • March 2011
Variants:
There are many ways to implement a cost metric including:
Voluntary submission of data by the automotive manufacturers
Third party regulation and standardisation, an annual consumer guide
Mandatory stickers and figures on new vehicles and/or in user manuals
Regulation on operating cost claims in car advertisements.
RELATIONSHIP TO OTHER POLICY OPTIONS
The creation of regional financial incentives, taxes and charges will affect the variability in the costs of
vehicle ownership and thus will affect the creation of a common metric for cost comparison. For
example, if a the common cost metric is applied nationally and there is a large difference in operating
costs and subsidies from state to state, the utility of such a metric will be diminished. If the variability of
lifetime cost for an EV varies widely enough from region to region, it may prove to be too complicated to
warrant the creation and implementation of a common cost metric. Examples of region specific changes
that could affect the creation of a common cost metric are:
P2. Time of use electricity pricing
P4. New or increased environmental, fuel or congestion charges or taxes on ICEVs
E1/P9 Purchase incentives and fee-bates
E11. Access to free or prime parking spaces.
OBSTACLES AND RISKS
There are many ways to compare the cost of EVs to ICEVs, and some methods will make EVs seem
more appealing than others. Likewise the interests of manufacturers, replacement parts companies,
financing companies, and others will likely be affected by the way in which this metric is implemented.
Another risk is that the metric is made to be too simple or too complex. If made too simple, it may appear
easy for the consumer to use but ultimately it will mislead the consumer since it does not contain enough
information to make an educated decision. If made too complex, the consumer may simply avoid using
the metric.
PRECEDENTS
National examples:
Green Vehicle Guide (GVG):
The Department of Infrastructure and Transport (DoIT) has developed a consumer guide for evaluating
vehicles when making purchasing decisions. The DoIT GVG will be updated to account for EVs and how
to rate and compare them to ICEVs in a meaningful way. The challenges are evident from their Electric
Vehicle Information page where they state8:
[W]e would expect that “pure” EVs would rate as zero emission vehicles for the purposes of the
Greenhouse Rating and the Air Pollution Ratings and thus score 10/10 on these ratings (and achieve a
5 star overall rating). Plug in-hybrids would be rated on the basis of the CO2 emissions value from the
standard test for Greenhouse Ratings and on the basis of the standard to which the vehicle is certified
8Green Vehicle Guide Electric Vehicle Information:
http://www.greenvehicleguide.gov.au/GVGPublicUI/Information.aspx?type=ElectricVehicleInformation
(accessed 23 November 2010)

SUGGESTED POLICIES FOR AUSTRALIA
Barriers to and Policy Solutions for EV Adoption in Australia • March 2011 71
under ADR79/02 for the Air Pollution Ratings. However, in recognition of the particular and unique
aspects of EV operations, we will also aim to provide more detailed information on the GVG
regarding the CO2 emissions aspects of vehicle recharging, highlighting the capacity to deliver a zero
vehicle emissions outcome, but also noting the potential for a range of overall CO2 emissions
outcomes.
The DoIT also creates fuel consumption labeling standards and as such are a likely candidate for the
development of a common cost metric for Australia9.
International case studies:
USA:
There are several international precedents for making fuel efficiency and operating cost information
available to the consumer. A good example is the EPA/DOT Fuel Economy labels and the recently
proposed EV versions of those labels. While guides and calculators are useful, they are not ubiquitous or
as easy to understand as a single label that must be placed on all new vehicles prior to sale.
EPA/DOT Fuel Economy label (proposed)10
:
The EPA and the National Highway Traffic Safety Administration (NHTSA) have created a new vehicle
comparison label that is required on all new vehicles. There are two primary label designs under
consideration.
EPA/DOT Advanced Technology Vehicles Label (proposed)11
:
Similar to the Fuel Economy label for ICEVs, the Advanced Technology label will enable consumers to
make a fair comparison with between ICEVs, BEVs and PHEVs:
EPA/DOT Electric Vehicle Label (proposed)12
:
This label is specific to BEVs. It displays:
Vehicle efficiency in kWh/100miles
MPGe (miles per gallon equivalent) and amount saved over a 5 year period.
Annual ―fuel‖ cost
Amount of money saved over 5 years in comparison to the average car.
EPA Green Vehicle Guide13
:
This guide allows consumers to compare vehicles for basic information, but it contains no cost
evaluation.
9 Australian Government Department of Infrastructure and Transport, Vehicles and the Environment:
http://www.infrastructure.gov.au/roads/environment/index.aspx (accessed 23 November 2010) 10 US Environmental Protection Agency Fuel Economy Label, Gas and Diesel Vehicles:
http://www.epa.gov/fueleconomy/label.htm (accessed 23 November 2010) 11 US Environmental Protection Agency Advanced Technology Vehicle Label:
http://www.epa.gov/fueleconomy/label.htm#atv (accessed 23 November 2010) 12 US Environmental Protection Agency Electric Vehicle Label:
http://www.epa.gov/fueleconomy/label/images/2010/labels-1-electric.jpg (accessed 23 November 2010) 13 US Environmental Protection Agency Green Vehicle Guide: www.epa.gov/greenvehicles/ (accessed 23 November
2010)

SUGGESTED POLICIES FOR AUSTRALIA
72 Barriers to and Policy Solutions for EV Adoption in Australia • March 2011
Canada:
NRCAN EnerGuide label14
:
This label is intended to remain on cars up to the time of sale. This label does not take into account
driving habits, and does not factor in maintenance. It only allows for a cost comparison for fuel. This
label shows:
Annual Fuel Cost
Annual Fuel Use
CO2 Emissions/yr
City/Hwy Fuel Consumption.
NRCAN Cost comparison tool15
:
This tool allows the consumer to compare two vehicles side by side for cost of fuel, CO2 emissions, and
fuel efficiency.
Non Profits:
Several cost of ownership calculators have been developed by non-profit organizations as well as through
government initiatives. However, none of them have outputted a standardized metric that allows for an
easy comparison.
Be Frugal EV Calculator16
:
Author: BeFrugal.com
Outputs: Cost Equivalent MPG, total CO2 emissions
Project Get Ready17
:
Author: Rocky Mountain Institute
Outputs: lifetime cost of vehicle, lifetime cost of fuel, equivalent barrels of oil used, CO2 equivalent
emitted
14 NRCAN EnerGuide Label: http://oee.nrcan.gc.ca/transportation/personal/buying/energuide-label.cfm?attr=8
(accessed 23 November 2010).
15 NRCAN Cost Comparison Tool: http://oee.nrcan.gc.ca/transportation/tools/compare/compare-search-one.cfm
(accessed 23 November 2010).
16 BeFrugal Electric Vehicle Calculator: http://www.befrugal.com/tools/electric-car-calculator/ (accessed 23
November 2010).
17 Project Get Ready Lifetime Cost Calculator: http://projectgetready.com/js/tco.html (accessed 23 November 2010).

SUGGESTED POLICIES FOR AUSTRALIA
Barriers to and Policy Solutions for EV Adoption in Australia • March 2011 73
C7: Coordinating federal and state EV strategies Coordination
CONTEXT
General Description:
The federal government along with several of the state governments lack a coordinated strategy on the
adoption of EVs. Potential for greater coordination could relate to:
Information about how existing programs relate to EVs
Areas of priority policy reform
Analysis of the impacts and benefits of EVs specifically with regards to the environment, electricity
grid, standards, EV consumers and local industry development
Programs and program timelines, including specific incentives, that aim to increase broad adoption
and may specifically address:
Vehicle demonstration
Charging infrastructure
Government fleet purchases
Emission standards
Industry collaboration.
Plans to integrate strategies of associated industries such as manufacturing and electricity production
Adoption targets
Participation in national or international initiatives
Delegation of implementation responsibilities to specific teams or departments with regular reporting
and benchmarks.
Need:
Strategies are needed at the federal and state levels to determine how government can best work with
industry and the public to ensure a smooth and rapid transition from ICEVs to EVs. Governments can use
these strategies and roadmaps to play a coordinating role that will result in increased social,
environmental and economic sustainability outcomes. These strategies are also needed to guide various
stakeholders, such as automotive manufacturers, in their decisions as well to create transparency in EV
policy.
In addition, federal and state governments are significant vehicle purchasers and could therefore have a
large influence through fleet EV purchases.

SUGGESTED POLICIES FOR AUSTRALIA
74 Barriers to and Policy Solutions for EV Adoption in Australia • March 2011
Barriers addressed:
Federal and state strategies address the barrier of ‗confusion‘ which is described as the interactions
created by other barriers. For example, strategies can provide good information about EV technology and
performance as well as information about policy direction and targets that will help to address barriers
around cultural values. Governments can also bring together various stakeholders in the strategy
development such as fleet managers, vehicle manufacturers and research institutions in a process that will
facilitate maximising common benefits of EV adoption and determine which barriers to prioritise.
EXPECTED OUTCOMES
Upfront costs and on-going costs to consumer:
The strategies themselves are unlikely to change the financial factors associated with EVs. However,
better coordination could potentially lead to greater economic efficiency which may translate to lower
sales prices. The magnitude of this reduction is too complex to calculate and therefore further research
would be needed to determine an approximate value.
Furthermore, policies contained within the strategies may relate directly to EV economics, but need be
addressed separately from the strategies themselves.
Benefits in terms of convenience, decreased risk and appeal:
Federal and state strategies would likely decrease risk to potential EV buyers though both the information
provided in the documents as well as the perceived increase in government commitment to EVs.
Convenience for the consumer would not be affected by the strategy, however, appeal would likely
increase dependent partially on the level of promotion and distribution of the strategies.
General outcomes for EV market:
The expected general outcomes are:
Improved communication between stakeholders as a result of the strategy development process
Further greenhouse gas reductions
Better publically available information on EV technology and performance characteristics
Harmonisation of standards, policies and regulations to support EVs
EV automakers would be more receptive to entering the Australian market, because a coordinated
local strategy would reduce their risks. This would result is an increased range of models available as
increased competition.
IMPLEMENTATION
Steps required to implement and level of government and potential department:
Strategy development could take a variety of different forms. However, the following steps should be
considered:
Determine purpose and vision of strategy
Decide on methodology and process including which stakeholders will be involved and how
Establish links with other strategies and planning processes
Analysis of:
o EV technology
SUGGESTED POLICIES FOR AUSTRALIA
Barriers to and Policy Solutions for EV Adoption in Australia • March 2011 75
o Related government programs and departmental responsibilities
o Barriers to adoption.
Identify key results strategy will aim to achieve
Selection of programs to fulfil key results
Determine work plan with program costings and implementation responsibilities
Set implementation timeline
Plan for and execute a plan to promote and distribute the strategy
Monitor and report on progress
Revise strategy periodically.
The policies at the state level would likely be suited to relevant departments of energy or transportation
such as the Department of Energy and Resource Management in Queensland. At the federal level, the
two departments that could lead the strategy would be the Department of Climate Change and Energy
Efficiency or the Department of Resources, Energy and Tourism.
Cost:
The cost of developing a strategy would vary significantly depending on the degree of analysis and
engagement. However, it is the authors estimate from costing of related strategy work that a viable state
strategy would cost between $150K and $300K while a federal strategy would cost between $250K and
$500K.
Variants:
EV strategies could be included as a part of a larger transport and/or energy strategy. However, is
recommended that at least an independent section of the plan or strategy is devoted to EVs in this case.
RELATIONSHIP TO OTHER POLICY OPTIONS
The primary relationship between this and other policy options discussed in this report is that the
strategies could present and discuss the other options in one document in much the same way as this
report but in a government endorsed plan. For example, the strategy would be the logical place to discuss
the government‘s current and planned initiatives in the areas of regulation, targets, information,
facilitation, incentives and pricing.
OBSTACLES AND RISKS
The primary risk in developing a state or federal EV strategy is the lack of a good process for stakeholder
engagement. An effective plan will need to draw on the experience and needs of research organisations,
industry, government and consumers.
PRECEDENTS
National examples:
There is currently only one precedent in Australia with the QLD Government. The issue paper for public
discussion ―outlines what Queensland will do to support the uptake of electric vehicles (EVs) when they
come onto the Australian market over the next few years‖. The stated key drivers for the strategy include
the needs to:
Position Queensland to optimise the greenhouse reduction potential of EVs
SUGGESTED POLICIES FOR AUSTRALIA
76 Barriers to and Policy Solutions for EV Adoption in Australia • March 2011
Investigate, and where appropriate, plan for future infrastructure needs to support EVs and improve
how the electricity network is used
Support Queensland industry, businesses, electricity distributors, and the community during the
transition to EVs
Factor EVs into land use planning to build community and industry resilience to potential increases
in fuel prices and possible shortages
Work with other governments and industry to harmonise standards, policies and regulations to
support EVs.
However, the SA state government also recently committed to the development of a ‗Low Emission
Vehicle Strategy‘. This strategy will:
Complement the South Australian Government's investment in the public transport system and the
implementation of South Australia's new planning strategy. lt will outline the roles and future actions
of the South Australian Government in relation to the advancement of low emission passenger
vehicles, and be informed by international efforts including the Climate Group's EV2O initiative. The
strategy will not favour any particular technology but will aim to create a supportive environment that
reduces or eliminates barriers to change. The strategy will also include development and
establishment of a new emissions reduction target for the State Government fleet.
Other states include EV related strategies as portions of broader overarching transport plans such as the
Victoria Transport Plan. However, there is currently no federal EV strategy in Australia which makes it
more difficult for states to create individual strategies without knowing the general direction of EV
policy in Australia.
International case studies:
Several states, countries and regions have developed EV strategies. Several of these are summarised
briefly below.
Japan
MITI created one of the first commercialisation plans in the world for EVs in 1976 (Ahman 2004). The
current plan developed in 2010 is called the Next-Generation Vehicle Plan and includes HEVs as well as
EVs. The current plan includes separate roadmaps for international standardisation, resource strategy and
infrastructure development.
EU
The European Commission earlier this year release ―A European strategy on clean and energy efficient
vehicles‖ focussed on heavy and light duty vehicles. A specific section on EVs deals with the issues of
market placement, standardisation, charging infrastructure, energy generation and distribution and battery
recycling.
Canada
The Electric Vehicle Technology Roadmap for Canada is ―intended to provide the strategic direction to
ensure the development and adoption of EVs in Canada, while building a robust industry.‖ The topics
covered in the strategy include ―energy storage, components for EVs, vehicle integration, business
models and opportunities for EVs, government policies, regulatory and human resource issues, and
public awareness and education.‖

SUGGESTED POLICIES FOR AUSTRALIA
Barriers to and Policy Solutions for EV Adoption in Australia • March 2011 77
US
While the US government has not created an EV strategy, several national organisations have including
the Electrification Coalition with their roadmap in 2009 and the Electric Drive Transportation
Association (EDTA) with their 2009 Road Map for Energy Security.
IEA
The IEA Electric and Plug-in Hybrid Electric Vehicles Roadmap was developed in collaboration with
government, industry and NGOs and addresses BEVs and PHEVs. The vision of the Roadmap is to
achieve a 50% sales share of light duty vehicles with EVs and PHEVs by 2050.

SUGGESTED POLICIES FOR AUSTRALIA
78 Barriers to and Policy Solutions for EV Adoption in Australia • March 2011
F5: Connecting renewable energy targets to EV sales Facilitation
CONTEXT
General Description:
Connecting renewable energy targets (RETs) to national EV sales will ensure that future growth in
electricity demand associated with EVs is linked to growth in low carbon energy resulting in low or zero
carbon transportation outcomes. The electricity consumption of EVs could be estimated based on the
type of EV sold or the vehicles could be separately metered at homes and public charge stations. The
RETs could be adjusted annually based on the EV electricity consumption. The current national targets
are fixed out to 2020 and include an expansion from the 2011 target of 12,500 GWh to the 2020 target of
45,000 GWh and are split between the large-scale renewable energy target and the small-scale renewable
energy scheme. Smart grid technologies will also allow EV charging to more closely align with times of
high intermittent renewable generation. This will reduce the system costs of intermittent renewable
generation and will allow the federal government to implement the RET more efficiently.
Need:
This policy is needed to ensure that the transition of vehicles from ICEVs to EVs results in the best
possible environmentally sustainable outcome. As Australia has one of the most carbon intensive
electricity generation systems in the world, EVs will need be charged from renewable energy to have a
significant direct greenhouse gas reduction.
Barriers addressed:
The barriers addressed are primarily related to split incentives but also cover cultural barriers. With
regards to split incentives, the main issue is the effectiveness of other government policies related to EV
adoption in reducing GHGs if the majority of the EVs charge using conventional grid electricity. This is
especially important in the State of Victoria due to the use of lignite as a fuel source. The cultural barrier
is related to the concern that EVs will not be less polluting than ICEVs or HEVs which can be alleviated
through ensuring the EVs energy comes from zero emission sources.
EXPECTED OUTCOMES
Upfront costs and on-going costs to consumer:
The expected cost outcomes are likely to be small. The only direct benefit would be that consumers
would not need to purchase Green Power to ensure zero emissions.
Benefits in terms of convenience, decreased risk and appeal:
The knowledge that no emissions would be generated from recharging would increase the appeal of EVs.
Convenience and risk would likely be unchanged by this policy.
General outcomes for EV market:
The expected outcomes for the overall EV market are increased adoption as a result of the assurance that
all consumers will be driving the most sustainable vehicle option available. There is also the potential for
more automakers to introduce EV models in Australia. Some companies, such as Toyota, have cited high
electricity emission intensity as a reason for not launching EVs in Australia in the past, although have
later gone on to announce that their EVs will be sold in Australia.
IMPLEMENTATION

SUGGESTED POLICIES FOR AUSTRALIA
Barriers to and Policy Solutions for EV Adoption in Australia • March 2011 79
Steps to implement and level of government and potential department:
The key factor to consider in the implementation of this policy is the method for determining the
additional energy used by the EVs. While it is possible to estimate the energy used by each vehicle based
on a combination of trials, case studies and individual vehicle characteristics, it would be significantly
more accurate to separately meter EVs. This would have the additional benefits of allowing for potential
demand management policies to be implemented at a later date and for electricity retailers to be able
offer pricing plans that incentivised off-peak charging. If EVs are separately metered, total energy use
from each vehicle can be aggregated by each utility and reported to the government annually to allow for
revision of RETs.
The Renewable Energy Regulator would monitor the scheme to ensure adequate reporting and
compliance by utilities. The Department of Climate Change and Energy Efficiency would be the likely
lead department in initiating and crafting the legislation given their current responsibility for the existing
RET.
Cost:
According to modelling from McLennan Magasanik Associates (MMA, 2010), the current enhanced
RET will have an impact on retail electricity prices on $4.62 from 2010 to 2015, $7.28 from 2015 to
2020 and $5.42 per MWh from 2021 to 2030. These represent increases in electricity prices of less than
5%. However, the best way to estimate the additional cost for liable parties (those making wholesale
acquisitions of electricity), is to multiply the average renewable energy certificate (REC) price by the
additional load created by EVs. From the Phase 1 ED Report, each vehicle will require approximately
5kWh per day or 1.8MWh per year, decreasing with technology improvements. The average REC price
for the past year was approximately $37 so therefore, the cost per vehicle is approximately $67 per
year18
. More detailed modelling by CSIRO under the ED project will estimate the number of vehicles
sold in a given year, which can be used to calculate the total cost to liable parties which would be passed
on as an incremental increase in retail electricity price. However, if 5% of vehicles in Australia were
electric, which is not expected to happen until sometime after 2020, then the total increase in the RET
target would be from 45,000 GWh to 46,350 GWh. If the additional cost of the RET scheme after 2020
was the stated $5.42 per MWh, then EVs would contribute an additional $0.16 per MWh or an increase
of 0.09% on 2020 electricity prices.
Variants:
Another way to calculate the increased costs to the federal government of increasing the RET is by
estimating the renewable technology mix and the average price per MWh including amortized capital,
fixed and variable operation and maintenance and incremental network costs.
One method to recover the costs of the program is to require participating drivers to take part in demand
response programs whereby the charging rate could be reduced during times of peak demand. The
potential cost savings to the electricity utility companies from this activity have the potential to recover a
substantial portion cost of the reduced registration revenue.
Another related possibility is to require that participating vehicles use smart charging technology that
maximises the use of renewable generation by charging faster at times of maximum intermittent
renewable energy generation and minimum total system demand.
Another variant is to pass the obligation on to car manufactures who want to continue to sell vehicles
18
$37 times 1.8 equals $67

SUGGESTED POLICIES FOR AUSTRALIA
80 Barriers to and Policy Solutions for EV Adoption in Australia • March 2011
with high levels of emissions to purchase RECs equivalent to lifetime energy consumption, instead of
requiring the federal government to increase the RET.
RELATIONSHIP TO OTHER POLICY OPTIONS
There is a clear relationship between this policy and the firm national EV sales targets. A sales target
would allow the RET adjustments to be made in advance without the assistance of EV distribution
modelling.
OBSTACLES AND RISKS
There is a risk of lack of public acceptance for the costs of Green Power for EV drivers to be divided
across the whole electorate. However, several state and federal policies are tied to particular consumer
segments and draw from the tax base of the entire population. Furthermore, it can be argued that
increases to the RET do not actually benefit the drivers of EV directly, but are of national and
international interest.
PRECEDENTS
National examples:
The expanded RET includes the Small-scale Renewable Energy Scheme (SRES) as part of the overall
target. The 2020 target for this category which includes small scale technologies such as solar panels and
solar hot water systems is set at 4,000 GWh, but had been left uncapped. This means that any additional
energy generated above this cap will serve to increase the total RET. This could be applied in the same
way to EVs or alternatively EVs could be included in the SRES as triggering increases in the target.
Better Place in Australia has partnered with AGL to provide all the energy required for its charging and
battery swap stations from 100% Green Power. This links EV driving to renewable energy in the same
manner as an increase in the RET would.
International case studies:
Better Place has also implemented programs internationally that ensure that all energy used to charge
EVs as their charge and swap stations is sourced from renewable energy.19
A study by Transport & Environment, Friends of the Earth Europe and Greenpeace European, Green
Power for Electric Cars, contained a similar recommendation for European countries to increase
renewable energy production by an equal amount to the energy consumed in powering EVs over and
above their national targets.
19
http://www.betterplace.com/global-progress

SUGGESTED POLICIES FOR AUSTRALIA
Barriers to and Policy Solutions for EV Adoption in Australia • March 2011 81
P8: Green registration discounts Price Reform
CONTEXT
General Description:
Allowing discounts on annual vehicle registration costs for EV drivers who purchase Green Power or
otherwise use renewable energy to power their vehicles will encourage zero emission driving and result
in potentially substantial greenhouse gas emission reductions. This policy could be implemented at a
state or federal level and could either be structured as a rebate on registration or on compulsory third
party insurance (provided through the Transport Accident Commission in Victoria).
Need:
This policy is needed because while EVs charging from grid power will produce fewer emissions than
the current average of new vehicles sold, the reductions will be minimal in some states due to the
relatively higher emissions intensity of the grid-supplied electricity. Furthermore, some new vehicles
such as those listed in the top 20 of the Green Vehicle Guide20
would produce substantially less
emissions than a typical EV drawing power from the grid in the highest emission intensity states such as
Victoria.
A policy is needed to encourage owners of EVs to switch over to Green Power and reduce vehicle
emission down to near zero.
Barriers addressed:
The barriers addressed are primarily related to price reform, information and incentives.
From the price reform perspective, this policy allows for economic benefit to the consumer for
environmental leadership.
With respect to information, several organisations have concluded that EV emissions will be higher than
an average vehicle in Victoria. An example of this is the statement on the Royal Automobile Club of
Victoria (RACV) website:21
Based on manufacturers' data and desktop analysis, electric vehicles powered by Victorian-produced
coal-fired electricity produce slightly more greenhouse gas emissions than comparable petrol
vehicles.
Analysis within the ED project in the Technical, Economic, Environmental & Institutional Assessments
Phase 1 Report concludes otherwise, however, it is clear to all stakeholders that EVs running on Green
Power will produce near zero emissions.
In terms of incentives, it is expected that many individuals who purchase EVs will be motivated by
environmental concerns and therefore may independently purchase Green Power. However, there will
inevitably be individuals who don‘t feel that they can afford Green Power or are adverse to the hassle of
20
http://www.greenvehicleguide.gov.au/ 21
http://www.racv.com.au/wps/wcm/connect/Internet/primary/my+car/environment/victorian+ele
ctric+vehicle+trial/victorian+electric+vehicle+trial+faqs#Whatimpactwillelectricvehicleshaveo
ngreenhouseemissions2
SUGGESTED POLICIES FOR AUSTRALIA
82 Barriers to and Policy Solutions for EV Adoption in Australia • March 2011
switching to Green Power and will therefore require an additional incentive to purchase it for their
homes, especially with the additional electrical load of an EV.
EXPECTED OUTCOMES
Upfront costs and on-going costs to consumer:
The expected outcomes are reduced upfront costs for consumers that decide to participate. This would
depend on the amount of registration reduction. Registration in Victoria currently costs $187.40. The
additional cost of Green Power to run a vehicle for a year can be calculated from the ED Phase 1 ISF
Report estimate of 1,800 kWh used per vehicle per year. At an approximate additional cost for 100%
Green Power at $0.05/kWh, this represents an additional $90 per year. Therefore, consumers who opted
for green registration could save up to $97 per year and have the added benefit of knowing that their
vehicle produces near zero emissions.
Benefits in terms of convenience, decreased risk and appeal:
This policy would detract slightly from convenience, depending on how it was implemented, as users
would need to sign up for Green Power either at the time of registration or afterwards.
However, the appeal of EVs would increase significantly with the knowledge that emissions were
reduced to near zero. Special licence plates associated with green registration would add even more to
this appeal.
There would likely be no change in the risk of purchasing an EV through this initiative.
General outcomes for EV market:
This initiative would help to increase adoption of EVs through both the potential cost reductions and
more generally through the perception that EVs were truly the most sustainable passenger vehicle choice
on the market.
IMPLEMENTATION
Steps required to implement and level of government and potential department:
There are several possible ways to implement this policy. Key pieces of information that would need to
be either estimated or provided to the relevant state authority (for e.g. VicRoads in Victoria under the
Department of Transport) include the amount of energy used by the EV and the amount of Green Power
purchased. The energy used could either be estimated based on the kilometres driven (from the odometer
reading at the time of registration) and the expected energy consumption per kilometre of the make and
model of EV or based on electricity meter data for the EV. Also, the evidence of Green Power purchase
could either be presented at the time of registration renewal or provided directly to the appropriate
agency by the energy retailer. This second option would reduce the hassle for the user and may be as
simple as checking a box on the initial registration form.
Cost:
The cost to a given state government would depend on the amount of registration fee waived. If, for
example, the full fee were to be waived in Victoria and 5% of vehicles in the state were electric and
subscribed to the green registration plan, then the cost would be approximately $37M per year for
200,000 EVs. This would of course also lead to a significant decrease in greenhouse gas emissions from
personal transportation and would become cheaper as renewable generation costs continue to decline.
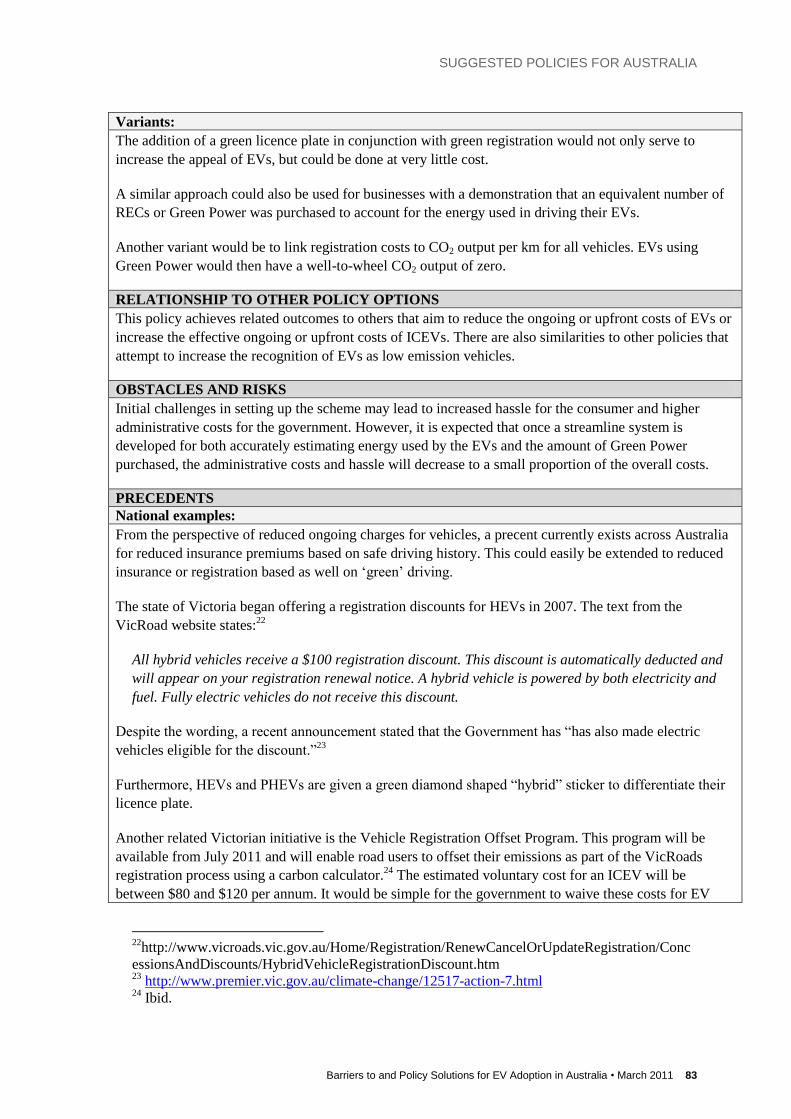
SUGGESTED POLICIES FOR AUSTRALIA
Barriers to and Policy Solutions for EV Adoption in Australia • March 2011 83
Variants:
The addition of a green licence plate in conjunction with green registration would not only serve to
increase the appeal of EVs, but could be done at very little cost.
A similar approach could also be used for businesses with a demonstration that an equivalent number of
RECs or Green Power was purchased to account for the energy used in driving their EVs.
Another variant would be to link registration costs to CO2 output per km for all vehicles. EVs using
Green Power would then have a well-to-wheel CO2 output of zero.
RELATIONSHIP TO OTHER POLICY OPTIONS
This policy achieves related outcomes to others that aim to reduce the ongoing or upfront costs of EVs or
increase the effective ongoing or upfront costs of ICEVs. There are also similarities to other policies that
attempt to increase the recognition of EVs as low emission vehicles.
OBSTACLES AND RISKS
Initial challenges in setting up the scheme may lead to increased hassle for the consumer and higher
administrative costs for the government. However, it is expected that once a streamline system is
developed for both accurately estimating energy used by the EVs and the amount of Green Power
purchased, the administrative costs and hassle will decrease to a small proportion of the overall costs.
PRECEDENTS
National examples:
From the perspective of reduced ongoing charges for vehicles, a precent currently exists across Australia
for reduced insurance premiums based on safe driving history. This could easily be extended to reduced
insurance or registration based as well on ‗green‘ driving.
The state of Victoria began offering a registration discounts for HEVs in 2007. The text from the
VicRoad website states:22
All hybrid vehicles receive a $100 registration discount. This discount is automatically deducted and
will appear on your registration renewal notice. A hybrid vehicle is powered by both electricity and
fuel. Fully electric vehicles do not receive this discount.
Despite the wording, a recent announcement stated that the Government has ―has also made electric
vehicles eligible for the discount.‖23
Furthermore, HEVs and PHEVs are given a green diamond shaped ―hybrid‖ sticker to differentiate their
licence plate.
Another related Victorian initiative is the Vehicle Registration Offset Program. This program will be
available from July 2011 and will enable road users to offset their emissions as part of the VicRoads
registration process using a carbon calculator.24
The estimated voluntary cost for an ICEV will be
between $80 and $120 per annum. It would be simple for the government to waive these costs for EV
22
http://www.vicroads.vic.gov.au/Home/Registration/RenewCancelOrUpdateRegistration/Conc
essionsAndDiscounts/HybridVehicleRegistrationDiscount.htm 23
http://www.premier.vic.gov.au/climate-change/12517-action-7.html 24
Ibid.

SUGGESTED POLICIES FOR AUSTRALIA
84 Barriers to and Policy Solutions for EV Adoption in Australia • March 2011
drivers as an alternative to reduced registration fees.
A final related Victorian initiative is the procurement of 100% Green Power for the vehicles used in the
Victorian EV Trial.25
Similar methodologies used to calculate the amount of Green Power required for
the trail vehicles could be used for the calculation of energy required in other EVs not participating in the
trial.
Another up-front incentive is the ACT Green Vehicles Duty Scheme, which is discussed in more detail in
policy E1/P9, EV Cost Reductions and Fuel Economy Base Fee at the Time of Vehicle Purchase.
International case studies:
Sweden waives the annual circulation tax for five years for EVs with energy consumption less than 37
kWh per 100 km (which is achievable by virtually all passenger EVs). This is equivalent to a premium of
SEK 10,000 ($1,478 AUD). Similar policies exist in other European countries.
Ireland is one of several countries where rebates on initial vehicle registration charges have been reduced
or eliminated for EVs. This can equate to substantial savings as Vehicle Registration Tax (VRT) can be
up to 36% of the Open Market Selling Price and is linked to the CO2 emissions per kilometre travelled.
This charge can is higher than €23,000 ($31,800 AUD) on some vehicles.26
In addition to the savings of
having a low emission (less than 120 gCO2 per km) vehicle, HEVs, PHEVs and BEVs get an additional
€2,500 ($3,465 AUD) discount on registration.27
25
www.transport.vic.gov.au/DOI/DOIElect.nsf/$UNIDS+for+Web+Display/ED2C1687B3FEA
438CA2577B3006F3B05/$FILE/ElectricVehicleTrial-InfoPaper.pdf 26
www.budget.gov.ie/Budgets/2008/Documents/AnnexD.pdf 27
www.revenue.ie/en/tax/vrt/faqs-co2.html#section7

SUGGESTED POLICIES FOR AUSTRALIA
Barriers to and Policy Solutions for EV Adoption in Australia • March 2011 85
P2: Time of use pricing Price Reform
CONTEXT
General Description:
Traditionally, the price consumers pay for electricity has generally been constant regardless of what time
the electricity is used. Under Time of Use (ToU) pricing electricity can be priced according to demand
throughout the day and year. When demand is at its highest, the prices are relatively high. Conversely,
prices would be lowest at night when demand is usually low.
There are many potential structures for ToU tariffs, but a common approach sets peak, shoulder and off-
peak pricing periods. ToU meters calculate how much power has been used during these periods.
Consumers are thereby encouraged to save money by shifting their energy consumption away from the
most expensive period to the cheaper shoulder and off-peak periods. By reducing waste and shifting
electrical use, it is possible for the average price and bill to the consumer to be reduced. However, as it
involves a component of having higher rates at certain times of the day, ToU pricing can still face
significant consumer and political resistance.
Need:
Requirements for new power station and grid upgrades are generally dictated by the annual peak power
demand on the grid. On such days, heating (in winter) or air conditioning (in summer) in combination
with all other electrical loads can add up to being more than three times as high as the lowest loads on a
mild night. This large spread contributes to the long term costs and environmental impact of electricity
production. The addition of uncontrolled EV charging, typically at the end of the workday is likely to
exacerbate peak demand. ToU pricing has the potential to moderate this impact on peak demand,
allowing power suppliers and network companies to avoid unnecessary high capital costs which would
otherwise ultimately trickle down to the consumers.
By creating standard ToU pricing for EVs, it both encourages prospective buyers to purchase EVs based
on low overnight tariffs and encourages charging in off-peak periods, reducing electricity network stress.
This could include critical peak pricing where the prices are significantly higher for short periods of the
highest peak demand.
Barriers addressed:
It is unlikely that the average cost of electricity will be a large barrier to EV adoption. However, without
time of use pricing structures, EV owners will likely charge at all times of the day without discretion thus
burdening the grid far more than necessary. Ultimately, this will result in unnecessarily high electricity
prices, thus potentially affecting the long term desirability of EVs.
EXPECTED OUTCOMES
Upfront costs and on-going costs to consumer:
ToU pricing may prove to be expensive for consumers who have no alternative but to charge their EVs
during the day or during peak hours. For these customers, their electricity bill will likely be higher than it
would if variable pricing were not implemented.

SUGGESTED POLICIES FOR AUSTRALIA
86 Barriers to and Policy Solutions for EV Adoption in Australia • March 2011
Benefits in terms of convenience, decreased risk and appeal:
In some cases, charging at night may be less convenient than a charge during peak hours. Regardless,
ToU pricing can provide consumers a safeguard against rising prices given that they are able to charge
mostly at off-peak times. As such, there may be a decreased price risk to the consumer in this regard.
General outcomes for EV market:
ToU pricing can act as an incentive for people to charge at off- peak times, thus decreasing the cost to
recharge and lowering the overall cost of EV ownership. Furthermore, it can help avoid additional
infrastructure expenditure and, as a result, keep electricity price increases to a minimum.
IMPLEMENTATION
Steps required to implement and level of government and potential department:
Firstly, government, utilities and consumer groups work together to provide smart meters at no extra cost
to the consumer regardless of EV ownership. Ideally, prices would be kept the same for a certain grace
period to avoid consumer backlash. Within this time period, consumers will be able to observe their own
power usage and will become acquainted with time of use information. Consumers can also be informed
by how much they have reduced their electricity usage during peak-hours thus familiarizing the
consumer. During this period, time of use billing can be made available as an option to the consumer;
however it would not be mandatory until after the specified grace period. Once this base of smart meters
is installed, it will be far easier for utilities to offer EV owners time of use billing for EV charging.
The specific details of EV charging in combination with time of use billing can be addressed in a contract
between the electricity provider and the consumer. The consumer‘s electricity consumption would be
recorded over short intervals by the smart meter and the price would be calculated based on the time of
use and the day of the week.
Cost:
The cost to implement ToU will likely be incurred by consumers who currently use electricity at peak
hours, but are unable to shift or reduce this load. An example of this is consumers who work from home
and those who use lots of air conditioning.
Variants:
Rather than mandating, one variant is to allow consumers to choose this type of billing as an option.
Users who feel that they would not benefit from such a measure could opt out. Another possibility is the
introduction of a second smart meter in the home that is used exclusively for vehicle charging. The rates
on this meter could be tiered aggressively for time of use, while the rest of the home remains the status-
quo.
RELATIONSHIP TO OTHER POLICY OPTIONS
If time of use billing for EV charging becomes widespread, it could affect the effort to initiate, encourage
and fund charging station infrastructure (T4). Fast charging stations that are primarily used during the
day, for example, may be faced with much higher electricity rates.
OBSTACLES AND RISKS
A key obstacle to ToU billing is the lack of installed ToU meters. ToU meters are required in order to
implement ToU pricing for EVs. Part of the reason for this obstacle is the confusion and backlash that
has resulted from previous attempts to roll out ToU meters and ToU billing at the same time. Another
risk is that if ToU billing for EVs is mandated, it may ultimately become a barrier to purchase an EV if

SUGGESTED POLICIES FOR AUSTRALIA
Barriers to and Policy Solutions for EV Adoption in Australia • March 2011 87
potential buyers are concerned that the cost to recharge will increase as a result of the policy.
PRECEDENTS
National examples:
Victoria
Department of Primary Industries28
:
The Smart Meter project was initiated by the Victorian Government through legislative changes in 2006.
Now the ongoing roll-out of Victoria‘s advanced metering infrastructure involves government, electricity
businesses, and consumer groups. The goal is to replace all residential and small business meters in
Victoria with 2.5 million Smart Meters by the end of 2013. Smart meters will be installed and managed
by electricity distribution businesses. These companies are regulated monopolies, and their spending is
monitored by the independent Australian Energy Regulator to ensure value to the consumer. While more
than 200,000 smart meters have been installed in Victoria2930
, considerable resistance has been
encountered31
.
EnergyAustralia has also introduced PowerSmart and LoadSmart time-based pricing where time of use
pricing within 30 minute intervals available for business use only32
.
International case studies:
California
Including low speed electric vehicles, the state of California has more than 25,000 electric vehicles on
the roads. Furthermore Californian utilities continue to roll out smart meters by the hundreds of
thousands.
Southern California Edison:
SCE has rolled out more than 1 million smart meters. In combination, there are many EV owners who
have experienced ―off-peak‖ charging of their EVs. With this large installed base of smart meters, SCE
can offer several different plans to EV ownership with less government regulation. SCE offers three
plans to EV owners:
Residential Plan (Schedule D): The standard residential rate plan where the price per kilowatt-hour
is tiered and increases as the amount of energy usage increases. This choice is the status-quo, but is
not the cost-effective choice for EV owners who charge at night.
Home & Electric Vehicle Plan (ToU-D-TEV): A tiered structure similar to the standard residential
rate, but provides lower electricity rates at night. This rate may be ideal for customers who have low
usage during peak daytime hours of 10 a.m. to 6 p.m.
Electric Vehicle Plan (ToU-EV-1): This rate uses a second meter to measure the electricity used
28 Department of Primary Industries, Smart Meters: http://new.dpi.vic.gov.au/energy/projects-research-
development/smart-meters (accessed 24 November 2010) 29 Department of Primary Industries, Smart Meters: http://new.dpi.vic.gov.au/smart-meters/about-smart-meters
(accessed 24 November 2010) 30 Department of Primary Industries, Smart Meter Locations: http://new.dpi.vic.gov.au/smart-meters/installation-
locations/maps (accessed 24 November 2010) 31 Fehrenbacher, K. (2010, March 28). Smart Meter Worries Crop Up In Australia. Gigaom. http://gigaom.com/cleantech/smart-meter-worries-crop-up-in-australia/ (accessed 24 November 2010) 32 Energy Australia, Power Smart Time-Of-Use Pricing:
http://www.energyaustralia.com.au/State/NSW/Business/Small-and-medium-business/Business-products-and-
services/Electricity/PowerSmart-time-based-pricing.aspx (accessed 24 November 2010)

SUGGESTED POLICIES FOR AUSTRALIA
88 Barriers to and Policy Solutions for EV Adoption in Australia • March 2011
to charge the customers vehicle, and thus can be billed at a separate rate from the rest of the home.
Due to the possibility of off-peak charging, this option potentially gives customers the lowest rates
for electric vehicle charging, but also involves more initial set-up cost and time33
.
San Diego Gas & Electric:
The California Public Utilities Commission (CPUC) and SDG&E have started a two-year ToU for EVs
pricing study for 1,000 SDG&E customers. The first 1,000 SDG&E customers who buy a Nissan LEAF
will receive free home charging equipment, courtesy of ECOtality, and will be able to take advantage of
lower electricity rates during off peak hours34
.
Pacific Gas and Electric Company (PG&E):
Mainly as a result of poor communication with utility customers, considerable backlash against time-of-
use billing and smart metering has been experienced in California as well. Some consumers feared their
utility bills would rise and others were simply disturbed by the abruptness that smart meters were
―imposed‖ upon them. To counter this backlash, the Silicon Valley Leadership Group, the City of San
Jose and PG&E partnered to create the ―Smart Grid Task Force‖. Members of this task force include
Oracle, Cisco, Nanosolar, Control4, Coulomb Technologies, Silver Spring Networks and OPower35
.
33 Southern California Edison Electric Vehicle Pricing Plan: http://www.sce.com/PowerandEnvironment/PEV/rate-
charging-options.htm (accessed 24 November 2010) 34 Tweed, K. (2010, June 24). San Diego Gas & Electric Approved for Time-of-Use EV Charging
Pilot. Greentechmedia. http://www.greentechmedia.com/articles/read/san-diego-gas-electric-approved-for-time-of-use-ev-charging-pilot/
(accessed 24 November 2010) 35 Fehrenbacher, K. (2010, June 25). Enter California‘s Smart Grid Task Force. Gigaom. http://gigaom.com/cleantech/enter-californias-smart-grid-task-force/ (accessed 24 November 2010)

SUGGESTED POLICIES FOR AUSTRALIA
Barriers to and Policy Solutions for EV Adoption in Australia • March 2011 89
E1/P9: EV cost reductions and fuel economy based fee at the time of vehicle purchase
Enticement / Pricing
CONTEXT
General Description:
Charging a fee to consumers based on the fuel economy of the vehicle at the time of purchase, otherwise
known as charging a feebate, will push the market towards vehicles that are more fuel-efficient36
.
Additionally, providing cost reductions or exemptions for EVs at the time of purchase, including sales
waiver, income tax reduction or cash back rebates, will pull the market towards greater uptake of EVs.
Together these policies could potentially offer a ‗budget neutral‘ strategy.
Need:
Most consumers have a poor understanding of the time value of money and typically demand very quick
payback periods. EV proliferation requires customers to perceive or understand (depending on the type
of customer) that EVs are cheaper, over the lifetime of the vehicle, than ICEVs37. While individuals have
purchased EVs in the past because of anticipated cost savings and desire to save money on gas38, 39 most
consumers focus on the upfront costs to purchase a vehicle rather than any potential on-going savings.
Since EVs are currently anticipated to have a greater upfront cost, as EVs become more widely available
consumers are likely to continue to opt to purchase ICEVs. A reduction in upfront cost should spur the
EV market. Additionally, several studies also suggest that the uptake of EVs is much more heavily
influenced by the cost of fuel rather than incentives.40, 41, 42 Therefore, instituting a fuel economy based
fee, e.g. artificially increasing the cost of fuel, can influence the EV market in a way similar to the
influences seen during market-driven spikes in petrol prices.
Barriers addressed:
The barriers primarily addressed via incentives and feebates at the time of purchase are the ‗payback gap‘
and ‗inefficient pricing‘. The payback gap refers to the fact that consumers need to perceive that
lifetime costs between EVs and ICEVs are comparable and that the discount rate for EVs is higher than
their average time-value of money. Inefficient pricing refers to unpriced ‗external costs‘, e.g. costs
resulting from the supply of the good, which are not recovered in the sale of the good. By providing a
fuel economy based fee, vehicles that emit a greater amount of greenhouse gases are penalised,
effectively incorporating the costs for carbon emissions. These costs, or revenue, can be used to
incentivise consumer purchasing of EVs that have less greenhouse gas emissions.
36 IInternational Energy Agency (IEA), 2001. Saving Oil and Reducing CO2 Emissions in Transport: Options and
Strategies. International Energy Agency and Organisation for Economic Cooperation and Development. France.
www.iea.org/textbase/nppdf/free/2000/savingoil2001.pdf (access 23 November 2010).
37 Hensley, R, Knupfer, S, Pinner, D, 2009. Electrifying cars: How three industries will evolve. McKinsey
Quarterly. No 3. Climate Change Special Initiative. Pp 88-96. 38 Heffner, R, Kurani, K, Turrentine, T, 2005. Effects of Vehicle Image in Gasoline-Hybrid Electric Vehicles. UC
Davis Institute for Transportation Studies, Davis.
39 McManus, W, Berman, B, 2005. 2005 O.S.A.T. – HybridCars.com Survey of Owners and Shoppers. University
of Michigan Transportation Research Institute.
40 Diamond, D, 2008a. The impact of government incentives for hybrid-electric vehicles: Evidence from US states,
Energy Policy, Volume 37, Issue 3, March 2009, Pages 972-983, ISSN 0301-4215.
41 Beresteanu, A, Li, S, 2008. Gasoline Prices, Government Support, and the Demand for Hybrid Vehicles in the
US. International Economic Review (forthcoming). 42 Chandra, A, Gulati, S, Kandlikar, M, 2010. Green drivers or free riders? An analysis of tax rebates for hybrid
vehicles. Journal of Environmental Economics and Management. 60 (2010) 78-93.

SUGGESTED POLICIES FOR AUSTRALIA
90 Barriers to and Policy Solutions for EV Adoption in Australia • March 2011
EXPECTED OUTCOMES
Upfront costs and on-going costs to consumer:
Incentives will decrease the upfront EV cost to the consumer, but the impact will depend on the level of
the incentive selected by state or federal government. The average range for tax rebates internationally
are:
<$2000 (e.g. Utah, South Carolina)
$2000 - $8000 (e.g. 5 Canadian provinces, US Government, 8 US States, Netherlands, Spain)
>$8000 (e.g. New Jersey, Belgium, Sweden).
Additionally, the EV consumer will have the added benefit of avoided feebate costs, which could range
from $1000 - $3000, to be more publically acceptable.
On-going costs will not be impacted.
Benefits in terms of convenience, decreased risk and appeal:
The decreased cost of EVs and increased cost of ICEVs will certainly increase the appeal of EVs. These
policies will not significantly impact on risk or convenience.
General outcomes for EV market:
Future work could quantify more accurate outcomes for the EV market, however several studies from the
US offer relevant insight into the potential magnitude of the outcomes as a result of these policies.
Gallagher and Muehlegger (2010) found that a tax incentive of US$1000 is associated with a 5% increase
in hybrid sales and when measured relative to model Manufacturer‘s Suggested Retail Price (MSRP),
increasing a tax incentive by 1% of a vehicle‘s MSRP is associated with a 1.2% increase in sales43
. In
relation to a feebate, a $100 increase in annual fuel savings is associated with a 13% increase in sales.
Additionally in the US, a 10% increase in petrol price has led to an 8.6% increase in per-capita sales of
hybrid vehicles. Interestingly, Gallagher and Muelegger (2010) also found that by increasing the
average petrol price in a state by 20% over a 6 year period (2001 – 2006, e.g. equal to an average fuel
economy savings from driving a hybrid of $85 per year), would increase hybrid sales an equivalent
amount to $330 sales tax waiver.
In Connecticut, a sales tax exemption for EVs lead to a increase in state market share of EVs, in
comparison to the US average market share (from -9% to +13%)44
.
Keeping in mind that the share of hybrid vehicle sales in Canada for 2005 was 0.35%, Chandra et al.
(2010) found that a $1000 increase in provincial sales tax rebate increases the market share of hybrid cars
by 31-38%.45
IMPLEMENTATION
Steps required to implement and level of government and potential department:
If the decision is made to offer incentives, providing them to consumers up-front will be a more efficient
use of government funds as up-front excise or sales tax waivers are more effective than delayed rebates
or tax credits in influencing adoption.46
A comparison of the income tax credit programs with rebate
43 Gallagher, K, Muehlegger, E., 2010. Giving green to get green? Incentives and consumer adoption of hybrid
vehicle technology. Journal of Environmental Economic Management. doi: 10.1016. 44 Diamond, 2008. 45 Chandra et al, 2010. 46 Diamond, 2008.

SUGGESTED POLICIES FOR AUSTRALIA
Barriers to and Policy Solutions for EV Adoption in Australia • March 2011 91
programs found that the rebate program needs less government revenue to achieve the same level of
average fuel-efficiency of new vehicles47
.
Gallagher and Muehlegger (2010)48
found that the form of incentives is as important a factor in
consumption adoption as incentive generosity. Specifically:
A sales tax waiver of mean value is associated with over three times the effect of an income tax
credit of mean value
Conditional on the value of the incentive, sales tax waivers have more than a ten-fold greater
impact on hybrid vehicle sales that income tax credits
A sales tax waiver equal to 1% of the retail price is associated with an 8.3% increase in sales—a
comparable income tax credit is associated with a 0.6% increase in retail sales.
Cost:
The cost to government to implement should be relatively low, as noted by workshop participants during
the Electric Driveway Policy Options workshop. Together these policies could potentially offer a
‗budget neutral‘ strategy.
Variants:
An alternative to a feebate on ICEVs would be an increase in the cost to register the vehicle. By
decoupling the feebate from the sale of the car, it may allow for greater flexibility in the size of the
feebate with less resistance from OEMs and dealerships. In this variant, the feebate would simply be
incorporated into the registration fees. Likewise, registration fees for EVs could be reduced or
eliminated.
Means testing incentives may also make for more fair policies and would potentially allow for greater
incentives for individuals with lower incomes. Arguably, consumers with lower incomes will also be
more affected by increases in fuel prices as they are likely to commute further and spend a larger portion
of their income on fuel and therefore will benefit more from using an EV.
RELATIONSHIP TO OTHER POLICY OPTIONS
As these policies are intended to significantly shift the sales and use of Electric Vehicles, it would be
prudent to link the development of these policies with F5 Connecting renewable energy targets to EV
sales and Green Registration Discounts.
If consumers had a Common Metric (I6) for comparing lifetime costs of all vehicles, the consumer would
understand and value the cost-savings offered by an EV, meaning the upfront incentive would not have to
be as high to motivate consumers past the current ‗sticker shock‘ of an EV.
OBSTACLES AND RISKS
One study has found that a one-standard deviation increase in per-capita income is associated with a 32%
increase in hybrid sales.49
The positive relationship between income and hybrid adoption suggests that
financial incentives may disproportionately benefit higher income consumers who are more likely to
purchase hybrids in the first place. Lower income consumers are less able to afford the higher up-front
47 Beresteanu, A, Li, S, 2008. 48 Gallagher, K, Muehlegger, E., 2010. 49 Gallagher, K, Muehlegger, E., 2010.

SUGGESTED POLICIES FOR AUSTRALIA
92 Barriers to and Policy Solutions for EV Adoption in Australia • March 2011
premium for a hybrid. Given the apparent weak or negligible effect of monetary incentives, this could
mean current monetary incentives for hybrids may be rewarding those who need the incentive the least
for a purchase they were likely to have made anyway.50
Resistance from other stakeholders will also
need to be considered, e.g. OEMs, car dealerships, low and mid-income consumers.
Dealers could potentially factor incentives into their pricing structure and charge consumers more for the
vehicle.
PRECEDENTS
National examples:
The main Australian example is the ACT Green Vehicles Duty Scheme. The Green Vehicles Duty
Scheme does not target EVs specifically, but provides an incentive for consumers to purchase
environmentally leading edge vehicles by subsidising stamp duty costs of low emission models. Similar
to the recommendations above of partnering an incentive and a fee-bate, the Scheme penalises poor
performing vehicles via an increase in stamp duty.
In the Scheme, vehicles are rated based on their carbon and air pollution emissions, which are collated by
the Commonwealth Government‘s Green Vehicle Guide (GVG). Vehicles with the top rating attract nil
stamp duty. Purchasers of a Toyota Prius for example, will save around $1122 (Department of Territory
and Municipal Services, 2008).51
Purchasers of vehicles in the lowest category face higher stamp duty
costs than what was incurred prior to the scheme.
The ACT Government argues incentivising better environmentally performing vehicles via stamp duty is
more appropriate at influencing consumer behaviour than a registration concession because the scheme
targets people at the time of vehicle purchase and does not adversely impact on lower income earners
more likely to own second hand, poorer performing vehicles.
Being tied to the Commonwealth‘s GVG, the scheme is also flexible in that it can accommodate PHEVs
and EVs as they become available. The GVG ratings are reviewed periodically. There is also potential for
the scheme to complement plans by EV services provider, Better Place Australia, to begin installing EV
recharging infrastructure in Canberra in 2011.
International case studies:
United States
Incentives: The US federal government offers US$7,500 as a tax credit for EV purchases and
infrastructure. In addition to this, there are over 30 other financial incentives across state and local
jurisdictions (funding, rebates, vouchers, bonuses, tax credits and reductions or exemptions on sales tax,
excise tax, vehicle license tax). To see the most current and comprehensive list visit, the US Energy
Efficiency and Renewable Energy‘s Alternative Fuels and Advanced Vehicles Data Center.52
Canada
Incentives: Five Canadian provinces offer sales tax rebates up to maximums of $2000 (4) and $3000 (1).
The Ontario Government offers are rebate of US $5,000 - $8,500.
50 Diamond, 2008. 51 Department of Territory and Municipal Services, 2008, Green Vehicles Stamp Duty Scheme,
www.tams.act.gov.au/move/green_vehicles_stamp_duty_scheme (accessed 8 September 2010) 52 US Energy Efficiency and Renewable Energy‘s Alternative Fuels and Advanced Vehicles Data Center:
www.afdc.energy.gov/afdc/laws/.

SUGGESTED POLICIES FOR AUSTRALIA
Barriers to and Policy Solutions for EV Adoption in Australia • March 2011 93
Europe
Incentives: National and regional governments of 15 EU member states have introduced incentives for
buying electric vehicles, consisting of tax reductions and exemptions, as well as bonus payments for the
buyers of electric vehicles, e.g. all western European countries with the exception of Italy and
Luxembourg. Three notable incentives are from Denmark, Belgium and the UK. EVs weighing less
than 2,000 kg are exempt from the Danish registration tax, which is based on the price of the vehicle.
This tax is calculated as follows: (105% x vehicle price up to DKK 79,000) + (180% x vehicle price
above DKK 79,000); e.g. a car costing DKK 80,000 would have a registration tax of DKK 144,000.
Belgium offers a personal income tax reduction of 30% (maximum of $9000 EUR). As from 2011,
purchasers of electric vehicles (including plug-in hybrids) will receive a discount of 25% of the vehicle‘s
list price up to a maximum of £ 5,000. The government has set aside £ 230m for this incentive
programme.
Feebate: Seventeen EU Member States levy CO2-related taxes on passenger cars. In Romania, electric
and hybrid cars are exempt from the special pollution tax, which is based on CO2 emissions, cylinder
capacity and compliance with Euro emission standards. UK exempts electric vehicles from the annual
circulation tax. This tax is based on CO2 emissions and all vehicles with emissions below 100 g/km are
exempt from it. In Sweden, hybrid vehicles with CO2 emissions of 120 g/km or less and electric cars
with an energy consumption of 37 kWh per 100 km or less are exempt from the annual circulation tax for
a period of five years from the date of their first registration. In Austria, cars emitting less than 120g/km
receive a maximum bonus of $300 EUR, and alternate fuel vehicles have an additional maximum bonus
of $500 EUR.
*For more detail on international examples of incentives, please see the summaries provided in the
Appendices of this report.

APPENDICES
94 Barriers to and Policy Solutions for EV Adoption in Australia • March 2011
APPENDICES
Appendix 1. Summary of Canadian Policies
Regulation - Canada
National Technical Standards
Canadian Standards Association (CSA) has standards for battery chargers related to general use
power supplies, as well as design and installation requirements for EV charging systems (e.g., CSA
C22.1 Section 17 and Section 86).
National Safety Standards
The Motor Vehicle Safety Act was amended in 2001 to require a series of crash tests to protect
occupants from the hazards that are unique to electric vehicles, e.g. electric shock, electrolyte spills
from batteries and the potential injury arising from the battery assembly entering the passenger
compartment (Canada Gazette, 2001). Electric passenger cars are required to meet the standards
required by the Motor Vehicle Safety Act that apply to all passenger cars.
National Regulation for Low Speed Vehicles
Different to the legal status of a passenger car, the Motor Vehicle Safety Regulations define Low-
Speed Vehicles as vehicles that:
Are designed for use primarily on streets where access of other classes of vehicles are
controlled
Travel on four wheels
That are entirely electric and travel up to 40 km/h
Have a gross vehicle weight rating of less than 1 361 kg.
In 2008, Transport Canada amended the legislation to add small trucks to the LSV class. Canada‘s
LSV class was created to allow companies to manufacture, import and sell these small, lightweight
limited purpose electric vehicles that could not meet the safety standards applied to larger and
heavier mainstream vehicles that operate on public roads. However the 2008 guideline also
recommended limiting LSV speeds to 40 km/h roads, which significantly impacts city use.
According to Transport Canada, such vehicles would instead be appropriate for university
campuses, parks, gated communities and military bases.
City Codes
In 2009, Vancouver passed requirement for charging ports in 20% of parking stalls in new multi-
family developments (Bailey and Morris, 2010). The outlets would be 240V – similar to those used
by household dryers or stove – and charge EVs about four times faster than standard 110V outlets.
The city expects the move will add 0.5 percent to the cost of an average building. Vancouver also
requires one and two-family dwellings to have plug-in vehicle charging capabilities.

APPENDICES
Barriers to and Policy Solutions for EV Adoption in Australia • March 2011 95
Targets - Canada
National Targets
The Government of Canada has a target to reach, by 2018, at least 500,000 highway-capable
plug-in electric-drive vehicles on Canadian roads, as well as what may be a larger number of
hybrid-electric vehicles. All these vehicles will have more Canadian content in parts and
manufacture than vehicles on the road in Canada in 2008 (GoC, 2010).
State Targets
Ontario is striving to have EVs represent 5% of the vehicles on the road in 2020.
Information - Canada
National Portals
Canada‘s Electric Vehicle Technology Roadmap has its own dedicated webpage with updates
on progress and upcoming workshops: www.evtrm.gc.ca
Transport Canada has an online Urban Transportation Emissions Calculator for estimating
annual emissions from personal, commercial and public transit vehicles.
National Education Programs
The ecoTechnology for Vehicles program, mentioned above, conducts outreach activities across
Canada in order to provide hands-on experiences and information about advanced vehicle
technologies, as well as circulates their Green Wheels newsletter.
Provincial Programs
With funding from Transport Canada, the Centre for Electric Vehicle Experimentation in
Quebec (CEVEQ) initiated and managed an Assessment of Low Speed Electric Vehicles in
Urban Communities, for which four EV manufacturers provided seven LSVs. The study was
used to gather public opinion on the risks related to using these vehicles in normal city traffic
(CEVEQ, 2002).
Arising policy suggestions included:
Authorize the use of LSVs in areas with 50 km/h and lower speed limits, except in areas
where actual known speeds are higher than authorized speeds (e.g., major arterial roads)
Have municipalities participate in each phase leading up to the government‘s possible
authorization of LSV use on municipal roads
Prepare a guide for municipalities to help them facilitate the introduction of LSVs in
municipal areas.
Facilitation - Canada
Federal Programs
Transport Canada‘s ecoTechnology for Vehicles (eTV) program works with manufacturers to
acquire and test and to address barriers to the introduction of new passenger vehicle
technologies in Canada. eTV‘s test results also inform the development of regulations, codes
and standards for EVs and PHEVs (TC, 2010): www.tc.gc.ca/eTV.

APPENDICES
96 Barriers to and Policy Solutions for EV Adoption in Australia • March 2011
Incentives – Canada
Provincial Sales Tax Rebates
Five Canadian provinces offer sales tax rebates up to maximums of $2,000 (4) and $3,000 (1).
The Ontario Government offers are rebate of US $5,000 - $8,500.
Pricing - Canada
Unknown
Coordination - Canada
Federal Coordination
The Canadian Electronic Vehicle Roadmap (evTRM) is led by industry and coordinated by a
federal government secretariat. The evTRM identifies critical gaps, requirements and
milestones needed to advance EVs in Canada. (GoC, 2010)

APPENDICES
Barriers to and Policy Solutions for EV Adoption in Australia • March 2011 97
Appendix 2. Summary of US Policies
Federal Regulation – United States
National Technical Standards
In the US, EV-related standards have been developed by UL since 1998, e.g. standards for EV
charging systems and related equipment. UL intends to release a new set of requirements for
large batteries in EV that will focus on the mitigation of the risk of fire, electrical hazards, and
enhancement of the overall safety of the EV (Anon, 2009 in Brown et al., 2010).
Importantly, the Society of Automotive Engineers (SAE) Standard J1772 standardizes the
connection between the EV and charging station, as well as 14 other standards.
The United States Advanced Battery Consortium (USABC) has begun formative work to
develop and establish standards for performance and abuse tolerance of ultracapacitors (UL,
2009 in Brown et al., 2010).
National Emissions Regulation
In 2010, the Environmental Protection Agency (EPA) developed CO2 tailpipe (exhaust)
standards for cars and light trucks. The standards require these vehicles to meet an estimated
combined average emissions level of 250 grams of carbon dioxide per mile, nearly 30% less
than the emissions produced by today‘s average new vehicle. Together, these standards will cut
greenhouse gas emissions by an estimated 960 million metric tons and 1.8 billion barrels of oil
over the lifetime of the vehicles sold under the program (model years 2012-2016) (EPA 2010).
To incentivize automakers to produce EVs and PHEVs, the EPA will count vehicle emissions as
zero grams per mile for plug-in electric vehicles when operating on grid electricity but the
agency is limiting this scoring to the first 200,000 vehicles produced by each manufacturer. For
automakers that produce 25,000 advanced technology vehicles in 2012, EPA will expand their
manufacturer production cap to 300,000. If a manufacturer exceeds their cumulative 200,000 or
300,000 vehicle production cap, the global warming emissions scoring for grid-electricity miles
for EVs and PHEVs will include the power plant emissions associated with the electricity
production and delivery to the vehicle.
National Vehicle Acquisition and Fuel Use Requirements
Federal fleets
Under the Energy Policy Act (EPAct) of 1992, 75% of new light-duty vehicles acquired by
certain federal fleets must be alternative fuel vehicles (AFVs), including hybrid electric
vehicles. Additionally, federal agencies with 20 vehicles or more in their U.S. fleet to decrease
petroleum consumption by 2% per year, relative to their Fiscal Year (FY) 2005 baseline,
through FY 2015. Agencies must also continue to increase their alternative fuel use by 10% per
year, relative to the previous year. Executive Order 13514, issued in October 2009, requires
federal agencies to establish reduction targets for greenhouse gas (GHG) emissions by FY 2020,
relative to a 2008 baseline. Reductions may be achieved through a variety of measures
including reduced petroleum consumption, use of AFVs, and fleet optimization efforts53
. (42
U.S. Code 13212, Executive Order 13423 (PDF 105 KB) and Executive Order 13514).
53
http://www1.eere.energy.gov/femp/about/fleet_mgmt.html

APPENDICES
98 Barriers to and Policy Solutions for EV Adoption in Australia • March 2011
Federal Regulation – United States
The U.S. Department of Defense (DOD) is required to exhibit a preference for the lease or
procurement of motor vehicles with electric or hybrid electric propulsion systems, including
plug-in hybrid systems. The Secretary of Defense must establish regulations to implement the
electric vehicle preference by October 28, 2010. (10 U.S. Code 2922g, and Public Law 111-84,
Section 2844)
State and Alternative Fuel Provider Fleets
Under the Energy Policy Act of 1992, certain state government and alternative fuel provider
fleets are required to acquire alternative fuel vehicles (AFVs). Compliance is required by fleets
that operate, lease, or control 50 or more light-duty vehicles within the U.S.
Battery Disposal Regulations
The US has federal regulations such as Resource Conservation and Recovery Act (RCRA) and
Characteristics of Hazardous Waste—Title 40 of Code of Federal Regulations (CFR) which
provides the basis for managing the disposal and recycling of battery wastes.
State Regulation – United States
Specifications for Electric Vehicle Compatibility
In California, new EVs and PHEVs must be equipped with a conductive charger inlet port that
meets the specifications contained in Society of Automotive Engineers (SAE) standard J1772 in
order to qualify for state rebates (California Code of Regulations Title 13, Section 1962.2).
Requirements Where to Install Charging Systems
The Oklahoma Department of Central Services Fleet Management Division may construct,
install, acquire, operate, and provide alternative fuelling infrastructure for state agencies and
local government use as well as the public in areas of the state where public access to
alternative fuel infrastructure is not readily available (Oklahoma Statutes 74-78v1).
Contingent upon funding, the Washington state must install electrical outlets suitable for
charging EVs in each of the state's fleet parking and maintenance facilities as well as every
state-operated highway rest stop by December 31, 2015. (Revised Code of Washington
43.01.250, 43.19.648, and 47.38.075)
State and local governments in Washington may lease land for installing, maintaining, and
operating EV charging stations or battery exchange stations for up to 50 years.
Also in Washington, certain jurisdictions must develop regulations to allow the use of EV
infrastructure and battery charging stations in all areas except critical areas or areas zoned for
residential or resource use. These regulations must be developed six months after the
Washington Department of Commerce distributes model ordinances, development regulations,
and guidance for local governments for site assessment and installing EV infrastructure, or by
July 1, 2010, whichever is later. Additionally, cities or municipalities may adopt incentive
programs to encourage retrofitting of existing structures capable of charging EVs (Revised
Code of Washington 35.63.126-35.63.127, 35A.63.107, 36.70.695, and 36.70A.695).
Requirements on How to Install Charging Systems
A multi-family residential dwelling or townhouse owner, in Hawaii, may install an EV charging

APPENDICES
Barriers to and Policy Solutions for EV Adoption in Australia • March 2011 99
State Regulation – United States
system at a parking stall at the dwelling as long as the system is in compliance with applicable
rules and the homeowner receives consent from the private entity if the system is placed in a
common area (Senate Bill 2231, 2010, and Hawaii Revised Statutes 196) (EERE, 2010).
Without requiring significant upgrades, EV infrastructure installed in Minnesota must: 1) be
able to be used by any make, model, or type of EV; 2) comply with state safety standards and
standards set by the Society of Automotive Engineers; and 3) be capable of bidirectional
charging once electrical utilities achieve a cost-effective ability to draw electricity from EVs
connected to the utility grid (Minnesota Statutes 325F.185).
Requirements When to Use Charging Systems
Publicly and privately owned EVs may be charged at Washington state office locations where
the vehicles are used for state business, commuter vehicles, or conducting business with the
state.
The Oklahoma Department of Central Services must discontinue public access to their fuelling
stations if a privately owned alternative fuelling station opens within a five-mile radius
(Oklahoma Statutes 74-78v1).
Oklahoma‘s Alternative Fuels Conversion Act requires all school and government vehicles
capable of operating on an alternative fuel to use the fuel whenever a fuelling station is located
within a five-mile radius of the respective department or district and the price of the alternative
fuel is cost competitive. If school and government vehicles must be fuelled outside the five-mile
radius and no fuelling station is reasonably available, the school and government vehicles are
exempt from this requirement.
Emissions Regulations
The California Low Carbon Fuel Standard (LCFS), overseen by the California Air Resources
Board (CARB) requires a 10% reduction in overall carbon intensity of transportation fuels in
the state by 2020.
California's Low Emission Vehicle II regulations specify maximum exhaust and GHG
emissions for LEVs, as well as amend the vehicle test procedures for zero-emission and hybrid
electric vehicle (California Code of Regulations Title 13, Section 1961-1961.1) (EERE, 2010).
As part of Colorado‘s GHG reduction goals, the Colorado Department of Public Health and
Environment (CDPHE) is directed to develop regulations to submit to its Air Quality Control
Commission that mandate reporting of GHG emissions from all major sources. CDPHE must
identify and evaluate the benefits and impediments to measures designed to reduce tailpipe
emissions, including the utility and availability of alternative fuel vehicles. Additionally,
CDPHE must develop a proposal for reducing net GHG emissions from the state‘s
transportation sector (Executive Order D004 08) (EERE, 2010).
Manufacturer Production Requirements
Manufacturers must produce and deliver for sale in California a minimum percentage of ZEVs
for each model year, e.g. 11% in 2010-2011; 16% in 2018 and on (California Code of
Regulations Title 13, Section 1962.1).
APPENDICES
100 Barriers to and Policy Solutions for EV Adoption in Australia • March 2011
State Regulation – United States
Government Acquisition Requirements
Between 2000-2006, four states had government EV purchasing requirements. Currently, 29
states have green fleet purchasing requirements. Notably, Hawaii‘s Alternative Fuel and
Advanced Vehicle Acquisition Requirements prioritises EV and PHEVs.
Arizona requires:
Federal fleets operating in certain Arizona counties to be comprised of at least 90%
alternative fuel vehicles
Certain local governments to develop and implement vehicle fleet plans. At least 75%
of the total government fleet must operate on alternate fuels
School districts with an average student population of more than 3,000 students to
ensure that 50% of the fleet operates on alternative fuels.
Under Oklahoma‘s Alternative Fuels Conversion Act, all school and government fleets may
convert their vehicles to operate on an alternative fuel, and all school districts should consider
only purchasing school vehicles, which have the capability to operate on an alternative fuel.
Requirements for Transportation Corporations
All buses purchased by the New Jersey Transit Corporation (NJTC) must be: 1) equipped with
improved pollution controls that reduce particulate emissions; or 2) powered by a fuel other
than conventional diesel. Qualifying vehicles include compressed natural gas vehicles, hybrid
electric vehicles, fuel cell vehicles, vehicles operating on biodiesel or ultra low sulphur fuel, or
vehicles operating on any other bus fuel approved by the U.S. Environmental Protection
Agency. If the NJTC is unable to meet the bus purchase requirement, a report must be submitted
to the New Jersey Senate and General Assembly detailing the reasons and an exemption may be
granted by the state legislature (New Jersey Statutes 27:1B-22).
Registration
In Arizona, a registered Alternate Fuel Vehicle must display an AFV license plate. In Iowa,
owner‘s who modify vehicles to use a different type of fuel are required to register the
conversion within 30 days (Iowa Code 321.116 and EERE, 2010).
Insurance
In Florida, insurance companies may not impose surcharges on EVs based on factors such as
new technology, passenger payload, weight-to-horsepower ratio, and the types of material used
to manufacture the vehicle, unless the Florida Office of Insurance Regulation receives actuarial
data that determines the surcharges are justified (Florida Statutes 627.06535 and EERE, 2010).
An insurer in Maine may credit or refund any portion of the premium charged for an insurance
policy on a clean fuel vehicle in order to encourage its policyholders to use clean fuel vehicles,
as long as insurance premiums on other vehicles are not increased to fund these credits or
refunds (Maine Revised Statutes Title 24-A, Section 2303-B).

APPENDICES
Barriers to and Policy Solutions for EV Adoption in Australia • March 2011 101
State Regulation – United States
EV Parking Spaces
In Arizona, an individual is not allowed to stop, stand, or park a motor vehicle within any
parking space specially designated for parking and charging EVs unless the motor vehicle is an
EV and has been issued an alternative fuel vehicle special plate or sticker.
All public, private, and government parking facilities in Hawaii with at least one hundred
parking spaces must designate at least 1% of the spaces specifically for EVs by December 31,
2011. The spaces designated for EVs will continue to increase by 1% for each additional 5,000
registered EVs until the percentage reaches 10%. (Hawaii Revised Statutes 226-10, 291-71, and
291-72) (EERE, 2010).
Provision of Authority for Requiring Energy Efficient Vehicles
When awarding a vehicle procurement contract, every city, county, and special district,
including school and community college districts, is authorized to require that 75% of the
passenger cars and/or light-duty trucks acquired be energy-efficient vehicles (California Public
Resources Code 25725-25726) (EERE, 2010).
Local Regulation – United States
Taxicab Acquisition Requirements
Chicago taxi companies with 50 or more vehicles in their fleet must operate at least one
alternative fuel taxi (City of Chicago Rules and Regulations for Taxicab Medallion License
Holders Rule 5.0) (EERE, 2010).
Targets – United States
National Target for Vehicles
US government intends to have one million EVs on the road by 2015 (Anon, 2009 in Brown et
al, 2010).
In 2007, the US Department of Energy issued the Replacement Fuel Goal, which is to replace
30% of the U.S. motor fuel consumption, via a domestic production capacity for replacement
fuels by 2030.
State Targets for EVs and EV Infrastructure
To help achieve Illinois‘ goal of reducing petroleum use by 20% by July 1, 2012, as compared
to 2008 levels, Illinois state agencies must work towards:
By 2015, at least 20% of new passenger vehicles purchased must be HEVs and 5%
must be BEVs
By 2025, at least 60% of new passenger vehicles purchased must be HEVs and 15%
must be BEVs (Executive Order 11, 2009).
By 2010, 100% of all light-duty vehicles for New York state agencies must be alternate fuel
vehicles, including EVs (Executive Order 9, 2008, Executive Order 142, 2005, and Executive
Order 111, 2001).
By 2018, Washington plans for each county to have 10% of public and private parking spaces

APPENDICES
102 Barriers to and Policy Solutions for EV Adoption in Australia • March 2011
ready for EV charging. Hawaii plans to build as many as 100,000 charging stations for EVs by
2012 (Hensley et al., 2009).
State Targets for Fuel
Minnesota required government agencies to reduce petrol by 50% and petroleum-based diesel
fuel by 25% by 2015 (Executive Orders 04-08 and 04-10, 2004, and Minnesota Statutes
16C.137).
The PennSecurity Fuels Initiative aims to replace 900 million gallons of the Commonwealth's
transportation fuels with alternative sources by 2020.
By 2015, all Washington state and local government agencies must use 100% biofuels or
electricity to operate all publicly owned vehicles. All state agencies must achieve 40% biofuel
or electricity use by 2013 (Revised Code of Washington 43.19.647-43.19.648).
The Wisconsin Department of Administration is directed to require, through its fleet
management policy, that all state agencies reduce the use of petroleum-based petrol in state-
owned vehicles by 20% by 2010 and 50% by 2015.
Information at a National Level – United States
Resources and Training
The Alternative Fuels and Advanced Vehicle Data Center summarizes laws, regulations and
funding opportunities by jurisdiction: www.afdc.energy.gov/afdc/laws
The US Commercial Service offers updated EV Developments and News on their Global
Automotive Team website: www.buyusa.gov/auto/evnews.html
Fire-fighters and first responders
A nation-wide Electric Vehicle Safety Training program helps fire-fighters and other first
responders prepare for the growing number of electric vehicles on the road in the United States.
The project, funded by a $4.4 million grant from the U.S. Department of Energy, and run by the
National Fire Protection Agency provides first responders with information they need to most
effectively deal with potential emergency situations involving electric vehicles:
www.evsafetytraining.org
Vehicle Labelling Requirements
Alternative fuel vehicles (AFVs) and fuel dispensers must be labelled with information to help
consumers make informed decisions about buying or fuelling a vehicle. All new and used
AFVs, including vehicles with an aftermarket conversion system installed, must be clearly
labelled with the vehicle‘s cruising range as estimated by the manufacturer, as well as other
descriptive information. The labelling requirements do not apply to HEVs. Electricity charging
stations must also be clearly labelled with the rating (16 CFR 306 and 309).
Greenhouse Gas Reporting Requirement
Beginning 2010, vehicle and engine manufacturers are required to report annual greenhouse gas
(GHG) emissions to the U.S. Environmental Protection Agency (EPA) (see EPA‘s Mandatory
Reporting of Greenhouse Gases Web site).

APPENDICES
Barriers to and Policy Solutions for EV Adoption in Australia • March 2011 103
Information at a State Level – United States
Information Networks
The New York State Clean Cities Sharing Network, which provides technical, policy, and
program information about AFVs, is managed by the New York State Energy Research and
Development Authority (NYSERDA). Members are notified about upcoming funding
opportunities and events. The Network publishes information about tax incentives, fuelling
stations, case studies, and contact information for the Clean Cities program and other industry
leaders. The Network also organizes and sponsors technical workshops.
State Reports
EV Impacts on Roadway Funding
Minnesota Department of Transportation conducted a study in 2009 that addressed, in part, the
impact that EVs might have on the current funding mechanisms for the state‘s roadways and
provided suggestions on how to mitigate any impacts.
EV Impacts on greenhouse gases
Minnesota: Minnesota Pollution Control Agency in 2007
Illinois: Argonne National Laboratory in 2009
Costs for Charging Infrastructure
Idaho National Engineering Laboratory in 2008
Monitoring Transport Fuel Trends
The California Energy Commission is required to prepare and provide an Integrated Energy
Policy Report to the governor on a biannual basis. The IEPR provides an overview of major
energy trends and issues facing the state, including those related to transportation fuels,
technologies, and infrastructure (California Public Resources Code 25302).
Information Dissemination Requirement
New motor vehicle dealers must make information about AFVs and Arizona-based incentives
for purchasing or leasing AFVs available to the public.
Training, Education and Manuals
Technicians
Oklahoma‘s Alternative Fuels Technician Certification Act regulates the training, testing, and
certification of technicians who install, modify, repair, or renovate equipment used in fuelling
alternative fuel vehicles and in the conversion of any engine to operate on an alternative fuel.
This includes EVs, EV charging infrastructure, and EV technicians (Oklahoma Statutes 74-
130.11 through 74-130.24).
The New York State Energy Research and Development Authority‘s (NYSERDA) Flexible
Technical (Flex-Tech) Assistance Program provides assistance to fleet managers who want to
evaluate the feasibility and cost of adding AFVs and fuelling facilities to their operations. Low-
cost training for vehicle mechanics is also available through certified institutions.

APPENDICES
104 Barriers to and Policy Solutions for EV Adoption in Australia • March 2011
Engineering students
As part of the Michigan Green Jobs Initiative, the Michigan Department of Energy, Labor and
Economic Growth is partnering with two universities to provide training of automotive
engineers for advanced vehicles through the Michigan Academy for Green Mobility. The
courses will be focused on developing engineering skills that apply to next-generation hybrid
and electric vehicles with an emphasis on battery design and hands-on learning.
General
The Iowa Department of Natural Resources conducts marketing and education outreach to
encourage the use of alternative fuel vehicles.
The State of Oregon has published an installation guide for installing EV charging stations.
Information at a City Level – United States
Los Angeles Department of Water and Power (LADWP) provides guidance on EV
infrastructure to help customers determine applications for EVs in their fleet operations, EV
maintenance services, and training.
Federal Facilitation – United States
In 2009, the US Department of Energy (DOE) awarded grants to 48 new advanced battery and
electric drive projects that will receive $2.4 billion in American Recovery and Reinvestment
Act (ARRA) funding. More than half of the funding went to companies in the state of Michigan.
State Facilitation – United States
Charging Infrastructure
The Alternative Fuelled Vehicles Program was developed within the New York State Office of
General Services to:
Assist New York State agencies, authorities, state universities and community colleges
in acquiring and utilizing alternative 104 fuelled vehicles
Satisfy federal and state requirements for purchasing such vehicles
Develop a comprehensive, conveniently accessible state-wide network of fuelling
stations to support the vehicles.
Upon agreement of standards for EVSE, Oregon will re-issue a request for proposal for building
a state-wide EV charging network (EERE, 2010).
Hawaii government is working with Better Place to roll out as many as 100,000 charging
stations by 2012.
The California government and local governments within California are working closely with
Coulomb Technologies, a company facilitating and installing electric vehicle (EV) charging
station infrastructure. The group organised a ―Plant a Station‖ campaign. Coulomb‘s website
has an easy way for consumers and businesses to suggest locations for ChargePoint®
Networked Charging Stations in their community to best serve the demand EV charging.
Additionally, Coulomb announced that their newly released ChargePoint App for the iPhone

APPENDICES
Barriers to and Policy Solutions for EV Adoption in Australia • March 2011 105
State Facilitation – United States
and iTouch has reached nearly 30,000 downloads. The free App locates ChargePoint Networked
Charging Stations for EV anywhere in North America, and displays in real time if a charging
station is currently available or in use. With the ChargePoint App, drivers can start and stop
charging sessions, be notified when their vehicle is fully charged, and get directions to stations
(Coulomb Technologies, 2010).
Purchasing Systems
A committee lead by the Operational Services Division and made up of other state and regional
agency representatives was tasked with studying the feasibility of developing and implementing
a system to facilitate the bulk purchase of AFVs by the Commonwealth and its political
subdivisions. The study should include the associated cost savings of a bulk purchase system, as
well as the cost of the system administration, the appropriate entities to participate in the
system, and the probability that the system would be utilized by these entities. The study results,
relevant recommendations for moving forward, and drafts of legislation necessary to put these
recommendations into effect should be presented to the Massachusetts legislature
(Massachusetts Session Law 169, 2008).
State-supported Industry Partnership
As part of a $5-million Michigan Energy Efficiency Grant Program, General Motors, Pacific
Northwest Laboratory, DTE Energy, Michigan Transportation Research Institute (UMTRI) and
others are studying the impact of PHEVs in Michigan.
The Minnesota Department of Commerce and the University of Minnesota are collaborating to
engage stakeholders on issues related to Smart Grid development in Minnesota. Michigan‘s
Public Service Commission established a smart grid collaborative, which is now studying
various aspects of PHEVs.
Oregon‘s largest utility Portland General Electric partnered with NEC Corporation to open the
US‘s first public-use, quick-charge station for electric vehicles. The Takasago Rapid Charging
Station can recharge electric vehicles with lithium-ion batteries to 80% of full strength in only
20- 30 minutes. The Governor of Oregon opened the charging station, in August 2010, by
charging an all-electric Nissan Leaf. Importantly, he reiterated, ―By making charging
convenient and available for public use, we are telling car manufacturers that Oregon is ready
for the next generation of electric vehicles – and we want our state to be a leader in introducing
these cars to the rest of the country‖ (EE News, 2010).
State-supported Academic Research
In 2009, $3 million of Ohio‘s technological innovation fund was granted to the Center For
Automotive Research (CAR) at The Ohio State University to develop electric vehicle
technology.
Resolutions
For Federal Action
The Nevada legislature recommends that the U.S. Congress enact legislation authorizing HEVs
to qualify for compliance under the Energy Policy Act of 1992 as a practical and economic way
to reduce emissions and lessen the use of foreign oil (Senate Joint Resolution 9, 2009).
APPENDICES
106 Barriers to and Policy Solutions for EV Adoption in Australia • March 2011
State Facilitation – United States
State Resolutions for Manufacturer Behaviour
The New Jersey Senate urges automobile manufacturers to use available technology to begin
manufacturing PHEVs for purchase and use by the general public, recognizing that the reliance
of PHEVs on electricity as the primary fuel source can reduce petrol consumption in the U.S.
(Senate Resolution 108, 2007)
The Commonwealth of Pennsylvania urges auto manufacturers to develop and produce PHEVs
for consumer use. (Reference House Resolution 106, 2007)
Federal Incentives for the Buyer – United States
Federal Income Tax Credit for Consumers
Following the National Energy Policy Report (2001), the U.S. government has been supporting
consumer purchase of hybrid vehicles via federal income tax deductions before 2006 and
federal income tax credits of $7,500 since then. Consumers who purchase residential fuelling
equipment may receive a tax credit of up to $2,000.
Federal Funds for Cities and State Agencies
In August 2009, DOE announced the recipients of $300 million in Clean Cities program
funding. These projects aim to speed the transformation of the nation‘s vehicle fleet, putting
more than 9,000 alternative fuel, electrified and energy efficient vehicles on the road,
establishing 542 refuelling locations across the country and displacing approximately 38 million
gallons of petroleum per year.
The Congestion Mitigation and Air Quality Improvement Program provides funding to state
departments of transportation (DOTs), municipal planning organizations (MPOs), and transit
agencies for projects and programs in air quality non-attainment and maintenance areas that
reduce transportation-related emissions. Eligible activities include travel demand management
strategies, development of alternative fuelling infrastructure, conversion of public fleet vehicles
to operate on cleaner fuels, and outreach activities that provide assistance to diesel equipment
and vehicle owners and operators regarding the purchase and installation of diesel retrofits.
State DOTs and MPOs must give priority to projects and programs to include diesel retrofits
and other cost-effective emissions reduction activities, and cost-effective congestion mitigation
activities that provide air quality benefits.
The Alternative Transportation in the Parks and Public Lands Program provides funding to
support public transportation projects in parks and on public lands. The goals of the program
include conservation of natural, historical, and cultural resources, and reduced congestion and
pollution. The Federal Transit Administration administers the program while partnering with the
Department of the Interior and the Forest Service to provide for technical assistance in
alternative transportation options. Eligible projects include capital and planning expenses for
alternative transportation systems such as clean fuel shuttle vehicles (49 U.S. Code 5320).

APPENDICES
Barriers to and Policy Solutions for EV Adoption in Australia • March 2011 107
State Incentives for the Buyer – United States
Tax Incentives
Income and Sales Tax
From 2000-2006, eight states eight states offered an income tax credit and four states waived
sales taxes on hybrid vehicle purchases.
Colorado currently offers income tax credits for vehicles that use or are converted to use an
alternative fuel. The tax credit is capped at $6000, but will increase the cap to $7,500 between
2012 and 2016 (House Bill 1331, 2009, and Colorado Revised Statutes 39-33-101 to 39-33-106)
(EERE, 2010).
Georgia offers a maximum income tax credit for 10% or $2,500 for Alternative Fuel Vehicles
and 20% or $5,000 for Zero Emission Vehicles (EERE, 2010). Others include:
Kansas: 50% credit for conversion costs, 50% for purchase costs
Maryland: maximum of 50% tax credit for the purchase of a PHEV
Montana: tax credit up to 50% for conversion
Oklahoma: 50% tax credit for purchasing or conversion
South Carolina: tax credit equal to 20% of the federal credit
Utah: tax credit of 35% or $2,500, whichever is less for purchasing and 50% credit for
converting, up to $2,500
Exemption of Registration Fees, Excise Tax and Annual License Tax
From 2000-2006, 4 states enacted registration or excise tax exemptions. Other current policies
include:
Arizona‘s initial annual vehicle license tax on an Alternative Fuel Vehicle is lower than
the tax on a conventional vehicle
Arkansas imposes excise taxes on alternative fuels based on a gasoline gallon
equivalent basis. DC offers exemptions for alternative fuel vehicles on excise tax
No county, city, village, town, or other political subdivision in Wisconsin is allowed to
levy or collect any excise, license, privilege, or occupational tax on motor vehicle fuel
or alternative fuels, or on the purchase, sale, handling, or consumption of motor vehicle
fuel or alternative fuels (Wisconsin Statutes 78.82)
Zero Emission Vehicles sold, rented or leased in New Jersey are exempt from state
sales and use tax.
Rebates
Illinois offers rebates up to $4,000 or 80% of the cost of purchasing or converting an
electric powered vehicle
In California, rebates are available through the Clean Vehicle Rebate Project for the
purchase or lease of qualified clean vehicles. The rebates offer up to $5,000 for light-
duty zero emission and plug-in hybrid vehicles and up to $20,000 for zero emission

APPENDICES
108 Barriers to and Policy Solutions for EV Adoption in Australia • March 2011
State Incentives for the Buyer – United States
commercial vehicles
The Colorado Department of Revenue offers a rebate for the purchase of an AFV, HEV,
or for the conversion of a vehicle to operate using an alternative fuel. Vehicles must be
owned by the State of Colorado, a political subdivision of the state, or a tax-exempt
organization, and be used in connection with the official activities of the entity. Each
qualified entity is limited to $350,000 per state fiscal year in total rebates paid
(Reference House Bill 1331, 2009, and Colorado Revised Statutes 39-33-101 through
39-33-106) (EERE, 2010)
New Jersey‘s rebate up to $12,000 for purchasing and conversions of EVs, and 50%
rebate for the cost of purchasing or installing infrastructure.
Fund, Grant and Loan Programs
The Illinois Alternative Fuel Vehicle Grant Program offers grants, up to $2,000 to counties,
cities, towns, townships, or school corporations to purchase OEM alternate fuel vehicles and for
the cost of conversions (Indiana Code 4-4-32.3) (EERE, 2010).
Maine‘s Transportation Efficiency Fund is a non-lapsing fund managed by the Department of
Transportation for zero-emission vehicles, biofuel and other alternative fuel vehicles,
congestion mitigation and air quality initiatives, rail, public transit, and car or van pooling
(Legislative Document 1786, 2010 and Maine Revised Statutes Title 23, Section 4210-E)
(EERE, 2010).
The Louisiana Department of Natural Resources administers the Alternative Fuel Vehicle
Revolving Loan Fund Program to provide loan assistance to local government entities for the
cost of converting conventional vehicles to operate on alternative fuels, or the incremental cost
of new AFVs (Senate Bill 103, 2010, and Louisiana Revised Statutes 33:1419.5-33:1419.10)
(EERE, 2010).
The Alternative and Renewable Fuel and Vehicle Technology Program, established by
Assembly Bill 118 and administered by the California Energy Commission, aims to increase the
use of alternative and renewable fuels and innovative technologies through grants and loans.
The Hawaii Department of Business, Economic Development, and Tourism established the
Hawaii Transportation Energy Transformation Grant Fund to provide grants through the
Transportation Energy Diversification Project for the acquisition of EVs, the installation of EV
charging infrastructure, and the development of innovative programs or the coordination of
activities that diversify transportation energy sources. The Department will review all
applications and will provide annual statistical information regarding program participation to
the governor and state legislature (Hawaii Revised Statutes 201) (EERE, 2010).
Others include:
In Florida, property owners may apply to their local government for funding to help finance
installations of EV charging equipment at their property or enter into a financing agreement
with the local government for the same purpose (House Bill 7179, 2010, and Florida
Statutes 163.08) (EERE, 2010)

APPENDICES
Barriers to and Policy Solutions for EV Adoption in Australia • March 2011 109
State Incentives for the Buyer – United States
Maine: Clean Fuel Vehicle Fund (grants and loans) administered by the Finance Authority
of Maine
Nebraska: The Dollar and Energy Saving Loan program (purchase and conversion of EVs
and purchase of charging station equipment) with a maximum loan up to $150,000 and
interest rate of 5% or less
New Hampshire: EV purchasing and infrastructure fund
New Mexico: acquisition loans, up to $3,000
New York: Clean City Challenge funds, which can be used to cost-share up to 75% of the
acquisition or infrastructure project
North Carolina: Loan program, where state and local government credit unions offer green
vehicle loans to purchase new HEVs. The loans are offered at a 1% interest rate discount as
compared to traditional new vehicle loan rates
Oklahoma: The Oklahoma Department of Central Services' Alternative Fuels Conversion
Loan program provides 0% interest loans to government fleets for converting vehicles to
operate on alternative fuels, the construction of AFV fuelling infrastructure, and the
incremental cost associated with the purchase of an original equipment manufacturer AFV.
The program provides up to $10,000 per converted or newly purchased AFV and up to
$150,000 for the development or installation of fuelling infrastructure (Oklahoma Statutes
74-130.4 and 74-130.5)
Oregon: credits up to $1,500 for the purchase of an HEV for residents and 35% tax credit
for businesses
Pennsylvania: financial assistance for HEVs and PHEVs
Texas: The Texas Emissions Reduction Plan provides grants for purchasing and converting
EVs
Utah: the Clean Fuels and Vehicle Technology Grant and Loan Program provides grants
and loans to businesses to cover costs associated with conversion and purchasing EVs.
Grants for fleets
Beginning in 2010, the Texas Commission on Environmental Quality will administer the Texas
Clean Fleet Program, which encourages owners of fleets containing diesel vehicles to
permanently remove the vehicles from the road and replace them with alternative fuel or hybrid
electric vehicles. Grants will be available to fleets to offset the incremental cost of such
replacement projects (Senate Bill 1759, 2009, and Texas Statutes, Health and Safety Code 391).
Vouchers for fleets
Through the Hybrid Truck and Bus Voucher Incentive Project (HVIP), the California Air
Resources Board provides vouchers to eligible fleets in order to reduce the incremental cost of
qualified medium- and heavy-duty hybrid electric vehicles at the time of purchase. Vouchers are
available on a first-come, first-served basis and range from $10,000 to $45,000.

APPENDICES
110 Barriers to and Policy Solutions for EV Adoption in Australia • March 2011
State Incentives for the Buyer – United States
Funds for buses
The Clean Fuelled Bus Program, administered by the New York State Energy Research and
Development Authority (NYSERDA), provides funds to state and local transit agencies,
municipalities, and schools for up to 100% of the incremental cost of purchasing new
alternative fuel buses and associated infrastructure (e.g. uses electricity as a primary motive
force) (EERE, 2010).
Access to High Occupancy Vehicle Lanes (HOV)
Five states allowed single-occupancy hybrid vehicles to drive in high-occupancy vehicle
(‗‗HOV‘‘) lanes. Currently there are nine.
Green Lanes
Phase Two of the Illinois Tollway Congestion-Relief Program (PDF 840 KB) includes a
Dedicated Green Lanes Plan that will provide access to qualified hybrid electric vehicles at
premium prices (EERE, 2010).
Vehicle Emission Test Exemptions
From 2000 – 2006, 3 states enacted vehicle emission test exemptions for hybrid vehicles.
Currently there are two.
Insurance for Loans
The Finance Authority of Maine may insure up to 100% of mortgage payments with respect to
mortgage loans for clean fuel vehicle projects (Maine Revised Statutes Title 10, Sections 1023-
K and 1026-A).
Parking Incentives
Arizona allows individuals driving Alternate Fuel Vehicles to park, without penalty in areas that
are designated for carpool operators.
State Exemptions for Driving Restrictions
In DC, certified clean fuel vehicles are exempt from time-of-day and day-of-week restrictions
and commercial vehicle bans (District of Columbia Code 50-702 and 50-714) (EERE, 2010).
Registration incentives
HEVs operating as taxicabs in Nevada may remain in operation for an additional 24 months
beyond the existing limits. Existing limits restrict vehicles used as taxicabs to operate for a
period of up to 67 months for new vehicles or 55 months for used vehicles with less than 30,000
miles on the odometer (Senate Bill 9, 2009, and Nevada Revised Statutes 706.8834).
Local Incentives for the Buyer – United States
Reduction of Fees and Charges
From 2000-2006, 13 cities enacted parking fee reduction or exemptions. The Los Angeles
Airport (LAX) offers free parking and charging for EVs in the lower/arrivals level of Parking
Structures 1 and 6.

APPENDICES
Barriers to and Policy Solutions for EV Adoption in Australia • March 2011 111
The Salt Lake City Department of Airports provides incentives to commercial ground
transportation providers who purchase and operate clean fuel vehicles that exclusively operate
on approved clean fuels, including electricity, or hybrid electric vehicles. The incentives are in
the form of a credit against ground transportation fees. Incentive credit amounts are $2,500 for
each original equipment manufacturer vehicle or certified vehicle converted to operate on an
alternative fuel.
Funds for Private Fleets
New York City‘s Private Fleet Alternative Fuel/Electric Vehicle Program will award funds up
to 50% of the purchase cost for light duty vehicles, 80% of the purchase or converting costs for
medium to heavy EVs, and 50% for EV charging stations.
Funds for Local Government
Congestion Mitigation and Air Quality program grants are available from the Houston-
Galveston Area Council for up to 75% of the incremental cost of purchasing EVs or
establishing publicly accessible alternative charging infrastructure (EERE, 2010).
Incentives Specifically for Infrastructure – United States
Federal Tax Credit for Infrastructure
A tax credit is available for the cost of installing alternative fuelling equipment, including,
electricity. The credit amount is up to 50% not to exceed $50,000. Fuelling station owners who
install qualified equipment at multiple sites are allowed to use the credit towards each location
(Public Law 111-5, Section 1123, and 26 U.S. Code 30C and 38B).
Electric Vehicle Charging Infrastructure Grants
San Francisco: The San Francisco Bay Area is to get $ 5 million to install 5000 electric vehicles
across the region. The funds from the Bay Area Air Quality Management District, the agency
responsible for air quality in the region, will support the development of 3000 home chargers,
2000 public chargers in car parks and at local companies and 50 fast charging stations near
highways. The programme is part of the region‘s ‗Spare the Air‘ initiative aimed at tackling air
pollution, over 50% of which comes from transport.
Colorado: grants are available to local governments for the installation of EV charging stations.
Grants are prioritized based on the local government's commitment to energy efficiency
(Reference Senate Bill 075, 2009 and Colorado Revised Statutes 24-38.5-102 and 24-38.5-103)
(EERE, 2010).
Alternative Fuel Infrastructure Tax Credits
The Colorado Department of Revenue offers an income tax credit for the cost of construction,
reconstruction, or acquisition of an alternative fuelling facility for motor vehicles. For an
alternative fuelling facility that will be generally accessible for use by the public or if at least
70% of the alternative fuel dispensed annually is derived from a renewable energy source for a
period of 10 years, the allowable credit increases. The credit has a maximum value of $400,000
(Colorado Revised Statutes 39-22-516) (EERE, 2010).

APPENDICES
112 Barriers to and Policy Solutions for EV Adoption in Australia • March 2011
In Georgia, an eligible business enterprise may claim an income tax credit for the purchase or
lease of qualified EVSE (maximum of 10% of the cost of the EVSE or $2,500) (EERE, 2010).
Others include:
Kansas: 50% tax credit on the construction costs of an alternative fuelling station
New York: 50% tax credit for the installation of infrastructure to charge electric
vehicles (New York Tax Law 187-b)
Oklahoma: 75% tax credit for the installation of electricity charging stations
Oregon: 50% tax credit for infrastructure projects.
Incentives for the Developer – United States
Federal Loans
DOE offered a conditional loan of $528.7 million to manufacturer Fisker Automotive for the
development of two versions of PHEVs with the intent of assembly line production beginning in
late 2012. DOE has also offered conditional loans of $1.6 billion to Nissan North America, Inc.
and $465 million to Tesla Motors.
Business Tax Credits
A taxpayer engaged in research and development of a qualified hybrid system that has the
primary purpose of propelling a motor vehicle may claim a tax credit under the Michigan
Business Tax equal to 3.9% of all wages or other payments. The maximum amount of credit
allowed for any one taxpayer is $2 million per tax year (Michigan Compiled Laws 208.1101-
208.1601).
Taxpayers certified by the Michigan NextEnergy Authority (MNEA) may claim a non-
refundable credit for tax liability attributable to research, development, or manufacturing of
qualified alternative fuel vehicles (AFVs) and renewable fuel. Additionally, businesses located
within the designated Alternative Energy Zone that are engaged in qualified activities may
claim a credit for the taxpayer's qualified payroll amount (Michigan Compiled Laws 207.821-
207.827 and 208.1429).
In Wisconsin, the Vehicle Battery and Engine Research Tax Credits provide automobile
developers with a tax credit equal to 10% of electric vehicle research costs.
Vermont: High-tech businesses involved exclusively in the design, development, and
manufacture of hybrid electric vehicles, electric vehicles are eligible for up to three of the
following tax credits: 1) payroll income tax credit; 2) qualified research and development
income tax credit; 3) export tax incentive; 4) small business investment tax credit; and 5) high-
tech growth tax credit (Vermont Statutes Title 32, Chapter 151, Section 5930a, c, f, g, and k).
Property Tax Exemptions
A tax exemption may apply to industrial property, which is used for, among other purposes,
high-technology activities, including electric and hybrid vehicles and their components. In order
to qualify for the tax exemptions, an industrial facility must obtain an exemption certificate for
the property from the State Tax Commission (Michigan Compiled Laws 207.552 and 207.803).

APPENDICES
Barriers to and Policy Solutions for EV Adoption in Australia • March 2011 113
Eligibility for Financing
Michigan‘s Local Development Financing Act allows qualified advanced vehicle research and
development projects to be eligible for financing. A municipality is authorized to create a local
development financing authority that may borrow against future tax increment financing to pay
for public infrastructure improvements that will attract economic development projects. The
Michigan Economic Development Corporation (MEDC) may designate all or part of a local
development financing authority district a ―certified alternative energy park‖ to attract
businesses engaged in alternative energy projects, including research and development of
alternative energy vehicles (Senate Bill 0428, 2009, and Michigan Compiled Laws 125.2152-
125.2162c) (EERE, 2010).
Federal Incentives for the Manufacturer – United States
Loans for Transforming Factories
Through the Advanced Technology Vehicles Manufacturing Loan Program, ATV and ATV
components manufacturers may be eligible for direct loans for up to 30% of the cost of re-
equipping, expanding, or establishing manufacturing facilities in the U.S. used to produce
qualified ATVs or ATV components, including EVs (Public Law 111-85, Section 312; Public
Law 110-140, Section 136; and 42 U.S. Code 17013).
In 2009, DOE announced a $5.9 billion Advanced Technology Vehicles Manufacturing
program loan to Ford Motor Company to transform factories across five states to produce more
fuel-efficient models, including plug-in electric vehicles.
State Incentives for the Manufacturer – United States
Business Tax Exemption or Credits
Manufacturers of traction battery packs for use in vehicles may be eligible for a tax credit from
the Michigan Economic Growth Authority. The amount of the credit is based on kilowatt hours
of battery capacity. Beginning on or after January 1, 2012, a manufacturer may claim a tax
credit of up to 75% of the qualified expenses for vehicle engineering to support battery
integration, prototyping, and launching. The same credit is available to a manufacturer that
increases its engineering activities for advanced automotive battery technologies. Taxpayers
that have received federal loan guarantees may claim a credit equal to 25% of the capital
investment expenses for the construction of a facility that will produce large-scale batteries and
manufacture integrated power management, smart control, and storage systems, if the project
creates at least 500 new jobs in the state (Senate Bill 777, 2009, and Michigan Compiled Laws
208.1434).
In South Carolina, manufacturing machinery and equipment purchased for use in manufacturing
batteries for hybrid electric vehicles may be reduced by 20% of the original cost. Qualified
facilities must invest at least $100 million in the project and create at least 200 new full-time
jobs with an average compensation level of 150% of the annual per capita income in South
Carolina or the county where the facility is located, whichever is less (House Bill 4478, 2010,
and South Carolina Code of Laws).
The Indiana Economic Development Corporation (IEDC) may award tax credits businesses for
the manufacture or assembly of alternate fuel vehicles in Indiana; up to 15% of the qualified

APPENDICES
114 Barriers to and Policy Solutions for EV Adoption in Australia • March 2011
investment (Indiana Code 6-3.1-31.9) (EERE, 2010).
Others include:
Louisiana‘s Green Jobs Tax Credit, including the advanced drive train vehicle industry
New Mexico‘s Alternative Energy Product Manufacturers Tax Credit, which provides a
maximum 5% credit of qualifying expenditures for manufacturing alternative energy
products, which include electric and hybrid electric vehicles (New Mexico Statutes 7-
9J)
Oklahoma‘s EV Manufacturing Tax Credit, up to $2000 credit per vehicle.
In Virginia, businesses involved with the manufacture of components for alternative
fuel vehicles (AFVs), AFV conversions, or the production, storage, or dispensing of
hydrogen as a vehicle fuel are eligible for a job creation tax credit for up to $700 per
full-time employee (Virginia Code 58.1-439.1).
Pricing – United States
Federal Policy
The U.S. General Services Administration (GSA) is required to allocate the incremental cost of
purchasing alternative fuel vehicles across the entire fleet of vehicles distributed by GSA. This
mandate also applies to other federal agencies that procure vehicles for federal fleets (Reference
42 U.S. Code 13212 (c)).
Utility Pricing
Many utilities offer tariffs specifically for EV, e.g.:
In 2009, Delaware became the first to allow EV owners to be eligible for a type of net
metering with their utility. Retail electricity customers with one or more grid-integrated
EVs will be credited in kilowatt-hours for energy discharged to the grid from the EV‘s
battery at the same rate that the customer pays to charge the battery (Senate Bill 153, 2009)
(EERE, 2010).
Minnesota‘s Great River Energy Off-Peak Charging Program provides rebates to charging
stations that provide off-peak (11pm-7am) electric vehicle charging
PG&E‘s Time-of-Use (ToU) Low Emission Vehicle rate, known as the ―E-9 rate‖
(Schedule E-9). The E-9 rate is mandatory for those customers that are currently on a
residential electric rate and who plan on refuelling an EV on their premises. The rate is as
low as 5 cents/kWh and as high as 28 cents/kWh depending on the time of day, day of the
week and time of year. The E-9 rate has two basic options, metering the whole house or just
the EV charger (Bailey and Morris, 2010)
The Sacramento Municipal Utility District (SMUD) offers a discounted rate of
approximately 50% as compared to the regular residential rate for electricity used by
residential customers to charge EVs. EV drivers must sign up for the appropriate residential
time-of-use rate. SMUD also offers lower off-peak time-of-use rates for EV charging by
commercial customers

APPENDICES
Barriers to and Policy Solutions for EV Adoption in Australia • March 2011 115
The Los Angeles Department of Water and Power (LADWP) offers a discounted rate of
$0.025/kWh for electricity used to charge EVs during off-peak times
In Michigan, the Detroit Edison utility is trialling two options of vehicle charging systems
for consumers: a $40/month/vehicle flat fee and a low rate for off-peak charging. Peak
hours are defined as falling between 9 a.m. and 11 p.m. on weekdays. The Michigan Public
Service Commission approved Detroit Edison‘s plan yesterday, making it the first company
in Michigan to develop a plan for EV charging. The rate system is designed as an
experiment to run through 2012. Most customers will need to equip their homes with a
second meter, to be dedicated specifically to vehicle charging. Detroit Edison will offer up
to $2,500 of funding per home to deter costs of the system (MPSC, 2010).
Coordination – United States
International Standards Coordination
The US and China have launched a joint US–China Electric Vehicles Initiative because joint
standards development for EV products and testing was identified as key to facilitating rapid
deployment of EVs in both countries (Anon, 2009 in Brown et al, 2010).
State Coordination Bodies
In Connecticut, the EV Infrastructure Council (Council) must coordinate interagency strategies
to prepare for the adoption of EVs, including establishing performance measures for meeting
infrastructure, funding, environmental, and regulatory goals, due September 1, 2010 (Executive
Order 34, 2009) (EERE, 2010).
The Alternate Fuels Commission was established within the Illinois Department of Commerce
and Economic Opportunity to identify and recommend strategies for implementing and
promoting the use of alternative fuels and alternative fuel vehicles. The Commission will also
identify ways to improve stakeholder communication and coordination regarding the research
and promotion of alternative fuels (House Bill 4245, 2009, and 415 Illinois Compiled Statutes
120/23) (EERE, 2010).
The Missouri Alternative Fuels Commission promotes the continued production and use of
alternative and renewable transportation fuels in Missouri. The commission submits a report
annually to the Governor and general assembly and provides recommendations on changes to
state law to facilitate the sale and distribution of alternative fuels and alternative fuel vehicles;
promote the development, sale, distribution, and consumption of alternative fuels; promote the
development and use of alternative fuel vehicles and technology that will enhance the use of
alternative and renewable transportation fuels; educate consumers about alternative fuels; and
develop a long-range plan for the state to reduce consumption of petroleum fuels (Missouri
Revised Statutes 414.420).
The Vermont Agency of Administration developed, and is responsible for overseeing the
implementation of, the State Agency Energy Plan. The Agency of Administration must modify
the Plan as necessary and readopt it on or before January 15 of each fifth year. As specified in
the 2010 Plan, the Vermont Agency of Transportation must continue to use 5% biodiesel (B5)
in its fleet of heavy-duty vehicles. The Vermont Department of Buildings and General Services

APPENDICES
116 Barriers to and Policy Solutions for EV Adoption in Australia • March 2011
Coordination – United States
must continue to use hybrid electric vehicles and Partial Zero Emission Vehicles in its fleet,
while adjusting purchases based on annual fleet selection monitoring and available vehicle
technology. All state agencies must investigate the use of additional alternative fuel and
advanced technology vehicles, as well as the necessary fuelling infrastructure, such as
incorporating electric vehicle supply equipment at appropriate state facilities. Additionally, the
Climate Neutral Working Group must expand education and tracking related to anti-idling
campaigns for state fleet vehicles and private sector vehicles operating on state owned property,
and conduct a survey to determine the level of government employee participating in
carpooling, vanpooling, and other commuting options (Vermont Statutes Title 3, Chapter 45,
Section 2291).
State Partnerships to Achieve Coordination
The Washington Department of Ecology must work with the Washington Departments of
Commerce and Transportation to assess whether California's low carbon fuel standard or other
state standards would help Washington meet its greenhouse gas emissions reduction target of
1990 levels by 2020. The Department of Transportation must also work in consultation with the
Departments of Ecology and Commerce and other interest groups to address low or zero
emission vehicles. Additionally, the Office of the Governor will work with state agencies to
seek funding to implement a project for the electrification of the West Coast interstate highway
and associated metropolitan centres and to purchase electric vehicles and install public fuelling
and/or charging infrastructure for electric and other high-efficiency, zero, or low carbon
vehicles (Executive Order 09-05, 2009).
In Washington, certain regional transportation planning organizations must collaborate with
state and local governments to promote EV use, invest in EV infrastructure, and seek funding
for these efforts. Collaborative planning efforts may include: 1) developing short- and long-term
plans outlining how state, regional, and local governments may construct EV charging locations
and ensure that the infrastructure can be electrically supported; 2) supporting public education
and training programs on EVs; 3) developing an implementation plan for counties to have 10%
of public and private parking spaces ready for EV charging by December 31, 2018; and 4)
developing model ordinances and guidance for local governments for site assessment and
installing EV infrastructure (Revised Code of Washington 47.80.090).
In an effort to promote best practices for public transportation services in Michigan, the
Michigan Department of Transportation is directed to coordinate with the Michigan Economic
Development Corporation to promote the transition of transit bus fleets to hybrid vehicles with
improved fuel economy (Reference Senate Bill 254, 2009).
The Southern California Regional Plug-in Electric Vehicle Plan is a collaboration between
cities, utilities, automakers and other key stakeholders who are working actively to support and
build the commercial launch or EVs.
State Roadmaps
A committee led by the Commissioner of Energy Resources and made up of other state and
regional agency representatives is required to develop a Massachusetts-wide plan for the
advancement of hybrid electric and alternative fuel vehicles. The plan should cover a 10 year
period, beginning in 2010, and take into account geographic diversity, demographics,

APPENDICES
Barriers to and Policy Solutions for EV Adoption in Australia • March 2011 117
Coordination – United States
transportation needs, infrastructure, and the current and emerging alternative fuel and advanced
vehicle technologies. Goals set forth in this plan may include the purchase of alternative fuel or
advanced vehicles and the production or distribution of alternative fuels. The plan should
include strategies and methods for achieving these goals (Massachusetts Session Law 169,
2008) (EERE, 2010).
The California Department of Transportation (Caltrans) is required to update the California
Transportation Plan by December 31, 2015, and every five years thereafter. The Plan must
address how the State will achieve maximum feasible emissions reductions, taking into
consideration the use of alternative fuels, new vehicle technology, and tailpipe emissions
reductions (Reference Senate Bill 391, 2009, and California Government Code 65071-65073)
(EERE, 2010).
Mayors of San Francisco, San Jose, and Oakland will follow a policy plan to develop and
expand the infrastructure needed to promote the use of EVs. Policy steps include: expediting the
permit and installation processes for charging outlets; providing incentives for employers and
other organizations who install charging infrastructure at the workplace and other parking
facilities; developing standard regulations governing EV infrastructure across the region; and
establishing programs to purchase EVs for use by city and state employees. The mayors will
work with other cities in the Bay Area as well as regional government organizations and private
sector partners (EERE, 2010).
State Joint Policy Evaluation
The California Public Utilities Commission (Commission), in consultation with the California
Energy Commission, California Air Resources Board, electrical corporations, and the motor
vehicle industry, must evaluate policies in an effort to develop infrastructure sufficient to
overcome any barriers to the widespread deployment and use of EVs and PHEVs. By July 1,
2011, the Commission is required to adopt rules to address the following (Senate Bill 626, 2009,
and California Public Utilities Code 740.2):
The impacts on electrical infrastructure and any infrastructure upgrades necessary for
widespread use of EVs and PHEVs, including the role and development of public
charging infrastructure
The impact of EVs and PHEVs on grid stability and the integration of renewable energy
resources
The technological advances necessary to ensure the widespread use of EVs and PHEVs
and what role the state should take to support the development of this technology
The existing code and permit requirements that will impact the widespread use of EVs
and PHEVs and any recommended changes to existing policies that may be a barrier to
the widespread use of EVs and PHEVs
Expand fuel infrastructure, fuelling stations, and equipment
The role the State should take to ensure that technologies employed in EVs and PHEVs
work harmoniously and across service territories
The impact of widespread use of EVs and PHEVs on achieving the state's greenhouse
gas emissions reductions goals and renewables portfolio standard program, and what

APPENDICES
118 Barriers to and Policy Solutions for EV Adoption in Australia • March 2011
Coordination – United States
steps should be taken to address the possibility of shifting emissions reductions
responsibilities from the transportation sector to the electrical industry.
Maine has adopted a policy to promote the development, implementation, availability and use
of smart grid technology, including integrating advanced electric storage and peak-reduction
technologies into the electric system through plug-in electric and hybrid electric vehicles
(Legislative Document 1535, 2010, and Maine Revised Statutes Title 35-A, Section 3143)
(EERE, 2010).
State Guidelines for EV Policy Development
The state of Montana encourages the use of alternative fuels and fuel blends to the extent that
doing so produces environmental and economic benefits to the citizens of Montana. The state
legislature recommends several guidelines for the development of a state alternative fuels
policy, including the following: 1) encourage the use of self-sufficient markets; 2) any state
alternative fuels program should have measurable benefits and state agencies must
communicate these benefits to the public; 3) state and local governments are encouraged to set
an example with their vehicle fleets by using alternative fuels and fuel blends (Montana Code
Annotated 90-4-1011).
State EV Definitions
EV infrastructure is defined as structures, machinery, and equipment necessary and integral to
support an EV, including battery charging stations, rapid charging stations, and battery
exchange stations. A battery charging station is defined as an electrical component assembly or
cluster of component assemblies designed specifically to charge batteries within an EV. A rapid
charging station is defined as an industrial grade electrical outlet that allows for faster
recharging of EV batteries through higher power levels. A battery exchange station is defined as
a fully automated facility that will enable an EV with a swappable battery to enter a drive lane
and exchange the depleted battery with a fully charged battery through a fully automated
process. Infrastructure must meet or exceed any applicable state building standards, codes, and
regulations (Revised Code of Washington 74.80.090).
State Resolutions
To achieve Hawaii‘s transportation efficiency goals and to create jobs, foster economic growth,
and reduce greenhouse gas emissions, the Hawaii Senate encourages the promotion of EV use
in the state. As a first step, EV charging infrastructure must be developed. Also, stakeholders
should work together to expedite the use of EVs in Hawaii. Additionally, the Hawaii House of
Representatives urges the Hawaii Clean Energy Initiative End-Use Efficiency Work Group to
address the challenges related to EV charging stations and access to electrical outlets to
facilitate the use of EVs and plug-in hybrid electric vehicles (House Concurrent Resolution 230,
2010, and Senate Concurrent Resolution 126, 2009) (EERE, 2010).
APPENDICES
Barriers to and Policy Solutions for EV Adoption in Australia • March 2011 119
Appendix 3. Summary of European Policies
Regulation - Europe
UN Technical Standards
Countries included in the UN Economic Commission for Europe (UNECE), including most
European Countries, will have new regulations imposed by the end of 2010 by the vehicle
regulatory body of the UNECE, the Vehicle Regulations and Transport Innovations Section.
New rules in these international safety standards were adopted at the World Forum for
Harmonization of Vehicle Regulations and include protections against electric shock, high
temperatures and gas exposure.
Enforced Union-wide Standards
Europe has also developed a range of EV-related standards, as published by the European
Committee for Electrotechnical Standardization (Brown et al, 2010). The EEC Directive
91/157 (batteries and accumulators containing certain dangerous substances) regulates the
disposal and management of EV batteries and is currently in revision (Brown et al, 2010).
The EU‘s Competitiveness Council declared that by mid-2011, EU standards for car-charging
interfaces will be finalised to ensure that EVs can be recharged anywhere within the EU, with
any model of charger. The Council argued that interoperability between EVs and the charging
infrastructure is crucial to winning consumers' acceptance and thus creating a mass market for
the new vehicles.
Emission Standards
The European Commission is legislating to force manufacturers to cut their average CO2
emissions by about one-quarter by 2012.
Exhaust Emission Standards
The European Union (EU) is setting new car fleet emissions targets of about 152 g/mile of CO2
by 2020.
Ban on petrol cars
In 2009, the Norwegian Finance Minister announce a plan to ban the sales petrol cars by 2015,
which would require carmakers to sell only vehicles that ran fully or partly on fuels such as
electricity, biofuels or hydrogen although the plan as not progressed since 2009.
In Firenze, Italy, cars running on petrol cannot enter the centre of the city, but electric cars can.
Targets - Europe
European Union Targets
The European Union have set their 2012 exhaust emission goals at 130 grams per kilometre.
Beyond this, the European Union is proposing even tougher standards of 80 g/km by 2020 and
60 g/km by 2025. To achieve this, the majority of the European light duty vehicle fleet will
have to be almost entirely electrically (including hydrogen fuel cells) or carbon-neutral biofuel-
powered. The EU is proposing serious fines for non-compliance, e.g. fining carmakers €95

APPENDICES
120 Barriers to and Policy Solutions for EV Adoption in Australia • March 2011
(US$120) per gram per model over the limit (EV World, 2010).
Country Targets
1. The Spanish government aims to have 1 million electric vehicles in Spain by 2014
2. France announces in October 2009 it will commit $2.2 billion to put 2 million electric
cars on the road by 2020
3. Ireland announced a goal to have 10% of all cars running on electricity by 2020.
City Targets
London expects to take the lead as the world‘s most electric vehicle friendly city with plans to
have 25,000 charge stations available by 2015 and 1 million electric vehicles in its fleet by
2015.
Information - Europe
Undetermined at this time.
Facilitation – Europe
Partnerships with Industry
In Portugal, the government has linked up with car-makers to further the use of electric cars by
investing in setting up electric charging stations across the country and in raising awareness of
the vehicle's benefits.
Britain is trying to persuade Japanese automaker Nissan to make its Sunderland plant the
European base for its new electric car the Leaf.
In Denmark, the Island of Bornholm is striving to replace all petrol cars with EVs as part of the
EDISON project. By using smart grid technology, an all-electric fleet will use V2G to allow
more turbines to be built and provide up to 50% of the island's supply. The project is run in
partnership with Danish Energy Association and Siemens and Dong.
Regional Partnership
France and Germany have started a cross-border electric vehicle pilot project in the Strasbourg-
Stuttgart region.
Research
The European Green Cars Initiative supports the development of sustainable forms of road
transport, including research on high density batteries, electric engines, and smart electricity
grids and their vehicle interfaces.
Incentives - Europe
Summary of Country Incentives for Consumers
National and regional governments of 15 EU member states have introduced incentives for
buying electric vehicles, consisting of tax reductions and exemptions, as well as bonus
payments for the buyers of electric vehicles, e.g. all western European countries with the
exception of Italy and Luxembourg.

APPENDICES
Barriers to and Policy Solutions for EV Adoption in Australia • March 2011 121
Incentives - Europe
Fuel Consumption Tax Reductions or Exemptions
Austria levies a fuel consumption tax on the first registration of a passenger car, equal to
2% of the purchase price multiplied by a factor of the fuel consumption in litres. EVs are
exempt from Austrian fuel consumption tax.
Monthly Vehicle Tax Exemption
Austria: EVs are exempt from a monthly vehicle tax.
Road Tax Exemption
EVs and other alternate fuel vehicles are exempt from road tax in the Czech Republic
Germany: EVs are exempt from annual circulation tax for five years
Sweden: Hybrid vehicles with CO2 emissions of 120 g/km or less and electric cars with an
energy consumption of 37 kWh per 100 km or less are exempt from the annual circulation
tax for a period of five years from the date of their first registration.
Registration Tax Reduction or Exemptions
EVs weighing less than 2,000 kg are exempt from the Danish registration tax, which is
based on the price of the vehicle. This tax is calculated as follows: (105% x vehicle price
up to DKK 79,000) + (180% x vehicle price above DKK 79,000); e.g. a car costing DKK
80,000 would have a registration tax of DKK 144,000
Greece: EVs and hybrids are exempt from registration tax
Portugal: Electric vehicles are totally exempt from the registration tax. Hybrid vehicles
benefit from a 50% reduction of the registration tax. This registration tax is based on engine
capacity and CO2 emissions
The Netherlands: Hybrid vehicles with an energy efficiency label A benefit from a
maximum reduction of EUR $6,400 of the registration tax. For hybrid vehicles with a B
label, the maximum bonus is EUR $3,200. The registration tax is based on price and CO2
emissions
Ireland: Electric and hybrid vehicles benefit from a reduction of maximum EUR $2,500 of
the registration tax.
Income Tax Reduction
Belgium: Personal income tax reduction of 30%, maximum of EUR $9,000.
Spain: 9 regional governments grant tax incentives of EUR $6,000 for EVs and EUR
$2,000 for hybrids. One regional government offers incentives up to 70% of the
investment.
Company Car Taxation
For electric and hybrid vehicles in Sweden, the taxable value of the car for the purposes of
company car taxation is reduced by 40% compared with the corresponding or comparable
petrol or diesel car. The maximum reduction of the taxable value is SEK 16,000 per year
UK: electric cars receive a five-year exemption from company car tax and electric vans a
five-year exemption from the van benefit charge (£3,000).
Congestion Tax Exemption
London provides EVs with exemptions for the congestion charge (savings of £8 a day). The
congestion tax in London imposes costs on conventional fossil-fuelled vehicles but does not

APPENDICES
122 Barriers to and Policy Solutions for EV Adoption in Australia • March 2011
Incentives - Europe
entirely remove them as an option.
Emission Rewards
In Austria, cars emitting less than 120g/km receive a maximum bonus of EUR $300, and
alternate fuel vehicles have an additional maximum bonus of EUR $500.
Emission Tax Reduction or Exemption
Seventeen EU Member States levy CO2-related taxes on passenger cars.
In Romania, electric and hybrid cars are exempt from the special pollution tax, which is
based on CO2 emissions, cylinder capacity and compliance with Euro emission standards
UK: Electric vehicles are exempt from the annual circulation tax. This tax is based on CO2
emissions and all vehicles with emissions below 100 g/km are exempt from it.
Bonuses and Discounts
Cyprus: A premium of EUR $700 is granted for the purchase of an EV
France: under a ―bonus-malus‖ system, a premium is granted for the purchase of a new car
when its CO2 emissions are 125 g/km or less. The maximum premium is EUR $5,000 for
vehicles emitting 60 g/km or less. The incentive cannot exceed 20% of the vehicle
purchase price. Hybrid vehicles emitting 135 g/km or less receive an incentive of EUR
$2,000
UK: As from 2011, purchasers of electric vehicles (including plug-in hybrids) will receive a
discount of 25% of the vehicle‘s list price up to a maximum of £5,000. The government has
set aside £230m for this incentive programme.
Free Parking
EV drivers receive free parking in downtown Copenhagen and London (savings on average
of £25 per day).
Infrastructure
In 2010, London‘s mayor confirmed up to £17 million (US$26 million) for electric vehicle
infrastructure.
EU Incentives for Manufacturers
EU policy allows manufacturers to gain ―super credits‖ for the sale of electric vehicles.
However, critiques point out that by allowing each EV sold to be counted 3.5 times as part of a
manufacturer‘s calculations towards their overall fleet limit, allows them to sell 3.5 high
emission cars with no effect on emissions targets.
Pricing - Europe
Seventeen EU Member States levy CO2-related taxes on passenger cars.
Coordination - Europe
The European Parliament resolution on EVs supports the Competitiveness Council‘s invite for
the Commission to set up an action plan for clean and energy efficient vehicles and calls on the

APPENDICES
Barriers to and Policy Solutions for EV Adoption in Australia • March 2011 123
Commission and Member States to establish ―the necessary conditions for the existence of a
single electric vehicle market‖. The resolution also:
(8) asks Member States gradually to replace their public services fleet of combustion
vehicles with electric vehicles, thus stimulating demand through public procurement;
calls on the EU institutions to roll out the infrastructure as soon as standards are in place
(11) is convinced that standardisation will enable a simple and straightforward approval
process and contribute to accelerating the market introduction and dissemination of low
carbon vehicles in the EU, enhancing the competitiveness of the EU mobility industry
through the reduction of development costs for manufacturers and the decarbonisation
of road transport.
The European Commission published their strategy for clean and energy-efficient vehicles in
April 2010.
In 2009, the Spanish Minister for Industry announced the Movele Plan (Electric Mobility Plan),
which subsidises the purchase of EVS up to 15-20% of its cost and for the immediate purchase
of 2,000 electric cars and installation of 500 charge points for the municipalities of Seville,
Barcelona and Madrid (IDAE, 2008).

APPENDICES
124 Barriers to and Policy Solutions for EV Adoption in Australia • March 2011
Appendix 4. Summary of Japanese Policies
Regulation - Japan
Enforced National Standards
Japan, being the world‘s predominant producer of hybrids and many battery technologies, has
established the Japanese Electric Vehicle Association, which in turn publishes a series of
standards specific to the EV (Brown et al., 2010).
Targets - Japan
Vehicle targets for general market
In 1991, the goal was then to have 200,000 BEVs on the road by the year 2000 (MITI, 1990 in
Ahman 2004). In 1997, the inclusion of HEVs can be seen in the light of the new CO2 reduction
target for 2008–2012 under the Kyoto protocol.
Japan maintains their commitment to develop the EV market. The Ministry of Economy, Trade
and Industry (METI) issued a goal, in 2010, for EVs to account for 50% of new car sales by
2020.
Vehicle targets for government fleets
Under the Environment Conservation Programme (1995), the Government announced that it
would replace 10% of their public vehicles with low emission vehicles (LEVs) by 2000 in a
procurement programme.
In 2001, the central Government took a new initiative to replace all vehicles used by
government with LEVs by the year 2004. Of these vehicles, 60% was expected to be HEVs,
according to the Environmental Ministry, which corresponds to roughly 4000 vehicles
(EVAAP, 2002 in Ahman, 2004). The rest will mainly be replaced by compressed natural gas
vehicles and some BEVs.
Prefecture goals
Kanagawa prefecture has a plan to ensure that there are 3000 EVs on local streets by fiscal year
2014 and aiming for 1,000 charging outlets of 100 and 200 volts within the prefecture by 2014.
Information - Japan
Undetermined at this time.
Facilitation - Japan
Research and Development
The Ministry of International Trade and Industry (MITI) has promoted BEVs since 1971,
launching a 5-year government-industry R&D programme. The MITI also funded company
R&D between 1978 and 1996 supporting leasing projects (MITI, 1990 in Ahman, 2004). The
idea of the MITI‘s R&D support is to create R&D consortia including companies from different
sectors and universities by adding a limited amount of government funding and strategic
guidance in line with the ―National Vision‘‘. The idea is to induce more company funded R&D
by this way and to stimulate inter-firm technology spill over (Ahman, 2004). In 1995 BEV field

APPENDICES
Barriers to and Policy Solutions for EV Adoption in Australia • March 2011 125
tests were launched by the MITI but these were replaced by several BEV-ITS programs starting
in 1998, demonstrating the feasibility of BEVs in combination with Intelligent Transportation
Systems (ITS). Research is also conducted under the same programme on lithium batteries
(through the organisation LIBES) since 1992. In 1997 the MITI initiated the Advanced Clean
Energy (ACE) vehicle programme. This is an R&D programme extending from 1997 to 2003
with the objective of developing different high-energy efficient hybrid vehicles.
The MITI funded programmes are usually long (>10 years) and divided into three phases
starting with (i) R&D on basic technologies, then (ii) demonstration and prototype, and the last
phase (iii) production and early deployment. All three phases receive government funding.
However, companies and other interested parties are expected to increase their share of
responsibility as the technology comes closer to commercialisation. Generally, the MITI funds
company research on technologies that are in the public interest with 100% funding at the early
stage of development and between 50 and 67% as the technology comes closer to
commercialisation. Standardisation projects receive 100% funding from the MITI (Daito, 2002
in Ahman, 2004).
Market Trials
Tsukuba City Solar-to-Electric Test is a partnership between government and auto
manufacturers to test cars that rely on solar electricity for the batteries, which will be rapidly-
charged at local FamilyMart stores.
Support for Infrastructure
The ECO-Station Project was initiated in 1993 with the aim of establishing 2000 fuelling
stations for clean-energy vehicles by the year 2000. Approximately 50% of these were intended
as BPEV charging stations (Hayashi et al., 1994 in Ahman, 2004). Quick-charging facilities for
BPEVs with night-time energy storage systems for load levelling were targeted (Ahman, 2004).
To facilitate the government‘s goals for EV sales, the government is spending US $135 million
in 2010 alone to build country-wide charging stations (Loveday, 2010a).
In mid-2010, Japan‘s METI began financing a three-month trial of a battery-swapping scheme
for EVs in partnership with Better Place and EV taxis in Tokyo, in 2010 (O‘Connor, 2010), the
first of its kind. The project includes the recharging and rapid battery replacement stations
developed by Better Place (Ben-Gedalyahu, 2010).
Battery facilitation
The MITI identified the battery as the crucial part in need of government support for the
successful introduction of BPEVs onto the market. The lithium battery project (LIBES) that
started in 1992 presented in 2001 a BPEV battery that meets most of the criteria set and that is
now ready for field tests.
Incentives - Japan

APPENDICES
126 Barriers to and Policy Solutions for EV Adoption in Australia • March 2011
Summary
From 1978 to 1996 the Japanese Electric Vehicle Association (JEVA) conducted various
leasing and purchasing incentive programmes. These programmes included relief from
commodity and acquisition tax in 1975 and 1976, leasing services directed towards private
enterprises, the collection of field data for further research, feasibility studies and subsidies to
local governments to buy BPEVs (Iguchi, 1992 in Ahman, 2004). In 1996, a BPEV Purchasing
Incentive Programme was introduced which replaced existing leasing and purchasing incentive
programmes that had been in operation since 1976. Fifty percent of the extra incremental
vehicle price was subsidized (Ahman, 2004). In 1998, the programme was integrated into the
Clean-Energy Vehicles Introduction Programme (CEV) together with other promotional
programmes for methanol-fuelled vehicles and CNG vehicles. Previous programmes for the
promotion of CEVs had been running since 1993 and primarily targeted infrastructure issues for
BPEVs, CNG and methanol-fuelled vehicles. The Clean Energy Vehicle Programme of 1998
had an improved budget and included for the first time HEVs.
National Subsidies
When it comes to direct market support, the Ministry of International Trade and Industry
(MITI) takes half of the financial risk of a new technology, e.g. subsidizes half of the extra cost
compared to a comparable ICEV (Daito, 2002 in Ahman, 2004).
Local funding
Local governments and other agencies can supply further funding within their area jurisdiction
(Ahman, 2004). One of the most generous prefectures in Japan is Kanagawa, which in March
2009 started providing a subsidy of about half that of the national government (i.e., ¥300,000).
This includes a range of measures to promote EVs, such as subsidies, lower taxes, plus reduced
parking fees and expressway tolls. The electric charging infrastructure will be further developed
with ―quick chargers‖ installed in 30 locations by 2010, aiming for 1,000 charging outlets of
100 and 200 volts within the prefecture by 2014.
Pricing - Japan
Undetermined at this time.
Coordination - Japan
National Plan
MITI established a basic market expansion and commercialisation plan for BPEVs in 1976 and
has since updated and reissued in 1983 and 1991 (Ahman, 2004). The comprehensive plan
sought to coordinate government agencies, companies and municipalities in their efforts to
expand BPEV and HEVs development. Barriers were identified and the relevant actors were
called upon to make efforts to remove these barriers through technical development, amending
laws and taxes, creating new standards and building a fuel infrastructure (Iguchi, 1992 in
Ahman, 2004). Market expansion plans present comprehensive plans for the development and
commercialisation of the targeted technologies. The plans include all the relevant actors
identified by the MITI, including industry, universities, local governments and government
agencies. The aim of these plans is to induce a common vision among the actors and coordinate
industry and government policy. The efforts and the process of the relevant actors are
coordinated and supervised by the MITI. Little formal pressure exists according to the MITI and

APPENDICES
Barriers to and Policy Solutions for EV Adoption in Australia • March 2011 127
the plan rests on a vision in which all actors, including the Government, are expected to play
their part (Watanabe, 2000 in Ahman, 2004).
The market expansion plans should also be seen in the context of the visions of the MITI for
Japanese industry, including strategic goals such as future competitiveness, as well as energy
and technology independence (Ahman, 2004). In 1996, the perceived market outlook was thus
bleak. Based on these reactions the marketing efforts for BPEVs shifted from R&D on
advanced batteries to finding applications (e.g. rental, sharing or ITS systems) where a state-of-
the-art BPEV can function rather than trying to force the technology to produce a vehicle with
features comparable to those of conventional vehicles.
Regional/local government plans
Larger prefecture governments (Tokyo, Chiba, Kanagawa, Osaka and Hyogo) laid out
aggressive market plans in 1993 for introducing BPEVs in order to reduce NOx emissions in
accordance with the Auto-NOx Law. The plans included a total number of almost 100,000
BPEVs and 170,000 LPGVs in the year 2000 (JEVA, 1998 in Ahman, 2004).

APPENDICES
128 Barriers to and Policy Solutions for EV Adoption in Australia • March 2011
Appendix 5. Summary of Chinese Policies
Regulation - China
Enforced National Standards
China appears to largely rely on adaptations of SAE standards for the EV (Brown et al, 2010).
Qualification of Manufactures
In 2007, China's National Development and Reform Commission implemented the
Administration Rules on Access to the Production of New Energy Vehicles, which was
administered by the New Energy Vehicle Expert Committee, in order to significantly streamline
the development of new energy vehicles. The New Energy Production Entrance Guidelines
regulate the qualifications of enterprises that are going to produce new energy vehicles or
components and requires that these enterprises to obtain the production permission from the
National Development and Reform Commission.
Targets - China
Federal Target for Industry
The government has made known its intent to position its auto manufacturing sector to be the
largest global producer of EVs (Bradsher, 2009 in Brown et al., 2010), with a goal of producing
half a million EVs by 2011 (Hensley et al., 2009).
Information - China
Undetermined at this time.
Facilitation - China
Infrastructure
China‘s State Grid is building charging facilities in at least three of the country‘s largest cities
by 2011.
Research and Development
Under the, China Auto Industry Rejuvenation Plan, the central government will appropriate
RMB 10 billion in a special fund to support technical innovation and renovation and
development of new energy vehicles and its spare parts by enterprises in the next three years.
Pilot Projects
In 2001, the Ministry of Science and Technology of China initiated the Electric Automotive
Projects. Enterprises, institutes and universities are all involved in key projects under the
support of local governments. In 2009, the Ministry of Finance and the Ministry of Science and
Technology jointly issued the "Circular on Carrying out Energy Conservation and New Energy
Vehicle Demonstration and Popularizing Pilot Programs" which listed thirteen China cities as
pilot cities for demonstration and popularization of energy conservation and new energy vehicle
development. The central government offered one-time fixed-amount subsidies for the
purchase of energy conservation and new energy vehicles in the pilot cities. It was reported that
each hybrid vehicle would receive up to RMB 50,000 in subsidies and electric cars would
receive RMB 60,000. The circular required the local governments to allocate funding for other

APPENDICES
Barriers to and Policy Solutions for EV Adoption in Australia • March 2011 129
relevant expenses including the construction of auxiliary facilities and the maintenance of the
new energy vehicles to guarantee the smooth operation of the pilot programs.
In order to promote the development and commercialization of new energy vehicles in China,
the Chinese Olympic Committee decided to use new energy buses and cars serving for Beijing
Olympic Games. The government purchase bid required 1,000 new energy vehicles.
Incentives - China
National subsidies
Under the China Auto Industry Rejuvenation Plan, subsidies from the central budget will be
appropriated to support the spread of new energy vehicles in large size and medium size cities.
China government will cover $8,800 of the cost of each EV purchased by large-city
governments and taxi fleets.
Local Government Discounts
Some cities in China are offering incentives for residents to buy cars locally. Shenzhen is
offering the discounts up to 60 percent of the car's value (RMB 50,000 when buying a hybrid
vehicle and RMB 60,000 if the vehicle is all-electric.) Chongqing city is also offering the
incentives of RMB 36,000 in subsidies and an exemption in the bridge tolls of RMB 7,000
when buying a locally-made Jiexun hybrid MPV, which costs RMB 140,000. The Shanghai
municipal government plans to offer up to a 20 percent one-time subsidy to people who buy the
new energy vehicles from 2010 through the end of 2011. The maximum compensation for a
passenger car will be RMB 60,000. The hybrid electric cars in China now can cost more than
RMB 250,000. (Zhang, et al., 2009).
Road Tax Exemptions
The buyers of hybrids, all-electric or fuel-cell vehicles will also get a break on some road taxes.
Registration incentives
Other promotional measures include easier registration.
Pricing - China
National Car Consumption Tax Rate
China's Auto Industry Rejuvenation Plan ensures the Car Consumption tax rate of 3.0L to 4.0L
vehicles will increase to 25% from 15%, and the tax rate of 4.0L and above vehicles will rise to
40% from the current 20% (Zhang, et al., 2009). In contrast, the consumption tax rate on
passenger vehicles with an engine size of 1 litre or lower will fall to 1% from the current 3%.
National Fuel Taxation Scheme
China‘s Auto Industry Rejuvenation Plan also raises the petrol tax from the current RMB 0.2
yuan per litre to RMB one yuan and the diesel tax from RMB 0.1 yuan per litre to RMB 0.8
yuan.

APPENDICES
130 Barriers to and Policy Solutions for EV Adoption in Australia • March 2011
Coordination - China
International Standards Coordination
The US and China have launched a joint US–China Electric Vehicles Initiative because joint
standards development for EV products and testing was identified as key to facilitating rapid
deployment of EVs in both countries (Anon, 2009 in Brown et al., 2010).
National Guidelines
―New Energy Vehicle Production Entrance Guideline‖ has been issued and actioned since 2007.
Aside from setting regulations, it defines and classifies new energy vehicles and ensures that all
new energy vehicle manufacturers and products are included in the ―Announcement of Vehicle
Manufacturers and Products‖ (Chen et al., 2008).

APPENDICES
Barriers to and Policy Solutions for EV Adoption in Australia • March 2011 131
Appendix 6. SUMMARY OF AUSTRALIAN INITIATIVES
6.1 Australian Green Car Innovation Fund
Part of the Commonwealth‘s New Car Plan for a Greener Future, the $1.3 billion Australian
Green Car Innovation Fund (GCIF) provides grants on a competitive basis to eligible Australian
companies, research organisations, industry associations and individual researchers to help
improve the environmental performance of the automotive industry54
. Specifically, the program
seeks to ―enhance the research and development and commercialisation of Australian
technologies that significantly reduce fuel consumption and/or greenhouse gas emissions of
passenger motor vehicles‖ 55
. Under the scheme, $1 of government funding is provided for
every $3 of the applicant‘s56
. The program is set to run for ten years.
Eligibility
Applicants fall under one of two funding streams. Stream A is limited to motor vehicle
producers (MVPs) registered under the Australian Government‘s Automotive Competitiveness
and Investment Scheme (ACIS) or the Automotive Transformation Scheme (ATS). MVPs can
apply for $5 million (minimum). However the cumulative total of grants must not exceed $300
million. Stream B is open to non-tax exempt companies incorporated under the Corporations
Act 2001, or consortia led by a non-tax exempt company. Stream B applicants may apply for
grants of $100,000 or more, with the cumulative total of grants not exceeding $100 million57
.
Successful applicant of both streams must meet the following key assessment criteria and
demonstrate an ability to fund the costs of the project not covered by the grant, in addition to
access to and rights in all intellectual property necessary to carry out and commercialise the
project:
Extent of the reduction in passenger motor vehicle fuel consumption and/or greenhouse
gas emissions
Technical merit, extent and calibre of innovation
Capacity and capability of applicant to undertake the project
Commercialisation potential
54
Department of Innovation, Industry, Science and Research, 2008b, Green Car Innovation
Fund: Framework Paper, Canberra 55
Department of Innovation, Industry, Science and Research, 2008, Customer Information
Guide, Canberra, accessed 15 September 2010 http://www.ausindustry.gov.au/Manufacturing/GreenCarInnovationFund/Documents/GCIF%20Customer%20Inform
ation%20Guide.pdf 56
Department of Innovation, Industry, Science and Research, 2008, Green Car Innovation
Fund: Fact Sheet, Canberra, accessed 15 September 2010 http://www.ausindustry.gov.au/Manufacturing/GreenCarInnovationFund/Documents/GCIF%20Fact%20Sheet.pdf 57
Department of Innovation, Industry, Science and Research, 2008, Green Car Innovation
Fund: Fact Sheet, Canberra, accessed 15 September 2010 http://www.ausindustry.gov.au/Manufacturing/GreenCarInnovationFund/Documents/GCIF%20Fact%20Sheet.pdf

APPENDICES
132 Barriers to and Policy Solutions for EV Adoption in Australia • March 2011
How the project will contribute to a sustainable and competitive Australian automotive
industry and the broader Australian economy.58
Projects can be up to three years in duration (four years in special circumstances). Table 0-1
summarises the eligible activities available for funding. Expenditure may include costs of
labour, contractors, plant and equipment (capped at 50%), acquisition and adaptation of new
leading-edge technologies (capped at 10%), prototypes, IP protection (capped at 10%),
collaborative costs and other eligible miscellaneous costs59
.
Table 0-1. Activities eligible for funding60
Activity Description
Research and
development
Systematic, investigative activities that involve innovation,
technology transfer into Australia or technical risk and result in new
knowledge or new improved materials, products, devices or services.
Proof of concept Work necessary to establish the commercial and technical viability of
a product or process.
Early stage
commercialisation
activities
Includes related product development (work undertaken to improve
the performance or reduce the cost of a product, process or service)
and IP protection and management.
Pre-production
development activities
Late stage activity generally focused on enabling a new product of
process to progress to production phase, e.g. retooling, technology
development, product testing, and demonstration and process
improvement. Does not include mass production of components.
6.2 Smart Grid, Smart City
Smart or intelligent grids provide the missing link between battery charging infrastructure and
EVs, and are therefore crucial to realising an EV and distributed energy future. Smart grids have
several advantages over conventional electricity grids. Using advanced communication, sensing
and metering infrastructure, smart grids can better manage energy loads and identify
infrastructure that requires maintenance. This enables more efficient energy distribution and
vastly improves the reliability of the electricity network. With this ‗intelligent‘ infrastructure,
smart grids are thus inherently capable of greatly improving the efficiency and reliability of the
electricity network by ―identifying and resolving faults, better managing voltage and identifying
infrastructure that requires maintenance‖61
. By design, smart grids can also aid consumers
58
Department of Innovation, Industry, Science and Research, 2008, Green Car Innovation
Fund: Fact Sheet, Canberra, accessed 15 September 2010 http://www.ausindustry.gov.au/Manufacturing/GreenCarInnovationFund/Documents/GCIF%20Fact%20Sheet.pdf 59
Department of Innovation, Industry, Science and Research, 2008, Green Car Innovation
Fund: Expenditure Guidelines, Canberra 60
Department of Innovation, Industry, Science and Research, 2008, Green Car Innovation
Fund: Expenditure Guidelines, Canberra 61
Department of Climate Change and Energy Efficiency, 2010, Smart Grid, Smart City,
accessed 8 Sep 2010 http://www.climatechange.gov.au/government/programs-and-
rebates/smartgrid.aspx

APPENDICES
Barriers to and Policy Solutions for EV Adoption in Australia • March 2011 133
manage their electricity consumption and, critical to the deployment of EV technology, ―enable
the use of energy efficient smart appliances that can be programmed to run on off-peak
power‖62
. As such, smart grids have the potential to coordinate the storage of renewable energy
in EVs.
In July 2010, the Australian government announced $100m in funding for the demonstration of
Australia‘s first commercial-scale smart grid in the Newcastle area, with parts of the trial also to
be conducted in Newington, Sydney CBD, Ku-ring-gai and Scone to reflect urban, suburban
and rural conditions and diverse network, geographic, climatic and customer characteristics63
.
The ‗Smart Grid, Smart City‘ project will be managed by the Department of Climate Change
and Energy Efficiency and aims to gather ―robust information about the costs and benefits of
smart grids‖64
. The objective of the program is to demonstrate the potential applications and
benefits of smart grids, and provide baseline data on network efficiency improvements and
behaviour change implicated with having more information about individual energy
consumption. For example, households and businesses participating in the trial will be able to
monitor real time electricity use through in-house displays.
The project will also involve an extensive EV trial, with two fleets of 10 to 20 vehicles to be
trialled in the Hunter region and by Sydney City Council. The consortium led by
EnergyAustralia which successfully won the Smart Grid Smart City bid includes EV recharging
infrastructure provider Better Place Australia, who will supply a trial EV recharging network as
part of the project65. The trial will explore V2G technology, including central systems to
manage large power loads when many EVs are charging simultaneously.
Targeted rollouts of smart grid and EV infrastructure such as in the Smart Grid Smart City
project will allow the community, the private sector and governments to ―gain early experience
with charge station infrastructure at a level of penetration required to encourage significant
adoption in a specific area. This will inform larger future rollouts‖.
62
Department of Climate Change and Energy Efficiency, 2010, Smart Grid, Smart City,
accessed 8 Sep 2010 http://www.climatechange.gov.au/government/programs-and-
rebates/smartgrid.aspx 63
Department of Climate Change and Energy Efficiency, 2010, Smart Grid, Smart City,
accessed 8 Sep 2010 http://www.climatechange.gov.au/government/programs-and-
rebates/smartgrid.aspx 64
Department of Climate Change and Energy Efficiency, 2010, Smart Grid, Smart City,
accessed 8 Sep 2010 http://www.climatechange.gov.au/government/programs-and-
rebates/smartgrid.aspx 65
Better Place Australia, 2010, Better Place Australia to supply EV infrastructure and services
for Smart Grid Smart Cities Project, June 9, 2010, accessed 14 September 2010
http://australia.betterplace.com/the-company-pressroom-pressreleases-detail/index/id/better-
place-australia-to-supply-ev-infrastructure-and-services-for-smart-grid-smart-cities-project

APPENDICES
134 Barriers to and Policy Solutions for EV Adoption in Australia • March 2011
6.3 Solar Cities
The Solar Cities program is a nine year $75 million Federal Government initiative aimed at
providing opportunities for realising the potential of solar power, energy efficiency, intelligent
grid and electric vehicle technology66
. The critical objectives of the program are to:
Demonstrate the economic and environmental impacts of integrating cost-reflective
pricing with the uptake of solar, energy efficiency and smart metering technologies,;
and
Identify and address barriers to distributed solar generation and electricity demand
management.67
Set to run until mid 2013, the program is administered by the Department of Climate Change
and Energy Efficiency, in partnership with local and state governments, industry, business and local communities.68 Funding has been allocated on competitive grounds. Between August
2006 and August 2008 the seven cities of Adelaide, Alice Springs, Blacktown, Central Victoria,
Moreland, Perth and Townsville were awarded funding under the scheme.
As the program involves the trailing of smart metering and development of distributed energy
infrastructure, its outcomes are inherently related to the future advancement and deployment of
EV technology. In the case of Adelaide, these technologies have been directly combined to
deliver Australia‘s first solar powered electric bus service (See Box 1).
66
Australian Greenhouse Office, http://www.climatechange.gov.au/government/programs-and-
rebates/solar-cities/~/media/publications/solar-cities/solar-cities-guidelines.ashx 67
http://www.climatechange.gov.au/government/programs-and-rebates/solar-
cities/~/media/publications/solar-cities/solar-cities-guidelines.ashx 68
Department of Climate Change and Energy Efficiency, 2010, About Solar Cities, accessed 8
Sep 2010 http://www.climatechange.gov.au/government/programs-and-rebates/solar-
cities/about.aspx

APPENDICES
Barriers to and Policy Solutions for EV Adoption in Australia • March 2011 135
Box 1. Tindo – Adelaide’s solar powered community bus
Jointly funded by the Federal Government under its Solar Cities program and Adelaide City
Council, a 50 kW solar photovoltaic (PV) system was installed on the roof of Adelaide
Central Bus Station. The PV system provides enough electricity to charge ‘Tindo’ –
Adelaide’s electric community bus launched in 2007. Tindo has a range of 200km between
recharging under typical urban conditions, is air-conditioned and has a capacity of 40
people. An additional fast charge station located outside the Central Bus Station provides a
range of 1km per one minute of charge.
The bus draws on solar energy stored in its 11 Zebra sodium/nickel chloride battery
modules and recycles wasted energy using regenerative braking to save up to 30% of
energy consumption. In its first year of operation, Tindo has saved over 14,000 litres of
diesel and 70,000 kg of CO2-e.
(Source: Adelaide City Council 2010). http://www.adelaidecitycouncil.com/adccwr/publications/guides_factsheets/tindo_fact_sheet.pdf
6.4 Victorian EV trial
In its State Transport Plan the Victorian Department of Transport outlined its support for
increasing the use of low emission vehicles and advancing EV technology. The Department has
now committed itself to the following projects:
1. A passenger EV trial
2. A scoping study into EV standards for Australia
3. A hybrid-electric bus trial
4. Complementary levers to facilitate the transition to EVs.
The State‘s broad policy and program objectives are outlined in Appendix Table 1 and the
above initiatives discussed in more detail below.

APPENDICES
136 Barriers to and Policy Solutions for EV Adoption in Australia • March 2011
Appendix Table 1. Policy Initiatives of the Victorian Government
Government
policy
Program Objective Activities
Encourage
the use of
low emission
vehicles
Identify market
development
barriers/enablers
Quantify life-cycle costs of a range of alternative fuel
vehicle technologies
Identify and facilitate development of investment risk
mitigation measures for end-users (insurance, service
network, disposal mechanisms)
Address information barriers
Identify regulatory barriers to EV adoption
Identify early adopter market segment and run pilot
programs in these areas, inc. tailored communication
strategies
Identify linkages with existing transport infrastructure
to address technological deficiencies
Design industry
development
framework for low
emission outcomes
Analyse energy supply infrastructure and design
renewable energy supply mechanisms
Apply life-cycle analysis to conventional transport and
EV technologies
Identify end of life disposal mechanisms for batteries
and other unique EV components
Address barriers to
industry
development; and
incentivise local
manufacture and/or
assembly of EV
technologies
Identify and address any regulatory impediments
Create a narrative for Vic around EV technology
Design a tailored/targeted communications campaign
Survey the range of applicable industry assistance
mechanisms
Create info provision mechanism to inform local
industry forward investment decisions
Include local content clause in procurement activities
Promote
innovation,
economic
development
and
employment
Create EV technology
(vehicles,
infrastructure)
innovation
opportunities
Build linkages between existing Vic Govt program
participants and researchers
Investigate local industry program participation
opportunities
Design policy
measures to promote
EV adoption
Analyse 'sweet-spots' and design tailored policy
measures to promote uptake
Promote
energy
security for
Understand the
effects, risks and
opportunities of
Benchmark the range of recharge infrastructure models
Investigate regulatory, metering implications for grid
energy exchange by entities, individuals

APPENDICES
Barriers to and Policy Solutions for EV Adoption in Australia • March 2011 137
Government
policy
Program Objective Activities
Victoria various recharge
infrastructure models
on existing energy
supply infrastructure
Investigate linkages into VRET/MRET and Green
Power
Information
provision
and
collection of
data
Ensure market
settings are most
appropriate to allow
collection of data
Develop better-informed drive cycle for Australian
conditions, based on driving in actual conditions
Passenger EV trial
The Victorian EV trial is the largest of its kinds currently underway in Australia, with $5
million over a five year period being allocated by the Victorian Government69
. The overall
objective of the program is to ―inform an easier and quicker transition to an environment where
Victorians increasingly opt for clean electric vehicles‖. The trial will provide an opportunity to
collect ‗real world‘ information on the use of EVs in Victorian conditions, including
identifying:
The market for EVs over time
How the use of EVs affects driver behaviour
Impacts of recharging, vehicle performance and efficiency, and
Implications for electricity consumption and demand management, greenhouse gas
emissions and air pollution. 70
The trial aims to replicate real world conditions as closely as possible and in doing so ―will
assess how a range of electricity providers will interact, reflecting the variety of providers likely
to develop in the market‖71
. Participants include:
Members of the public
Private and government fleets
Recharge infrastructure providers
Electricity suppliers, distributors and retailer, and
Technology providers to assist in data collection.
69
http://www.transport.vic.gov.au/web23/Home.nsf/AllDocs/246D50F44EB2272DCA2576A50015AE1E
?OpenDocument 70
http://www.transport.vic.gov.au/web23/Home.nsf/AllDocs/246D50F44EB2272DCA2576A50
015AE1E?OpenDocument 71
http://www.transport.vic.gov.au/web23/Home.nsf/AllDocs/246D50F44EB2272DCA2576A50
015AE1E?OpenDocument

APPENDICES
138 Barriers to and Policy Solutions for EV Adoption in Australia • March 2011
The Department of Transport will work with the Royal Automotive Club of Victoria (RACV) to
find 180 households to take part in the trial, with successful applicants being able to trial the car
for 3 months. Around 60 EVs (Mitsubishi i-MiEVs) will be rotated between different
households and various private and government fleets.
EV Standards Scoping Study
In 2009 the Victorian Government commissioned Standards Australia to undertake a scoping
study for EV standards in Australia72
. The findings of this study are outlined in Appendix Table
2. The 2010 final report recommends three priority areas for standards development in relation
in EVs in Australia:
Development of standards for aftermarket conversions to ensure EVs deliver the same
level of safety as original equipment manufacturer (OEM)
Development of standards for Level 2 recharging to ensure interoperability
Standards relating to the provision of vehicle user and GHG information (overcoming
market unfamiliarity, e.g. vehicle labelling and standardised information of relative
energy efficiency and GHG performance)73
.
The study also found a ―complete absence of a national industry dialogue addressing the key
issues associated with the introduction of electric vehicles in Australia‖. Consequently, the
report also recommends the need to maintain a comprehensive stakeholder dialogue that had
been initiated by the scoping study74
.
72
http://www.transport.vic.gov.au/web23/Home.nsf/AllDocs/67B55E26353FD96CCA257625001A5D52?
OpenDocument 73
http://www.standards.org.au/LinkClick.aspx?fileticket=32IAegzIvLk%3d&tabid=94&mid=423 74
http://www.standards.org.au/LinkClick.aspx?fileticket=32IAegzIvLk%3d&tabid=94&mid=423

APPENDICES
Barriers to and Policy Solutions for EV Adoption in Australia • March 2011 139
Appendix Table 2. Key strategic insights from the study, Electric Vehicle Standards in Australia, 201075
Issue Finding
EV transition timeframe Lack of consensus with respect to the likely development (nature and
timing) of the domestic EV market. Development of the domestic EV
market is likely to occur in three distinct stages:
Stage 1 – Market infancy
Stage 2 – Market establishment
Stage 3 – Market maturation
Standards approach Industry characterised by a high level of technology dynamism,
suggesting the use of performance-based standards over prescriptive
standards
Cost High cost of new OEM electric vehicles will likely create market
demand for aftermarket vehicles in the medium to short term
Emissions standards GHG performance will vary according to the GHG intensity of the
electricity supplied to the vehicle
Recharging and the
national electricity grid
Provision of feed-in (V2G) capability for recharging infrastructure may
create challenges and opportunities for the operation of the national
electricity grid
Home-based recharging May create challenges, most notably associated with the operation of
level II recharge systems
International
standardisation
Need to harmonise Australian vehicle standards with international
vehicle standards
Consumer operability New and unfamiliar operating paradigm for road users, the vehicle repair
industry and rescue authorities
HEV Bus Trial
The Victorian Government is currently trialling two hybrid-electric bus technologies. The
$750,000 project involves two HEV buses, using in series and parallel technologies76. The
purpose of the project is to identify barriers to investment in each technology and gain a
better understanding of vehicle performance under Victorian road conditions. A similar
trial is soon to begin in Queensland.
Complementing policies and programs
The Department of Transport has identified the following policies and programs designed to
directly or indirectly facilitate the uptake of EV technology in Victoria.
75
http://www.standards.org.au/LinkClick.aspx?fileticket=32IAegzIvLk%3d&tabid=94&mid=423 76
http://www3.transport.vic.gov.au/vtp/Videos/video32/index.html

APPENDICES
140 Barriers to and Policy Solutions for EV Adoption in Australia • March 2011
Appendix Table 3. Levers to facilitate the uptake of EVs in Victoria77
Domain Example policies, projects and initiatives as at March 2010
Land-use
planning
Melbourne@5million, Victorian Transport Plan
Identifies overarching land-use, transport network and employment planning
strategies to allow for systematic and targeted design of EV roll out.
Precinct Structure Plans (PSPs)
Promote sustainable transport options including EVs, among other
‗liveability‘ objectives.
Zero Emission Neighbourhood program
Grant program targeted at sustainable residential development including
consideration of EV technology options.
Transport
infrastructure
and vehicles
Transport Integration Act 2010
Integration of sustainability objectives into transport planning, thereby
encouraging preference of sustainable transport options such as EVs.
Smart Meter Roll-out
State-wide roll-out of smart meters. Commenced in September 2009 and to
be completed by the end of 2013. Smart meters are a key enabling
technology for EV adoption.
IPv6 Virtual Test Bed
An IPv6 Virtual Test Bed for use by EV technology suppliers in verifying
their latest ICT systems showcases leading edge product features and
establish advanced data management systems for development projects.
Government Fleet Target
Strategy to reduce GHG burden of government fleet. Preference for low
emission vehicles.
Industry
support/research
Automotive Australia 2020 vision project
Technology roadmap for the local automotive industry. EV technology has
been identified as a priority and an action plan will be delivered in 2010.
Victorian EV Trial / Nissan EV Memorandum of Understanding (MoU)
Memorandum of Understanding between Victorian Government and Nissan
to work collaboratively on investigating options for EV roll-out in Victoria
(e.g. Victorian EV Trial)
Education and
training
Victorian EV Trial
$5 million/5 year trial to provide baseline data on the potential EV market,
consumer behaviour, vehicle performance and market responses.
Hybrid-electric Bus Trial
Launched in June 2009, involves the trialling of two hybrid-electric buses
77
Department of Transport, 2010, Victoria’s role as Australia’s Electric Vehicle Capital,
accessed 14 September 2010, Victoria
http://www.transport.vic.gov.au/DOI/DOIElect.nsf/$UNIDS+for+Web+Display/D042623A7B2
E8F49CA2576EA001261C0/$FILE/Victoria_electric_vehicle_activities_2010.pdf
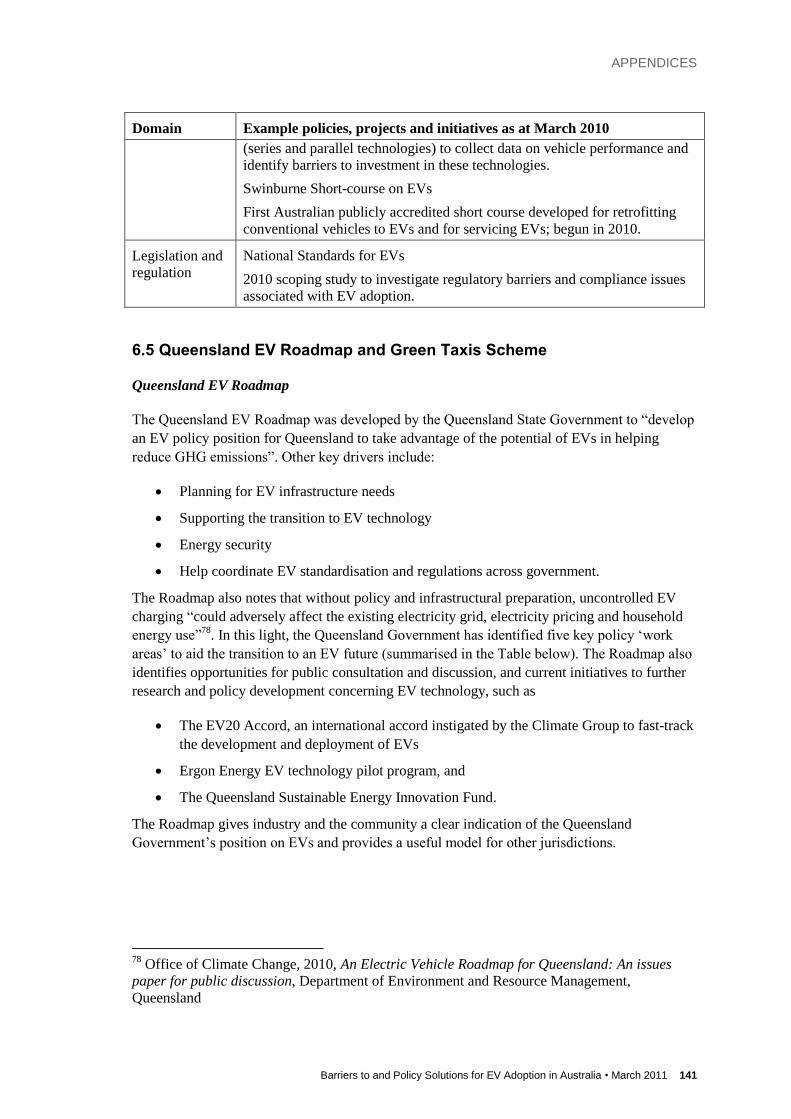
APPENDICES
Barriers to and Policy Solutions for EV Adoption in Australia • March 2011 141
Domain Example policies, projects and initiatives as at March 2010
(series and parallel technologies) to collect data on vehicle performance and
identify barriers to investment in these technologies.
Swinburne Short-course on EVs
First Australian publicly accredited short course developed for retrofitting
conventional vehicles to EVs and for servicing EVs; begun in 2010.
Legislation and
regulation
National Standards for EVs
2010 scoping study to investigate regulatory barriers and compliance issues
associated with EV adoption.
6.5 Queensland EV Roadmap and Green Taxis Scheme
Queensland EV Roadmap
The Queensland EV Roadmap was developed by the Queensland State Government to ―develop
an EV policy position for Queensland to take advantage of the potential of EVs in helping
reduce GHG emissions‖. Other key drivers include:
Planning for EV infrastructure needs
Supporting the transition to EV technology
Energy security
Help coordinate EV standardisation and regulations across government.
The Roadmap also notes that without policy and infrastructural preparation, uncontrolled EV
charging ―could adversely affect the existing electricity grid, electricity pricing and household
energy use‖78
. In this light, the Queensland Government has identified five key policy ‗work
areas‘ to aid the transition to an EV future (summarised in the Table below). The Roadmap also
identifies opportunities for public consultation and discussion, and current initiatives to further
research and policy development concerning EV technology, such as
The EV20 Accord, an international accord instigated by the Climate Group to fast-track
the development and deployment of EVs
Ergon Energy EV technology pilot program, and
The Queensland Sustainable Energy Innovation Fund.
The Roadmap gives industry and the community a clear indication of the Queensland
Government‘s position on EVs and provides a useful model for other jurisdictions.
78
Office of Climate Change, 2010, An Electric Vehicle Roadmap for Queensland: An issues
paper for public discussion, Department of Environment and Resource Management,
Queensland

APPENDICES
142 Barriers to and Policy Solutions for EV Adoption in Australia • March 2011
Appendix Table 4. Summary of policy work areas identified by the Queensland EV Roadmap
Policy work area Actions
Environmental and
resource impacts
Reduce GHG emissions from passenger transport
Ensure domestic energy security and preparing for the use of
alternatives to fossil fuels
Minimise environmental impacts of EV development, e.g. battery
recycling
Recharging and
electricity grid
impacts
Support electricity needs (reducing peak demand vulnerability)
Increase network efficiency
Maintain electricity affordability
Encourage deployment of intelligent systems to save costs over time
Standards, planning
and regulation
Maintain competiveness by offering consumers high quality, safe new
vehicles
Ensure motorist safety through education about the functionality of new
technologies
Prepare for new infrastructure systems through policy and in relation to
land-use planning
Consumer uptake
and behaviour
change
Develop strategies and policies to meet the needs of motorist behaviour
Understand motivations for EV adoption and about decisions made
about vehicle purchases
Raise awareness about benefits of alternative (cleaner) motoring (inc.
EVs)
Industry
development and
growth
Promote growth in sectors where enterprise strengths exist
Encourage growth in clean technology and renewable energy market
sectors
Queensland 15% Preference Rule for Green Taxis
The Queensland Government has introduced a 15% preference rule for taxis with a greenhouse
gas rating of 8 or above under the Commonwealth‘s Green Vehicle Guide (GVG) rating
scheme. Insofar preference has been for HEVs, primarily the Toyota Prius. The scheme was
introduced to target greenhouse gas emission reduction in the Queensland taxi fleet. On
average, a Queensland taxi will travel approximately nine times the distance travelled by the
average motorist79
. The industry is responsible for 100,000 tonnes of GHG emissions. Box 2
outlines how the scheme will work.
In the future, and with the appropriate level of infrastructure, green taxi policies such as the
Queensland scheme could be extended to include EVs.
79
Department of Transport and Main Roads, 2009, ‗Taxi Service Licence Tenders‘ – 15%
Preference Rule for Green Taxis‘, Passenger Transport Policy Determination, Queensland

APPENDICES
Barriers to and Policy Solutions for EV Adoption in Australia • March 2011 143
Box 2. 15% mark-up on tender bids (Queensland DOT, 2009)
Preference is given by applying a 15% mark-up on their tender bid, giving an advantage in
the tender process, e.g. Person A has a Green Vehicle and bids $280,000 while Person B
has a Regular Vehicle and bids $300,000. A bid from Person A would attract a 15% mark-
up on their bid which would increase their bid by $42,000 to $322,000, thereby making
Person A the highest bidder.
6.6 ACT Green Vehicles Duty Scheme
The Green Vehicles Duty Scheme does not target HEVs, PHEVs or EVs specifically, but
provides an incentive for consumers to purchase environmentally leading edge vehicles by
subsidising stamp duty costs of low emission models80
. It also works to discourage poor
performing vehicles by increasing stamp duty costs on these vehicles. New light vehicles are
given a Green Vehicle Rating of A, B, C or D, based on the vehicle‘s carbon dioxide and air
pollution emissions. This data is currently collated by the Commonwealth Government‘s for its
Green Vehicle Guide (GVG)—an online, regularly updated registry that allows consumers to
compare the environmental performance of vehicles.
Vehicles with an A rating attract nil stamp duty. Purchasers of a Toyota Prius for example, will
save around $112281
.This category includes current HEVs on the market, including the Prius,
Toyota Camry Hybrid, and the Lexus RX450h. However, it does not include all HEVs with the
Honda Civic hybrid falling within category B. Category B vehicles receive a reduced subsidy.
Stamp duty on category C vehicles generally remains unchanged, whilst purchasers of category
D vehicles face higher stamp duty costs than what was incurred prior to the scheme.
The ACT Government argues incentivising better environmentally performing vehicles via
stamp duty is more appropriate at influencing consumer behaviour than a registration
concession because the scheme targets people at the time of vehicle purchase and does not
adversely impact on lower income earners more likely to own second hand, poorer performing
vehicles.
Being tied to the Commonwealth‘s GVG, the scheme is also flexible in that it can accommodate
PHEVs and EVs as they become available. The GVG ratings are reviewed periodically82
. There
is also potential for the scheme to complement plans by EV services provider, Better Place
Australia, to begin installing EV recharging infrastructure in Canberra in 2011.
80
Department of Territory and Municipal Services, 2008, Green Vehicles Stamp Duty Scheme,
accessed 8 Sep 2010 http://www.tams.act.gov.au/move/green_vehicles_stamp_duty_scheme 81
ACT Government, 2008, 82
Real J, 2010, Reducing Vehicle Fuel Consumption and Emissions: An Australian Government
Perspective, Presentation to NRMA Alternative Fuel and Technology Sumitt, 3 March 2010,
Department of Infrastructure, Transport, Regional Development and Local Government,
Canberra

APPENDICES
144 Barriers to and Policy Solutions for EV Adoption in Australia • March 2011
6.7 UWA Australia Renewable Energy Vehicle (REV) Trial
Launched in March 2010 this 2 year trial will see 10 converted ICEVs-EVs incorporated into
the fleets of government agencies and key industry stakeholders83
. Funding is primarily
provided by the University of Western Australia (UWA) and the West Australian Department of
Planning and Infrastructure. Cash and in-kind support has also been sought from industry
sponsors84
.
The Perth EV trial is being conducted in conjunction with the first Australian fast-charging
network trial. A consortium led by UWA and Murdoch University received $229,000 in funding
under the Australian Research Council‘s Linkage grant scheme. The project will involve the
installation of 10 fast-recharge stations around Perth, with data collection via wireless 3G
broadband and from vehicles via black-box recorders85
.
The REV Trial includes a comprehensive research program, the objectives of which are outlined
in Box 3 below.
Box 3. WA EV Trial Objectives
Test realistic fleet usability, given distance, behavioural and range factors
Full comparative economic study electric vehicles versus fuel vehicles
Testing of the first integrated recharging network (smart grid/V2G elements) – generate
alternative infrastructure scenarios based on usability and economic analysis
Testing to what extent distributed high capacity recharging required and the potential
grid impacts thereof
Provide data points for initial findings on energy policy, transport regulation and
vehicle taxation
(Source: http://www.co2smart.com.au/)
83
http://www.co2smart.com.au/ 84
http://therevproject.com/ 85
http://www.news.uwa.edu.au/200911021834/media-statements/perth-get-electric-vehicle-
charging-stations-2010

REFERENCES
Barriers to and Policy Solutions for EV Adoption in Australia • March 2011 145
REFERENCES
A123, 2010a. Products. Accessed 13 October 2010:
http://www.a123systems.com/a123/products
A123, 2010b. A123 Systems Opens the Largest Lithium Ion Automotive Battery Manufacturing
Plant in North America. Accessed 13 October 2010:
http://ir.a123systems.com/releasedetail.cfm?ReleaseID=506787
ACEA, 2010a. An Increasing Number of Member States Levy CO2-based Taxation or
Incentivise Electric Vehicles. European Automobile Manufacturers‘ Association. Accessed 13
September 2010:
www.acea.be/index.php/news/news_detail/an_increasing_number_of_member_states_levy_co2
_based_taxation_or_incentivis/
ACEA, 2010b. Electric Vehicles: Turning Buzz into Reality. Opportunity for further EU
leadership in engineering and competence. European Automobile Manufacturers‘ Association.
Accessed 13 September 2010:
www.acea.be/index.php/news/news_detail/electric_vehicles_turning_buzz_into_reality/
Ahman, M, 2004. Government policy and the development of electric vehicles in Japan, Energy
Policy, Volume 34, Issue 4, March 2006, Pages 433-443, ISSN 0301-4215, DOI:
10.1016/j.enpol.2004.06.011.
Albrecht, A, Holyoak, N, Pudney, P, Raicu, R, Taylor, M, Zito, R & Groves, J, 2009a.
Emissions Analysis of Electric Vehicle Use. Report prepared for the CRC for Advanced
Automotive Technologies.
Albrecht, A, Holyoak, N, Pudney, P, Raicu, R, Taylor, M, Zito, R & Groves, J, 2009b. Uptake
and Use of Electric Vehicles in Australia. Report prepared for the CRC for Advanced
Automotive Technologies.
Automotive Australia, 2010 (AA2010). Automotive Australia 2020 Technology Roadmap.
Accessed December 11 2010:
http://www.autocrc.com/files/Image/2009/AA2020TechnologyRoadmap.pdf
Australian Government, 2010. Alternative and renewable fuels. Department of Sustainability,
Environment, Water, Population and Communities. Accessed 15 December 2010:
www.environment.gov.au/atmosphere/fuelquality/emerging/alternative/index.html
Bailey, J, Morris, D. Electric Vehicle Policy for the Midwest – A scoping document. Prepared
for the RE-AMP Network by New Rules Project. Dec 2009.
Barry K, 2010. ―Sanyo EV Travels 624 Miles on One Charge‖, Autopia, Wired Magazine.
Accessed 22 September 2010: www.wired.com/autopia/2010/05/sanyo-ev-travels-624-miles-
on-a-single-charge

REFERENCES
146 Barriers to and Policy Solutions for EV Adoption in Australia • March 2011
Beauregard, G, 2008. Report of Investigation: Hybrids Plus Plug In Hybrid Vehicle. Prepared
for the National Rural Electric Cooperative Association and US DOE, Idaho National Labratory
by eTec.
Ben-Gedalyahu, D, 2010. Better Place unveils Tokyo electric car project. Accessed 22
September 2010: https://www.buyusa.gov/auto/evnews.html
Beresteanu, A, Li, S, 2008. Gasoline Prices, Government Support, and the Demand for Hybrid
Vehicles in the US. International Economic Review (forthcoming).
Better Place, 2010. Better Place Launches Switchable-Battery Electric Tax Project in Tokyo.
Better Place Press Releases. Accessed 13 October 2010: http://www.betterplace.com/the-
company-pressroom-pressreleases-detail/index/id/tokyo-electric-taxi-project
Bracks, S, 2008, Review of Australia‘s automotive industry. Technical report.
Brown, S, Pyke, D, Steenhof, P, 2010. Electric vehicles: The role and importance of standards
in an emerging market, Energy Policy, Volume 38, Issue 7, Pages 3797-3806
BYD, 2010. E6 Specifications. Accessed 13 October 2010:
www.byd.com/showroom.php?car=e6&index=6
Calef, D, Goble, R, 2007. The allure of technology: how France and California promoted
electric and hybrid vehicles to reduce air pollution. Policy Sciences 40, 1–34.
Canada Gazette, 2001. Motor Vehicle Safety Act: Regulations Amending the Motor Vehicle
Safety Regulations (Electrolyte Spillage and Electrical Shock Protection). Accessed 4 March
2011: http://canadagazette.gc.ca/archives/p2/2001/2001-11-21/html/sor-dors486-eng.html
Centre for Electric Vehicle Experimentation in Quebec, 2002. Assessment of low-speed
electric vehicles in urban communities: pilot project. Accessed 13 September 2010.
www.tc.gc.ca/eng/innovation/tdc-projects-road-i-5138-586.htm
Chandra, A, Gulati, S, Kandlikar, M, 2010. Green drivers or free riders? An analysis of tax
rebates for hybrid vehicles. Journal of Environmental Economics and Management. 60 (2010)
78-93.
Chen, H, Jin, J, Chen, J, 2008. Catching up in New Energy Vehicle Industry: Review of its
Development and Policies in China. Management of Innovation and Technology, 2008. ICMIT
2008. 4th IEEE International Conference.
Coulomb Technologies, 2010. Coulomb Technologies Announces Plant a Station Campaign.
Accessed 22 September 2010: http://www.coulombtech.com/pr/news-press-releases-2010-
0422.php
CNW Marketing Research, ―Dust to Dust Automotive Energy Report‖, 2007,
http://cnwmr.com/nss-folder/automotiveenergy/DUST%20PDF%20VERSION.pdf accessed 22
Sep 2010.

REFERENCES
Barriers to and Policy Solutions for EV Adoption in Australia • March 2011 147
Department of Territory and Municipal Services, 2008. ACT Government Green Vehicles Duty
Scheme: Green Vehicles come in many shapes and sizes. Produced for the ACT Government.
Diamond, D, 2008a. The impact of government incentives for hybrid-electric vehicles:
Evidence from US states, Energy Policy, Volume 37, Issue 3, March 2009, Pages 972-983,
ISSN 0301-4215.
Diamond, D, 2008b. The impact of HOV lane incentives for hybrids in Virginia. Journal of
Public Transportation 11 (4), 57–76.
Diesendorf, M, Lamb D, Matthews J & Pearman G, 2008. A roadmap for alternative fuels in
Australia: Ending our dependence on oil. Technical report, NRMA Motoring and Services.
Dow Kokam, 2010. A Better Battery – Patented Technology, Precision Manufacturing and
Ingenious Design. Accessed 13 October 2010: http://www.dowkokam.com/technology.htm
Dunstan, C, Daly, J, 2009. Institutional Barriers to Intelligent Grid: Working Paper 4.1. CSIRO
Intelligent Grid Research Program by the Institute for Sustainable Futures, University of
Technology Sydney.
Dunstan C, Langham E & Ison N, 2009. 20 Policy Options for Developing Distributed Energy:
Working Paper 4.2, Ver. 1. CSIRO Intelligent Grid Research Program by the Institute for
Sustainable Futures, University of Technology Sydney.
Electric Drive Transportation Association (EDTA), 2009. The Electric Drive Road Map for
Energy Security.
Energy Efficiency and Renewable Energy, US Department of, 2010. Federal and State
Incentives and Laws. Alternative Fuels and Advanced Vehicle Data Center. Updated May,
2010. Accessed 8 September, 2010. http://www.afdc.energy.gov/afdc
Energy Efficiency News, 2010. San Francisco gets $5 million to install electric vehicle
charging stations. Accessed 14 September 2010: www.energyefficiencynews.com/i/3306/
Environmental Protection Agency, 2010. Regulatory Announcement: EPA and NHTSA
Finalize Historic National Program to Reduce Greenhouse Gases and Improve Fuel Economy
for Cars and Trucks. United States Environmental Protection Agency and Office of
Transportation and Air Quality. EPA-420-F-10-014. April 2010.
EV World, 2010. America’s Lagging Automotive CO2 Goals. Accessed 22 September 2010:
http://evworld.com/currents.cfm?jid=126
Fontaine, P.J, 2008. Shortening the path to energy independence: a policy agenda to
commercialize battery-electric vehicles. Electricity Journal 21 (6), 22–42 (July).
Foxes T.J, 2002. Technological and institutional ‗lock-in‘ as a barrier to sustainable innovation.
ICCEPT Working Paper, November 2002, Imperial College Centre for Energy Policy and
Technology, London

REFERENCES
148 Barriers to and Policy Solutions for EV Adoption in Australia • March 2011
Freeman, C, 1995. The ‗National System of Innovation‘ in historical perspective. Cambridge
Journal of Economics, 19 (1), 5-24.
Gallagher, K, Muehlegger, E., 2010. Giving green to get green? Incentives and consumer
adoption of hybrid vehicle technology. Journal of Environmental Economic Management. doi:
10.1016.
Government of Canada, 2010. Canada‘s Electric Vehicle Technology Roadmap. A strategic
vision for highway-capable battery-electric, plug-in and other hybrid-electric vehicles.
Accessed 10 September 2010.
www.evtrm.gc.ca/pdfs/ElectrICEVehicleTechnologyRoadmap_e.pdf
Greene, David L., German, John., Delucchi, Mark A., 2007. Fuel economy: the case for market
failure. ORNL/National Transportation Research Center, Knoxville, TN.
Hanlon, M, 2010. MIT Develops New Fast-Charging Battery Technology for Automobiles.
Gizmag. Accessed 13 October 2010: http://www.gizmag.com/go/5228/
Heffner, R, Kurani, K, Turrentine, T, 2005. Effects of Vehicle Image in Gasoline-Hybrid
Electric Vehicles. UC Davis Institute for Transportation Studies, Davis.
Hensley, R, Knupfer, S, Pinner, D, 2009. Electrifying cars: How three industries will evolve.
McKinsey Quarterly. No 3. Climate Change Special Initiative. Pp 88-96.
Hudson, J, ―The Real Deal‖, NRMA Motoring News. Accesessed 22 September 2010:
http://www.mynrma.com.au/cps/rde/xchg/mynrma/hs.xsl/the-real-deal.htm
Hyde, T, 2010. Project Get Ready: Preparing Cities for Electric Vehicles. Rocky Mountain
Institute & Smart Products. Accessed 6 August 2010: http://smart-
products.tmcnet.com/topics/smart-products/articles/77906-project-get-ready-preparing-cities-
electric-vehicles.htm
IDEA, 2008. MOVELE: Electric mobility (MOVilidad ELEctrica) pilot project. Accessed 14
September 2010: www.idae.es/index.php/mod.pags/mem.detalle/id.407/lang.uk
Jaffe A.B and Stavins R.N, 1994. The energy-efficiency gap. Energy Policy 22 (10), 804–810.
Kageyama, Y, 2010. Toyota shows smart-grid technology for its plug-in. Associated Press,
October 5, 2010. Accessed 7 October 2010:
www.detnews.com/article/20101005/AUTO01/10050370/1148/Toyota-shows-smart-grid-
technology-for-its-plug-in
Kahn, M., 2007. Do greens drive hybirds or hummers? Environmental ideology as a
determinant of consumer choice. Journal of Environmental Economics and Management 54,
129–145.
REFERENCES
Barriers to and Policy Solutions for EV Adoption in Australia • March 2011 149
Kampman, B., Leguijt, C., Bennink, D., Wielders, L., Rijkee, X., de Buck, A., Braat, W.et al,
2010. Green Power for Electric Cars: Development of policy recommendations to harvest the
potential of electric vehicles. January 2010. CE Delft, Delft. CE Publication No:10.4037.11.
Available at: www.ce.nl
Kezunovic, M, Waller, S, Damnjanovic, I. 2010. Framework for Studying Emerging Policy
Issues Associated with PHEVs in Managing Coupled Power and Transportation Systems.
Green Technologies Conference, 2010. IEEE. 15-16 April 2010.
Kurani K.S, Turrentine T, Sperling D, 1994, ‗Demand for electric vehicles in hybrid
households: an exploratory analysis‘, Transport Policy, Vol 1, No. 4, pp.244-256
Lane B, Potter S, 2007, ‗The adoption of cleaner vehicles in the UK: exploring the consumer
attitude-action gap‘, Journal of Cleaner Production, Vol 15, pp. 1085-1092
Lazar, J, McKenzie, M, 2009. Electric Vehicles and Australian Standards: Scoping study
findings. Prepared for Victorian Department of Innovation, Industry and Regional
Development (DIIRD).
Lazar, J, McKenzie, M, 2010. Electric vehicle standards in Australia: Standards workplan.
Version 1.1 (draft for detailed workplan consultation). Prepared for Victorian Department of
Innovation, Industry and Regional Development (DIIRD).
Lidicker, J, Lipman, T, Shaheen, S, 2010. Economic Assessment of Electric-Drive Vehicle
Operation in California and the United States. 2010 Transportation Research Record. Institute
of Transportation Studies, UC Davis.
Loveday, E, 2010a. Japanese Ministry of Economy wants hybrids, electric vehicles to account
for 50% of new car sales by 2020. Autoblog Green. Accessed 22 September 2010:
http://green.autoblog.com/2010/04/20/japanese-ministry-of-economy-wants-hybrids-and-
electrics-to-acco/
Loveday, E, 2010b. Toyota's hybrid sales eclipse 2.5M mark, now climbing at 2,000 per day.
AutoblogGreen Accessed 03 August 2010
Michigan Public Service Commission (MPSC), 2010. Getting Ready for Plug-in Electric
Vehicles in Michigan, MPSC Approves Experimental Electric Vehicle Rate for Detroit Edison
Company – the First in the State. Accessed 4 March 2011:
http://www.michigan.gov/mpsc/0,1607,7-159-16400_17280-241930--,00.html
McGlaun, S, 2010. Toyota Sells 1M Hybrids in Japan Alone. Daily Tech. Accessed 7 October
2010: http://www.dailytech.com/Toyota+Sells+1M+Hybrids+in+Japan+Alone/article19292.htm
McLennan Magasanik Associates (MAA), 2010. Impacts of Changes to the Design of the
Expanded Renewable Energy Target. Report to the Department of Climate Change and Energy
Efficiency.
McManus,W.S., Berman, B., 2005. 2005 O.S.A.T.–HybridCars.com Survey of Owners and
Shoppers. University of Michigan Transportation Research Institute.

REFERENCES
150 Barriers to and Policy Solutions for EV Adoption in Australia • March 2011
Nanowerk, 2010. Russian-Chinese nanotechnology cooperation on production of ultra-capacity
lithium-ion batteries. Accessed 13 October 2010:
http://www.nanowerk.com/news/newsid=15893.php
National Energy Policy, 2001. Report of the National Energy Policy Development Group:
Reliable, Affordable, and Environmentally Sound Energy for America‘s Future.
O‘Connor, M, 2010. Better Place Starts Electric Vehicle Battery Swap in Japan. Accessed 22
September 2010: http://www.triplepundit.com/2010/04/better-place-starts-electric-vehicle-
battery-swap-in-japan/
Ornelas, E, 2008, PHEVs: systems, characteristics and applications. Presented at AFVi PHEV
Workshop, 11 May 2008.
Packard D, 2010. Smart Grid, Smart Charging. CliperCreek, Presentation at Plug-in 2010, 28
July 2010.
Pike Research, 2009. Electric Vehicles on the Grid: Residential, Public, Private and Workplace
Charging Stations, EV Charging Business Models, and Vehicle to Grid Technology. Accessed 4
March, 2011: http://www.pikeresearch.com/research/smart-energy/electric-vehicles-on-the-grid
Pike Research, 2010. Battery Electric and Plug-in Hybrid Electric Vehicles: OEM Strategies,
Demand Drivers, Technology Issues, Key Industry Players, and Global Market Forecasts.
Accessed 13 October, 2010: http://www.pikeresearch.com/research/plug-in-electric-vehicles.
Riedy, C, 2003. Subsidies that encourage fossil fuel use in Australia. Working Paper
CR2003/01, Institute for Sustainable Futures, University of Technology Sydney
Rowley I, 2009, ―Introducing the Nissan Leaf Electric Vehicle‖, Business Week, 2 Aug 2009,
http://www.businessweek.com/autos/autobeat/archives/2009/08/post_4.html accessed 22 Sep
2010.
Simpson, A, 2009. Environmental Attributes of Electric Vehicles in Australia. Curtin University
Sustainability Policy (CUSP) Institute.
Smith R, ―Shifting the Spare Tire: Values and Incentives for Electricity Demand Management
Following Market Reform - The Australian Experience‖, 30th International IAEE conference,
Wellington, NZ, 2007.
Sovacool B.K, 2009, ‗The cultural barriers to renewable energy and energy efficiency in the
United States‘, Technology in Society, Vol. 31, pp.365-373
Sovacool B.K, Hirsh R.F, 2009, ‗Beyond batteries: An examination of the benefits and barriers
of hybrid electric vehicles (PHEVs) and a vehicle –to-grid (V2G) transition, Energy Policy, Vol
37, pp.1095-1103
Squatriglia, C, 2009. Nissan Turns Over An Electric Leaf. Autopia. Wired.com. Accessed 13
October 2010: http://www.wired.com/autopia/2009/08/nissan-electric-leaf/

REFERENCES
Barriers to and Policy Solutions for EV Adoption in Australia • March 2011 151
Sundaresan R, J.N. Sheth, 1989, ‗Consumer resistance to innovations: the marketing problem
and its solutions‘. Journal of Consumer Marketing, Vol 6, No.2, pp.5-14
Tonachel, L, 2010. EPA Sets CO2 Accounting for Plug-in Electric Vehicles for Model Years
2012 – 2016. Posted 1 April 2010. Switchboard, Natural Resources Defense Council Staff
Blog. http://switchboard.nrdc.org/blogs/ltonachel/epa_sets_co2_accounting_for_pl.html
Toxco, 2010. Inside Toxco's Battery Recycling Facilities. Accessed 13 October 2010:
http://www.toxco.com/facilities.html
Transport Canada, 2010. Motor Vehicle Safety Standard for Electric Vehicles. Date Modified:
13 December 2009. Date Accessed: 13 September 2010.
www.tc.gc.ca/eng/mediaroom/releases-nat-2001-01_h146e-2219.htm
Transport Canada, 2010. ecoTechnology for Vehicles. Date Modified: 25 August 2010. Date
Accessed: 13 September, 2010.
US Commercial Service, 2009. China Brief: New Energy Vehicles. Accessed 4 March 2011:
http://www.buyusa.gov/china/en/584.pdf
US Department of Energy (DOE) Vehicle Technologies Program, 2010. The Recovery Act:
Transforming America‘s Transportation Sector Batteries and Electric Vehicles.
Victorian Government, Department of Transport, ―Victorian Integrated Survey of Travel and
Activity 2007‖, http://www5.transport.vic.gov.au/vista/ accessed 20 Sep 2010.
Yang, C, 2010. Launching strategy for electric vehicles: Lessons from China and Taiwan,
Technological Forecasting and Social Change, Volume 77, Issue 5, June 2010, Pages 831-834,