Supporting Information
19
S1 1 2 Supporting Information for 3 4 5 6 Daniel Girma Mulat 1 , Alastair James Ward 1 , Anders Peter S. Adamsen 1 , Niels Vinther Voigt 2 , Jeppe 7 Lund Nielsen 3 , Anders Feilberg 1 * 8 ! 9 "#$#$ % $$& ’ ( ! 10 ) ( *#+$ ( ,#$ ( - $ 11 $+ .-$ /’ ’ $+ ! 12 13 *Corresponding author: 14 Anders Feilberg; phone: +45 30896099; e0mail: [email protected] 15 16 17 18 19 20 21 22 23 24 25 26 27 19 pages, 6 figures, 2 tables, 8 sections were included in the supporting materials. 28
Transcript of Supporting Information

S1
1
2
Supporting Information for 3
�4
����������������� ������������������������������������������������������5
������������������� �������� ���� ������������������������6
Daniel Girma Mulat1, Alastair James Ward
1, Anders Peter S. Adamsen
1, Niels Vinther Voigt
2, Jeppe 7
Lund Nielsen3, Anders Feilberg
1* 8
������������ ���������������������������������������������� ������!9
������"�#��$���#�$%����������������$$&�'��������������(������!10
)(�������*�#��+��$(���������������������,����#��$����(���������- ��������$11
����������$+�������������.������-���$�����/'����'�����$+���������!12
13
*Corresponding author: 14
Anders Feilberg; phone: +45 30896099; e0mail: [email protected]�15
16
17
18
19
20
21
22
23
24
25
26
27
19 pages, 6 figures, 2 tables, 8 sections were included in the supporting materials. 28
S2
������������������������� �����������������������������������29
Acetoclastic methanogenesis (AM): 30
*CH3COO
0 + H2O →
*CH4 + HCO3
0 ∆G°´= 031.0 kJ mol
01 (S1) 31
Syntrophic acetate oxidation coupled to hydrogenotrophic methanogenesis (SAO0HM): 32
*CH3COO
0 + 4H2O → H
*CO3
0 + HCO3
0 + 4H2 + H
+ ∆G°´= +104.1 kJ mol
01 (S2) 33
H*CO3
0 (or HCO3
0) + 4H2 + H
+ → *CH4 (or CH4) + 3H2O ∆G°´= 0135.6 kJ mol
01 34
(S3) 35
(asterisks represent the carbon of the methyl group in acetate) (1, 2) 36
37
�������������38
���������������39
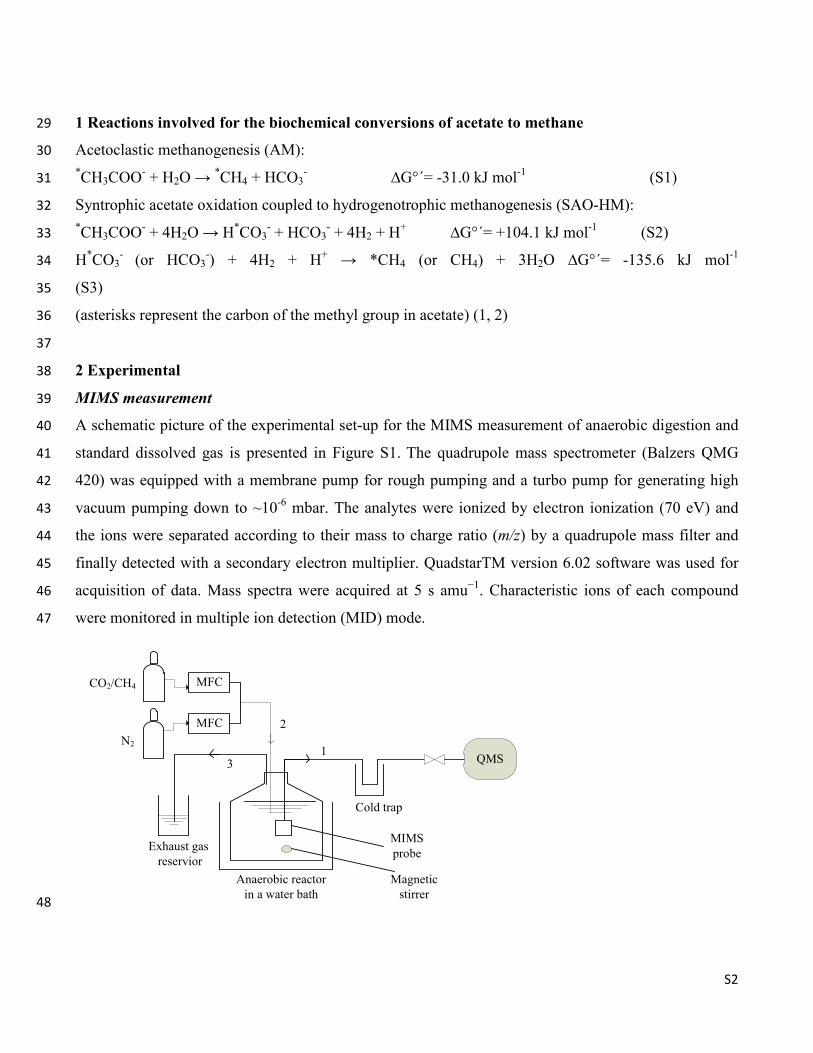
A schematic picture of the experimental set0up for the MIMS measurement of anaerobic digestion and 40
standard dissolved gas is presented in Figure S1. The quadrupole mass spectrometer (Balzers QMG 41
420) was equipped with a membrane pump for rough pumping and a turbo pump for generating high 42
vacuum pumping down to ~1006
mbar. The analytes were ionized by electron ionization (70 eV) and 43
the ions were separated according to their mass to charge ratio (�01) by a quadrupole mass filter and 44
finally detected with a secondary electron multiplier. QuadstarTM version 6.02 software was used for 45
acquisition of data. Mass spectra were acquired at 5 s amu−1
. Characteristic ions of each compound 46
were monitored in multiple ion detection (MID) mode. 47
N21
2
3
Exhaust gas
reservior
MFC
QMS
Cold trap
MFC
MIMS
probe
Magnetic
stirrer
Anaerobic reactor
in a water bath
CO2/CH4
�48

S3
�������� MIMS measurement set0up for calibration of standard dissolved gases and for measurement 49
of dissolved gases in anaerobic reactor. During calibration of dissolved gases in water, the three gas 50
lines (�, � and �) were connected. During the MIMS measurement of anaerobic digestion products, the 51
two gas lines (� and �) were disconnected. MFC is mass flow controller; QMS is quadrupole mass 52
spectrometer. 53
54
The anaerobic reactor system was constructed by connecting three gas lines to a gas0tight serum bottle 55
(see Figure S1). Gas line � was made by connecting stainless steel and capillary tubing as follows. One 56
end of the 0.32 cm o.d. stainless steel tubing was connected to the high vacuum section of the mass 57
spectrometer through a bellows0sealed valve (Swagelok, Denmark) for safety purpose and the other end 58
was connected to 0.32 cm o.d. capillary tubing. The stainless tubing was bent to a U0shape and kept in 59
a 1 L wide0mouth Dewar flask (Sigma Aldrich, Denmark) filled with dry ice (~ 080°C) to make a cold 60
trap system. The other end of the 0.32 cm o.d. capillary tubing was connected to a membrane probe. 61
The membrane probe was made from 127 Lm thick silicon membrane (SIL0TEC Sheeting, Technical 62
Products Inc., USA) inlet and supported by a thin perforated stainless steel plate. Before connecting the 63
capillary tubing to the membrane probe, a hole was drilled in a butyl rubber stopper (30 mm o.d., 64
Apodan Nordic, Denmark) and the capillary tubing was inserted directly in this. A serum bottle 65
containing fermentation broth was sealed with the butyl rubber stopper and secured with an aluminum 66
crimp. The stated MIMS setup was used for measurement of anaerobic digestion process. 67
68
A small modification was made to the MIMS setup during preparation of standard gas solution. 69
Additional two gas lines (� and �) were made (see Figure S1). Two holes were drilled in the butyl 70
rubber stopper and two lines of PTFE tubing (0.32 cm o.d.) were inserted directly in these. Gas line � 71
was constructed by connecting one of the PTFE tubing from the serum bottle through a three0way 72
connector to two mass flow controllers (EL0FLOW®
Select, Bronkhorst) for adding a specified flow of 73
CO2/CH4 and N2 gases2 One mass flow controller (MFC) was connected to a gas mixture cylinder (60 74
vol% CH4 and 40 vol% CO2) and the other MFC was connected to a gas cylinder of N2 (purity > 99.99 75
vol%) with PTFE tubing (0.64 cm o.d.). Gas line � was based on submerging the other end of the PTFE 76
tubing from the serum bottle into a beaker filled with water for removing exhaust gas. 77
78

S4
Two types of MIMS measurements were employed: 79
(i) MIMS calibration:� Aqueous standard solutions of carbon dioxide and methane at different 80
concentrations were prepared in deionized water from the standard gas mixture CH4 (60 vol%) and CO2 81
(40 vol%). A N2 gas (purity > 99.99 vol%) was used for dilution. The dilution was carried out by 82
adjusting the volumetric flow of the component gases in the mixture by using a MFC2 A gas mixture 83
(CO2 and CH4) and N2 gas with defined concentration (vol%) was bubbled into a serum bottle (500 84
mL) filled with 200 mL of deionized water. The gas was continuously bubbled into water until the 85
concentration of dissolved gas was stable. The stabilization took 40045 minutes and it was monitored 86
with MIMS by recording the characteristics ions of methane at �01 15 and carbon dioxide at �01 44287
(ii) MIMS measurement of anaerobic digestion: A serum bottle (5000mL) containing a fermentation 88
solution was quickly transferred from the incubation chamber to a water bath (52°C) for MIMS 89
measurement. The serum bottle was uncapped and the MIMS probe was immediately submerged into 90
the fermentation broth and the bottle was capped again. During capping and uncapping the bottle, N2 91
gas was used for flushing across the mouth of the bottle. The effectiveness of N2 flushing for avoiding 92
the diffusion of air into a reactor was tested by incubating two parallel sets of unlabeled acetate 93
reactors. One set of reactors was capped all the time until the end of the experiment. The other set was 94
used for MIMS measurement where the bottles were capped and uncapped during the measurement as 95
explained earlier. The acetate degradation rate and methane production profile of both sets of control 96
reactors were similar (data not shown). N2 flushing across the mouth of the bottles is an effective 97
technique in order to avoid the diffusion of air into the fermentation bottle. Sufficient mixing during 98
MIMS measurement was provided with a magnetic stirrer. After every MIMS measurement, the 99
membrane probe was first rinsed with acidified water (0.1 M H2SO4) and then deionized water in order 100
to avoid contamination of the inlet system and to provide a constant background signal. After the 101
MIMS measurement, the serum bottle was kept in the incubation chamber until the next measurement 102
day. 103
104
������������������105
The volume of a produced gas was measured using an acidified water displacement method at room 106
temperature and atmospheric pressure. Samples of headspace gas were taken using a gas tight syringe 107
with a needle through a septum and transferred into a 20 mL headspace vial. The compositions of CH4 108

S5
and CO2 in the headspace samples were analyzed using Agilent technologies 7890A gas 109
chromatograph equipped with a thermal conductivity detector and an Agilent technology GC sampler 110
80. Methane and carbon dioxide were isolated using Alltech’s CTR I stainless steel column. It is 111
essentially a column within a column which was packed with different materials: outer column (1.8 m 112
x 0.64 cm) was packed with an activated molecular sieve and inner column (1.8 m x 0.32 cm) was 113
packed with a porous polymer mixture. The carrier gas was helium at 30 mL/min. The temperatures of 114
injection port, column oven and detector were set at 110, 40 and 150 °C, respectively. 115
116
Liquid samples for VFA analysis were withdrawn with a syringe equipped with a needle through a 117
septum and its pH was measured immediately. The liquid samples (1.000 g) were first acidified with 4 118
mL of 0.3 M oxalic acid containing the internal standard dimethylpropanoic acid, then centrifuged at 119
4,500 rpm for 12 min and filtered through a 0.45m GHP membrane. Finally an aliquot of the 120
supernatant solution was transferred into a vial. The concentrations of volatile fatty acids were 121
determined by Agilent Technologies 7890A gas chromatograph equipped with flame ionization 122
detector (FID). A polar phase capillary column, HP0INNOWax (30m x 0.25 mm x 0.25 Lm), was used 123
for separation. Helium was used as a carrier gas at 1.8 ml/min flow rate. The analyses were performed 124
using a temperature programme: 5 min at 100°C, a linear gradient from 1000120°C at the rate of 10 125
°C/min, 5 min at 120°C, a linear gradient from 120°C to the final temperature of 220°C at the rate of 126
30°C/min and final hold at
220°C for 3 min. The temperatures of injection port and detector were set at 127
285°C and 300°C, respectively. 128
129
�����������������130
Liquid samples for proteome analysis were collected from all reactors at the middle of the incubation 131
experiment and stored in a freezer (~ 020 °C) until the analysis. Proteins were extracted followed by 132
tryptic digestion as described elsewhere (3) and mass spectrometry analysis by an automated LC0ESI0133
MS/MS with an UltiMate 3000 RSLCnano system on0line coupled to a Q Exactive mass spectrometer 134
via a Nanospray Flex ion source (Thermo Fisher Scientific). The resulting mass spectra were used to 135
search for protein homologs using an in0house Mascot database search engine and the NCBI and the 136
UniProt database as described in details elsewhere (4). 137
138
S6
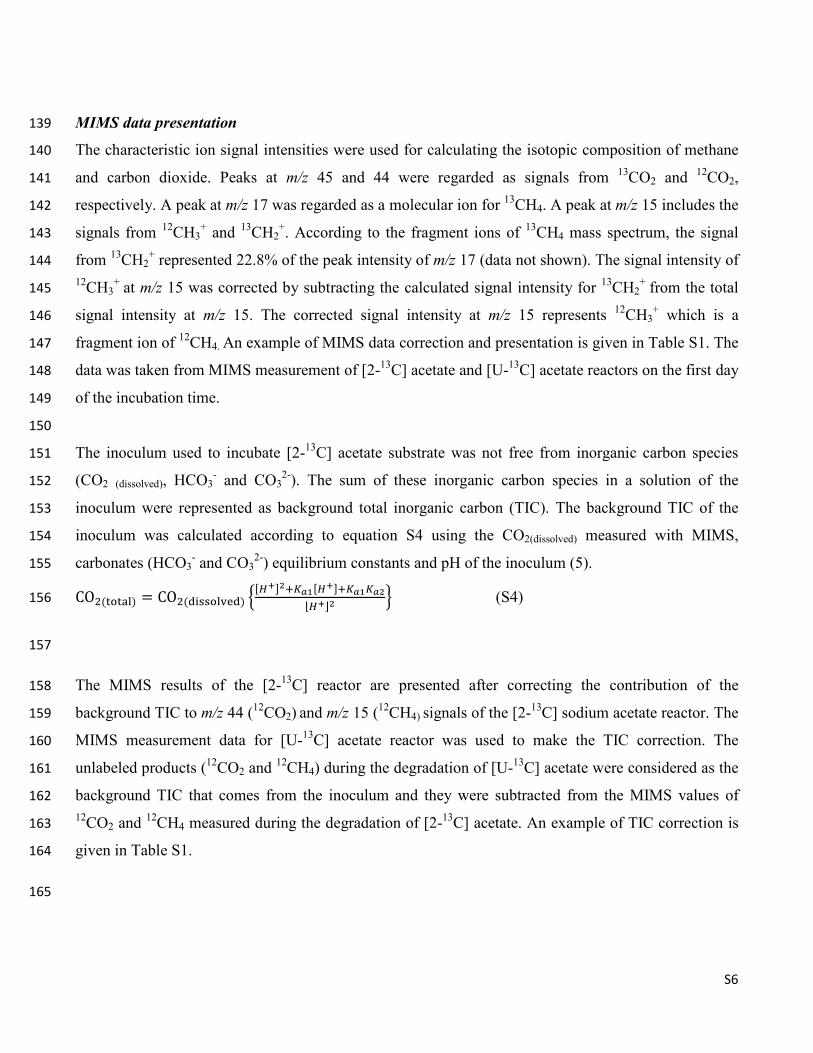
����������������������139
The characteristic ion signal intensities were used for calculating the isotopic composition of methane 140
and carbon dioxide. Peaks at �01 45 and 44 were regarded as signals from 13
CO2 and 12
CO2, 141
respectively. A peak at �01 17 was regarded as a molecular ion for 13
CH4. A peak at �01 15 includes the 142
signals from 12
CH3+ and
13CH2
+. According to the fragment ions of
13CH4 mass spectrum, the signal 143
from 13
CH2+ represented 22.8% of the peak intensity of �01 17 (data not shown). The signal intensity of 144
12CH3
+ at �01 15 was corrected by subtracting the calculated signal intensity for
13CH2
+ from the total 145
signal intensity at �01 15. The corrected signal intensity at �01 15 represents 12
CH3+ which is a 146
fragment ion of 12
CH4. An example of MIMS data correction and presentation is given in Table S1. The 147
data was taken from MIMS measurement of [2013
C] acetate and [U013
C] acetate reactors on the first day 148
of the incubation time. 149
150
The inoculum used to incubate [2013
C] acetate substrate was not free from inorganic carbon species 151
(CO2 (dissolved), HCO30 and CO3
20). The sum of these inorganic carbon species in a solution of the 152
inoculum were represented as background total inorganic carbon (TIC). The background TIC of the 153
inoculum was calculated according to equation S4 using the CO2(dissolved) measured with MIMS, 154
carbonates (HCO30 and CO3
20) equilibrium constants and pH of the inoculum (5). 155
CO������� CO���� ����� ���������������������
����� � (S4) 156
157
The MIMS results of the [2013
C] reactor are presented after correcting the contribution of the 158
background TIC to �01 44 (12
CO2) and �01 15 (12
CH4) signals of the [2013
C] sodium acetate reactor. The 159
MIMS measurement data for [U013
C] acetate reactor was used to make the TIC correction. The 160
unlabeled products (12
CO2 and 12
CH4) during the degradation of [U013
C] acetate were considered as the 161
background TIC that comes from the inoculum and they were subtracted from the MIMS values of 162
12CO2 and
12CH4 measured during the degradation of [20
13C] acetate. An example of TIC correction is 163
given in Table S1. 164
165

S7
166
�� ���� Isotopic distribution of methane and carbon dioxide from 13
C labeled acetate 167
168
Ion current
Substrate �01 15 (12
CH4) in nA
�01 17 (13
CH4)
in nA 13
CH4 (atom%)
Actual
13CH2
+
subtracteda
Background
TIC0correctedb Actual
Background
TIC0correctedc
13CH3COO
0 4.0 2.4 1.4 7.0 83.7
13CH3
13COO
0 3.3 1.0 9.9
Ion current
Substrate �01 44 (12
CO2) in nA
�01 45 (13
CO2)
in nA 13
CO2 (atom%) 13
CO2 (atom%)/13
CH4(atom%)
Actual
Background
TIC0correctedd Actual
Background
TIC0corrected
Background
TIC0corrected 13
CH3COO0 49 45.1 0.7 1.6 0.02
13CH3
13COO
0 3.9
169
a.� The signal from 13
CH2+ represented 22.8% of the peak intensity of �01 17. 170
b.� The ion current at �01 15 from [U013
C] acetate was regarded as arising from the background 171
production of unlabeled CH4. 172
c.� The percentage of 13
CH4 to total methane calculated from background TIC0corrected 12
CH4 and 173
actual 13
CH4 values. 174
d.� The ion current at �01 44 from [U013
C] acetate was regarded as arising from the background 175
production of unlabeled CO2. 176
177
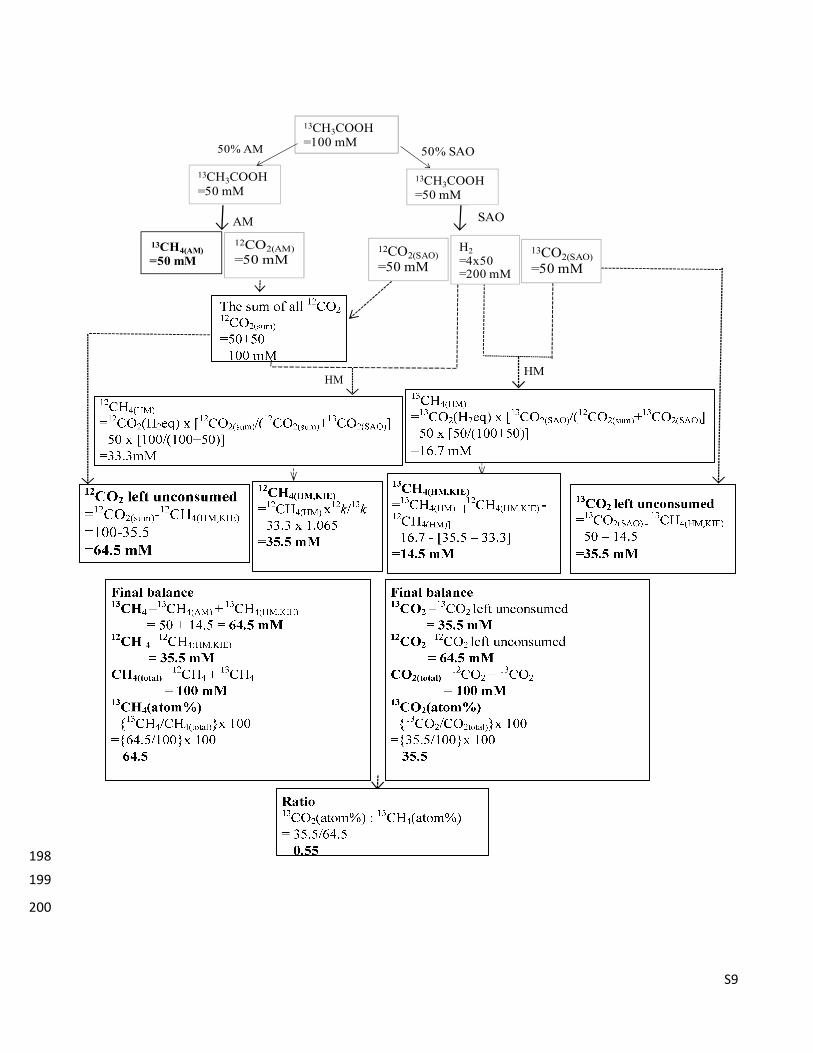
����������������������������������178
The production of CH4 and /or CO2 from acetate depends on the metabolic pathways. During 179
acetoclastic methanogenesis, methane is formed from the methyl group carbon atom in acetate and 180
carbon dioxide is formed from the carboxyl group carbon atom (6). In synthrophic acetate oxidation 181
pathway, the carbons of both the groups in acetate are converted to carbon dioxide (7, 8). If 182
acetoclastic methanogenesis is taking place, 1 mole of 13
CH4 and 1 mole of 12
CO2 will be produced 183
from 1 mole of 13
CH3COO0. When SAO is taking place, 1 mole of
13CO2, 1 mole of
12CO2 and 4 moles 184
of H2 will be produced from 1 mole of 13
CH3COO0. Since there is no extra source of H2 available to the 185
system, only 1 mole of carbon dioxide is reduced by 4 moles of H2 via HM and the other 1 mol of 186
carbon dioxide is remained unconsumed. Both 13
CO2 and 12
CO2 can be reduced to 13
CH4 and 13
CH4, 187
respectively, with different proportion according to their rate constants. As 12
CO2 reacts slightly faster 188

S8
than 13
CO2 during the reduction of carbon dioxide (i.e., 12!/
13! = 1.065 on average at thermophilic 189
condition) (9, 10), the production of 12
CH4 is estimated to be slightly higher than 13
CH4 at the given 190
time point. A schematic representation of calculated mass balance of 13
CH4, 12
CH4, 13
CO2 and 12
CO2 by 191
assuming 50% methane production from acetoclastic methanogenesis and the remaining 50% from 192
SAO0HM is shown in Figure S2. In this mass balance calculation, the kinetic isotope effect (12!/
13! = 193
1.065) was included. The background TIC was not included in the mass balance calculation since TIC0194
corrected MIMS data is used to quantify the contribution of SAO to methane production. Similar mass 195
balance calculation was reported by Hori �� �$2(11) but we expanded it by including the kinetic isotope 196
effect. 197
S9
�� !"#$%&
'()��%
HMHM
50% AM 50% SAO
13CH3COOH
=50 mM
13CH3COOH=100 mM
13CH3COOH
=50 mM
12CO2(AM)
=50 mM12CO2(SAO)
=50 mM
H2
=4x50=200 mM
13CO2(SAO)
=50 mM
SAOAM
198
199
200
S10
������ ���A schematic representations to determine the mass balance of 12
CH4, 13
CH4, 12
CO2 and 201 13
CO2. Herein an example of a mass balance is provided when 100mM 13
CH3COOH was degraded by 202
50% acetoclastic methanogenesis and 50% synthrophic acetate coupled to hydrogenotrophic 203
methanogenesis. HM is hydrogenotrophic methanogenesis; AM is acetoclastic methanogenesis; SAO is 204
synthrophic acetate oxidation; atom% of 13
C labeled substrate is {13
C substrate/(13
C substrate + 12
C 205
substrate)} x 100, for e.g. 13
CO2 (atom%) ={13
CO2/(13
CO2+12
CO2)} x 100; 12
CO2 (H2eq) and 13
CO2 206
(H2eq) are 1 mol 12
CO2 and 13
CO2 equivalent that can be reduced by the available 4 mol H2 via HM , 207
respectively, i.e. only 50 mM of 12
CO2 and 13
CO2 can be reduced by the available 400 mM of H2; KIE 208
is kinetic isotope effect; 12!/
13!=1.065 is the ratio of the rate constants of
12CO20derived methane to 209
13CO20derived methane; HM,KIE is methane0derived via hydrogenotrophic methanogenesis including 210
kinetic isotope effect. 211
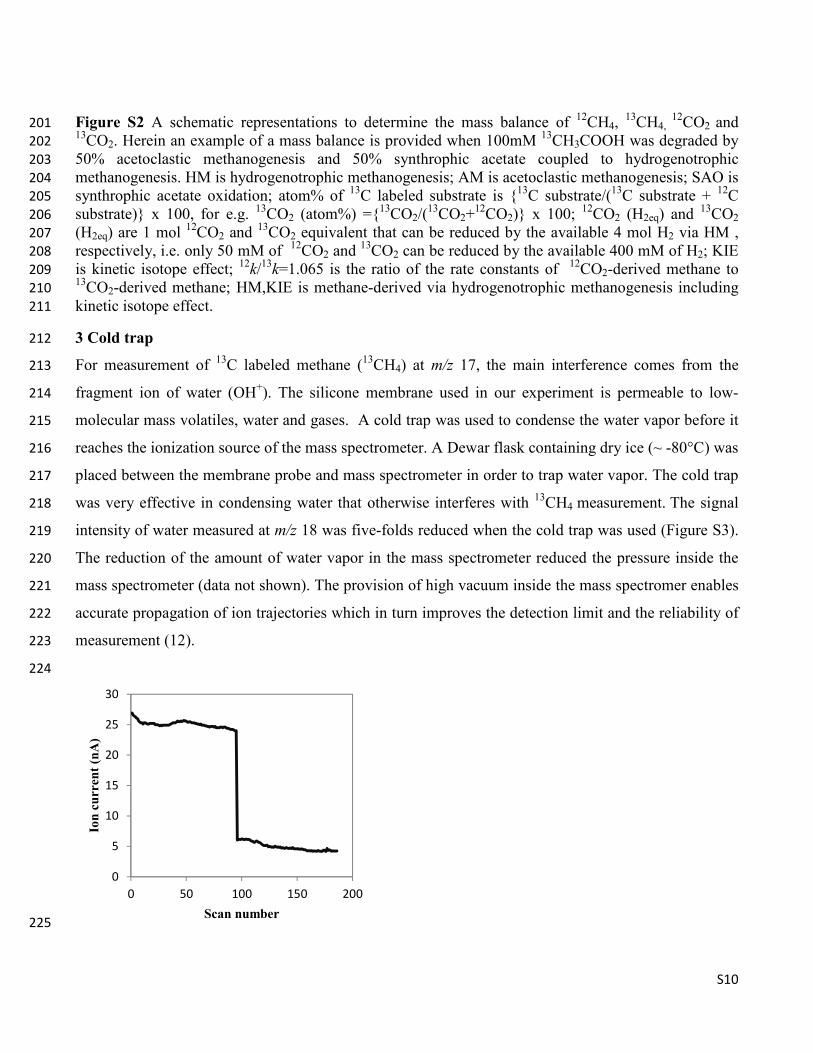
�� ���������212
For measurement of 13
C labeled methane (13
CH4) at �01 17, the main interference comes from the 213
fragment ion of water (OH+). The silicone membrane used in our experiment is permeable to low0214
molecular mass volatiles, water and gases. A cold trap was used to condense the water vapor before it 215
reaches the ionization source of the mass spectrometer. A Dewar flask containing dry ice (~ 080°C) was 216
placed between the membrane probe and mass spectrometer in order to trap water vapor. The cold trap 217
was very effective in condensing water that otherwise interferes with 13
CH4 measurement. The signal 218
intensity of water measured at �01 18 was five0folds reduced when the cold trap was used (Figure S3). 219
The reduction of the amount of water vapor in the mass spectrometer reduced the pressure inside the 220
mass spectrometer (data not shown). The provision of high vacuum inside the mass spectromer enables 221
accurate propagation of ion trajectories which in turn improves the detection limit and the reliability of 222
measurement (12). 223
224
�225
0
5
10
15
20
25
30
0 50 100 150 200
*���������#�$&
������� �

S11
��������� Implementation of the cold trap (operated at ~80°C) caused a significant reduction of the 226
water vapor content (as monitored by �01 18), which otherwise permeate through the silicone 227
membrane. The lines represent the first 95 scans in the absence of cold trap and the last 90 scans in the 228
presence of cold trap. When cold trap was used, the data points until the attainment of stable MIMS 229
reading was excluded. That is why a sharp drop between the top left line and the bottom right line was 230
observed. 231
232
"������������������������233
The aim of the sample temperature test was to investigate the effect of membrane temperature on the 234
operating pressure of the MIMS system and performance of the silicone membrane. The temperature of 235
deionized water as a sample was increased step by step from room temperature to 52.5°C. The choice 236
of this temperature range was based on the fact that most of biogas production from organic waste is 237
conducted under either mesophilic (~ 35°C) or thermophilic (~ 52°C) conditions. In our study, 238
anaerobic digestion was conducted in the incubation chamber held at 52°C. While the MIMS 239
measurement was conducted, the temperature of the reactor was controlled by a water bath held at 240
52°C. Constant temperature was maintained during MIMS measurements to avoid process instability 241
due to temperature fluctuation and to stabilize the MIMS measurements, as temperature affects the 242
MIMS signals (see also below). 243
244
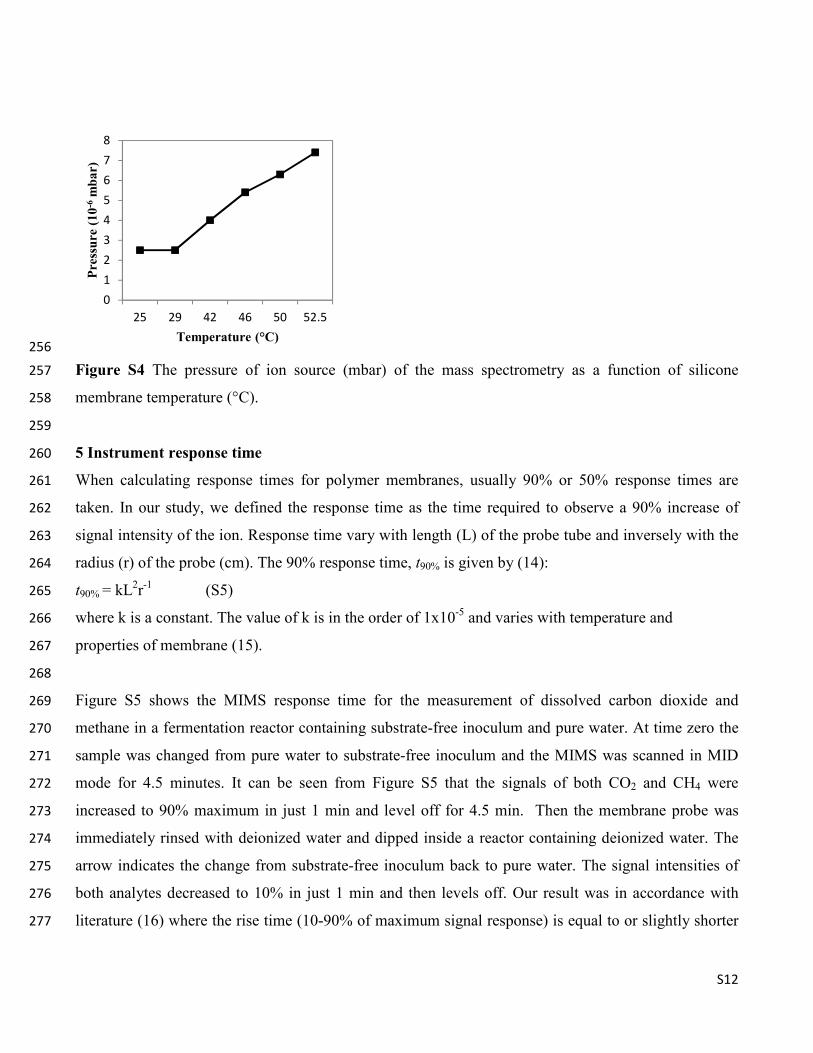
Figure S4 shows changes of pressure inside the mass spectrometer with an increase in temperatures of 245
water sample from room temperature up to 52.5°C. The pressure hardly changed when temperature 246
increased from room temperature up to 29°C. However, it showed a linear three0fold increase as the 247
temperature increased from 29052.5°C. Moreover, the background intensity of both CO2 and CH4 248
signals increased by three0fold (data not shown). Higher sample temperature causes the expansion of 249
membrane micropores, which leads to increase in diffusivity of the analyte through the membrane. As a 250
consequence of higher analyte flow into the vacuum section of the mass spectrometer, the partial 251
pressure inside the mass spectrometer increases (13). In our temperature study, the total pressure in the 252
ionization chamber of the mass spectromer is lower than the recommended safety limit (~ 3.0 x 1005
253
mbar). Therefore, it can be concluded that safe operation of a MIMS system is achievable for a typical 254
sample temperature range (30052°C). 255
S12
256
������ �"� The pressure of ion source (mbar) of the mass spectrometry as a function of silicone 257
membrane temperature (°C). 258
259
(�*��������������������260
When calculating response times for polymer membranes, usually 90% or 50% response times are 261
taken. In our study, we defined the response time as the time required to observe a 90% increase of 262
signal intensity of the ion. Response time vary with length (L) of the probe tube and inversely with the 263
radius (r) of the probe (cm). The 90% response time, �90% is given by (14): 264
�90% = kL2r01
(S5) 265
where k is a constant. The value of k is in the order of 1x1005
and varies with temperature and 266
properties of membrane (15).�267
268
Figure S5 shows the MIMS response time for the measurement of dissolved carbon dioxide and 269
methane in a fermentation reactor containing substrate0free inoculum and pure water. At time zero the 270
sample was changed from pure water to substrate0free inoculum and the MIMS was scanned in MID 271
mode for 4.5 minutes. It can be seen from Figure S5 that the signals of both CO2 and CH4 were 272
increased to 90% maximum in just 1 min and level off for 4.5 min. Then the membrane probe was 273
immediately rinsed with deionized water and dipped inside a reactor containing deionized water. The 274
arrow indicates the change from substrate0free inoculum back to pure water. The signal intensities of 275
both analytes decreased to 10% in just 1 min and then levels off. Our result was in accordance with 276
literature (16) where the rise time (10090% of maximum signal response) is equal to or slightly shorter 277
0
1
2
3
4
5
6
7
8
25 29 42 46 50 52.5
+������#�),-� ��&
���������#. &

S13
than fall time (decrease in signal response from 90010%). The fast rise and fall time obtained in our 278
study shows the capability of MIMS technique for online and onsite monitoring of dissolved carbon 279
dioxide and methane in real time. 280
281
282
283
�������(�MIMS measurement of (a) dissolved methane (�01 15) and (b) carbon dioxide (�01 44) 284
directly inside reactors containing substrate0free inoculum and deionized water. The arrow indicates the 285
change from substrate0free inoculum back to pure water. 286
287
-�%�������������������/����%*%��288
The determination of the concentration of hydrogen at �01 2 in our reactor was obscured by the high 289
concentration of dissolved methane (about 1.4 mM) and very low concentration of dissolved hydrogen 290
ranged from 0.5 to 3 XM in the digester (17). Due to high energetic electron (70 eV) used for the 291
ionization of the analytes, methane (CH4) molecules fragment to H2+ ion and detected at �01 2. The 292
contribution of methane to the signal at �01 2 was determined by purging methane at different 293
concentration into deionized water. As shown in Figure 6S, a linear relationship was observed (r2 = 294
0.995) when �01 2 signal was plotted versus �01 15 signal (methane). Due to the high background 295
signal from methane at �01 2 and the expected extremely small concentration of hydrogen at steady 296
anaerobic condition, the ion abundance of hydrogen at �01 2 could not be determined accurately in our 297
experiment. However, the hydrogen concentration of anaerobic digester both at steady state organic 298
loading rate (OLR) and increased OLR was reported by some authors (18020). In these published 299
0
500
1000
1500
2000
2500
0 4.5 9
*�������������(�#��)��$
)
��������#���&
(a)
0
50
100
150
200
0 4.5 9
*������������""�#��$&
��������#���&
(b)

S14
works, the calibration curve for quantifying hydrogen and the interference of methane at �01 2 were not 300
reported. The reported hydrogen data might be overestimated due to the interference from fragment ion 301
of methane. It seems that the concentration of hydrogen in an anaerobic digester can only be 302
determined accurately by MIMS in a few condition, for instance, at high OLR that leads to high 303
concentration of hydrogen and with appropriate correction for the interference caused by the fragment 304
ion of methane. 305
��306
307
�������- The fragment ion of methane at �01 2 divided by �01 18 (water) and its linear dependence 308
with the ion intensity of �01 15 (methane) divided by �01 18 (water). 309
0�%������������������310
The use of ion0current ratio between 13
C and 12
C isotopes of CO2 and CH4 in our study significantly 311
reduces errors associated with the drift in mass spectrometer and membrane inlet system as well as 312
slight fluctuations in sample temperature and permeability of water vapor. We have considered two 313
major sources of uncertainty, which arises from isotope ratio measurement with MIMS and the 314
calculation of quantifying methanogenesis pathways as follows. 315
(i) Uncertainty of MIMS measurement of isotopic distribution of CO2 and CH4: 316
The MIMS measurement was conducted for 4 minutes in each anaerobic reactor. The maximum 317
response signal was attained in one minute and an average of data points within the last three minutes 318
of MIMS measurement was used to assign the signal intensity of the individual measured ion. The 319
uncertainty associated with taking the average signal intensity was 2.5%, 1.3%, 1.3% and 1.3% for �01 320
15 (12
CH4), �01 17(13
CH4), �01 44(12
CO2) and �01 45(13
CO2), respectively. 321
0.00
0.02
0.04
0.06
0.08
0.10
0.12
0.14
0.16
0.18
0.20
0 2 4 6 8
*�������������,��,����1������
*�������������(,��,����1��������

S15
(ii) Uncertainty of quantifying SAO pathways as a function of MIMS data of 13
CO2 (atom%)/13
CH4 322
(atom%) using equation 1: 323
Equation 1 was derived considering the kinetics isotope effect during the reduction of carbon dioxide to 324
methane. The average value of 12!/
13! = 1.065 was used to account the kinetic effect (9, 10). Previous 325
literatures showed that the 12!/
13! for thermophilic hydrogenotrophic methanogens was in the range of 326
1.04 to 1.09 (9, 10). The uncertainty associated with the use of 12!/
13! = 1.065 on average for deriving 327
equation 1 was 4.9%. 328
329
The propagated uncertainty associated with quantification of SAO (%) using equation 1 as a function 330
of MIMS data of 13
CO2(atom%)/13
CH4(atom%) was calculated from both uncertainty components 331
listed above and it was estimated to be 5.9%. 332
333
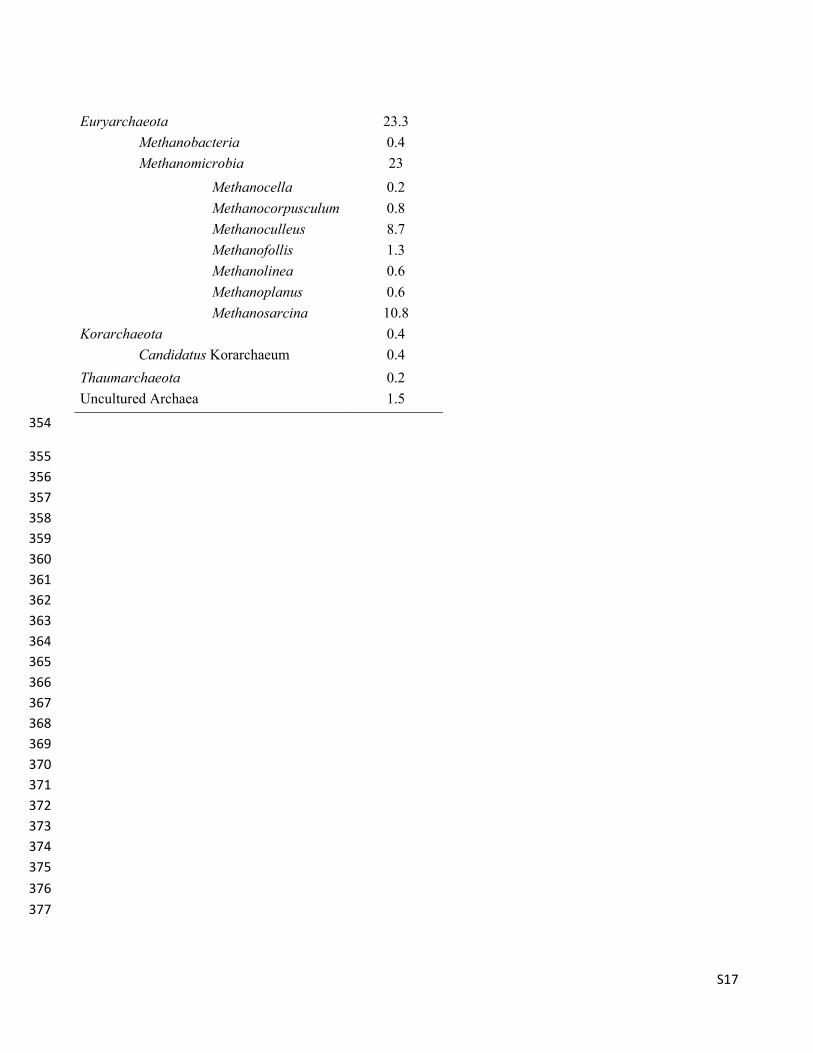
1�%��� ���������������������334
The resulting mass spectra were used to identify and taxonomically attribute individual peptides to 335
,�#����� and ��#����. At least two peptides with similar identities were required for proper 336
identification. The proteome analysis showed that a total of 527 proteins were identified with a wide 337
range of functional categories and representing 18 phyla, 30 classes and 107 genera. The bacterial 338
proteome constituted 74.5% of the proteins with a relative high diversity whereas the majority of the 339
remaining proteins affiliated to ��#���� (Table S2). We found only a few fungal and plant proteins in 340
the sample. 341
342
343
344
345
346
347
348
349
350
351

S16
�� �����Distribution of protein sequences analyzed in this study 352
�353
+����2 ����23���2� +������
�#���+�#����� 2.3
�#���+�#����� 2.1
�#���+�#����-�� 0.2
�3����#�� 1.1
,�#�����-����0(�$���+�group 5.7
,�#�����-���� 4.4
(�$���+� 1.1
%����+�#������ 0.2
(�$���-���04����#���#��+��group 0.4
(�$����$�5� 0.9
(�$-�$���� 0.2
(�$����$�5� 0.4
"�������#��+�� 0.4
(���+�#����� 0.2
�������+�#����� 0.2
6�+��+�#�����0�#�-�+�#�����group 0.6
6����#���� 30.9
,�#�$$� 8
($�����-�� 19.7
������$����#��� 0.4
�������#���� 2.8
6���+�#����� 0.9
7$�#����#���� 1.1
7�����+�#����� 16.5
�$���������+�#����� 5.3
,���������+�#����� 2.8
8����������+�#����� 5.7
��$��������+�#����� 2.5
���$�������+�#����� 0.2
.����#������ 3.4
.����������� 7
.��������� 7
"���������� 0.8
Uncultured bacteria 2.5
S17
�����#������ 23.3
*�����+�#����� 0.4
*�������#��+�� 23
*�����#�$$� 0.2
*�����#�����#�$�� 0.8
*�����#�$$��� 8.7
*�������$$�� 1.3
*�����$��� 0.6
*������$��� 0.6
*��������#�� 10.8
�����#������ 0.4
(�-�-����Korarchaeum 0.4
"������#������ 0.2
Uncultured Archaea 1.5
354
355
356
357
358
359
360
361
362
363
364
365
366
367
368
369
370
371
372
373
374
375
376
377

S18
References 378
379
1. Hattori, S. Syntrophic acetate0oxidizing microbes in methanogenic environments. 380
*�#��+�� ����2�))14 �), 1180127. 381
2. Sasaki, D.; Hori, T.; Haruta, S.; Ueno, Y.; Ishii, M.; Igarashi, Y. Methanogenic pathway 382
and community structure in a thermophilic anaerobic digestion process of organic solid waste. 92383
,���#�2,����2�)��4 ���, 41046. 384
3. Heyer, R.; Kohrs, F.; Benndorf, D.; Rapp, E.; Kausmann, R.; Heiermann, M.; Klocke, M.; 385
Reichl, U. Metaproteome analysis of the microbial communities in agricultural biogas plants. �:386
,����#��$2�)��. 387
4. Kılıç, N. K.; Stensballe, A.; Otzen, D. E.; Dönmez, G. Proteomic changes in response to 388
chromium (VI) toxicity in 7���-��������������. ,��������2"�#��$2�)�)4 ���, 213402140. 389
5. Bastidas0Oyanedel, J.0R.; Mohd0Zaki, Z.; Pratt, S.; Steyer, J.0P.; Batstone, D. J. 390
Development of membrane inlet mass spectrometry for examination of fermentation processes. "�$���391
�)�)4 �), 4820492. 392
6. Thauer, R. K.; Möller0Zinkhan, D.; Spormann, A. M. Biochemistry of acetate catabolism 393
in anaerobic chemotrophic bacteria. ��2;��2*�#��+��$2�5154 /), 43067. 394
7. Zinder, S. H.; Koch, M. Non0aceticlastic methanogenesis from acetate: acetate oxidation 395
by a thermophilic syntrophic coculture. ��#�2*�#��+��$2�51"4 �)�, 2630272. 396
8. Schnürer, A.; Houwen, F. P.; Svensson, B. H. Mesophilic syntrophic acetate oxidation 397
during methane formation by a triculture at high ammonium concentration. ��#�2*�#��+��$2�55"4 �<�, 398
70074. 399
9. Conrad, R. Quantification of methanogenic pathways using stable carbon isotopic 400
signatures: a review and a proposal. =��28��#���2�))(4 )<, 7390752. 401
10. Pohlman, J.; Kaneko, M.; Heuer, V.; Coffin, R.; Whiticar, M. Methane sources and 402
production in the northern Cascadia margin gas hydrate system. ����7$���2.#2>���2�))54 ��?, 5040403
512. 404
11. Hori, T.; Sasaki, D.; Haruta, S.; Shigematsu, T.; Ueno, Y.; Ishii, M.; Igarashi, Y. 405
Detection of active, potentially acetate0oxidizing syntrophs in an anaerobic digester by flux 406
measurement and formyltetrahydrofolate synthetase (FTHFS) expression profiling. *�#��+��$2�)��4 407
�@?, 198001989. 408
12. Tarkiainen, V.; Kotiaho, T.; Mattila, I.; Virkajarvi, L.; Aristidou, A.; Ketola, R. A. On0409
line monitoring of continuous beer fermentation process using automatic membrane inlet mass 410
spectrometric system. "�$����))(4 <@, 125401263. 411
13. Johnson, R. C.; Cooks, R. G.; Allen, T. M.; Cisper, M. E.; Hemberger, P. H. Membrane 412
introduction mass spectrometry: Trends and applications. *���.��#����2;��2�)))4 �', 1037. 413
14. Lloyd, D.; Bohátka, S.; Szilágyi, J. Quadrupole mass0spectrometery in the monitoring and 414
control of fermentations. ,���������51(4 �, 1790212. 415
15. Cowie, G.; Lloyd, D. Membrane inlet ion trap mass spectrometry for the direct 416
measurement of dissolved gases in ecological samples. 92*�#��+��$2*���2�5554 )@, 1012. 417
16. Ketola, R. A.; Ojala, M.; Sorsa, H.; Kotiaho, T.; Kostiainen, R. K. Development of a 418
membrane inlet mass spectrometric method for analysis of air samples. ��$2(���2�#���5504 )/', 419
3590365. 420

S19
17. Kuroda, K.; Gaiger Silveira, R.; Nishio, N.; Sunahara, H.; Nagai, S. Measurement of 421
dissolved hydrogen in an anaerobic digestion process by a membrane0covered electrode. 926�����2422
,����2�55�4 ?�, 4180423. 423
18. Whitmore, T.; Lloyd, D.; Jones, G.; Williams, T. Hydrogen0dependent control of the 424
continuous anaerobic digestion process. ���$2*�#��+��$2,����#��$2�5104 �<, 3830388. 425
19. Scott, R. I.; Williams, T. N.; Whitmore, T. N.; Lloyd, D. Direct measurement of 426
methanogenesis in anaerobic digestors by membrane inlet mass spectrometry. ��292���$2*�#��+��$2427
�51�4 ��, 2360241. 428
20. Zhang, Y.; Zhang, F.; Chen, M.; Chu, P.0N.; Ding, J.; Zeng, R. J. Hydrogen 429
supersaturation in extreme0thermophilic (70° C) mixed culture fermentation. ���$2 ���2�)��4 ��', 430
2130219. 431
432