Supporting Online Material for
39
www.sciencemag.org/cgi/content/full/332/6027/346/DC1 Supporting Online Material for Phonemic Diversity Supports Serial Founder Effect Model of Language Expansion from Africa Quentin D. Atkinson* *E-mail: [email protected] Published 15 April 2011, Science 332, 346 (2011) DOI: 10.1126/science.1199295 This PDF file includes: Methods SOM Text Figs. S1 to S8 Tables S1 to S4 References
-
Upload
khangminh22 -
Category
Documents
-
view
1 -
download
0
Transcript of Supporting Online Material for
www.sciencemag.org/cgi/content/full/332/6027/346/DC1
Supporting Online Material for
Phonemic Diversity Supports Serial Founder Effect Model of Language Expansion from Africa
Quentin D. Atkinson*
*E-mail: [email protected]
Published 15 April 2011, Science 332, 346 (2011) DOI: 10.1126/science.1199295
This PDF file includes:
Methods SOM Text Figs. S1 to S8 Tables S1 to S4 References
1
Supporting Online Material for Phonemic diversity supports a serial founder effect model of language expansion from Africa Quentin D. Atkinson Email – [email protected] Table of Contents 1. Materials and Methods 1.1 Language Data 2 1.2 Modelling a serial founder effect 3 1.3 Alternatives to the single origin model 4 1.4 Accounting for non-independence within language families 5 1.5 Controlling for geographic variation in modern demography 6 1.6 Variation within and between language families 7 2. Supplementary Description and Discussion 1.1 Phonemic diversity and the serial founder effect 8 3. Supporting Figures 12 4. Supporting Tables 20 5. References 37
2
1. Materials and Methods
1.1 Language Data
Data on phoneme inventory size were taken from the World Atlas of Language
Structures (WALS - available online at http://www.wals.info/) (S1-S4) together with
information on each language’s taxonomic affiliation (family, subfamily and genus)
and geographic location (longitude and latitude). WALS contains information on
three elements of phonemic diversity – vowel (S2), consonant (S3) and tone (S4)
diversity – in a total of 567 languages. Due to uncertainty in ascertaining exact
inventory counts across languages, the WALS data are binned into ranges for vowel
(small [2-4], medium [5-6], large [7-14]), consonant (small [6-14], moderately small
[15-18], average [19-25], moderately large [26-33], large [34+]) and tone (no tone,
simple tone and complex tone) diversity. Uncertainty associated with these diversity
assignments is only expected to weaken any clinal relationship with geography.
WALS values for the three items were standardized (subtracting the mean value and
then dividing the difference by the standard deviation) so that they were on
comparable scales (mean = 0, standard deviation = 1). The standardized scores were
then averaged to produce a measure of total phonemic diversity in each language
(Table S1).
Since population demography is thought to affect phonemic diversity, WALS data
were combined with estimates of speaker population size and geographic distribution
as recorded in Ethnologue (S5), using ISO-639-3 reference codes listed for each
language in the WALS dataset and checking references by hand. Language area (km2)
was calculated based on digitized language maps (available from Global Mapping
International http://www.gmi.org) under a Robinson projection using the ArcGIS v9.1
software package. Population density was calculated as the number of speakers
divided by language area. As population size, language area and population density
were all positively skewed, log10 of these values was used as the predictor variable for
the reported regressions.

3
Any language listed as a creole or sign language was excluded from analysis, as were
all extinct languages (with population zero), leaving a total sample size of 504
languages (Table S1). Raising the population size threshold to exclude endangered
languages with population sizes of less than 50 did not appreciably change the results
presented in the paper.
1.2 Modelling a serial founder effect
A serial founder effect model of phonemic diversity was used to infer the most likely
origin of modern languages, following an approach outlined in studies of human
genetic and phenotypic diversity (S6). Under this model, during population expansion,
small founder groups are expected to carry less phonemic diversity than their larger
parent populations. A series of founder events should produce a gradient of
decreasing phonemic diversity with increasing distance from the origin. Hence, the
point of language origin is predicted to show the strongest negative correlation
between phonemic diversity and distance from the origin. This approach does not
attempt to infer particular phylogenetic relationships between languages, nor does it
require that the probability of encountering a particular phoneme changes with
distance from the origin (although it might), only that on average phonemic diversity
in languages will decline.
A series of multiple regressions using distance from the origin to predict phonemic
diversity were carried out in R (S7) for 2560 potential origin locations around the
globe, corresponding to the locations of all the languages in the WALS database. This
sampling strategy covers the entire range of human colonization, with the advantage
that areas that were not colonized (e.g. oceans, deserts and the poles) are not sampled
and resolution is higher in more heavily populated areas. Since log10 of population
size was found to be an important predictor of phonemic diversity (S8), to control for
regional variation in speaker population size, unless otherwise stated, log population
size was also included as a predictor in the regressions reported.
Great circle distances (following the curvature of the earth) between the putative
origins and each of the 504 languages for which there was phoneme information were
calculated using the Haversine function (S9). So that the distances used more
4
accurately represented plausible migration scenarios (e.g. excluding the possibility of
crossing the Indian Ocean or traversing the poles), any distances between continents
were constrained to pass through a set of five key waypoints (S10), corresponding to
approximate migration corridors between continents (Table S4; Figure S8).
To identify the set of putative origin locations that best fit the observed distribution of
phonemic diversity under a serial founder effect model, model fit was evaluated using
the Bayesian Information Criterion (BIC) (S11). Following the genetic studies (S6),
models within four BIC units of the best fit model were taken to have “considerable
support” (S11) and this threshold was used to infer the most likely region of language
origin.
1.3 Alternatives to the single origin model
To investigate the possibility of multiple language origins, distance from a second
origin location was added as a predictor to the model incorporating population size
and distance from the best-fit origin in Africa. Any second language origin that has
contributed significantly to extant phonemic diversity should produce a cline in
residual phonemic diversity after correcting for population size and distance from the
best-fit origin in Africa. As above, model fit was evaluated using BIC.
Even under language monogenesis, it is possible that the observed global cline in
phonemic diversity is the result of expansions following the last glacial maximum
(LGM) into northern Eurasia, the Americas and the remote Pacific, rather than a
single expansion from Africa. To test this explanation, the 504 languages in the
WALS sample were categorized according to whether they are located in areas likely
to have been colonized (or recolonized) after the LGM. This included Eurasia north of
40 degrees latitude (S12), all of the Americas and all islands in the Pacific and Indian
Ocean first settled during the Austronesian expansion (Table S1). These more
recently colonized regions have lower average phonemic diversity than the rest of the
world (t=-6.597, df=503, p<0.001). To test whether this can explain the global cline in
phonemic diversity from Africa, colonization after the LGM was added as a binary
factor to a regression incorporating population size and distance from Africa - only
population size and distance from Africa were significant predictors (rdistance=-0.401,
5
p<0.001; rpopulation=0.152, p=0.001; rLGM=0.032, p=0.419). Population size and
distance from Africa are also significant predictors of phonemic diversity in a
regression with areas colonized after the LGM excluded (rdistance=-0.511, p<0.001;
rpopulation=0.253, p<0.001). Distance from Africa remains a significant predictor in the
family level analysis (rdistance=-0.328, p<0.028) and hierarchical linear model
(!distance=-3.872 – -2.525 " 10-5 [95% HPD], p<0.001).
1.4 Accounting for non-independence within language families
Following studies examining the founder effect in human genetic and phenotypic
diversity (S6), the initial analyses were carried out using linear regressions. However,
like our genes, languages contain a legacy of their evolutionary past. Failure to allow
for such phylogenetic non-independence can lead to overestimating degrees of
freedom and an increase in type I errors (S13). The issue of non-independence
between related languages was dealt with in three ways. First, analyses were repeated
at the language family level, taking means of the variables of interest across all 50
families comprising more than one language (Table S2). For those variables that had
been logged, the mean of the logged value was used. Distances were calculated from
each putative origin to the centroid location of each language family. Model fit was
evaluated using BIC. This approach reduces degrees of freedom by only considering
variation between language families, weighting each language family equally.
Second, WALS classifies languages at three taxonomic levels – family, sub-family
and genus. The effect sizes observed here on the global sample of languages mean we
do not expect to reliably detect a serial founder effect separately within each of the
language families in WALS. Instead, the initial individual language analyses were
repeated on the full data set using a hierarchical linear regression framework to model
dependencies at each taxonomic level. This approach applies a variance structure to
the data that accounts for relatedness between languages at each level. Analyses were
carried out in R (S7) using the lmer function in the lme4 package (S14). P values and
credibility intervals on model coefficients (!) were estimated using Markov Chain
Monte Carlo sampling implemented in the pvals.fnc function as part of the
LanguageR package (S15). Reported model fit was evaluated using BIC, although the
6
same results applied using residual maximum likelihood (REML) (S16). Models
relating phonemic diversity to population size and distance from the best-fit origin in
Africa (together and separately) were run with and without interaction effects across
family groups. Adding an interaction effect did not significantly improve model fit as
measured by BIC and REML, indicating that the patterns reported here reflect
consistent trends within families that hold across the globe.
Finally, as in ref. (S6), the founder effect regressions were repeated with Mantel and
partial Mantel tests, an approach to investigating correlations between distance
matrices that uses a permutation test to avoid assumptions about the independence of
data points and the statistical distributions underlying variables. Mantel tests were
carried out on the full language dataset in Arlequin 3.1 (S17), using differences in
distance from the origin and log population size to predict differences in phonemic
diversity. The results from the Mantel tests were in line with results obtained under
the linear models and are reported in Table S3.
1.5 Controlling for modern demography
To control for possible geographic variation in demography, in addition to speaker
population size, I examined the effect of three other demographic factors that could
plausibly influence phonemic diversity - geographic area (km2), population density
(speaker population per km2) and local language diversity (languages within a fixed
radius). Geographic area and population density may influence the diversification of
languages into dialect groups with different phoneme inventories. Population density
may also be a proxy for effective population size – the number of speakers an
individual actually comes into contact with. Local language density gives an
indication of the number of other languages that speakers of the target language are
exposed to and so may affect rates of borrowing of phonemes. Local language
diversity was calculated based on the total number of languages listed within a
500km, 1000km, 2000km and 3000km radius of each of the 504 sampled languages.
The number of languages within 1000km showed the strongest correlation with
phonemic diversity and was used to generate the reported results.
7
First, all of the demographic variables were included in a regression predicting
phonemic diversity together with speaker population size and distance from the best-
fit origin in Africa. Second, a combination of forwards and backwards stepwise
regression based on BIC, as implemented in the step function in R (S7), was used to
identify the key predictors of phoneme inventory size at the individual language and
language-family levels. At the individual language level, the best model includes
distance from Africa (rdistance=-0.429, p<0.001), log of population size
(rpopulation=0.181, p<0.001) and geographic area (rarea=-0.107, p=0.016). At the family
level, the best model includes distance from Africa (rdistance=-0.401, p<0.001) and log
of population size (rpopulation=0.300, p<0.036).
1.6 Variation in phonemic diversity within and between language families
Claims about the deep history of human language are frequently criticized because
languages are thought to change too rapidly and too unpredictably to allow ancestral
inferences beyond ~10kya (S18). However, recent work has shown that elements of
language, such as commonly used words (S19) and some phonemes (S20) can be
highly stable, some persisting for tens of millennia (S19). Variation in phoneme
inventory size within versus between families gives insight into rates of change in
phonemic diversity through time. If phonemic diversity were highly unstable,
variation within families should be high, and language family should explain little or
none of the variance in phonemic diversity around the globe. Conversely, relative
stability should preserve phoneme inventory size across a family, making language
family a good predictor of phonemic diversity globally. In a general linear model,
language family as a factor explains 50% of the variance in phonemic diversity
(adjusted r-squared=0.502, df=49, p<0.001) and 48% of the variance in phonemic
diversity across the largest 10 families (adjusted r-squared=0.476, df=9, p<0.001).
This level of conservation within major language families indicates that robust
statistical patterns in global phonemic diversity can persist for many millennia and
could plausibly reflect a time scale on the order of the African exodus.

8
2. Supplementary Description and Discussion
2.1 Phonemic diversity and the serial founder effect
We expect the number of phonemes present in a language today to reflect past
phoneme inventory size, combined with complex group dynamic processes driving
relative rates of merging, splitting and borrowing of phonemes (S21- S24). Many
factors are likely to influence the rates at which these processes occur (S23, S24), and
their relative rates will determine the trajectory of phonemic diversity in a language
through time.
In population genetics, the founder effect describes the loss of genetic diversity that
occurs when a small group breaks off from a larger parent population to found a new
population. This occurs when variants from the parent population are not passed on to
the new descendent population or are lost during the subsequent population bottleneck
due to high rates of drift. Following a bottleneck, genetic diversity will increase again
as mutation and migration introduce new variants into the growing population. The
same scenario can apply to phonemic diversity if founder populations sometimes
sample only a subset of phonemes from the parent population (e.g., from a dialect of
the parent language) or are likely to lose phonemes during the subsequent population
bottleneck. Splitting and borrowing may still generate new phonemes, but as in the
genetic case, the balance will have been temporarily shifted toward diversity loss.
The loss of phonemic diversity following a population bottleneck is predicted under a
range of cultural transmission models (S21, S25- S29). This effect is expected to
operate on top of any immediate reduction of phonemic diversity due to sampling
only part of the dialect variation from the parent population. For example, Henrich
(S25) uses the Price equation (S30, S31) and social learning literature to derive a
model of cultural transmission in which learners preferentially copy cultural variants
from the most prestigious or skilful individuals. When copying is highly accurate this
will produce an ever-increasing cultural repertoire. However, if copying involves
error, such that some elements are lost in transmission between individuals, then,
across a range of parameter values, smaller groups tend to have fewer cultural
variants. Although applied in the context of the cumulative evolution of material
9
culture, Henrich makes explicit the model’s relevance to the evolution of other
socially transmitted traits, including phonemes - where individuals copy phoneme
distinctions made by the most proficient speakers (with some loss), small population
size will reduce phoneme diversity. De Boer (S26, S27) models the evolution of
vowel inventories using a different approach, in which individuals copy any members
of their group with some error, and finds the same population size effect. A linguistic
founder effect also emerges naturally from recent Darwinian approaches to language
change, which treat phonemic variants like competing alleles in a population of
utterances (S21, S29). Communication constraints may play an additional role.
Increased shared information in small close-knit communities is thought to increase
the tolerance for reduced contrastive possibilities associated with smaller phoneme
inventories (S28). Simulations of language evolution also predict that rates of change
will be faster in small populations, slowing as populations grow (S32), which may act
to preserve the effects of any historical bottlenecks1.
The analyses presented here (Fig. S1) and previous research using a different data set
and coding scheme (S8) confirm that languages with smaller speaker populations do
indeed have smaller phoneme inventories, consistent with a linguistic founder effect.
Empirical findings now also support the existence of a cultural founder effect in
modern human material culture (S25, S33), Acheulean handaxes (S34), Polynesian
canoe designs (S35) and chaffinch song (S36). Recent phylogenetic evidence suggests
a linguistic founder effect has operated to produce punctuated bursts of evolution
during the formation of new languages (S37).
One prediction that arises if phoneme distinctions are more likely to be lost in small
founder populations is that a succession of founder events during range expansion
should produce a progressive reduction in phonemic diversity with increasing
distance from the point of origin, paralleling the serial founder effect in population
genetics (S38). Under this model, populations at the periphery of an expansion into
new territory will have undergone more founder events more recently and over
greater distances than populations nearer the origin. Over the course of an expansion,
1 Note that faster rates of change in small populations do not entail greater within-population phonemic diversity. Whilst new distinctions can spread to fixation more quickly in small populations, existing distinctions are more easily lost.

10
peripheral languages will therefore have experienced an increased likelihood of
phoneme loss compared to their relatives nearer the origin. Later localized population
movements after the initial expansion could also influence patterns of diversity.
Whilst this may add noise to the data, as in the genetic case, populations at the
periphery are still expected to carry the legacy of more founder events and hence have
fewer phonemes. The impact of more recent founder events on any global trend is
limited by the smaller distances involved and the potential to borrow phonemes when
moving into already colonized areas (the linguistic analogue to gene flow). By
contrast, on a global scale, contact-induced borrowing following expansion may help
to maintain a cline, since neighbouring populations at similar points in the expansion
(e.g., in Africa versus in Australia) are more likely to encounter similar phonemes and
levels of diversity. As with the human genetic and phenotypic data, despite more
recent population movements, we therefore expect a large-scale expansion from a
single origin to generate a global cline in phonemic diversity, decreasing with
increasing distance from the origin.
The serial founder effect model of human genetic and phenotypic diversity has been
an important line of evidence supporting a primary African origin to modern humans
(S6, S38- S42). Here I use the same approach to examine the fit of a serial founder
effect model to global variation in phonemic diversity, searching the globe for the
putative origin location that produces the strongest relationship between phoneme
inventory size and geographic distance. This approach does not assume any particular
origin location or any clinal patterning in phonemic diversity. Rather, model support
at each origin location is evaluated against support for all other putative origin
locations and against the null hypothesis that there is no relationship between
phonemic diversity and distance from the origin. No clear relationship between the
number of phonemes in a language and geography would suggest either that modern
languages are the result of polygenesis (many independent language lineage origins)
or that any possible founder effect is too weak to produce a detectable expansion
signal in the data. Alternatively, an appreciable linguistic founder effect operating
over the course of a major expansion of languages is expected to produce a
geographic cline in phonemic diversity, decreasing from the point of language origin.
11
It is worth noting that fitting a serial founder effect model to phoneme inventory data
describes an inherently stochastic (probabilistic) process and does not entail that
phonemic diversity is entirely determined by population size via a serial founder
effect. Distance from the best-fit origin in Africa and population size are shown to be
significant predictors of phonemic diversity, explaining approximately 30% of global
variation, but other socio-linguistic processes (S23, S24) and more recent population
movements clearly also play a role. Neither of these factors are expected to
systematically bias results to produce the observed global cline in phonemic diversity.
12
A
B
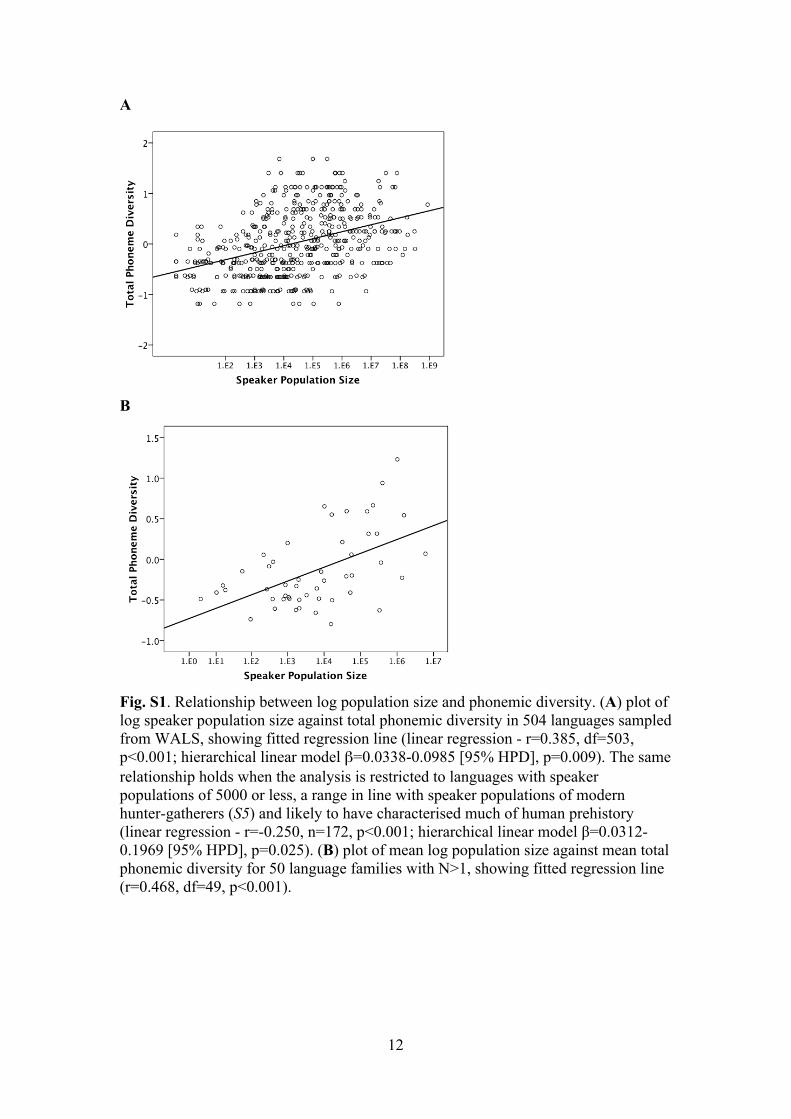
Fig. S1. Relationship between log population size and phonemic diversity. (A) plot of log speaker population size against total phonemic diversity in 504 languages sampled from WALS, showing fitted regression line (linear regression - r=0.385, df=503, p<0.001; hierarchical linear model !=0.0338-0.0985 [95% HPD], p=0.009). The same relationship holds when the analysis is restricted to languages with speaker populations of 5000 or less, a range in line with speaker populations of modern hunter-gatherers (S5) and likely to have characterised much of human prehistory (linear regression - r=-0.250, n=172, p<0.001; hierarchical linear model !=0.0312-0.1969 [95% HPD], p=0.025). (B) plot of mean log population size against mean total phonemic diversity for 50 language families with N>1, showing fitted regression line (r=0.468, df=49, p<0.001).
13
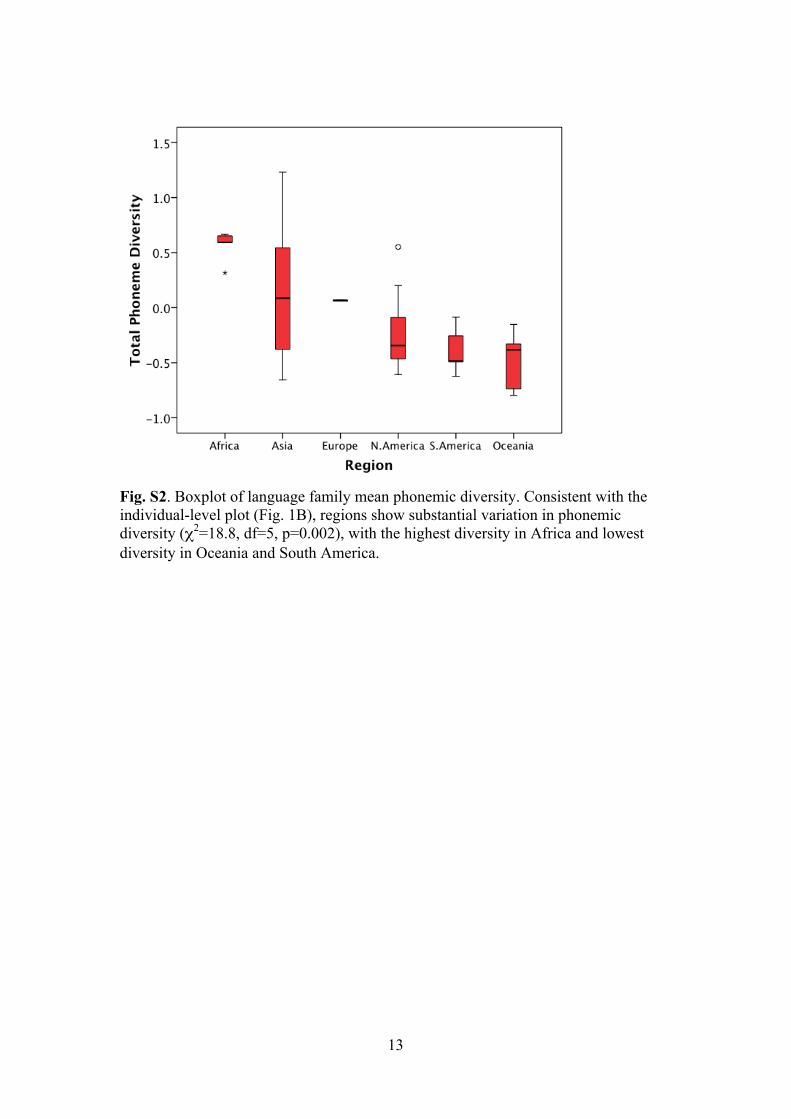
Fig. S2. Boxplot of language family mean phonemic diversity. Consistent with the individual-level plot (Fig. 1B), regions show substantial variation in phonemic diversity (#2=18.8, df=5, p=0.002), with the highest diversity in Africa and lowest diversity in Oceania and South America.
14
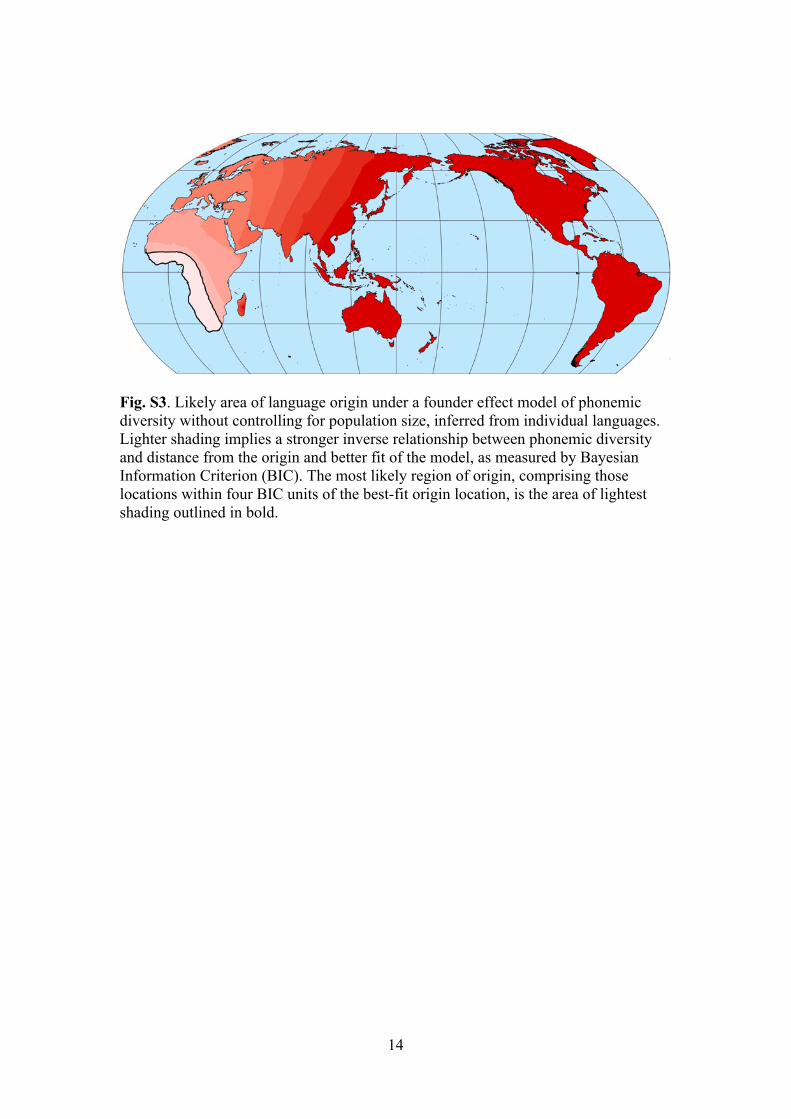
Fig. S3. Likely area of language origin under a founder effect model of phonemic diversity without controlling for population size, inferred from individual languages. Lighter shading implies a stronger inverse relationship between phonemic diversity and distance from the origin and better fit of the model, as measured by Bayesian Information Criterion (BIC). The most likely region of origin, comprising those locations within four BIC units of the best-fit origin location, is the area of lightest shading outlined in bold.

15
Fig. S4. Likely area of language origin under a founder effect model of phonemic diversity controlling for population size, inferred from individual languages using a hierarchical linear model that accounts for dependencies at the family, subfamily and genus levels. Lighter shading implies a stronger inverse relationship between phonemic diversity and distance from the origin and better fit of the model, as measured by Bayesian Information Criterion (BIC). The most likely region of origin, comprising those locations within four BIC units of the best-fit origin location, is the area of lightest shading outlined in bold. The effect of distance from origin in the best-fit model remains highly significant (!=-3.94 – -1.94 x 10⁻⁵ [95% HPD], p=<0.001).
16
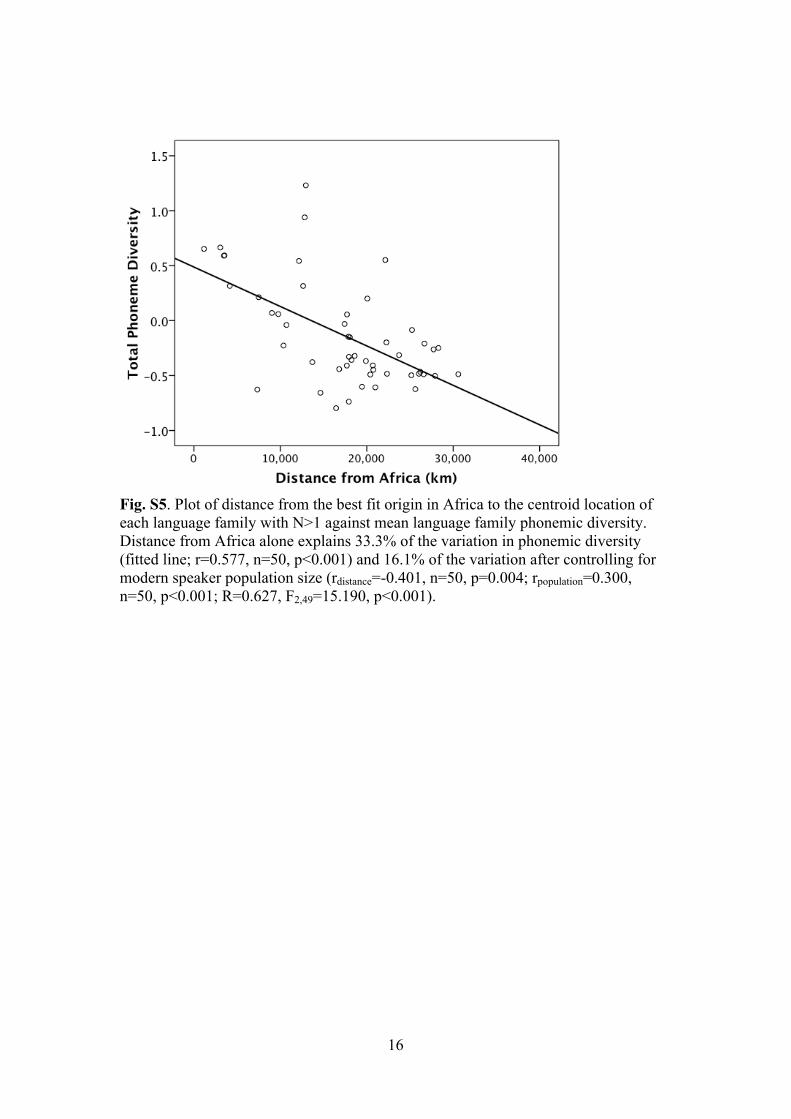
Fig. S5. Plot of distance from the best fit origin in Africa to the centroid location of each language family with N>1 against mean language family phonemic diversity. Distance from Africa alone explains 33.3% of the variation in phonemic diversity (fitted line; r=0.577, n=50, p<0.001) and 16.1% of the variation after controlling for modern speaker population size (rdistance=-0.401, n=50, p=0.004; rpopulation=0.300, n=50, p<0.001; R=0.627, F2,49=15.190, p<0.001).
17
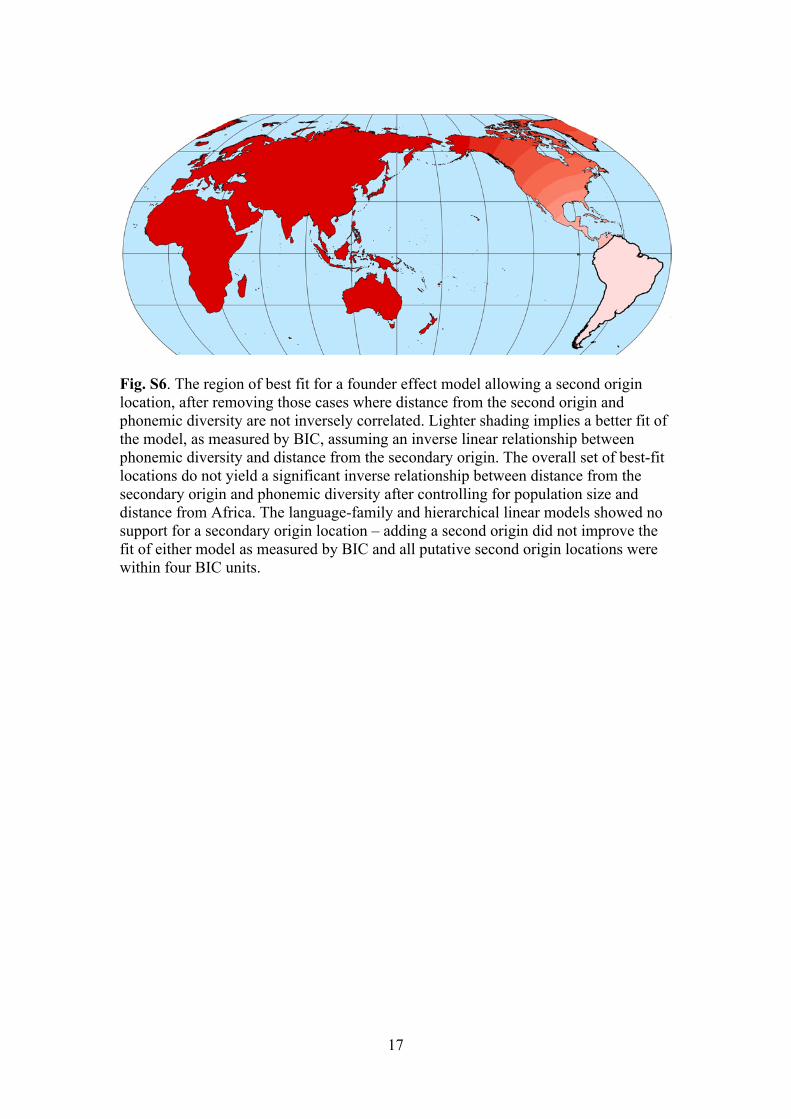
Fig. S6. The region of best fit for a founder effect model allowing a second origin location, after removing those cases where distance from the second origin and phonemic diversity are not inversely correlated. Lighter shading implies a better fit of the model, as measured by BIC, assuming an inverse linear relationship between phonemic diversity and distance from the secondary origin. The overall set of best-fit locations do not yield a significant inverse relationship between distance from the secondary origin and phonemic diversity after controlling for population size and distance from Africa. The language-family and hierarchical linear models showed no support for a secondary origin location – adding a second origin did not improve the fit of either model as measured by BIC and all putative second origin locations were within four BIC units.
18
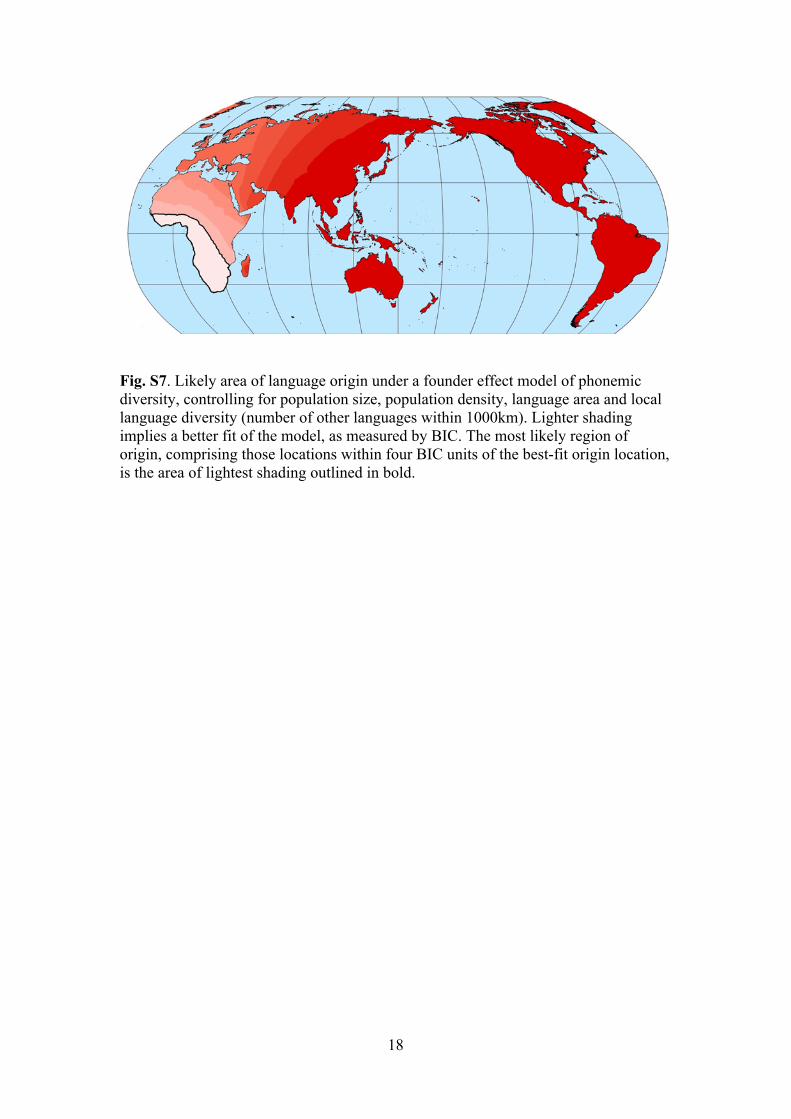
Fig. S7. Likely area of language origin under a founder effect model of phonemic diversity, controlling for population size, population density, language area and local language diversity (number of other languages within 1000km). Lighter shading implies a better fit of the model, as measured by BIC. The most likely region of origin, comprising those locations within four BIC units of the best-fit origin location, is the area of lightest shading outlined in bold.
19
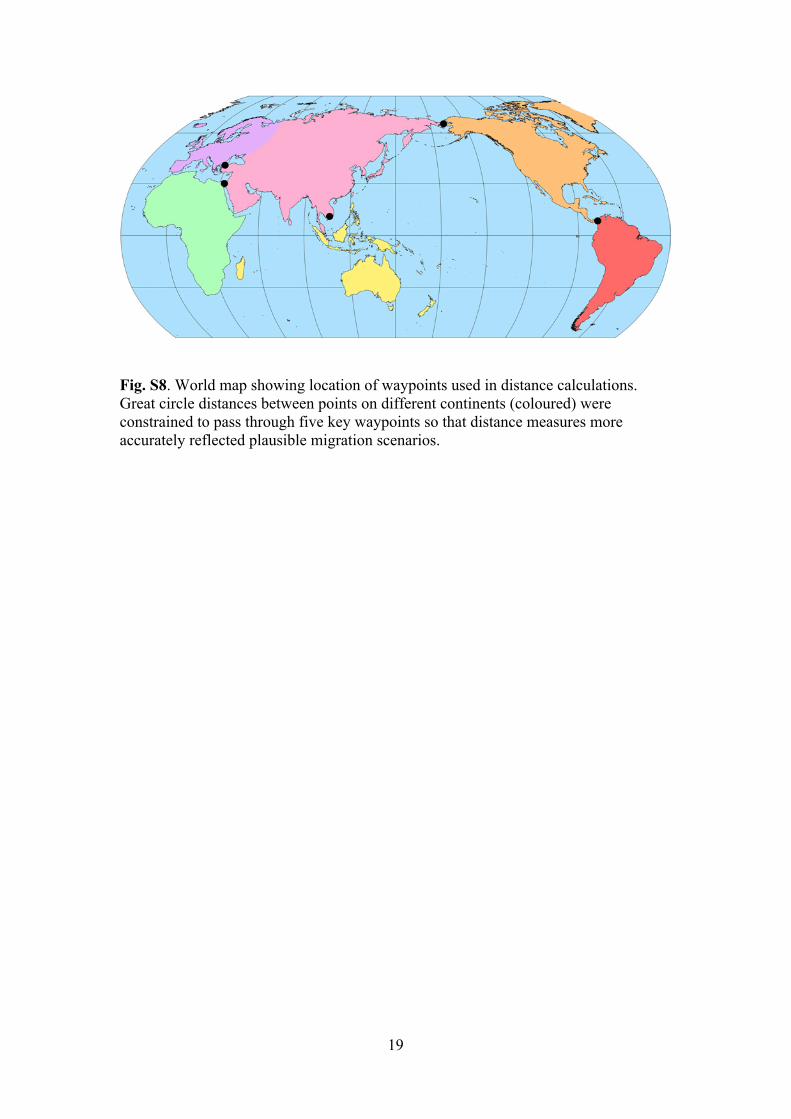
Fig. S8. World map showing location of waypoints used in distance calculations. Great circle distances between points on different continents (coloured) were constrained to pass through five key waypoints so that distance measures more accurately reflected plausible migration scenarios.
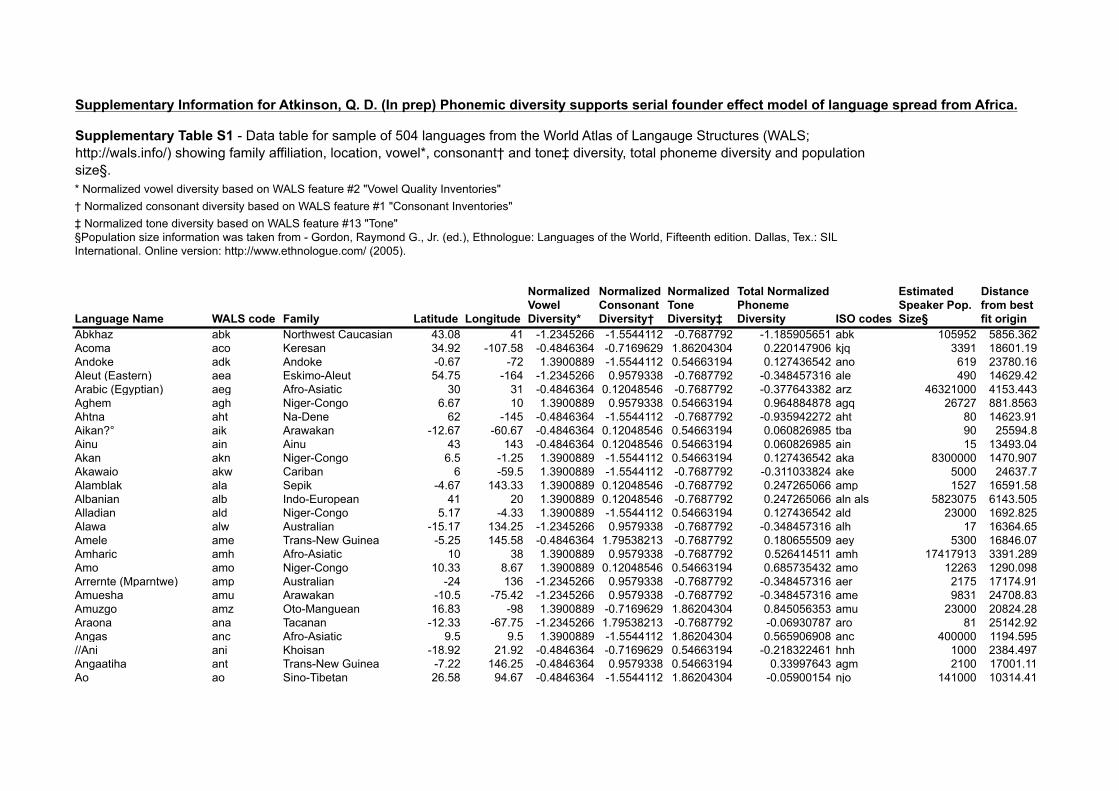
Supplementary Information for Atkinson, Q. D. (In prep) Phonemic diversity supports serial founder effect model of language spread from Africa.
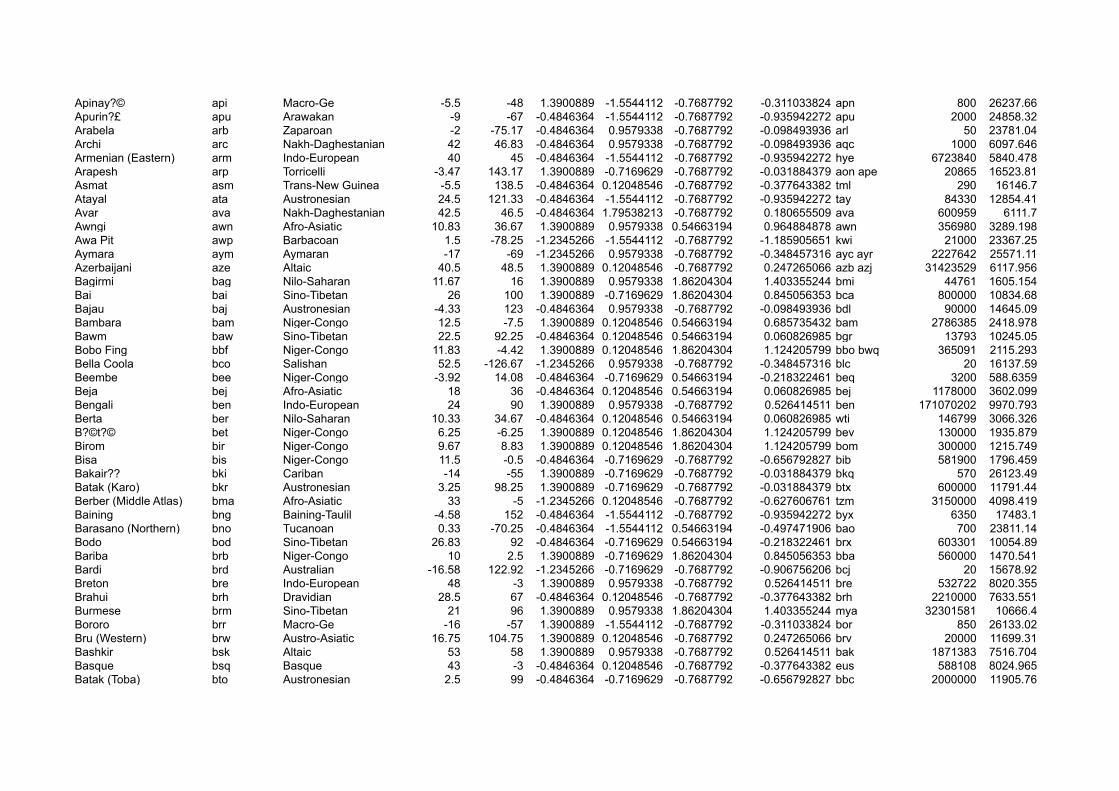
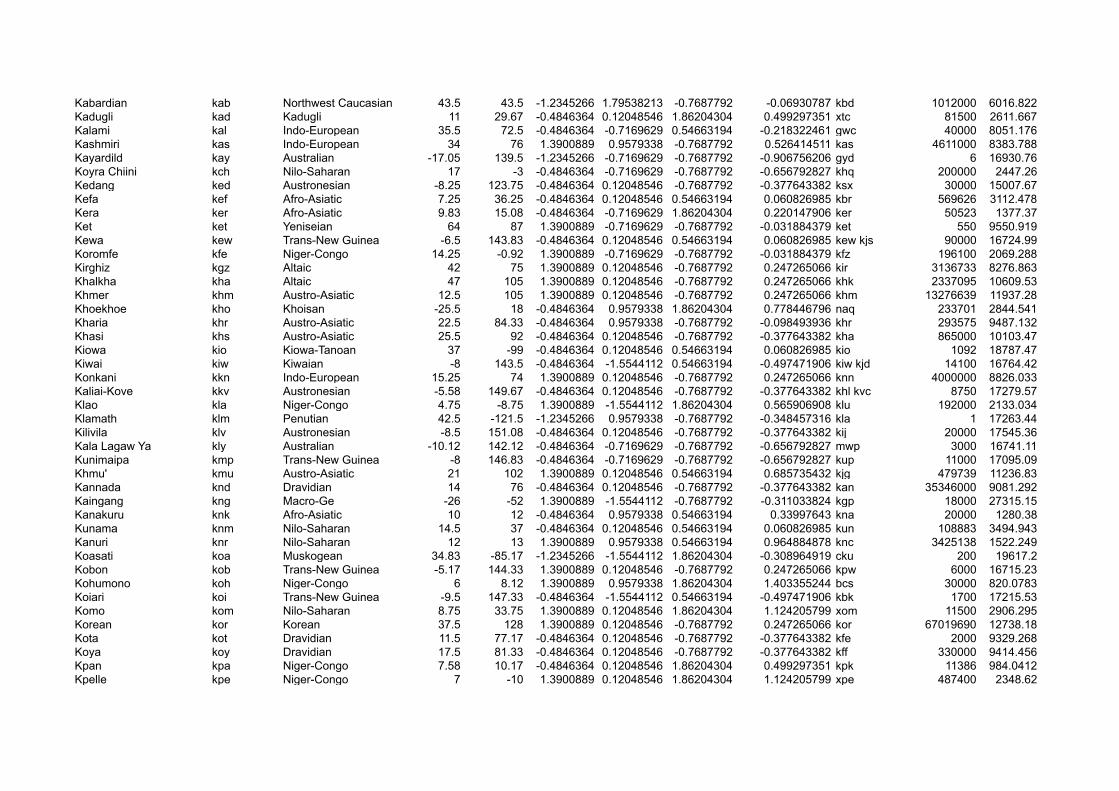
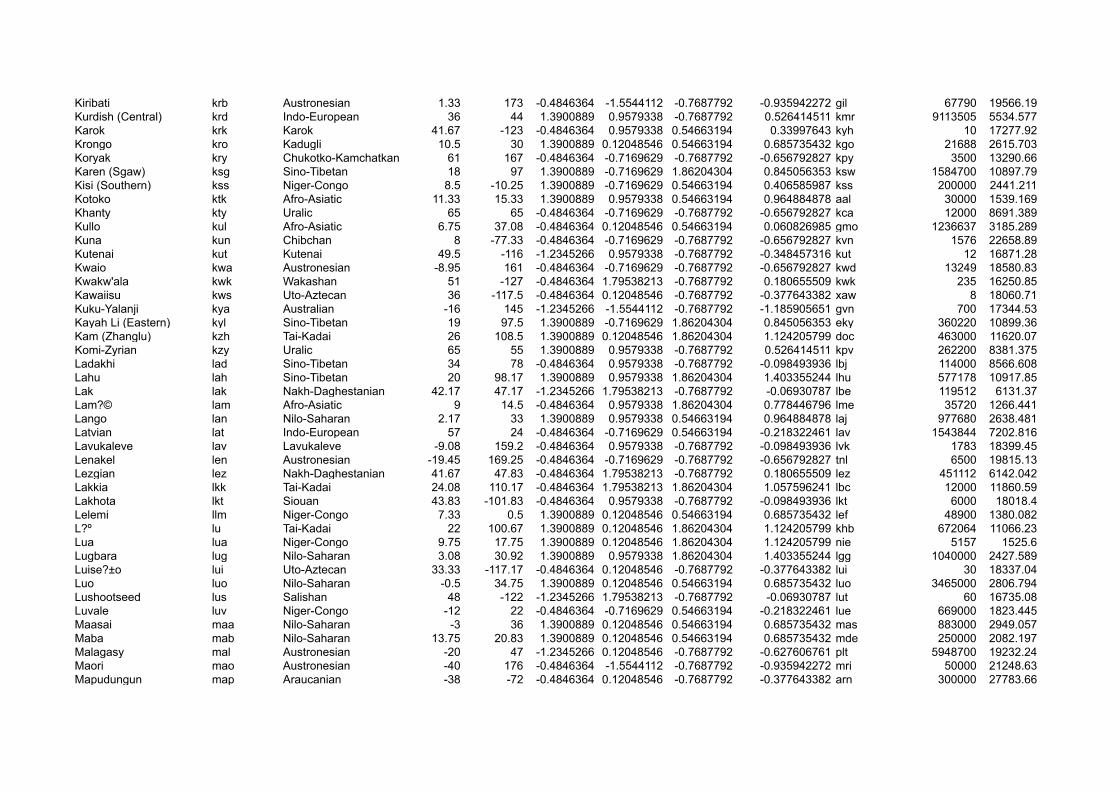
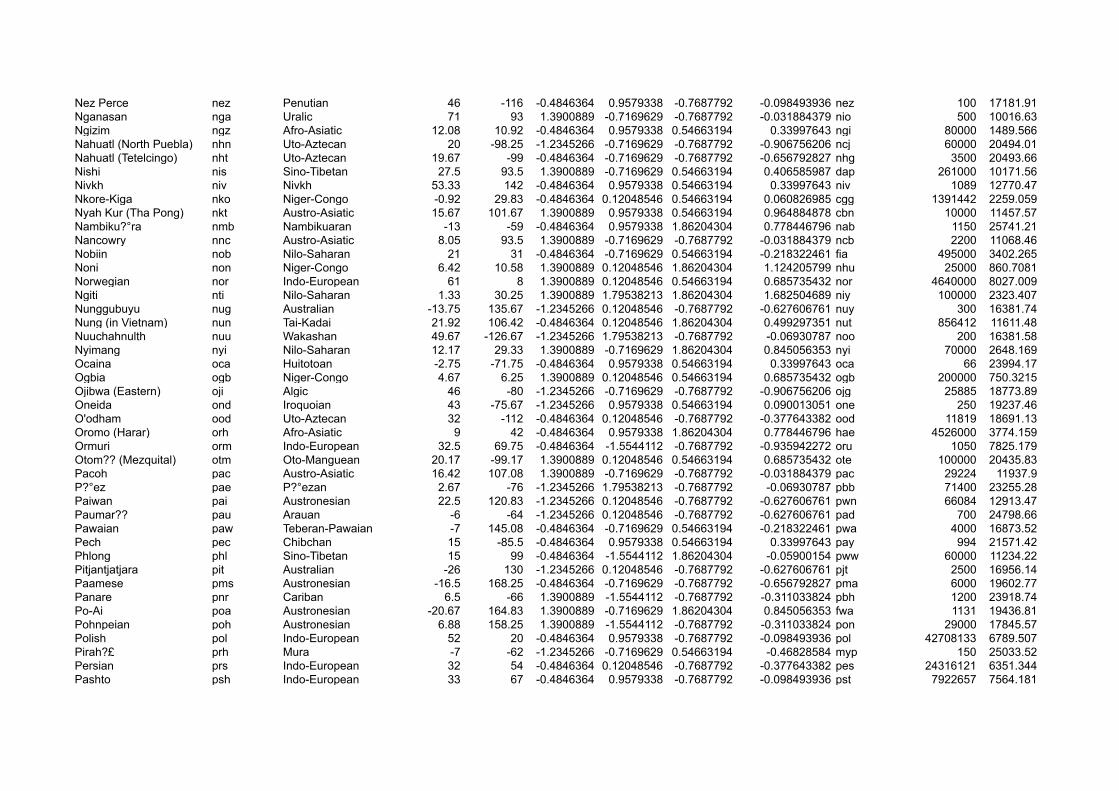
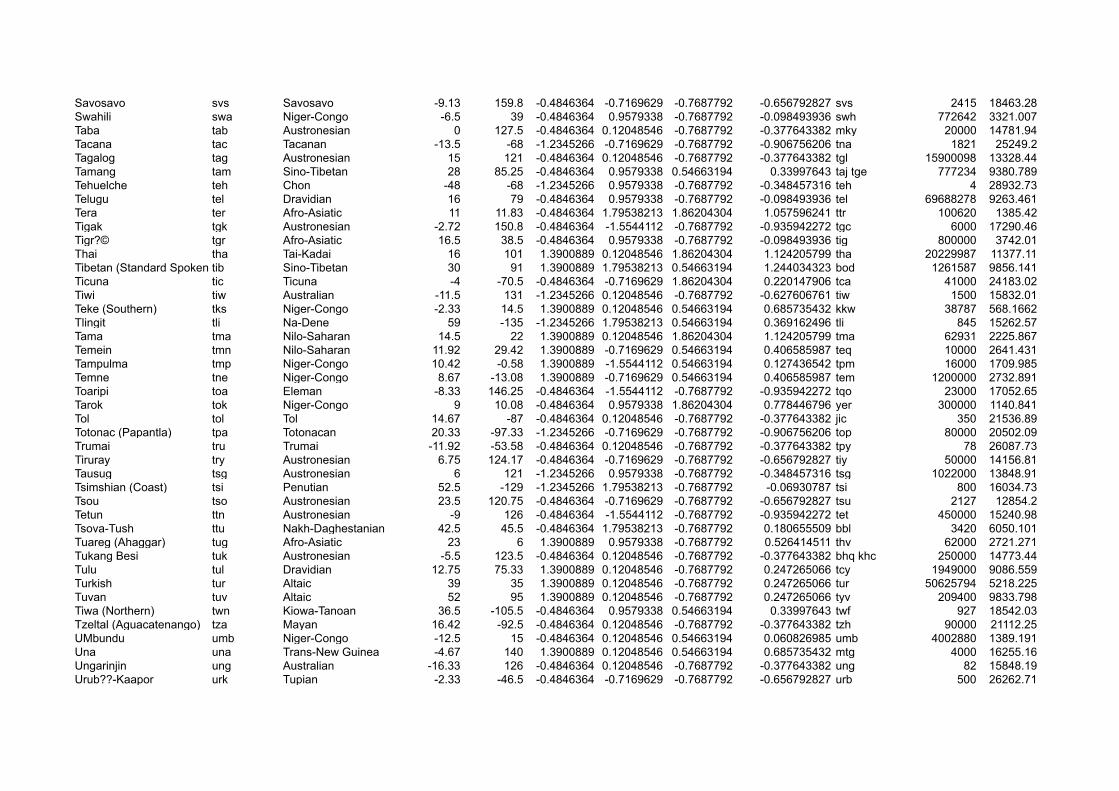
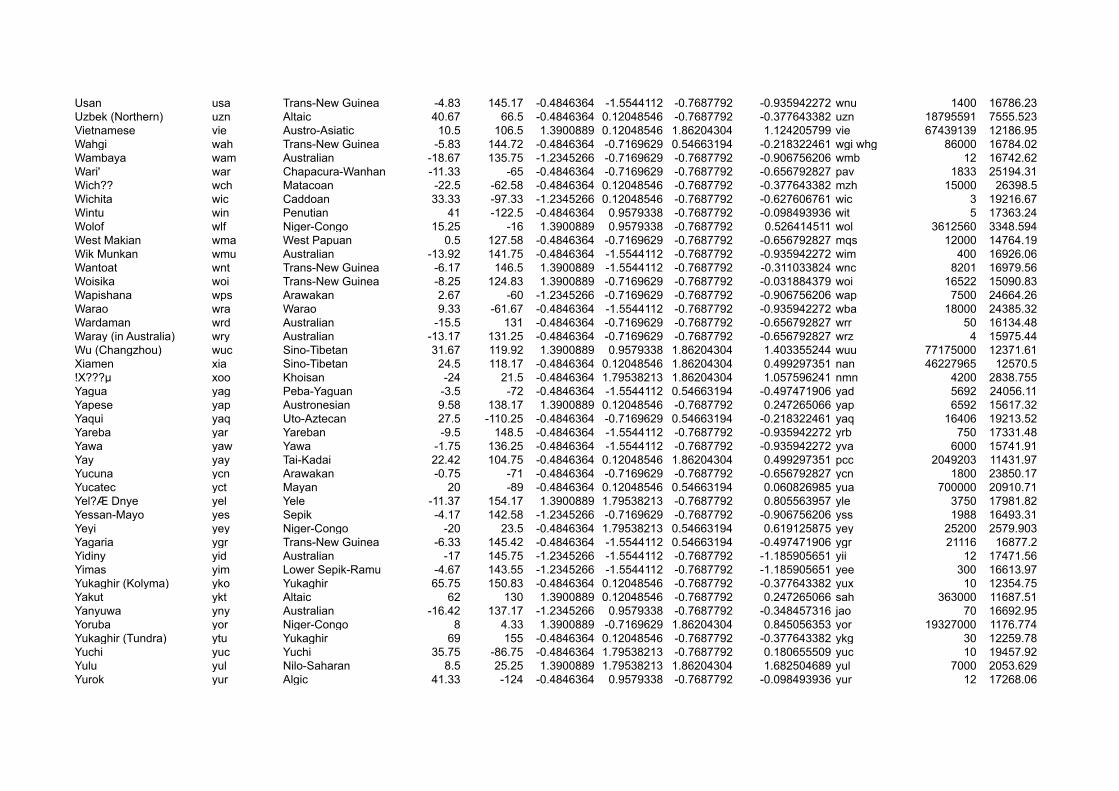
* Normalized vowel diversity based on WALS feature #2 "Vowel Quality Inventories" † Normalized consonant diversity based on WALS feature #1 "Consonant Inventories" ‡ Normalized tone diversity based on WALS feature #13 "Tone" §Population size information was taken from - Gordon, Raymond G., Jr. (ed.), Ethnologue: Languages of the World, Fifteenth edition. Dallas, Tex.: SIL International. Online version: http://www.ethnologue.com/ (2005).
Language Name WALS code Family Latitude Longitude
Normalized Vowel Diversity*
Normalized Consonant Diversity†
Normalized Tone Diversity‡
Total Normalized Phoneme Diversity ISO codes
Estimated Speaker Pop. Size§
Distance from best fit origin
Abkhaz abk Northwest Caucasian 43.08 41 -1.2345266 -1.5544112 -0.7687792 -1.185905651 abk 105952 5856.362Acoma aco Keresan 34.92 -107.58 -0.4846364 -0.7169629 1.86204304 0.220147906 kjq 3391 18601.19Andoke adk Andoke -0.67 -72 1.3900889 -1.5544112 0.54663194 0.127436542 ano 619 23780.16Aleut (Eastern) aea Eskimo-Aleut 54.75 -164 -1.2345266 0.9579338 -0.7687792 -0.348457316 ale 490 14629.42Arabic (Egyptian) aeg Afro-Asiatic 30 31 -0.4846364 0.12048546 -0.7687792 -0.377643382 arz 46321000 4153.443Aghem agh Niger-Congo 6.67 10 1.3900889 0.9579338 0.54663194 0.964884878 agq 26727 881.8563Ahtna aht Na-Dene 62 -145 -0.4846364 -1.5544112 -0.7687792 -0.935942272 aht 80 14623.91Aikan?° aik Arawakan -12.67 -60.67 -0.4846364 0.12048546 0.54663194 0.060826985 tba 90 25594.8Ainu ain Ainu 43 143 -0.4846364 0.12048546 0.54663194 0.060826985 ain 15 13493.04Akan akn Niger-Congo 6.5 -1.25 1.3900889 -1.5544112 0.54663194 0.127436542 aka 8300000 1470.907Akawaio akw Cariban 6 -59.5 1.3900889 -1.5544112 -0.7687792 -0.311033824 ake 5000 24637.7Alamblak ala Sepik -4.67 143.33 1.3900889 0.12048546 -0.7687792 0.247265066 amp 1527 16591.58Albanian alb Indo-European 41 20 1.3900889 0.12048546 -0.7687792 0.247265066 aln als 5823075 6143.505Alladian ald Niger-Congo 5.17 -4.33 1.3900889 -1.5544112 0.54663194 0.127436542 ald 23000 1692.825Alawa alw Australian -15.17 134.25 -1.2345266 0.9579338 -0.7687792 -0.348457316 alh 17 16364.65Amele ame Trans-New Guinea -5.25 145.58 -0.4846364 1.79538213 -0.7687792 0.180655509 aey 5300 16846.07Amharic amh Afro-Asiatic 10 38 1.3900889 0.9579338 -0.7687792 0.526414511 amh 17417913 3391.289Amo amo Niger-Congo 10.33 8.67 1.3900889 0.12048546 0.54663194 0.685735432 amo 12263 1290.098Arrernte (Mparntwe) amp Australian -24 136 -1.2345266 0.9579338 -0.7687792 -0.348457316 aer 2175 17174.91Amuesha amu Arawakan -10.5 -75.42 -1.2345266 0.9579338 -0.7687792 -0.348457316 ame 9831 24708.83Amuzgo amz Oto-Manguean 16.83 -98 1.3900889 -0.7169629 1.86204304 0.845056353 amu 23000 20824.28Araona ana Tacanan -12.33 -67.75 -1.2345266 1.79538213 -0.7687792 -0.06930787 aro 81 25142.92Angas anc Afro-Asiatic 9.5 9.5 1.3900889 -1.5544112 1.86204304 0.565906908 anc 400000 1194.595//Ani ani Khoisan -18.92 21.92 -0.4846364 -0.7169629 0.54663194 -0.218322461 hnh 1000 2384.497Angaatiha ant Trans-New Guinea -7.22 146.25 -0.4846364 0.9579338 0.54663194 0.33997643 agm 2100 17001.11Ao ao Sino-Tibetan 26.58 94.67 -0.4846364 -1.5544112 1.86204304 -0.05900154 njo 141000 10314.41
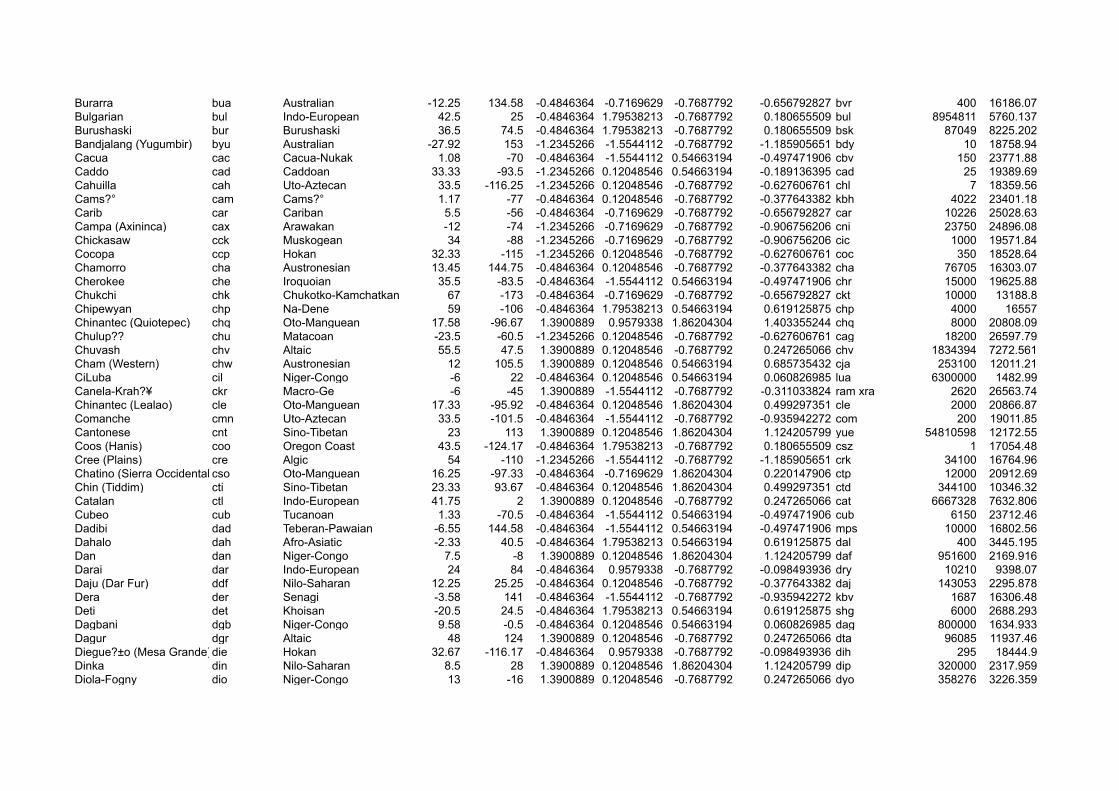
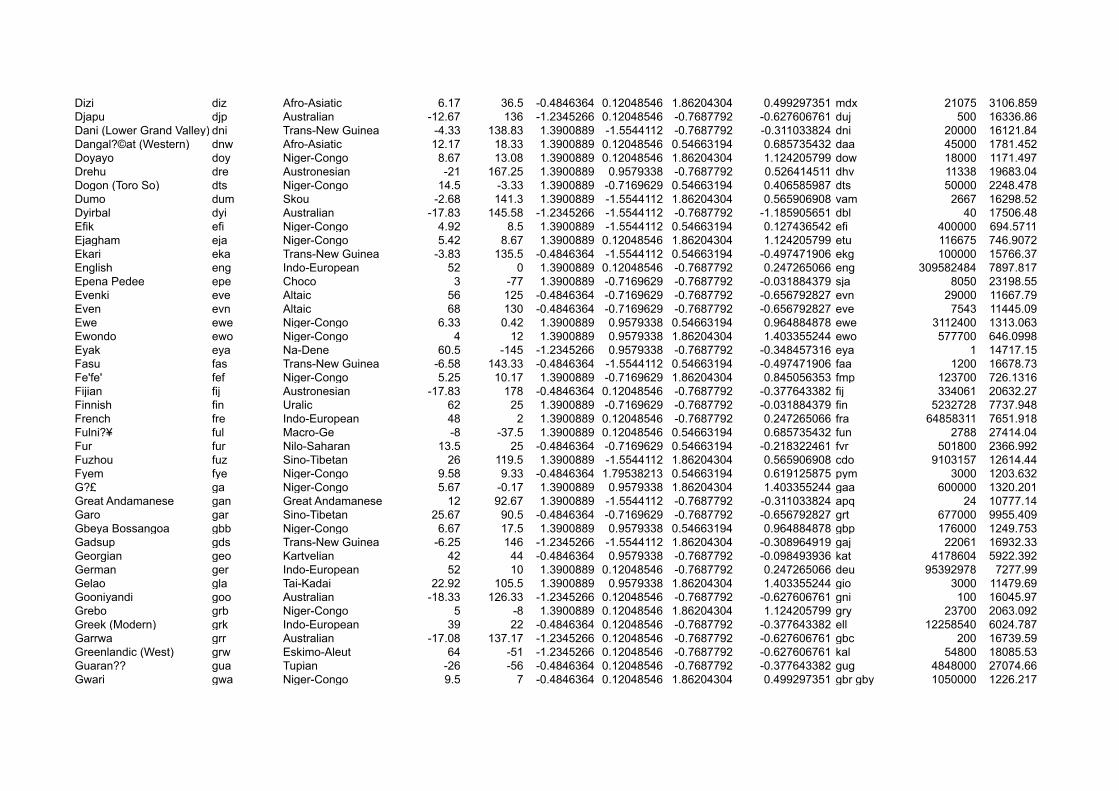
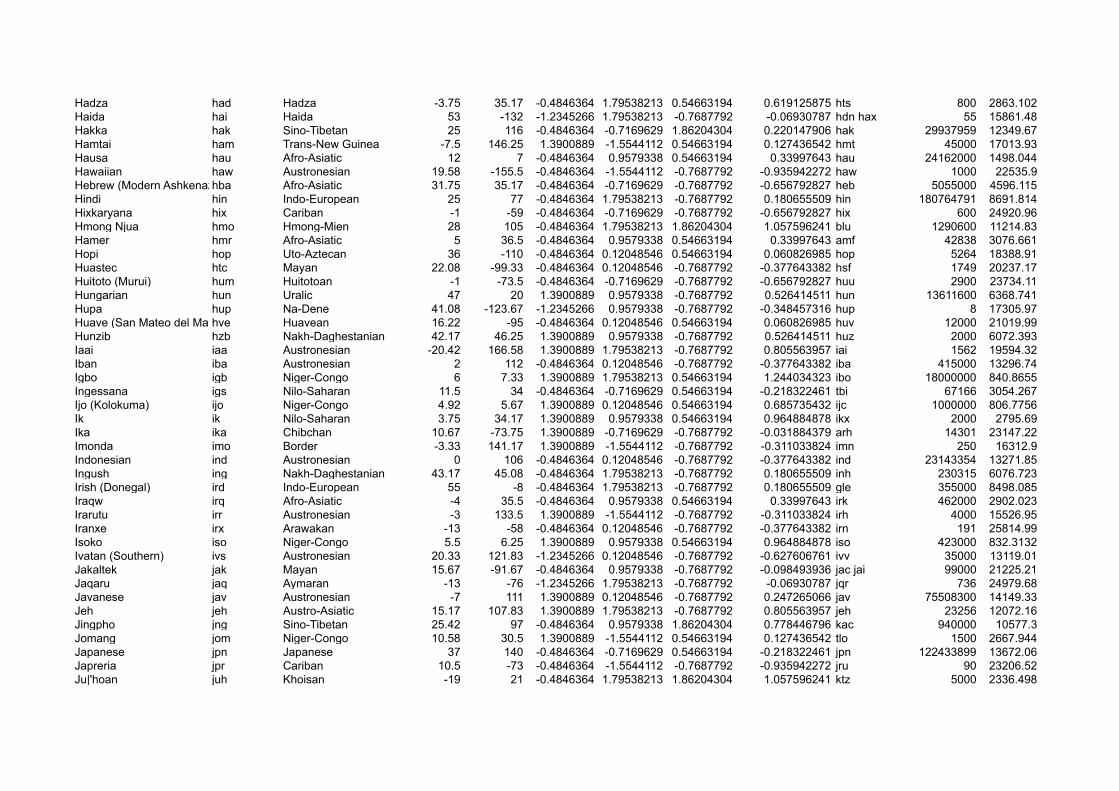
Supplementary Table S1 - Data table for sample of 504 languages from the World Atlas of Langauge Structures (WALS; http://wals.info/) showing family affiliation, location, vowel*, consonant† and tone‡ diversity, total phoneme diversity and population size§.
Apinay?© api Macro-Ge -5.5 -48 1.3900889 -1.5544112 -0.7687792 -0.311033824 apn 800 26237.66Apurin?£ apu Arawakan -9 -67 -0.4846364 -1.5544112 -0.7687792 -0.935942272 apu 2000 24858.32Arabela arb Zaparoan -2 -75.17 -0.4846364 0.9579338 -0.7687792 -0.098493936 arl 50 23781.04Archi arc Nakh-Daghestanian 42 46.83 -0.4846364 0.9579338 -0.7687792 -0.098493936 aqc 1000 6097.646Armenian (Eastern) arm Indo-European 40 45 -0.4846364 -1.5544112 -0.7687792 -0.935942272 hye 6723840 5840.478Arapesh arp Torricelli -3.47 143.17 1.3900889 -0.7169629 -0.7687792 -0.031884379 aon ape 20865 16523.81Asmat asm Trans-New Guinea -5.5 138.5 -0.4846364 0.12048546 -0.7687792 -0.377643382 tml 290 16146.7Atayal ata Austronesian 24.5 121.33 -0.4846364 -1.5544112 -0.7687792 -0.935942272 tay 84330 12854.41Avar ava Nakh-Daghestanian 42.5 46.5 -0.4846364 1.79538213 -0.7687792 0.180655509 ava 600959 6111.7Awngi awn Afro-Asiatic 10.83 36.67 1.3900889 0.9579338 0.54663194 0.964884878 awn 356980 3289.198Awa Pit awp Barbacoan 1.5 -78.25 -1.2345266 -1.5544112 -0.7687792 -1.185905651 kwi 21000 23367.25Aymara aym Aymaran -17 -69 -1.2345266 0.9579338 -0.7687792 -0.348457316 ayc ayr 2227642 25571.11Azerbaijani aze Altaic 40.5 48.5 1.3900889 0.12048546 -0.7687792 0.247265066 azb azj 31423529 6117.956Bagirmi bag Nilo-Saharan 11.67 16 1.3900889 0.9579338 1.86204304 1.403355244 bmi 44761 1605.154Bai bai Sino-Tibetan 26 100 1.3900889 -0.7169629 1.86204304 0.845056353 bca 800000 10834.68Bajau baj Austronesian -4.33 123 -0.4846364 0.9579338 -0.7687792 -0.098493936 bdl 90000 14645.09Bambara bam Niger-Congo 12.5 -7.5 1.3900889 0.12048546 0.54663194 0.685735432 bam 2786385 2418.978Bawm baw Sino-Tibetan 22.5 92.25 -0.4846364 0.12048546 0.54663194 0.060826985 bgr 13793 10245.05Bobo Fing bbf Niger-Congo 11.83 -4.42 1.3900889 0.12048546 1.86204304 1.124205799 bbo bwq 365091 2115.293Bella Coola bco Salishan 52.5 -126.67 -1.2345266 0.9579338 -0.7687792 -0.348457316 blc 20 16137.59Beembe bee Niger-Congo -3.92 14.08 -0.4846364 -0.7169629 0.54663194 -0.218322461 beq 3200 588.6359Beja bej Afro-Asiatic 18 36 -0.4846364 0.12048546 0.54663194 0.060826985 bej 1178000 3602.099Bengali ben Indo-European 24 90 1.3900889 0.9579338 -0.7687792 0.526414511 ben 171070202 9970.793Berta ber Nilo-Saharan 10.33 34.67 -0.4846364 0.12048546 0.54663194 0.060826985 wti 146799 3066.326B?©t?© bet Niger-Congo 6.25 -6.25 1.3900889 0.12048546 1.86204304 1.124205799 bev 130000 1935.879Birom bir Niger-Congo 9.67 8.83 1.3900889 0.12048546 1.86204304 1.124205799 bom 300000 1215.749Bisa bis Niger-Congo 11.5 -0.5 -0.4846364 -0.7169629 -0.7687792 -0.656792827 bib 581900 1796.459Bakair?? bki Cariban -14 -55 1.3900889 -0.7169629 -0.7687792 -0.031884379 bkq 570 26123.49Batak (Karo) bkr Austronesian 3.25 98.25 1.3900889 -0.7169629 -0.7687792 -0.031884379 btx 600000 11791.44Berber (Middle Atlas) bma Afro-Asiatic 33 -5 -1.2345266 0.12048546 -0.7687792 -0.627606761 tzm 3150000 4098.419Baining bng Baining-Taulil -4.58 152 -0.4846364 -1.5544112 -0.7687792 -0.935942272 byx 6350 17483.1Barasano (Northern) bno Tucanoan 0.33 -70.25 -0.4846364 -1.5544112 0.54663194 -0.497471906 bao 700 23811.14Bodo bod Sino-Tibetan 26.83 92 -0.4846364 -0.7169629 0.54663194 -0.218322461 brx 603301 10054.89Bariba brb Niger-Congo 10 2.5 1.3900889 -0.7169629 1.86204304 0.845056353 bba 560000 1470.541Bardi brd Australian -16.58 122.92 -1.2345266 -0.7169629 -0.7687792 -0.906756206 bcj 20 15678.92Breton bre Indo-European 48 -3 1.3900889 0.9579338 -0.7687792 0.526414511 bre 532722 8020.355Brahui brh Dravidian 28.5 67 -0.4846364 0.12048546 -0.7687792 -0.377643382 brh 2210000 7633.551Burmese brm Sino-Tibetan 21 96 1.3900889 0.9579338 1.86204304 1.403355244 mya 32301581 10666.4Bororo brr Macro-Ge -16 -57 1.3900889 -1.5544112 -0.7687792 -0.311033824 bor 850 26133.02Bru (Western) brw Austro-Asiatic 16.75 104.75 1.3900889 0.12048546 -0.7687792 0.247265066 brv 20000 11699.31Bashkir bsk Altaic 53 58 1.3900889 0.9579338 -0.7687792 0.526414511 bak 1871383 7516.704Basque bsq Basque 43 -3 -0.4846364 0.12048546 -0.7687792 -0.377643382 eus 588108 8024.965Batak (Toba) bto Austronesian 2.5 99 -0.4846364 -0.7169629 -0.7687792 -0.656792827 bbc 2000000 11905.76
Burarra bua Australian -12.25 134.58 -0.4846364 -0.7169629 -0.7687792 -0.656792827 bvr 400 16186.07Bulgarian bul Indo-European 42.5 25 -0.4846364 1.79538213 -0.7687792 0.180655509 bul 8954811 5760.137Burushaski bur Burushaski 36.5 74.5 -0.4846364 1.79538213 -0.7687792 0.180655509 bsk 87049 8225.202Bandjalang (Yugumbir) byu Australian -27.92 153 -1.2345266 -1.5544112 -0.7687792 -1.185905651 bdy 10 18758.94Cacua cac Cacua-Nukak 1.08 -70 -0.4846364 -1.5544112 0.54663194 -0.497471906 cbv 150 23771.88Caddo cad Caddoan 33.33 -93.5 -1.2345266 0.12048546 0.54663194 -0.189136395 cad 25 19389.69Cahuilla cah Uto-Aztecan 33.5 -116.25 -1.2345266 0.12048546 -0.7687792 -0.627606761 chl 7 18359.56Cams?° cam Cams?° 1.17 -77 -0.4846364 0.12048546 -0.7687792 -0.377643382 kbh 4022 23401.18Carib car Cariban 5.5 -56 -0.4846364 -0.7169629 -0.7687792 -0.656792827 car 10226 25028.63Campa (Axininca) cax Arawakan -12 -74 -1.2345266 -0.7169629 -0.7687792 -0.906756206 cni 23750 24896.08Chickasaw cck Muskogean 34 -88 -1.2345266 -0.7169629 -0.7687792 -0.906756206 cic 1000 19571.84Cocopa ccp Hokan 32.33 -115 -1.2345266 0.12048546 -0.7687792 -0.627606761 coc 350 18528.64Chamorro cha Austronesian 13.45 144.75 -0.4846364 0.12048546 -0.7687792 -0.377643382 cha 76705 16303.07Cherokee che Iroquoian 35.5 -83.5 -0.4846364 -1.5544112 0.54663194 -0.497471906 chr 15000 19625.88Chukchi chk Chukotko-Kamchatkan 67 -173 -0.4846364 -0.7169629 -0.7687792 -0.656792827 ckt 10000 13188.8Chipewyan chp Na-Dene 59 -106 -0.4846364 1.79538213 0.54663194 0.619125875 chp 4000 16557Chinantec (Quiotepec) chq Oto-Manguean 17.58 -96.67 1.3900889 0.9579338 1.86204304 1.403355244 chq 8000 20808.09Chulup?? chu Matacoan -23.5 -60.5 -1.2345266 0.12048546 -0.7687792 -0.627606761 cag 18200 26597.79Chuvash chv Altaic 55.5 47.5 1.3900889 0.12048546 -0.7687792 0.247265066 chv 1834394 7272.561Cham (Western) chw Austronesian 12 105.5 1.3900889 0.12048546 0.54663194 0.685735432 cja 253100 12011.21CiLuba cil Niger-Congo -6 22 -0.4846364 0.12048546 0.54663194 0.060826985 lua 6300000 1482.99Canela-Krah?¥ ckr Macro-Ge -6 -45 1.3900889 -1.5544112 -0.7687792 -0.311033824 ram xra 2620 26563.74Chinantec (Lealao) cle Oto-Manguean 17.33 -95.92 -0.4846364 0.12048546 1.86204304 0.499297351 cle 2000 20866.87Comanche cmn Uto-Aztecan 33.5 -101.5 -0.4846364 -1.5544112 -0.7687792 -0.935942272 com 200 19011.85Cantonese cnt Sino-Tibetan 23 113 1.3900889 0.12048546 1.86204304 1.124205799 yue 54810598 12172.55Coos (Hanis) coo Oregon Coast 43.5 -124.17 -0.4846364 1.79538213 -0.7687792 0.180655509 csz 1 17054.48Cree (Plains) cre Algic 54 -110 -1.2345266 -1.5544112 -0.7687792 -1.185905651 crk 34100 16764.96Chatino (Sierra Occidental)cso Oto-Manguean 16.25 -97.33 -0.4846364 -0.7169629 1.86204304 0.220147906 ctp 12000 20912.69Chin (Tiddim) cti Sino-Tibetan 23.33 93.67 -0.4846364 0.12048546 1.86204304 0.499297351 ctd 344100 10346.32Catalan ctl Indo-European 41.75 2 1.3900889 0.12048546 -0.7687792 0.247265066 cat 6667328 7632.806Cubeo cub Tucanoan 1.33 -70.5 -0.4846364 -1.5544112 0.54663194 -0.497471906 cub 6150 23712.46Dadibi dad Teberan-Pawaian -6.55 144.58 -0.4846364 -1.5544112 0.54663194 -0.497471906 mps 10000 16802.56Dahalo dah Afro-Asiatic -2.33 40.5 -0.4846364 1.79538213 0.54663194 0.619125875 dal 400 3445.195Dan dan Niger-Congo 7.5 -8 1.3900889 0.12048546 1.86204304 1.124205799 daf 951600 2169.916Darai dar Indo-European 24 84 -0.4846364 0.9579338 -0.7687792 -0.098493936 dry 10210 9398.07Daju (Dar Fur) ddf Nilo-Saharan 12.25 25.25 -0.4846364 0.12048546 -0.7687792 -0.377643382 daj 143053 2295.878Dera der Senagi -3.58 141 -0.4846364 -1.5544112 -0.7687792 -0.935942272 kbv 1687 16306.48Deti det Khoisan -20.5 24.5 -0.4846364 1.79538213 0.54663194 0.619125875 shg 6000 2688.293Dagbani dgb Niger-Congo 9.58 -0.5 -0.4846364 0.12048546 0.54663194 0.060826985 dag 800000 1634.933Dagur dgr Altaic 48 124 1.3900889 0.12048546 -0.7687792 0.247265066 dta 96085 11937.46Diegue?±o (Mesa Grande)die Hokan 32.67 -116.17 -0.4846364 0.9579338 -0.7687792 -0.098493936 dih 295 18444.9Dinka din Nilo-Saharan 8.5 28 1.3900889 0.12048546 1.86204304 1.124205799 dip 320000 2317.959Diola-Fogny dio Niger-Congo 13 -16 1.3900889 0.12048546 -0.7687792 0.247265066 dyo 358276 3226.359
Dizi diz Afro-Asiatic 6.17 36.5 -0.4846364 0.12048546 1.86204304 0.499297351 mdx 21075 3106.859Djapu djp Australian -12.67 136 -1.2345266 0.12048546 -0.7687792 -0.627606761 duj 500 16336.86Dani (Lower Grand Valley) dni Trans-New Guinea -4.33 138.83 1.3900889 -1.5544112 -0.7687792 -0.311033824 dni 20000 16121.84Dangal?©at (Western) dnw Afro-Asiatic 12.17 18.33 1.3900889 0.12048546 0.54663194 0.685735432 daa 45000 1781.452Doyayo doy Niger-Congo 8.67 13.08 1.3900889 0.12048546 1.86204304 1.124205799 dow 18000 1171.497Drehu dre Austronesian -21 167.25 1.3900889 0.9579338 -0.7687792 0.526414511 dhv 11338 19683.04Dogon (Toro So) dts Niger-Congo 14.5 -3.33 1.3900889 -0.7169629 0.54663194 0.406585987 dts 50000 2248.478Dumo dum Skou -2.68 141.3 1.3900889 -1.5544112 1.86204304 0.565906908 vam 2667 16298.52Dyirbal dyi Australian -17.83 145.58 -1.2345266 -1.5544112 -0.7687792 -1.185905651 dbl 40 17506.48Efik efi Niger-Congo 4.92 8.5 1.3900889 -1.5544112 0.54663194 0.127436542 efi 400000 694.5711Ejagham eja Niger-Congo 5.42 8.67 1.3900889 0.12048546 1.86204304 1.124205799 etu 116675 746.9072Ekari eka Trans-New Guinea -3.83 135.5 -0.4846364 -1.5544112 0.54663194 -0.497471906 ekg 100000 15766.37English eng Indo-European 52 0 1.3900889 0.12048546 -0.7687792 0.247265066 eng 309582484 7897.817Epena Pedee epe Choco 3 -77 1.3900889 -0.7169629 -0.7687792 -0.031884379 sja 8050 23198.55Evenki eve Altaic 56 125 -0.4846364 -0.7169629 -0.7687792 -0.656792827 evn 29000 11667.79Even evn Altaic 68 130 -0.4846364 -0.7169629 -0.7687792 -0.656792827 eve 7543 11445.09Ewe ewe Niger-Congo 6.33 0.42 1.3900889 0.9579338 0.54663194 0.964884878 ewe 3112400 1313.063Ewondo ewo Niger-Congo 4 12 1.3900889 0.9579338 1.86204304 1.403355244 ewo 577700 646.0998Eyak eya Na-Dene 60.5 -145 -1.2345266 0.9579338 -0.7687792 -0.348457316 eya 1 14717.15Fasu fas Trans-New Guinea -6.58 143.33 -0.4846364 -1.5544112 0.54663194 -0.497471906 faa 1200 16678.73Fe'fe' fef Niger-Congo 5.25 10.17 1.3900889 -0.7169629 1.86204304 0.845056353 fmp 123700 726.1316Fijian fij Austronesian -17.83 178 -0.4846364 0.12048546 -0.7687792 -0.377643382 fij 334061 20632.27Finnish fin Uralic 62 25 1.3900889 -0.7169629 -0.7687792 -0.031884379 fin 5232728 7737.948French fre Indo-European 48 2 1.3900889 0.12048546 -0.7687792 0.247265066 fra 64858311 7651.918Fulni?¥ ful Macro-Ge -8 -37.5 1.3900889 0.12048546 0.54663194 0.685735432 fun 2788 27414.04Fur fur Nilo-Saharan 13.5 25 -0.4846364 -0.7169629 0.54663194 -0.218322461 fvr 501800 2366.992Fuzhou fuz Sino-Tibetan 26 119.5 1.3900889 -1.5544112 1.86204304 0.565906908 cdo 9103157 12614.44Fyem fye Niger-Congo 9.58 9.33 -0.4846364 1.79538213 0.54663194 0.619125875 pym 3000 1203.632G?£ ga Niger-Congo 5.67 -0.17 1.3900889 0.9579338 1.86204304 1.403355244 gaa 600000 1320.201Great Andamanese gan Great Andamanese 12 92.67 1.3900889 -1.5544112 -0.7687792 -0.311033824 apq 24 10777.14Garo gar Sino-Tibetan 25.67 90.5 -0.4846364 -0.7169629 -0.7687792 -0.656792827 grt 677000 9955.409Gbeya Bossangoa gbb Niger-Congo 6.67 17.5 1.3900889 0.9579338 0.54663194 0.964884878 gbp 176000 1249.753Gadsup gds Trans-New Guinea -6.25 146 -1.2345266 -1.5544112 1.86204304 -0.308964919 gaj 22061 16932.33Georgian geo Kartvelian 42 44 -0.4846364 0.9579338 -0.7687792 -0.098493936 kat 4178604 5922.392German ger Indo-European 52 10 1.3900889 0.12048546 -0.7687792 0.247265066 deu 95392978 7277.99Gelao gla Tai-Kadai 22.92 105.5 1.3900889 0.9579338 1.86204304 1.403355244 gio 3000 11479.69Gooniyandi goo Australian -18.33 126.33 -1.2345266 0.12048546 -0.7687792 -0.627606761 gni 100 16045.97Grebo grb Niger-Congo 5 -8 1.3900889 0.12048546 1.86204304 1.124205799 gry 23700 2063.092Greek (Modern) grk Indo-European 39 22 -0.4846364 0.12048546 -0.7687792 -0.377643382 ell 12258540 6024.787Garrwa grr Australian -17.08 137.17 -1.2345266 0.12048546 -0.7687792 -0.627606761 gbc 200 16739.59Greenlandic (West) grw Eskimo-Aleut 64 -51 -1.2345266 0.12048546 -0.7687792 -0.627606761 kal 54800 18085.53Guaran?? gua Tupian -26 -56 -0.4846364 0.12048546 -0.7687792 -0.377643382 gug 4848000 27074.66Gwari gwa Niger-Congo 9.5 7 -0.4846364 0.12048546 1.86204304 0.499297351 gbr gby 1050000 1226.217
Hadza had Hadza -3.75 35.17 -0.4846364 1.79538213 0.54663194 0.619125875 hts 800 2863.102Haida hai Haida 53 -132 -1.2345266 1.79538213 -0.7687792 -0.06930787 hdn hax 55 15861.48Hakka hak Sino-Tibetan 25 116 -0.4846364 -0.7169629 1.86204304 0.220147906 hak 29937959 12349.67Hamtai ham Trans-New Guinea -7.5 146.25 1.3900889 -1.5544112 0.54663194 0.127436542 hmt 45000 17013.93Hausa hau Afro-Asiatic 12 7 -0.4846364 0.9579338 0.54663194 0.33997643 hau 24162000 1498.044Hawaiian haw Austronesian 19.58 -155.5 -0.4846364 -1.5544112 -0.7687792 -0.935942272 haw 1000 22535.9Hebrew (Modern Ashkenazic)hba Afro-Asiatic 31.75 35.17 -0.4846364 -0.7169629 -0.7687792 -0.656792827 heb 5055000 4596.115Hindi hin Indo-European 25 77 -0.4846364 1.79538213 -0.7687792 0.180655509 hin 180764791 8691.814Hixkaryana hix Cariban -1 -59 -0.4846364 -0.7169629 -0.7687792 -0.656792827 hix 600 24920.96Hmong Njua hmo Hmong-Mien 28 105 -0.4846364 1.79538213 1.86204304 1.057596241 blu 1290600 11214.83Hamer hmr Afro-Asiatic 5 36.5 -0.4846364 0.9579338 0.54663194 0.33997643 amf 42838 3076.661Hopi hop Uto-Aztecan 36 -110 -0.4846364 0.12048546 0.54663194 0.060826985 hop 5264 18388.91Huastec htc Mayan 22.08 -99.33 -0.4846364 0.12048546 -0.7687792 -0.377643382 hsf 1749 20237.17Huitoto (Murui) hum Huitotoan -1 -73.5 -0.4846364 -0.7169629 -0.7687792 -0.656792827 huu 2900 23734.11Hungarian hun Uralic 47 20 1.3900889 0.9579338 -0.7687792 0.526414511 hun 13611600 6368.741Hupa hup Na-Dene 41.08 -123.67 -1.2345266 0.9579338 -0.7687792 -0.348457316 hup 8 17305.97Huave (San Mateo del Mar)hve Huavean 16.22 -95 -0.4846364 0.12048546 0.54663194 0.060826985 huv 12000 21019.99Hunzib hzb Nakh-Daghestanian 42.17 46.25 1.3900889 0.9579338 -0.7687792 0.526414511 huz 2000 6072.393Iaai iaa Austronesian -20.42 166.58 1.3900889 1.79538213 -0.7687792 0.805563957 iai 1562 19594.32Iban iba Austronesian 2 112 -0.4846364 0.12048546 -0.7687792 -0.377643382 iba 415000 13296.74Igbo igb Niger-Congo 6 7.33 1.3900889 1.79538213 0.54663194 1.244034323 ibo 18000000 840.8655Ingessana igs Nilo-Saharan 11.5 34 -0.4846364 -0.7169629 0.54663194 -0.218322461 tbi 67166 3054.267Ijo (Kolokuma) ijo Niger-Congo 4.92 5.67 1.3900889 0.12048546 0.54663194 0.685735432 ijc 1000000 806.7756Ik ik Nilo-Saharan 3.75 34.17 1.3900889 0.9579338 0.54663194 0.964884878 ikx 2000 2795.69Ika ika Chibchan 10.67 -73.75 1.3900889 -0.7169629 -0.7687792 -0.031884379 arh 14301 23147.22Imonda imo Border -3.33 141.17 1.3900889 -1.5544112 -0.7687792 -0.311033824 imn 250 16312.9Indonesian ind Austronesian 0 106 -0.4846364 0.12048546 -0.7687792 -0.377643382 ind 23143354 13271.85Ingush ing Nakh-Daghestanian 43.17 45.08 -0.4846364 1.79538213 -0.7687792 0.180655509 inh 230315 6076.723Irish (Donegal) ird Indo-European 55 -8 -0.4846364 1.79538213 -0.7687792 0.180655509 gle 355000 8498.085Iraqw irq Afro-Asiatic -4 35.5 -0.4846364 0.9579338 0.54663194 0.33997643 irk 462000 2902.023Irarutu irr Austronesian -3 133.5 1.3900889 -1.5544112 -0.7687792 -0.311033824 irh 4000 15526.95Iranxe irx Arawakan -13 -58 -0.4846364 0.12048546 -0.7687792 -0.377643382 irn 191 25814.99Isoko iso Niger-Congo 5.5 6.25 1.3900889 0.9579338 0.54663194 0.964884878 iso 423000 832.3132Ivatan (Southern) ivs Austronesian 20.33 121.83 -1.2345266 0.12048546 -0.7687792 -0.627606761 ivv 35000 13119.01Jakaltek jak Mayan 15.67 -91.67 -0.4846364 0.9579338 -0.7687792 -0.098493936 jac jai 99000 21225.21Jaqaru jaq Aymaran -13 -76 -1.2345266 1.79538213 -0.7687792 -0.06930787 jqr 736 24979.68Javanese jav Austronesian -7 111 1.3900889 0.12048546 -0.7687792 0.247265066 jav 75508300 14149.33Jeh jeh Austro-Asiatic 15.17 107.83 1.3900889 1.79538213 -0.7687792 0.805563957 jeh 23256 12072.16Jingpho jng Sino-Tibetan 25.42 97 -0.4846364 0.9579338 1.86204304 0.778446796 kac 940000 10577.3Jomang jom Niger-Congo 10.58 30.5 1.3900889 -1.5544112 0.54663194 0.127436542 tlo 1500 2667.944Japanese jpn Japanese 37 140 -0.4846364 -0.7169629 0.54663194 -0.218322461 jpn 122433899 13672.06Japreria jpr Cariban 10.5 -73 -0.4846364 -1.5544112 -0.7687792 -0.935942272 jru 90 23206.52Ju|'hoan juh Khoisan -19 21 -0.4846364 1.79538213 1.86204304 1.057596241 ktz 5000 2336.498
Kabardian kab Northwest Caucasian 43.5 43.5 -1.2345266 1.79538213 -0.7687792 -0.06930787 kbd 1012000 6016.822Kadugli kad Kadugli 11 29.67 -0.4846364 0.12048546 1.86204304 0.499297351 xtc 81500 2611.667Kalami kal Indo-European 35.5 72.5 -0.4846364 -0.7169629 0.54663194 -0.218322461 gwc 40000 8051.176Kashmiri kas Indo-European 34 76 1.3900889 0.9579338 -0.7687792 0.526414511 kas 4611000 8383.788Kayardild kay Australian -17.05 139.5 -1.2345266 -0.7169629 -0.7687792 -0.906756206 gyd 6 16930.76Koyra Chiini kch Nilo-Saharan 17 -3 -0.4846364 -0.7169629 -0.7687792 -0.656792827 khq 200000 2447.26Kedang ked Austronesian -8.25 123.75 -0.4846364 0.12048546 -0.7687792 -0.377643382 ksx 30000 15007.67Kefa kef Afro-Asiatic 7.25 36.25 -0.4846364 0.12048546 0.54663194 0.060826985 kbr 569626 3112.478Kera ker Afro-Asiatic 9.83 15.08 -0.4846364 -0.7169629 1.86204304 0.220147906 ker 50523 1377.37Ket ket Yeniseian 64 87 1.3900889 -0.7169629 -0.7687792 -0.031884379 ket 550 9550.919Kewa kew Trans-New Guinea -6.5 143.83 -0.4846364 0.12048546 0.54663194 0.060826985 kew kjs 90000 16724.99Koromfe kfe Niger-Congo 14.25 -0.92 1.3900889 -0.7169629 -0.7687792 -0.031884379 kfz 196100 2069.288Kirghiz kgz Altaic 42 75 1.3900889 0.12048546 -0.7687792 0.247265066 kir 3136733 8276.863Khalkha kha Altaic 47 105 1.3900889 0.12048546 -0.7687792 0.247265066 khk 2337095 10609.53Khmer khm Austro-Asiatic 12.5 105 1.3900889 0.12048546 -0.7687792 0.247265066 khm 13276639 11937.28Khoekhoe kho Khoisan -25.5 18 -0.4846364 0.9579338 1.86204304 0.778446796 naq 233701 2844.541Kharia khr Austro-Asiatic 22.5 84.33 -0.4846364 0.9579338 -0.7687792 -0.098493936 khr 293575 9487.132Khasi khs Austro-Asiatic 25.5 92 -0.4846364 0.12048546 -0.7687792 -0.377643382 kha 865000 10103.47Kiowa kio Kiowa-Tanoan 37 -99 -0.4846364 0.12048546 0.54663194 0.060826985 kio 1092 18787.47Kiwai kiw Kiwaian -8 143.5 -0.4846364 -1.5544112 0.54663194 -0.497471906 kiw kjd 14100 16764.42Konkani kkn Indo-European 15.25 74 1.3900889 0.12048546 -0.7687792 0.247265066 knn 4000000 8826.033Kaliai-Kove kkv Austronesian -5.58 149.67 -0.4846364 0.12048546 -0.7687792 -0.377643382 khl kvc 8750 17279.57Klao kla Niger-Congo 4.75 -8.75 1.3900889 -1.5544112 1.86204304 0.565906908 klu 192000 2133.034Klamath klm Penutian 42.5 -121.5 -1.2345266 0.9579338 -0.7687792 -0.348457316 kla 1 17263.44Kilivila klv Austronesian -8.5 151.08 -0.4846364 0.12048546 -0.7687792 -0.377643382 kij 20000 17545.36Kala Lagaw Ya kly Australian -10.12 142.12 -0.4846364 -0.7169629 -0.7687792 -0.656792827 mwp 3000 16741.11Kunimaipa kmp Trans-New Guinea -8 146.83 -0.4846364 -0.7169629 -0.7687792 -0.656792827 kup 11000 17095.09Khmu' kmu Austro-Asiatic 21 102 1.3900889 0.12048546 0.54663194 0.685735432 kjg 479739 11236.83Kannada knd Dravidian 14 76 -0.4846364 0.12048546 -0.7687792 -0.377643382 kan 35346000 9081.292Kaingang kng Macro-Ge -26 -52 1.3900889 -1.5544112 -0.7687792 -0.311033824 kgp 18000 27315.15Kanakuru knk Afro-Asiatic 10 12 -0.4846364 0.9579338 0.54663194 0.33997643 kna 20000 1280.38Kunama knm Nilo-Saharan 14.5 37 -0.4846364 0.12048546 0.54663194 0.060826985 kun 108883 3494.943Kanuri knr Nilo-Saharan 12 13 1.3900889 0.9579338 0.54663194 0.964884878 knc 3425138 1522.249Koasati koa Muskogean 34.83 -85.17 -1.2345266 -1.5544112 1.86204304 -0.308964919 cku 200 19617.2Kobon kob Trans-New Guinea -5.17 144.33 1.3900889 0.12048546 -0.7687792 0.247265066 kpw 6000 16715.23Kohumono koh Niger-Congo 6 8.12 1.3900889 0.9579338 1.86204304 1.403355244 bcs 30000 820.0783Koiari koi Trans-New Guinea -9.5 147.33 -0.4846364 -1.5544112 0.54663194 -0.497471906 kbk 1700 17215.53Komo kom Nilo-Saharan 8.75 33.75 1.3900889 0.12048546 1.86204304 1.124205799 xom 11500 2906.295Korean kor Korean 37.5 128 1.3900889 0.12048546 -0.7687792 0.247265066 kor 67019690 12738.18Kota kot Dravidian 11.5 77.17 -0.4846364 0.12048546 -0.7687792 -0.377643382 kfe 2000 9329.268Koya koy Dravidian 17.5 81.33 -0.4846364 0.12048546 -0.7687792 -0.377643382 kff 330000 9414.456Kpan kpa Niger-Congo 7.58 10.17 -0.4846364 0.12048546 1.86204304 0.499297351 kpk 11386 984.0412Kpelle kpe Niger-Congo 7 -10 1.3900889 0.12048546 1.86204304 1.124205799 xpe 487400 2348.62
Kiribati krb Austronesian 1.33 173 -0.4846364 -1.5544112 -0.7687792 -0.935942272 gil 67790 19566.19Kurdish (Central) krd Indo-European 36 44 1.3900889 0.9579338 -0.7687792 0.526414511 kmr 9113505 5534.577Karok krk Karok 41.67 -123 -0.4846364 0.9579338 0.54663194 0.33997643 kyh 10 17277.92Krongo kro Kadugli 10.5 30 1.3900889 0.12048546 0.54663194 0.685735432 kgo 21688 2615.703Koryak kry Chukotko-Kamchatkan 61 167 -0.4846364 -0.7169629 -0.7687792 -0.656792827 kpy 3500 13290.66Karen (Sgaw) ksg Sino-Tibetan 18 97 1.3900889 -0.7169629 1.86204304 0.845056353 ksw 1584700 10897.79Kisi (Southern) kss Niger-Congo 8.5 -10.25 1.3900889 -0.7169629 0.54663194 0.406585987 kss 200000 2441.211Kotoko ktk Afro-Asiatic 11.33 15.33 1.3900889 0.9579338 0.54663194 0.964884878 aal 30000 1539.169Khanty kty Uralic 65 65 -0.4846364 -0.7169629 -0.7687792 -0.656792827 kca 12000 8691.389Kullo kul Afro-Asiatic 6.75 37.08 -0.4846364 0.12048546 0.54663194 0.060826985 gmo 1236637 3185.289Kuna kun Chibchan 8 -77.33 -0.4846364 -0.7169629 -0.7687792 -0.656792827 kvn 1576 22658.89Kutenai kut Kutenai 49.5 -116 -1.2345266 0.9579338 -0.7687792 -0.348457316 kut 12 16871.28Kwaio kwa Austronesian -8.95 161 -0.4846364 -0.7169629 -0.7687792 -0.656792827 kwd 13249 18580.83Kwakw'ala kwk Wakashan 51 -127 -0.4846364 1.79538213 -0.7687792 0.180655509 kwk 235 16250.85Kawaiisu kws Uto-Aztecan 36 -117.5 -0.4846364 0.12048546 -0.7687792 -0.377643382 xaw 8 18060.71Kuku-Yalanji kya Australian -16 145 -1.2345266 -1.5544112 -0.7687792 -1.185905651 gvn 700 17344.53Kayah Li (Eastern) kyl Sino-Tibetan 19 97.5 1.3900889 -0.7169629 1.86204304 0.845056353 eky 360220 10899.36Kam (Zhanglu) kzh Tai-Kadai 26 108.5 1.3900889 0.12048546 1.86204304 1.124205799 doc 463000 11620.07Komi-Zyrian kzy Uralic 65 55 1.3900889 0.9579338 -0.7687792 0.526414511 kpv 262200 8381.375Ladakhi lad Sino-Tibetan 34 78 -0.4846364 0.9579338 -0.7687792 -0.098493936 lbj 114000 8566.608Lahu lah Sino-Tibetan 20 98.17 1.3900889 0.9579338 1.86204304 1.403355244 lhu 577178 10917.85Lak lak Nakh-Daghestanian 42.17 47.17 -1.2345266 1.79538213 -0.7687792 -0.06930787 lbe 119512 6131.37Lam?© lam Afro-Asiatic 9 14.5 -0.4846364 0.9579338 1.86204304 0.778446796 lme 35720 1266.441Lango lan Nilo-Saharan 2.17 33 1.3900889 0.9579338 0.54663194 0.964884878 laj 977680 2638.481Latvian lat Indo-European 57 24 -0.4846364 -0.7169629 0.54663194 -0.218322461 lav 1543844 7202.816Lavukaleve lav Lavukaleve -9.08 159.2 -0.4846364 0.9579338 -0.7687792 -0.098493936 lvk 1783 18399.45Lenakel len Austronesian -19.45 169.25 -0.4846364 -0.7169629 -0.7687792 -0.656792827 tnl 6500 19815.13Lezgian lez Nakh-Daghestanian 41.67 47.83 -0.4846364 1.79538213 -0.7687792 0.180655509 lez 451112 6142.042Lakkia lkk Tai-Kadai 24.08 110.17 -0.4846364 1.79538213 1.86204304 1.057596241 lbc 12000 11860.59Lakhota lkt Siouan 43.83 -101.83 -0.4846364 0.9579338 -0.7687792 -0.098493936 lkt 6000 18018.4Lelemi llm Niger-Congo 7.33 0.5 1.3900889 0.12048546 0.54663194 0.685735432 lef 48900 1380.082L?º lu Tai-Kadai 22 100.67 1.3900889 0.12048546 1.86204304 1.124205799 khb 672064 11066.23Lua lua Niger-Congo 9.75 17.75 1.3900889 0.12048546 1.86204304 1.124205799 nie 5157 1525.6Lugbara lug Nilo-Saharan 3.08 30.92 1.3900889 0.9579338 1.86204304 1.403355244 lgg 1040000 2427.589Luise?±o lui Uto-Aztecan 33.33 -117.17 -0.4846364 0.12048546 -0.7687792 -0.377643382 lui 30 18337.04Luo luo Nilo-Saharan -0.5 34.75 1.3900889 0.12048546 0.54663194 0.685735432 luo 3465000 2806.794Lushootseed lus Salishan 48 -122 -1.2345266 1.79538213 -0.7687792 -0.06930787 lut 60 16735.08Luvale luv Niger-Congo -12 22 -0.4846364 -0.7169629 0.54663194 -0.218322461 lue 669000 1823.445Maasai maa Nilo-Saharan -3 36 1.3900889 0.12048546 0.54663194 0.685735432 mas 883000 2949.057Maba mab Nilo-Saharan 13.75 20.83 1.3900889 0.12048546 0.54663194 0.685735432 mde 250000 2082.197Malagasy mal Austronesian -20 47 -1.2345266 0.12048546 -0.7687792 -0.627606761 plt 5948700 19232.24Maori mao Austronesian -40 176 -0.4846364 -1.5544112 -0.7687792 -0.935942272 mri 50000 21248.63Mapudungun map Araucanian -38 -72 -0.4846364 0.12048546 -0.7687792 -0.377643382 arn 300000 27783.66

Maricopa mar Hokan 33.17 -113.17 -0.4846364 0.12048546 -0.7687792 -0.377643382 mrc 181 18525.07Maung mau Australian -11.92 133.5 -0.4846364 -0.7169629 -0.7687792 -0.656792827 mph 200 16071.17Maxakal?? max Macro-Ge -18 -40 -0.4846364 -1.5544112 -0.7687792 -0.935942272 mbl 728 27667.17Maybrat may West Papuan -1.33 132.5 -0.4846364 -1.5544112 -0.7687792 -0.935942272 ayz 20000 15344.28Mazahua maz Oto-Manguean 19.42 -99.92 -1.2345266 1.79538213 0.54663194 0.369162496 maz mmc 365000 20477.8Mba mba Niger-Congo 1 25 1.3900889 0.12048546 1.86204304 1.124205799 mfc 36087 1740.378Meithei mei Sino-Tibetan 24.75 94 -0.4846364 0.9579338 0.54663194 0.33997643 mni 1261000 10321.07Mangghuer mgg Altaic 36 102 -0.4846364 0.12048546 -0.7687792 -0.377643382 mjg 152000 10658.02Mien mie Hmong-Mien 25 111 1.3900889 0.9579338 1.86204304 1.403355244 ium 818685 11894.33Maranungku mku Australian -13.67 130 -0.4846364 -1.5544112 -0.7687792 -0.935942272 zmr 15 15915.16Mambila mla Niger-Congo 6.75 11.5 1.3900889 0.12048546 1.86204304 1.124205799 mcu mzk 129000 916.2551Malakmalak mlk Australian -13.42 130.42 -0.4846364 -1.5544112 -0.7687792 -0.935942272 mpb 9 15928.6Mandarin mnd Sino-Tibetan 34 110 -0.4846364 0.9579338 1.86204304 0.778446796 cmn 873014298 11418.85Maidu (Northeast) mne Penutian 40 -120.67 -0.4846364 -0.7169629 -0.7687792 -0.656792827 nmu 1 17537.29Moghol mog Altaic 35 62 -0.4846364 0.12048546 -0.7687792 -0.377643382 mhj 200 7099.201Mor mor Austronesian -2.95 135.75 -0.4846364 -1.5544112 0.54663194 -0.497471906 mhz 700 15747.56Movima mov Movima -13.83 -65.67 -0.4846364 -0.7169629 -0.7687792 -0.656792827 mzp 1452 25394.71Murrinh-Patha mpa Australian -14.67 129.67 -1.2345266 0.12048546 -0.7687792 -0.627606761 mwf 900 15968.52Marind mrd Marind -7.83 140.17 -0.4846364 -0.7169629 -0.7687792 -0.656792827 mrz 7000 16430.57Murle mrl Nilo-Saharan 6.5 33.5 1.3900889 0.12048546 0.54663194 0.685735432 mur 60200 2797.952Maranao mrn Austronesian 7.83 124.25 -1.2345266 -1.5544112 -0.7687792 -1.185905651 mrw 776169 14136.36Moro mro Niger-Congo 11 30.17 1.3900889 0.12048546 0.54663194 0.685735432 mor 30000 2658.971Martuthunira mrt Australian -20.83 116.5 -1.2345266 0.12048546 -0.7687792 -0.627606761 vma 5 15795.13Miwok (Southern Sierra) mss Penutian 37.5 -120 -0.4846364 -0.7169629 -0.7687792 -0.656792827 skd 7 17807.63Mixe (Totontepec) mtp Mixe-Zoque 17.25 -96 1.3900889 -1.5544112 -0.7687792 -0.311033824 mto 5200 20871.34Muinane mui Huitotoan -1 -72.5 -0.4846364 0.12048546 0.54663194 0.060826985 bmr 150 23783.5Mumuye mum Niger-Congo 9 11.67 -0.4846364 0.12048546 1.86204304 0.499297351 mzm 400000 1164.097Mundari mun Austro-Asiatic 23 84.67 -0.4846364 0.9579338 -0.7687792 -0.098493936 muw 2074700 9500.179Mixtec (Chalcatongo) mxc Oto-Manguean 17.05 -97.58 -0.4846364 -0.7169629 1.86204304 0.220147906 mig 14453 20820.82Mixtec (Molinos) mxm Oto-Manguean 17 -97.58 -0.4846364 -0.7169629 1.86204304 0.220147906 mig 14453 20825.86Ma'ya mya Austronesian -1.25 130.92 -0.4846364 -1.5544112 1.86204304 -0.05900154 slz 4000 15183.16Mangarrayi myi Australian -14.67 133.5 -0.4846364 -0.7169629 -0.7687792 -0.656792827 mpc 50 16267.45Mazatec (Chiquihuitl?°n) mzc Oto-Manguean 17.75 -96.92 -0.4846364 0.12048546 1.86204304 0.499297351 maq 2500 20779.78Nanai nai Altaic 49.5 137 -0.4846364 -0.7169629 -0.7687792 -0.656792827 gld 5772 12708.62Nandi nan Nilo-Saharan 0.25 35 1.3900889 -1.5544112 0.54663194 0.127436542 kln 2458123 2838.398Neo-Aramaic (Persian Azerbaijannap Afro-Asiatic 38 47 -0.4846364 0.12048546 -0.7687792 -0.377643382 trg 4378 5871.083Nara (in Ethiopia) nar Nilo-Saharan 15.08 37.58 -0.4846364 -0.7169629 0.54663194 -0.218322461 nrb 80000 3580.178Navajo nav Na-Dene 36.17 -108 -1.2345266 0.9579338 0.54663194 0.090013051 nav 148530 18461.67Naxi nax Sino-Tibetan 27.5 100 1.3900889 1.79538213 1.86204304 1.682504689 nbf 308839 10775.54Ndut ndt Niger-Congo 14.92 -16.92 1.3900889 0.9579338 1.86204304 1.403355244 ndv 35000 3415.417Nenets nen Uralic 69 72 -0.4846364 0.9579338 -0.7687792 -0.098493936 yrk 26730 9208.659Nepali nep Indo-European 28 85 -0.4846364 0.9579338 -0.7687792 -0.098493936 nep 17209255 9357.227Newari (Kathmandu) new Sino-Tibetan 27.67 85.5 -1.2345266 0.12048546 -0.7687792 -0.627606761 new 825458 9414.689
Nez Perce nez Penutian 46 -116 -0.4846364 0.9579338 -0.7687792 -0.098493936 nez 100 17181.91Nganasan nga Uralic 71 93 1.3900889 -0.7169629 -0.7687792 -0.031884379 nio 500 10016.63Ngizim ngz Afro-Asiatic 12.08 10.92 -0.4846364 0.9579338 0.54663194 0.33997643 ngi 80000 1489.566Nahuatl (North Puebla) nhn Uto-Aztecan 20 -98.25 -1.2345266 -0.7169629 -0.7687792 -0.906756206 ncj 60000 20494.01Nahuatl (Tetelcingo) nht Uto-Aztecan 19.67 -99 -0.4846364 -0.7169629 -0.7687792 -0.656792827 nhg 3500 20493.66Nishi nis Sino-Tibetan 27.5 93.5 1.3900889 -0.7169629 0.54663194 0.406585987 dap 261000 10171.56Nivkh niv Nivkh 53.33 142 -0.4846364 0.9579338 0.54663194 0.33997643 niv 1089 12770.47Nkore-Kiga nko Niger-Congo -0.92 29.83 -0.4846364 0.12048546 0.54663194 0.060826985 cgg 1391442 2259.059Nyah Kur (Tha Pong) nkt Austro-Asiatic 15.67 101.67 1.3900889 0.9579338 0.54663194 0.964884878 cbn 10000 11457.57Nambiku?°ra nmb Nambikuaran -13 -59 -0.4846364 0.9579338 1.86204304 0.778446796 nab 1150 25741.21Nancowry nnc Austro-Asiatic 8.05 93.5 1.3900889 -0.7169629 -0.7687792 -0.031884379 ncb 2200 11068.46Nobiin nob Nilo-Saharan 21 31 -0.4846364 -0.7169629 0.54663194 -0.218322461 fia 495000 3402.265Noni non Niger-Congo 6.42 10.58 1.3900889 0.12048546 1.86204304 1.124205799 nhu 25000 860.7081Norwegian nor Indo-European 61 8 1.3900889 0.12048546 0.54663194 0.685735432 nor 4640000 8027.009Ngiti nti Nilo-Saharan 1.33 30.25 1.3900889 1.79538213 1.86204304 1.682504689 niy 100000 2323.407Nunggubuyu nug Australian -13.75 135.67 -1.2345266 0.12048546 -0.7687792 -0.627606761 nuy 300 16381.74Nung (in Vietnam) nun Tai-Kadai 21.92 106.42 -0.4846364 0.12048546 1.86204304 0.499297351 nut 856412 11611.48Nuuchahnulth nuu Wakashan 49.67 -126.67 -1.2345266 1.79538213 -0.7687792 -0.06930787 noo 200 16381.58Nyimang nyi Nilo-Saharan 12.17 29.33 1.3900889 -0.7169629 1.86204304 0.845056353 nyi 70000 2648.169Ocaina oca Huitotoan -2.75 -71.75 -0.4846364 0.9579338 0.54663194 0.33997643 oca 66 23994.17Ogbia ogb Niger-Congo 4.67 6.25 1.3900889 0.12048546 0.54663194 0.685735432 ogb 200000 750.3215Ojibwa (Eastern) oji Algic 46 -80 -1.2345266 -0.7169629 -0.7687792 -0.906756206 ojg 25885 18773.89Oneida ond Iroquoian 43 -75.67 -1.2345266 0.9579338 0.54663194 0.090013051 one 250 19237.46O'odham ood Uto-Aztecan 32 -112 -0.4846364 0.12048546 -0.7687792 -0.377643382 ood 11819 18691.13Oromo (Harar) orh Afro-Asiatic 9 42 -0.4846364 0.9579338 1.86204304 0.778446796 hae 4526000 3774.159Ormuri orm Indo-European 32.5 69.75 -0.4846364 -1.5544112 -0.7687792 -0.935942272 oru 1050 7825.179Otom?? (Mezquital) otm Oto-Manguean 20.17 -99.17 1.3900889 0.12048546 0.54663194 0.685735432 ote 100000 20435.83Pacoh pac Austro-Asiatic 16.42 107.08 1.3900889 -0.7169629 -0.7687792 -0.031884379 pac 29224 11937.9P?°ez pae P?°ezan 2.67 -76 -1.2345266 1.79538213 -0.7687792 -0.06930787 pbb 71400 23255.28Paiwan pai Austronesian 22.5 120.83 -1.2345266 0.12048546 -0.7687792 -0.627606761 pwn 66084 12913.47Paumar?? pau Arauan -6 -64 -1.2345266 0.12048546 -0.7687792 -0.627606761 pad 700 24798.66Pawaian paw Teberan-Pawaian -7 145.08 -0.4846364 -0.7169629 0.54663194 -0.218322461 pwa 4000 16873.52Pech pec Chibchan 15 -85.5 -0.4846364 0.9579338 0.54663194 0.33997643 pay 994 21571.42Phlong phl Sino-Tibetan 15 99 -0.4846364 -1.5544112 1.86204304 -0.05900154 pww 60000 11234.22Pitjantjatjara pit Australian -26 130 -1.2345266 0.12048546 -0.7687792 -0.627606761 pjt 2500 16956.14Paamese pms Austronesian -16.5 168.25 -0.4846364 -0.7169629 -0.7687792 -0.656792827 pma 6000 19602.77Panare pnr Cariban 6.5 -66 1.3900889 -1.5544112 -0.7687792 -0.311033824 pbh 1200 23918.74Po-Ai poa Austronesian -20.67 164.83 1.3900889 -0.7169629 1.86204304 0.845056353 fwa 1131 19436.81Pohnpeian poh Austronesian 6.88 158.25 1.3900889 -1.5544112 -0.7687792 -0.311033824 pon 29000 17845.57Polish pol Indo-European 52 20 -0.4846364 0.9579338 -0.7687792 -0.098493936 pol 42708133 6789.507Pirah?£ prh Mura -7 -62 -1.2345266 -0.7169629 0.54663194 -0.46828584 myp 150 25033.52Persian prs Indo-European 32 54 -0.4846364 0.12048546 -0.7687792 -0.377643382 pes 24316121 6351.344Pashto psh Indo-European 33 67 -0.4846364 0.9579338 -0.7687792 -0.098493936 pst 7922657 7564.181

Passamaquoddy-Maliseet psm Algic 45 -67 -0.4846364 -0.7169629 0.54663194 -0.218322461 pqm 1655 19389.8Parauk puk Austro-Asiatic 23.25 99.5 1.3900889 0.9579338 -0.7687792 0.526414511 prk 528400 10901.56Pur?©pecha pur Tarascan 19.5 -101.67 -0.4846364 0.9579338 -0.7687792 -0.098493936 tsz 120000 20392.09Qawasqar qaw Alacalufan -49 -75 -1.2345266 0.9579338 -0.7687792 -0.348457316 alc 20 28979.01Quechua (Cochabamba) qco Quechuan -17.5 -66 -0.4846364 0.9579338 -0.7687792 -0.098493936 quh 3637500 25742.48Quileute qui Chimakuan 47.92 -124.25 -1.2345266 0.9579338 0.54663194 0.090013051 qui 10 16643.32Rama ram Chibchan 11.75 -83.75 -1.2345266 -0.7169629 -0.7687792 -0.906756206 rma 24 21978.58Rapanui rap Austronesian -27.12 -109.37 -0.4846364 -1.5544112 -0.7687792 -0.935942272 rap 3392 28010.45Res??garo res Arawakan -2.42 -71.5 -0.4846364 0.9579338 0.54663194 0.33997643 rgr 14 23975.49Romanian rom Indo-European 46 25 1.3900889 0.12048546 -0.7687792 0.247265066 ron 23498367 6031.231Roro ror Austronesian -8.75 146.58 -0.4846364 -1.5544112 -0.7687792 -0.935942272 rro 15000 17105.38Romansch (Scharans) rsc Indo-European 46.75 9.5 -0.4846364 0.12048546 -0.7687792 -0.377643382 roh 40000 7071.052Rotokas rtk West Bougainville -6 155.17 -0.4846364 -1.5544112 -0.7687792 -0.935942272 roo 4320 17866.34Rukai ruk Austronesian 22.83 120.83 -1.2345266 0.12048546 -0.7687792 -0.627606761 dru 10543 12896.25Russian rus Indo-European 56 38 -0.4846364 0.9579338 -0.7687792 -0.098493936 rus 145031551 7094.689Rutul rut Nakh-Daghestanian 41.5 47.42 -0.4846364 1.79538213 0.54663194 0.619125875 rut 20111 6103.329Sango san Niger-Congo 5 18 1.3900889 0.9579338 0.54663194 0.964884878 sag 404000 1171.636S?°liba (in Colombia) sba S?°liban 6 -70 -0.4846364 0.12048546 -0.7687792 -0.377643382 slc 1555 23496.69Saami (Central-South) scs Uralic 64.67 16.75 -0.4846364 1.79538213 -0.7687792 0.180655509 sma 600 8133.627Sindhi sdh Indo-European 26 69 1.3900889 1.79538213 -0.7687792 0.805563957 snd 21362000 7891.445Sandawe sdw Khoisan -5 35 -0.4846364 1.79538213 0.54663194 0.619125875 sad 40000 2859.423Sedang sed Austro-Asiatic 14.83 108 1.3900889 1.79538213 -0.7687792 0.805563957 sed 101434 12105.63Selknam sel Chon -53 -70 -1.2345266 0.12048546 -0.7687792 -0.627606761 ona 1 29455.87Shan sha Tai-Kadai 22 98 -0.4846364 0.12048546 1.86204304 0.499297351 shn 3260000 10813.25Shiriana shi Yanomam 3.5 -62.83 -0.4846364 -1.5544112 -0.7687792 -0.935942272 shb 566 24337.07Shipibo-Konibo shk Panoan -7.5 -75 -1.2345266 -0.7169629 -0.7687792 -0.906756206 shp 26000 24384.75Shuswap shu Salishan 52 -120 -0.4846364 1.79538213 -0.7687792 0.180655509 shs 500 16477.86Slave sla Na-Dene 67 -125 -0.4846364 0.9579338 0.54663194 0.33997643 scs xsl 2200 15291.47Semelai sml Austro-Asiatic 3 103 1.3900889 0.9579338 -0.7687792 0.526414511 sza 2932 12258.61Seneca snc Iroquoian 42.5 -77.5 -0.4846364 -1.5544112 -0.7687792 -0.935942272 see 175 19209.35Senadi snd Niger-Congo 9.5 -6.25 1.3900889 0.12048546 1.86204304 1.124205799 sef 862000 2113.121Sinhala snh Indo-European 7 80.5 1.3900889 0.12048546 -0.7687792 0.247265066 sin 13220256 9903.463Sanuma snm Yanomam 4.5 -64.67 1.3900889 -1.5544112 -0.7687792 -0.311033824 xsu 5074 24109.59Somali som Afro-Asiatic 3 45 1.3900889 0.12048546 0.54663194 0.685735432 som 12653480 3971.735Soqotri soq Afro-Asiatic 12.5 54 -0.4846364 0.9579338 -0.7687792 -0.098493936 sqt 64000 7216.364Sora sor Austro-Asiatic 20 84.33 -0.4846364 0.12048546 -0.7687792 -0.377643382 srb 288000 9590.51Spanish spa Indo-European 40 -4 -0.4846364 0.9579338 -0.7687792 -0.098493936 spa 322299171 8163.111Squamish squ Salishan 49.67 -123.17 -1.2345266 0.9579338 -0.7687792 -0.348457316 squ 15 16535.56Sre sre Austro-Asiatic 11.5 108 1.3900889 -1.5544112 0.54663194 0.127436542 kpm 128723 12277.46Sirion?? srn Tupian -15.58 -64 1.3900889 0.12048546 -0.7687792 0.247265066 srq 399 25652.6Suena sue Trans-New Guinea -7.75 147.55 -0.4846364 1.79538213 0.54663194 0.619125875 sue 3000 17155.9Sui sui Tai-Kadai 26 107.5 1.3900889 0.12048546 1.86204304 1.124205799 swi 200120 11528.36Supyire sup Niger-Congo 11.5 -5.58 1.3900889 -0.7169629 1.86204304 0.845056353 spp 364000 2186.62
Savosavo svs Savosavo -9.13 159.8 -0.4846364 -0.7169629 -0.7687792 -0.656792827 svs 2415 18463.28Swahili swa Niger-Congo -6.5 39 -0.4846364 0.9579338 -0.7687792 -0.098493936 swh 772642 3321.007Taba tab Austronesian 0 127.5 -0.4846364 0.12048546 -0.7687792 -0.377643382 mky 20000 14781.94Tacana tac Tacanan -13.5 -68 -1.2345266 -0.7169629 -0.7687792 -0.906756206 tna 1821 25249.2Tagalog tag Austronesian 15 121 -0.4846364 0.12048546 -0.7687792 -0.377643382 tgl 15900098 13328.44Tamang tam Sino-Tibetan 28 85.25 -0.4846364 0.9579338 0.54663194 0.33997643 taj tge 777234 9380.789Tehuelche teh Chon -48 -68 -1.2345266 0.9579338 -0.7687792 -0.348457316 teh 4 28932.73Telugu tel Dravidian 16 79 -0.4846364 0.9579338 -0.7687792 -0.098493936 tel 69688278 9263.461Tera ter Afro-Asiatic 11 11.83 -0.4846364 1.79538213 1.86204304 1.057596241 ttr 100620 1385.42Tigak tgk Austronesian -2.72 150.8 -0.4846364 -1.5544112 -0.7687792 -0.935942272 tgc 6000 17290.46Tigr?© tgr Afro-Asiatic 16.5 38.5 -0.4846364 0.9579338 -0.7687792 -0.098493936 tig 800000 3742.01Thai tha Tai-Kadai 16 101 1.3900889 0.12048546 1.86204304 1.124205799 tha 20229987 11377.11Tibetan (Standard Spoken)tib Sino-Tibetan 30 91 1.3900889 1.79538213 0.54663194 1.244034323 bod 1261587 9856.141Ticuna tic Ticuna -4 -70.5 -0.4846364 -0.7169629 1.86204304 0.220147906 tca 41000 24183.02Tiwi tiw Australian -11.5 131 -1.2345266 0.12048546 -0.7687792 -0.627606761 tiw 1500 15832.01Teke (Southern) tks Niger-Congo -2.33 14.5 1.3900889 0.12048546 0.54663194 0.685735432 kkw 38787 568.1662Tlingit tli Na-Dene 59 -135 -1.2345266 1.79538213 0.54663194 0.369162496 tli 845 15262.57Tama tma Nilo-Saharan 14.5 22 1.3900889 0.12048546 1.86204304 1.124205799 tma 62931 2225.867Temein tmn Nilo-Saharan 11.92 29.42 1.3900889 -0.7169629 0.54663194 0.406585987 teq 10000 2641.431Tampulma tmp Niger-Congo 10.42 -0.58 1.3900889 -1.5544112 0.54663194 0.127436542 tpm 16000 1709.985Temne tne Niger-Congo 8.67 -13.08 1.3900889 -0.7169629 0.54663194 0.406585987 tem 1200000 2732.891Toaripi toa Eleman -8.33 146.25 -0.4846364 -1.5544112 -0.7687792 -0.935942272 tqo 23000 17052.65Tarok tok Niger-Congo 9 10.08 -0.4846364 0.9579338 1.86204304 0.778446796 yer 300000 1140.841Tol tol Tol 14.67 -87 -0.4846364 0.12048546 -0.7687792 -0.377643382 jic 350 21536.89Totonac (Papantla) tpa Totonacan 20.33 -97.33 -1.2345266 -0.7169629 -0.7687792 -0.906756206 top 80000 20502.09Trumai tru Trumai -11.92 -53.58 -0.4846364 0.12048546 -0.7687792 -0.377643382 tpy 78 26087.73Tiruray try Austronesian 6.75 124.17 -0.4846364 -0.7169629 -0.7687792 -0.656792827 tiy 50000 14156.81Tausug tsg Austronesian 6 121 -1.2345266 0.9579338 -0.7687792 -0.348457316 tsg 1022000 13848.91Tsimshian (Coast) tsi Penutian 52.5 -129 -1.2345266 1.79538213 -0.7687792 -0.06930787 tsi 800 16034.73Tsou tso Austronesian 23.5 120.75 -0.4846364 -0.7169629 -0.7687792 -0.656792827 tsu 2127 12854.2Tetun ttn Austronesian -9 126 -0.4846364 -1.5544112 -0.7687792 -0.935942272 tet 450000 15240.98Tsova-Tush ttu Nakh-Daghestanian 42.5 45.5 -0.4846364 1.79538213 -0.7687792 0.180655509 bbl 3420 6050.101Tuareg (Ahaggar) tug Afro-Asiatic 23 6 1.3900889 0.9579338 -0.7687792 0.526414511 thv 62000 2721.271Tukang Besi tuk Austronesian -5.5 123.5 -0.4846364 0.12048546 -0.7687792 -0.377643382 bhq khc 250000 14773.44Tulu tul Dravidian 12.75 75.33 1.3900889 0.12048546 -0.7687792 0.247265066 tcy 1949000 9086.559Turkish tur Altaic 39 35 1.3900889 0.12048546 -0.7687792 0.247265066 tur 50625794 5218.225Tuvan tuv Altaic 52 95 1.3900889 0.12048546 -0.7687792 0.247265066 tyv 209400 9833.798Tiwa (Northern) twn Kiowa-Tanoan 36.5 -105.5 -0.4846364 0.9579338 0.54663194 0.33997643 twf 927 18542.03Tzeltal (Aguacatenango) tza Mayan 16.42 -92.5 -0.4846364 0.12048546 -0.7687792 -0.377643382 tzh 90000 21112.25UMbundu umb Niger-Congo -12.5 15 -0.4846364 0.12048546 0.54663194 0.060826985 umb 4002880 1389.191Una una Trans-New Guinea -4.67 140 1.3900889 0.12048546 0.54663194 0.685735432 mtg 4000 16255.16Ungarinjin ung Australian -16.33 126 -0.4846364 0.12048546 -0.7687792 -0.377643382 ung 82 15848.19Urub??-Kaapor urk Tupian -2.33 -46.5 -0.4846364 -0.7169629 -0.7687792 -0.656792827 urb 500 26262.71
Usan usa Trans-New Guinea -4.83 145.17 -0.4846364 -1.5544112 -0.7687792 -0.935942272 wnu 1400 16786.23Uzbek (Northern) uzn Altaic 40.67 66.5 -0.4846364 0.12048546 -0.7687792 -0.377643382 uzn 18795591 7555.523Vietnamese vie Austro-Asiatic 10.5 106.5 1.3900889 0.12048546 1.86204304 1.124205799 vie 67439139 12186.95Wahgi wah Trans-New Guinea -5.83 144.72 -0.4846364 -0.7169629 0.54663194 -0.218322461 wgi whg 86000 16784.02Wambaya wam Australian -18.67 135.75 -1.2345266 -0.7169629 -0.7687792 -0.906756206 wmb 12 16742.62Wari' war Chapacura-Wanhan -11.33 -65 -0.4846364 -0.7169629 -0.7687792 -0.656792827 pav 1833 25194.31Wich?? wch Matacoan -22.5 -62.58 -0.4846364 0.12048546 -0.7687792 -0.377643382 mzh 15000 26398.5Wichita wic Caddoan 33.33 -97.33 -1.2345266 0.12048546 -0.7687792 -0.627606761 wic 3 19216.67Wintu win Penutian 41 -122.5 -0.4846364 0.9579338 -0.7687792 -0.098493936 wit 5 17363.24Wolof wlf Niger-Congo 15.25 -16 1.3900889 0.9579338 -0.7687792 0.526414511 wol 3612560 3348.594West Makian wma West Papuan 0.5 127.58 -0.4846364 -0.7169629 -0.7687792 -0.656792827 mqs 12000 14764.19Wik Munkan wmu Australian -13.92 141.75 -0.4846364 -1.5544112 -0.7687792 -0.935942272 wim 400 16926.06Wantoat wnt Trans-New Guinea -6.17 146.5 1.3900889 -1.5544112 -0.7687792 -0.311033824 wnc 8201 16979.56Woisika woi Trans-New Guinea -8.25 124.83 1.3900889 -0.7169629 -0.7687792 -0.031884379 woi 16522 15090.83Wapishana wps Arawakan 2.67 -60 -1.2345266 -0.7169629 -0.7687792 -0.906756206 wap 7500 24664.26Warao wra Warao 9.33 -61.67 -0.4846364 -1.5544112 -0.7687792 -0.935942272 wba 18000 24385.32Wardaman wrd Australian -15.5 131 -0.4846364 -0.7169629 -0.7687792 -0.656792827 wrr 50 16134.48Waray (in Australia) wry Australian -13.17 131.25 -0.4846364 -0.7169629 -0.7687792 -0.656792827 wrz 4 15975.44Wu (Changzhou) wuc Sino-Tibetan 31.67 119.92 1.3900889 0.9579338 1.86204304 1.403355244 wuu 77175000 12371.61Xiamen xia Sino-Tibetan 24.5 118.17 -0.4846364 0.12048546 1.86204304 0.499297351 nan 46227965 12570.5!X???! xoo Khoisan -24 21.5 -0.4846364 1.79538213 1.86204304 1.057596241 nmn 4200 2838.755Yagua yag Peba-Yaguan -3.5 -72 -0.4846364 -1.5544112 0.54663194 -0.497471906 yad 5692 24056.11Yapese yap Austronesian 9.58 138.17 1.3900889 0.12048546 -0.7687792 0.247265066 yap 6592 15617.32Yaqui yaq Uto-Aztecan 27.5 -110.25 -0.4846364 -0.7169629 0.54663194 -0.218322461 yaq 16406 19213.52Yareba yar Yareban -9.5 148.5 -0.4846364 -1.5544112 -0.7687792 -0.935942272 yrb 750 17331.48Yawa yaw Yawa -1.75 136.25 -0.4846364 -1.5544112 -0.7687792 -0.935942272 yva 6000 15741.91Yay yay Tai-Kadai 22.42 104.75 -0.4846364 0.12048546 1.86204304 0.499297351 pcc 2049203 11431.97Yucuna ycn Arawakan -0.75 -71 -0.4846364 -0.7169629 -0.7687792 -0.656792827 ycn 1800 23850.17Yucatec yct Mayan 20 -89 -0.4846364 0.12048546 0.54663194 0.060826985 yua 700000 20910.71Yel?Æ Dnye yel Yele -11.37 154.17 1.3900889 1.79538213 -0.7687792 0.805563957 yle 3750 17981.82Yessan-Mayo yes Sepik -4.17 142.58 -1.2345266 -0.7169629 -0.7687792 -0.906756206 yss 1988 16493.31Yeyi yey Niger-Congo -20 23.5 -0.4846364 1.79538213 0.54663194 0.619125875 yey 25200 2579.903Yagaria ygr Trans-New Guinea -6.33 145.42 -0.4846364 -1.5544112 0.54663194 -0.497471906 ygr 21116 16877.2Yidiny yid Australian -17 145.75 -1.2345266 -1.5544112 -0.7687792 -1.185905651 yii 12 17471.56Yimas yim Lower Sepik-Ramu -4.67 143.55 -1.2345266 -1.5544112 -0.7687792 -1.185905651 yee 300 16613.97Yukaghir (Kolyma) yko Yukaghir 65.75 150.83 -0.4846364 0.12048546 -0.7687792 -0.377643382 yux 10 12354.75Yakut ykt Altaic 62 130 1.3900889 0.12048546 -0.7687792 0.247265066 sah 363000 11687.51Yanyuwa yny Australian -16.42 137.17 -1.2345266 0.9579338 -0.7687792 -0.348457316 jao 70 16692.95Yoruba yor Niger-Congo 8 4.33 1.3900889 -0.7169629 1.86204304 0.845056353 yor 19327000 1176.774Yukaghir (Tundra) ytu Yukaghir 69 155 -0.4846364 0.12048546 -0.7687792 -0.377643382 ykg 30 12259.78Yuchi yuc Yuchi 35.75 -86.75 -0.4846364 1.79538213 -0.7687792 0.180655509 yuc 10 19457.92Yulu yul Nilo-Saharan 8.5 25.25 1.3900889 1.79538213 1.86204304 1.682504689 yul 7000 2053.629Yurok yur Algic 41.33 -124 -0.4846364 0.9579338 -0.7687792 -0.098493936 yur 12 17268.06
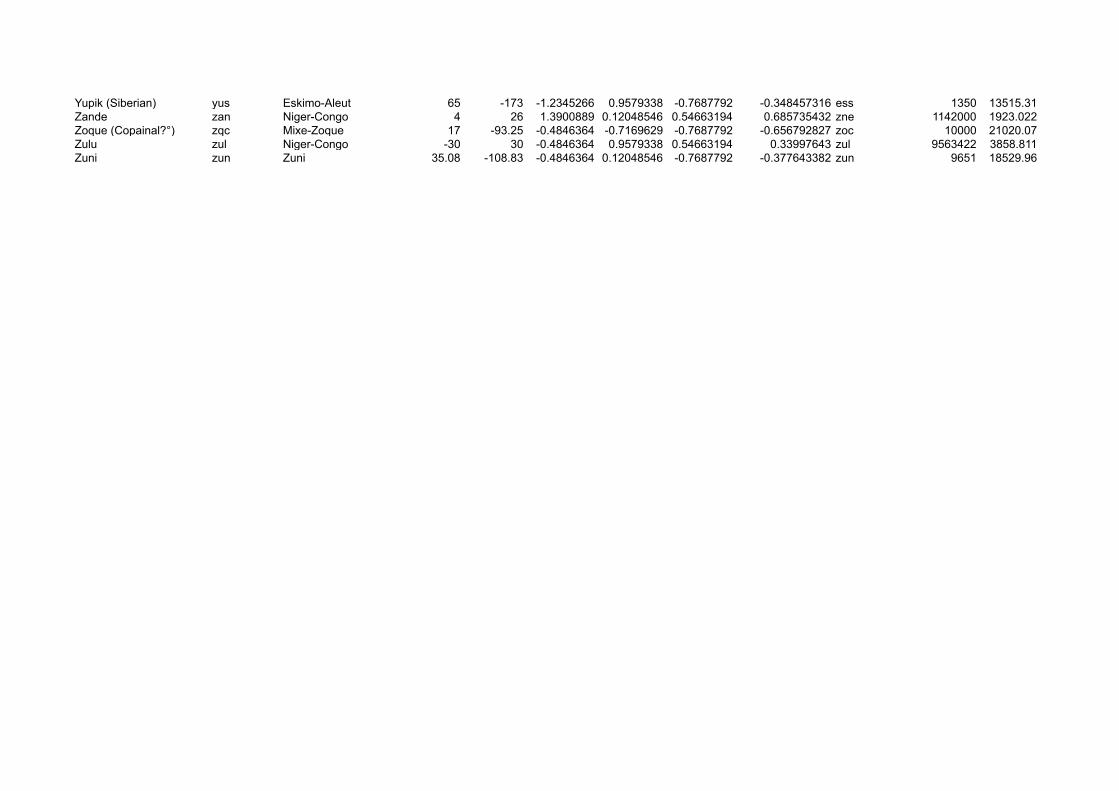
Yupik (Siberian) yus Eskimo-Aleut 65 -173 -1.2345266 0.9579338 -0.7687792 -0.348457316 ess 1350 13515.31Zande zan Niger-Congo 4 26 1.3900889 0.12048546 0.54663194 0.685735432 zne 1142000 1923.022Zoque (Copainal?°) zqc Mixe-Zoque 17 -93.25 -0.4846364 -0.7169629 -0.7687792 -0.656792827 zoc 10000 21020.07Zulu zul Niger-Congo -30 30 -0.4846364 0.9579338 0.54663194 0.33997643 zul 9563422 3858.811Zuni zun Zuni 35.08 -108.83 -0.4846364 0.12048546 -0.7687792 -0.377643382 zun 9651 18529.96
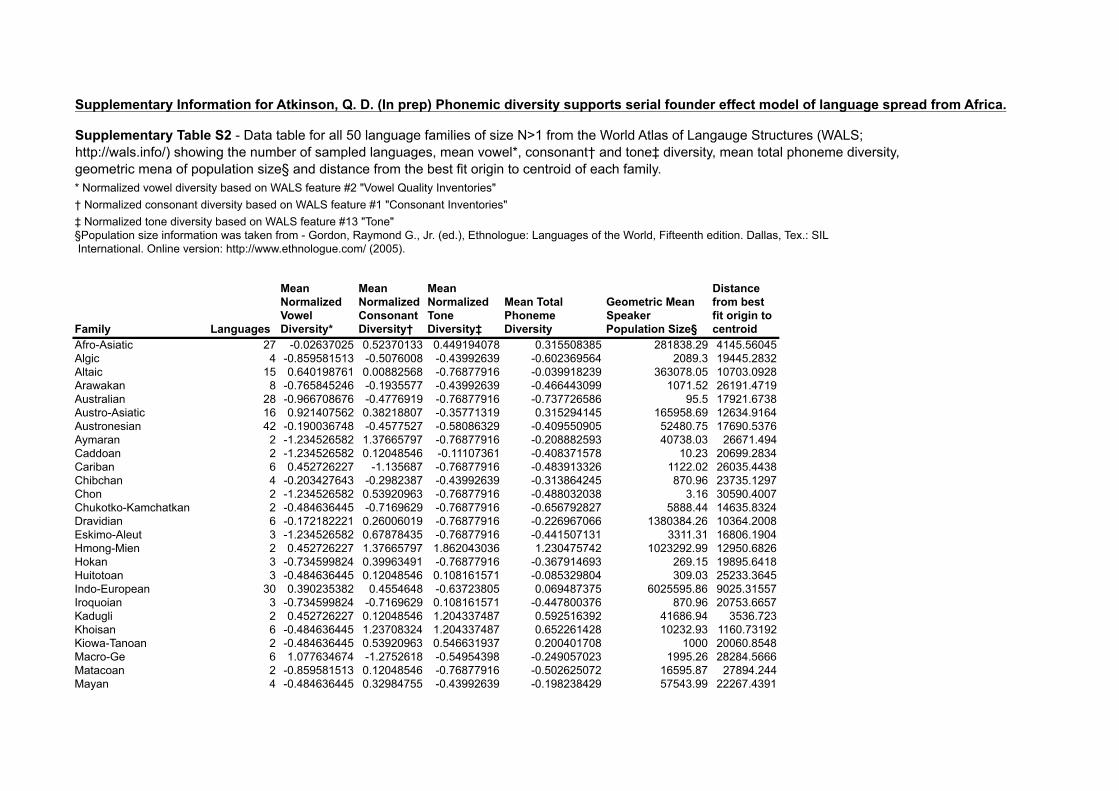
Supplementary Information for Atkinson, Q. D. (In prep) Phonemic diversity supports serial founder effect model of language spread from Africa.
* Normalized vowel diversity based on WALS feature #2 "Vowel Quality Inventories" † Normalized consonant diversity based on WALS feature #1 "Consonant Inventories" ‡ Normalized tone diversity based on WALS feature #13 "Tone" §Population size information was taken from - Gordon, Raymond G., Jr. (ed.), Ethnologue: Languages of the World, Fifteenth edition. Dallas, Tex.: SIL International. Online version: http://www.ethnologue.com/ (2005).
Family Languages
Mean Normalized Vowel Diversity*
Mean Normalized Consonant Diversity†
Mean Normalized Tone Diversity‡
Mean Total Phoneme Diversity
Geometric Mean Speaker Population Size§
Distance from best fit origin to centroid
Afro-Asiatic 27 -0.02637025 0.52370133 0.449194078 0.315508385 281838.29 4145.56045Algic 4 -0.859581513 -0.5076008 -0.43992639 -0.602369564 2089.3 19445.2832Altaic 15 0.640198761 0.00882568 -0.76877916 -0.039918239 363078.05 10703.0928Arawakan 8 -0.765845246 -0.1935577 -0.43992639 -0.466443099 1071.52 26191.4719Australian 28 -0.966708676 -0.4776919 -0.76877916 -0.737726586 95.5 17921.6738Austro-Asiatic 16 0.921407562 0.38218807 -0.35771319 0.315294145 165958.69 12634.9164Austronesian 42 -0.190036748 -0.4577527 -0.58086329 -0.409550905 52480.75 17690.5376Aymaran 2 -1.234526582 1.37665797 -0.76877916 -0.208882593 40738.03 26671.494Caddoan 2 -1.234526582 0.12048546 -0.11107361 -0.408371578 10.23 20699.2834Cariban 6 0.452726227 -1.135687 -0.76877916 -0.483913326 1122.02 26035.4438Chibchan 4 -0.203427643 -0.2982387 -0.43992639 -0.313864245 870.96 23735.1297Chon 2 -1.234526582 0.53920963 -0.76877916 -0.488032038 3.16 30590.4007Chukotko-Kamchatkan 2 -0.484636445 -0.7169629 -0.76877916 -0.656792827 5888.44 14635.8324Dravidian 6 -0.172182221 0.26006019 -0.76877916 -0.226967066 1380384.26 10364.2008Eskimo-Aleut 3 -1.234526582 0.67878435 -0.76877916 -0.441507131 3311.31 16806.1904Hmong-Mien 2 0.452726227 1.37665797 1.862043036 1.230475742 1023292.99 12950.6826Hokan 3 -0.734599824 0.39963491 -0.76877916 -0.367914693 269.15 19895.6418Huitotoan 3 -0.484636445 0.12048546 0.108161571 -0.085329804 309.03 25233.3645Indo-European 30 0.390235382 0.4554648 -0.63723805 0.069487375 6025595.86 9025.31557Iroquoian 3 -0.734599824 -0.7169629 0.108161571 -0.447800376 870.96 20753.6657Kadugli 2 0.452726227 0.12048546 1.204337487 0.592516392 41686.94 3536.723Khoisan 6 -0.484636445 1.23708324 1.204337487 0.652261428 10232.93 1160.73192Kiowa-Tanoan 2 -0.484636445 0.53920963 0.546631937 0.200401708 1000 20060.8548Macro-Ge 6 1.077634674 -1.2752618 -0.54954398 -0.249057023 1995.26 28284.5666Matacoan 2 -0.859581513 0.12048546 -0.76877916 -0.502625072 16595.87 27894.244Mayan 4 -0.484636445 0.32984755 -0.43992639 -0.198238429 57543.99 22267.4391
Supplementary Table S2 - Data table for all 50 language families of size N>1 from the World Atlas of Langauge Structures (WALS; http://wals.info/) showing the number of sampled languages, mean vowel*, consonant† and tone‡ diversity, mean total phoneme diversity, geometric mena of population size§ and distance from the best fit origin to centroid of each family.
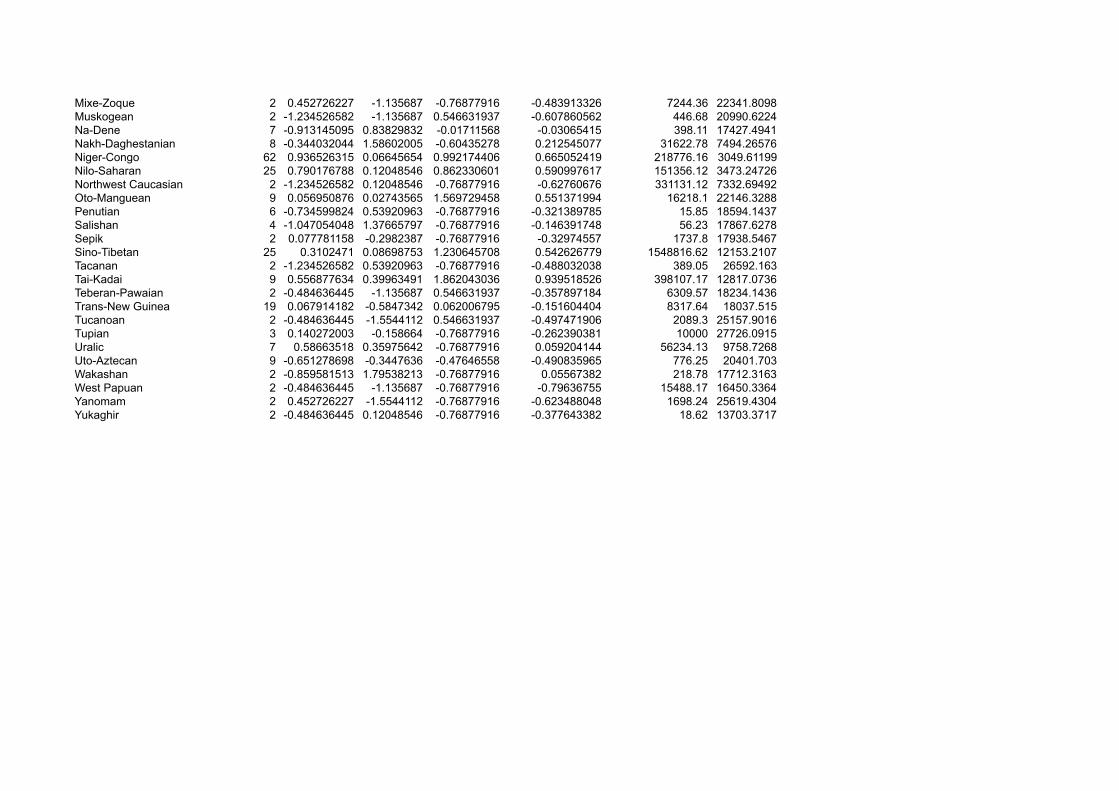
Mixe-Zoque 2 0.452726227 -1.135687 -0.76877916 -0.483913326 7244.36 22341.8098Muskogean 2 -1.234526582 -1.135687 0.546631937 -0.607860562 446.68 20990.6224Na-Dene 7 -0.913145095 0.83829832 -0.01711568 -0.03065415 398.11 17427.4941Nakh-Daghestanian 8 -0.344032044 1.58602005 -0.60435278 0.212545077 31622.78 7494.26576Niger-Congo 62 0.936526315 0.06645654 0.992174406 0.665052419 218776.16 3049.61199Nilo-Saharan 25 0.790176788 0.12048546 0.862330601 0.590997617 151356.12 3473.24726Northwest Caucasian 2 -1.234526582 0.12048546 -0.76877916 -0.62760676 331131.12 7332.69492Oto-Manguean 9 0.056950876 0.02743565 1.569729458 0.551371994 16218.1 22146.3288Penutian 6 -0.734599824 0.53920963 -0.76877916 -0.321389785 15.85 18594.1437Salishan 4 -1.047054048 1.37665797 -0.76877916 -0.146391748 56.23 17867.6278Sepik 2 0.077781158 -0.2982387 -0.76877916 -0.32974557 1737.8 17938.5467Sino-Tibetan 25 0.3102471 0.08698753 1.230645708 0.542626779 1548816.62 12153.2107Tacanan 2 -1.234526582 0.53920963 -0.76877916 -0.488032038 389.05 26592.163Tai-Kadai 9 0.556877634 0.39963491 1.862043036 0.939518526 398107.17 12817.0736Teberan-Pawaian 2 -0.484636445 -1.135687 0.546631937 -0.357897184 6309.57 18234.1436Trans-New Guinea 19 0.067914182 -0.5847342 0.062006795 -0.151604404 8317.64 18037.515Tucanoan 2 -0.484636445 -1.5544112 0.546631937 -0.497471906 2089.3 25157.9016Tupian 3 0.140272003 -0.158664 -0.76877916 -0.262390381 10000 27726.0915Uralic 7 0.58663518 0.35975642 -0.76877916 0.059204144 56234.13 9758.7268Uto-Aztecan 9 -0.651278698 -0.3447636 -0.47646558 -0.490835965 776.25 20401.703Wakashan 2 -0.859581513 1.79538213 -0.76877916 0.05567382 218.78 17712.3163West Papuan 2 -0.484636445 -1.135687 -0.76877916 -0.79636755 15488.17 16450.3364Yanomam 2 0.452726227 -1.5544112 -0.76877916 -0.623488048 1698.24 25619.4304Yukaghir 2 -0.484636445 0.12048546 -0.76877916 -0.377643382 18.62 13703.3717
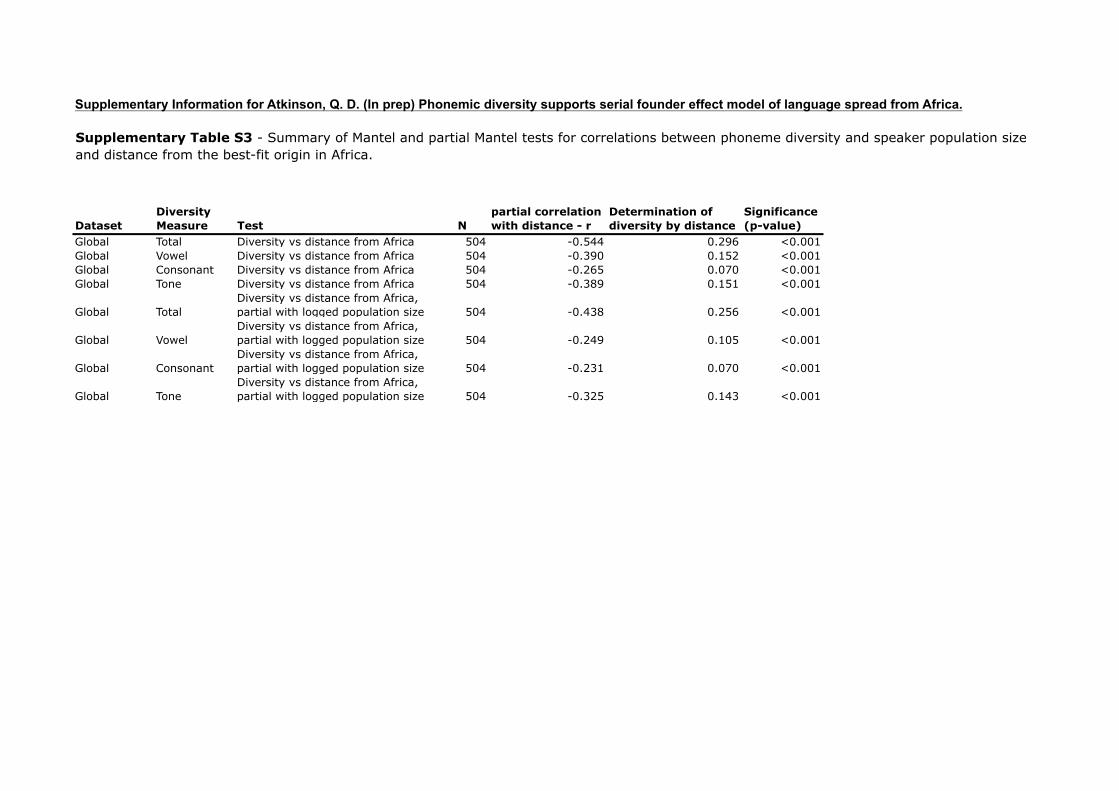
Supplementary Information for Atkinson, Q. D. (In prep) Phonemic diversity supports serial founder effect model of language spread from Africa.
DatasetDiversity Measure Test N
partial correlation with distance - r
Determination of diversity by distance
Significance (p-value)
Global Total Diversity vs distance from Africa 504 -0.544 0.296 <0.001Global Vowel Diversity vs distance from Africa 504 -0.390 0.152 <0.001Global Consonant Diversity vs distance from Africa 504 -0.265 0.070 <0.001Global Tone Diversity vs distance from Africa 504 -0.389 0.151 <0.001
Global TotalDiversity vs distance from Africa, partial with logged population size 504 -0.438 0.256 <0.001
Global VowelDiversity vs distance from Africa, partial with logged population size 504 -0.249 0.105 <0.001
Global ConsonantDiversity vs distance from Africa, partial with logged population size 504 -0.231 0.070 <0.001
Global ToneDiversity vs distance from Africa, partial with logged population size 504 -0.325 0.143 <0.001
Supplementary Table S3 - Summary of Mantel and partial Mantel tests for correlations between phoneme diversity and speaker population size and distance from the best-fit origin in Africa.

Supplementary Information for Atkinson, Q. D. (In prep) Phonemic diversity supports serial founder effect model of language spread from Africa.
Waypoint Linking Location Long. Lat.1 Africa and Asia Cairo 31.0 E 30.0 N2 Asia and Europe Istanbul 29.0 E 41.0 N3 Asia and Oceania Phnom Penh 105.0 E 11.5 N4 Asia and North America Bering Strait 170.0 W 66.0 N5 North America and South America Panama 77.5 W 8.0 N
Supplementary Table S4 - Waypoints used to calculate pairwise geographic distances between locations on different continents.
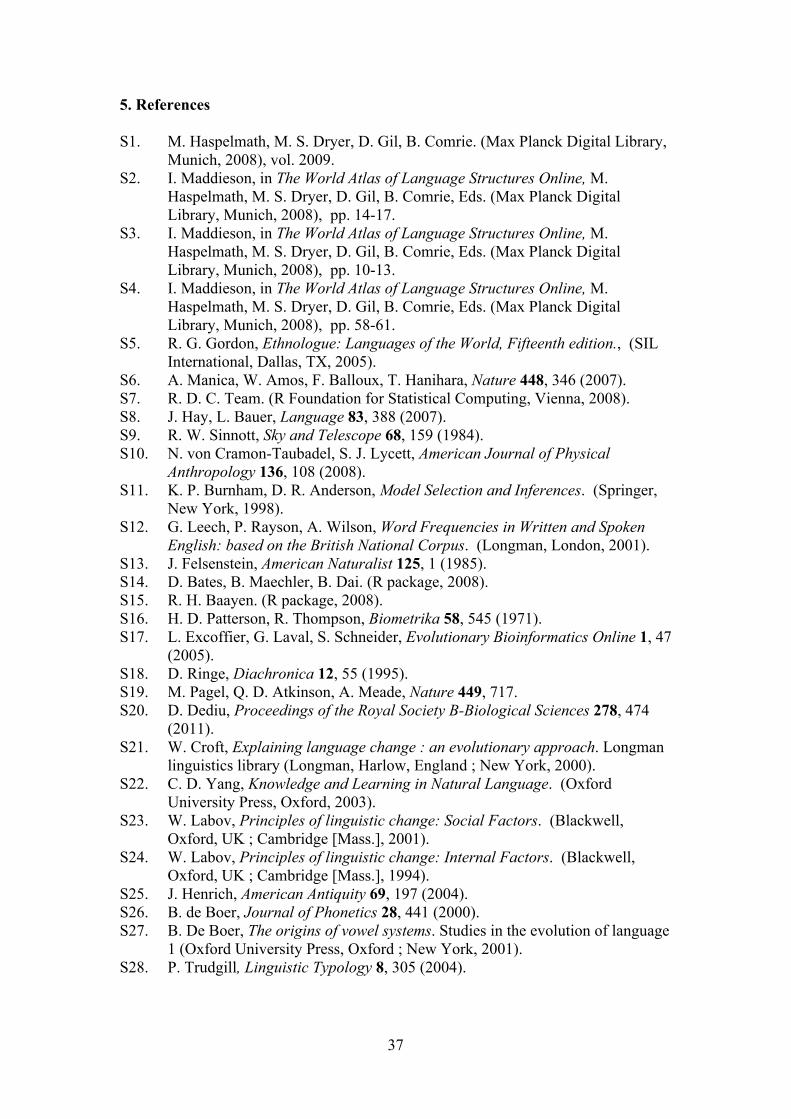
37
5. References S1. M. Haspelmath, M. S. Dryer, D. Gil, B. Comrie. (Max Planck Digital Library,
Munich, 2008), vol. 2009. S2. I. Maddieson, in The World Atlas of Language Structures Online, M.
Haspelmath, M. S. Dryer, D. Gil, B. Comrie, Eds. (Max Planck Digital Library, Munich, 2008), pp. 14-17.
S3. I. Maddieson, in The World Atlas of Language Structures Online, M. Haspelmath, M. S. Dryer, D. Gil, B. Comrie, Eds. (Max Planck Digital Library, Munich, 2008), pp. 10-13.
S4. I. Maddieson, in The World Atlas of Language Structures Online, M. Haspelmath, M. S. Dryer, D. Gil, B. Comrie, Eds. (Max Planck Digital Library, Munich, 2008), pp. 58-61.
S5. R. G. Gordon, Ethnologue: Languages of the World, Fifteenth edition., (SIL International, Dallas, TX, 2005).
S6. A. Manica, W. Amos, F. Balloux, T. Hanihara, Nature 448, 346 (2007). S7. R. D. C. Team. (R Foundation for Statistical Computing, Vienna, 2008). S8. J. Hay, L. Bauer, Language 83, 388 (2007). S9. R. W. Sinnott, Sky and Telescope 68, 159 (1984). S10. N. von Cramon-Taubadel, S. J. Lycett, American Journal of Physical
Anthropology 136, 108 (2008). S11. K. P. Burnham, D. R. Anderson, Model Selection and Inferences. (Springer,
New York, 1998). S12. G. Leech, P. Rayson, A. Wilson, Word Frequencies in Written and Spoken
English: based on the British National Corpus. (Longman, London, 2001). S13. J. Felsenstein, American Naturalist 125, 1 (1985). S14. D. Bates, B. Maechler, B. Dai. (R package, 2008). S15. R. H. Baayen. (R package, 2008). S16. H. D. Patterson, R. Thompson, Biometrika 58, 545 (1971). S17. L. Excoffier, G. Laval, S. Schneider, Evolutionary Bioinformatics Online 1, 47
(2005). S18. D. Ringe, Diachronica 12, 55 (1995). S19. M. Pagel, Q. D. Atkinson, A. Meade, Nature 449, 717. S20. D. Dediu, Proceedings of the Royal Society B-Biological Sciences 278, 474
(2011). S21. W. Croft, Explaining language change : an evolutionary approach. Longman
linguistics library (Longman, Harlow, England ; New York, 2000). S22. C. D. Yang, Knowledge and Learning in Natural Language. (Oxford
University Press, Oxford, 2003). S23. W. Labov, Principles of linguistic change: Social Factors. (Blackwell,
Oxford, UK ; Cambridge [Mass.], 2001). S24. W. Labov, Principles of linguistic change: Internal Factors. (Blackwell,
Oxford, UK ; Cambridge [Mass.], 1994). S25. J. Henrich, American Antiquity 69, 197 (2004). S26. B. de Boer, Journal of Phonetics 28, 441 (2000). S27. B. De Boer, The origins of vowel systems. Studies in the evolution of language
1 (Oxford University Press, Oxford ; New York, 2001). S28. P. Trudgill, Linguistic Typology 8, 305 (2004).
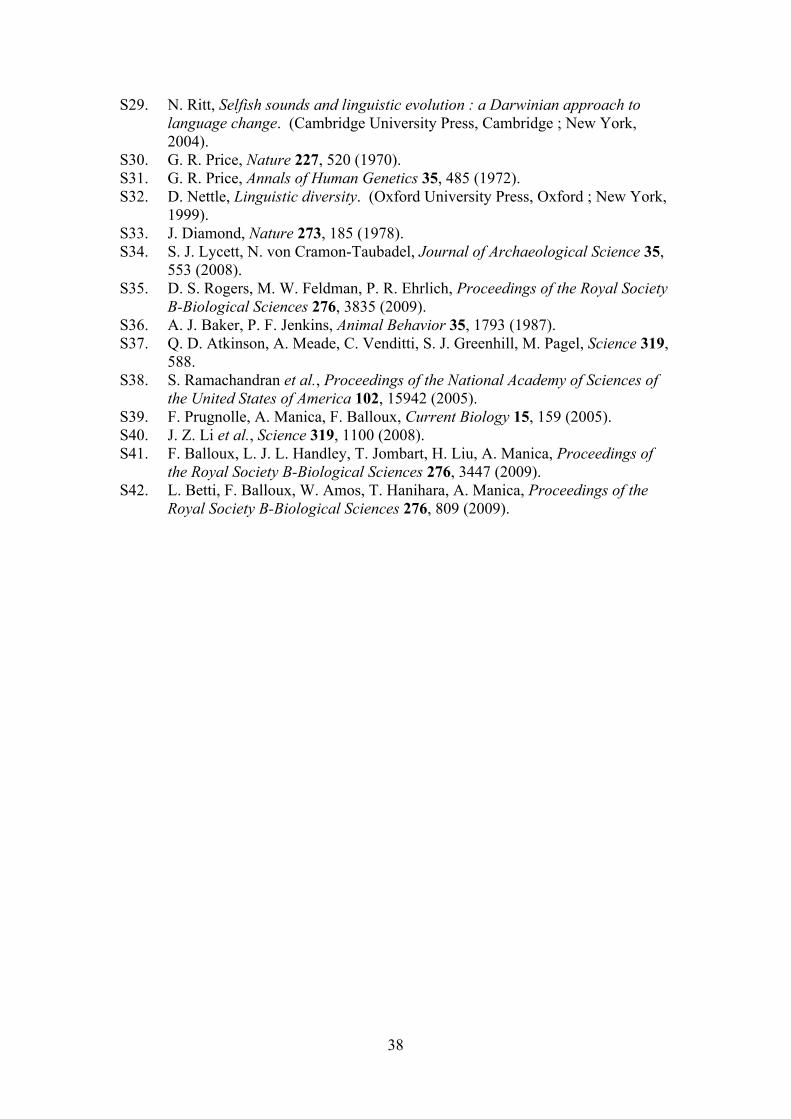
38
S29. N. Ritt, Selfish sounds and linguistic evolution : a Darwinian approach to language change. (Cambridge University Press, Cambridge ; New York, 2004).
S30. G. R. Price, Nature 227, 520 (1970). S31. G. R. Price, Annals of Human Genetics 35, 485 (1972). S32. D. Nettle, Linguistic diversity. (Oxford University Press, Oxford ; New York,
1999). S33. J. Diamond, Nature 273, 185 (1978). S34. S. J. Lycett, N. von Cramon-Taubadel, Journal of Archaeological Science 35,
553 (2008). S35. D. S. Rogers, M. W. Feldman, P. R. Ehrlich, Proceedings of the Royal Society
B-Biological Sciences 276, 3835 (2009). S36. A. J. Baker, P. F. Jenkins, Animal Behavior 35, 1793 (1987). S37. Q. D. Atkinson, A. Meade, C. Venditti, S. J. Greenhill, M. Pagel, Science 319,
588. S38. S. Ramachandran et al., Proceedings of the National Academy of Sciences of
the United States of America 102, 15942 (2005). S39. F. Prugnolle, A. Manica, F. Balloux, Current Biology 15, 159 (2005). S40. J. Z. Li et al., Science 319, 1100 (2008). S41. F. Balloux, L. J. L. Handley, T. Jombart, H. Liu, A. Manica, Proceedings of
the Royal Society B-Biological Sciences 276, 3447 (2009). S42. L. Betti, F. Balloux, W. Amos, T. Hanihara, A. Manica, Proceedings of the
Royal Society B-Biological Sciences 276, 809 (2009).