
Supporting Information - The Royal Society of Chemistry
18
S1 Supporting Information P3-type K 0.32 Fe 0.35 Mn 0.65 O 2 ·0.39H 2 O: a promising cathode for Na-Ion full batteries Fig. S1 XRD patterns of the KFM sample and the 500 °C heated KFM sample, the inset shows the details between 11 and 14°. (The heated sample was cooled down in argon-filled glove box and immediately characterized) Electronic Supplementary Material (ESI) for Journal of Materials Chemistry A. This journal is © The Royal Society of Chemistry 2018
-
Upload
khangminh22 -
Category
Documents
-
view
1 -
download
0
Transcript of Supporting Information - The Royal Society of Chemistry

S1
Supporting InformationP3-type K0.32Fe0.35Mn0.65O2·0.39H2O: a promising cathode for Na-Ion
full batteries
Fig. S1 XRD patterns of the KFM sample and the 500 °C heated KFM sample, the
inset shows the details between 11 and 14°. (The heated sample was cooled down in
argon-filled glove box and immediately characterized)
Electronic Supplementary Material (ESI) for Journal of Materials Chemistry A.This journal is © The Royal Society of Chemistry 2018

S2
Table S1. The calculated lattice reflections, inter-planar distances and peak intensities
of KFM by Rietveld refinement.
No. 2θ h k l D-spacing (Å) Int. (a.u.)1 12.618 0 0 -3 7.0097 444697.742 25.392 0 0 -6 3.5049 151062.353 36.078 -1 1 1 2.4876 178112.724 36.854 0 1 2 2.4369 150658.125 38.498 0 -9 2 2.3366 19851.076 39.828 -1 1 4 2.2615 86947.487 41.943 0 1 5 2.1523 205139.98 47.202 -1 1 7 1.924 118803.759 50.271 0 1 8 1.8135 52785.8510 52.152 0 0 -12 1.7524 34655.9211 57.143 -1 1 10 1.6107 40875.8412 60.909 0 1 11 1.5198 31610.1913 64.36 -1 2 0 1.4463 45649.4514 65.886 -1 2 3 1.4165 31699.5915 66.659 0 0 -15 1.4019 5775.4416 69.06 -1 1 13 1.3589 23584.9717 70.36 -1 2 6 1.337 45283.0118 73.445 0 1 14 1.2883 12791.2119 76.058 0 2 1 1.2504 15461.1820 76.533 -2 2 2 1.2438 12659.7521 77.564 -1 2 9 1.2298 16795.3322 78.423 0 2 4 1.2185 10189.2423 79.832 -2 2 5 1.2005 16929.8524 82.5 0 0 -18 1.1683 4653.2225 82.882 -1 1 16 1.1639 8224.4926 83.562 0 2 7 1.1561 13719.2427 85.879 -2 2 8 1.1308 8536.128 87.347 -1 2 12 1.1155 27975.1429 87.974 0 1 17 1.1092 12451.16

S3
Table S2. Rietveld refinement parameters and results obtained for KFM.
Fig. S2. XRD patterns of the KFM sample and the ash (before the centrifuging step)
that cooled down in air and argon-filled glove box, respectively; the inset shows the
details between 11 and 14°.
Atoms x y z OccupancyK 0 0 0.832921 0.32Fe 0 0 0 0.35Mn 0 0 0 0.65O 0 0 0.409097 1O 0 0 0.590903 1
O(H2O) 0 0 0.832921 0.39

S4
Fig. S3. (a, b) Optical images of the centrifuge tube in the progress of washing the
KFM.
S5
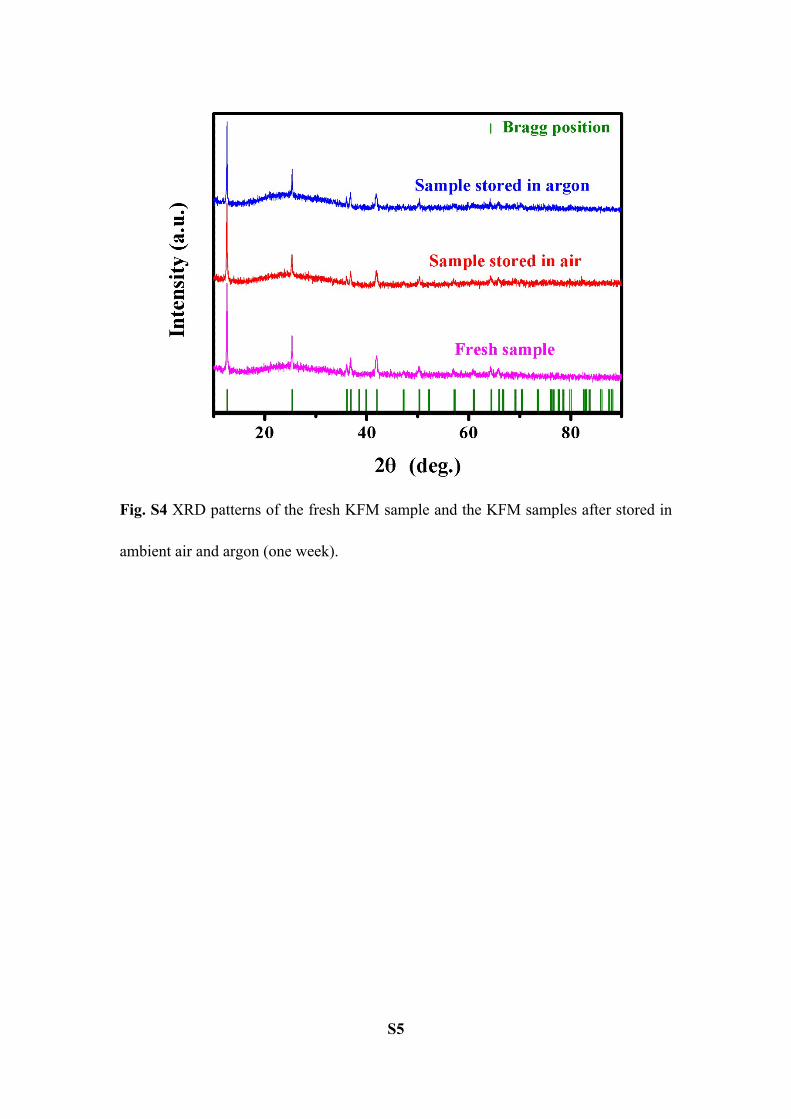
Fig. S4 XRD patterns of the fresh KFM sample and the KFM samples after stored in
ambient air and argon (one week).

S6
Fig. S5 TEM images of KFM with different magnifications.

S7
Fig. S6 (a) Fe 2p (Peak 1, 2, 3 for Fe3+, Peak 4, 5, 6 for Fe2+) (b) Mn 2p XPS spectra
of KFM in different states during cycling (Peak 1, 2 for Mn4+, Peak 3, 4 for Mn3+ and
Peak 5, 6,7 for Mn2+).
Ex situ XPS method was employed to further understand the valence change through
recording electrodes with different depths of discharge and charge at 10 mA g-1. After
the 1st discharge, the original peaks of Fe3+ and Mn4+ decrease and new peaks
represent Fe2+, Mn3+ and Mn2+ appear.1–4 As the voltage is increased to 3.8 V in the
2nd cycle,it is evident that the Fe2+ and Mn2+ are oxidized which is in according

S8
with the alkali ion desertion progress. When the electrode is discharged to 1.6 V in the
2nd cycle, we again find the ratio increasing of Fe2+ and Mn2+ and the ratio decreasing
of Fe3+ and Mn3+. The result presented here is a primary qualitative analysis. As in the
transformation of KFM electrodes to XPS equipment, the contact to air is inevitable
and it’s not fit for estimating the capacity of KFM.
Fig. S7 Discharge/charge curves of KFM at 100 mA g-1.
S9
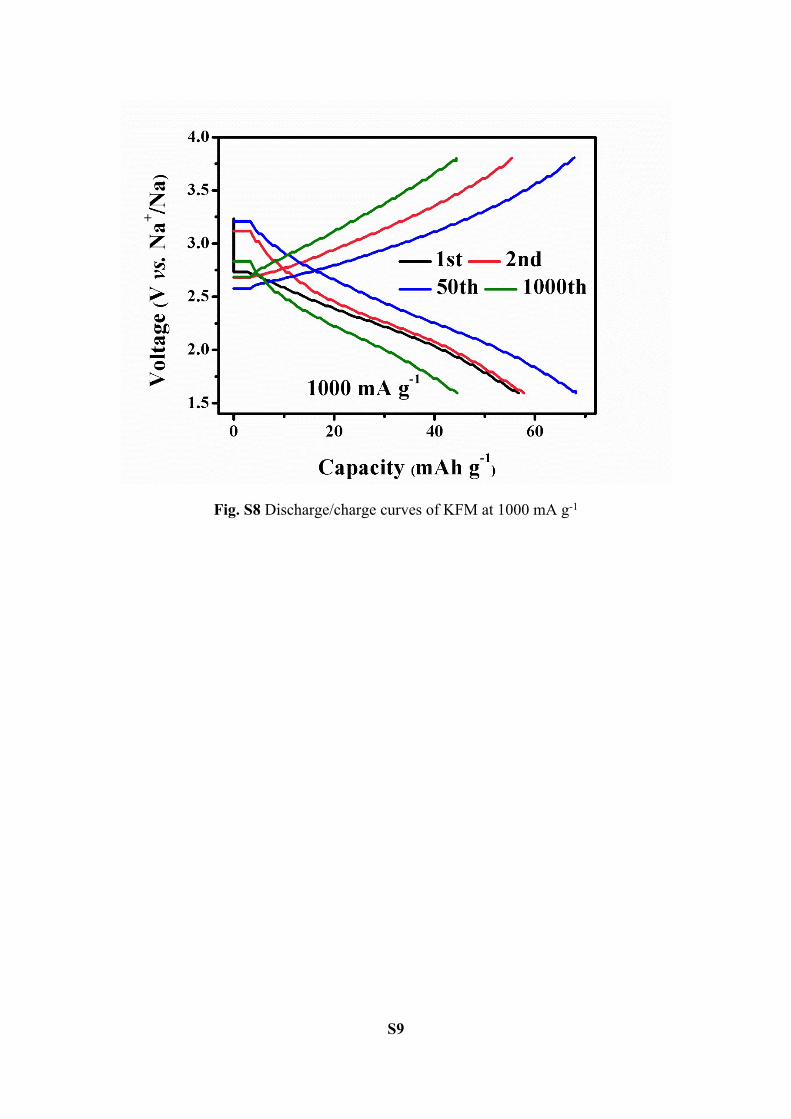
Fig. S8 Discharge/charge curves of KFM at 1000 mA g-1

S10
Fig. S9 (a) Discharge/charge curves of 200 °C-heated KFM at 10 mA g-1. (b) The
cycle performances of 200 °C heated KFM at 1000 mA g-1.
The 200 °C-heated KFM shows initial discharge capacity of 128.3 mAh g-1 at 10
mAh g-1 and the discharge capacity of the 5th cycle is 130.6 mAh g-1 (Fig. S9a). The
200 °C heated KFM also shows considerable cycle performance at 1000 mA g-1 that a
maximum discharge capacity of 66.5 mAh g-1 together with a discharge capacity of
48.0 mAh g-1 at the 1000th cycle are delivered (Fig. S9b).

S11
Fig. S10 (a) XRD curves of the electrodes at the end of charge/discharge of 5th, (b) 120th and (c) 1000th.

S12
Fig. S11 (a) K and (b) Na XPS of the pristine sample and the electrode after 120
cycles.

S13
Fig. S12 The corresponding XRD patterns (without protection by Kapton films) of
different stages in Fig. 5a (bottom to top—A to I), the black dashed lines marked
peaks are those originated from the aluminum current collectors.

S14
Fig. S13 Discharge/charge curves of the full battery at 1000 mA g-1

S15
Fig. S14 (a) Discharge/charge curves of KFM at 10 mA g-1 in the electrolete without
FEC additive. (b) The cycle performances of KFM at 100 mA g-1 in the electrolyte
without FEC additive.
To further explore the efficacy of KFM, the electrochemical performance of the
material with FEC-free electrolyte was tested for comparison (Fig. S14a, b). The

S16
KFM demonstrates approximate initial capacities as the FEC-contained ones, but the
KFM shows relative lower coulombic efficiencies both at 10 and 100 mA g-1 and only
a discharge capacity of 55.0 mAh g-1 is obtained after 200 cycles at 100 mA g-1.
Table S3. Summary of the typical low-cost cathodes for NIBs.
Materials Max capacity
Cycle number/cycle rate Full cells Ref.
O3-Na [Fe1/2Mn1/2]O2100–110 mAh g−1 30/12 mA g-1 - [5]
P2-Na2/3[Fe1/2Mn1/2]O2 190 mAh g-1 30/12 mA g-1 - [5]
P2-Na7/9Cu2/9Fe1/9Mn2/3O2 89 mAh g−1 150/100 mA g-1 - [6]
Romanechite-structuredNa0.31MnO1.9
About 90 mAh g-1
100/5 C charge, 0.2 C discharge - [7]
FePO4 151 mAh g-1 160/20 mA g-1 - [8]
NaFe(SO4)2About 85 mAh g-1 80/0.2C - [9]
This work 137.5 mAh g-1 1000/1000 mA g-1 220.5 Wh kg−1
and 4340 W kg-1 -

S17
Table S4. Summary of some representative state-of-the-art cathode materials for
NIBs. (Note: The energy/power densities of full cells are all calculated based on the
mass of cathode material)
Materials Half cells max capacity
Half cell cycle number/cycle
rate
Full cellsenergy/power
densities
Full cellcycles/
Average potential
Ref.
Na2Co2(SeO3)3–GO 75 mAh g-1 50/4.9 mA g-1 - - [10]
Na1.1V3O7.9@rGO 174 mAh g-1 500/1000 mA g-1 - - [11]
NaNi0.45Cu0.05Mn0.4Ti0.1O2 124 mAh g-1 500/1 C - - [12]
NaVPO4F/C 120 mAh g-1 1000/286 mAh g-1 112 Wh kg−1/ 200 W kg-1 50/1.4 V [13]
Na3V2(PO4)3 113 mAh g-1 1000/10 C134 Wh
kg−1/13200 W kg−1
300/1.3 V [14]
Na[Ni0.25Fe0.5Mn0.25]O2/C 130 mAh g-1 50/0.5 C312 Wh
kg−1/3120 W kg−1
150/2.4 V [15]
K0.33Co0.53Mn0.47O2∙0.39H2O 114 mAh g-1 130/500 mA g-1 186.1 Wh kg−1
/2634 W kg-1100/2.5
V [16]
This work 137.5 mAh g-1 1000/1000 mA g-1 220.5 Wh kg−1 /4340 W kg-1
900/ 2.1 V -
References

S18
[1] Q. An, F. Lv, Q. Liu, C. Han, K. Zhao, J. Sheng, Q. Wei, M. Yan, L. Mai, Nano Lett.,
2014, 14, 6250.
[2] L. Li , A.-R. O. Raji, J. M. Tour, Adv. Mater., 2013, 25, 6298.
[3] A. Baylet, S. Royer, C. Labrugère, H. Valencia, P. Marécot, J. M. Tatibouët, D. Duprez,
Phys. Chem. Chem. Phys., 2008, 10, 5983.
[4] P. R. Chowdhury, K. G. Bhattacharyya, RSC Adv., 2016, 6, 112016.
[5] N. Yabuuchi, M. Kajiyama, J. Iwatate, H. Nishikawa, S. Hitomi, R. Okuyama, R. Usui, Y.
Yamada, S. Komaba, Nature Materials, 2012, 11, 512.
[6] Y. Li, Z. Yang, S. Xu, L. Mu, L. Gu, Y.-S. Hu , H. Li, L. Chen, Adv. Sci., 2015, 2,
1500031.
[7] J.-Y. Li, X.-L. Wu, X.-H. Zhang, H.-Y. Lu, G. Wang, J.-Z. Guo, F. Wan, R.-S. Wang,
Chem. Commun., 2015, 51, 14848.
[8] Y. Fang, L. Xiao, J. Qian, X. Ai, H. Yang, Y. Cao, Nano Lett., 2014, 14, 3539.
[9] P. Singh, K. Shiva, H. Celio, J. B. Goodenough, Energy Environ. Sci., 2015, 8 3000.
[10] S. Y. Kim, D. Kundu, L. F. Nazar, Adv. Energy Mater., 2018, 8, 1701729.
[11] Y. Cai, F. Liu, Z. Luo, G. Fang, J. Zhou, A. Pan, S. Liang, Energy Storage Materials,
2018, 13, 168.
[12] H.-R. Yao, P.-F. Wang, Y. Gong, J. Zhang, X. Yu, L. Gu, C. OuYang, Y.-X. Yin, E. Hu,
X.-Q. Yang, E. Stavitski, Y.-G. Guo, L.-J. Wan, J. Am. Chem. Soc., 2017, 139, 8440.
[13] T. Jin, Y. Liu, Y. Li, K. Cao, X. Wang, L. Jiao, Adv. Energy Mater., 2017, 7, 1700087.
[14] W. Ren, Z. Zheng, C. Xu, C. Niu, Q. Wei, Q. An, K. Zhao, M. Yan, M. Qin, L. Mai,
Nano Energy, 2016, 25, 145.
[15] S.-M. Oh, S.-T. Myung, C. S. Yoon, J. Lu, J. Hassoun, B. Scrosati, K. Amine, Y.-K. Sun,
Nano Lett., 2014, 14, 1620.
[16] S. Wang, T. Sun, S. Yuan, Y.-H. Zhu, X.-B. Zhang, J.-M. Yan, Q. Jiang, Mater. Horiz.,
2017, 4, 1122.