
Proton conductors of cerium pyrophosphate for intermediate temperature fuel cell

Applied Catalysis B: Environmental 93 (2010) 395–405
The catalytic performance of mesoporous cerium oxides prepared through ananocasting route for the total oxidation of naphthalene
Begona Puertolas a, Benjamın Solsona b,*, Said Agouram c,d, Ramon Murillo a,Ana Marıa Mastral a, Asuncion Aranda a, Stuart H. Taylor e, Tomas Garcia a,**a Instituto de Carboquımica (CSIC), C/Miguel Luesma, 50018 Zaragoza, Spainb Departament d’Enginyeria Quımica, Universitat de Valencia, C/Dr. Moliner 50, 46100 Burjassot, Valencia, Spainc Department of Applied Physics and Electromagnetism, Universitat de Valencia, C/Dr. Moliner 50, 46100 Burjassot, Valencia, Spaind SCSIE, Universitat de Valencia, C/Dr. Moliner 50, 46100 Burjassot, Valencia, Spaine Cardiff Catalysis Institute, School of Chemistry, Cardiff University, Main Building, Park Place, Cardiff CF10 3AT, UK
A R T I C L E I N F O
Article history:
Received 22 July 2009
Received in revised form 14 October 2009
Accepted 17 October 2009
Available online 30 October 2009
Keywords:
Catalytic combustion
Nanocasting
Mesoporous CeO2
KIT-6
Naphthalene
A B S T R A C T
Cerium oxides have been prepared by nanocasting of a mesoporous siliceous KIT-6. Through this
synthesis method a partially ordered mesoporous structure, as demonstrated by several characterization
techniques (N2 adsorption, XRD and HRTEM) has been obtained. Accordingly, very high surface areas
have been achieved (up to 163 m2/g), despite using high calcination temperatures (550 8C). We have
demonstrated that the aging temperature of the siliceous template is of outstanding importance, as this
parameter is directly responsible for both the pore size and the surface area of the catalysts. In addition,
whilst a low preparation temperature (40 8C) makes the further removal of the silica template difficult,
higher temperatures lead to more compact frameworks with a higher interconnectivity among the
networks. These cerium oxide materials have been tested as catalysts for the total oxidation of
naphthalene, and display excellent activity, remarkably higher than commercial CeO2. The mesoporous
ceria catalysts also demonstrate a high degree of stability with extended time-on-stream and most
importantly using high reaction temperatures.
� 2009 Elsevier B.V. All rights reserved.
Contents lists available at ScienceDirect
Applied Catalysis B: Environmental
journa l homepage: www.e lsev ier .com/ locate /apcatb
1. Introduction
Polycyclic aromatic hydrocarbons (PAHs) are a family ofenvironmental pollutants produced as a result of the incompletecombustion, or pyrolysis, of organic material [1,2]. These emissionsare mainly associated with the use of diesel, gasoline, gas, coal andwood used in power generation [3–5]. The increase of theconcentration of PAHs in urban areas, mainly due to the proliferationof diesel vehicles, has been linked to serious risks to health sincemany of them are carcinogenic and/or mutagenic [6,7]. In addition,PAHs can be released to the environment either supported ontoparticulate matter or in the gas phase. Whereas particulate mattercan be trapped with a reasonably high efficiency the control of PAHemissions in the gas phase is more difficult [3].
A range of different technologies has been developed to reducePAH emissions. These include biodegradation, absorption, adsorp-tion, high-energy electron beam, ozonization and catalytic
* Corresponding author. Tel.: +34 963544319; fax: +34 963544898.
** Corresponding author. Tel.: +34 976 733977.
E-mail addresses: [email protected] (B. Solsona), [email protected]
(T. Garcia).
0926-3373/$ – see front matter � 2009 Elsevier B.V. All rights reserved.
doi:10.1016/j.apcatb.2009.10.014
oxidation [6,8]. Among them, catalytic oxidation has beendemonstrated to be one of the most promising technologies forthe removal of PAHs by converting them to carbon dioxide andwater. The possibility of operating at lower temperatures and withhigher selectivity to CO2 than other methods, makes it one of themost economical and effective techniques for the destruction ofPAHs [3,9]. Unlike thermal oxidation, catalytic oxidation allowsoperation with diluted effluent streams (<1% PAHs [9]) and leadsto lower combustion temperatures, which means substantialenergy savings.
Naphthalene is the most volatile member of this class ofpollutants. It consists of a basic aromatic structure and is thesimplest and least toxic PAH. Therefore, it is taken as a modelcompound in the study of this group of pollutants; the informationobtained for naphthalene can be very useful for the abatement ofother PAHs [6,10].
Noble metal based catalysts, such as Pt and Pd supported ondifferent metal oxides, are very active for the removal of PAHs,especially naphthalene [1,11,12]. However, the development ofmore active and cost-effective catalysts for the complete oxidationof PAHs remains a major research target.
Among an extensive range of metal oxide catalysts, CeO2 hasdemonstrated to be a potential catalyst for the treatment of PAH

B. Puertolas et al. / Applied Catalysis B: Environmental 93 (2010) 395–405396
emissions, especially naphthalene [13]. Its excellent activity fornaphthalene oxidation is a combination of the ability to transportoxygen, high surface area and the capacity for redox behaviour[3,14,15]. It has been demonstrated that the Ce3+/Ce4+ redox cycleleads to high catalytic activity of CeO2 [6].
The synthesis of mesoporous inorganic oxides with high surfacearea has usually meant an improved performance in catalyticreactions. In fact, in catalytic combustion reactions of VOCs anincrease in the surface area has led, not only to higher catalyticactivity, but also on many occasions to a higher surface areanormalized rate [16,17]. However, the synthesis of such mesopor-ous high surface area materials usually requires large amounts oforganic compounds, expensive chemicals and some times extre-mely complicated preparation methods [18,19]. In addition,although many non-siliceous metal oxides have been fabricatedin the porous forms using organic surfactants as templates,crystalline walls leading to ordered materials could not beachieved [19]. The main problem is that temperatures requiredfor the crystallization of metal oxides are normally high and theliquid crystals of surfactants templating the oxides woulddecompose before the crystallization of metal oxides. All theseproblems can be solved using a nanocasting technique, especiallyemploying silica as a template [20,21].
The synthesis of inorganic oxides by nanocasting methodsinvolves the filling of the pores of a porous solid by the metal oxideprecursor. Thus, the development of these inorganic oxides isdetermined by the shape and size of the pores of the poroussiliceous material. Once the oxide is synthesized the templateframework is eliminated and the high surface area inorganic oxideis obtained.
In the present work a variety of partially ordered mesoporousCeO2 materials have been prepared using a nanocasting procedurewith siliceous KIT-6 as a template. These materials have beentested as catalysts for the total oxidation of naphthalene; showingexcellent activity. The preparation method involves (i) theincorporation of the CeO2 precursors into a KIT-6 mesoporoussilica template, (ii) their conversion to cerium oxide, and (iii) theremoval of the silica template. Variations of the aging temperatureduring the synthesis of the silica template (100, 80, 60 and 40 8C)have produced four different mesoporous catalysts with simila-rities to the cubic Ia3d symmetries of the silica template.
Presently there are only very few articles devoted to thepreparation of cerium oxide by a nanocasting route [22–24] usingmesoporous silica, and to the best of our knowledge, this is the firsttime a mesoporous inorganic oxide prepared by nanocasting hasbeen employed as a catalyst for the total oxidation of a polycyclicaromatic hydrocarbon, which has been identified as a particularlytoxic subset of VOCs.
2. Experimental
In this work, a mesoporous silica template was used as a hardtemplate: a three-dimensional Ia3d cubic arrangement of pores,KIT-6 [25,26]. Such a pore structure can yield mesoporous metaloxides with highly crystalline walls and good thermal stability,after the silica template is removed [26].
2.1. Synthesis of KIT-6 silica
KIT-6 was synthesized in acidic conditions using a mixture ofPluronic P123 triblock copolymer (EO20PO70EO20) as template andbutanol. Thus, 6 g of P123 were added to a solution of 220 g ofdistilled water and 12 g of concentrated HCl (35%). The mixturewas stirred for 6 h at 35 8C and then 6 g of butanol were addedunder stirring for 1 more hour [25]. Finally, 12.48 g of tetraethylorthosilicate (TEOS, 98%, Aldrich) were added and stirred for 24 h
at the same temperature. The resulting mixture was heated for24 h at 100, 80, 60 or 40 8C under static conditions (hydrothermaltreatment). Finally, the white solids were recovered by filtration,washed with deionized water and dried for 24 h in an oven at120 8C. Thereafter, the products were calcined in flowing air at550 8C for 6 h at a heating rate of 10 8C min�1 [25].
2.2. Preparation of mesoporous cerium oxides
For the synthesis of the mesoporous cerium oxide, siliceous KIT-6 has been used as a template. Thus, 0.15 g of KIT-6 and 0.4 g ofCe(NO3)3�6H2O were dispersed in 5 mL of ethanol. After 30 min ofstirring, ethanol was removed by evaporation through heating themixture overnight at 120 8C in an oven. Afterward, the resultingpowder was heated in a ceramic crucible in an oven at 350 8C for6 h to completely decompose the nitrate species. The impregnationstep was repeated with 5.0 mL of the metal salt solution in order toachieve higher loadings. After the evaporation of the solvent, theresulting material was calcined at 550 8C for 6 h. Finally, the silicatemplate was removed at room temperature using a 2 M NaOHaqueous solution. The NaOH etching of silica was repeated fourtimes, each time using a fresh portion of NaOH solution (5 mL) [25].The CeO2 materials were recovered by centrifugation, washed withwater and finally dried at 120 8C. Reproducibility of the prepara-tion was checked by repeating the synthesis procedure for severalbatches. Catalysts were labelled Ce-KIT6-X, where X is the agingtemperature of the silica template (40, 60, 80 or 100 8C).
2.3. Characterization
Powder X-ray diffraction (XRD) was used to identify thecrystalline phases present in the catalysts. A Bruker D8 Advancediffractometer with monochromatic Cu Ka source operated at40 kV and 40 mA was used. The experimental patterns werecalibrated against a silicon standard and the crystalline phaseswere identified by matching the experimental patterns to theJCPDS powder diffraction file.
Raman spectra were obtained using a confocal micro-Ramanspectrometer (Horiba Jobin Yvon HR800 UV). The excitation sourceused was a green laser (532 nm) operated at a power of 40 mW.The laser was focused on powdered samples, placed on amicroscope slide, to produce a spot size of ca. 8 mm of diameter.The detector used was an air refrigerated charge-coupled device(CCD).
Silica templates and catalyst samples were characterised by N2
adsorption at�196 8C, using a Micromeritics ASAP 2020 apparatus.The selected temperature to perform the degasification step was150 8C. From these data, the following textural parameters werecalculated: total pore volumes were calculated using the adsorbedvolume at a relative pressure of 0.97. Multipoint Brunauer–Emmet–Teller (BET) surface area, (SBET) was estimated from therelative pressure range from 0.05 to 0.25. The pore size distributionof the mesoporous materials was analyzed using the Barrett–Joyner–Halenda (BJH) method.
Temperature programmed reduction (TPR) studies wereperformed using a Micromeritics Autochem II instrument with aTCD detector. In all the experiments, 10 vol.% H2 in Ar, at a constantflow rate of 50 mL min�1, was used as reducing gas. A temperaturerange of 30–750 8C and a constant heating rate of 10 8C min�1 wereused. In each experiment, 0.30 g of powdered catalyst wasanalyzed.
TEM/SEM experiments were also conducted. Initial experimentsto check the composition of CeO2 in the silica template wasperformed by energy dispersive X-ray spectroscopy EDX analysisusing a Scanning Electron Microscope (SEM-XL 30). Furthercharacterization of the samples were then performed by transmis-

Fig. 1. (A) Powder low angle XRD patterns of the KIT-6 silica templates; (B) N2
adsorption–desorption isotherms and pore size distributions (inset) calculated
with the desorption branch using the BJH method, for the different KIT-6 silica
templates.
Table 1Structural parameters of 3D cubic mesoporous KIT-6 silica templatesa.
Silica
template
Tprep
(8C)
SBET
(m2 g�1)
VT
(cm3 g�1)
d0
(nm)
a0 (nm) hw
(nm)
KIT6-100 100 684 0.77 5.1 21.4 5.6
KIT6-80 80 734 0.86 4.9 20.8 5.5
KIT6-60 60 578 0.55 4.3 19.5 5.4
KIT6-40 40 481 0.40 3.7 17.8 5.2
a SBET is the specific surface area deduced from the isotherm analysis in the
relative pressure range of 0.05–0.25; VT is the total pore volume at relative
pressures 0.95; d0 is the pore diameter calculated from the desorption branch of the
isotherm using the BJH method; XRD unit-cell parameter a0 is equal to 61/2d2 1 1; the
wall thickness hw = a0/2�d0.
B. Puertolas et al. / Applied Catalysis B: Environmental 93 (2010) 395–405 397
sion electron microscopy (TEM), high resolution TEM (HRTEM),selected area electron diffraction (SAED) and EDX by using a fieldemission gun (FEG) TECNAI G2 F20 microscope operated at 200 kV.To prepare TEM samples, after being finely powdered in an agatemortar, the cerium oxide specimens were treated by sonicating inabsolute ethanol for several minutes, and a few drops of the resultingsuspension were deposited onto a holey-carbon film supported on acopper grid, which was subsequently dried.
2.4. Catalytic performance tests
Catalytic activity tests for naphthalene oxidation were carriedout in a fixed bed laboratory micro-reactor. Blank tests wereconducted by passing naphthalene (450 vppm) through an emptyreactor that was heated from 100 to 350 8C at a rate of 10 8C min�1.Naphthalene oxidation in the empty reactor was negligible up to350 8C, suggesting that any oxidation activity below 350 8C can beattributed to the presence of the catalysts.
Catalysts (0.1–0.2 mm particle size) were tested using a 3/800
o.d. quartz tube as reactor. The reaction feed consisted in all casesof ca. 450 vppm naphthalene in a mixture of 20 vol.% oxygen and80 vol.% helium. A total flow rate of 50 ml min�1 was used and thecatalysts occupied a constant volume, giving a GHSV of ca.75,000 h�1 for all the catalysts. On the most active catalyst furtherexperiments using a GHSV of ca. 20,000 h�1 were also carried out.Analyses were performed by an on-line gas chromatograph withthermal conductivity and flame ionization detectors. The catalyticactivity was measured over the temperature range of 100–350 8C,in incremental steps of 25 8C, and temperatures were controlledby a thermocouple, placed in the catalyst bed. Data were obtainedat each temperature after naphthalene adsorption equilibriumwas accomplished. Four analyses were made at each temperatureand average values were calculated. The reaction temperaturewas increased and the same procedure followed to determineeach data point. Oxidation activity was expressed as yield ofcarbon dioxide [1,26].
3. Results and discussion
3.1. Silica template characterization
Small-angle XRD data for the KIT mesoporous silica calcined atdifferent temperatures are shown in Fig. 1A. The low anglereflections (2 1 1 and 2 2 0) correspond to the three-dimensionalIa3d cubic symmetry of the ordered mesopore system [27]. Thepeaks shift to higher 2u values with decreasing aging temperature,which is consistent with shrinkage of the mesostructure. There isevidence of increasing peak broadening and reduction in peakintensity with decreasing calcination temperature, indicative ofsome reduction in the ordering of the pores. The a0 latticeparameters for the KIT mesostructure extracted from the XRD dataare listed in Table 1. It can be observed that there is a reduction inlattice parameter with decreasing aging temperature. These resultsare consistent with data reported by Rumplecker et al. [28] forsilica KIT-6 templates prepared at different aging temperatures.
Fig. 1B clearly illustrates the influence of the temperature of thehydrothermal treatment on pore size and pore size distribution ofthe mesoporous silica. The adsorption–desorption isotherms foreach mesoporous silica are shown in Fig. 1B. They correspond to atype IV isotherm with a H1 hysteresis loop that reduces in size andshifts progressively to lower partial pressures at lower agingtreatment temperatures, consistent with reduction in the poresize. Additionally, for samples hydrothermally treated at highertemperatures (KIT6-80, KIT6-100), a pronounced capillary con-densation step was observed, which reflects large pore volumes.Pore volumes of the samples strongly depend on the aging
treatment. Such pore size reduction is clearly shown in the inset ofFig. 1B and Table 1 where the mean pore diameter, calculated withthe desorption branch using the BJH method, decreases from5.1 nm for KIT6-100 to 3.7 nm for KIT6-40. These data areconfirmed in Fig. 1B where it is observed that the distributionbecomes narrower with increasing temperature.
Table 1 summarizes the physicochemical parameters of thedifferent KIT-6 silica templates. The values are consistent withprevious data reported for such KIT-6 materials in the literature[28]. The obtained BET surface areas, pore volumes, wallthicknesses, and interconnectivity of the silica are influenced bythe aging temperature. The wall thickness of the material wascalculated using the pore size obtained from N2 sorption data using
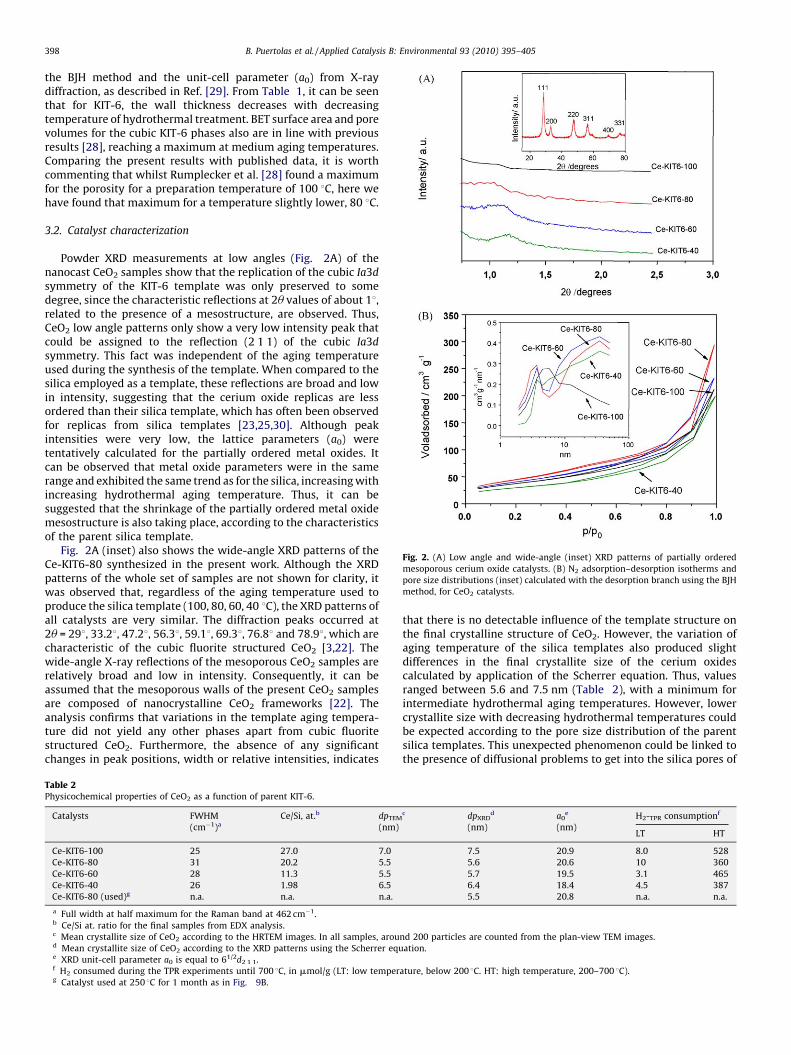
Fig. 2. (A) Low angle and wide-angle (inset) XRD patterns of partially ordered
mesoporous cerium oxide catalysts. (B) N2 adsorption–desorption isotherms and
pore size distributions (inset) calculated with the desorption branch using the BJH
method, for CeO2 catalysts.
B. Puertolas et al. / Applied Catalysis B: Environmental 93 (2010) 395–405398
the BJH method and the unit-cell parameter (a0) from X-raydiffraction, as described in Ref. [29]. From Table 1, it can be seenthat for KIT-6, the wall thickness decreases with decreasingtemperature of hydrothermal treatment. BET surface area and porevolumes for the cubic KIT-6 phases also are in line with previousresults [28], reaching a maximum at medium aging temperatures.Comparing the present results with published data, it is worthcommenting that whilst Rumplecker et al. [28] found a maximumfor the porosity for a preparation temperature of 100 8C, here wehave found that maximum for a temperature slightly lower, 80 8C.
3.2. Catalyst characterization
Powder XRD measurements at low angles (Fig. 2A) of thenanocast CeO2 samples show that the replication of the cubic Ia3d
symmetry of the KIT-6 template was only preserved to somedegree, since the characteristic reflections at 2u values of about 18,related to the presence of a mesostructure, are observed. Thus,CeO2 low angle patterns only show a very low intensity peak thatcould be assigned to the reflection (2 1 1) of the cubic Ia3d
symmetry. This fact was independent of the aging temperatureused during the synthesis of the template. When compared to thesilica employed as a template, these reflections are broad and lowin intensity, suggesting that the cerium oxide replicas are lessordered than their silica template, which has often been observedfor replicas from silica templates [23,25,30]. Although peakintensities were very low, the lattice parameters (a0) weretentatively calculated for the partially ordered metal oxides. Itcan be observed that metal oxide parameters were in the samerange and exhibited the same trend as for the silica, increasing withincreasing hydrothermal aging temperature. Thus, it can besuggested that the shrinkage of the partially ordered metal oxidemesostructure is also taking place, according to the characteristicsof the parent silica template.
Fig. 2A (inset) also shows the wide-angle XRD patterns of theCe-KIT6-80 synthesized in the present work. Although the XRDpatterns of the whole set of samples are not shown for clarity, itwas observed that, regardless of the aging temperature used toproduce the silica template (100, 80, 60, 40 8C), the XRD patterns ofall catalysts are very similar. The diffraction peaks occurred at2u = 298, 33.28, 47.28, 56.38, 59.18, 69.38, 76.88 and 78.98, which arecharacteristic of the cubic fluorite structured CeO2 [3,22]. Thewide-angle X-ray reflections of the mesoporous CeO2 samples arerelatively broad and low in intensity. Consequently, it can beassumed that the mesoporous walls of the present CeO2 samplesare composed of nanocrystalline CeO2 frameworks [22]. Theanalysis confirms that variations in the template aging tempera-ture did not yield any other phases apart from cubic fluoritestructured CeO2. Furthermore, the absence of any significantchanges in peak positions, width or relative intensities, indicates
Table 2Physicochemical properties of CeO2 as a function of parent KIT-6.
Catalysts FWHM
(cm�1)a
Ce/Si, at.b dpTEM
(nm)
Ce-KIT6-100 25 27.0 7.0
Ce-KIT6-80 31 20.2 5.5
Ce-KIT6-60 28 11.3 5.5
Ce-KIT6-40 26 1.98 6.5
Ce-KIT6-80 (used)g n.a. n.a. n.a.
a Full width at half maximum for the Raman band at 462 cm�1.b Ce/Si at. ratio for the final samples from EDX analysis.c Mean crystallite size of CeO2 according to the HRTEM images. In all samples, aroud Mean crystallite size of CeO2 according to the XRD patterns using the Scherrer eque XRD unit-cell parameter a0 is equal to 61/2d2 1 1.f H2 consumed during the TPR experiments until 700 8C, in mmol/g (LT: low temperg Catalyst used at 250 8C for 1 month as in Fig. 9B.
that there is no detectable influence of the template structure onthe final crystalline structure of CeO2. However, the variation ofaging temperature of the silica templates also produced slightdifferences in the final crystallite size of the cerium oxidescalculated by application of the Scherrer equation. Thus, valuesranged between 5.6 and 7.5 nm (Table 2), with a minimum forintermediate hydrothermal aging temperatures. However, lowercrystallite size with decreasing hydrothermal temperatures couldbe expected according to the pore size distribution of the parentsilica templates. This unexpected phenomenon could be linked tothe presence of diffusional problems to get into the silica pores of
c dpXRDd
(nm)
a0e
(nm)
H2-TPR consumptionf
LT HT
7.5 20.9 8.0 528
5.6 20.6 10 360
5.7 19.5 3.1 465
6.4 18.4 4.5 387
5.5 20.8 n.a. n.a.
nd 200 particles are counted from the plan-view TEM images.
ation.
ature, below 200 8C. HT: high temperature, 200–700 8C).

Fig. 3. Raman spectra of mesoporous CeO2 catalysts.
B. Puertolas et al. / Applied Catalysis B: Environmental 93 (2010) 395–405 399
the KIT6-40 during the precursor impregnation, due to its narrowpore size distribution, which could lead to undesired formation ofCeO2 particles on the exterior surfaces of the silica template as hasbeen observed by TEM.
The N2 physisorption isotherm of the mesoporous CeO2
samples (Fig. 2B) exhibits an marginal increase in slope at arelative pressure of ca. 0.5, followed by a linear increase up to 0.8–0.9 in both the adsorption and the desorption branches. Theincrease in slope at ca. 0.5 corresponds to capillary condensation,typical of mesoporous materials with uniform pore systems, whilethe further increase at higher relative pressures indicatessubstantial interparticle porosity. The capillary condensation stepis not very pronounced; the isotherm shape is an intermediatebetween type II and type IV. Except in the case of Ce-KIT6-100, thepresence of both regular mesopores and interparticle voids isconfirmed by the occurrence of a rather broad BJH pore diameterdistribution [31] in the larger mesopore size region around ca.35 nm (Fig. 2A, inset), accompanied by a sharp peak in the porediameter distribution at ca. 4 nm, which confirms that the materialcontains uniform pores, as expected for a replica of orderedmesoporous silica [31]. In addition, it can be observed in Fig. 2B(inset) that the amount of these pores increases with the agingtemperature of the template up to 80 8C. It is worth commentingthat a different pore size distribution is obtained for Ce-KIT6-100.In this case, although a broad pore size distribution is alsoobserved; it seems that the amount of interparticle voids is lowerso that the interconnectivity between the particle networks ofordered pores seems to be improved. In addition, the pore sizedistribution is shifted to higher values. According to [27,32], thepresence of a wider pore size distribution centred at ca. 7 nmtogether with the lower intensity of the (2 1 1) reflection in thesmall-angle XRD pattern seem to indicate that microporousbridges linking the two sets of pores in KIT-6 are broken, resultingin the filling of one or other set of pores, but not bothsimultaneously.
The specific surface areas of mesoporous CeO2 are estimatedfrom the BET method and are shown in Table 3. All the mesoporousmetal oxides exhibited large BET surface areas and pore volumes,which are the desired characteristics for many surface catalyticreactions. The surface areas ranged between 102 and 163 m2 g�1.These values are higher than those reported for other authorsduring the replication of CeO2 from KIT-6 [23,25] and in the samerange than other mesoporous CeO2 obtained by nanocasting ofother templates [22,31,33], i.e. MCM-48, SBA-15. Catalysts withmedium aging temperature (80 and 60 8C) presented highersurface areas, 163 and 145 m2 g�1, respectively, than those aged at40 and 100 8C. In the case of the sample with the precursor aged at40 8C the lower surface area should be attributed to the presence ofamorphous silica remaining in the catalyst (confirmed by Ramananalysis and EDX analysis), thus blocking pores and most likely
Table 3Structural and catalytic properties of CeO2 as a function of parent KIT-6a.
Catalysts SBET
(m2 g�1)
VT
(cm3 g�1)
d0
(nm)
Areal formation
rateb (�104)
Ce-KIT6-100 132 0.31 8.0 6.5
Ce-KIT6-80 163 0.41 8.5 10.2
Ce-KIT6-60 145 0.34 8.9 5.0
Ce-KIT6-40 102 0.28 9.4 3.6
Ce-KIT6-80 (used)c 148 0.39 8.0 –
a SBET is the specific surface area deduced from the isotherm analysis in the
relative pressure range of 0.05–0.25; VT is the total pore volume at relative
pressures 0.95; d0 is the pore diameter calculated from the desorption branch of the
isotherm using the BJH method.b Formation rate of CO2 normalized per surface area calculated at 225 8C in
gCO2=ðm2 hÞ.
c Catalyst used at 250 8C for 1 month as in Fig. 9B.
preventing the final formation of ordered mesoporous ceriastructures. In the case of the sample aged at 100 8C the amountof silica was negligible. However, the use of KIT6-100 template ledto a structure with a lower surface area, which could be linked tothe presence of mesopores with larger sizes, as shown above.
Raman spectra of the CeO2 catalysts (Fig. 3) showed similarspectra for all catalysts synthesized, presenting a single bandcentred at a frequency of 462 cm�1, which is characteristic of CeO2
vibrations. Another less intense Raman band can be observed at478 cm�1 in Ce-KIT6-40, which most likely corresponds toamorphous silica from the remaining silica template used in thesynthesis [34], since EDX analysis confirms the highest silicaquantity in this catalyst.
Table 2 shows the full width at half maximum (FWHM) of themain Raman band, at 462 cm�1. Some authors [35] have associatedthe increase of FWHM with a decrease of the crystallite size and/ora higher amount of oxygen vacancies of the CeO2. According toTable 2, although small differences in the amount of oxygenvacancies cannot be discounted, a clear relationship can beestablished between the mean crystallite size and the FWHM.However, when comparing the FWHM/crystallite size ratios, thevalues calculated are not constant, it is highest for Ce-KIT6-80,followed by Ce-KIT6-60, Ce-KIT6-40 and Ce-KIT6-100. It couldindicate slight differences in defect density that could also lead todifferent catalytic behaviour.
Temperature programmed reduction (TPR) measurementswere carried out to investigate the redox properties of thesynthesized catalysts. TPR assays for the ceria catalysts (Fig. 4)studied in this work mainly show a wide reduction band from 300to 700 8C (HT peak) with two maxima centered at ca. 400 and550 8C, respectively. A small low temperature reduction peak (LTpeak) centered at 100–150 8C can also be observed. The lowreduction band is related to highly reducible surface ceria species,whereas high temperature reduction peaks can be attributed tosurface reduction of capping oxygen [36,37]. Although similar TPRprofiles were observed for all the catalysts, Ce-KIT6-100 seems topresent the HT reduction bands at the lowest temperatures.Regarding the LT peaks in Ce-KIT6-80 and Ce-KIT6-100 are presentat the lowest temperatures and the H2 consumption are also thehighest (Table 2). It must be noted that the reduction of the bulk of

Fig. 4. TPR profiles of partially ordered mesoporous CeO2 catalysts in 10 vol.% H2 in Ar.
B. Puertolas et al. / Applied Catalysis B: Environmental 93 (2010) 395–405400
CeO2 does not take place in the interval of temperature studied,since it only occurs above 750 8C [36,38]. Regarding to the differentreduction temperature observed for these catalysts, not manyconclusions can be drawn. It has been reported in TPR experimentson CeO2 that a decrease in particle size results in a shift of thereduction peak maximum to lower temperatures [39]. Howeverwe cannot observe a clear relationship in our catalysts. Thereforeother factors such as the different interaction between CeO2 andthe remaining silica present, different surface area . . . could alsohave an influence on the reduction temperature.
Fig. 5 presents the EDX spectra from cerium oxide with KIT-6templates at 40 and 100 8C. For both catalysts the elements cerium,oxygen and silicon were detected, although the silica content wasmuch higher in the sample treated at 40 8C. EDX analysisconfirmed that the silicon content decreased significantly as a
Fig. 5. EDX spectra of partially ordered mesoporous cerium oxide templated by KIT-
6. (a) At 100 8C (Ce-KIT6-100) and (b) at 40 8C (Ce-KIT6-40).
function of synthesis temperature. Thus, the use of a silicatemplate prepared at 40 8C (Ce-KIT6-40) leads to a cerium metaloxide with an extremely high silica content (Si/Ce = 0.51, at. ratio)that indicates that the removal of the hard template when thesample was prepared using this low temperature is not satisfac-tory. In contrast, the other samples present very low silica content.For example, Ce-KIT6-100, shown in Fig. 4, consists of more than98.5% CeO2; with a very low Si content (Si/Ce = 0.037, at. ratio).Similar conclusions were observed for samples treated at 60 and80 8C. It has been previously reported [40] that low agingtemperatures during the preparation of KIT-6 may result in amarginal degree of interconnecting porosity, thick walls and smallmesopore diameters. Accordingly, Table 1 shows the specificsurface area, the mesopore volume and the mean mesopore size ofthe silica templates. Lower aging temperatures during the silicatemplate preparation lead to a smaller mean mesopore size and alower degree of mesoporosity. Thus, the precursor loading insidethe silica pores of the KIT6-40 could be hindered due to poreblocking, which could lead to undesired formation of CeO2
particles on the surface of the silica template. Therefore, it canbe assumed that the presence of these particles covering theexternal surface of the silica template could explain the low silicaremoval efficiency during the NaOH etching. This assumption alsoagrees with the TEM data, where several zones with unorderedCeO2 nanoparticles were detected in the case of the catalystprepared from the silica template aged at 40 8C. In addition, XRDdata also showed the presence of higher crystallite size domains.
Transmission electron microscopy investigation provides directobservation of the morphology and the distribution of ceriumoxide particles. In fact, TEM analysis confirms the orderedmesostructural properties of the replica CeO2. Fig. 6 shows somerepresentative images of the distinct CeO2 templated by KIT-6.From these images, it can be seen that the products partiallyconsist of a large domain of CeO2 having a well ordered frameworkand uniform nanoparticles with size ranging from 4 to 8 nm (Table2 reports the measured crystallite size by TEM). These values are ingood agreement with those obtained from the XRD data. In mostparts of the samples, the periodicity extends over a large region,typically more than 50 repeated distances in the case of 60, 80 and100 8C. A bigger, and an unordered, agglomerated zone of CeO2
between 50 and 100 nm was observed in the case of replica CeO2
templated by KIT-6 at 40 8C. CeO2 particles (dark areas) of sphericalshape were observed as shown in Fig. 6. In all samples (KIT-6: 40,60, 80 and 100 8C) the nanospheres are in a hexagonal close packed(hcp) crystalline system. The pore size is lower than those of theCeO2 particles and therefore it is not straightforward to give anaccurate size with TEM analysis.
The corresponding selected area electron diffraction (SAED)patterns show seven diffuse diffraction rings. According to JCPDS:34-394 all the diffraction rings could be indexed by a face-centeredcubic phase of CeO2, space group Fm3m, and are in good agreementwith the XRD measurements (see inset in Fig. 6 for the diffractionrings assignment). The most interesting finding from XRD andelectron diffraction analyses is that no characteristic peaks andrings of impurities or other phases are present, indicating the highphase purity of the products after the annealing treatment toremove the KIT-6 silica template.
TEM images with higher magnification of the porous CeO2
crystals templated by KIT-6 at 60 8C (Fig. 7A) indicated that theporous crystals were both made of nanospheres connected bynanobridges. As indicated by arrows in Fig. 7A bridges could beobserved at the edge of the particles; the bridge size is about 2 nm.Further structural characterization of the products was carried outusing HRTEM. Fig. 7B shows a HRTEM image indicating clearlattice spacings, demonstrating that the nanospheres are highlycrystalline with an interplanar spacing of 3.15 A, corresponding to

Fig. 6. Typical low magnification TEM images of partially ordered mesoporous CeO2 templated by KIT-6. (a) Ce-KIT6-40, (b) Ce-KIT6-60, (c) Ce-KIT6-80, (d) Ce-KIT6-100. The
inset figure in (a) is the corresponding SAED patterns.
B. Puertolas et al. / Applied Catalysis B: Environmental 93 (2010) 395–405 401
the (1 1 1) lattice spacing of CeO2, another lattice spacing of 2.75 Abetween adjacent lattice planes corresponds to the (2 0 0) planes ofCeO2. The crystal orientation of CeO2 has no relationship with thetemperature of treatment.
It can be concluded from TEM and HRTEM analyses that thematerials obtained are partially (mainly) ordered mesoporousmetal oxides. In addition, these cerium oxides replicate to a highextent (although it depends on the sample) the siliceous template,since the presence of framework-confined pores has been detectedfor all the synthesized catalysts.
Thus, different silica templates were produced in this workvarying the aging time during the synthesis procedure to modify
Fig. 7. High magnification (A) and high resolution TEM images (B) of KIT6-60, respectiv
spacings of the marked fringes are 3.15 and 2.75 A corresponding to the (1 1 1) and (2
the pore size of ordered mesoporous CeO2. However, it has beenshown that, regardless of the parent silica template, partiallyordered metal oxides with interparticulate porosity have beenobtained. Although, it is not straightforward to estimate the degreeof ordered material, pore size distributions indicate that increasingtemperatures during the hydrothermal treatment of the parentsilica up to 80 8C, leads to a higher amount of ‘‘ordered’’ pores(Fig. 2A). At higher hydrothermal aging temperature, the size ofthese pores seems to shift to higher values most likely due to thepresence of new ‘‘unordered’’ mesopores rising from the absence ofcrystalinity in the pore walls. Thus, a less ordered material isobtained, according to XRD data. In addition, hydrothermal
ely. The arrows in (a) point to the nanobridge connecting two nanospheres. The d-
0 0) planes, respectively.

B. Puertolas et al. / Applied Catalysis B: Environmental 93 (2010) 395–405402
temperatures of 100 8C seem to favour the connectivity betweenthe different mesoporous CeO2 networks, since lower interparti-culate porosity has been observed.
Therefore, although it has been published previously [28] that itis possible to produce tailored highly ordered mesoporous Co3O4
networks with different pore size and wall thickness, retaining thesymmetry of the silica parent using silica KIT-6 hydrothermallytreated at different temperatures; this paper shows that CeO2
materials behave in a different way and only partial orderedmesoporous materials with similar pore size distribution havebeen obtained, except in the case of Ce-KIT6-100. However, it isworth commenting that erroneous conclusions may be reached,when only the value of the mean pore size calculated using the BJHmethod, is taken into account, since experimental data show thatthe higher the hydrothermal temperature, the lower the mean poresize, as was expected.
3.3. Catalytic performance for naphthalene oxidation
In order to be certain of the heterogeneous character of theactivity of ceria catalysts a blank run was conducted in the absenceof catalyst. No catalytic activity at temperatures of 325 8C andbelow was observed. At 350 8C a low conversion of ca. 1% wasobtained.
The main reaction product observed for naphthalene oxidationwas CO2, but it was not the only product. Other compounds such asnaphthenol, dimethyl phthalate and benzaldehyde were alsodetected. These compounds were trapped in a dichloromethanecold trap at the exit of the reaction system and then analyzed byGC–MS. Reaction temperature was fixed at 225 8C for 1 h. In allcases, the concentration of these by-products was low. On theother hand it is noteworthy that CO was not detected in anyexperiment.
Fig. 8 shows the variation of the catalytic activity (expressed asconversion to CO2) for naphthalene total oxidation, as a function ofthe reaction temperature for the CeO2 catalysts prepared by thenanocasting method. For comparative purposes, the activity of theKIT-6 silica employed as the template is also included. Excellentcatalytic performance has been observed for the Ce-KIT6-80 andCe-KIT6-100 catalysts, whilst Ce-KIT6-40 and Ce-KIT6-60 catalystswere not able to reach full naphthalene conversion over thetemperature range studied. Table 3 also shows the catalyticactivity normalized for the surface area at 225 8C, a reaction
Fig. 8. Variation of the catalytic activity for naphthalene oxidation (expressed as
yield to CO2) as a function of reaction temperature over nanocast CeO2 catalysts.
Reaction conditions in text. Symbols: Ce-KIT6-40 (&), Ce-KIT6-60 (*), Ce-KIT6-80
(~), Ce-KIT6-100 (!) and KIT6-80 (D).
temperature which gives CO2 yields lower than 30%. As can be seenin Table 3 the Ce-KIT6-80 catalyst presents the highest areal rateshowing that not only the surface area exerts an influence on thecatalytic activity.
As expected, the silica KIT-6 template did not show appreciableconversion. Therefore, for the nanocast CeO2 catalysts the oneprepared from the silica template aged at 80 8C (Ce-KIT6-80)presented the highest activity and the activities of the catalystsynthesized in the present work decrease in the order:
Ce-KIT6-80>Ce-KIT6-100> >Ce-KIT6-60> >Ce-KIT6-40
> > >KIT6
The Ce-KIT6-80 catalyst gave a yield of CO2 over 80% at 260 8C andover 95% at 275 8C. These results are in accordance with the catalystcharacteristics, and previously reported results for CeO2 basedcatalysts [13], since Ce-KIT6-80 showed the lowest crystallite size,the highest surface area and the highest Raman FWHM/crystallitesize ratio, together with a low remaining content of Si (Tables 2 and3), and suitable redox properties. Ce-KIT6-100 showed loweractivity than Ce-KIT6-80 (100–250 8C) although full conversionwas reached at similar temperatures. Ce-KIT6-40 showed the lowestactivity and this is likely to be associated with the persistentpresence of silica used in the synthesis (as corroborated by Ramanand EDX analysis), the lowest surface area and the high crystallitesize. Finally, according to its physicochemical characteristics and theamount of remaining silica, an intermediate activity is found in thecase of the Ce-KIT6-60 catalyst.
Although Ce-KIT6-80 was the most active catalyst, anotheroutstanding feature is the high activity of the Ce-KIT6-100 catalyst,taking into account its lower specific surface area. As it is shownabove, a hydrothermal aging temperature of 100 8C during thesynthesis of the silica template seems to lead (i) to the formation oflarger pores in the replica CeO2 structure; and (ii) a decrease in theinterconnectivity degree between the networks. Although nostraightforward explanation for the activity of the Ce-KIT6-100sample is evident, two scenarios can be tentatively proposed. In thefirst scenario, the pore size distribution of the CeO2 nanocastmaterials may have an influence on the activity during thenaphthalene total oxidation, and therefore, wider pore sizedistributions could be favouring the total oxidation of naphtha-lene. Against this assumption, it can be argued that all the catalystspresent a pore size distribution much greater than the molecularsize of naphthalene (0.7 nm), and consequently no, or possibly onlysome minor, diffusional limitations towards the active sites wouldbe expected. In the second scenario, it can be assumed that theincreased interconnectivity is responsible for the unexpectedactivity of the Ce-KIT6-100 sample, since larger networks arepresented. Unfortunately, the formation of larger networks wasnot linked to the presence of a more ordered structure for the Ce-KIT6-100 sample, which may lead to larger specific surface areathan the Ce-KIT6-80 catalyst and, therefore, higher activity. Newpreparation methods are now being studied in order to obtainhighly ordered materials with narrow pore size distributions thatcould demonstrate the validity of this assumption.
Another parameter that can have an influence on the catalyticactivity is the reducibility of the catalysts. According to the TPRresults reduction features at low temperature (LT features) andhigh temperature (HT features) have been observed for all thecatalysts. Since the oxidation of naphthalene takes place mainlybefore 300 8C we consider that the low temperature reduciblespecies can influence the catalytic activity more than the hightemperature reducible species. In fact the two most active catalysts(Ce-KIT6-80 and Ce-KIT6-100) present the low temperaturereduction bands with higher intensity and at lower temperaturesthan the other two catalysts (Ce-KIT6-40 and Ce-KIT6-60).

Fig. 9. Catalytic stability of Ce-KIT6-80 during naphthalene total oxidation. (A)
Evolution of the activity in the Np oxidation (expressed as yield to CO2) with the
reaction temperature during three cycles. Symbols: cycle 1 (!), cycle 2 (~), cycle 3
(*). (B) Evolution of the activity (expressed as yield to CO2) with the time on line at
a reaction temperature of 225 8C (o) and 250 8C (&). Reaction conditions in text. (C)
Evolution of the activity (expressed as yield to CO2) with the time on line at different
reaction temperatures. Reaction conditions in text.
Fig. 10. Characterization data of fresh and used Ce-KIT6-80 catalysts. (A) Low angle
and wide-angle (inset) XRD patterns; (B) N2 adsorption–desorption isotherms and
pore size distributions (inset) calculated with the desorption branch using the BJH
method.
B. Puertolas et al. / Applied Catalysis B: Environmental 93 (2010) 395–405 403
The catalytic stability of the best catalyst (Ce-KIT6-80) wasevaluated for naphthalene oxidation over the temperature range100–350 8C in three consecutive cycles (Fig. 9A). The catalyticactivity remained unchanged after three cycles and maintained itshigh naphthalene oxidation activity to CO2. Long-term use of thiscatalyst (in order to determine the total catalyst lifetime) hasdemonstrated that the catalyst is stable for a prolonged period oftime of, at least, 1 month (Fig. 9B). Finally, a third stability test tocheck the behaviour at high temperature was conducted (Fig. 9C).Due to the high reactivity of ceria, our experimental setup does notpermit us to work at space velocities high enough to give yields
lower than 100% at a reaction temperature as high as 400 or 500 8C.Therefore in order to probe potential deactivation, catalyticactivity was measured at 225 8C. After 4 h on line at 225 8C (stableyield to CO2 of ca. 27%) the temperature was increased to 400 8Cand monitored for 4 h. After the 4 h period the temperature wasreduced to 225 8C, and the catalytic activity determined. After 4more hours the temperature was increased to 500 8C and finallydecreased to 225 8C. The yield to CO2 observed was ca. 29%. Usingthis procedure, it was confirmed that no deactivation takes placeeven after operating at 500 8C.
Tables 2 and 3 and Fig. 10 show the characterization resultsfor the Ce-KIT6-80 catalyst used at 250 8C for 1 month as inFig. 9B. It can be clearly observed that although there was nocollapse of the structure, the mesoporous structure of thecatalyst changed after reaction. Small-angle XRD data showsthat the low angle reflection (2 1 1) shifted to higher 2u valuesafter use, consistent with shrinkage of the mesostructure.Accordingly an increase of the a0 lattice parameter was alsoobserved after use (Table 2). In addition, Fig. 10A (inset) alsoshows the wide-angle XRD patterns of the fresh and used Ce-KIT6-80 samples. Although lower intensities were recorded forused catalysts, a similar crystallite size was obtained by theScherrer equation. Therefore, the shrinkage of the mesoporousstructure could be linked to the growth of the crystalline porewall during the reaction. According to this, a narrower pore sizedistribution can be detected for the ordered network in the caseof used Ce-KIT6-80 sample (Fig. 10A), with a sharp peak in thepore diameter distribution, corresponding to the ordered pores,
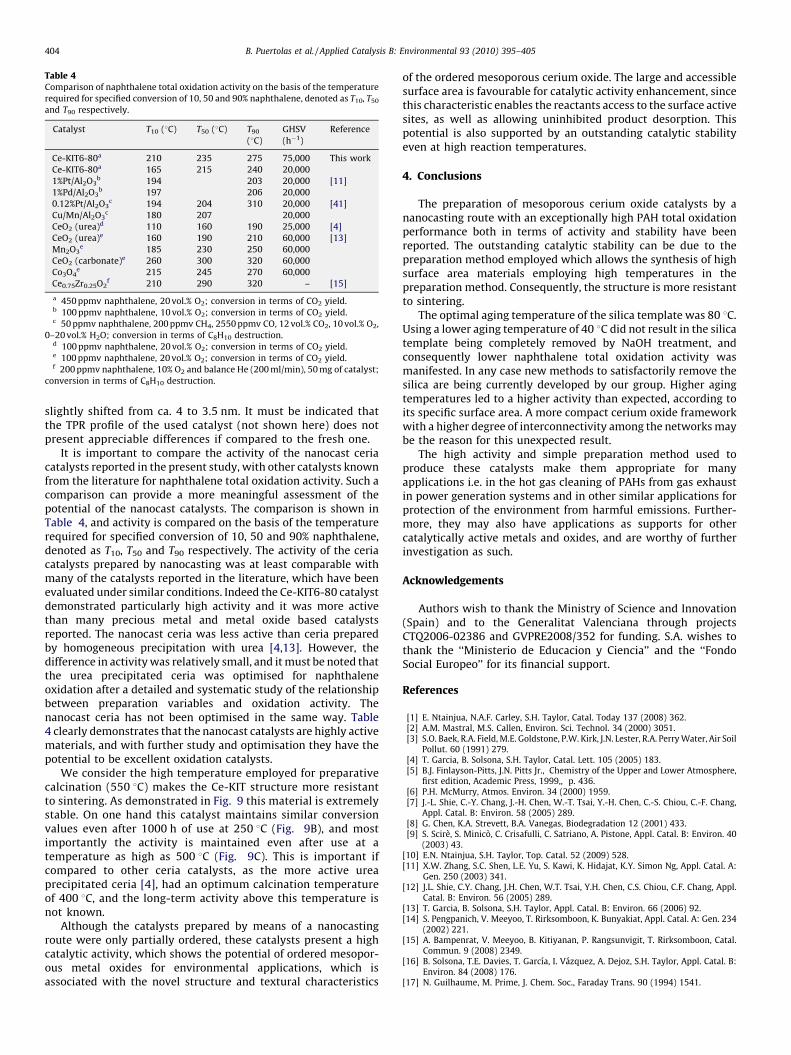
Table 4Comparison of naphthalene total oxidation activity on the basis of the temperature
required for specified conversion of 10, 50 and 90% naphthalene, denoted as T10, T50
and T90 respectively.
Catalyst T10 (8C) T50 (8C) T90
(8C)
GHSV
(h�1)
Reference
Ce-KIT6-80a 210 235 275 75,000 This work
Ce-KIT6-80a 165 215 240 20,000
1%Pt/Al2O3b 194 203 20,000 [11]
1%Pd/Al2O3b 197 206 20,000
0.12%Pt/Al2O3c 194 204 310 20,000 [41]
Cu/Mn/Al2O3c 180 207 20,000
CeO2 (urea)d 110 160 190 25,000 [4]
CeO2 (urea)e 160 190 210 60,000 [13]
Mn2O3e 185 230 250 60,000
CeO2 (carbonate)e 260 300 320 60,000
Co3O4e 215 245 270 60,000
Ce0.75Zr0.25O2f 210 290 320 – [15]
a 450 ppmv naphthalene, 20 vol.% O2; conversion in terms of CO2 yield.b 100 ppmv naphthalene, 10 vol.% O2; conversion in terms of CO2 yield.c 50 ppmv naphthalene, 200 ppmv CH4, 2550 ppmv CO, 12 vol.% CO2, 10 vol.% O2,
0–20 vol.% H2O; conversion in terms of C8H10 destruction.d 100 ppmv naphthalene, 20 vol.% O2; conversion in terms of CO2 yield.e 100 ppmv naphthalene, 20 vol.% O2; conversion in terms of CO2 yield.f 200 ppmv naphthalene, 10% O2 and balance He (200 ml/min), 50 mg of catalyst;
conversion in terms of C8H10 destruction.
B. Puertolas et al. / Applied Catalysis B: Environmental 93 (2010) 395–405404
slightly shifted from ca. 4 to 3.5 nm. It must be indicated thatthe TPR profile of the used catalyst (not shown here) does notpresent appreciable differences if compared to the fresh one.
It is important to compare the activity of the nanocast ceriacatalysts reported in the present study, with other catalysts knownfrom the literature for naphthalene total oxidation activity. Such acomparison can provide a more meaningful assessment of thepotential of the nanocast catalysts. The comparison is shown inTable 4, and activity is compared on the basis of the temperaturerequired for specified conversion of 10, 50 and 90% naphthalene,denoted as T10, T50 and T90 respectively. The activity of the ceriacatalysts prepared by nanocasting was at least comparable withmany of the catalysts reported in the literature, which have beenevaluated under similar conditions. Indeed the Ce-KIT6-80 catalystdemonstrated particularly high activity and it was more activethan many precious metal and metal oxide based catalystsreported. The nanocast ceria was less active than ceria preparedby homogeneous precipitation with urea [4,13]. However, thedifference in activity was relatively small, and it must be noted thatthe urea precipitated ceria was optimised for naphthaleneoxidation after a detailed and systematic study of the relationshipbetween preparation variables and oxidation activity. Thenanocast ceria has not been optimised in the same way. Table4 clearly demonstrates that the nanocast catalysts are highly activematerials, and with further study and optimisation they have thepotential to be excellent oxidation catalysts.
We consider the high temperature employed for preparativecalcination (550 8C) makes the Ce-KIT structure more resistantto sintering. As demonstrated in Fig. 9 this material is extremelystable. On one hand this catalyst maintains similar conversionvalues even after 1000 h of use at 250 8C (Fig. 9B), and mostimportantly the activity is maintained even after use at atemperature as high as 500 8C (Fig. 9C). This is important ifcompared to other ceria catalysts, as the more active ureaprecipitated ceria [4], had an optimum calcination temperatureof 400 8C, and the long-term activity above this temperature isnot known.
Although the catalysts prepared by means of a nanocastingroute were only partially ordered, these catalysts present a highcatalytic activity, which shows the potential of ordered mesopor-ous metal oxides for environmental applications, which isassociated with the novel structure and textural characteristics
of the ordered mesoporous cerium oxide. The large and accessiblesurface area is favourable for catalytic activity enhancement, sincethis characteristic enables the reactants access to the surface activesites, as well as allowing uninhibited product desorption. Thispotential is also supported by an outstanding catalytic stabilityeven at high reaction temperatures.
4. Conclusions
The preparation of mesoporous cerium oxide catalysts by ananocasting route with an exceptionally high PAH total oxidationperformance both in terms of activity and stability have beenreported. The outstanding catalytic stability can be due to thepreparation method employed which allows the synthesis of highsurface area materials employing high temperatures in thepreparation method. Consequently, the structure is more resistantto sintering.
The optimal aging temperature of the silica template was 80 8C.Using a lower aging temperature of 40 8C did not result in the silicatemplate being completely removed by NaOH treatment, andconsequently lower naphthalene total oxidation activity wasmanifested. In any case new methods to satisfactorily remove thesilica are being currently developed by our group. Higher agingtemperatures led to a higher activity than expected, according toits specific surface area. A more compact cerium oxide frameworkwith a higher degree of interconnectivity among the networks maybe the reason for this unexpected result.
The high activity and simple preparation method used toproduce these catalysts make them appropriate for manyapplications i.e. in the hot gas cleaning of PAHs from gas exhaustin power generation systems and in other similar applications forprotection of the environment from harmful emissions. Further-more, they may also have applications as supports for othercatalytically active metals and oxides, and are worthy of furtherinvestigation as such.
Acknowledgements
Authors wish to thank the Ministry of Science and Innovation(Spain) and to the Generalitat Valenciana through projectsCTQ2006-02386 and GVPRE2008/352 for funding. S.A. wishes tothank the ‘‘Ministerio de Educacion y Ciencia’’ and the ‘‘FondoSocial Europeo’’ for its financial support.
References
[1] E. Ntainjua, N.A.F. Carley, S.H. Taylor, Catal. Today 137 (2008) 362.[2] A.M. Mastral, M.S. Callen, Environ. Sci. Technol. 34 (2000) 3051.[3] S.O. Baek, R.A. Field, M.E. Goldstone, P.W. Kirk, J.N. Lester, R.A. Perry Water, Air Soil
Pollut. 60 (1991) 279.[4] T. Garcia, B. Solsona, S.H. Taylor, Catal. Lett. 105 (2005) 183.[5] B.J. Finlayson-Pitts, J.N. Pitts Jr., Chemistry of the Upper and Lower Atmosphere,
first edition, Academic Press, 1999,, p. 436.[6] P.H. McMurry, Atmos. Environ. 34 (2000) 1959.[7] J.-L. Shie, C.-Y. Chang, J.-H. Chen, W.-T. Tsai, Y.-H. Chen, C.-S. Chiou, C.-F. Chang,
Appl. Catal. B: Environ. 58 (2005) 289.[8] G. Chen, K.A. Strevett, B.A. Vanegas, Biodegradation 12 (2001) 433.[9] S. Scire, S. Minico, C. Crisafulli, C. Satriano, A. Pistone, Appl. Catal. B: Environ. 40
(2003) 43.[10] E.N. Ntainjua, S.H. Taylor, Top. Catal. 52 (2009) 528.[11] X.W. Zhang, S.C. Shen, L.E. Yu, S. Kawi, K. Hidajat, K.Y. Simon Ng, Appl. Catal. A:
Gen. 250 (2003) 341.[12] J.L. Shie, C.Y. Chang, J.H. Chen, W.T. Tsai, Y.H. Chen, C.S. Chiou, C.F. Chang, Appl.
Catal. B: Environ. 56 (2005) 289.[13] T. Garcia, B. Solsona, S.H. Taylor, Appl. Catal. B: Environ. 66 (2006) 92.[14] S. Pengpanich, V. Meeyoo, T. Rirksomboon, K. Bunyakiat, Appl. Catal. A: Gen. 234
(2002) 221.[15] A. Bampenrat, V. Meeyoo, B. Kitiyanan, P. Rangsunvigit, T. Rirksomboon, Catal.
Commun. 9 (2008) 2349.[16] B. Solsona, T.E. Davies, T. Garcıa, I. Vazquez, A. Dejoz, S.H. Taylor, Appl. Catal. B:
Environ. 84 (2008) 176.[17] N. Guilhaume, M. Prime, J. Chem. Soc., Faraday Trans. 90 (1994) 1541.

B. Puertolas et al. / Applied Catalysis B: Environmental 93 (2010) 395–405 405
[18] G. Frenzer, W.F. Maier, Annu. Rev. Mater. Res. 36 (2006) 281.[19] G.J.D. Soler-illia, C. Sanchez, B. Lebeau, Joel Patarin, Chem. Rev. 102 (2002) 4093.[20] T. Valdes-Solıs, A.B. Fuertes, Mater. Res. Bull. 41 (2006) 2187.[21] M. Tiemann, Chem. Mater. 20 (2008) 961.[22] S.C. Laha, R. Ryoo, Chem. Commun. (2003) 2138.[23] W.H. Shen, X.P. Dong, Y.F. Zhu, H.R. Chen, J.L. Shi, Micropor. Mesopor. Mater. 85
(2005) 157.[24] B. Tian, X. Liu, H. Yang, S. Xie, C. Yu, B. Tu, D. Zhao, Adv. Mater. 15 (2003)
1370.[25] E. Rossinyol, J. Arbiol, F. Peiro, A. Cornet, J.R. Morante, B. Tian, T. Bob, D. Zhao,
Sensors Actuat. B 109 (2005) 57.[26] F. Jiao, K.M. Shaju, P.G. Bruce, Angewandte Chemie – Int. Ed. 44 (1995) 6550.[27] Y. Ren, F. Jiao, P.G. Bruce, Micropor. Mesopor. Mater. 121 (2009) 90.[28] A. Rumplecker, F. Kleitz, E.L. Salabas, F. Slhuth, Chem. Mater. 19 (2007) 485.[29] L.A. Solovyov, V.I. Zaikovskii, A.N. Shmakov, O.V. Belousov, R. Ryoo, J. Phys. Chem.
B 106 (2002) 12198.[30] J. Zhu, Q. Gao, Z. Chen, Appl. Catal. B: Environ. 81 (2008) 236.
[31] J. Roggenbuck, H. Schafer, T. Tsoncheva, C. Michev, J. Hass, M. Tiemann, Micropor.Mesopor. Mater. 101 (2007) 335.
[32] F. Jiao, A.H. Hill, A. Harrison, A. Berko, A.V. Chadwick, P.C. Bruce, J. Am. Chem. Soc.130 (2008) 5262.
[33] P. Ji, J. Zhang, F. Chen, M. Anpo, J. Phys. Chem. C 112 (2008) 17809.[34] V.N. Denisov, B.N. Mavrin, M. Koosh, I. Pochik, J. Appl. Spectrosc. 55 (1991) 1573–
8647.[35] E. Ntainjua, N.T. Garcia, B. Solsona, S.H. Taylor, Appl. Catal. B: Environ. 76 (2007)
248–256.[36] D. Andreeva, R. Nedyalkova, L. Ilieva, M.V. Abrashev, Appl. Catal. B: Environ. 52
(2004) 157.[37] H.C. Yao, Y. Yu, J. Catal. 86 (1984) 254.[38] M.F.L. Johnson, J. Mooi, J. Catal. 103 (1987) 502.[39] A. Jones, B.D. McNicol, Temperature Programmed Reduction for Solid Materials
Characterisation, Marcel Dekker, New York, 1986, p. 51.[40] T.W. Kim, F. Kleitz, B. Paul, R. Ryoo, J. Am. Chem. Soc. 127 (2005) 7601.[41] J. Carno, M. Berg, S. Jaras, Fuel 75 (1996) 959.
Copyright © 2022 FDOKUMEN