Scintillation and Luminescence Properties of Undoped and Cerium-doped LiGdCl4 and NaGdCl4
12
pss applications and materials science a status solidi www.pss-a.com physica REPRINT Scintillation and luminescence properties of Ce 3+ doped ternary cesium rare-earth halides M. D. Birowosuto 1 , P. Dorenbos 1 , C. W. E. van Eijk 1 , K. W. Krämer 2 , and H. U. Güdel 2 1 Radiation Detection and Matter, Faculty of Applied Sciences, Delft University of Technology, Mekelweg 15, 2629 JB, Delft, The Netherlands 2 Department of Chemistry and Biochemistry, University of Bern, Freiestrasse 3, 3000 Bern 9, Switzerland Received 18 September 2006, revised 3 November 2006, accepted 14 November 2006 Published online 16 January 2007 PACS 29.30.Kv, 29.40.Mc, 78.47.+ p, 78.55.Hx The scintillation properties of Ce 3+ doped ternary cesium rare-earth halides are reported. We investigated Cs 3 Lu 2 I 9 :Ce 3+ , Cs 3 Gd 2 I 9 :Ce 3+ , Cs 3 LaBr 6 :Ce 3+ and Cs 3 LuI 6 :Ce 3+ . Cs 3 Lu 2 I 9 :Ce 3+ and Cs 3 LaBr 6 :Ce 3+ exhibit the highest light yields under γ-ray excitation of 22800 ± 2300 and 10400 ± 1000 photons per MeV of ab- sorbed γ-ray energy, respectively. Optical spectroscopy and scintillation decay time curves of these com- pounds are presented. phys. stat. sol. (a) 204, No. 3, 850 – 860 (2007) / DOI 10.1002/pssa.200622459
Transcript of Scintillation and Luminescence Properties of Undoped and Cerium-doped LiGdCl4 and NaGdCl4
p s sapplications and materials science
a
statu
s
soli
di
www.pss-a.comph
ysi
ca
REPRINT
Scintillation and luminescence properties
of Ce3+
doped ternary cesium rare-earth halides
M. D. Birowosuto1
, P. Dorenbos1
, C. W. E. van Eijk1
, K. W. Krämer2
, and H. U. Güdel2
1
Radiation Detection and Matter, Faculty of Applied Sciences, Delft University of Technology,
Mekelweg 15, 2629 JB, Delft, The Netherlands
2
Department of Chemistry and Biochemistry, University of Bern, Freiestrasse 3, 3000 Bern 9,
Switzerland
Received 18 September 2006, revised 3 November 2006, accepted 14 November 2006
Published online 16 January 2007
PACS 29.30.Kv, 29.40.Mc, 78.47.+p, 78.55.Hx
The scintillation properties of Ce3+
doped ternary cesium rare-earth halides are reported. We investigated
Cs3Lu
2I9:Ce
3+
, Cs3Gd
2I9:Ce
3+
, Cs3LaBr
6:Ce
3+
and Cs3LuI
6:Ce
3+
. Cs3Lu
2I9:Ce
3+
and Cs3LaBr
6:Ce
3+
exhibit
the highest light yields under γ-ray excitation of 22800 ± 2300 and 10400 ± 1000 photons per MeV of ab-
sorbed γ-ray energy, respectively. Optical spectroscopy and scintillation decay time curves of these com-
pounds are presented.
phys. stat. sol. (a) 204, No. 3, 850–860 (2007) / DOI 10.1002/pssa.200622459

phys. stat. sol. (a) 204, No. 3, 850–860 (2007) / DOI 10.1002/pssa.200622459
© 2007 WILEY-VCH Verlag GmbH & Co. KGaA, Weinheim
Scintillation and luminescence properties
of Ce3+ doped ternary cesium rare-earth halides
M. D. Birowosuto*, 1, P. Dorenbos1, C. W. E. van Eijk1, K. W. Krämer2, and H. U. Güdel2
1 Radiation Detection and Matter, Faculty of Applied Sciences, Delft University of Technology,
Mekelweg 15, 2629 JB, Delft, The Netherlands 2 Department of Chemistry and Biochemistry, University of Bern, Freiestrasse 3, 3000 Bern 9,
Switzerland
Received 18 September 2006, revised 3 November 2006, accepted 14 November 2006
Published online 16 January 2007
PACS 29.30.Kv, 29.40.Mc, 78.47.+p, 78.55.Hx
The scintillation properties of Ce3+ doped ternary cesium rare-earth halides are reported. We investigated
Cs3Lu
2I9:Ce3+, Cs
3Gd
2I9:Ce3+, Cs
3LaBr
6:Ce3+ and Cs
3LuI6:Ce3+. Cs
3Lu
2I9:Ce3+ and Cs
3LaBr
6:Ce3+ exhibit
the highest light yields under γ-ray excitation of 22800 ± 2300 and 10400 ± 1000 photons per MeV of ab-
sorbed γ-ray energy, respectively. Optical spectroscopy and scintillation decay time curves of these com-
pounds are presented.
© 2007 WILEY-VCH Verlag GmbH & Co. KGaA, Weinheim
1 Introduction
The scintillation properties of various Ce3+ doped ternary halides were previously investigated.
K2LaI5 :Ce3+ and RbGd2Br7 :Ce3+ show relatively high light yields of 55000 and 32000 photons/MeV,
respectively [1, 2]. However, K2LaI5 :Ce3+ and RbGd2Br7 :Ce3+ contain the radioactive isotopes 40K and 87Rb. They lead to intrinsic activity that is undesirable for the application of these crystals as scintillators
[3, 4].
In this work, we present the scintillation properties of new Ce3+ doped ternary halides (Cs3M2I9 :Ce3+,
M = Lu,Gd and Cs3MX6 :Ce3+, M = La,Lu, X = Br, I). The highest light yield of 22800 photons/MeV
was recorded for Cs3Lu2I9 :Ce3+. This is much lower than that of 70000 photons/MeV of LaBr3 :Ce3+ and
98000 photons/MeV of LuI3 :Ce3+ [5–7].
The host properties and Ce3+ luminescence in various compounds with six-fold octahedral coordina-
tion around Ce3+ like LuI3 :Ce3+ and bromoelpasolites were previously studied [8, 9]. In this work, we
report the optical spectroscopy of the Ce3+ doped ternary halides that have similar octahedral anion coor-
dination. Using X-ray, optical and vacuum ultraviolet excitation (VUV), we study the host and Ce3+
emission and the excitation properties. The theoretical absolute light yield is estimated using the values
of the band gaps.
2 Experimental
2.1 Sample preparation and gamma interaction properties
The single crystals of undoped and Ce3+ doped Cs3LaBr6 were grown in silica ampoules by the Bridg-
mann technique. CsBr, LaBr3 and CeBr3 were used as starting materials. LaBr3 and CeBr3 were prepared
from La2O3 and CeO2 using the NH4Br method [10]. Both were sublimed for purification.
* Corresponding author: e-mail: [email protected], Phone: +31152781954, Fax: +31152786422

phys. stat. sol. (a) 204, No. 3 (2007) 851
www.pss-a.com © 2007 WILEY-VCH Verlag GmbH & Co. KGaA, Weinheim
Original
Paper
Table 1 Calculated density (c
ρ ) and total γ-ray attenuation length at 511 keV (l511
) of Cs3LaBr
6,
Cs3LuI
6, Cs
3Gd
2I9, and Cs
3Lu
2I9.
compound c
ρ l511
(g/cm3) (cm)
Cs3LaBr6 4.55 2.43
Cs3LuI6 4.78 2.09
Cs3Gd2I9 4.73 2.15
Cs3Lu2I9 4.82 2.04
The crystals of pure and Ce3+ doped Cs3M2I9, M = Lu, Gd and Cs3LuI6 were grown in silica ampoules
by the Bridgmann technique. Since the ammonium halide method does not work for iodides, the MI3
were synthesized from the elements and sublimed for the purification [11]. The Ce3+ doped samples were
obtained from a stoichiometric mixture of CsI, MI3 (M = Lu,Gd) and CeI3, respectively. Ce3+ doped
Cs3LaBr6 and Cs3LuI6 were grown with 0.5% Ce3+ whereas Ce3+ doped Cs3Gd2I9 was grown with
1% Ce3+. Two Ce3+ doped Cs3Lu2I9 crystals (0.5 and 2%) were prepared. It should be noted that
Cs3LaBr6 :Ce3+ and Ce3+ doped ternary iodides have the same degree of hygroscopicity as LaBr3 :Ce3+
and LuI3 :Ce3+, respectively [6, 7].
Cs3LaBr6 and Cs3LuI6 crystallize in the Cs3BiCl6 structure with space group C2/c [12]. Cs3Gd2I9 and
Cs3Lu2I9 are isostructural to Cs3Cr2Cl9 and crystallize in space group P63/mmc [13]. For Ce3+ doped
compounds, Ce3+ ions occupy a rare-earth cation site with six-fold (distorted) octahedral coordination.
Table 1 shows the calculated density (c
ρ ) and the total γ -ray attenuation length at 511 keV (l511) of the
investigated compounds. The total attenuation lengths for Cs3LuI6 and Cs3Lu2I9 in Table 1 are longer
than that of LuI3 (1.82 cm) [6].
2.2 Measurement techniques
X-ray excited emission spectra were recorded in reflection using an X-ray tube with a Cu-anode. The
anode was operated at 35 kV and 25 mA. The emission of the sample was dispersed by an Acton Re-
search Corporation (ARC) VM-504 monochromator (blazed at 300 nm, 1200 grooves/mm) and detected
by a Hamamatsu R934-04 Photomultiplier Tube (PMT). The spectra in this study were corrected for the
wavelength dependence of the photodetector quantum efficiency as well as monochromator transmission.
γ -ray pulse height spectra were recorded with a Hamamatsu R1791 PMT operated at a cathode voltage
of –700 V. Crystals sealed in quartz ampoules were directly mounted to the window of the PMT without
an optical coupling and covered with several layers of 0.1 mm ultraviolet (UV) reflecting Teflon tape.
The yield, expressed in photoelectrons per MeV of absorbed γ -ray energy (phe/MeV), was determined
by comparison of the total γ -ray energy absorption peak with the single photoelectron peak. The light
yield expressed in photons per MeV (photons/MeV) is determined using the quantum efficiency and
reflectivity of the PMT [14].
662 keV γ -ray scintillation decay time curves were recorded using two different methods. The first is
the single-photon counting technique described by Bollinger and Thomas [15]. For this method, scintilla-
tion decay time curves were recorded at time ranges up to 200 µs with XP2020Q PMTs, Ortec 934 Con-
stant Fraction Discriminators, Ortec 567 Time to Amplitude Converter (TAC) and AD513A CAMAC
Analog to Digital Converter (ADC). The second method is the multihit method [16]. The TAC and ADC
in single-photon counting technique were replaced by a Lecroy 4208 Time to Digital Converter with a
channel width of 1 ns. By this method, the short decay component and its contribution to the total light
yield are less accurately obtained than by the single-photon counting technique.
Room temperature (RT) optical excitation and emission spectra in the 220–800 nm wavelength range
were recorded using the spectrophotometer Quanta Master QM1 of Photon Technology International
(PTI). Vacuum ultraviolet (VUV) excitation and emission spectra were measured at the SUPERLUMI

852 M. D. Birowosuto et al.: Scintillation and luminescence properties of Ce3+ doped halides
© 2007 WILEY-VCH Verlag GmbH & Co. KGaA, Weinheim www.pss-a.com
station at HASYLAB at the DESY facility in Hamburg, Germany. Details of this experiment can be
found in [9]. Sodium salycilate was used as a reference to correct the excitation spectrum for the lamp
spectrum and the monochromator transmission. The emission spectrum is corrected for the spectral sen-
sitivity of the system.
Decay curves with selected excitation and emission wavelengths were recorded using a PicoQuant
PDL 808 Sepia pulsed diode laser. Laser heads with wavelengths ranging from UV to infrared were used
to excite the sample. The output frequency of 5 MHz is selected. The emission was filtered by band filter
and detected by a Philips XP2020Q PMT. Decay curves were obtained after deconvolution of the system
response function.
Temperature-dependent measurements were performed using a JANIS VPF-700 Cryostat operated
with a model 331 temperature controller. The temperature range is 77–800 K.
3 Results and discussion
3.1 X-ray excited emission spectra
X-ray excited emission spectra of undoped and 0.5% Ce3+ doped Cs3LaBr6, Cs3LuI6, Cs3Lu2I9 and
Cs3Gd2I9 :1% Ce3+ recorded at RT are shown in Fig. 1.
The undoped Cs3LaBr6 emission spectrum shows a broad band peaked at 394 nm, see spectrum (i) in
Fig. 1a. The undoped Cs3LuI6 and Cs3Lu2I9 emission spectra show bands peaked at 390 and 608 nm,
respectively, with unknown rare-earth impurity 4f–4f lines located between 550 and 850 nm, see spec-
tra (i) in Fig. 1b and d.
The emission spectrum of Cs3LaBr6 :0.5% Ce3+ shows two overlapping bands peaked at 390 and
425 nm, see full line in Fig. 1a. These bands are attributed to Ce3+ emission. In the Cs3LuI6 :0.5%Ce3+
emission spectrum, these bands are shifted towards longer wavelength peaking at 429 and 471 nm, see
Fig. 1 X-ray excited emission spectra at RT of un-
doped and Ce3+ doped (a) Cs3LaBr
6, (b) Cs
3LuI
6,
(c) Cs3Gd
2I9, and (d) Cs
3Lu
2I9. The spectra denoted with
(i) and (ii) are of undoped and Ce3+ doped samples,
respectively.

phys. stat. sol. (a) 204, No. 3 (2007) 853
www.pss-a.com © 2007 WILEY-VCH Verlag GmbH & Co. KGaA, Weinheim
Original
Paper
Fig. 2 Temperature dependence of X-ray excited emission spectra at 40 K intervals (a) and temperature
dependence of the integrated X-ray emission intensity (b) of Cs3Lu
2I9:0.5% Ce3+.
Fig. 1b. 4f–4f lines of unknown rare-earth impurities are also present in this compound. The redshift is
attributed to a larger covalency between Ce3+ and iodine than between Ce3+ and bromine [17]. The 5d
crystal field splitting in Cs3LuI6 :0.5% Ce3+ is likely to be smaller than that of Cs3LaBr6 :0.5% Ce3+. A
similar trend in the 5d Ce3+ crystal field splitting can be found for LuI3 :Ce3+ and Cs2NaLaBr6 :Ce3+ [8, 9].
The 5d Ce3+ crystal field splitting of 1.61 eV of LuI3 :Ce3+ is smaller than that of 1.83 eV of
Cs2NaLaBr6 :Ce3+.
The emission spectra of Cs3Gd2I9 :1% Ce3+ and Cs3Lu2I9 :0.5% Ce3+ show a different structure than
those of Cs3LaBr6 :0.5% Ce3+ and Cs3LuI6 :0.5% Ce3+, see Fig. 1c and 1d. In the Cs3Gd2I9 :1% Ce3+ spec-
trum, the sharp line at 314 nm is attributed to 6P7 / 2 → 8S Gd3+ transition, see Fig. 1c. The origin of the
broad bands in the spectrum at 300, 390, 429, 478, and 571 nm is not clear. In the spectrum of
Cs3Lu2I9 :0.5% Ce3+, we observe a broad band peaked at 556 nm, see spectrum (ii) in Fig. 1d.
The temperature dependence of X-ray excited emission spectra and the integrated X-ray emission
intensity of Cs3Lu2I9 :0.5% Ce3+ are shown in Fig. 2.
The X-ray excited emission spectrum recorded at 80 K shows two bands peaking at 556 and 627 nm.
When the temperature increases, the Ce3+ emission broadens and there is a general blue-shift. The gen-
eral blue shift may be related to lattice expansion leading to larger Ce3+-anion distances and small crystal
field interaction. The integrated intensity of the emission spectra is shown in Fig. 2b. There is a 4.5 times
decrease in the integrated intensity from 80 K to RT.
3.2 Luminescence characteristics
The optically excited emission and excitation spectra of undoped Cs3LaBr6, Cs3LuI6, and Cs3Lu2I9 re-
corded at RT are shown in Fig. 3.
The emission spectra of Cs3LaBr6 and Cs3LuI6 excited into the host lattice absorption show two over-
lapping bands with peaks at 320 and 395 nm and 290 and 375 nm, respectively, whereas the spectrum of
undoped Cs3Lu2I9 shows one band peaked at 608 nm. We attribute the bands to exciton emission, either
self trapped or impurity trapped. Sharp peaks originate from 4f–4f transitions of unintended rare-earth
impurities.
From the excitation spectra of the undoped compounds, the properties of the host compounds that are
compiled in Table 2 were derived. The fundamental absorption (Efa) is defined as the energy of the first
sharp onset in the excitation spectra monitoring intrinsic emission. The first maximum (Eex) is attributed
to the creation of excitons which can be regarded as bound electron hole pairs. The edge of the conduc-
tion band (EVC) corresponds to the creation of free electrons in the conduction band and free holes in the

854 M. D. Birowosuto et al.: Scintillation and luminescence properties of Ce3+ doped halides
© 2007 WILEY-VCH Verlag GmbH & Co. KGaA, Weinheim www.pss-a.com
valence band. The bottom of the conduction band was estimated at 8% higher energy than Eex. This is
based on the estimation that the binding energy of the electron and hole pair in the exciton is about 8% of
the exciton creation energy in alkali halide [18]. EVC of Cs3LaBr6 :Ce3+ appears 0.5 eV smaller than that
of LaBr3 :Ce3+[19]. For ternary iodides, EVC in Cs3LuI6 :Ce3+ and Cs3Lu2I9 :Ce3+ is 0.5 eV larger and
0.2 eV smaller than that of LuI3 :Ce3+, respectively [8].
Figure 4 shows the emission and excitation spectra of Cs3LaBr6 :0.5% Ce3+, Cs3LuI6 :0.5% Ce3+, and
Cs3Lu2I9 :0.5%Ce3+ recorded at RT. With octahedral coordination, the Ce3+ 5d configuration splits into a
doublet 5deg at high energy and a triplet 5d2gt
at low energy [9]. In the Cs3LaBr6 :Ce3+, Cs3LuI6 :Ce3+, and
Cs3Lu2I9 :Ce3+ excitation spectra, we observe lower energy bands peaking at 362, 410 and 425 nm, re-
spectively, see Fig. 4 These bands are attributed to the 5d2gt
absorption. The expected splitting into three
sub bands resulting from the distortion of the octahedra coordination is not resolved. The other bands at
244, 278, and 310 nm for Cs3LaBr6 :Ce3+, Cs3LuI6 :Ce3+, and Cs3Lu2I9 :Ce3+, respectively, are due to the
remnant of the host lattice and the possible 5deg excitations. The emission spectra of Cs3LaBr6 :Ce3+ and
Cs3LuI6 :Ce3+ show similar structures as the X-ray excited emission spectra, see Fig. 1. They exhibit two
bands of the characteristic 5d → 4f Ce3+[2F5/2,2F7/2] doublet emission, see Fig. 4a and b. The 2F spin–orbit
splittings of the Ce3+ ground state in Cs3LaBr6 :Ce3+ and Cs3LuI6 :Ce3+ are 2112 and 2079 cm–1, respec-
tively.
The Cs3Lu2I9 :Ce3+ emission spectrum shows a more complicated structure. The Cs3Lu2I9 :Ce3+ emis-
sion spectrum excited at 404 nm exhibits bands peaking at 556 nm with a shoulder at 468 nm, see
Table 2 Host properties of Cs3LaBr
6, Cs
3LuI
6, and Cs
3Lu
2I9. Energies are given in eV.
compound Efa Eex EVC
Cs3LaBr6 4.5 5.0 5.4
Cs3LuI6 4.4 4.7 5.0
Cs3Lu2I9 3.6 4.0 4.3
Fig. 3 Excitation (lines with open squares) and emission
spectra (solid lines) of undoped (a) Cs3LaBr
6, (b) Cs
3LuI
6,
and (c) Cs3Lu
2I9 at RT. The excitation spectra were re-
corded monitoring 490, 345, and 549 nm emission for
Cs3LaBr
6, Cs
3LuI
6, and Cs
3Lu
2I9, respectively and the
emission spectra were excited at 260, 250, and 270 nm for
Cs3LaBr
6, Cs
3LuI
6, and Cs
3Lu
2I9, respectively. E
fa, E
ex, and
EVC
are explained in the text.

phys. stat. sol. (a) 204, No. 3 (2007) 855
www.pss-a.com © 2007 WILEY-VCH Verlag GmbH & Co. KGaA, Weinheim
Original
Paper
Fig. 4c. Another band at 627 nm was previously resolved in the X-ray excitation spectrum recorded at
80 K, see Fig. 2. When excited at 90 nm, a band peaking at 426 nm appears, see inset in Fig. 4c. From
those bands, we suggest that there are two types of Ce3+ sites in Cs3Lu2I9 :Ce3+. However, in the Cs3Lu2I9
structure, there is only one Lu3+ site and we expect the Ce3+ to occupy that site. The second Ce3+ site is
then a distorted site of unknown nature.
The Stokes shift of Ce3+ emission in one site is smaller than the other site, see Fig. 4c. The Ce3+ emis-
sion with the smallest Stokes shift is probably the genuine Lu3+ site since its Stokes shift is identical with
that of Cs3LuI6 :Ce3+. This is due to the fact that Ce3+ in both compounds occupies Lu3+ site with six-fold
octahedral coordination. The Ce3+ emission from the regular site (Ce(I)) and the distorted site (Ce(II)) are
then peaked at 426 and 468 nm and at 556 and 627 nm, respectively. The corresponding 2F spin–orbit
splittings of the Ce3+ ground state for both sites are 2107 and 2037 cm–1. The Ce(I) emission was not
observed in the emission spectrum excited at 404 nm, see Fig. 4c. This means that the band at 404 nm
does not belong to the 5d excitation band of Ce(I) or the excitation at the 5d band of Ce(I) is effectively
transferred to Ce(II).
Decay curves of Cs3Lu2I9 :0.5% Ce3+ monitoring 460 nm (Ce(I) site) and 550 nm (Ce(II) site) emission
excited into the 4f → 5d band edge at 377 nm are shown in Fig. 5. Decay curves monitoring Ce(I) emis-
sion were fit with a single exponential decay whereas those monitoring Ce(II) emission were fit with the
following equation [9, 20].
d d tt
d t 0
t d
1/( ) e e e
1/ 1
t t t
N t N N yτ τ ττ
τ τ
- - -È ˘È ˘= + - +Í ˙Î ˚- /Î ˚ . (1)
Equation (1) is obtained when the excitation of Ce(II) is delayed due to a transfer from Ce(I) to Ce(II). Nt
and Nd are the number of populated 5d states at t = 0 of Ce(I) and Ce(II), respectively. d
τ and t
τ are the
decay time of Ce(II) and the transfer time from Ce(I) to Ce(II), respectively. We also added y0 as a cor-
Fig. 4 Excitation (lines with open squares) and
emission spectra (solid lines) of (a) Cs3LaBr
6:0.5% Ce3+,
(b) Cs3LuI
6:0.5% Ce3+, and (c) Cs
3Lu
2I9:0.5% Ce3+ at RT.
The excitation spectra were recorded monitoring 425,
471, and 557 nm emission for Cs3LaBr
6:0.5% Ce3+,
Cs3LuI
6:0.5% Ce3+, and Cs
3Lu
2I9:0.5% Ce3+, respectively
and the emission spectra excited at 330, 284, and
404 nm for Cs3LaBr
6:0.5% Ce3+, Cs
3LuI
6:0.5% Ce3+, and
Cs3Lu
2I9:0.5% Ce3+, respectively. The inset in (c) is
the emission spectrum excited at 90 nm for
Cs3Lu
2I9:0.5% Ce3+.
856 M. D. Birowosuto et al.: Scintillation and luminescence properties of Ce3+ doped halides
© 2007 WILEY-VCH Verlag GmbH & Co. KGaA, Weinheim www.pss-a.com
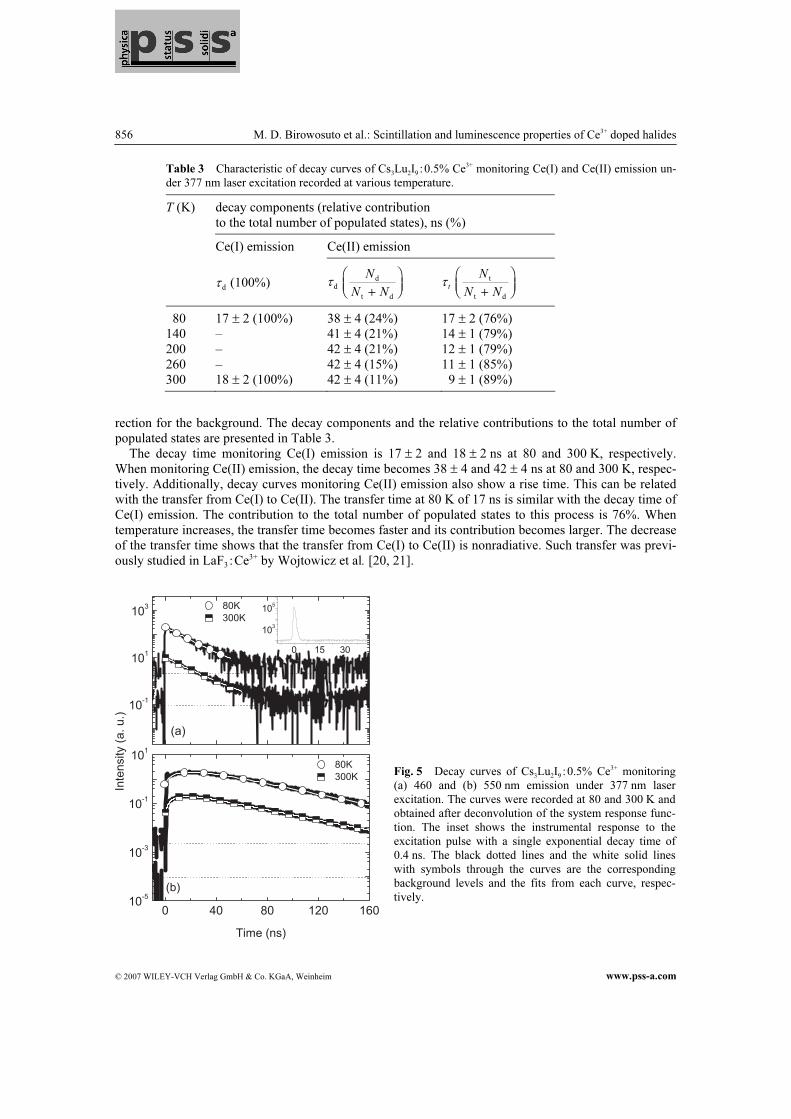
Table 3 Characteristic of decay curves of Cs3Lu
2I9:0.5% Ce3+ monitoring Ce(I) and Ce(II) emission un-
der 377 nm laser excitation recorded at various temperature.
T (K) decay components (relative contribution
to the total number of populated states), ns (%)
Ce(I) emission Ce(II) emission
d
τ (100%) dτ d
t d
N
N N
Ê ˆÁ ˜Ë ¯+
t
τ t
t d
N
N N
Ê ˆÁ ˜Ë ¯+
80 17 ± 2 (100%) 38 ± 4 (24%) 17 ± 2 (76%)
140 – 41 ± 4 (21%) 14 ± 1 (79%)
200 – 42 ± 4 (21%) 12 ± 1 (79%)
260 – 42 ± 4 (15%) 11 ± 1 (85%)
300 18 ± 2 (100%) 42 ± 4 (11%) 9 ± 1 (89%)
rection for the background. The decay components and the relative contributions to the total number of
populated states are presented in Table 3.
The decay time monitoring Ce(I) emission is 17 ± 2 and 18 ± 2 ns at 80 and 300 K, respectively.
When monitoring Ce(II) emission, the decay time becomes 38 ± 4 and 42 ± 4 ns at 80 and 300 K, respec-
tively. Additionally, decay curves monitoring Ce(II) emission also show a rise time. This can be related
with the transfer from Ce(I) to Ce(II). The transfer time at 80 K of 17 ns is similar with the decay time of
Ce(I) emission. The contribution to the total number of populated states to this process is 76%. When
temperature increases, the transfer time becomes faster and its contribution becomes larger. The decrease
of the transfer time shows that the transfer from Ce(I) to Ce(II) is nonradiative. Such transfer was previ-
ously studied in LaF3 :Ce3+ by Wojtowicz et al. [20, 21].
Fig. 5 Decay curves of Cs3Lu
2I9:0.5% Ce3+ monitoring
(a) 460 and (b) 550 nm emission under 377 nm laser
excitation. The curves were recorded at 80 and 300 K and
obtained after deconvolution of the system response func-
tion. The inset shows the instrumental response to the
excitation pulse with a single exponential decay time of
0.4 ns. The black dotted lines and the white solid lines
with symbols through the curves are the corresponding
background levels and the fits from each curve, respec-
tively.

phys. stat. sol. (a) 204, No. 3 (2007) 857
www.pss-a.com © 2007 WILEY-VCH Verlag GmbH & Co. KGaA, Weinheim
Original
Paper
3.3 Scintillation light yield and energy resolution
The 137Cs 662 keV γ source pulse height spectra of Cs3LaBr6 :Ce3+ and Cs3Lu2I9 :Ce3+ are presented in
Fig. 6. The pulse height spectra of Cs3LuI6 :Ce3+ and Cs3Gd2I9 :Ce3+ are not shown. The 662 keV pho-
topeaks are centered at a channel number 1700 ± 170 and 8300 ± 830 for undoped and Ce3+ doped
Cs3LaBr6, respectively. In Cs3Lu2I9 :Ce3+, the center of the photopeak is shifted towards higher channel
number when Ce3+ concentration increases.
Light yields and energy resolutions are listed in Table 4. The energy resolution R defined as full width
at half maximum (FWHM) over the peak position is obtained from a Gaussian fit of the photopeak.
Cs3Lu2I9 :2% Ce3+ has the highest light yield of 22800 ± 2300 photons/MeV and the best energy resolu-
Table 4 Light yield and energy resolution derived from pulse height spectra of undoped and Ce3+ doped
Cs3LaBr
6, Cs
3LuI
6, Cs
3Gd
2I9, and Cs
3Lu
2I9 under 662 keV γ-ray excitation measured with a Hamamatsu
R1791 PMT at RT. Energy resolution was recorded with a shaping time of 10 µs. The energy resolution
of Cs3LuI
6:Ce3+ and Cs
3Gd
2I9:Ce3+ are not presented because of poor crystal quality.
compound photoelectron light yield energy
(phe/MeV) (103 photons/MeV) resolution
0.5 µs 10 µs 0.5 µs 10 µs R (%)
undoped Cs3LaBr6 410 ± 41 530 ± 53 1.6 ± 0.2 2.1 ± 0.2 13.6 ± 1.4
Cs3LaBr6 :Ce3+(0.5%) 1460 ± 15 2620 ± 26 5.8 ± 0.6 10.4 ± 1.0 30.0 ± 3.0
undoped Cs3LuI6 300 ± 30 360 ± 36 1.2 ± 0.1 1.4 ± 0.1 –
Cs3LuI6 :Ce3+(0.5%) 355 ± 35 380 ± 38 1.4 ± 0.1 1.5 ± 0.2 –
Cs3Gd2I9 :Ce3+(1%) 310 ± 31 360 ± 36 2.2 ± 0.2 2.6 ± 0.3 –
Undoped Cs3Lu2I9 400 ± 40 650 ± 65 4.0 ± 0.4 6.6 ± 0.7 19.2 ± 1.9
Cs3Lu2I9 :Ce3+(0.5%) 1530 ± 150 2430 ± 240 12.1 ± 1.2 19.2 ± 1.9 11.2 ± 1.1
Cs3Lu2I9 :Ce3+(2%) 1670 ± 170 2800 ± 280 13.6 ± 1.4 22.8 ± 2.3 9.0 ± 0.9
Fig. 6 Pulse height spectra of Cs3LaBr
6:Ce3+ and
Cs3Lu
2I9:Ce3+ for 137Cs 662 keV γ -rays. Spectra were meas-
ured with a Hamamatsu R1791 PMT recorded with shaping
time of 10 µs and at RT.
858 M. D. Birowosuto et al.: Scintillation and luminescence properties of Ce3+ doped halides
© 2007 WILEY-VCH Verlag GmbH & Co. KGaA, Weinheim www.pss-a.com
tion of 9.0 ± 0.9%. The light yields in these compounds are much smaller than those of 70000 ± 7000
photons/MeV of LaBr3 :Ce3+ and 98000 ± 9800 photons/MeV of LuI3 :Ce3+ [5, 7]. The energy resolution
of Cs3LuI6, Cs3LuI6 :Ce3+, and Cs3Gd2I9 :Ce3+ are not presented since they are very poor. This is related
with both the low photoelectron response and the poor crystal quality. In Cs3LaBr6 :Ce3+, the poor energy
resolution (30%) is mainly caused by the poor crystal quality.
The maximum possible light yield can be theoretically estimated from the band gap of materials EVC
as given by
6
VC
10 SQY
Eβ= , (2)
where S is the efficiency of electron–hole transport to the optical center, Q is the luminescence quantum
efficiency of the optical center and β is the ratio between energy needed to create one electron–hole pair
and the energy gap. The value of β is between 2 and 3. For the ideal scintillator, S and Q are unity.
We apply the EVC values from Table 2 to Eq. (2). In the case of an ideal scintillator, the light yield of
Cs3LaBr6 :Ce3+ would be 77000 ± 15000 photons/MeV whereas those of Cs3LuI6 :Ce3+ and Cs3Lu2I9 :Ce3+
would be 82000 ± 16000 photons/MeV and 98000 ± 20000 photons/MeV, respectively. These values are
four to fifty three times larger than the actual light yields in Table 4. The values for SQ are
0.139 ± 0.028, 0.019 ± 0.004, and 0.243 ± 0.048 for Cs3LaBr6 :Ce3+, Cs3LuI6 :Ce3+ and Cs3Lu2I9 :Ce3+,
respectively. Therefore, S and/or Q in these compounds are much smaller than those in LaBr3 :Ce3+ and
LuI3 :Ce3+ where S and Q are almost unity [6].
For Cs3Lu2I9 :0.5% Ce3+, we determined that the light yield at 80 K is 4.5 times higher than that at
300 K, which translates to 86400 photons/MeV at 80 K, see Fig. 2. We also found that the decay times
monitoring both Ce(I) and Ce(II) emissions do not shorten as temperature increases from 80 to 300 K,
see Fig. 5. Thus, the low light yield at RT in Cs3Lu2I9 :0.5% Ce3+ is not caused by the intrinsic quenching
of Ce3+ 5d → 4f emission. The low light yield at RT is attributed to the low efficiency of electron–hole
transport to Ce3+.
3.4 Scintillation decay curves
The γ-ray scintillation decay curves of Cs3LaBr6 :Ce3+ and Cs3Lu2I9 :Ce3+ recorded using the multihit
method are shown in Fig. 7. The scintillation decay curves of Cs3LuI6 :Ce3+ and Cs3Gd2I9 :Ce3+ could not
be recorded with this method because of a very low photoelectron response, see Table 4. The short-time
scale scintillation decay curves recorded using the single-photon counting technique are shown in the
inset. These curves were fitted with three exponentials. In order to characterize the long-time scale decay
curves, the curves of Cs3Lu2I9 :Ce3+ and Cs3LaBr6 :Ce3+ were fitted with four and three exponentials,
respectively. The first and second decay components from the fit of the short-time scale decay curves
were applied as constants in the fit of the long-time scale decay curves.
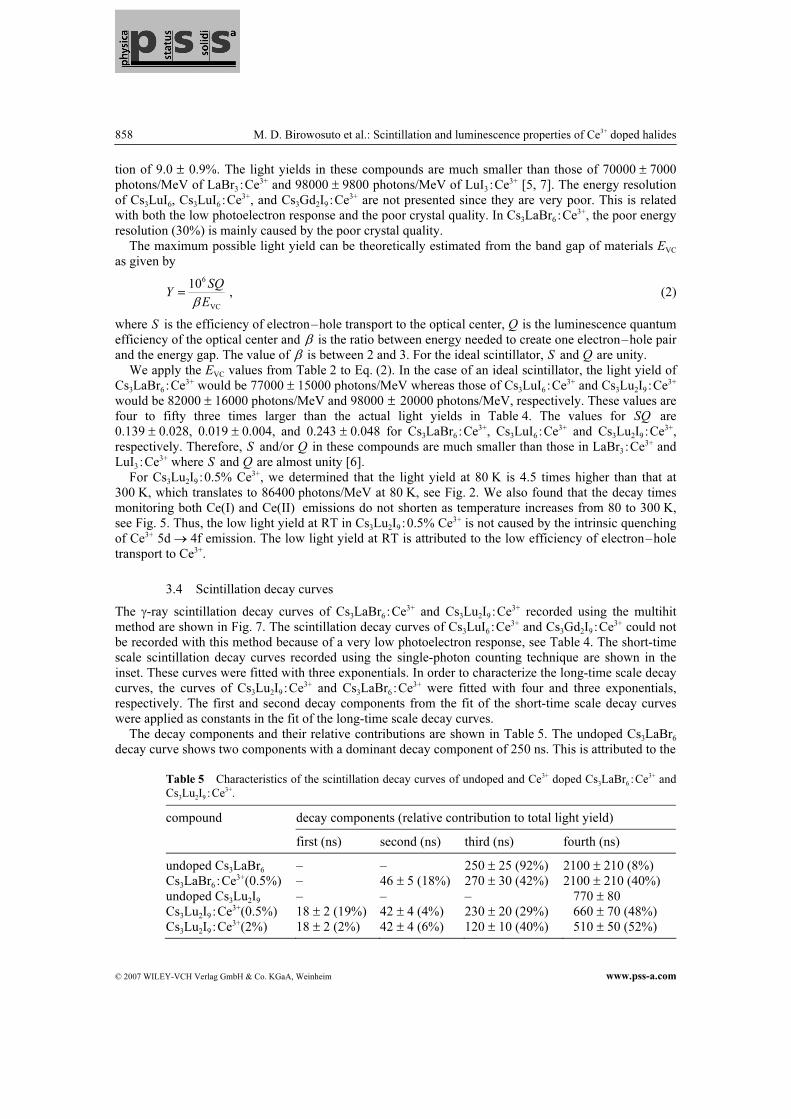
The decay components and their relative contributions are shown in Table 5. The undoped Cs3LaBr6
decay curve shows two components with a dominant decay component of 250 ns. This is attributed to the
Table 5 Characteristics of the scintillation decay curves of undoped and Ce3+ doped Cs
3LaBr
6:Ce3+ and
Cs3Lu
2I9:Ce3+.
compound decay components (relative contribution to total light yield)
first (ns) second (ns) third (ns) fourth (ns)
undoped Cs3LaBr6 – – 250 ± 25 (92%) 2100 ± 210 (8%)
Cs3LaBr6 :Ce3+(0.5%) – 46 ± 5 (18%) 270 ± 30 (42%) 2100 ± 210 (40%)
undoped Cs3Lu2I9 – – – 770 ± 80
Cs3Lu2I9 :Ce3+(0.5%) 18 ± 2 (19%) 42 ± 4 (4%) 230 ± 20 (29%) 660 ± 70 (48%)
Cs3Lu2I9 :Ce3+(2%) 18 ± 2 (2%) 42 ± 4 (6%) 120 ± 10 (40%) 510 ± 50 (52%)

phys. stat. sol. (a) 204, No. 3 (2007) 859
www.pss-a.com © 2007 WILEY-VCH Verlag GmbH & Co. KGaA, Weinheim
Original
Paper
decay time of the exciton emission in Cs3LaBr6, see Fig. 3. In the Ce3+ doped Cs3LaBr6 decay curve, we
observe similar decay components and in addition a fast component of 46 ns. The fast component may
correspond with the lifetime of the 5d state of Ce3+ in Cs3LaBr6 :Ce3+. The contribution of the 2.100 ns
slow component to the total light yield has increased compared to that of undoped Cs3LaBr6. This in-
crease suggests that the introduction of Ce3+ to this compound may also create a potential well for trap-
ping charge carriers. Therefore Ce3+ ion could play two different roles as a luminescence center and as a
trap [21]. For higher Ce3+ concentration, the formation of lattice excitons or Ce3+-bound excitons could
significantly be delayed.
The undoped Cs3Lu2I9 decay curve exhibits only a single exponential decay with a decay time of
770 ns. When it is doped with Ce3+, two fast components appear. For Cs3Lu2I9 :0.5% Ce3+, the 18 and
42 ns decay times correspond with the lifetime of the 5d state of Ce(I) and Ce(II), respectively, see Fig. 5
and Table 3. It suggests that part of the electron hole pairs are trapped immediately by Ce3+ within 1 ns
[22]. The other electron–hole pairs are trapped by the lattice and transferred to Ce3+ which leads to the
intermediate and slow components in the scintillation decay curves, see Fig. 7b.
When the concentration increases to 2%, the contribution of the fast component decreases while the
intermediate and the slow components become faster with decay times of 120 and 510 ns, respectively.
The relative contribution to the total light yield of the slow component in Cs3Lu2I9 :Ce3+ is larger than
that of the fast component, therefore the electron–hole transfer to the Ce3+ center via the host lattice is
more important than the direct sequential electron–hole capture. The decrease of the contribution of the
first component when the Ce3+ concentration increases may correspond to the creation of traps as in
Cs3LaBr6 :Ce3+.
4 Conclusion
We studied scintillation properties of Ce3+ doped ternary cesium rare-earth halides. The highest light
yield (22800 photons/MeV) and the best energy resolution (9%) are found for Cs3Lu2I9 :2% Ce3+. Optical
properties of these compounds are also presented. The energy gap of Cs3Lu2I9, Cs3LuI6, and Cs3LaBr6 is
Fig. 7 Scintillation decay curves of (a) undoped (i) and 0.5%
Ce3+ doped (ii) Cs3LaBr
6 and (b) undoped (i), 0.5% (ii) and 2%
Ce3+ doped (iii) Cs3Lu
2I9 under 137Cs γ -ray excitation recorded
by the multihit method at RT. The inset shows the short-time
scale scintillation decay curves recorded using the single-
photon counting technique at RT of 0.5% (i) and 2% Ce3+
doped (ii) Cs3Lu
2I9. The black dotted lines and the white solid
lines through the curves are the corresponding background
levels and the fits from each curve, respectively.

860 M. D. Birowosuto et al.: Scintillation and luminescence properties of Ce3+ doped halides
© 2007 WILEY-VCH Verlag GmbH & Co. KGaA, Weinheim www.pss-a.com
4.29, 5.05, and 5.40 eV, respectively. Using this energy gap, we estimated the light yields of all com-
pounds should be between 70000 and 120000 photons/MeV. The obtained light yield is much lower than
expected. In case of Cs3Lu2I9 :Ce3+, the low light yield is due to the small efficiency of electron–hole
transport to the optical center. Generally, these compounds are less interesting for scintillator applica-
tions compared to LaBr3 :Ce3+ and LuI3 :Ce3+, due to their low light yields.
Acknowledgments These investigations have been supported by Netherlands Technology Foundation (STW), the
Swiss National Science Foundation, the European Community Research Infrastructure Action under the FP6 ‘Struc-
turing the European Research Area’ Programme (through the Integrated Infrastructure Initiative ‘Integrating Activity
on Synchrotron and Free Electron Laser Science’) and Saint Gobain, division crystals and detectors, Nemours,
France.
References
[1] E. V. D. van Loef, P. Dorenbos, C. W. E. van Eijk, K. W. Krämer, and H. U. Güdel, Nucl. Instrum. Methods
Phys. Res. A 537, 232 (2005).
[2] P. Dorenbos, J. C. van’t Spijker, O. W. V. Frijns, C. W. E. van Eijk, K. W. Krämer, and H. U. Güdel, Nucl.
Instrum. Methods Phys. Res. B 132, 728 (1997).
[3] P. Dorenbos, J. T. M. de Haas, and C. W. E. van Eijk, IEEE Trans. Nucl. Sci. 42, 2190 (1995).
[4] O. Guillot Noël, J. C. van t’Spijker, J. T. M. de Haas, P. Dorenbos, C. W. E. van Eijk, K. W. Krämer, and H. U.
Güdel, IEEE Trans. Nucl. Sci. 46, 1274 (1999).
[5] M. D. Birowosuto, P. Dorenbos, C. W. E. van Eijk, K. W. Krämer, and H. U. Güdel, IEEE Trans. Nucl. Sci.
52, 1114 (2005).
[6] M. D. Birowosuto, P. Dorenbos, C. W. E. van Eijk, K. W. Krämer, and H. U. Güdel, J. Appl. Phys. 99, 123520
(2006).
[7] E. V. D. van Loef, P. Dorenbos, C. W. E. van Eijk, K. W. Krämer, and H. U. Güdel, Appl. Phys. Lett. 79, 1573
(2001).
[8] M. D. Birowosuto, P. Dorenbos, C. W. E. van Eijk, K. W. Krämer, and H. U. Güdel, J. Lumin. 118, 308
(2006).
[9] M. D. Birowosuto, P. Dorenbos, C. W. E. van Eijk, K. W. Krämer, and H. U. Güdel, J. Phys.: Condens. Matter
18, 6133 (2006).
[10] G. Meyer, Prog. Solid State Chem. 14, 141 (1982).
[11] G. Meyer, Synthesis of Lanthanide and Actinide Compounds (Kluwer, Dordrecht, The Netherlands, 1991).
[12] F. Benachenhou, G. Mairesse, G. Nowogrocki, and D. Thomas, Solid State Chem. 65, 13 (1986).
[13] G. J. Wessel and D. J. W. Ijdo, Acta Crystallogr. 10, 466 (1957).
[14] J. T. M. de Haas, P. Dorenbos, and C. W. E. van Eijk, Nucl. Instrum. Methods Phys. Res. A 537, 97 (2005).
[15] L. M. Bollinger and G. E. Thomas, Rev. Sci. Instrum. 32, 1044 (1961).
[16] W. W. Moses, Nucl. Instrum. Methods Phys. Res. A 336, 253 (1993).
[17] P. Dorenbos, Phys. Rev. B 62, 15640 (2000).
[18] K. S. Song and R. T. Williams, Self-Trapped Excitons (Springer, Berlin, Heidelberg, 1993), p. 175.
[19] P. Dorenbos, E. V. D. van Loef, A. P. Vink, E. van der Kolk, C. W. E. van Eijk, K. W. Krämer, H. U. Güdel,
W. M. Higgins, and K. S. Shah, Lumin. 117, 147 (2006).
[20] A. J. Wojtowicz, E. Berman, Cz. Koepke, and A. Lempicki, IEEE Trans. Nucl. Sci. 39, 494 (1992).
[21] A. J. Wojtowicz, M. Balcerzyk, E. Berman, and A. Lempicki, Phys. Rev. B 49, 14880 (1994).
[22] P. Dorenbos, phys. stat. sol. (a) 202, 195 (2005).