Proton conductors of cerium pyrophosphate for intermediate temperature fuel cell
7
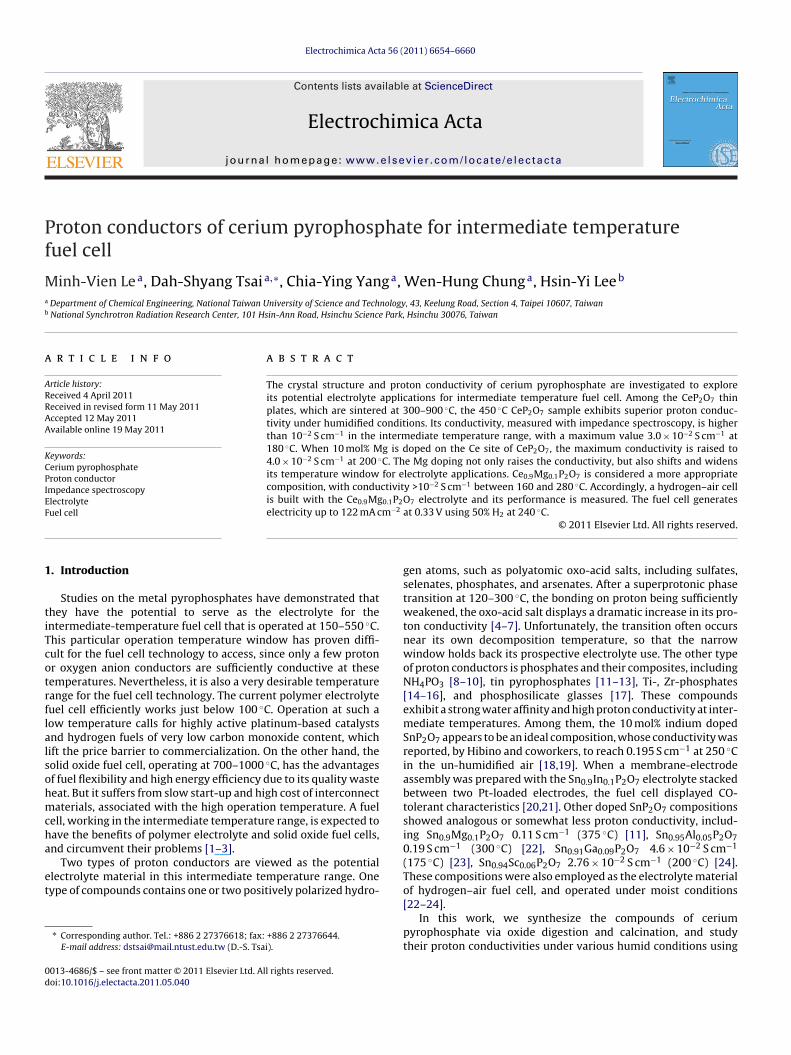
Electrochimica Acta 56 (2011) 6654–6660 Contents lists available at ScienceDirect Electrochimica Acta j ourna l ho me pag e: www.elsevier.com/locate/electacta Proton conductors of cerium pyrophosphate for intermediate temperature fuel cell Minh-Vien Le a , Dah-Shyang Tsai a,∗ , Chia-Ying Yang a , Wen-Hung Chung a , Hsin-Yi Lee b a Department of Chemical Engineering, National Taiwan University of Science and Technology, 43, Keelung Road, Section 4, Taipei 10607, Taiwan b National Synchrotron Radiation Research Center, 101 Hsin-Ann Road, Hsinchu Science Park, Hsinchu 30076, Taiwan a r t i c l e i n f o Article history: Received 4 April 2011 Received in revised form 11 May 2011 Accepted 12 May 2011 Available online 19 May 2011 Keywords: Cerium pyrophosphate Proton conductor Impedance spectroscopy Electrolyte Fuel cell a b s t r a c t The crystal structure and proton conductivity of cerium pyrophosphate are investigated to explore its potential electrolyte applications for intermediate temperature fuel cell. Among the CeP 2 O 7 thin plates, which are sintered at 300–900 ◦ C, the 450 ◦ C CeP 2 O 7 sample exhibits superior proton conduc- tivity under humidified conditions. Its conductivity, measured with impedance spectroscopy, is higher than 10 −2 S cm −1 in the intermediate temperature range, with a maximum value 3.0 × 10 −2 S cm −1 at 180 ◦ C. When 10 mol% Mg is doped on the Ce site of CeP 2 O 7 , the maximum conductivity is raised to 4.0 × 10 −2 S cm −1 at 200 ◦ C. The Mg doping not only raises the conductivity, but also shifts and widens its temperature window for electrolyte applications. Ce 0.9 Mg 0.1 P 2 O 7 is considered a more appropriate composition, with conductivity >10 −2 S cm −1 between 160 and 280 ◦ C. Accordingly, a hydrogen–air cell is built with the Ce 0.9 Mg 0.1 P 2 O 7 electrolyte and its performance is measured. The fuel cell generates electricity up to 122 mA cm −2 at 0.33 V using 50% H 2 at 240 ◦ C. © 2011 Elsevier Ltd. All rights reserved. 1. Introduction Studies on the metal pyrophosphates have demonstrated that they have the potential to serve as the electrolyte for the intermediate-temperature fuel cell that is operated at 150–550 ◦ C. This particular operation temperature window has proven diffi- cult for the fuel cell technology to access, since only a few proton or oxygen anion conductors are sufficiently conductive at these temperatures. Nevertheless, it is also a very desirable temperature range for the fuel cell technology. The current polymer electrolyte fuel cell efficiently works just below 100 ◦ C. Operation at such a low temperature calls for highly active platinum-based catalysts and hydrogen fuels of very low carbon monoxide content, which lift the price barrier to commercialization. On the other hand, the solid oxide fuel cell, operating at 700–1000 ◦ C, has the advantages of fuel flexibility and high energy efficiency due to its quality waste heat. But it suffers from slow start-up and high cost of interconnect materials, associated with the high operation temperature. A fuel cell, working in the intermediate temperature range, is expected to have the benefits of polymer electrolyte and solid oxide fuel cells, and circumvent their problems [1–3]. Two types of proton conductors are viewed as the potential electrolyte material in this intermediate temperature range. One type of compounds contains one or two positively polarized hydro- ∗ Corresponding author. Tel.: +886 2 27376618; fax: +886 2 27376644. E-mail address: [email protected] (D.-S. Tsai). gen atoms, such as polyatomic oxo-acid salts, including sulfates, selenates, phosphates, and arsenates. After a superprotonic phase transition at 120–300 ◦ C, the bonding on proton being sufficiently weakened, the oxo-acid salt displays a dramatic increase in its pro- ton conductivity [4–7]. Unfortunately, the transition often occurs near its own decomposition temperature, so that the narrow window holds back its prospective electrolyte use. The other type of proton conductors is phosphates and their composites, including NH 4 PO 3 [8–10], tin pyrophosphates [11–13], Ti-, Zr-phosphates [14–16], and phosphosilicate glasses [17]. These compounds exhibit a strong water affinity and high proton conductivity at inter- mediate temperatures. Among them, the 10 mol% indium doped SnP 2 O 7 appears to be an ideal composition, whose conductivity was reported, by Hibino and coworkers, to reach 0.195 S cm −1 at 250 ◦ C in the un-humidified air [18,19]. When a membrane-electrode assembly was prepared with the Sn 0.9 In 0.1 P 2 O 7 electrolyte stacked between two Pt-loaded electrodes, the fuel cell displayed CO- tolerant characteristics [20,21]. Other doped SnP 2 O 7 compositions showed analogous or somewhat less proton conductivity, includ- ing Sn 0.9 Mg 0.1 P 2 O 7 0.11 S cm −1 (375 ◦ C) [11], Sn 0.95 Al 0.05 P 2 O 7 0.19 S cm −1 (300 ◦ C) [22], Sn 0.91 Ga 0.09 P 2 O 7 4.6 × 10 −2 S cm −1 (175 ◦ C) [23], Sn 0.94 Sc 0.06 P 2 O 7 2.76 × 10 −2 S cm −1 (200 ◦ C) [24]. These compositions were also employed as the electrolyte material of hydrogen–air fuel cell, and operated under moist conditions [22–24]. In this work, we synthesize the compounds of cerium pyrophosphate via oxide digestion and calcination, and study their proton conductivities under various humid conditions using 0013-4686/$ – see front matter © 2011 Elsevier Ltd. All rights reserved. doi:10.1016/j.electacta.2011.05.040
-
Upload
independent -
Category
Documents
-
view
1 -
download
0
Transcript of Proton conductors of cerium pyrophosphate for intermediate temperature fuel cell
Pf
Ma
b
a
ARRAA
KCPIEF
1
tiTcotrflalsohmcha
et
0d
Electrochimica Acta 56 (2011) 6654– 6660
Contents lists available at ScienceDirect
Electrochimica Acta
j ourna l ho me pag e: www.elsev ier .com/ locate /e lec tac ta
roton conductors of cerium pyrophosphate for intermediate temperatureuel cell
inh-Vien Lea, Dah-Shyang Tsaia,∗, Chia-Ying Yanga, Wen-Hung Chunga, Hsin-Yi Leeb
Department of Chemical Engineering, National Taiwan University of Science and Technology, 43, Keelung Road, Section 4, Taipei 10607, TaiwanNational Synchrotron Radiation Research Center, 101 Hsin-Ann Road, Hsinchu Science Park, Hsinchu 30076, Taiwan
r t i c l e i n f o
rticle history:eceived 4 April 2011eceived in revised form 11 May 2011ccepted 12 May 2011vailable online 19 May 2011
a b s t r a c t
The crystal structure and proton conductivity of cerium pyrophosphate are investigated to exploreits potential electrolyte applications for intermediate temperature fuel cell. Among the CeP2O7 thinplates, which are sintered at 300–900 ◦C, the 450 ◦C CeP2O7 sample exhibits superior proton conduc-tivity under humidified conditions. Its conductivity, measured with impedance spectroscopy, is higherthan 10−2 S cm−1 in the intermediate temperature range, with a maximum value 3.0 × 10⁻² S cm−1 at
◦
eywords:erium pyrophosphateroton conductormpedance spectroscopylectrolyte180 C. When 10 mol% Mg is doped on the Ce site of CeP2O7, the maximum conductivity is raised to4.0 × 10−2 S cm−1 at 200 ◦C. The Mg doping not only raises the conductivity, but also shifts and widensits temperature window for electrolyte applications. Ce0.9Mg0.1P2O7 is considered a more appropriatecomposition, with conductivity >10−2 S cm−1 between 160 and 280 ◦C. Accordingly, a hydrogen–air cellis built with the Ce0.9Mg0.1P2O7 electrolyte and its performance is measured. The fuel cell generates
m−2 ◦
uel cell electricity up to 122 mA c. Introduction
Studies on the metal pyrophosphates have demonstrated thathey have the potential to serve as the electrolyte for thentermediate-temperature fuel cell that is operated at 150–550 ◦C.his particular operation temperature window has proven diffi-ult for the fuel cell technology to access, since only a few protonr oxygen anion conductors are sufficiently conductive at theseemperatures. Nevertheless, it is also a very desirable temperatureange for the fuel cell technology. The current polymer electrolyteuel cell efficiently works just below 100 ◦C. Operation at such aow temperature calls for highly active platinum-based catalystsnd hydrogen fuels of very low carbon monoxide content, whichift the price barrier to commercialization. On the other hand, theolid oxide fuel cell, operating at 700–1000 ◦C, has the advantagesf fuel flexibility and high energy efficiency due to its quality wasteeat. But it suffers from slow start-up and high cost of interconnectaterials, associated with the high operation temperature. A fuel
ell, working in the intermediate temperature range, is expected toave the benefits of polymer electrolyte and solid oxide fuel cells,nd circumvent their problems [1–3].
Two types of proton conductors are viewed as the potentiallectrolyte material in this intermediate temperature range. Oneype of compounds contains one or two positively polarized hydro-
∗ Corresponding author. Tel.: +886 2 27376618; fax: +886 2 27376644.E-mail address: [email protected] (D.-S. Tsai).
013-4686/$ – see front matter © 2011 Elsevier Ltd. All rights reserved.oi:10.1016/j.electacta.2011.05.040
at 0.33 V using 50% H2 at 240 C.© 2011 Elsevier Ltd. All rights reserved.
gen atoms, such as polyatomic oxo-acid salts, including sulfates,selenates, phosphates, and arsenates. After a superprotonic phasetransition at 120–300 ◦C, the bonding on proton being sufficientlyweakened, the oxo-acid salt displays a dramatic increase in its pro-ton conductivity [4–7]. Unfortunately, the transition often occursnear its own decomposition temperature, so that the narrowwindow holds back its prospective electrolyte use. The other typeof proton conductors is phosphates and their composites, includingNH4PO3 [8–10], tin pyrophosphates [11–13], Ti-, Zr-phosphates[14–16], and phosphosilicate glasses [17]. These compoundsexhibit a strong water affinity and high proton conductivity at inter-mediate temperatures. Among them, the 10 mol% indium dopedSnP2O7 appears to be an ideal composition, whose conductivity wasreported, by Hibino and coworkers, to reach 0.195 S cm−1 at 250 ◦Cin the un-humidified air [18,19]. When a membrane-electrodeassembly was prepared with the Sn0.9In0.1P2O7 electrolyte stackedbetween two Pt-loaded electrodes, the fuel cell displayed CO-tolerant characteristics [20,21]. Other doped SnP2O7 compositionsshowed analogous or somewhat less proton conductivity, includ-ing Sn0.9Mg0.1P2O7 0.11 S cm−1 (375 ◦C) [11], Sn0.95Al0.05P2O70.19 S cm−1 (300 ◦C) [22], Sn0.91Ga0.09P2O7 4.6 × 10⁻² S cm−1
(175 ◦C) [23], Sn0.94Sc0.06P2O7 2.76 × 10⁻² S cm−1 (200 ◦C) [24].These compositions were also employed as the electrolyte materialof hydrogen–air fuel cell, and operated under moist conditions
[22–24].In this work, we synthesize the compounds of ceriumpyrophosphate via oxide digestion and calcination, and studytheir proton conductivities under various humid conditions using
ica Acta 56 (2011) 6654– 6660 6655
iiapc
2
cpWABwdtp3pTc
dM(wppmaosdo
1sswptr(fotabaeidp
spaodC7lwfl
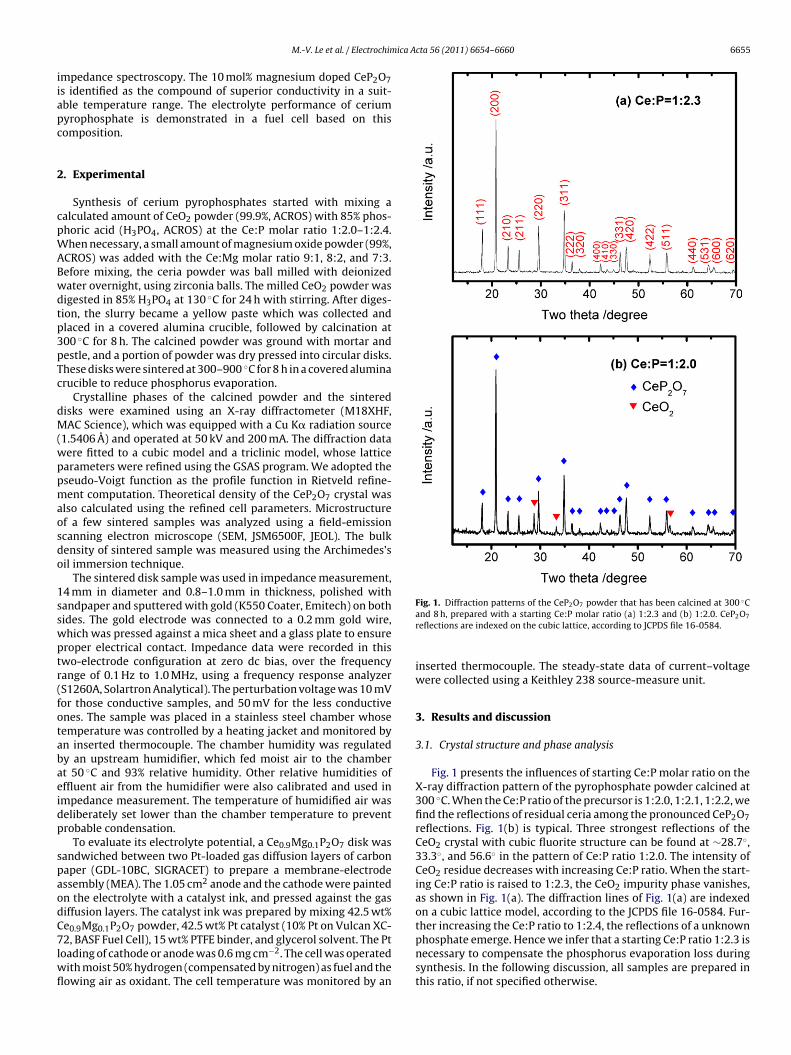
Fig. 1. Diffraction patterns of the CeP2O7 powder that has been calcined at 300 ◦C
M.-V. Le et al. / Electrochim
mpedance spectroscopy. The 10 mol% magnesium doped CeP2O7s identified as the compound of superior conductivity in a suit-ble temperature range. The electrolyte performance of ceriumyrophosphate is demonstrated in a fuel cell based on thisomposition.
. Experimental
Synthesis of cerium pyrophosphates started with mixing aalculated amount of CeO2 powder (99.9%, ACROS) with 85% phos-horic acid (H3PO4, ACROS) at the Ce:P molar ratio 1:2.0–1:2.4.hen necessary, a small amount of magnesium oxide powder (99%,
CROS) was added with the Ce:Mg molar ratio 9:1, 8:2, and 7:3.efore mixing, the ceria powder was ball milled with deionizedater overnight, using zirconia balls. The milled CeO2 powder wasigested in 85% H3PO4 at 130 ◦C for 24 h with stirring. After diges-ion, the slurry became a yellow paste which was collected andlaced in a covered alumina crucible, followed by calcination at00 ◦C for 8 h. The calcined powder was ground with mortar andestle, and a portion of powder was dry pressed into circular disks.hese disks were sintered at 300–900 ◦C for 8 h in a covered aluminarucible to reduce phosphorus evaporation.
Crystalline phases of the calcined powder and the sinteredisks were examined using an X-ray diffractometer (M18XHF,AC Science), which was equipped with a Cu K� radiation source
1.5406 A) and operated at 50 kV and 200 mA. The diffraction dataere fitted to a cubic model and a triclinic model, whose latticearameters were refined using the GSAS program. We adopted theseudo-Voigt function as the profile function in Rietveld refine-ent computation. Theoretical density of the CeP2O7 crystal was
lso calculated using the refined cell parameters. Microstructuref a few sintered samples was analyzed using a field-emissioncanning electron microscope (SEM, JSM6500F, JEOL). The bulkensity of sintered sample was measured using the Archimedes’sil immersion technique.
The sintered disk sample was used in impedance measurement,4 mm in diameter and 0.8–1.0 mm in thickness, polished withandpaper and sputtered with gold (K550 Coater, Emitech) on bothides. The gold electrode was connected to a 0.2 mm gold wire,hich was pressed against a mica sheet and a glass plate to ensureroper electrical contact. Impedance data were recorded in thiswo-electrode configuration at zero dc bias, over the frequencyange of 0.1 Hz to 1.0 MHz, using a frequency response analyzerS1260A, Solartron Analytical). The perturbation voltage was 10 mVor those conductive samples, and 50 mV for the less conductivenes. The sample was placed in a stainless steel chamber whoseemperature was controlled by a heating jacket and monitored byn inserted thermocouple. The chamber humidity was regulatedy an upstream humidifier, which fed moist air to the chambert 50 ◦C and 93% relative humidity. Other relative humidities offfluent air from the humidifier were also calibrated and used inmpedance measurement. The temperature of humidified air waseliberately set lower than the chamber temperature to preventrobable condensation.
To evaluate its electrolyte potential, a Ce0.9Mg0.1P2O7 disk wasandwiched between two Pt-loaded gas diffusion layers of carbonaper (GDL-10BC, SIGRACET) to prepare a membrane-electrodessembly (MEA). The 1.05 cm2 anode and the cathode were paintedn the electrolyte with a catalyst ink, and pressed against the gasiffusion layers. The catalyst ink was prepared by mixing 42.5 wt%e0.9Mg0.1P2O7 powder, 42.5 wt% Pt catalyst (10% Pt on Vulcan XC-
2, BASF Fuel Cell), 15 wt% PTFE binder, and glycerol solvent. The Ptoading of cathode or anode was 0.6 mg cm−2. The cell was operatedith moist 50% hydrogen (compensated by nitrogen) as fuel and theowing air as oxidant. The cell temperature was monitored by an
and 8 h, prepared with a starting Ce:P molar ratio (a) 1:2.3 and (b) 1:2.0. CeP2O7
reflections are indexed on the cubic lattice, according to JCPDS file 16-0584.
inserted thermocouple. The steady-state data of current–voltagewere collected using a Keithley 238 source-measure unit.
3. Results and discussion
3.1. Crystal structure and phase analysis
Fig. 1 presents the influences of starting Ce:P molar ratio on theX-ray diffraction pattern of the pyrophosphate powder calcined at300 ◦C. When the Ce:P ratio of the precursor is 1:2.0, 1:2.1, 1:2.2, wefind the reflections of residual ceria among the pronounced CeP2O7reflections. Fig. 1(b) is typical. Three strongest reflections of theCeO2 crystal with cubic fluorite structure can be found at ∼28.7◦,33.3◦, and 56.6◦ in the pattern of Ce:P ratio 1:2.0. The intensity ofCeO2 residue decreases with increasing Ce:P ratio. When the start-ing Ce:P ratio is raised to 1:2.3, the CeO2 impurity phase vanishes,as shown in Fig. 1(a). The diffraction lines of Fig. 1(a) are indexedon a cubic lattice model, according to the JCPDS file 16-0584. Fur-ther increasing the Ce:P ratio to 1:2.4, the reflections of a unknownphosphate emerge. Hence we infer that a starting Ce:P ratio 1:2.3 is
necessary to compensate the phosphorus evaporation loss duringsynthesis. In the following discussion, all samples are prepared inthis ratio, if not specified otherwise.
6656 M.-V. Le et al. / Electrochimica Acta 56 (2011) 6654– 6660
Fud
dF(6rmialpat[ctfasy�d
t3ri
Humidification is critical to the proton conductivity of ceriumpyrophosphate. It takes a considerable amount of time to humid-ify the sintered disk sufficiently so that its conductivity reaches asteady-state value. Fig. 5 shows a typical impedance reduction with
Table 1Major and impurity compounds present in the cerium pyrophosphate disk sinteredat 300–900 ◦C. A qualitative description of reflection intensity is given to each com-pound, based on the X-ray diffraction results. The CeP2O7 disk was prepared withan initial Ce:P ratio = 1:2.3.
Compound 300 ◦C 450 ◦C 600 ◦C 750 ◦C 900 ◦C
CeP2O7 vs vs vs vs –
ig. 2. Rietveld fit to the X-ray diffraction data of the CeP2O7 disk sintered at 300 ◦C,sing (a) a cubic model and (b) a triclinic model. The two insets show the fittingifferences around 81◦ by the two models.
At room temperature, the CeP2O7 crystal is essentially pseu-ocubic. Two lattice models are used in the Rietveld refinement.ig. 2(a) presents the refinement result using a cubic lattice withPa3) symmetry. The best fit results in a = 8.5647 A, a cell volume28.26 A3, and a theoretical density 3.264 g cm−3. With a weightedesidual factor Rwp 13.63% and goodness-of-fit 3.25, this refine-ent quality appears reasonable, but a model of lower symmetry
s assumed for two reasons. First, a number of reflections at lowerngle display shoulder or splitting, which is not expected for a cubicattice. Second, the phase transition studies on cerium pyrophos-hate and its analogs, such as MP2O7 (M = Zr, Ti, and Ge), indicate
triclinic model is more appropriate at low temperatures, becausehe P–O–P bond angle tends to deviate from its average value 180◦
25–27]. Fig. 2(b) shows the Rietveld refinement result with a tri-linic (P1) model. With the relaxed point symmetry, we diminishhe residual factor Rwp to 12.60% and goodness-of-fit 2.78. The dif-erence between two fittings is contrasted in the insets of Fig. 2(a)nd (b). The peak splitting, around 2� = 81◦, is more accuratelyimulated by the triclinic model. The best fit of triclinic modelields: a = 8.5584 A, b = 8.5597 A, c = 8.5767 A; = 90.17◦, = 90.03◦,
= 89.85◦. The cell volume is 620.25 g cm−3, and the theoreticalensity 3.304 g cm−3.
Fig. 3 presents the influences of sintering temperature on
he crystalline phases of pyrophosphate sample. The pattern of00 ◦C-sintered disk is very clean, as illustrated in Fig. 3(a), alleflections belong to CeP2O7. We found a small amount of CeP3O9n the 450 ◦C-sintered sample, as shown in Fig. 3(b). The 450 ◦CFig. 3. Diffraction patterns of the CeP2O7 disks sintered for 8 h at (a) 300 ◦C, (b)450 ◦C, and (c) 750 ◦C. Reflections of each phase are marked with its individualsymbol and color.
sample also has trace amounts of CePO4 and Ce(PO3)4. The diffrac-tion pattern of 600 ◦C sample is not plotted, since it is analogousto Fig. 3(b). When the sintering temperature is raised to 750 ◦C,the reflections of CeP3O9 impurity become more intense, so dothe CePO4 reflections. But the major phase is still CeP2O7. As thesintering temperature is further raised to 900 ◦C, the reflectionsof CeP3O9 and CePO4 predominate the diffraction pattern, sinceCeP2O7 completely decomposes.
A qualitative summary of the identified compounds between300 and 900 ◦C is given in Table 1, which suggests the CeP2O7 diskdecomposes near 750 ◦C. Our result is similar to the report of Whiteet al., who stated CeP2O7 decomposed into CeP3O9 and CePO4 afterprolonged heating at 725 ◦C [26]. This decomposition temperatureis considerably higher than that reported by Masui et al., who statedthe CeP2O7 powder decomposed between 340 and 389 ◦C based onthe exothermic events measured in differential thermal analysis[28].
The bulk density of cerium pyrophosphate disks sintered at300 and 450 ◦C measures 2.94 g cm−3, hence, the relative densityof cerium pyrophosphate disk is ∼89.0%. The relative density ofCe0.9Mg0.1P2O7 is slightly less, ∼88.4%. Fig. 4 shows the top-viewimages of these two compositions, indicating a number of micron-sized pores dispersed in small cubic grains.
3.2. Impedance spectra and proton conductivities
CeP3O9 – vw w w sCePO4 – vw vw vw sCe(PO3)4 – vw vw vw –
vs, very strong; s, strong; w, weak; vw, very weak.
M.-V. Le et al. / Electrochimica Acta 56 (2011) 6654– 6660 6657
FC
r1BaittIis
Ft0
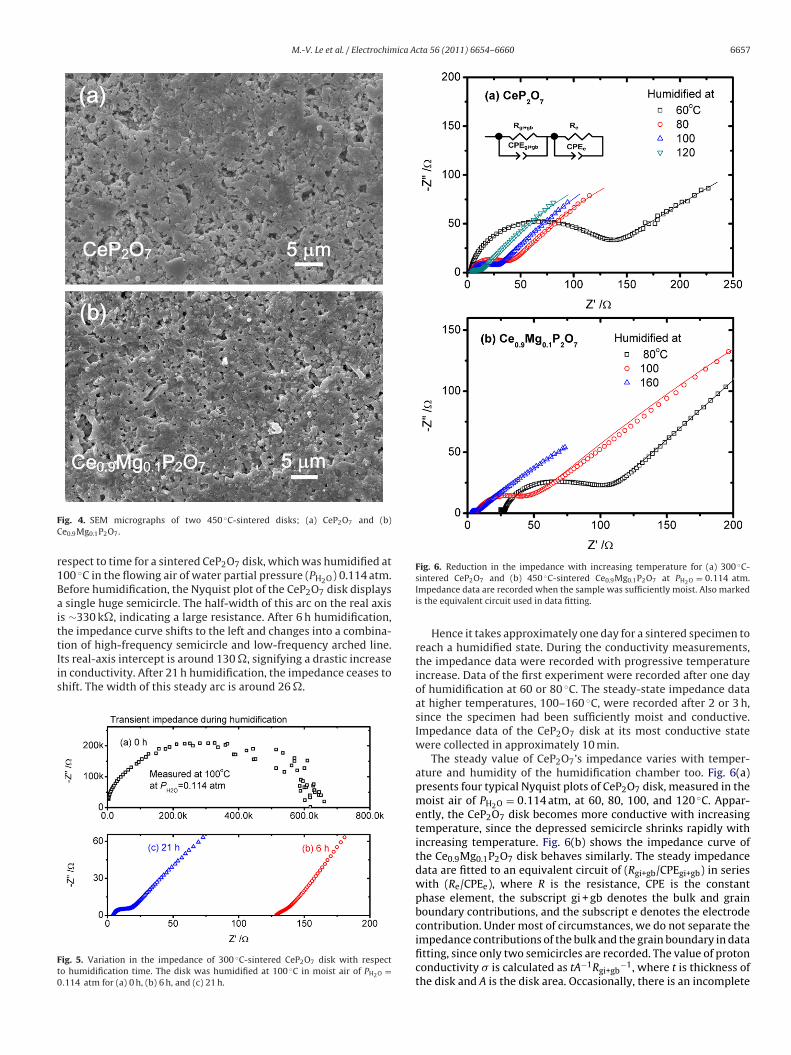
Fig. 6. Reduction in the impedance with increasing temperature for (a) 300 ◦C-
ig. 4. SEM micrographs of two 450 ◦C-sintered disks; (a) CeP2O7 and (b)e0.9Mg0.1P2O7.
espect to time for a sintered CeP2O7 disk, which was humidified at00 ◦C in the flowing air of water partial pressure (PH2O) 0.114 atm.efore humidification, the Nyquist plot of the CeP2O7 disk displays
single huge semicircle. The half-width of this arc on the real axiss ∼330 k�, indicating a large resistance. After 6 h humidification,he impedance curve shifts to the left and changes into a combina-
ion of high-frequency semicircle and low-frequency arched line.ts real-axis intercept is around 130 �, signifying a drastic increasen conductivity. After 21 h humidification, the impedance ceases tohift. The width of this steady arc is around 26 �.ig. 5. Variation in the impedance of 300 ◦C-sintered CeP2O7 disk with respecto humidification time. The disk was humidified at 100 ◦C in moist air of PH2O =.114 atm for (a) 0 h, (b) 6 h, and (c) 21 h.
sintered CeP2O7 and (b) 450 ◦C-sintered Ce0.9Mg0.1P2O7 at PH2O = 0.114 atm.Impedance data are recorded when the sample was sufficiently moist. Also markedis the equivalent circuit used in data fitting.
Hence it takes approximately one day for a sintered specimen toreach a humidified state. During the conductivity measurements,the impedance data were recorded with progressive temperatureincrease. Data of the first experiment were recorded after one dayof humidification at 60 or 80 ◦C. The steady-state impedance dataat higher temperatures, 100–160 ◦C, were recorded after 2 or 3 h,since the specimen had been sufficiently moist and conductive.Impedance data of the CeP2O7 disk at its most conductive statewere collected in approximately 10 min.
The steady value of CeP2O7’s impedance varies with temper-ature and humidity of the humidification chamber too. Fig. 6(a)presents four typical Nyquist plots of CeP2O7 disk, measured in themoist air of PH2O = 0.114 atm, at 60, 80, 100, and 120 ◦C. Appar-ently, the CeP2O7 disk becomes more conductive with increasingtemperature, since the depressed semicircle shrinks rapidly withincreasing temperature. Fig. 6(b) shows the impedance curve ofthe Ce0.9Mg0.1P2O7 disk behaves similarly. The steady impedancedata are fitted to an equivalent circuit of (Rgi+gb/CPEgi+gb) in serieswith (Re/CPEe), where R is the resistance, CPE is the constantphase element, the subscript gi + gb denotes the bulk and grainboundary contributions, and the subscript e denotes the electrodecontribution. Under most of circumstances, we do not separate the
impedance contributions of the bulk and the grain boundary in datafitting, since only two semicircles are recorded. The value of protonconductivity � is calculated as tA−1Rgi+gb−1, where t is thickness ofthe disk and A is the disk area. Occasionally, there is an incomplete
6658 M.-V. Le et al. / Electrochimica Acta 56 (2011) 6654– 6660
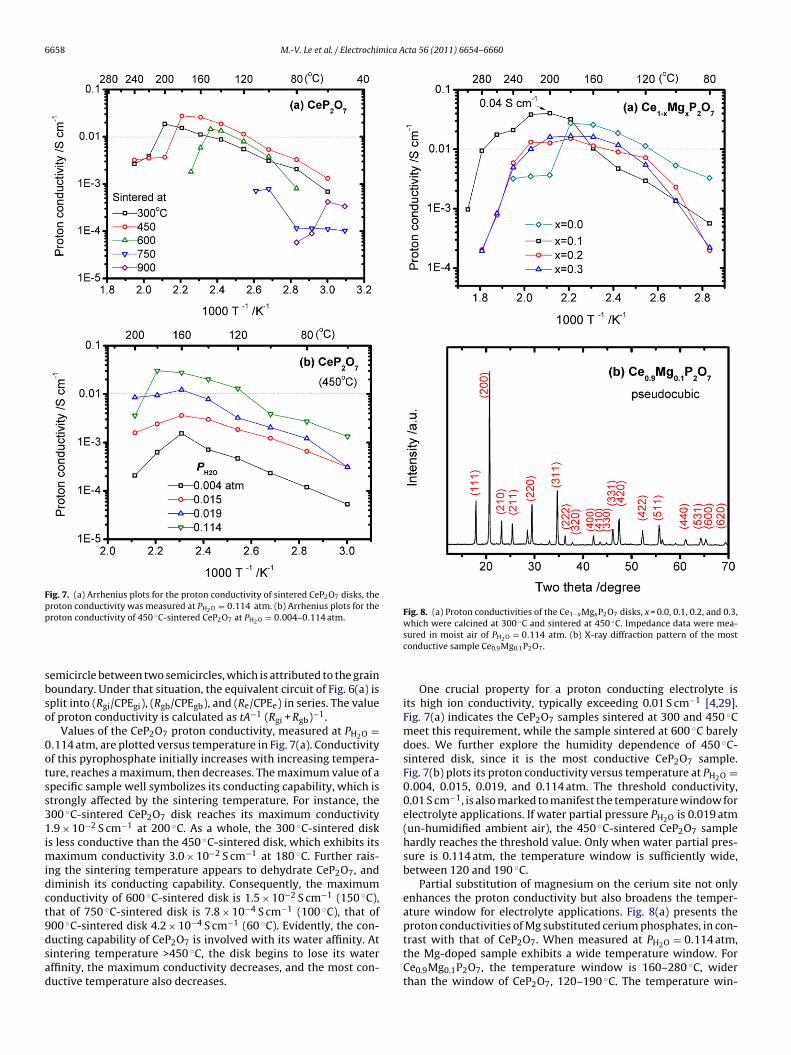
Fig. 7. (a) Arrhenius plots for the proton conductivity of sintered CeP2O7 disks, theproton conductivity was measured at PH2O = 0.114 atm. (b) Arrhenius plots for thep ◦
sbso
0otss31imidct9dsad
Fig. 8. (a) Proton conductivities of the Ce1−xMgxP2O7 disks, x = 0.0, 0.1, 0.2, and 0.3,which were calcined at 300 ◦C and sintered at 450 ◦C. Impedance data were mea-
the Mg-doped sample exhibits a wide temperature window. For
roton conductivity of 450 C-sintered CeP2O7 at PH2O = 0.004–0.114 atm.
emicircle between two semicircles, which is attributed to the grainoundary. Under that situation, the equivalent circuit of Fig. 6(a) isplit into (Rgi/CPEgi), (Rgb/CPEgb), and (Re/CPEe) in series. The valuef proton conductivity is calculated as tA−1 (Rgi + Rgb)−1.
Values of the CeP2O7 proton conductivity, measured at PH2O =.114 atm, are plotted versus temperature in Fig. 7(a). Conductivityf this pyrophosphate initially increases with increasing tempera-ure, reaches a maximum, then decreases. The maximum value of apecific sample well symbolizes its conducting capability, which istrongly affected by the sintering temperature. For instance, the00 ◦C-sintered CeP2O7 disk reaches its maximum conductivity.9 × 10−2 S cm−1 at 200 ◦C. As a whole, the 300 ◦C-sintered disk
s less conductive than the 450 ◦C-sintered disk, which exhibits itsaximum conductivity 3.0 × 10⁻² S cm−1 at 180 ◦C. Further rais-
ng the sintering temperature appears to dehydrate CeP2O7, andiminish its conducting capability. Consequently, the maximumonductivity of 600 ◦C-sintered disk is 1.5 × 10⁻² S cm−1 (150 ◦C),hat of 750 ◦C-sintered disk is 7.8 × 10⁻⁴ S cm−1 (100 ◦C), that of00 ◦C-sintered disk 4.2 × 10⁻⁴ S cm−1 (60 ◦C). Evidently, the con-ucting capability of CeP2O7 is involved with its water affinity. Atintering temperature >450 ◦C, the disk begins to lose its water
ffinity, the maximum conductivity decreases, and the most con-uctive temperature also decreases.sured in moist air of PH2O = 0.114 atm. (b) X-ray diffraction pattern of the mostconductive sample Ce0.9Mg0.1P2O7.
One crucial property for a proton conducting electrolyte isits high ion conductivity, typically exceeding 0.01 S cm−1 [4,29].Fig. 7(a) indicates the CeP2O7 samples sintered at 300 and 450 ◦Cmeet this requirement, while the sample sintered at 600 ◦C barelydoes. We further explore the humidity dependence of 450 ◦C-sintered disk, since it is the most conductive CeP2O7 sample.Fig. 7(b) plots its proton conductivity versus temperature at PH2O =0.004, 0.015, 0.019, and 0.114 atm. The threshold conductivity,0.01 S cm−1, is also marked to manifest the temperature window forelectrolyte applications. If water partial pressure PH2O is 0.019 atm(un-humidified ambient air), the 450 ◦C-sintered CeP2O7 samplehardly reaches the threshold value. Only when water partial pres-sure is 0.114 atm, the temperature window is sufficiently wide,between 120 and 190 ◦C.
Partial substitution of magnesium on the cerium site not onlyenhances the proton conductivity but also broadens the temper-ature window for electrolyte applications. Fig. 8(a) presents theproton conductivities of Mg substituted cerium phosphates, in con-trast with that of CeP2O7. When measured at PH2O = 0.114 atm,
Ce0.9Mg0.1P2O7, the temperature window is 160–280 ◦C, widerthan the window of CeP2O7, 120–190 ◦C. The temperature win-
M.-V. Le et al. / Electrochimica A
Fdc
d14aCtcc
3
atCocthTpd0prhtivd
act
[
[[[[
[[
[
[
[
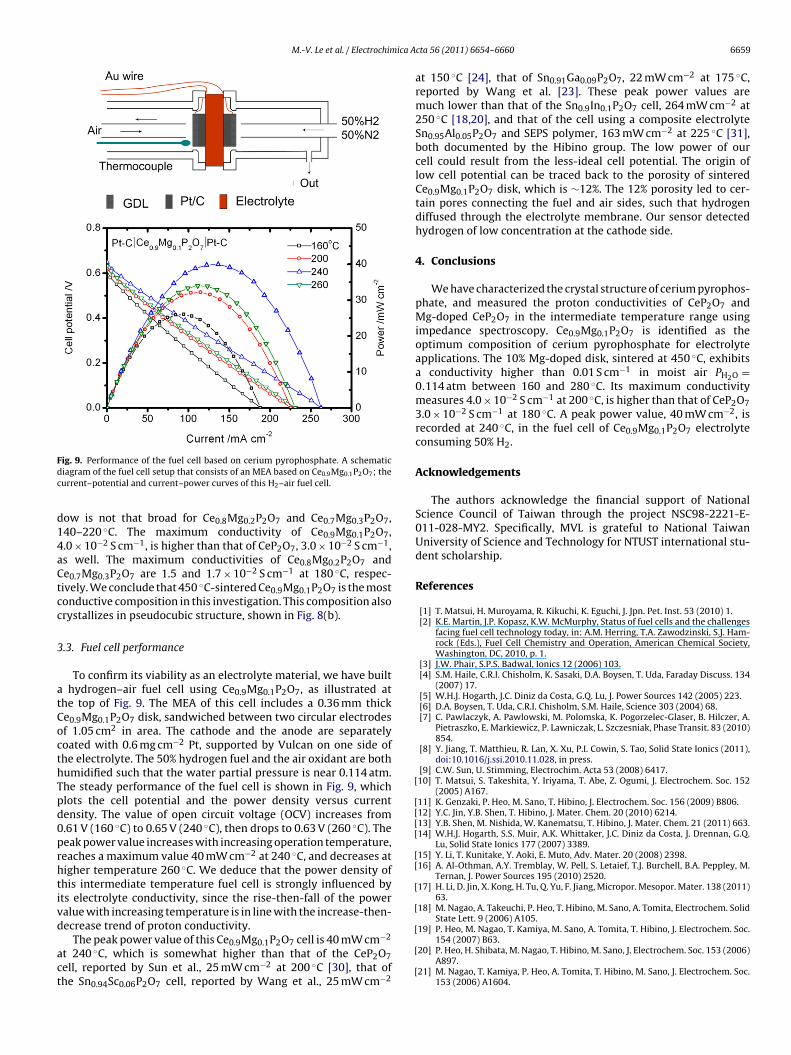
ig. 9. Performance of the fuel cell based on cerium pyrophosphate. A schematiciagram of the fuel cell setup that consists of an MEA based on Ce0.9Mg0.1P2O7; theurrent–potential and current–power curves of this H2–air fuel cell.
ow is not that broad for Ce0.8Mg0.2P2O7 and Ce0.7Mg0.3P2O7,40–220 ◦C. The maximum conductivity of Ce0.9Mg0.1P2O7,.0 × 10−2 S cm−1, is higher than that of CeP2O7, 3.0 × 10⁻² S cm−1,s well. The maximum conductivities of Ce0.8Mg0.2P2O7 ande0.7Mg0.3P2O7 are 1.5 and 1.7 × 10⁻² S cm−1 at 180 ◦C, respec-ively. We conclude that 450 ◦C-sintered Ce0.9Mg0.1P2O7 is the mostonductive composition in this investigation. This composition alsorystallizes in pseudocubic structure, shown in Fig. 8(b).
.3. Fuel cell performance
To confirm its viability as an electrolyte material, we have built hydrogen–air fuel cell using Ce0.9Mg0.1P2O7, as illustrated athe top of Fig. 9. The MEA of this cell includes a 0.36 mm thicke0.9Mg0.1P2O7 disk, sandwiched between two circular electrodesf 1.05 cm2 in area. The cathode and the anode are separatelyoated with 0.6 mg cm−2 Pt, supported by Vulcan on one side ofhe electrolyte. The 50% hydrogen fuel and the air oxidant are bothumidified such that the water partial pressure is near 0.114 atm.he steady performance of the fuel cell is shown in Fig. 9, whichlots the cell potential and the power density versus currentensity. The value of open circuit voltage (OCV) increases from.61 V (160 ◦C) to 0.65 V (240 ◦C), then drops to 0.63 V (260 ◦C). Theeak power value increases with increasing operation temperature,eaches a maximum value 40 mW cm−2 at 240 ◦C, and decreases atigher temperature 260 ◦C. We deduce that the power density ofhis intermediate temperature fuel cell is strongly influenced byts electrolyte conductivity, since the rise-then-fall of the poweralue with increasing temperature is in line with the increase-then-ecrease trend of proton conductivity.
−2
The peak power value of this Ce0.9Mg0.1P2O7 cell is 40 mW cmt 240 ◦C, which is somewhat higher than that of the CeP2O7ell, reported by Sun et al., 25 mW cm−2 at 200 ◦C [30], that ofhe Sn0.94Sc0.06P2O7 cell, reported by Wang et al., 25 mW cm−2[
[
cta 56 (2011) 6654– 6660 6659
at 150 ◦C [24], that of Sn0.91Ga0.09P2O7, 22 mW cm−2 at 175 ◦C,reported by Wang et al. [23]. These peak power values aremuch lower than that of the Sn0.9In0.1P2O7 cell, 264 mW cm−2 at250 ◦C [18,20], and that of the cell using a composite electrolyteSn0.95Al0.05P2O7 and SEPS polymer, 163 mW cm−2 at 225 ◦C [31],both documented by the Hibino group. The low power of ourcell could result from the less-ideal cell potential. The origin oflow cell potential can be traced back to the porosity of sinteredCe0.9Mg0.1P2O7 disk, which is ∼12%. The 12% porosity led to cer-tain pores connecting the fuel and air sides, such that hydrogendiffused through the electrolyte membrane. Our sensor detectedhydrogen of low concentration at the cathode side.
4. Conclusions
We have characterized the crystal structure of cerium pyrophos-phate, and measured the proton conductivities of CeP2O7 andMg-doped CeP2O7 in the intermediate temperature range usingimpedance spectroscopy. Ce0.9Mg0.1P2O7 is identified as theoptimum composition of cerium pyrophosphate for electrolyteapplications. The 10% Mg-doped disk, sintered at 450 ◦C, exhibitsa conductivity higher than 0.01 S cm−1 in moist air PH2O =0.114 atm between 160 and 280 ◦C. Its maximum conductivitymeasures 4.0 × 10⁻² S cm−1 at 200 ◦C, is higher than that of CeP2O73.0 × 10−2 S cm−1 at 180 ◦C. A peak power value, 40 mW cm−2, isrecorded at 240 ◦C, in the fuel cell of Ce0.9Mg0.1P2O7 electrolyteconsuming 50% H2.
Acknowledgements
The authors acknowledge the financial support of NationalScience Council of Taiwan through the project NSC98-2221-E-011-028-MY2. Specifically, MVL is grateful to National TaiwanUniversity of Science and Technology for NTUST international stu-dent scholarship.
References
[1] T. Matsui, H. Muroyama, R. Kikuchi, K. Eguchi, J. Jpn. Pet. Inst. 53 (2010) 1.[2] K.E. Martin, J.P. Kopasz, K.W. McMurphy, Status of fuel cells and the challenges
facing fuel cell technology today, in: A.M. Herring, T.A. Zawodzinski, S.J. Ham-rock (Eds.), Fuel Cell Chemistry and Operation, American Chemical Society,Washington, DC, 2010, p. 1.
[3] J.W. Phair, S.P.S. Badwal, Ionics 12 (2006) 103.[4] S.M. Haile, C.R.I. Chisholm, K. Sasaki, D.A. Boysen, T. Uda, Faraday Discuss. 134
(2007) 17.[5] W.H.J. Hogarth, J.C. Diniz da Costa, G.Q. Lu, J. Power Sources 142 (2005) 223.[6] D.A. Boysen, T. Uda, C.R.I. Chisholm, S.M. Haile, Science 303 (2004) 68.[7] C. Pawlaczyk, A. Pawlowski, M. Polomska, K. Pogorzelec-Glaser, B. Hilczer, A.
Pietraszko, E. Markiewicz, P. Lawniczak, L. Szczesniak, Phase Transit. 83 (2010)854.
[8] Y. Jiang, T. Matthieu, R. Lan, X. Xu, P.I. Cowin, S. Tao, Solid State Ionics (2011),doi:10.1016/j.ssi.2010.11.028, in press.
[9] C.W. Sun, U. Stimming, Electrochim. Acta 53 (2008) 6417.10] T. Matsui, S. Takeshita, Y. Iriyama, T. Abe, Z. Ogumi, J. Electrochem. Soc. 152
(2005) A167.11] K. Genzaki, P. Heo, M. Sano, T. Hibino, J. Electrochem. Soc. 156 (2009) B806.12] Y.C. Jin, Y.B. Shen, T. Hibino, J. Mater. Chem. 20 (2010) 6214.13] Y.B. Shen, M. Nishida, W. Kanematsu, T. Hibino, J. Mater. Chem. 21 (2011) 663.14] W.H.J. Hogarth, S.S. Muir, A.K. Whittaker, J.C. Diniz da Costa, J. Drennan, G.Q.
Lu, Solid State Ionics 177 (2007) 3389.15] Y. Li, T. Kunitake, Y. Aoki, E. Muto, Adv. Mater. 20 (2008) 2398.16] A. Al-Othman, A.Y. Tremblay, W. Pell, S. Letaief, T.J. Burchell, B.A. Peppley, M.
Ternan, J. Power Sources 195 (2010) 2520.17] H. Li, D. Jin, X. Kong, H. Tu, Q. Yu, F. Jiang, Micropor. Mesopor. Mater. 138 (2011)
63.18] M. Nagao, A. Takeuchi, P. Heo, T. Hibino, M. Sano, A. Tomita, Electrochem. Solid
State Lett. 9 (2006) A105.19] P. Heo, M. Nagao, T. Kamiya, M. Sano, A. Tomita, T. Hibino, J. Electrochem. Soc.
154 (2007) B63.20] P. Heo, H. Shibata, M. Nagao, T. Hibino, M. Sano, J. Electrochem. Soc. 153 (2006)
A897.21] M. Nagao, T. Kamiya, P. Heo, A. Tomita, T. Hibino, M. Sano, J. Electrochem. Soc.
153 (2006) A1604.

6 ica A
[
[[
[
[
[
[364.
660 M.-V. Le et al. / Electrochim
22] A. Tomita, N. Kajiyama, T. Kamiya, M. Nagao, T. Hibino, J. Electrochem. Soc. 154(2007) B1265.
23] H. Wang, J. Liu, W. Wang, G. Ma, J. Power Sources 195 (2010) 5596.24] H. Wang, H. Zhang, G. Xiao, F. Zhang, T. Yu, J. Xiao, G. Ma, J. Power Sources 196
(2011) 683.25] H. Birkedal, A.M.K. Andersen, A. Arakcheeva, G. Chapuls, P. Norby, P. Pattison,
Inorg. Chem. 45 (2006) 4346.26] K.M. White, P.L. Lee, P.J. Chupas, K.W. Chapman, E.A. Payzant, A.C. Jupe, W.A.
Bassett, C.S. Zha, A.P. Wilkinson, Chem. Mater. 20 (2008) 3728.
[[
[
cta 56 (2011) 6654– 6660
27] J. Sanz, J.E. Iglesias, J. Soria, E.R. Losilla, A.G. Aranda, S. Bruque, Chem. Mater. 9(1997) 996.
28] T. Masui, H. Hirai, N. Imanaka, G. Adachi, Phys. Status Solidi A 198 (2003)
29] Y.C. Jin, B. Lee, T. Hibino, J. Jpn. Pet. Inst. 53 (2010) 12.30] X. Sun, S. Wang, Z. Wang, X. Ye, T. Wen, F. Huang, Solid State Ionics 179 (2008)
1138.31] Y.C. Jin, T. Hibino, Electrochim. Acta 55 (2010) 8371.