Chapter 20 Chemical Bonding of Mobile Cations in Superionic Conductors
42
CHEMICAL BONDING OF MOBILE CATIONS IN SUPERIONIC CONDUCTORS Y. Kowada , M. Tatsumisago, T. Minami, and H. Adachi Hyogo University of Teacher Education, Hyogo 673-1494, Japan Department of Applied Chemistry, Osaka Prefecture University, Sakai 599-8531, Japan Osaka Prefecture University, Sakai 599-8531, Japan Fukui Institute for Fundamental Chemistry, Kyoto University, Kyoto 606-8103, Japan e-mail address : [email protected] Abstract Electronic states of monovalent ions in superionic conductors such as Li 3 N, and the lithium sulfide superionic conducting glasses, were calculated by the DV-Xα cluster method. The movements of the cations were simulated by several model clusters with different positions of the moving cation. The net charge of the moving cation and the total bond overlap population between the moving cation and the other ions were used for discussion of chemical bonding of the moving cation. In the Li 3 N crystal, the total bond overlap population of the moving cation along the conduction path changed smaller than those of the other paths. On the other hand, the changes of the net charges of the moving cations were similar in any paths. Furthermore the relationship between ionic conductivity and the differential total bond overlap population (DBOP) was discussed in the lithium sulfide superionic conducting glasses. The cluster models were constructed by the coordination number reported by experimental methods and the bond length estimated from the ionic radii of each ion. Especially the relationship between ionic conductivity and the differential bond overlap population were discussed for the sulfide-based lithium ion conducting glasses in the systems Li 2 S-SiS 2 -Al 2 S 3 and Li 2 S-SiS 2 -P 2 S 5 . In these glasses, the DBOP with the
-
Upload
independent -
Category
Documents
-
view
0 -
download
0
Transcript of Chapter 20 Chemical Bonding of Mobile Cations in Superionic Conductors

CHEMICAL BONDING OF MOBILE CATIONS IN SUPERIONIC
CONDUCTORS
Y. Kowada, M. Tatsumisago, T. Minami, and H. Adachi
Hyogo University of Teacher Education, Hyogo 673-1494, Japan
Department of Applied Chemistry, Osaka Prefecture University,
Sakai 599-8531, Japan
Osaka Prefecture University, Sakai 599-8531, Japan
Fukui Institute for Fundamental Chemistry, Kyoto University,
Kyoto 606-8103, Japan
e-mail address : [email protected]
Abstract Electronic states of monovalent ions in superionic conductors such as Li3N,
and the lithium sulfide superionic conducting glasses, were calculated by the
DV-Xα cluster method. The movements of the cations were simulated by several model clusters with different positions of the moving cation. The
net charge of the moving cation and the total bond overlap population
between the moving cation and the other ions were used for discussion of
chemical bonding of the moving cation. In the Li3N crystal, the total bond
overlap population of the moving cation along the conduction path changed
smaller than those of the other paths. On the other hand, the changes of the
net charges of the moving cations were similar in any paths. Furthermore
the relationship between ionic conductivity and the differential total bond
overlap population (DBOP) was discussed in the lithium sulfide superionic
conducting glasses. The cluster models were constructed by the
coordination number reported by experimental methods and the bond length
estimated from the ionic radii of each ion. Especially the relationship
between ionic conductivity and the differential bond overlap population were
discussed for the sulfide-based lithium ion conducting glasses in the systems
Li2S-SiS2-Al2S3 and Li2S-SiS2-P2S5. In these glasses, the DBOP with the

movement of the lithium ion had good negative correlations with the ionic
conductivities and positive correlations with the activation energies obtained
by the experimental measurements. In any cases, the smaller change of the
total bond overlap population of the moving cations played an important role
of the fast ion movement in the superionic conducting glasses, rather than the
change of the net charge of the moving cations. This bonding state of the
moving cations is one of the characteristics of the electronic state in
superionic conductors.
1. Introduction
Recent 10 years we have investigated the electronic state of the ion movement in
the solid state materials. [1-6] In the SiO2-MxOy (MxOy = P2O5, TiO2, and ZrO2) gel
films, the bonding state between the Na ions and the oxide ions were discussed. In
this case the covalent bonding between the Na and the oxide ions were the reason of the
movement of the Na ions. In the Li2S-SiS2-Li4SiO4 oxysulfide glasses, the Li ion
conductivity of the rapidly quenched glasses was discussed from the viewpoint of the
chemical bonding of the moving ions. The addition of the Li4SiO4 made pyro
oxysulfide groups with the bridging oxygen and this unit had the same covalent
interaction with the surrounding Li ions, which was an origin of the high ionic
conductivity of the oxysulfide glasses. We have also looked into the electronic state

of the Ag ions in AgI-based superionic conducting materials. In this case we have
proposed a method to simulate the movement of the ions in the molecular orbital
calculations and discussed the change of the bonding state of the moving Ag ions.
The result showed that the moving Ag ions had a very small change of the covalent
bonding with movement through the conduction path rather than ionic interactions.
This small change of the covalent bonding was one of the origins of the fast movement
of the Ag ions in the AgI-based superionic conductors.
In these studies, we have paid attentions on the bonding state of the moving ions
from the viewpoints of the interactions named covalency and ionicity between the
moving ions and the surrounding ions. Thus the covalent bonding of the moving ions
should support an important part of the ion movement in the solid-state materials. In
the present study the electronic states of the Li3N crystal and sulfide-based superionic
(or Li ion) conducting glasses were studied, in order to analyze the interaction of the
moving ions in superionic conducting materials. These materials are the typical Li
ion conductors and have high ionic conductivities. Furthermore the Li, the N, and the
S ions usually have covalent interactions in the solid state materials. We can expect

that there are some relationship between the high ionic conductivity and the covalent
interactions of the moving cations in these systems.
2. Li3N crystal
There are several studies about the high Li ion conductivity of Li3N crystal by
experimental measurements and theoretical calculations [7-10]. Several experimental
studies reported that the Li3N crystal contained H+ ion impurities in interstitial positions
and they make a certain concentration of the Li ion vacancies. These vacancies are
yield on the planes, which contains both Li and N ions, called Li2N plane. It was
reported that the activation energy of the movement of the Li ion on Li2N planes was
0.004 eV [10]. In the Li3N crystal there is the other kind of the Li ions on the planes
containing only the Li ions, which connect between the Li2N planes. This kind of the
Li ions hardly moves compared with that on the Li2N plane. In addition to this, the
Li3N crystal has the anisotropicity in the ionic conductivity and the Li ion conductivity
along the c axis is much smaller than those of the a and b axes.
Thus the Li ion can move easily in the Li2N plane and hardly move in the Li plane.

This is something strange from the viewpoint of the chemical bonding. In the Li2N
plane, the moving Li ions might have strong interaction with the N ions compared with
those on the Li plane. Generally the larger interaction between the Li and the N ions
seems to impose constraints on the fast movement of the Li ion. The experimental
results, however, suggest that the fast movement of the Li ions in the Li3N crystal is not
dependent on the smaller interaction between the Li and the N ions. The chemical
bonding of the Li ion should contribute to the fast movement of the Li ion in Li3N
crystal.
2.1. Calculation method
The DV-Xα cluster method [11], which is one of the first principle molecular
orbital calculation methods, was used for the calculation of the electronic state of the
Li3N crystal. In this method, Slater's exchange potential was used, [12]
VXC( r↑) = -3α
34π
ρ↑( r)⎡
⎣ ⎢ ⎢
⎤
⎦ ⎥ ⎥
13
(1)
where ρ is the electron density and α is a parameter. There are many studies in

which α = 0.7 is suitable for all elements [13, 14]. Then we have also adopted this
value through this work.
The numerical basis functions were used in the method. As the results, H and S
matrices were evaluated by the weighted sum of the each value on the sample points
distributed in the three-dimensional space.
Sij = ω(rk )φi*(rk )φi(rk )
k∑ (2)
Hij = ω(rk )φi*(rk )h(rk )φi(rk )
k∑ (3)
where φi is the basis functions, h is the Hamiltonian, ω is the weight of each sample
point.
We have obtained bond overlap population between the ions and net charge of the
ions by the Mulliken population analysis in order to discuss the bonding state of the Li
and N ions.
Several model clusters were constructed by the crystal structure of the Li3N crystal.
[8] This crystal is assigned to the space group of P6/mmm and the lattice constants a

and c are 3.65 and 3.88 Å, respectively. The schematic diagrams of the model
clusters are shown in Fig. 1. The Li3N crystal has layer structure of two kinds of
plane structures, the Li2N and the Li planes. On the Li2N plane, there are Li and N
ions that make hexagons. On the Li plane there are only Li ions that are bonding
with the N ions on the Li2N planes and are bridging between two Li2N planes. The
conduction path of the Li ions reported by several experimental studies is included in
the Li2N plane. Fig. 1(i) shows the model clusters for the conduction path in Li2N
plane. In this model, one Li ion was removed from the Li2N plane so that the
neighboring Li ion can move to the vacancy. The movement of the Li ion was
simulated by using several model clusters with the different positions of the Li ion
along the estimated conduction path, since it is fundamentally very difficult to
manipulate the movement of the atoms and ions in the molecular orbital calculations.
This method was already reported and was really very useful for the simulations of the
movement of the Ag ions in the α-AgI crystal.[4] Fig. 1(ii) shows the model cluster
for the movement of the Li ions on the Li plane. In this model cluster one Li ion was
moved to the neighboring vacancy of Li site. This path is not a suitable path for the

Li ion in the Li3N crystal reported by several experimental studies.
The Li3N crystal has anisotropy of the Li ion conductivity and the conductivity
along the c axis is much smaller than those in the a and b axes. Then we have used
model clusters of the movement of the Li ion toward the c axis shown in Fig. 1(iii) and
(iv) for the comparison of the movement toward the different directions. Since there
are several possibilities of the conduction path toward c axis, we have adopted two
possible paths for the model clusters.
2.2. Results and Discussion
Fig. 2 shows net charge of the moving Li ions in clusters (i)-(iv). In this figure,
the abscissa shows the relative position of the moving Li ion. Since the length of the
conduction path (i)-(iv) are different, the value of 0 means the initial position and 1
means the final position of the moving Li ion so that the position of the moving lithium
ion in each path was normalized.
In the cluster (i), shown as closed circles, the net charge is 0.41 at initial position.
It changes little with the movement of the Li ion and becomes 0.43 at the final position.

The charge of the Li ion is almost the same and no obvious changes were observed in
the cluster (ii), shown as closed squares. In the case of the α-AgI the net charge of
the moving Ag ion was changed and had a maximum at the middle position of the
conduction path, called a saddle point. In the Li3N crystal, however, there is no
obvious change of the net charge of the Li ion during the movement. In the cases of
the clusters (iii) and (iv), shown as closed triangles and diamonds, the net charge of the
Li ion at initial position is 0.28, which is clearly smaller than those in the clusters (i)
and (ii). The net charge of the Li ion was increased at x = 0.25 and was almost
constant until x = 0.75. At the final position the net charge becomes smaller again.
This result might be caused by the structures of the model clusters. In the clusters
(iii) and (iv), the initial and final positions are located on the surface of the model
clusters. Though the surface atoms usually have larger electron density than the inner
atoms, the net charges of the Li ions became smaller at the initial and the final positions
in the clusters (iii) and (iv). There were some difficulties of the calculations of
the conduction path along with the c axis because the cluster size became two times
larger than the clusters (i) and (ii) if all the Li ions around the conduction path through

the c axis were located inside of the model clusters. However, the net charge at the
positions inside of the clusters, from x = 0.25 to x = 0.75, shows similar values as those
observed in the cluster (i) and (ii).
Thus the net charges of the moving Li ions in the different paths are
very similar each other and we can conclude that there is no obvious change
of the ionic interaction of the moving Li ion in the experimentally reported
conduction path compared with the other non-conduction paths.
Fig. 3 shows the total bond overlap populations (TBOP) of the moving Li ion in the
model clusters shown in Fig. 1. The TBOP means the summation of all the bond
overlap populations between the moving Li ion and the surrounding ions, which shows
the covalency of the bonding state of the moving Li ions.
In the cluster (i), which is the model of the Li2N plane, TBOP is 0.82 at the initial
position and is slightly decreased with the movement of the Li ion. There is a
minimum of TBOP at x = 0.5. The TBOP is increased after x=0.5 and is 0.79 at the
final position. Basically the similar change is observed in the TBOP of the moving
Li ion on the Li plane. In this plane the TBOP is 0.80 at the initial position and is

decreased with the movement of the Li ion. A minimum of TBOP is observed at x =
0.5 and finally the TBOP becomes 0.78. At the initial and the final positions the
TBOP of the moving Li ion on the Li2N plane are almost the same as those on the Li
plane. However, at the middle position, x = 0.5, the TBOP on the Li2N plane is
almost 0.1 larger than that on the Li plane. As the result, the difference between the
maximum and the minimum of the TBOP of the Li ion on the Li2N plane is 0.077,
which is much smaller than that on the Li plane, 0.13. This smaller change of the
TBOP through the path is a characteristic of the bonding nature of the moving Li ion on
the Li2N plane.
In the case of the movement of the Li ion toward the c axis, the different changes
were observed. In the model cluster (iii) for the c axis movement, the TBOP of the
moving Li ion is 0.95 at the initial position. The TBOP of the moving Li ion is
decreased largely with the movement and becomes minimum, 0.72, at x = 0.5. The
change of the TBOP with the movement of the Li ion through the path toward the c axis
is about 0.2, which is much larger than those in the clusters (i) and (ii). The same
tendency was observed in the cluster (iv). The initial TBOP of the Li ion is 0.94 and

the minimum is 0.70 at x=0.75. The difference between the maximum and the
minimum is 0.35. In the clusters (iii) and (iv) the initial and final position of the
moving Li ion are located on the surface of the clusters, since the cluster size became
too large to calculate the electronic state of the Li ions if we have taken the extended
model clusters for the c axis movement of the Li ions. In general the surface ions
have relatively large interaction with the surrounding ions. This “surface effect” is
the reason of the large change of the covalency in these model clusters. However,
since the net charge of the moving Li ion is almost the same as those on the Li and Li2N
plane in the positions in the range from x = 0.25 to 0.75 as shown in Fig. 2, the result
suggests that surface effect of the bonding state of the moving Li ion could be neglect in
these positions.
In the case of the Li3N crystal, the TBOP of the Li ion on the Li2N plane changed
smaller than those in the other paths. This result suggests that the smaller change of
the TBOP of the moving Li ion should play very important role on the fast movement of
the Li ion in the Li3N crystal. To discuss this smaller change, the details of BOP of
the moving Li ions are shown in Figs. 4 and 5. Fig. 4 shows the sum of the BOP

between the moving Li and the surrounding N ions. On the Li2N plane, the cluster (i),
the BOP of Li-N is 0.64 at initial position and is decreased with the movement of the Li
ion. However, the change is very small and difference between the maximum and
minimum is only 0.05. In contrary to this, the BOP changes largely on the Li plane,
the cluster (ii). In this case the initial value is 0.60 and is decreased with the
movement of the Li ion. The BOP has the minimum of 0.39, at x = 0.5. The
difference is 0.21 which is considerably larger than that on the Li2N plane. The
similar results were obtained in the c axis models of clusters (iii) and (iv). The BOP
is 0.72 at the initial position and is decreased largely with the movement of the Li ion.
The minimum is observed at x = 0.5, where the value is 0.35 for the cluster (iii) and
0.37 for the cluster (iv). The changes in the cluster (iii) and (iv) are more than 0.4.
Especially during the positions from x = 0.25 to 0.75, which are the inner of the clusters,
the BOP changed still larger than that of the cluster (i).
Fig. 5 shows another component of BOP of the moving Li ion, Li-Li interaction.
On the Li2N plane, the cluster (i), the BOP of Li-Li is 0.19 at the initial position and is
decreased little with the movement of the Li ion. The BOP of the moving Li ion is

almost constant through the path. This "constant BOP" of the moving Li ion is the
characteristic of the bonding state of the Li ion on the Li2N plane. On the Li plane,
the cluster (ii), the initial value of the BOP of the Li ion is 0.21 which is almost the
same value as that in the Li2N plane. However, the BOP is increased with the
movement of the Li ion and has a maximum, 0.27, at x = 0.5. The clusters (iii) and
(iv) for the models of the movement along with the c axis, similar changes of the BOP
of Li-Li were observed. That is, at the initial position the BOP is 0.22 and is
increased with the movement of the Li ion. There is a maximum at x = 0.5 and the
value is 0.33 for the cluster (iii) and 0.37 for the cluster (iv) which are larger than that
on the Li plane.
We have previously reported that the moving Ag ion in AgI-based superionic
conducting materials had very small change of the covalent bonding with surrounding
ions through the path. This small change was dependent on the covalent bonding
between the moving Ag ion and the neighboring Ag ions, that is, Ag-Ag covalent
interaction. Such cation-cation covalent interaction was the characteristic of the
bonding nature of the mobile Ag ion. On contrary to this, there are no obvious Li-Li
covalent interactions of the moving Li ions in the conduction path on Li2N plane,
though the Li ions on the other non-conduction paths have relatively larger Li-Li
interactions. In the case of Li3N the moving Li ion on the Li2N plane has very small
change of the covalent bonding of both Li-N and Li-Li through the movement along the
path. This might be one of the origins of the fast movement of the Li ion in the Li3N
crystal.
3. Sulfide-based Li ion conducting glasses
3.1. Model clusters
As describe in the previous section, the smaller change of
the TBOP of Li ion with the movement through the conduction path
was observed in the Li3N crystal. In this section, we have
tried to estimate the relationship between the ionic
conductivity and chemical bonding of the moving Li ions in the
sulfide-based superionic conducting glasses.

In order to calculate the electronic state of the Li ion in
the sulfide-based superionic conducting glasses, there is a
hurdle to construct a model cluster, since it is difficult to
obtain the detail of the structure around Li ions in the glasses
by experimental methods. The coordination number of sulfide
ions to the Li ion and the distances between the Li ion and the
first neighboring ions were reported about several kinds of the
sulfide glasses. [15-17] As based on these studies, we have
adapted tetrahedral structure and estimated the bond length
from the ionic radius of each ion reported by Shannon, [18] to
calculate electronic state near Li ions. Fig. 6 shows a
schematic diagram of the model cluster to calculate the
electronic state around the Li ion in the present work. In
this model, a lithium ion is located in the center and four
sulfide ions are coordinated. Each sulfide ion is included
in a SiS4 unit, which has regular tetrahedron structure. The

outside sulfide ions of SiS4 units are terminated by lithium
ions. The distances of Si-S, Li-S, P-S, and Al-S are 2.10,
2.43, 2.01, and 2.23 Å, respectively. Near the center
tetrahedral unit, three lithium ions are located on the outside
to keep the cluster neutral. The movement of the center Li
ion was simulated by five clusters with different position of
the ion. The SiS2 content was changed with exchange Si in SiS4
units with the other elements, such as Al and P. In this case,
the neutrality of the model clusters was adjusted by the number
of the outside Li ions. Then the contents of Al and P in the
clusters could become 25, 50, 75, and 100 mol% in the present
work. To compare the theoretical results with the
experimental ones, the bond overlap population of the
composition corresponding to the experimental samples was
obtained by interpolation of the results of these four
compositions.

As previously reported, the covalency of bonding nature
between the moving cations and surrounding ions were very
important to realize the fast movement of the ions. We
investigated the total bond overlap population to estimate
total of covalent interactions of moving cations and it was
suggested that the cations, which could move easily, had small
change of the total bond overlap population with the movement.
In the present work we would like to introduce differential
total bond overlap population (DBOP), to evaluate the
relationship between the covalent interaction and the fast
movement of the moving Li ions. That is obtained by
subtracting the minimum from the maximum of the total bond
overlap population with the movement of the lithium ion through
the path. In this study the electronic state of the moving
lithium ions were calculated in the systems Li2S-SiS2-Al2S3 and
Li2S-SiS2-P2S5 to compare with the ionic conductivity.

3.2. Results and Discussion
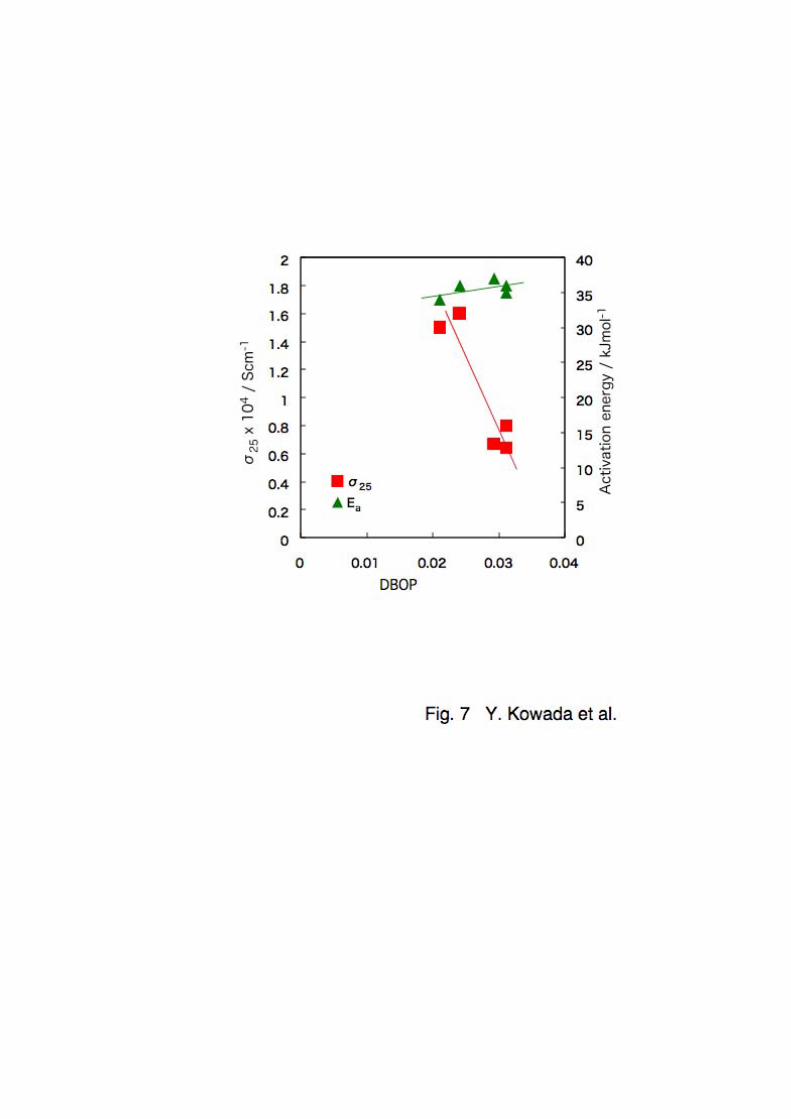
The composition dependences of the DBOP and the ionic
conductivity at 25 ºC in the system Li2S-SiS2-Al2S3 are shown in
Fig. 7. In this figure, closed diamonds show the results of
ionic conductivity reported in reference 19 and closed
rectangles show DBOP in the 60Li2S•0.4(xAlS1.5•(100-x)SiS2)
glasses. The ionic conductivity is decreased with an increase
in the compositional parameter x up to x=50 and then gradually
decreased with further increase in x. On the other hand, the
DBOP shows opposite tendency with the Al2S3 content. The DBOP
at x=0 is 0.017 and shows increasing tendency with the Al2S3
content to 0.057 at x=100. As mentioned above, the faster
movable cations in the superionic conducting glasses showed

smaller DBOP with the movement. In this system, the DBOP
becomes smaller at the composition with the higher ionic
conductivity. Furthermore, there seems to be a correlation
between the ionic conductivity and the DBOP.
Fig. 8 shows the composition dependences of the activation
energy for conduction and the DBOP. In this system, activation
energy is increased with the Al2S3 content, corresponding to the
decrease of the ionic conductivity. The DBOP is also increased
with x and might be found to correlate with activation energy.
Then, we have estimated correlations of the DBOP with the ionic
conductivity and the activation energy. The ionic
conductivity at 25 ºC and the activation energy for conduction
in the 60Li2S•0.4(xAlS1.5•(100-x)SiS2), as a function of the DBOP,
are shown in Fig. 9. It is noteworthy that the ionic
conductivity is decreased and the activation energy is
increased linearly with an increase in the DBOP. The

evaluated correlation coefficient between the ionic
conductivity and DBOP is -0.91 and that between the activation
energy and DBOP is 0.90. This result suggests that the DBOP
significantly has a good positive correlation with the
activation energy and a good negative correlation with the ionic
conductivity in this system. This is very interesting
because the model clusters for this calculation were
constructed without no strict structural informations obtained
by experimental measurements. Furthermore, these good
correlations of DBOP support quantitative relations between
DBOP and ionic conductivity.
The results of the DBOP analysis in the system Li2S-P2S5-SiS2
are shown in Fig. 10. This figure shows the composition
dependence of DBOP and ionic conductivity at 25 ºC in the
75Li2S•0.25(xPS2.5•(100-x)SiS2) glasses. [20] In this system,
the ionic conductivity is 0.64 x 10⁻⁴ Scm-1 at x=60 and is increased

with increasing of the P2S5 content. The conductivity becomes
1.60 x 10⁻⁴ Scm-1 at x=75. Contrary to this, DBOP of the moving
Li ion is 0.031 at x=50 and is decreased with the P2S5 content.
The composition dependence of the activation energy for
conduction in this system is shown in Fig.11. The activation
energy is 35.0 KJmol-1 at x=60 and is almost flat up to x=80.
Further increase in x results in a decrease in the activation
energy. This change is corresponding to the increase of ionic
conductivity. The DBOP of the Li ion shows similar variation
with x, whereas the DBOP is decreased in the range of x larger
than 75. Since the change of the activation energy and the
DBOP are also similar in this system, we have estimated the
correlation between the experimental results and the DBOP.
Fig. 12 shows the DBOP dependence of ionic conductivity
at 25 ºC and activation energy for conduction. In this system
the correlations of the DBOP with ionic conductivity and

activation energy are very similar in the system Li2S-SiS2-Al2S3,
i.e., a positive correlation of the DBOP with activation energy
and a good negative one with ionic conductivity are observed,
while the increase of activation energy with the DBOP is smaller
than that in the case of the addition of Al2S3. The correlation
coefficient for the ionic conductivity is -0.92 and that for
the activation energy is 0.51. The small correlation
coefficient of activation energy would be due to the difference
of the composition where the DBOP and the activation energy
start to decrease. Nevertheless, there are good correlations
of the DBOP with the ionic conductivity and the activation
energy in the both systems Li2S-SiS2-Al2S3 and Li2S-SiS2-P2S5.
This result suggests that the DBOP calculated by the DV-Xα
method has a certain relationship with the ionic conductivity
and the activation energy in the sulfide-based superionic
conducting glasses.

4. Conclusion
Electronic states of monovalent ions in superionic conductors such as Li3N, and
the sulfide-based superionic conducting glasses in the systems
Li2S-SiS2-Al2S3 and Li2S-SiS2-P2S5, were calculated by the DV-Xα
method. The differential the total bond overlap population
( DBOP ) was obtained from the model clusters constructed with
no strict structural parameters by experimental measurements.
The DBOP had good correlations with the ionic conductivity and
activation energy in the both systems. This result suggests
that the covalent interaction of the moving lithium ions is very
important to understand the fast movement of the lithium ions
in the sulfide-based superionic conducting glasses. The DBOP
estimated by the DV-Xα method could be applied to design new
sulfide-based superionic conducting glasses.

References
[1] Y. Kowada, H. Adachi, and T. Minami, J. Ceram. Soc. Jpn., 101, 1330-4
(1993).
[2] Y. Kowada, H. Adachi, M. Tatsumisago, T. Minami, J. Non-Cryst. Solids,
232-234, 497-501(1998).
[3] N. Imanaka, S. Tamura, G. Adachi, Y. Kowada, Solid State Ionics 130 (2000)
179-182.
[4] Y. Kowada, Y. Yamada, M. Tatsumisago, T. Minami, and H. Adachi, Solid
State Ionics 136-137 (2000) 393-397.
[5] R. Araki, A. Hayashi, Y. Kowada, M. Tatsumisago, T. Minami, J. Non-Cryst.
Solids (2001), 288(1-3), 1-7.
[6] Y. Kowada, M. Okamoto, I. Tanaka, H. Adachi, M. Tatsumisago, T. Minami, J.
Non-Cryst. Solids 345&346 (2004) 489-493
[7] J. Wahl and U. Holland , Solid State Commun. 27, 237 (1978).
[8] H. Schulz, K. H. Thiemann, Acta Crystallogr. A 35, 309
(1979).

[9] Y. Koyama, Y. Yamada, I. Tanaka, S. R. Nishitani, H. Adachi,
M. Murayama, R. Kanno, Mater. Trans. (2002), 43(7), 1460-1463
[10] J. Sarnthein, K. Schwarz, P. E. Bloechl, Phys. Rev. B:
Condens. Matter (1996) 53(14), 9084-91.
[11] H. Adachi, M. Tsukada, C. Satoko, J. Phys. Soc. Japan 45,
875 (1978).
[12] J. C. Slater, Quantum Theory of Molecules and Solids, Vol.
4 (McGraw-Hill, New York, 1974).
[13] E. J. Baerends and P. Ros, Chem. Phys. 2, 52 (1973).
[14] E. J. Baerends and P. Ros, Molec. Phys. 30, 1735 (1975).
[15] C. Estournès, A. P. Owens, M. Ménétrier, A. Levasseur,
K. J. Rao, and S. R. Elliott, J. Non-Cryst. Solids 171 (1994)
80-86.
[16] A. Pradel, G. Taillades, M. Ribes, and H. Eckert, J.
Non-Cryst. Solids 188 (1995) 75-86.
[17] R. Prasada Rao, M. Seshasayee, J. Non-Cryst. Solids 352
(2006) 3310-3314.

[18] R. D. Shannon, Acta Crystallogr. A32 (1976) 751.
[19] A. Hayashi, T. Fukuda, H. Morimoto, T. Minami, M.
Tatsumisago, J. Mater. Sci. 39 (2004) 5125-5127.
[20] A. Hayashi, Y. Ishikawa, S. Hama, T. Minami, and M.
Tatsumisago, Electrochem. Solid-State Lett., 6(3) (2003)
A47-A49.

Figure captions
Fig. 1 Schematic diagram of the Li3N model clusters.
Fig. 2 The relationship between the net charge and the
position of the moving Li ion in the model clusters (i)-(iv).
•: cluster (i), •:cluster (ii), ▲:cluster(iii), •:cluster (iv)
Fig. 3 The relationship between the total bond overlap
population and the position of the moving Li ion in the model
clusters (i)-(iv). •: cluster (i), •:cluster (ii),
▲:cluster(iii), •:cluster (iv)
Fig. 4 The position dependence of bond overlap population
between the moving Li and the neighboring N ions. •: cluster
(i), •:cluster (ii), ▲:cluster(iii), •:cluster (iv)
Fig. 5 The position dependence of bond overlap population
between the moving Li and the neighboring Li ions. •: cluster
(i), •:cluster (ii), ▲:cluster(iii), •:cluster (iv)
Fig. 6 Schematic diagram of the Li16Si4S16 model cluster.

Fig. 7 The composition dependence of ionic conductivity and
DBOP in the 60Li2S•0.4(xAlS1.5•(100-x)SiS2) glasses.
Fig. 8 The composition dependence of the Ea of the ionic
conductivity and DBOP in the 60Li2S•0.4(xAlS1.5•(100-x)SiS2)
glasses.
Fig. 9 The relationship between the ionic conductivity, Ea
and DBOP in the 60Li2S•0.4(xAlS1.5•(100-x)SiS2) glasses.
Fig. 10 The composition dependence of ionic conductivity and
DBOP in the 75Li2S•0.25(xPS2.5•(100-x)SiS2) glasses.
Fig. 11 The composition dependence of the Ea of the ionic
conductivity and DBOP in the 75Li2S•0.25(xPS2.5•(100-x)SiS2)

glasses.
Fig. 12 The relationship between the ionic conductivity, Ea
and DBOP in the 75Li2S•0.25(xPS2.5•(100-x)SiS2) glasses.

Fig.1 Y. Kowada et al

0
0.2
0.4
0.6
0.8
0 0.2 0.4 0.6 0.8 1
Net
cha
rge
Position of the Li ion
Fig. 2 Y. Kowada et al

0.6
0.7
0.8
0.9
1
-0.25 0 0.25 0.5 0.75 1 1.25
Tota
l bon
d ov
erla
p po
pula
tion
Position of the Li ion
Fig. 3 Y. Kowada et al

0.3
0.4
0.5
0.6
0.7
0.8
0 0.25 0.5 0.75 1
Bon
d ov
erla
p po
pula
tion
Position of the Li ion
Fig. 4 Y. Kowada et al

0
0.1
0.2
0.3
0.4
0.5
-0.25 0 0.25 0.5 0.75 1 1.25
Bon
d ov
erla
p po
pula
tion
Position of the Li ion
Fig. 5 Y. Kowada et al