
kinésithérapique des lésions myo- aponévrotiques des ischio ...
Upload
khangminh22Category
view
0download
0
UNIVERSITE MONTPELLIER II SCIENCES ET TECHNIQUES DU LANGUEDOC
T H E S E
pour obtenir le grade de
DOCTEUR DE L'UNIVERSITE MONTPELLIER II
Discipline : Chimie et Physicochimie des Matériaux (CNU 31)
Ecole Doctorale : Sciences Chimiques (ED 459)
Présentée et soutenue publiquement Le 10 décembre 2010
par
Wolfram Müller
Extraction liquide-solide des cations métalliques par des cations amphiphiles
Composition du jury
André Ayral Professeur, Université Montpellier II Président du jury
Fabienne Testard Ingénieur Chercheur CEA, IRAMIS Saclay Rapporteur
Werner Kunz Professeur, Université de Ratisbonne, Allemagne Rapporteur
Theyencheri Narayanan Responsable ID02, ESRF Examinateur
Thomas Zemb Professeur INSTN, ICS Marcoule Examinateur
Olivier Diat Ingénieur Chercheur CEA, ICS Marcoule Directeur de thèse
Christophe Déjugnat Chargé de Recherche CNRS, Toulouse Invité

2

3
Thèse financée par

4

5
Acknowledgements
This thesis has been carried out from December 2007 to November 2010 at the
Institute of Separation Chemistry (ICSM) in Marcoule, France.
This work would not have been possible without the help and support of many
people to whom I am deeply grateful.
First I would like to thank Prof. Thomas Zemb, who gave me the opportunity
work on this topic and to conduct this thesis at the ICSM. He set the main directions
of this subject during the three years and was a constant source of fruitful
discussions. Likewise, I want to thank Dr. Olivier Diat who directed my work and
offered help and support whenever I needed.
I am indebted to Dr. Christophe Déjugnat, without whom this thesis would not
have been possible. He offered me a warm welcome since the first day of my thesis
and was always present, offered help and encouraged me in every aspect. His strong
capacity to extract the best of a person allowed me to pass my limits and to evolve
constantly.
Furthermore I want to thank Dr. Eric Quéméneur for the kind welcome and for
giving me the possibility to work in the SBTN during the first year of my thesis, the
time in which the ICSM has been constructed. I am likewise thankful for the constant
support of the whole members of the SBTN and the familiar atmosphere which made
it a pleasure to work there.
I am very grateful to Prof. Jean-François Dufrêche for his support and patience
concerning the theoretic modelling. I am indebted to the technical staff of the ICSM
as well, especially Véronique Dubois for introducing me to the ICP-OES technique
and furthermore Gilles Guillot and René Astier for the constant technical support.
A “Thank You” goes also to Dr. Philippe Moisy from the DRCP in Marcoule, who
was a constant source of interesting propositions and fruitful discussions.

6
I am very thankful to Hélène Martin who is the heart and soul of our institute,
and solved together with Alice Vidal, Mathilde Dias and André Gueyne every possible
administrative problem.
And of course, I would like to thank all my colleagues at the ICSM as well as my
friends for their mental and practical daily support during my work, especially Simone
Tien, Rémi Andrieu, Minh Hieu Trinh, Amélie Banc, Camille Carrignon, Philippe
Makowski and Johann Ravaux.
A very special “Thank You” goes to Frédéric Goettmann and Helena Kaper for
the numberless nice moments we spent together and their good humour, which
highlighted every day.
There are no words to thank Caroline Bauer, Pierre Bauduin and Émile Bauduin
for their friendship, the emotional support and allowing me to be part of their family.
And last but not least, I would like to thank my parents, Dagmar and Freimuth
Müller, my brother Torsten Müller and Susanne Wolfrum for their love, their
encouraging support in every aspect, and for giving me the strength to reach my
aims.
7
Summary
In the field of selective separation for recycling of spent nuclear fuel, liquid-liquid
extraction processes are like PUREX are widely used at industrial scale. Usually,
extraction systems are formulated to get non-stable emulsions, which consist of an
aqueous phase containing the metallic ions and an organic phase in which a
hydrophobic extractant is dispersed. During the emulsification process an ion transfer
takes place. This is made possible by the complexation of the metal ion at the
water/oil interface by the weakly amphiphilic extractant molecules, which allow the
subsequent extraction in the organic phase. Some drawbacks of the liquid-liquid
extraction techniques come from the slow kinetics of the ion transfer, which cannot
be controlled because it is not well understood. Furthermore, a degradation of
organic solvents and extractants happens when they are used in a highly radioactive
environment.
In order to guarantee a sustainable nuclear energy for the forthcoming
generations, alternative reprocessing techniques are under development. One of
them consists in selectively precipitating actinides from aqueous waste solutions by
cationic surfactants (liquid-solid extraction) and based on studies from Heckmann et
al in the 80’s. This technique has some interesting advantages over liquid-liquid
extraction techniques, because several steps are omitted like stripping of the
extracted species or solvent washing. Moreover, the amount of waste is decreased
considerably since no contaminated organic solvent is produced. In this thesis, we
have carried out a physico-chemical study to understand the specific interactions
between the metallic cations with the cationic surfactant. First, we have analysed the
specific effect of the different counter-ions (Cl-, NO3-, C2O4
2-) and then the effect of
alkaline cations on the structural properties of the surfactant aggregation in varying
thermodynamical conditions. Finally, different multivalent cations (Cu2+, Zn2+, UO22+,
Fe3+, Nd3+, Eu3+, Th4+) were considered; we have concluded that depending on the
anionic complex of these metals formed in acidic media, we can observe or not an
adsorption at the micellar interface. This adsorption has a large influence of the
surfactant aggregation properties and determines the limits of the application in term
of ionic strength, temperature and surfactant concentration.

8
9
Contents
General introduction .................................................................................................................. 11
I – Bibliographic introduction ………....................................…………………………………….. 15
1.1 Nuclear energy – an overview ………………………………………….............................. 15
1.2 Surfactants in aqueous solutions ……………................................................................. 20
1.3 Specific ion effects: role in surfactant self-assembly…………………….......................... 26
References ……………………………………………………………………….......................... 29
II – Effects of anions on micellisation parameters of cetylpyridinium surfactants.............. 37
2.1 Introduction ..................................................................................................................... 37
2.2 Results and discussion ................................................................................................... 38
2.2.1 Micellisation parameters ......................................................................................... 38
2.2.1.1 Critical micellar concentration (cmc) ............................................................ 38
2.2.1.2 Krafft temperature measurements................................................................ 39
2.2.2 Structural parameters ............................................................................................. 43
2.2.2.1 Light scattering .................. ......................................................................... 43
2.2.2.2 Small angle neutron scattering (SANS) ....................................................... 52
2.2.2.3 Small angle X-ray scattering (SAXS) ........................................................... 58
2.2.2.4 Scattering of interaction samples ................................................................. 63
2.2.2.5 Competition of counterion binding ............................................................... 67
2.2.2.6 Does TK depend on the surface area per head group? ............................... 69
2.2.2 Lateral equation of state (EOS) .............................................................................. 69
2.3 Conclusion ...................................................................................................................... 80
References ……………………………………………………………………….......................... 81
III – Effects of alkaline cations on self-assembly of cetylpyridinium surfactants ............... 83
3.1 Introduction...................................................................................................................... 83
3.2 Results and discussion.................................................................................................... 83
3.2.1 Krafft temperature measurements........................................................................... 83
3.2.2 Light scattering ……………..................................................................................... 85
3.2.3 Small angle X-ray scattering (SAXS)....................................................................... 89
3.3 Conclusion ...................................................................................................................... 96
References ……………………………………………………………………….......................... 97
IV – Precipitation of metal cations by cetylpyridinium surfactants ...................................... 99
4.1 Introduction ..................................................................................................................... 99
4.2 Experimental ................................................................................................................... 100
10
4.3 Results and discussion ................................................................................................... 101
4.3.1 Krafft temperature measurements .......................................................................... 101
4.3.2 Small angle neutron scattering (SANS) .................................................................. 103
4.3.3 Anomalous small angle X-ray scattering (ASAXS) ................................................. 105
4.3.4 SAXS study of the precipitates ............................................................................... 110
4.3.5 Metal separation by precipitation ............................................................................ 114
4.4 Conclusion ...................................................................................................................... 116
References ……………………………………………………………………….......................... 121
General conclusion .................................................................................................................... 127
Perspectives and outlook .......................................................................................................... 129
Annexe A – Experimental and techniques ............................................................................... 131
A.1 Techniques: theory and experimental procedures ......................................................... 131
A.1.1 IR-spectroscopy ..................................................................................................... 131
A.1.2 Krafft temperature measurements ......................................................................... 132
A.1.3 Surface tension ...................................................................................................... 133
A.1.4 pH measurements .................................................................................................. 136
A.1.5 Scattering techniqes ............................................................................................... 137
A.1.5.1 Light scattering ............................................................................................ 137
A.1.5.2 Small angle X-ray scattering (SAXS) ........................................................... 145
A.1.5.3 Anomalous X-ray scattering ......................................................................... 149
A.1.5.4 Small neutron X-ray scattering (SAXS) ........................................................ 151
A.1.6 ICP-OES ................................................................................................................. 152
A.2. Experimental .................................................................................................................. 155
A.2.2 Materials ................................................................................................................. 155
A.2.2 Preparation of sample solutions ............................................................................. 158
References ……………………………………………………………………….......................... 160
.
Annexe B – Supporting information ......................................................................................... 161
B.1 Supporting information of Chapter II .............................................................................. 161
B.2 Supporting information of Chapter IV ............................................................................. 165
B.3 US Patent 4,609,533 of Prof. K. Heckmann .................................................................. 167
Annexe C – French summary of the thesis .............................................................................. 175
Notes ……………………………………………............................................................................... 195
11
General introduction
In the field of selective metal ion separation for reprocessing of nuclear spent
fuel, liquid-liquid extraction techniques are widely used at industrial level, e.g. the
PUREX (Plutonium Uranium Recovery) process. Usually, extraction systems are
formulated to get non-stable emulsions, which consists of an aqueous phase
containing the metallic ions and an organic phase in which a hydrophobic extractant
is dispersed. During the emulsification process an ion transfer takes place. This is
made possible by the complexation of the metal ion at the water/oil interface by the
weakly amphiphilic extractant molecules, which allow the subsequent extraction in
the organic phase. Some drawbacks of the liquid-liquid extraction technique come
from the slow kinetics of the ion transfer, which cannot be controlled because it is not
well understood. Furthermore, a degradation of organic solvents and extractants
happens, when using them in a highly radioactive environment. In the framework of
sustainable nuclear energy, it is a great challenge to find effective separation
systems that allow to recycle nuclear waste in a more simple and well-understood
ways. One major objective is also to integrate the separation/recycling steps into the
reactor design in order to reduce contamination and proliferation risks as well as the
amount of contaminated waste to a minimum. Then, alternative methods like
electrochemical processes are under progress.
Recently it has been shown that self-organisation of amphiphilic complexants
could play a major role in the extraction efficiency by increasing the surface
interaction between the metal ions and the self-organised aggregates. In this context,
another approach basing on a precipitation technique using amphiphiles has been
presented by Heckmann et al. almost thirty years ago. This method consists in
selectively precipitating metal ions from a bulk aqueous mixture using cationic
surfactants (liquid-solid extraction). It has been shown to efficiently separate actinides
and lanthanides using long-chain ammoniums or pyridiniums. Especially
cetylpyridinium surfactants were used successfully. In contrast to liquid-liquid
extractions, several processing steps are omitted in this approach like the stripping of
the extracted species or the solvent washing, as no organic solvent is used. This
makes it interesting in terms of sustainability, but it could present also a certain risk
12
concerning criticality safety, when fissile elements are concentrated due to
precipitation.
However, a particular point that appears paradoxal in this process raises the
question: how can a metallic cation be recognized by cationic surfactants?
This is one of a series of fundamental questions which are relevant for
explaining the extraction mechanism. In fact, the role of the surfactant aggregation on
the metal separation is also important to determine. A further point of interest is the
obtained precipitate, which has not been documented regarding its structure.
The aim of this work was hence to provide information concerning the influence of
several physico-chemical parameters on the selective separation of metallic cations
by the cationic surfactant like:
• The influence of the ionic strength on the extraction efficiency and the
aggregate shape in terms of ion-specificity.
• The structures of the precipitates obtained and the way they can be controlled.
• The “real charge” of the metal in the complex which is precipitated.
• The stoichiometry metal/surfactant and the selectivity of the process
In order to provide some answers to these questions, the surfactant N-cetylpyridinium
chloride (C16PyCl, in the following abbreviated as CPC) was employed and chosen
as model system. Furthermore, different counterions (Cl-, NO3-, CH3COO-, C2O4
2-)
were introduced in order to consider the influence of ion specificity on extraction.
The first chapter of this thesis presents a bibliographic introduction of the topic
and gives the framework for this study. The second chapter deals with the influence
of the different anions introduced on micellisation parameters of cetylpyridinium in
acidic solution: chloride (Cl-), nitrate (NO3-,) oxalate (Ox2-). In contrast to most studies
found in literature, great care was taken to avoid mixtures of different anions, which is
the reason why the surfactant solutions were prepared with the corresponding acid of
the counterion. Up to our knowledge, cetylpyridinium oxalate was not characterised
until now. The observations are discussed in the framework of the current
understanding of specific ion effects. Furthermore the geometrical parameters
obtained for cetylpyridinium chloride and nitrate aggregates were introduced in a free
13
energy model adapted for this surfactant system in order to describe the different
energetic contributions to micellisation.
In the third chapter, a further aspect of this work is presented by replacing the
acidic solutions used for the studies in chapter two by an alkaline salt solution (LiX,
NaX, KX, RbX, CsX, with X = Cl-, NO3-). Thus, the effect of monovalent cations on
the aggregation parameters of the surfactant was studied for a series while keeping
the anion fixed.
In the fourth chapter, the monovalent cations are replaced by a series of
multivalent cations, including divalent (UO22+, Zn2+, Cu2+), trivalent (Nd3+, Eu3+, Fe3+)
and tetravalent (Th4+) metals and studied in acidic solutions (HCl, HNO3). The
influence of these metal ions on the solubility temperature (TK) of cetylpyridinium as
well as on its structural organisation in liquid and solid state has been determined.
For all surfactant-metal combinations, the extraction efficiency of metals precipitated
by cetylpyridinium was determined quantitatively as a function of surfactant and
counterion concentration.
The results of the previous chapters are summarized in a general conclusion
which gives also an outlook on future work in this domain. The annex of this work
contains practical and theoretical information about the used measuring techniques,
sample preparation and tables with TK values which are of minor interest for the main
part of the work.

14

I – Bibliographic Introduction
15
Chapter I – Bibliographic introduction
1.1 Nuclear energy – an overview
Nuclear energy is mainly used in order to generate electricity. One major reason
of using nuclear energy is that nuclear fuel contains millions of times more energy
than a similar mass of gasoline or coal. Today, about 15 % of the world’s electricity is
supplied by nuclear energy [1]. The principle behind is called the nuclear fission, in
which a nucleus from a heavy element, like uranium or plutonium, splits when
bombarded by a neutron. For uranium, this process is highly exothermic (about 200
MeV per process) and comprises the emission of electromagnetic radiation, two
fragments and two or three neutrons. Natural uranium consists of 99.7 % 238U and
only 0.3 % of 235U, but only the latter isotope is fissile, meaning that it also undergoes
fission when struck by a thermal, slow moving neutron. The isotope 238U is
fissionable meaning that it can undergo induced fission when hit by a free neutron.
Therefore, the uranium isotope 235U is of special interest for nuclear industry
since it can cause and maintain a self-sustained chain reaction. For this purpose
uranium with about 3.5 % of 235U is necessary, which is the reason why uranium
used as nuclear fuel is enriched to this isotope level by gas diffusion or ultra-
centrifugation techniques, before being confined in a fuel rod. Once the chain
reaction is started, one neutron is needed for the self-sustained chain reaction by
leading to fission of another 235U. The surplus neutrons are captured either by the
reactor structure, the coolant or the fuel itself [2]. In the latter case the possibility
exists for 238U to absorb a neutron and form 239U, which then subsequently
transforms via beta-decay to 239Pu, another industrially important fissile isotope. A
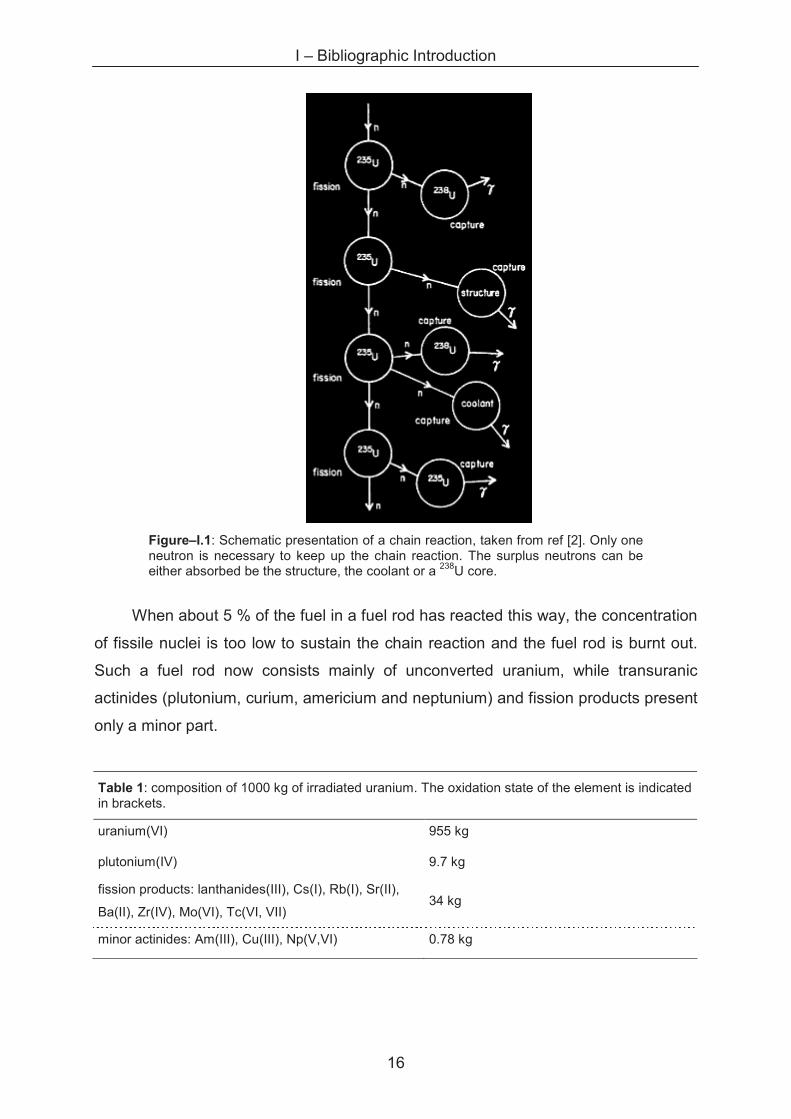
schematic overview of a self-sustained chain reaction is given in the following figure–
I.1.
I – Bibliographic Introduction
16
Figure–I.1: Schematic presentation of a chain reaction, taken from ref [2]. Only one neutron is necessary to keep up the chain reaction. The surplus neutrons can be either absorbed be the structure, the coolant or a 238U core.
When about 5 % of the fuel in a fuel rod has reacted this way, the concentration
of fissile nuclei is too low to sustain the chain reaction and the fuel rod is burnt out.
Such a fuel rod now consists mainly of unconverted uranium, while transuranic
actinides (plutonium, curium, americium and neptunium) and fission products present
only a minor part.
Table 1: composition of 1000 kg of irradiated uranium. The oxidation state of the element is indicated in brackets.
uranium(VI) 955 kg
plutonium(IV) 9.7 kg
fission products: lanthanides(III), Cs(I), Rb(I), Sr(II),
Ba(II), Zr(IV), Mo(VI), Tc(VI, VII) 34 kg
minor actinides: Am(III), Cu(III), Np(V,VI) 0.78 kg
I – Bibliographic Introduction
17
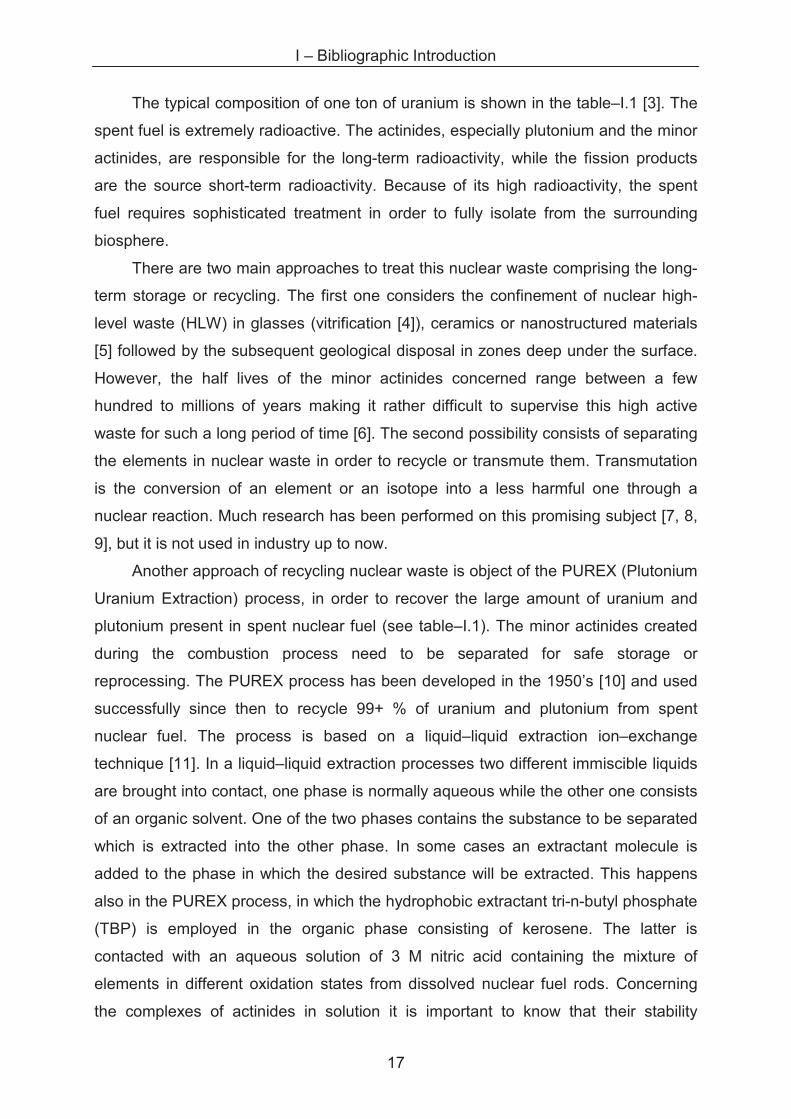
The typical composition of one ton of uranium is shown in the table–I.1 [3]. The
spent fuel is extremely radioactive. The actinides, especially plutonium and the minor
actinides, are responsible for the long-term radioactivity, while the fission products
are the source short-term radioactivity. Because of its high radioactivity, the spent
fuel requires sophisticated treatment in order to fully isolate from the surrounding
biosphere.
There are two main approaches to treat this nuclear waste comprising the long-
term storage or recycling. The first one considers the confinement of nuclear high-
level waste (HLW) in glasses (vitrification [4]), ceramics or nanostructured materials
[5] followed by the subsequent geological disposal in zones deep under the surface.
However, the half lives of the minor actinides concerned range between a few
hundred to millions of years making it rather difficult to supervise this high active
waste for such a long period of time [6]. The second possibility consists of separating
the elements in nuclear waste in order to recycle or transmute them. Transmutation
is the conversion of an element or an isotope into a less harmful one through a
nuclear reaction. Much research has been performed on this promising subject [7, 8,
9], but it is not used in industry up to now.
Another approach of recycling nuclear waste is object of the PUREX (Plutonium
Uranium Extraction) process, in order to recover the large amount of uranium and
plutonium present in spent nuclear fuel (see table–I.1). The minor actinides created
during the combustion process need to be separated for safe storage or
reprocessing. The PUREX process has been developed in the 1950’s [10] and used
successfully since then to recycle 99+ % of uranium and plutonium from spent
nuclear fuel. The process is based on a liquid–liquid extraction ion–exchange
technique [11]. In a liquid–liquid extraction processes two different immiscible liquids
are brought into contact, one phase is normally aqueous while the other one consists
of an organic solvent. One of the two phases contains the substance to be separated
which is extracted into the other phase. In some cases an extractant molecule is
added to the phase in which the desired substance will be extracted. This happens
also in the PUREX process, in which the hydrophobic extractant tri-n-butyl phosphate
(TBP) is employed in the organic phase consisting of kerosene. The latter is
contacted with an aqueous solution of 3 M nitric acid containing the mixture of
elements in different oxidation states from dissolved nuclear fuel rods. Concerning
the complexes of actinides in solution it is important to know that their stability
I – Bibliographic Introduction
18
depends much on the oxidation state and acidity. At pH higher than 1, actinides
undergo hydrolysis. For this reason the minimal acidity used is 0.5 M H+. The stability
of the complexes for e.g. plutonium follows the series: Pu4+ > Pu3+ > PuO22+ > PuO2
+.
TBP has a strong affinity for elements in oxidation state (IV) and (VI), which is not
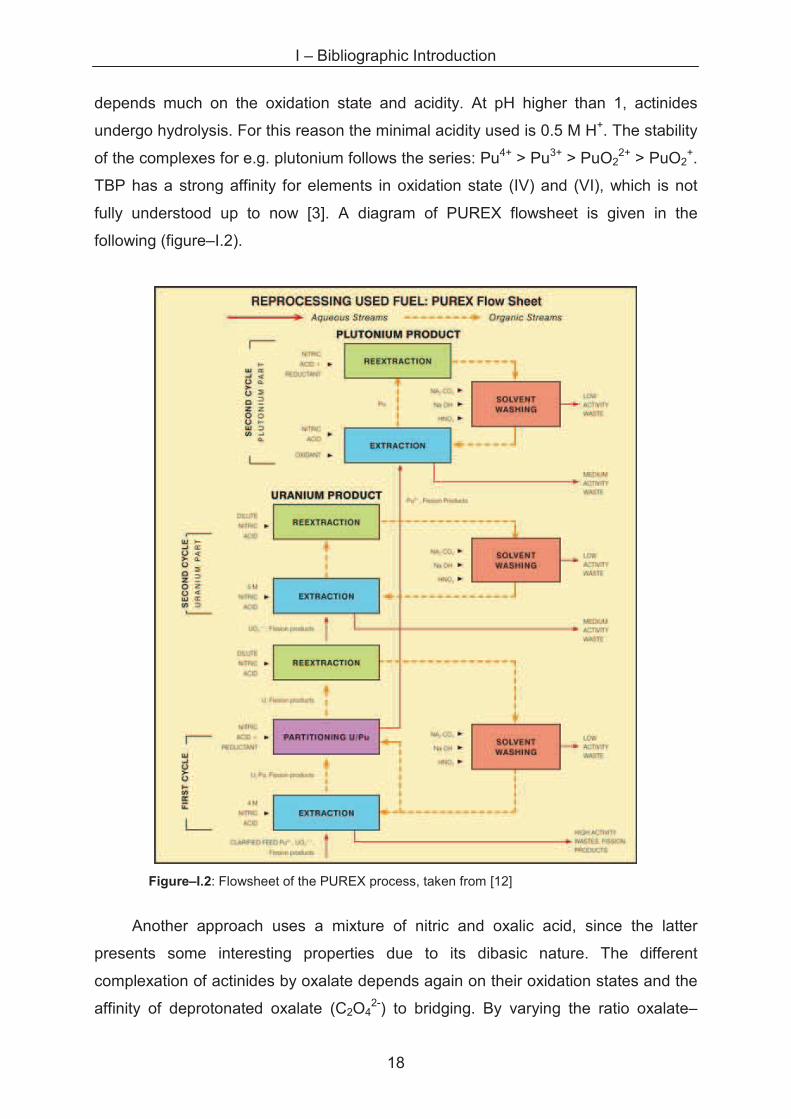
fully understood up to now [3]. A diagram of PUREX flowsheet is given in the
following (figure–I.2).
Figure–I.2: Flowsheet of the PUREX process, taken from [12]
Another approach uses a mixture of nitric and oxalic acid, since the latter
presents some interesting properties due to its dibasic nature. The different
complexation of actinides by oxalate depends again on their oxidation states and the
affinity of deprotonated oxalate (C2O42-) to bridging. By varying the ratio oxalate–
I – Bibliographic Introduction
19
actinide, the solubility of the actinide complexes can be controlled precisely.
Hydrochloric acid is normally avoided because of its high corrosion power concerning
the container materials. After the extraction of plutonium and uranium in the organic
phase by TBP, they are back-extracted into the aqueous phase (stripping). From the
aqueous phase they are separated from each other or reprocessed together as
mixed oxides. The latter case is one of the goals of the COEX (co-extraction of
actinides) process.
The advantages of the PUREX process are its continuous operation and high
throughput, its possibility to be tuned for purity or selectivity, the solvent recycling and
the waste minimization. The disadvantages are the solvent and extractant
degradation (hydrolysis and radiolysis) due to the high radioactivity present, its
requirements of tankage and reagents, the difficulties arising from handling with high-
level waste and the creation of stockpiles of plutonium oxide.
In the framework of a sustained development of nuclear energy, it is of high
interest to find alternative processes in order to reduce the number of disadvantages
listed above. Several approaches were introduced in the last years [13, 14, 15, 16,
17], using amines to transfer lanthanides or actinides complexed by
phosphotungstates into diverse organic phases. Other attempts consisted in
improving the PUREX process, aiming to separate long-lived radionuclides like
americium and curium from short-living fission products (DIAMEX-SANEX) [18, 19,
20], or the grouped extraction of actinides (GANEX), which then separates minor
actinides and some lanthanides from short-living fission products [21]. A major
challenge for the industry is to develop processes that allow a closed fuel cycle [22]
which can be integrated in the reactor design and which reduce in the same time the
risk of proliferation.
In most of these systems, the extractants used are weak amphiphiles and self-
assemble into aggregates. This self-assembly of extractants was subject of research
some years ago [23] for liquid-liquid extraction systems and it was concluded that the
supramolecular extraction plays a key role in the extraction [24]. In this context, an
interesting approach was presented about twenty years ago, namely a liquid-solid
extraction technique. A liquid-solid extraction process is commonly defined as a
leaching technique. The principle is to extract the soluble components of a solid
matter by a solvent, but here the term was applied to a cationic surfactant system
used as extractant to separate actinides from aqueous solutions by precipitation [25,
I – Bibliographic Introduction
20
26, 27]. In all cases the targeted element was required to form an anionic complex in
solution which interacts strongly with the cationic surfactant. The consequence of this
preferential interaction is the formation of an insoluble surfactant-metal-complex
which precipitates from solution. In contrast, the other metals present in solution do
not form anionic complexes, or form metal-surfactant complexes which have a higher
solubility than the targeted metal. This way, uranium was selectively separated from
other metals like iron in hydrochloric or sulphuric acid solution by precipitation with a
series of ammonium salts and polyelectrolytes, which is subject of a patent
developed by Heckmann et al. [28]. Based on this observation, he presented a
process for selectively separating plutonium from uranium in nitric and sulphuric acid,
respectively [29]. Especially the surfactants n-cetylpyridinium chloride and sulphate,
respectively, were used preferentially in this process. This raises the questions, how
the self-assembly influences the selectivity and efficiency of the extraction process.
1.2. Surfactants in aqueous solutions
An amphiphilic molecule is defined as a molecule possessing a hydrophilic and
a hydrophobic part. Surfactants (surface active agents) are amphiphiles which show
the tendency to adsorb at surfaces or interfaces. In water, the hydrophobic chains
direct towards the less polar medium, i.e. air, while the hydrophilic head group sticks
to the polar solvent, i.e. an aqueous phase. Indeed, there is an energy cost to
disperse these molecules in water because of their hydrophobic part, which is
counterbalanced by the entropy of the molecule. Their organisation at the water/air
interface leads to a decrease of the interfacial tension between the water and air,
thus reducing the free surface enthalpy. A subtle equilibrium exists between the
chemical potential µ of the molecules in the bulk and at the interface. By adding more
surfactant to the aqueous solution, the dispersion cost becomes too high and cannot
be counterbalanced by the µ of equilibrium. The “excess” molecules which do not find
a place at the interface begin to aggregate in the water phase shielding the
hydrophobic chains from contact with water while the polar heads remain in contact
with the water molecules [30]. Depending on the polar head group, these amphiphilic
molecules are classified as anionic, cationic, zwitterionic or non-ionic.
I – Bibliographic Introduction
21
Extractant molecules consist of a lyophobic and lyophilic group, too, and thus
belong also to the class of amphiphiles. In contrast to surfactants, extractants are
much less surface-active and show a better solubility in one of the two phases, which
is a key factor for the extraction process. Otherwise, they would remain at the
interface which would result in long extraction kinetics and lower yield rates.
The borderline concentration necessary to induce the self-aggregation is called
the critical aggregation concentration (cac) which marks an important feature of the
surfactant. When spherical aggregates are formed the cac equals the critical micellar
concentration (cmc)1. The cmc depends strongly on the chemical structure of the
surfactant but also on other parameters like salts or additives (like alcohols) present
in the aqueous phase or temperature and pressure. Above the cmc surfactants
aggregate generally first in a spherical form but could also grow to be oblate or
cylindrical. At higher concentration they can self-assemble into bilayers and build
vesicles or they can even be structured in liquid crystal phases like, lamellar,
hexagonal or cubic. Reverse phases are observed for very high concentrations
and/or appropriate molecular structure of surfactants. In these cases the polar head
groups arrange around a water core which is surrounded by a hydrophobic outer
phase. The aggregation form has also influence on the macroscopic properties of
surfactant solutions like, for example viscosity or conductivity.
A first concept of describing the surfactant aggregation was developed by Griffin
in 1949 and was called hydrophilic–lipophilic balance (HLB) [31], presenting a
practically inspired method to classify surfactants depending on the ratio of their
hydrophilic and hydrophobic molecular volumes. Recently, this approach was
extended by Salager to the concept of hydrophilic–lipophilic deviation from optimum
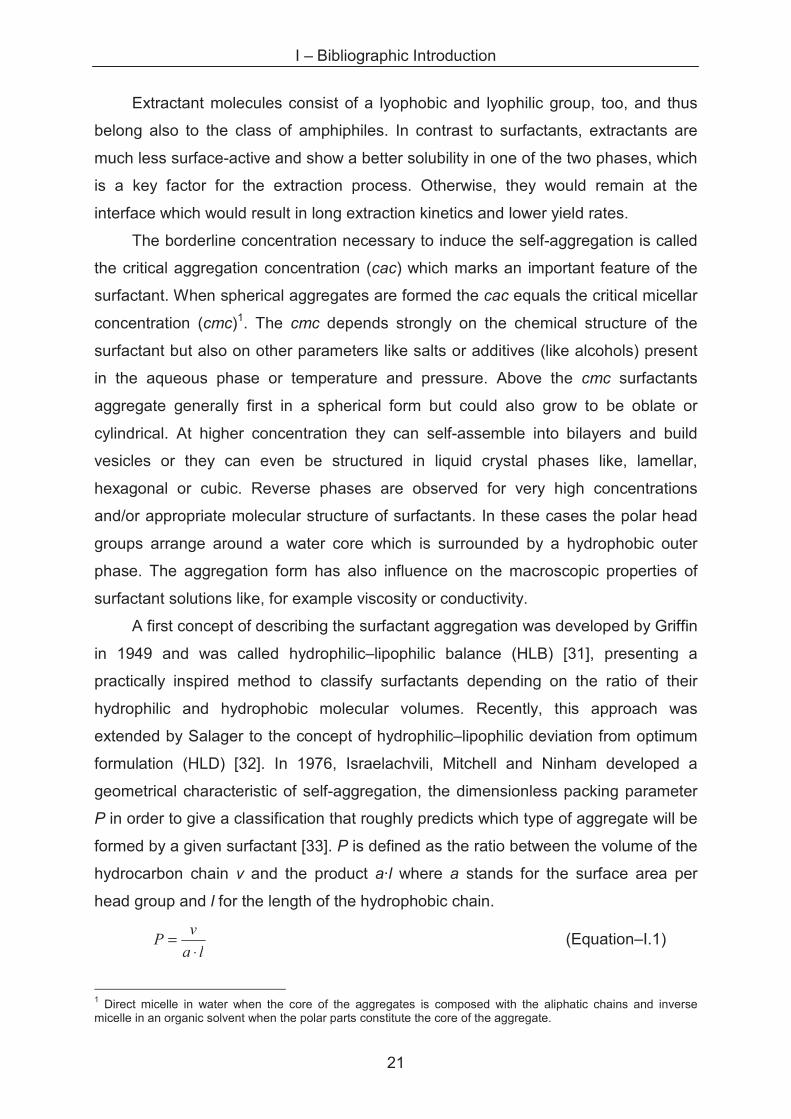
formulation (HLD) [32]. In 1976, Israelachvili, Mitchell and Ninham developed a
geometrical characteristic of self-aggregation, the dimensionless packing parameter
P in order to give a classification that roughly predicts which type of aggregate will be
formed by a given surfactant [33]. P is defined as the ratio between the volume of the
hydrocarbon chain v and the product a·l where a stands for the surface area per
head group and l for the length of the hydrophobic chain.
la
vP
⋅= (Equation–I.1)
1 Direct micelle in water when the core of the aggregates is composed with the aliphatic chains and inverse micelle in an organic solvent when the polar parts constitute the core of the aggregate.
I – Bibliographic Introduction
22
When 1/3 < P < 1/2, the amphiphile tends to form spheres, whereas cylinders
will form for P > 1/2. Bilayers and vesicles are the preferred aggregation types when
P approaches 1, corresponding to a globally cylindrical shape of the tenside. For
surfactants with a molecular structure resembling an inverted cone, reverse
structures are most likely to form and P becomes higher than 1. For a classic
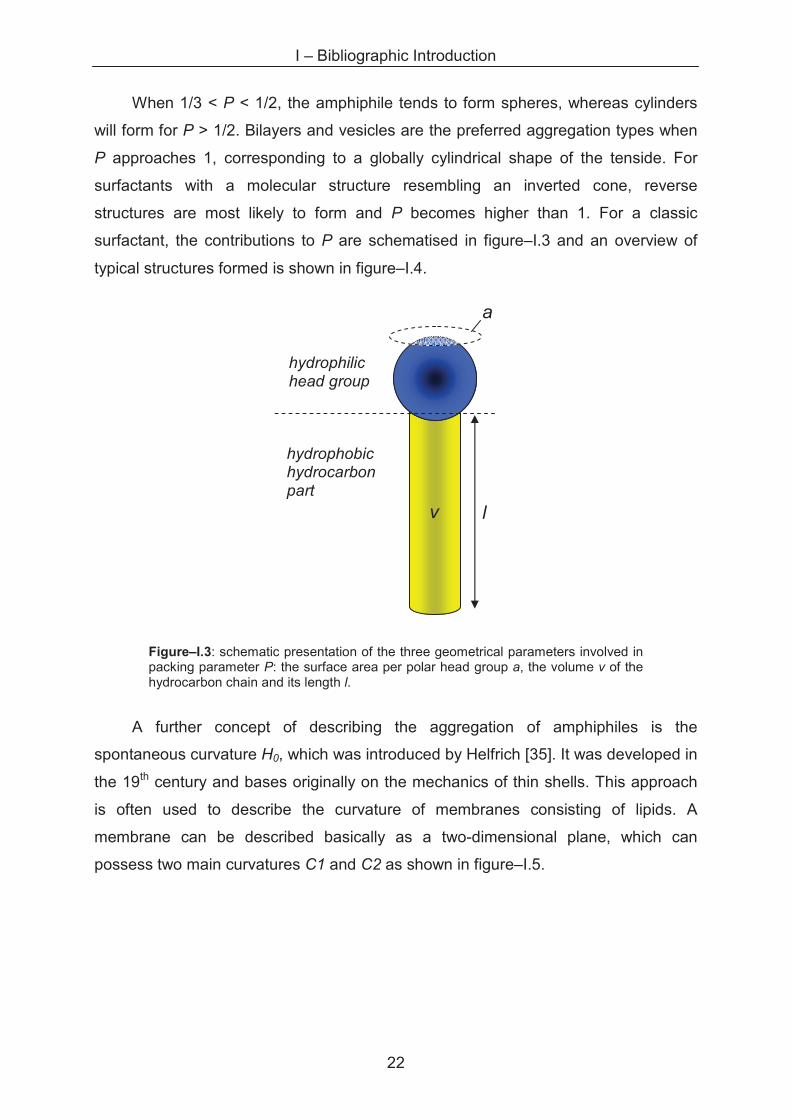
surfactant, the contributions to P are schematised in figure–I.3 and an overview of
typical structures formed is shown in figure–I.4.
Figure–I.3: schematic presentation of the three geometrical parameters involved in packing parameter P: the surface area per polar head group a, the volume v of the hydrocarbon chain and its length l.
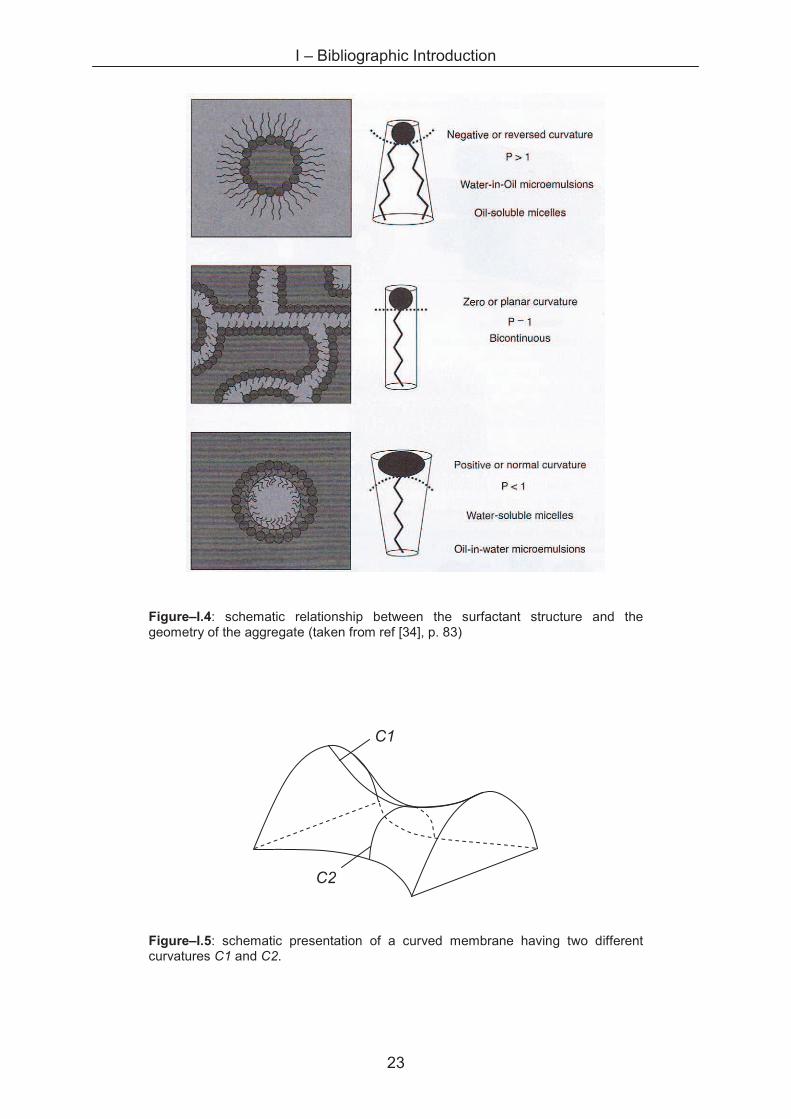
A further concept of describing the aggregation of amphiphiles is the
spontaneous curvature H0, which was introduced by Helfrich [35]. It was developed in
the 19th century and bases originally on the mechanics of thin shells. This approach
is often used to describe the curvature of membranes consisting of lipids. A
membrane can be described basically as a two-dimensional plane, which can
possess two main curvatures C1 and C2 as shown in figure–I.5.
l v
a
hydrophilic head group
hydrophobic hydrocarbon part
I – Bibliographic Introduction
23
C1
C2
Figure–I.4: schematic relationship between the surfactant structure and the geometry of the aggregate (taken from ref [34], p. 83)
Figure–I.5: schematic presentation of a curved membrane having two different curvatures C1 and C2.
I – Bibliographic Introduction
24
Depending on the molecular structure of the lipid a slightly positive or negative
spontaneous curvature is often introduced. This concept is applied on bicontinuous
liquid crystalline phases in which the free energy depends mostly on elasticity and
rigidity of the curved surfactant film. A comprehensive overview of the different
concepts and the points they have in common was given recently by Kunz et al. for
CiEj nonionic surfactants [36].
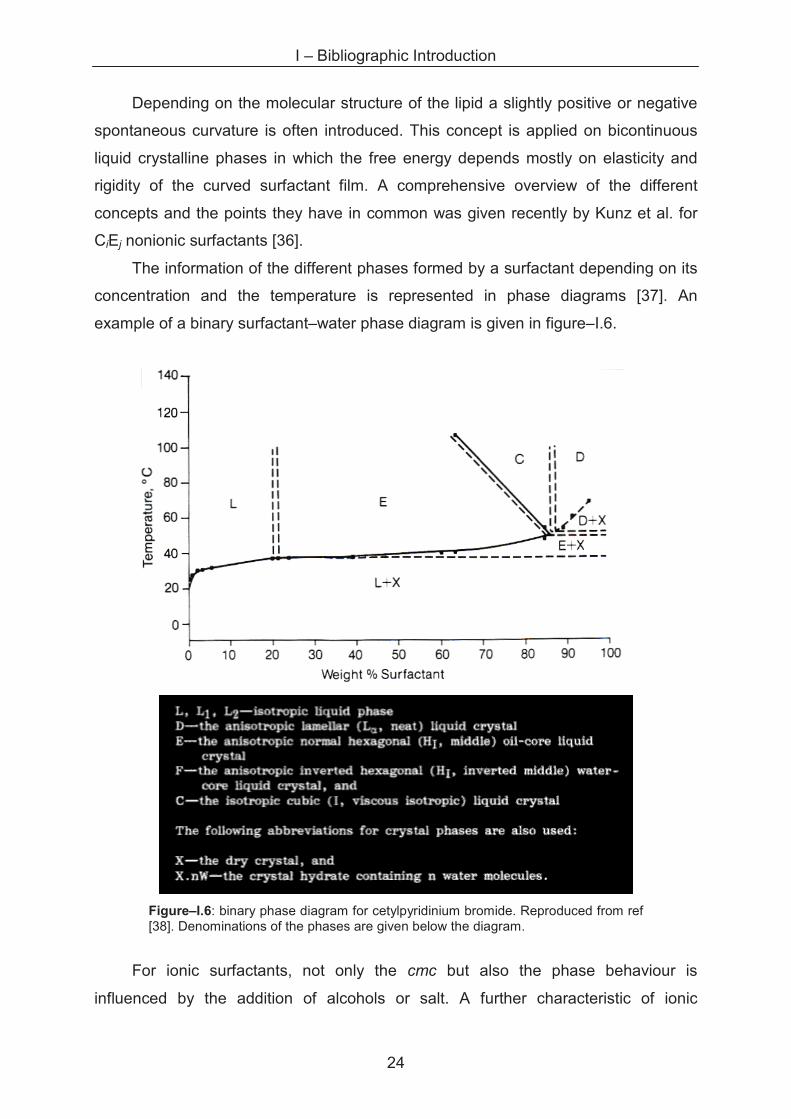
The information of the different phases formed by a surfactant depending on its
concentration and the temperature is represented in phase diagrams [37]. An
example of a binary surfactant–water phase diagram is given in figure–I.6.
Figure–I.6: binary phase diagram for cetylpyridinium bromide. Reproduced from ref [38]. Denominations of the phases are given below the diagram.
For ionic surfactants, not only the cmc but also the phase behaviour is
influenced by the addition of alcohols or salt. A further characteristic of ionic
I – Bibliographic Introduction
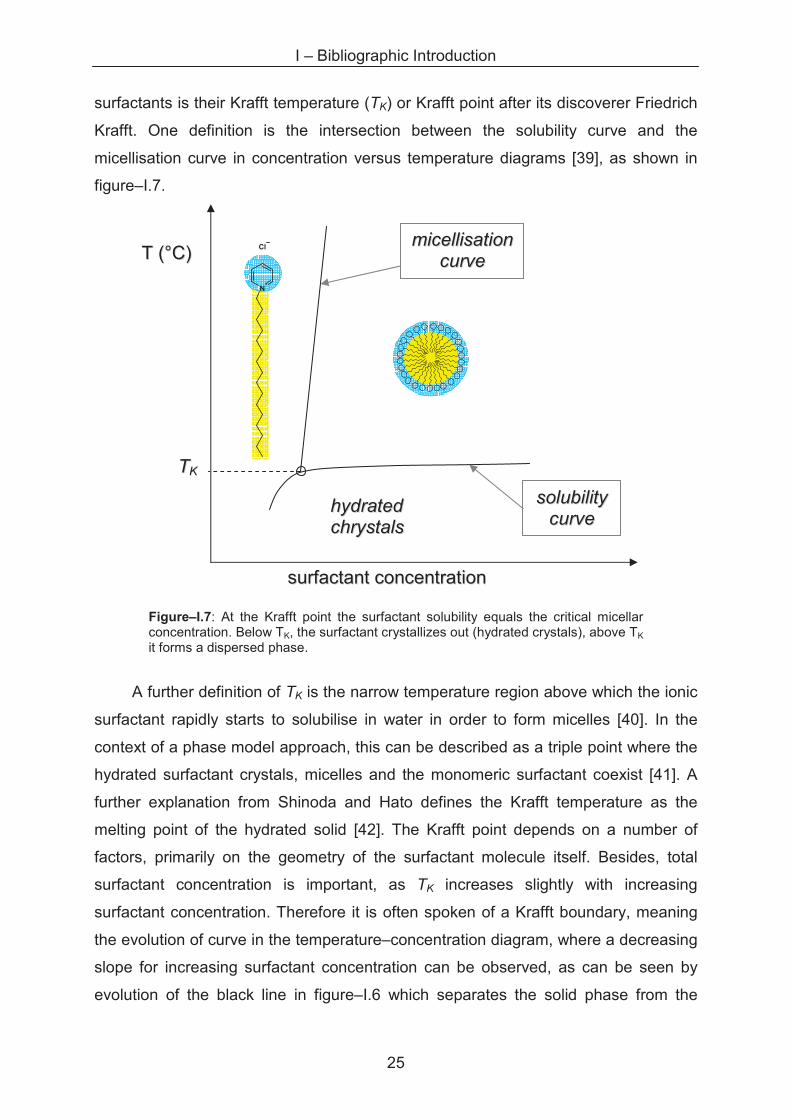
25
surfactants is their Krafft temperature (TK) or Krafft point after its discoverer Friedrich
Krafft. One definition is the intersection between the solubility curve and the
micellisation curve in concentration versus temperature diagrams [39], as shown in
figure–I.7.
Figure–I.7: At the Krafft point the surfactant solubility equals the critical micellar concentration. Below TK, the surfactant crystallizes out (hydrated crystals), above TK
it forms a dispersed phase.
A further definition of TK is the narrow temperature region above which the ionic
surfactant rapidly starts to solubilise in water in order to form micelles [40]. In the
context of a phase model approach, this can be described as a triple point where the
hydrated surfactant crystals, micelles and the monomeric surfactant coexist [41]. A
further explanation from Shinoda and Hato defines the Krafft temperature as the
melting point of the hydrated solid [42]. The Krafft point depends on a number of
factors, primarily on the geometry of the surfactant molecule itself. Besides, total
surfactant concentration is important, as TK increases slightly with increasing
surfactant concentration. Therefore it is often spoken of a Krafft boundary, meaning
the evolution of curve in the temperature–concentration diagram, where a decreasing
slope for increasing surfactant concentration can be observed, as can be seen by
evolution of the black line in figure–I.6 which separates the solid phase from the
hhyyddrraatteedd
cchhrryyssttaallss
TTKK
TT ((°°CC))
ssuurrffaaccttaanntt ccoonncceennttrraattiioonn
ssoolluubbiilliittyy
ccuurrvvee
mmiicceelllliissaattiioonn
ccuurrvvee
N+
Cl
I – Bibliographic Introduction
26
liquid crystalline phases. A further influence on TK comes from the addition of salt to
the surfactant solution [43, 44].
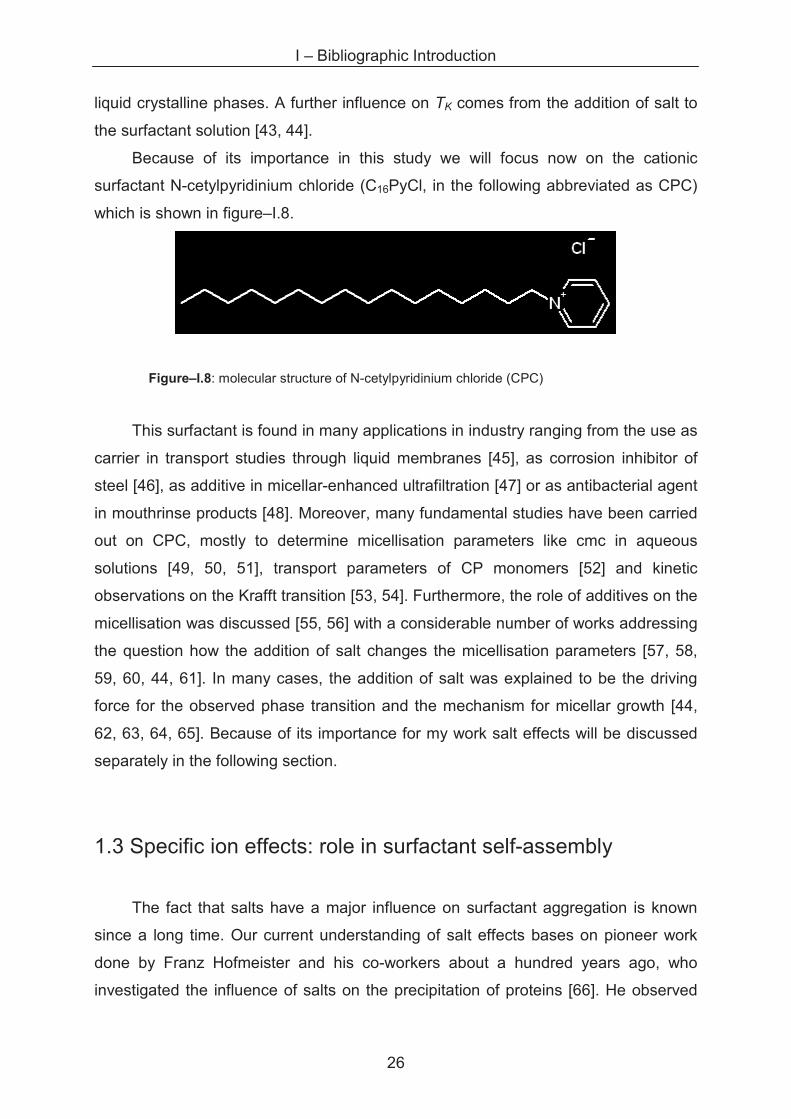
Because of its importance in this study we will focus now on the cationic
surfactant N-cetylpyridinium chloride (C16PyCl, in the following abbreviated as CPC)
which is shown in figure–I.8.
Figure–I.8: molecular structure of N-cetylpyridinium chloride (CPC)
This surfactant is found in many applications in industry ranging from the use as
carrier in transport studies through liquid membranes [45], as corrosion inhibitor of
steel [46], as additive in micellar-enhanced ultrafiltration [47] or as antibacterial agent
in mouthrinse products [48]. Moreover, many fundamental studies have been carried
out on CPC, mostly to determine micellisation parameters like cmc in aqueous
solutions [49, 50, 51], transport parameters of CP monomers [52] and kinetic
observations on the Krafft transition [53, 54]. Furthermore, the role of additives on the
micellisation was discussed [55, 56] with a considerable number of works addressing
the question how the addition of salt changes the micellisation parameters [57, 58,
59, 60, 44, 61]. In many cases, the addition of salt was explained to be the driving
force for the observed phase transition and the mechanism for micellar growth [44,
62, 63, 64, 65]. Because of its importance for my work salt effects will be discussed
separately in the following section.
1.3 Specific ion effects: role in surfactant self-assembly
The fact that salts have a major influence on surfactant aggregation is known
since a long time. Our current understanding of salt effects bases on pioneer work
done by Franz Hofmeister and his co-workers about a hundred years ago, who
investigated the influence of salts on the precipitation of proteins [66]. He observed
I – Bibliographic Introduction
27
that the solubility of many proteins depends on the electrolyte concentration and
differs for each electrolyte used. Soon, he discovered that anions appeared to have a
greater impact on the solubility than cations, which is due to a higher polarisability of
their valence electrons and interplay of hydration and dispersion forces. In the
following, he proposed a classification of the anions and cations depending on their
capacity to increase or to decrease protein solubility. The resulting series for anions
is [67, 68]:
SO42- > HPO4
2- > OH- > F- > HCOO- > PO43- > CH3COO- > Cl- > Br- > I- > NO3
- >
ClO4- > SCN-
Cl- marks a borderline case: the ions on the left side of Cl- reduce protein
solubility and are called salting-out, kosmotropes or water-structure-makers. The
tendency of these ions to stay well-hydrated in solution favours the attractive
interaction between the hydrophobic surface patches of proteins, which leads to the
folding of the proteins and their precipitation. Contrarily, the ions on the right side of
Cl- increase protein solubility, by interacting with the hydrophobic patches of the
proteins, preventing them from folding and stabilizing them thus in solution. They are
called salting-in, chaotropes or water-structure-breakers. It has to be mentioned that
the series is often given without the coion, which is H+ in our case.
Despite their less pronounced effects, cations can be ordered in a similar way
as anions as shown in the following series:
Ba2+ > Ca2+ > Mg2+ > Li+ > Na+ > K+ > Rb+� Cs+ > NH4
+.
Here, the sodium ion occupies the borderline position between kosmotropic ions
on the left side and chaotropic ions on the right side. These two classifications are
called lyotropic or Hofmeister series. Their influence on colloids and soft matter has
been studied extensively; even inversions of the series have been observed for some
systems [68, 69, 70, 71, 72]. In this context, ion pairing was described by Collins to
be a critical parameter influencing the micellar properties [73]. It was suggested that
kosmotropes better form ion pairs with other kosmotropes and chaotropes pair with
chaotropes, by preferring counterions with similar free energy of hydration. This ion
pairing tendency will contribute to the free energy of the system, as ion pairs are less
I – Bibliographic Introduction
28
hydrated than dissociated ions. Indeed, it was shown by Hedin that the micellar
surface perturbs the hydration shell of bromide more than those of chloride ions [74,
75]. Ninham introduced another approach by claiming that better polarisable
chaotropic ions have stronger dispersion interactions with interfaces than their
kosmotropic counterparts [76]. Furthermore, Leontidis stated that dispersion forces
might not be the only reason for the Hofmeister series and that there are indications
of anions acting through direct interactions with surfaces [70].
In last years, the role of interfacial hydration on aggregation parameters like
size and shape has been discussed. In this context we talk about “interfacial” water
(in contrast to the “bulk” water) as an integral part of the aggregation structure.
Therefore, the aggregate structure is sensitive to the balance of short-range
interactions within the interfacial region between the hydrophobic effect and the free
energy of hydration of counterions and head groups. Hence, sphere-to-rod transitions
of amphiphiles depend on the amphiphile as well as on the type and concentration of
the counterion. This transition occurs as a consequence of the dehydration of the
interfacial region, which favours the formation of head group–counterion pairs as
evidenced from chemical trapping experiments [77, 78]. Recently, also the surfactant
head groups were considered as chaotropic or kosmotropic moieties, which formed
the basis of interesting papers [71, 79]. One aim was to establish a Hofmeister series
for surfactant head-groups in order to explain and predict their interaction with a
given type of counterion. Alkyl sulphate head groups were classified as chaotropes
while alkyl carboxylates were considered as kosmotropes.
It was pointed out by Leontidis, that one of the main challenges to correctly
study Hofmeister ions is the observed phenomena are influenced by both anions and
cations of an electrolyte [70]. In this context, it is surprising that many studies of salt
effects on surfactant aggregation in the past years use mixtures of counterions in
their solutions and create thus more complex situations [60, 61, 80]. Up to now the
influence of anions onto the self-assembly was of central the interest because of their
more pronounced effects [61, 81]. The bulk cations, often fixed as Na+ or K+, which
are also present due to the dissociation of the salt were not considered in the studies,
but they should not be fully neglected [82].
I – Bibliographic Introduction
29
References
[1] WORLD NUCLEAR ASSOCIATION (W.N.A.): “Overview of nuclear energy”, 2010.
[2] VAN NERO JUNIOR, A.: "A guidebook to nuclear reactors". University of California press, Los Angeles, USA, 1979.
[3] GUILLAUMONT, R., AND PRADEL, P.: "Monographie DEN: le traitment-recyclage du combustible nucléaire usé". Commissariat à l’énergie atomique (CEA), 2008.
[4] EWING, R.: "Glass as a waste form and vitrification technology: Summary of an Internal Workshop". National Academic Press, 1996.
[5] BULLEN, D., SAGUES, A., CRAIG, P., DI BELLA, C., AND SEVERSON, K.: "Materials performance issues for high-level radioactive waste packages". Journal Of The Minerals Metals & Materials Society 52, 9 (Sep 2000), 30–33.
[6] ANSARI, S., PATHAK, P., HUSAIN, M., PRASAD, A., PARMAR, V., AND MANCHANDA, V.: "Extraction chromatographic studies of metal ions using n,n,n,n-tetraoctyl diglycolamide as the stationary phase". Talanta 68, 4 (Feb 15, 2006), 1273–1280.
[7] BOWMAN, C., ARTHUR, E., LISOWSKI, P., LAWRENCE, G., JENSEN, R., ANDERSON, J.,BLIND, B., CAPPIELLO, M., DAVIDSON, J., ENGLAND, T., ENGEL, L., HAIGHT, R.,HUGHES, H., IRELAND, J., KRAKOWSKI, R., LABAUVE, R., LETELLIER, B., PERRY, R.,RUSSELL, G., STAUDHAMMER, K., VERSAMIS, G., AND WILSON, W.: "Nuclear-energy generation and waste transmutation using an accelerator-driven intense thermal-neutron source". Nuclear Instruments & Methods In Physics Research Section A-accelerators Spectrometers Detectors And Associated Equipment 320, 1-2 (Aug 15, 1992), 336–367.
[8] BOWMAN, C.: "Accelerator-driven systems for nuclear waste transmutation". Annual Review Of Nuclear And Particle Science 48, (1998), 505–556.
[9] GLORIS, M., MICHEL, R., SUDBROCK, F., HERPERS, U., MALMBORG, P., AND
HOLMQVIST, B.: "Proton-induced production of residual radionuclides in lead at intermediate energies". Nuclear Instruments & Methods In Physics Research Section A-accelerators Spectrometers Detectors And Associated Equipment 463, 3 (May 11, 2001), 593–633.
[10] ANDERSON, H., AND ASPREY, L.: "Solvent extraction process for plutonium", May 1947.
[11] NUCLEAR ENERGY ASSOCIATION (N.E.A.): "Trends in the nuclear fuel cycle: economic, environmental and social aspects". OECD Publishing, 2002. ISBN: 9789264196643.
I – Bibliographic Introduction
30
[12] WORLD NUCLEAR ASSOCIATION: “Reprocessing used fuel: PUREX flow sheet”. website, electronic, October 2007.
(http://www.world-nuclear.org/education/chem.htm)
[13] SATO, T., NAKAMURA, T., AND KUWAHARA, M.: "Diluent effect on the extraction of uranium(VI) from hydrochloric acid solutions by trioctylamine". Solvent Extraction and Ion Exchange 3, 3 (1985), 283–307.
[14] SATO, T., NAKAMURA, T., AND KUWAHARA, M.: "Determination of the heat change in the extraction of divalent copper, zinc and cadmium from hydrochloric acid solutions by trioctylmethylammonium chloride in various organic solvents". Thermochimica Acta 92, (1985), 305–308.
[15] MYASOEDOV, B., MILYUKOVA, M., MALIKOV, D., KUZOVKINA, Y., AND VAREZHKINA, N.: "Extraction of americium (IV) by dioctylamine prom sulfuric acid solutions containing a completing agent". Solvent Extraction and Ion Exchange 3, 4 (1985), 417–426.
[16] MILYUKOVA, M., VAREZHKINA, N., AND MYASOEDOV, B.: "Extraction of rare earth elements by high molecular weight amines from nitric acid solutions". Journal of Radioanalytical and Nuclear Chemistry 105, (1986), 249–256.
[17] MILYUKOVA, M., VAREZHKINA, N., AND MYASOEDOV, B.: "Extraction of trivalent lanthanides and actinides by primary amines". Journal of Radioanalytical and Nuclear Chemistry 121, (1988), 403–408. 10.1007/BF02041427.
[18] MADIC, C., J. HUDSON, M., LILJENZIN, J.-O., GLATZ, J.-P., NANNICINI, R., FACCHINI,A., KOLARIK, Z., AND ODOJ, R.: "Recent achievements in the development of partitioning processes of minor actinides from nuclear wastes obtained in the frame of the newpart european programme (1996-1999)". Progress in Nuclear Energy 40, 3-4 (2002), 523–526.
[19] MINCHER, B., GIUSEPPE, M., AND MEZYK, S.: "Review: The effects of radiation chemistry on solvent extraction 4: Separation of the trivalent actinides and considerations for radiation-resistant solvent systems". Solvent Extraction And Ion Exchange 28, 4 (2010), 415–436.
[20] BERTHON, L., MOREL, J., ZORZ, N., NICOL, C., VIRELIZIER, H., AND MADIC, C.: “DIAMEX process for minor actinide partitioning: Hydrolytic and radiolytic degradations of malonamide extractants". Separation Science And Technology 36, 5-6 (2001), 709–728. 11th Symposium on Separation Science and Technology for Energy Applications, Gatlinburg, Tennessee, Oct 17-21, 1999.
[21] PAIVA, A., AND MALIK, P.: "Recent advances on the chemistry of solvent extraction applied to the reprocessing of spent nuclear fuels and radioactive wastes". Journal of Radioanalytical and Nuclear Chemistry 261, (2004), 485–496.
[22] ZILBERMAN, B., PUZIKOV, E., RYABKOV, D., MAKARYCHEV-MIKHAILOV, M., SHADRIN,A., FEDOROV, Y., AND SIMONENKO, V.: "Development, analysis, and simulation of
I – Bibliographic Introduction
31
a technological structure for reprocessing irradiated nuclear fuel from nuclear power plants by water-extraction methods". Atomic Energy 107, (2009), 333–347.
[23] ERLINGER, C., GAZEAU, D., ZEMB, T., MADIC, C., LEFRANCOIS, L., HEBRANT, M., AND
TONDRE, C.: "Effect of nitric acid extraction on phase behavior, microstructure and interactions between primary aggregates in the system dimethyldibutyltetradecylmalonamide (DMDBTDMA) / n-dodecane / water: a phase analysis and small angle X-ray scattering (SAXS) characterisation study". Solvent Extraction and Ion Exchange 16, 3 (1998), 707–738.
[24] TESTARD, F., BAUDUIN, P., MARTINET, L., ABECASSIS, B., BERTHON, L., MADIC, C.,AND ZEMB, T.: "Self-assembling properties of malonamide extractants used in separation processes". Radiochimica Acta 96, 4-5 (May 2008), 265–272.
[25] STRNAD, J., HECKMANN, K., AND GOMPPER, K.: "Separation of plutonium from intermediate level liquid waste by precipitation with alkyl-pyridinium nitrates". Monatshefte Für Chemie 120, 1 (Jan. 1989), 21–23.
[26] STRNAD, J., AND HECKMANN, K.: "Separation of actinides with alkylpyridinium salts". Journal Of Radioanalytical And Nuclear Chemistry-Articles 163, 1 (Nov. 1992), 47–57.
[27] SPURNY, J., HECKMANN, K., MAINKA, E., AND COERDT, W.: "Fällung der anionischen Nitratkomplexe von Ce4+ und Pu4+ mit Cetylpyridiniumnitrat". Monatshefte für Chemie 118 (1987), 789–791.
[28] HECKMANN, K. AND SPURNY, J.: "Process for selective separation of plutonium from uranium and other metals", United States Patent 4,609,533. Sep 2, 1986.
[29] HECKMANN, K. AND SPURNY, J.: "Process for the selective separation of uranium from accompanying metals", United States Patent 4,486,392. Dec 4, 1984.
[30] TANFORD, C.: "Hydrophobic effect and organization of living matter". Science 200, 4345 (1978), 1012–1018.
[31] GRIFFIN, W. J. Soc. Cosmetic Chemists 1 (1949), 311.
[32] SALAGER, J., MARQUEZ, N., GRACIAA, A., AND LACHAISE, J.: "Partitioning of ethoxylated octylphenol surfactants in microemulsion-oil-water systems: Influence of temperature and relation between partitioning coefficient and physicochemical formulation". Langmuir 16, 13 (Jun 27, 2000), 5534–5539.
[33] ISRAELACHVILI, J., MITCHELL, D., AND NINHAM, B.: "Theory of self-assembly of hydrocarbon amphiphiles into micelles and bilayers". Journal of the Chemical Society - Faraday Transactions II 72, (1976), 1525–1568.
[34] COSGROVE, T.: "Colloid Science", 2nd Edition, Wiley-VCH, 2010.
[35] HELFRICH, W., Z. Naturforschung 82c (1973), 693.
I – Bibliographic Introduction
32
[36] KUNZ, W., TESTARD, F., AND ZEMB, T.: "Correspondence between curvature, packing parameter, and hydrophilic-lipophilic deviation scales around the phase-inversion temperature". Langmuir 25, 1 (Jan 6, 2009), 112–115.
[37] LAUGHLIN, R.: "The aqueous phase behavior of surfactants". Academic Press Ltd., 1994.
[38] RUBINGH, D., AND HOLLAND, P.: "Cationic Surfactants - Physical Chemistry", 1st Edition, Surfactants science series – Volume 37, CRC press, 1990.
[39] EVANS, F., AND WENNERSTRÖM, H.: "The Colloidal Domain: Where Physics, Chemistry, Biology and Technology meet". 2nd Edition, Wiley-VCH, 1999.
[40] KRAFFT, F., AND WIGLOW, H.; Berichte der Bunsen-Gesellschaft 28, (1895), 2566.
[41] SHINODA, K., AND HUTCHINSON, E.: "Pseudo-phase separation model for thermodynamic calculations on micellar solutions". The Journal of Physical Chemistry 66, 4 (Apr. 1962), 577–582.
[42] SHINODA, K., HATO, M., AND HAYASHI, T.: "Physicochemical properties of aqueous solutions of fluorinated surfactants". The Journal of Physical Chemistry 76, 6 (1972), 909–914.
[43] HECKMANN, K., SCHWARZ, R., AND STRNAD, J.: "Determination of Krafft point and cmc of hexadecylpyridinium salts in electrolyte solutions". Journal of Colloid and Interface Science 120, 1 (Nov. 1987), 114–117.
[44] VARADE, D., JOSHI, T., ASWAL, V., GOYAL, P., HASSAN, P., AND BAHADUR, P.: "Effect of salt on the micelles of cetyl pyridinium chloride". Colloids and Surfaces A: Physicochemical and Engineering Aspects 259, 1-3 (2005), 95–101.
[45] ALIZADEH, N., SALIMI, S., AND JABBARI, A.: "Transport study of palladium through a bulk liquid membrane using hexadecylpyridinium as carrier". Separation and Purification Technology 28, 3 (Sep 1, 2002), 173–180.
[46] ATIA, A., AND SALEH, M.: "Inhibition of acid corrosion of steel using cetylpyridinium chloride". Journal of Applied Electrochemistry 33, 2 (Feb 2003), 171–177.
[47] BAEK, K., AND YANG, J.: "Competitive bind of anionic metals with cetylpyridinium chloride micelle in micellar-enhanced ultrafiltration". Desalination 167, 1-3, Sp. Iss. SI (Aug 15, 2004), 101–110.
[48] JENKINS, S., ADDY, M., WADE, W., AND NEWCOMBE, R.: "The magnitude and duration of the effects of some mouthrinse products on salivary bacterial counts". Journal of Clinical Periodontology 21, 6 (Jul, 1994), 397–401.
[49] ANACKER, E.: "Light scattering by cetylpyridinium chloride solutions". Journal of Physical Chemistry 62, 1 (1958), 41–45.
I – Bibliographic Introduction
33
[50] STIGTER, D.: "Micelle formation by ionic surfactants 2. Specificity of head groups, micelle structure". Journal of Physical Chemistry 78, 24 (1974), 2480–2485.
[51] STIGTER, D.: "Micelle formation by ionic surfactants 1. 2-phase model, Gouy-Chapman model, hydrophobic interactions". Journal of Colloid And Interface Science 47, 2 (1974), 473–482.
[52] BHAT, M., DAR, A., AMIN, A., RASHID, P., AND RATHER, G.: "Temperature dependence of transport and equilibrium properties of alkylpyridinium surfactants in aqueous solutions". The Journal of Chemical Thermodynamics 39, 11 (Nov 2007), 1500–1507.
[53] SASAKI, S.: "Metastable crystalline lamella of cetylpyridinium chloride in the Krafft transition". Journal of Physical Chemistry B 111, 10 (Mar 15, 2007), 2473–2476.
[54] SASAKI, S.: "Kinetic studies on hydrated solid transform of cetylpyridinium chloride in aqueous solution". Journal of Physical Chemistry B 113, 25 (Jun 25, 2009), 8545–8551.
[55] PANDEY, S., ACREE, W., AND FETZER, J.: "Spectroscopic investigations in molecularly organized solvent media. part 5. Fluorescence behaviour of polycyclic aromatic hydrocarbons dissolved in cetylpyridinium chloride plus zwitterionic and cetyltrimethylammonium chloride plus zwitterionic mixed surfactant systems". Talanta 47, 3 (Nov. 1998), 769–778.
[56] ZDZIENNICKA, A.: "The adsorption tendency of cetylpyridinium bromide at water-air interface and micelles formation in the presence of propanol". Colloids and Surfaces A: Physicochemical and Engineering Aspects 325, 1-2 (July 2008), 93–100.
[57] ANACKER, E., AND GHOSE, H.: "Counterions and micelle size. 2. Light scattering by solutions of cetylpyridinium salts". Journal of the American Chemical Society 90, 12 (1968), 3161+.
[58] PORTE, G., APPELL, J., AND POGGL, Y.: "Experimental investigations of the flexibilty of elongated cetylpyridinium bromide micelles". Journal of Physicals Chemistry 84, 23 (1980), 3105–3110.
[59] PORTE, G., AND APPELL, J.: "Growth and size distributions of cetylpyridinium bromide micelles in high ionic strength aqueous solutions". The Journal of Physical Chemistry 85, 17 (Aug 1981), 2511–2519.
[60] KUMAR, S., BANSAL, D., AND KABIR-UD-DIN.: "Micellar growth in the presence of salts and aromatic hydrocarbons: influence of the nature of the salt". Langmuir 15, 15 (July 1999), 4960–4965.
I – Bibliographic Introduction
34
[61] ABEZGAUZ, L., KUPERKAR, K., HASSAN, P. A., RAMON, O., BAHADUR, P., AND
DANINO, D.: "Effect of Hofmeister anions on micellization and micellar growth of the surfactant cetylpyridinium chloride". Journal Of Colloid And Interface Science 342, 1 (Feb 1, 2010), 83–92.
[62] IMAE, T., AND IKEDA, S.: "Characteristics of rodlike micelles of cetyltrimethyl-ammonium chloride in aqueous NaCl solutions - their flexibilty and the scaling laws in dilute and semidilute regimes". Colloid and Polymer Science 265, 12 (Dec 1987), 1090–1098.
[63] IKEDA, S., AND FUJIO, K.: "The salt-induced sphere-rod transition of micelles of dodecylpyridinium iodide in aqueous NaI solutions". Colloid And Polymer Science 270, 10 (Oct 1992), 1009–1017.
[64] HEINDL, A., AND KOHLER, H.: "Rod formation of ionic surfactants: a thermodynamic model". Langmuir 12, 10 (May 15, 1996), 2464–2477.
[65] BAUER, A., WOELKI, S., AND KOHLER, H.: "Rod formation of ionic surfactants: electrostatic and conformational energies". The Journal of Physical Chemistry B 108, 6 (Feb 2004), 2028–2037.
[66] KUNZ, W., HENLE, J., AND NINHAM, B.: "’Zur Lehre von der Wirkung der Salze’ (about the science of the effect of salts): Franz Hofmeister’s historical papers". Current Opinion in Colloid and Interfaces Science 9, 1-2 (Aug 2004), 19–37.
[67] ZHANG, Y., AND CREMER, P.: "Interactions between macromolecules and ions: The Hofmeister series". Current Opinion in Chemical Biology 10, 6 (2006), 658–663. Model systems / Biopolymers.
[68] PINNA, M., BAUDUIN, P., TOURAUD, D., MONDUZZI, M., NINHAM, B., AND KUNZ, W.: "Hofmeister effects in biology: Effect of choline addition on the salt-induced super activity of horseradish peroxidase and its implication for salt resistance of plants". Journal Of Physical Chemistry B 109, 34 (Sep 1, 2005), 16511–16514.
[69] SCHWIERZ, N., HORINEK, D., AND NETZ, R.: "Reversed anionic Hofmeister series: The interplay of surface charge and surface polarity". Langmuir 26, 10 (May 18, 2010), 7370–7379.
[70] LEONTIDIS, E.: "Hofmeister anion effects on surfactant self-assembly and the formation of mesoporous solids". Current Opinion in Colloid & Interface Science 7, 1-2 (2002), 81–91.
[71] VLACHY, N., JAGODA-CWIKLIK, B., VÁCHA, R., TOURAUD, D., JUNGWIRTH, P., AND
KUNZ, W.: "Hofmeister series and specific interactions of charged headgroups with aqueous ions". Advances in Colloid and Interface Science 146, 1-2 (2009), 42–47.
[72] LO NOSTRO, P., LO NOSTRO, A., NINHAM, B., PESAVENTO, G., FRATONI, L., AND
BAGLIONI, P.: "Hofmeister specific ion effects in two biological systems". Current Opinion in Colloid & Interface Science 9, 1-2 (2004), 97–101.
I – Bibliographic Introduction
35
[73] COLLINS, K.: "Charge density-dependent strength of hydration and biological structure". Biophysical Journal 72, 1 (Jan 1997), 65–76.
[74] HEDIN, N., AND FURO, I.: "Fast diffusion of Br- ions on a micellar surface". The Journal of Physical Chemistry B 103, 44 (1999), 9640–9644.
[75] HEDIN, N., FURO, I., AND ERIKSSON, P. O.: "Fast diffusion of the Cl- ion in the headgroup region of an oppositely charged micelle. A 35Cl–NMR spin relaxation study". The Journal of Physical Chemistry B 104, 35 (2000), 8544–8547.
[76] BOSTROM, M., WILLIAMS, D. R. M., AND NINHAM, B. W.: "Ion specificity of micelles explained by ionic dispersion forces". Langmuir 18, 16 (2002), 6010–6014.
[77] GENG, Y., ROMSTED, L., FROEHNER, S., ZANETTE, D., MAGID, L., CUCCOVIA, I., AND
CHAIMOVICH, H.: "Origin of the sphere-to-rod transition in cationic micelles with aromatic counterions: specific ion hydration in the interfacial region matters". Langmuir 21, 2 (Jan 18, 2005), 562–568.
[78] ROMSTED, L.: "Do amphiphile aggregate morphologies and interfacial compositions depend primarily on interfacial hydration and ion-specific interactions? The evidence from chemical trapping". Langmuir 23, 2 (Jan 16, 2007), 414–424.
[79] VLACHY, N., DRECHSLER, M., VERBAVATZ, J.-M., TOURAUD, D., AND KUNZ, W.: "Role of the surfactant headgroup on the counterion specificity in the micelle-to-vesicle transition through salt addition". Journal of Colloid and Interface Science 319, 2 (Mar 15, 2008), 542–548.
[80] ASWAL, V., GOYAL, P., MENON, S., AND DASANNACHARYA, B.: "Role of inter-micellar interaction on micellar growth". Physica B 213, (Aug 1995), 607–609.
[81] ASWAL, V., AND GOYAL, P.: "Role of counterion distribution on the structure of micelles in aqueous salt solutions: small-angle neutron scattering study". Chemical Physics Letters 357, 5-6 (May 17, 2002), 491–497.
[82] BHAT, M., DAR, A., AMIN, A., AND RATHER, G.: "Co- and counterion effect on the micellization characteristics of dodecylpyridinium chloride". Journal of Dispersion Science and Technology 29, 4 (Apr 2008), 514–520.

I – Bibliographic Introduction
36
II – Effects of anions on the self-assembly of cetylpyridinium surfactants
37
Chapter II – Effects of anions on the self-assembly
of cetylpyridinium surfactants
2.1 Introduction
The major interest of this study is hence to determine the influence of different
anions (but avoiding their mixtures) on micellisation parameters of cetylpyridinium
including the micellar radius r, the aggregation number NAgg, the Krafft temperature
TK, the cmc as well as the head group area a. We considered different anions in the
lyotropic series in this work. Chloride was chosen because of its central position in
the lyotropic series, being the reference ion for cetylpyridinium chloride. Furthermore,
cetylpyridinium chloride can be directly purchased. The more chaotropic nitrate was
chosen because of its interest in nuclear waste treatment, as the majority of the
recycling processes use nitric acid. In order to have a monovalent hydrophilic
counterion, we tested acetate, but found that CP did not show suitable Krafft
temperatures to work with this counterion. In order to keep the carboxylate function,
the divalent oxalate was taken, as it is also used in oxalate precipitation processes in
nuclear waste treatment. Up to our knowledge, cetylpyridinium oxalate is not
characterised until now.
For this study, various techniques including light-, X-ray- and neutron scattering
have been carried out. The obtained results are interpreted in terms of counterion
adsorption in the framework of current understanding of ion effects. Furthermore, the
data obtained for the aggregation of cetylpyridinium are introduced in a free energy
model adapted for this surfactant system in order to describe the different energetic
contributions to micellisation. The model consists of a surface energy term, an
expression containing the non-electrostatic (steric) repulsion energy and finally a
term for the lateral electrostatic repulsion. By minimising this equation with respect to
the surface area per head group a, one obtains the lateral equation of state (EOS)
which yields the total free energy of micellisation. While standard models are taken
for the first two terms, the electrostatic contribution is generated by a modified
II – Effects of anions on the self-assembly of cetylpyridinium surfactants
38
Poisson-Boltzmann approach accounting for the differences in the nature of the
counterions.
2.2 Results and Discussion
2.2.1 Micellisation parameters
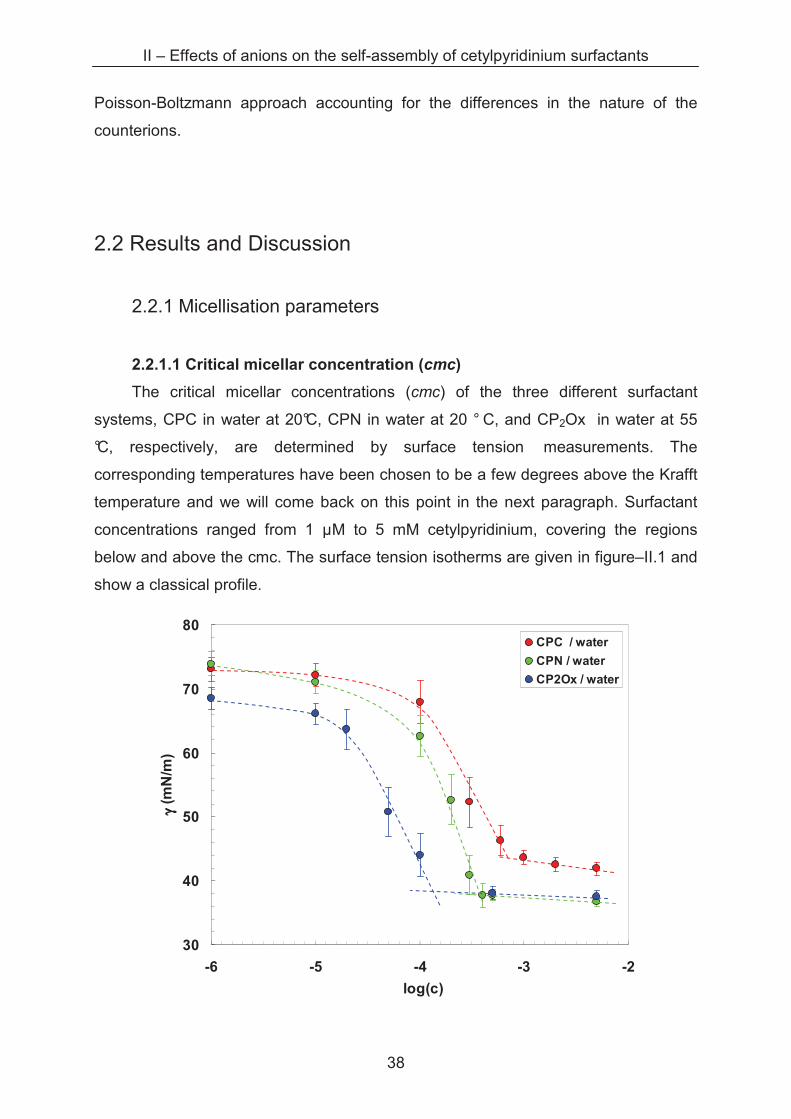
2.2.1.1 Critical micellar concentration (cmc)
The critical micellar concentrations (cmc) of the three different surfactant
systems, CPC in water at 20°C, CPN in water at 20 ° C, and CP2Ox in water at 55
°C, respectively, are determined by surface tension measurements. The
corresponding temperatures have been chosen to be a few degrees above the Krafft
temperature and we will come back on this point in the next paragraph. Surfactant
concentrations ranged from 1 µM to 5 mM cetylpyridinium, covering the regions
below and above the cmc. The surface tension isotherms are given in figure–II.1 and
show a classical profile.
30
40
50
60
70
80
-6 -5 -4 -3 -2
log(c)
γγ γγ (m
N/m
)
CPC / water
CPN / water
CP2Ox / water
II – Effects of anions on the self-assembly of cetylpyridinium surfactants
39
Figure–II.1: Plot of the surface tensions of CPC (�), CPN (�) (at 20 °C) and CP 2Ox (�) (at 55 °C) in water as a function of the surfacta nt concentration c (mol·L-1). The slopes are drawn manually as an eyes guide.
Table–II.1: The critical micelle concentration (cmc) for cetylpyridinium chloride, nitrate (at 20 °C) and oxalate (at 55°C), respectively, in water.
surfactant system cmc (10-3 mol·L-1)
CPC / water 0.9 ± 0.2
CPN / water 0.5 ± 0.1
CP2Ox / water 0.1 ± 0.02
The cmc are determined from the intersection of the slopes and summarised in
table–II.1. The tendency of a decrease of the cmc following the sequence chloride -
nitrate is also found by Perche and Heckmann [1, 2]. The value of 0.90 mM at 20 °C
for CPC is in the range of data determined previously [3, 4, 5, 6]. The same can be
said for the 0.45 mM found for CPN at 20 °C, which is close to the one obtained by
Heckmann [1] at the same temperature. For cetylpyridinium oxalate a lower cmc
value of 0.1 mM is determined. This can be explained by considering a strong
complexation of the pyridinium head groups by the divalent counterion, which
reduces the electrostatic interaction between the head groups and promotes
micellisation. An IR spectrum recorded from the dry cetylpyridinium oxalate powder
shows no C–O–H bending between 1395 and 1440 cm-1 and no broad O–H vibration
between 2500 and 3300 cm-1. Then oxalate is fully deprotonated. Consequently, we
consider one oxalate complexing two pyridinium head groups and we thus speak of
CP2Ox.
2.2.1.2 Krafft temperature measurements
The Krafft temperature TK is measured in order to obtain information about the
solubility of the system. Prior to oxalate, the monovalent acetate counterion is tested
as stated above. Only samples in 3 M acetic acid showed positive Krafft points of
about 5 °C. However, the determination of solubilit y temperatures at lower acetate
concentrations is not possible because all samples remained soluble down to 0 °C.
For this reason it has not been possible to prepare and purify CPAc. In order to keep
the carboxylate functionality, the divalent oxalate is used, because other monovalent
carboxylates with longer hydrocarbon chains than C2 would presumably play the role
II – Effects of anions on the self-assembly of cetylpyridinium surfactants
40
of a co-surfactant for cetylpyridinium. The surfactant concentration has been 10 mM
and thus above the cmc. Krafft temperatures are determined for CPC (18 °C ) and
CPN (17 °C) in pure water, respectively. On one han d, the former value coincides
with the one obtained by Perche [2] but differs from the value reported by Heckmann
and Abezgauz (11°C) [1, 3]. On the other hand, data for CPN is in exact agreement
with the value found by Heckmann.
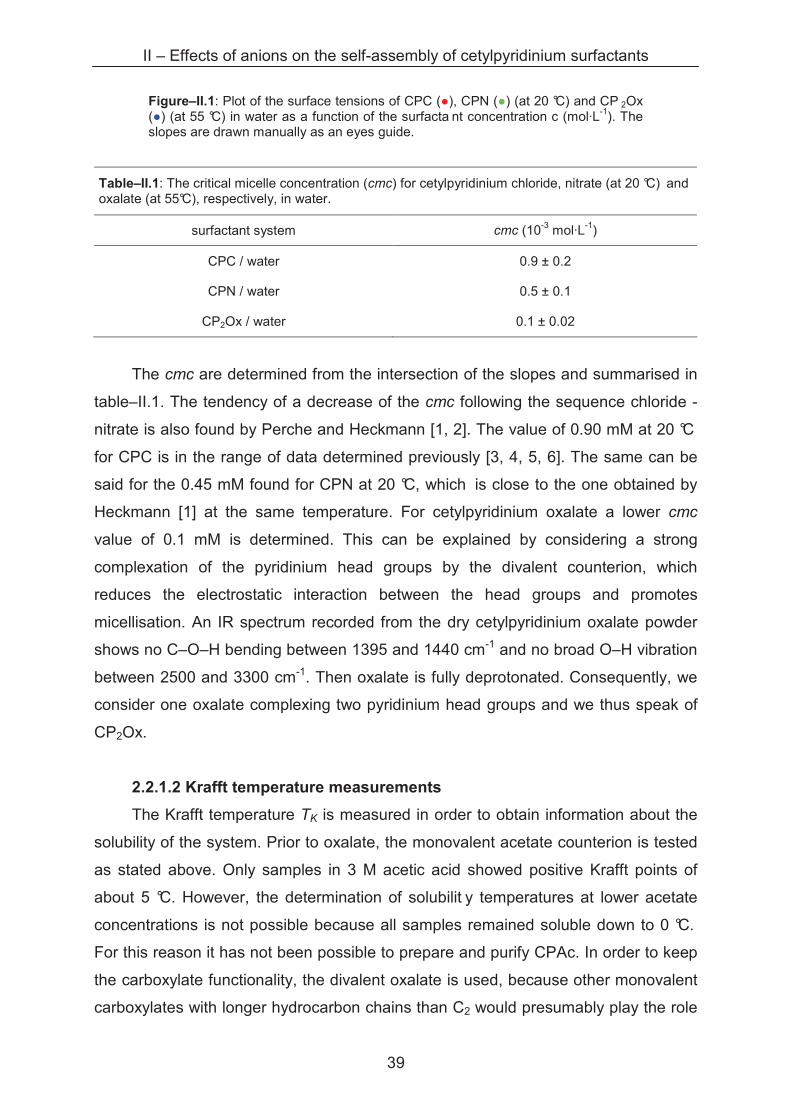
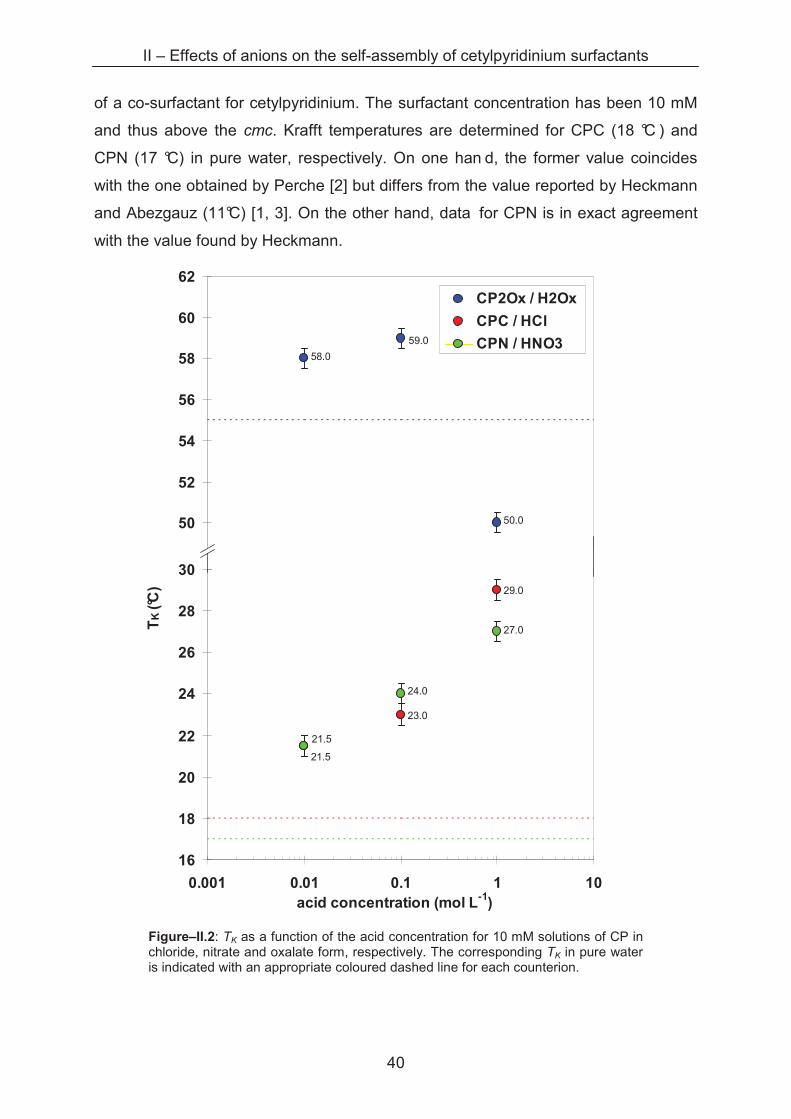
Figure–II.2: TK as a function of the acid concentration for 10 mM solutions of CP in chloride, nitrate and oxalate form, respectively. The corresponding TK in pure water is indicated with an appropriate coloured dashed line for each counterion.
58.0
59.0
50.0
48
50
52
54
56
58
60
62
0.001 0.01 0.1 1 10acid concentration (mol L-1)
CP2Ox / H2Ox
CPC / HCl
CPN / HNO3
29.0
23.0
21.5
27.0
24.0
21.5
16
18
20
22
24
26
28
30
0.001 0.01 0.1 1 10acid concentration (mol L-1)
TK (
°C)
II – Effects of anions on the self-assembly of cetylpyridinium surfactants
41
Then, Krafft temperatures of cetylpyridinium surfactants are measured as a
function of the ionic strength starting in pure water up to 1 M acid solutions, the acid
solution containing the same anion than the counter-anion of the CP. The results are
given in figure–II.2.
The Krafft temperature of cetylpyridinium with the monovalent counterions
chloride and nitrate increases with the acid concentration in the samples, the
maximal TK is about 10 °C higher than for samples in pure wat er. However, no
significant variation of TK between the samples in chloride and nitrate solutions is
determined. The solubility temperature of cetylpyridinium with the divalent oxalate
counterion is about 30 °C higher than for the two o ther counterions except for the
sample in 1 M oxalic acid. In this case TK drops even below the reference point of
CP2Ox in pure water.
From the results obtained for CPC, CPN and CP2Ox, the TK variations can be
explained under two aspects. First, TK of cetylpyridinium increases with increasing
ionic strength of the solution. This is in agreement with data reported by Nakayama
[7], who stated that the Krafft point of ionic surfactant systems increases with the
addition of salt. On the one hand, this can be explained by the screening of repulsive
interactions between the polar head groups by the counterions which allows a closer
interaction between the aliphatic chains. On the other hand, the counterions compete
for hydration water with the head groups. Both mechanisms lead to a decrease of
solubility and hence an increase of TK.
Second, the interaction of the counterion with the surfactant head group plays
an important role on solubility for surfactants. Heckmann and Perche observed an
increasing TK of cetylpyridinium with increasing polarisability of the counterions of the
halide series (Cl-, Br- and I-) [7, 21]. In their study, NO3- is positioned between Cl- and
Br-. According to Ninham, better polarisable ions act through stronger dispersion
forces with interfaces [8]. Leontidis argued that dispersion forces might not be the
only type of force accounting for specific ion effects and that also direct interfacial
interactions cannot be neglected [9]. However, these argumentations suggest a
different Krafft point for CPC and CPN, which is not really observed in our system
with very similar values for CPC and CPN whatever the ionic strengths. In this
context it has to be mentioned that absolute values of TK of cetylpyridinium depend
strongly on measurement conditions. For example, the Krafft temperature of CPN in
pure water is determined with 11 °C by Heckmann and Abezgauz [1, 3], but differs
II – Effects of anions on the self-assembly of cetylpyridinium surfactants
42
from the 17 °C reported by Perche [2] and also dete rmined in our measurements.
Sasaki stated CPC forming metastable states in the Krafft transition with their stability
depending on the cool down kinetics and with long conversion times to the crystalline
state [10, 11]. In our opinion, this is more likely to be the reason for the different Krafft
temperatures published.
The generally higher TK for cetylpyridinium oxalate solutions are explained by
the complexation of two pyridinium head groups by one oxalate ion, which reduces
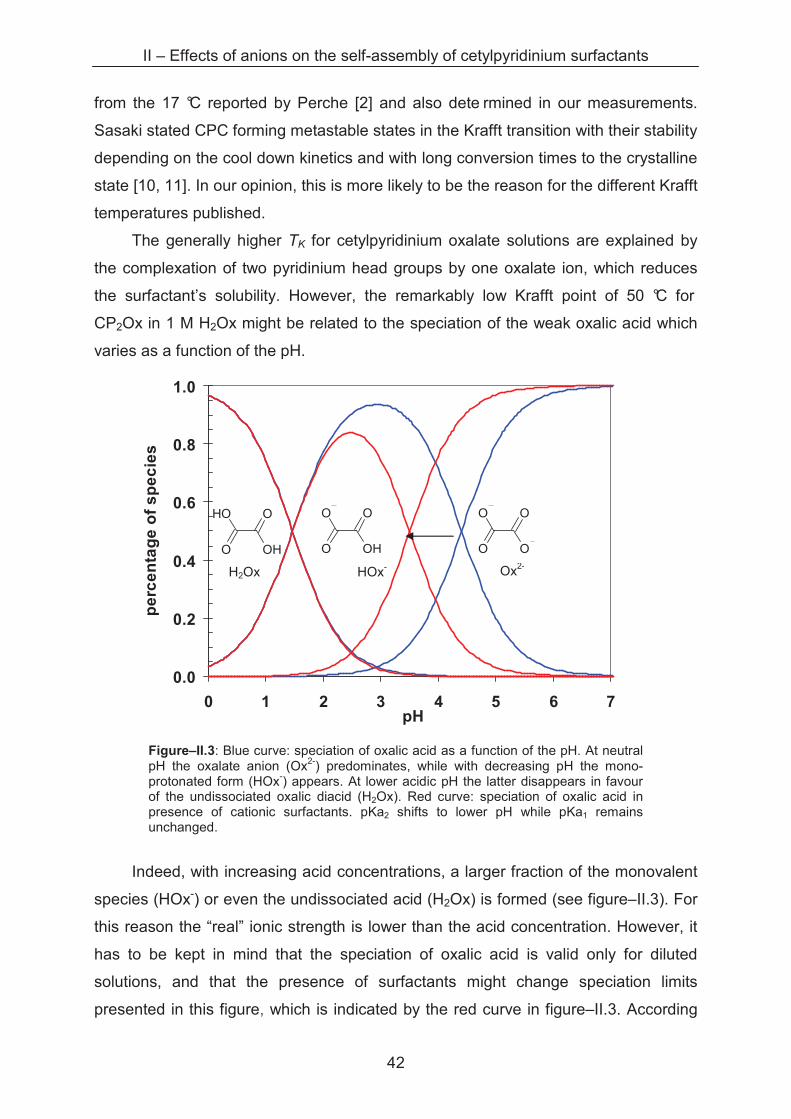
the surfactant’s solubility. However, the remarkably low Krafft point of 50 °C for
CP2Ox in 1 M H2Ox might be related to the speciation of the weak oxalic acid which
varies as a function of the pH.
0.0
0.2
0.4
0.6
0.8
1.0
0 1 2 3 4 5 6 7 pH
pe
rce
nta
ge
of
sp
ec
ies
O
O
O
O
O
OH
O
O
O
OH
HO
O
Figure–II.3: Blue curve: speciation of oxalic acid as a function of the pH. At neutral pH the oxalate anion (Ox2-) predominates, while with decreasing pH the mono-protonated form (HOx-) appears. At lower acidic pH the latter disappears in favour of the undissociated oxalic diacid (H2Ox). Red curve: speciation of oxalic acid in presence of cationic surfactants. pKa2 shifts to lower pH while pKa1 remains unchanged.
Indeed, with increasing acid concentrations, a larger fraction of the monovalent
species (HOx-) or even the undissociated acid (H2Ox) is formed (see figure–II.3). For
this reason the “real” ionic strength is lower than the acid concentration. However, it
has to be kept in mind that the speciation of oxalic acid is valid only for diluted
solutions, and that the presence of surfactants might change speciation limits
presented in this figure, which is indicated by the red curve in figure–II.3. According
H2Ox HOx- Ox2-
II – Effects of anions on the self-assembly of cetylpyridinium surfactants
43
to Srivastava et al., at least pKa2 of oxalate is shifted to lower pH due to the
interaction of the cationic surfactant [33].
Nevertheless, whatever the acid used, it is interesting to observe the same TK
variation as a function of the acid concentration in the range of 0 up to 0.1 M. To go
further in these considerations, information concerning the aggregate structure is
needed allowing the determination of the surface per head group. For this reason,
scattering experiments are carried out and discussed in the following paragraphs.
2.2.2 Structural parameters
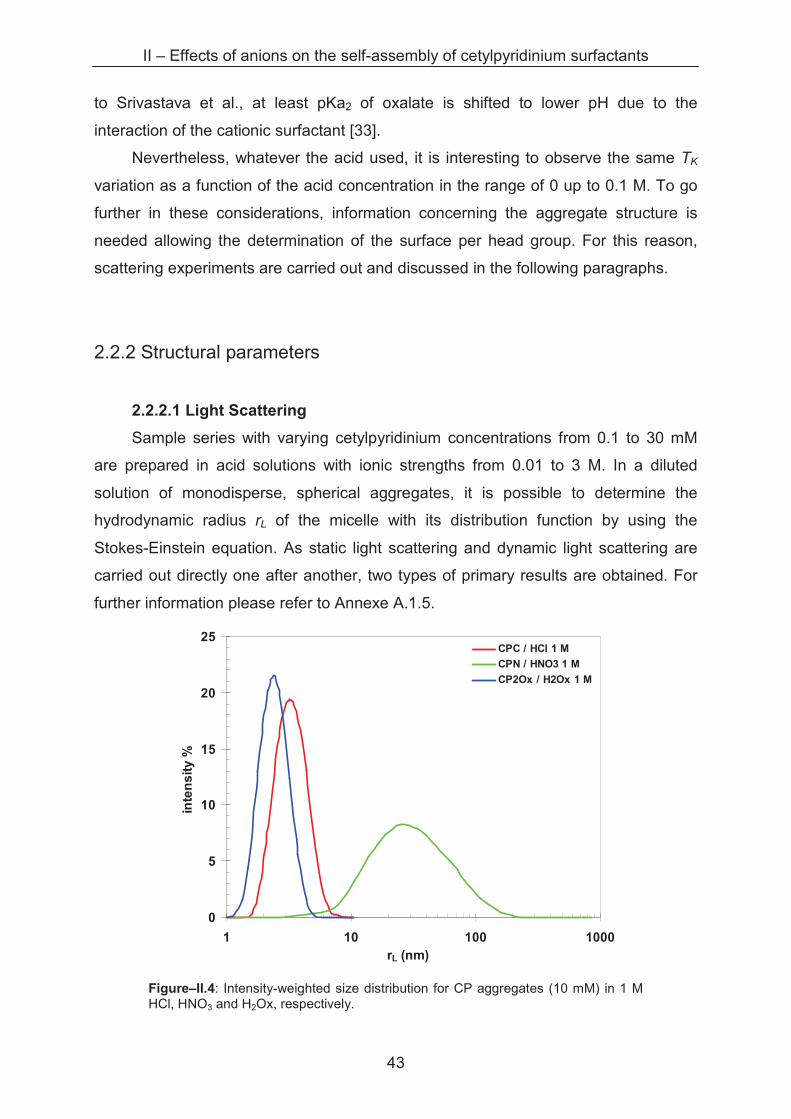
2.2.2.1 Light Scattering
Sample series with varying cetylpyridinium concentrations from 0.1 to 30 mM
are prepared in acid solutions with ionic strengths from 0.01 to 3 M. In a diluted
solution of monodisperse, spherical aggregates, it is possible to determine the
hydrodynamic radius rL of the micelle with its distribution function by using the
Stokes-Einstein equation. As static light scattering and dynamic light scattering are
carried out directly one after another, two types of primary results are obtained. For
further information please refer to Annexe A.1.5.
0
5
10
15
20
25
1 10 100 1000
rL (nm)
inte
ns
ity
%
CPC / HCl 1 M
CPN / HNO3 1 M
CP2Ox / H2Ox 1 M
Figure–II.4: Intensity-weighted size distribution for CP aggregates (10 mM) in 1 M HCl, HNO3 and H2Ox, respectively.
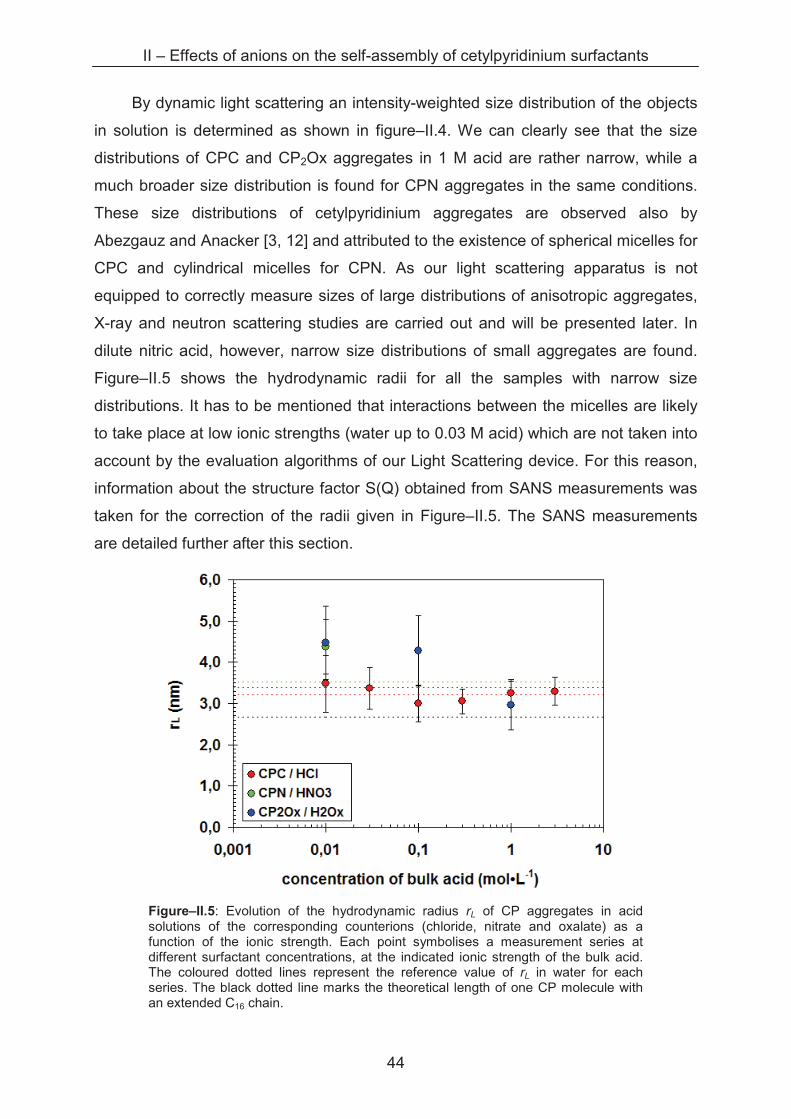
II – Effects of anions on the self-assembly of cetylpyridinium surfactants
44
By dynamic light scattering an intensity-weighted size distribution of the objects
in solution is determined as shown in figure–II.4. We can clearly see that the size
distributions of CPC and CP2Ox aggregates in 1 M acid are rather narrow, while a
much broader size distribution is found for CPN aggregates in the same conditions.
These size distributions of cetylpyridinium aggregates are observed also by
Abezgauz and Anacker [3, 12] and attributed to the existence of spherical micelles for
CPC and cylindrical micelles for CPN. As our light scattering apparatus is not
equipped to correctly measure sizes of large distributions of anisotropic aggregates,
X-ray and neutron scattering studies are carried out and will be presented later. In
dilute nitric acid, however, narrow size distributions of small aggregates are found.
Figure–II.5 shows the hydrodynamic radii for all the samples with narrow size
distributions. It has to be mentioned that interactions between the micelles are likely
to take place at low ionic strengths (water up to 0.03 M acid) which are not taken into
account by the evaluation algorithms of our Light Scattering device. For this reason,
information about the structure factor S(Q) obtained from SANS measurements was
taken for the correction of the radii given in Figure–II.5. The SANS measurements
are detailed further after this section.
Figure–II.5: Evolution of the hydrodynamic radius rL of CP aggregates in acid solutions of the corresponding counterions (chloride, nitrate and oxalate) as a function of the ionic strength. Each point symbolises a measurement series at different surfactant concentrations, at the indicated ionic strength of the bulk acid. The coloured dotted lines represent the reference value of rL in water for each series. The black dotted line marks the theoretical length of one CP molecule with an extended C16 chain.
II – Effects of anions on the self-assembly of cetylpyridinium surfactants
45
The evolution of the hydrodynamic radius of narrowly distributed aggregates for
three cetylpyridinium surfactants (CPC, CPN and CP2Ox, respectively) is plotted as a
function of the ionic strength. In water, rather similar radii are determined with 3.4 nm,
3.5 nm and 3.4 nm for CPC, CPN and CP2Ox aggregates, respectively, which are
slightly bigger than the theoretical length of one CP monomer (2.65 nm) [13].
In 0.01 M acid solutions, nearly the same size is determined for aggregates of
each surfactant, with radii around 4.0 nm, 4.4 nm and 4.6 nm for CPC, CPN and
CP2Ox micelles, respectively. The size distribution suggests the existence of
exclusively spherical micelles although we cannot exclude ellipsoidal or oblate
morphology on the basis of DLS measurements. No specific counterion differences
are detectable at this ionic strength.
A difference in the evolution of the hydrodynamic radius can be observed at 0.1
M bulk acid concentration. While CPC and CP2Ox aggregates grow slightly up to
about 3 nm but keep the narrow size distribution, a broad distribution of larger objects
is found for CPN aggregates. This phase transition is observed by many authors in
similar cases, and the phenomenon is explained by a reduced surface area per head
group of the surfactant due to the adsorption of nitrate ions on the micellar interface.
Thus, repulsive head group interactions are reduced leading to an elongation of the
micelles towards cylindrical geometry.
In contrast to this observation, CPC and CP2Ox micelles remain spherical also
at 1 M acid concentration, which is also found by Anacker [14, 12] and Abezgauz [3]
for CPC aggregates. While rL increases up to 3.2 nm for CPC, the radius of CP2Ox
micelles shrinks slightly down to 2.5 nm. Even in 3 M hydrochloric acid the CPC
micelles remain spherical with radii of 3.3 nm. According to Anacker, the micelle has
reached its geometrical limit of a sphere at this radius, because a spherical object
consisting of C16 alkyl chains cannot exceed much the density of liquid hexadecane.
Any further increase of the micellar radius would mean the formation of empty spaces
in the micellar core, as the alkyl chains cannot be extended further. Abezgauz found
the radii of 10 mM CPC micelles to be 4-5 nm in NaCl solutions by cryo-TEM
techniques [3].
The slight decrease of the radius for CP2Ox aggregates 1 M H2Ox may be
related to speciation effects. At this oxalate concentration, the ratio between the three
species H2Ox, HOx- and Ox2- is not clear, but apparently the screening of the micellar
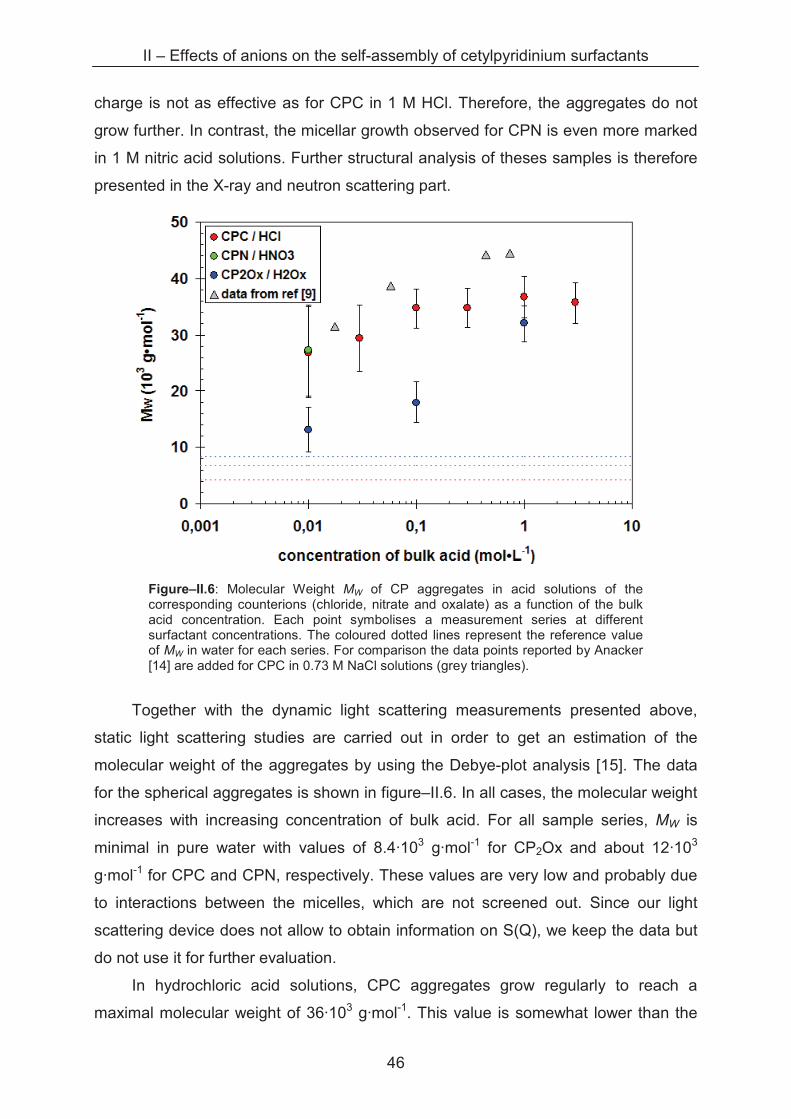
II – Effects of anions on the self-assembly of cetylpyridinium surfactants
46
charge is not as effective as for CPC in 1 M HCl. Therefore, the aggregates do not
grow further. In contrast, the micellar growth observed for CPN is even more marked
in 1 M nitric acid solutions. Further structural analysis of theses samples is therefore
presented in the X-ray and neutron scattering part.
Figure–II.6: Molecular Weight MW of CP aggregates in acid solutions of the corresponding counterions (chloride, nitrate and oxalate) as a function of the bulk acid concentration. Each point symbolises a measurement series at different surfactant concentrations. The coloured dotted lines represent the reference value of MW in water for each series. For comparison the data points reported by Anacker [14] are added for CPC in 0.73 M NaCl solutions (grey triangles).
Together with the dynamic light scattering measurements presented above,
static light scattering studies are carried out in order to get an estimation of the
molecular weight of the aggregates by using the Debye-plot analysis [15]. The data
for the spherical aggregates is shown in figure–II.6. In all cases, the molecular weight
increases with increasing concentration of bulk acid. For all sample series, MW is
minimal in pure water with values of 8.4·103 g·mol-1 for CP2Ox and about 12·103
g·mol-1 for CPC and CPN, respectively. These values are very low and probably due
to interactions between the micelles, which are not screened out. Since our light
scattering device does not allow to obtain information on S(Q), we keep the data but
do not use it for further evaluation.
In hydrochloric acid solutions, CPC aggregates grow regularly to reach a
maximal molecular weight of 36·103 g·mol-1. This value is somewhat lower than the
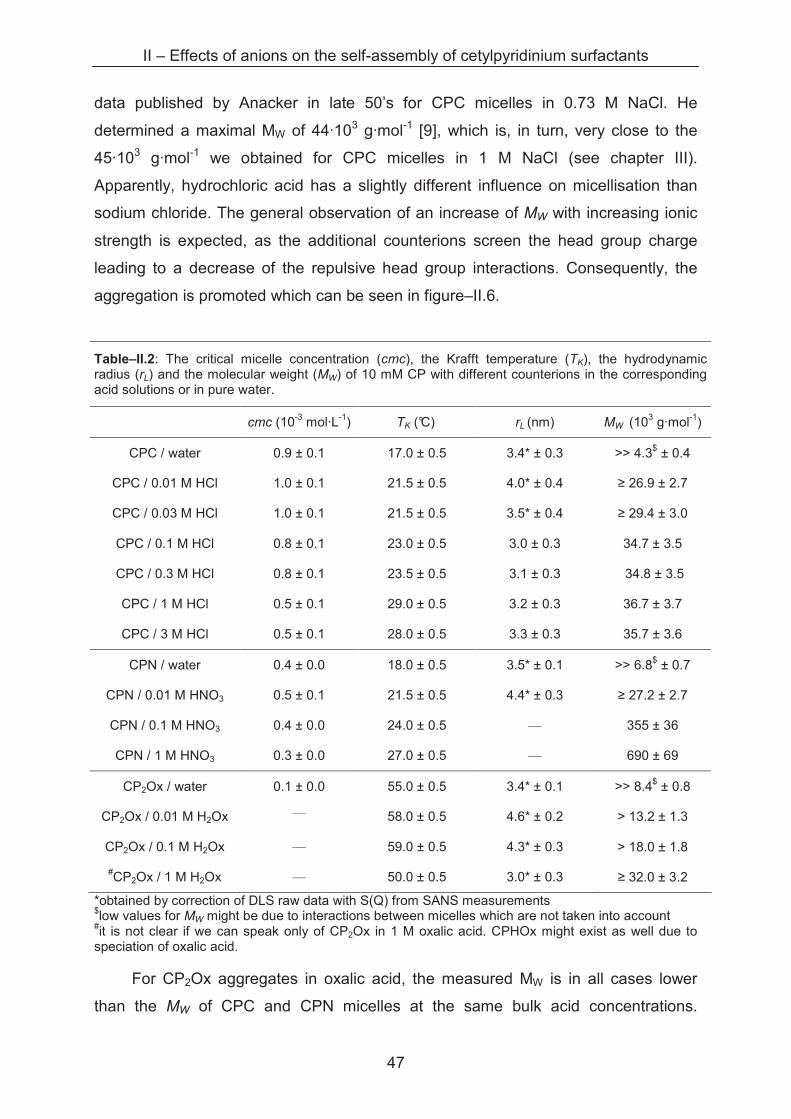
II – Effects of anions on the self-assembly of cetylpyridinium surfactants
47
data published by Anacker in late 50’s for CPC micelles in 0.73 M NaCl. He
determined a maximal MW of 44·103 g·mol-1 [9], which is, in turn, very close to the
45·103 g·mol-1 we obtained for CPC micelles in 1 M NaCl (see chapter III).
Apparently, hydrochloric acid has a slightly different influence on micellisation than
sodium chloride. The general observation of an increase of MW with increasing ionic
strength is expected, as the additional counterions screen the head group charge
leading to a decrease of the repulsive head group interactions. Consequently, the
aggregation is promoted which can be seen in figure–II.6.
Table–II.2: The critical micelle concentration (cmc), the Krafft temperature (TK), the hydrodynamic radius (rL) and the molecular weight (MW) of 10 mM CP with different counterions in the corresponding acid solutions or in pure water.
cmc (10-3 mol·L-1) TK (°C) rL (nm) MW (103 g·mol-1)
CPC / water 0.9 ± 0.1 17.0 ± 0.5 3.4* ± 0.3 >> 4.3$ ± 0.4
CPC / 0.01 M HCl 1.0 ± 0.1 21.5 ± 0.5 4.0* ± 0.4 � 26.9 ± 2.7
CPC / 0.03 M HCl 1.0 ± 0.1 21.5 ± 0.5 3.5* ± 0.4 � 29.4 ± 3.0
CPC / 0.1 M HCl 0.8 ± 0.1 23.0 ± 0.5 3.0 ± 0.3 34.7 ± 3.5
CPC / 0.3 M HCl 0.8 ± 0.1 23.5 ± 0.5 3.1 ± 0.3 34.8 ± 3.5
CPC / 1 M HCl 0.5 ± 0.1 29.0 ± 0.5 3.2 ± 0.3 36.7 ± 3.7
CPC / 3 M HCl 0.5 ± 0.1 28.0 ± 0.5 3.3 ± 0.3 35.7 ± 3.6
CPN / water 0.4 ± 0.0 18.0 ± 0.5 3.5* ± 0.1 >> 6.8$ ± 0.7
CPN / 0.01 M HNO3 0.5 ± 0.1 21.5 ± 0.5 4.4* ± 0.3 � 27.2 ± 2.7
CPN / 0.1 M HNO3 0.4 ± 0.0 24.0 ± 0.5 — 355 ± 36
CPN / 1 M HNO3 0.3 ± 0.0 27.0 ± 0.5 — 690 ± 69
CP2Ox / water 0.1 ± 0.0 55.0 ± 0.5 3.4* ± 0.1 >> 8.4$ ± 0.8
CP2Ox / 0.01 M H2Ox — 58.0 ± 0.5 4.6* ± 0.2 > 13.2 ± 1.3
CP2Ox / 0.1 M H2Ox — 59.0 ± 0.5 4.3* ± 0.3 > 18.0 ± 1.8
#CP2Ox / 1 M H2Ox — 50.0 ± 0.5 3.0* ± 0.3 � 32.0 ± 3.2
*obtained by correction of DLS raw data with S(Q) from SANS measurements $low values for MW might be due to interactions between micelles which are not taken into account #it is not clear if we can speak only of CP2Ox in 1 M oxalic acid. CPHOx might exist as well due to speciation of oxalic acid.
For CP2Ox aggregates in oxalic acid, the measured MW is in all cases lower
than the MW of CPC and CPN micelles at the same bulk acid concentrations.
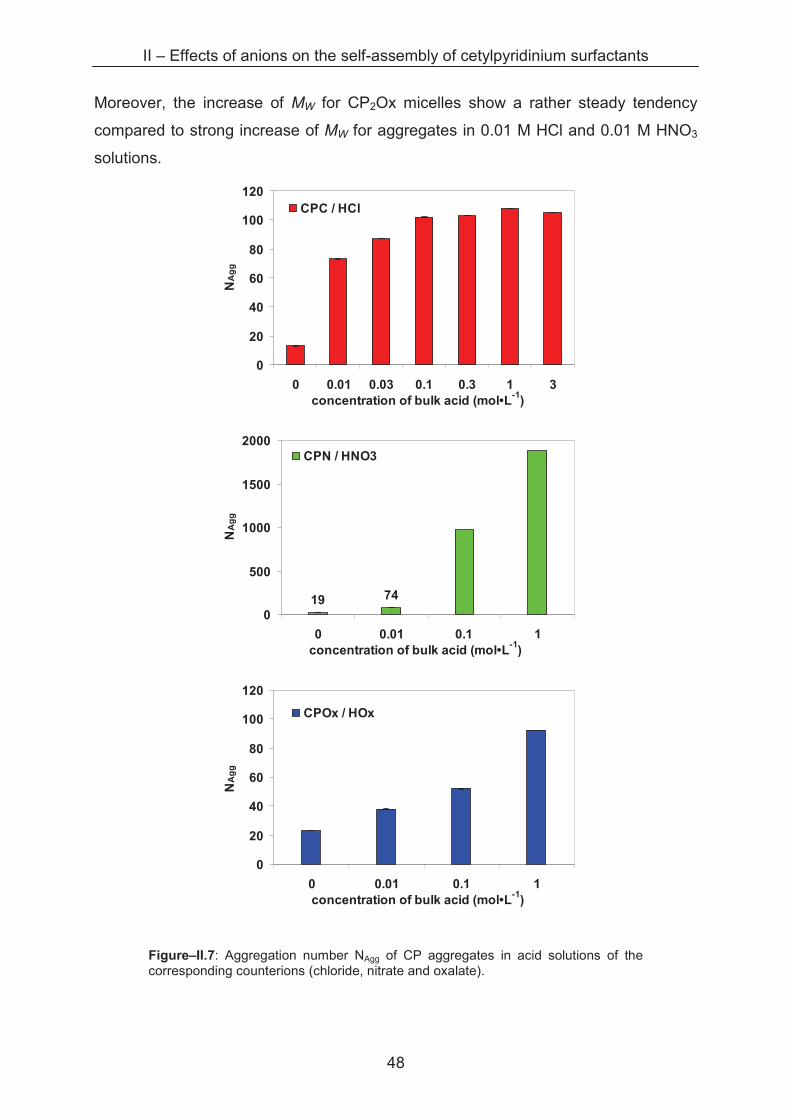
II – Effects of anions on the self-assembly of cetylpyridinium surfactants
48
Moreover, the increase of MW for CP2Ox micelles show a rather steady tendency
compared to strong increase of MW for aggregates in 0.01 M HCl and 0.01 M HNO3
solutions.
0
20
40
60
80
100
120
0 0.01 0.03 0.1 0.3 1 3concentration of bulk acid (mol•L
-1)
NA
gg
CPC / HCl
19 74
0
500
1000
1500
2000
0 0.01 0.1 1concentration of bulk acid (mol•L
-1)
NA
gg
CPN / HNO3
0
20
40
60
80
100
120
0 0.01 0.1 1concentration of bulk acid (mol•L
-1)
NA
gg
CPOx / HOx
Figure–II.7: Aggregation number NAgg of CP aggregates in acid solutions of the corresponding counterions (chloride, nitrate and oxalate).
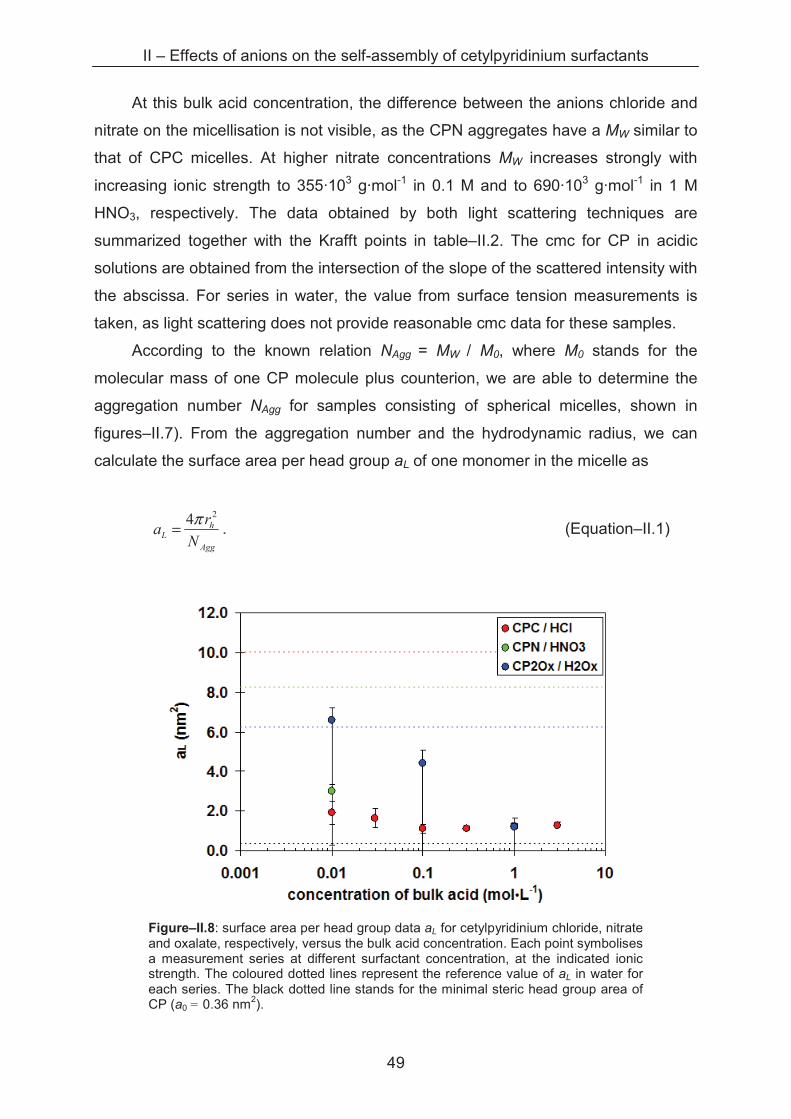
II – Effects of anions on the self-assembly of cetylpyridinium surfactants
49
At this bulk acid concentration, the difference between the anions chloride and
nitrate on the micellisation is not visible, as the CPN aggregates have a MW similar to
that of CPC micelles. At higher nitrate concentrations MW increases strongly with
increasing ionic strength to 355�103 g�mol-1 in 0.1 M and to 690�103 g�mol-1 in 1 M
HNO3, respectively. The data obtained by both light scattering techniques are
summarized together with the Krafft points in table–II.2. The cmc for CP in acidic
solutions are obtained from the intersection of the slope of the scattered intensity with
the abscissa. For series in water, the value from surface tension measurements is
taken, as light scattering does not provide reasonable cmc data for these samples.
According to the known relation NAgg = MW / M0, where M0 stands for the
molecular mass of one CP molecule plus counterion, we are able to determine the
aggregation number NAgg for samples consisting of spherical micelles, shown in
figures–II.7). From the aggregation number and the hydrodynamic radius, we can
calculate the surface area per head group aL of one monomer in the micelle as
Agg
hL
N
ra
24π= . (Equation–II.1)
Figure–II.8: surface area per head group data aL for cetylpyridinium chloride, nitrate and oxalate, respectively, versus the bulk acid concentration. Each point symbolises a measurement series at different surfactant concentration, at the indicated ionic strength. The coloured dotted lines represent the reference value of aL in water for each series. The black dotted line stands for the minimal steric head group area of CP (a0 = 0.36 nm2).
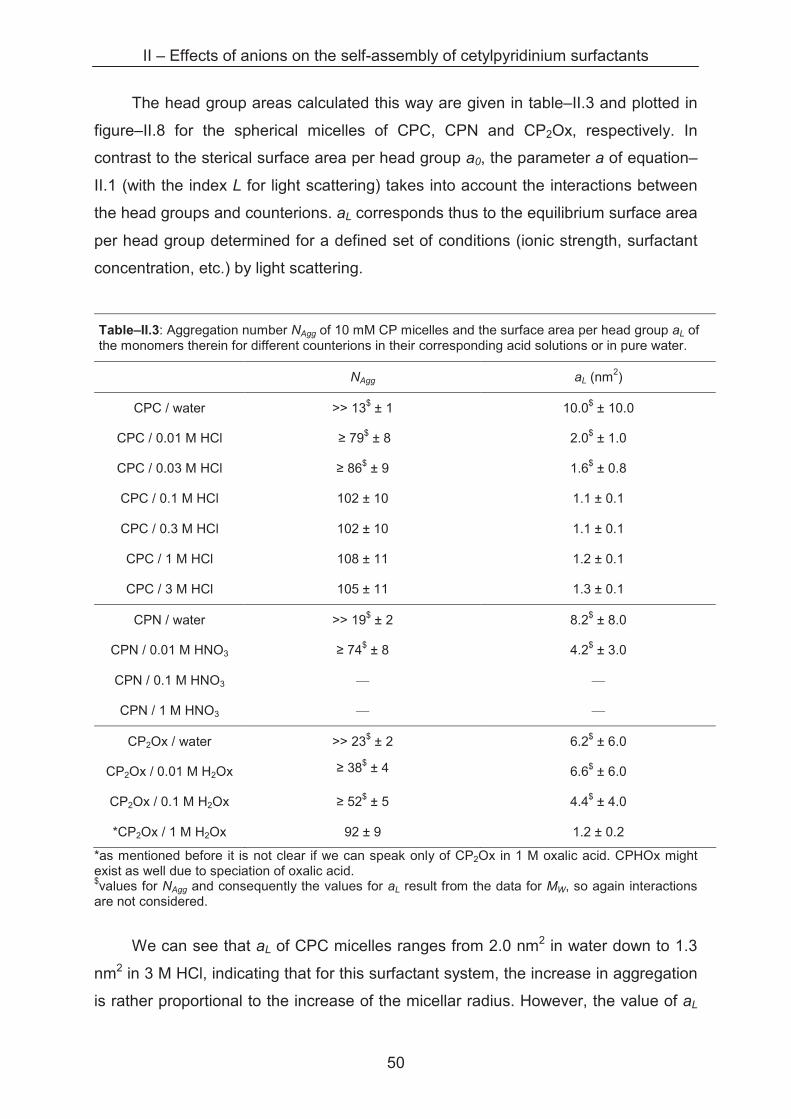
II – Effects of anions on the self-assembly of cetylpyridinium surfactants
50
The head group areas calculated this way are given in table–II.3 and plotted in
figure–II.8 for the spherical micelles of CPC, CPN and CP2Ox, respectively. In
contrast to the sterical surface area per head group a0, the parameter a of equation–
II.1 (with the index L for light scattering) takes into account the interactions between
the head groups and counterions. aL corresponds thus to the equilibrium surface area
per head group determined for a defined set of conditions (ionic strength, surfactant
concentration, etc.) by light scattering.
Table–II.3: Aggregation number NAgg of 10 mM CP micelles and the surface area per head group aL of the monomers therein for different counterions in their corresponding acid solutions or in pure water.
NAgg aL (nm2)
CPC / water >> 13$ ± 1 10.0$ ± 10.0
CPC / 0.01 M HCl � 79$ ± 8 2.0$ ± 1.0
CPC / 0.03 M HCl � 86$ ± 9 1.6$ ± 0.8
CPC / 0.1 M HCl 102 ± 10 1.1 ± 0.1
CPC / 0.3 M HCl 102 ± 10 1.1 ± 0.1
CPC / 1 M HCl 108 ± 11 1.2 ± 0.1
CPC / 3 M HCl 105 ± 11 1.3 ± 0.1
CPN / water >> 19$ ± 2 8.2$ ± 8.0
CPN / 0.01 M HNO3 � 74$ ± 8 4.2$ ± 3.0
CPN / 0.1 M HNO3 — —
CPN / 1 M HNO3 — —
CP2Ox / water >> 23$ ± 2 6.2$ ± 6.0
CP2Ox / 0.01 M H2Ox � 38$ ± 4 6.6$ ± 6.0
CP2Ox / 0.1 M H2Ox � 52$ ± 5 4.4$ ± 4.0
*CP2Ox / 1 M H2Ox 92 ± 9 1.2 ± 0.2
*as mentioned before it is not clear if we can speak only of CP2Ox in 1 M oxalic acid. CPHOx might exist as well due to speciation of oxalic acid. $values for NAgg and consequently the values for aL result from the data for MW, so again interactions are not considered.
We can see that aL of CPC micelles ranges from 2.0 nm2 in water down to 1.3
nm2 in 3 M HCl, indicating that for this surfactant system, the increase in aggregation
is rather proportional to the increase of the micellar radius. However, the value of aL
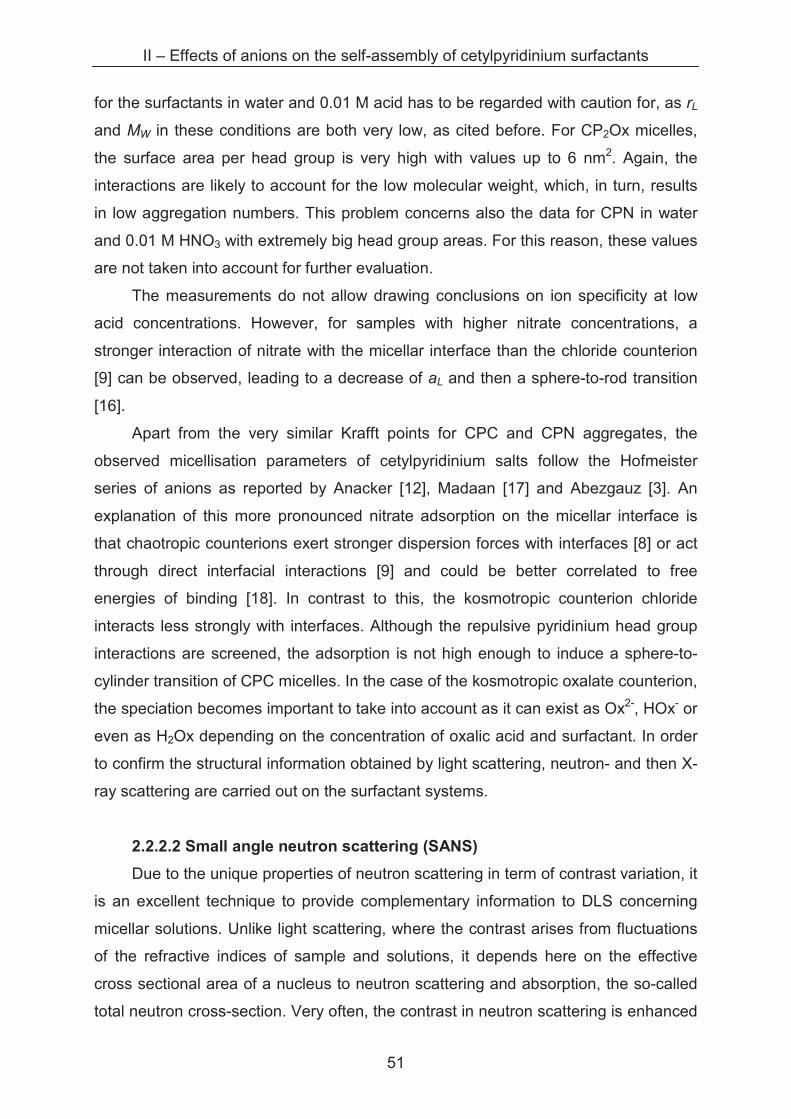
II – Effects of anions on the self-assembly of cetylpyridinium surfactants
51
for the surfactants in water and 0.01 M acid has to be regarded with caution for, as rL
and MW in these conditions are both very low, as cited before. For CP2Ox micelles,
the surface area per head group is very high with values up to 6 nm2. Again, the
interactions are likely to account for the low molecular weight, which, in turn, results
in low aggregation numbers. This problem concerns also the data for CPN in water
and 0.01 M HNO3 with extremely big head group areas. For this reason, these values
are not taken into account for further evaluation.
The measurements do not allow drawing conclusions on ion specificity at low
acid concentrations. However, for samples with higher nitrate concentrations, a
stronger interaction of nitrate with the micellar interface than the chloride counterion
[9] can be observed, leading to a decrease of aL and then a sphere-to-rod transition
[16].
Apart from the very similar Krafft points for CPC and CPN aggregates, the
observed micellisation parameters of cetylpyridinium salts follow the Hofmeister
series of anions as reported by Anacker [12], Madaan [17] and Abezgauz [3]. An
explanation of this more pronounced nitrate adsorption on the micellar interface is
that chaotropic counterions exert stronger dispersion forces with interfaces [8] or act
through direct interfacial interactions [9] and could be better correlated to free
energies of binding [18]. In contrast to this, the kosmotropic counterion chloride
interacts less strongly with interfaces. Although the repulsive pyridinium head group
interactions are screened, the adsorption is not high enough to induce a sphere-to-
cylinder transition of CPC micelles. In the case of the kosmotropic oxalate counterion,
the speciation becomes important to take into account as it can exist as Ox2-, HOx- or
even as H2Ox depending on the concentration of oxalic acid and surfactant. In order
to confirm the structural information obtained by light scattering, neutron- and then X-
ray scattering are carried out on the surfactant systems.
2.2.2.2 Small angle neutron scattering (SANS)
Due to the unique properties of neutron scattering in term of contrast variation, it
is an excellent technique to provide complementary information to DLS concerning
micellar solutions. Unlike light scattering, where the contrast arises from fluctuations
of the refractive indices of sample and solutions, it depends here on the effective
cross sectional area of a nucleus to neutron scattering and absorption, the so-called
total neutron cross-section. Very often, the contrast in neutron scattering is enhanced
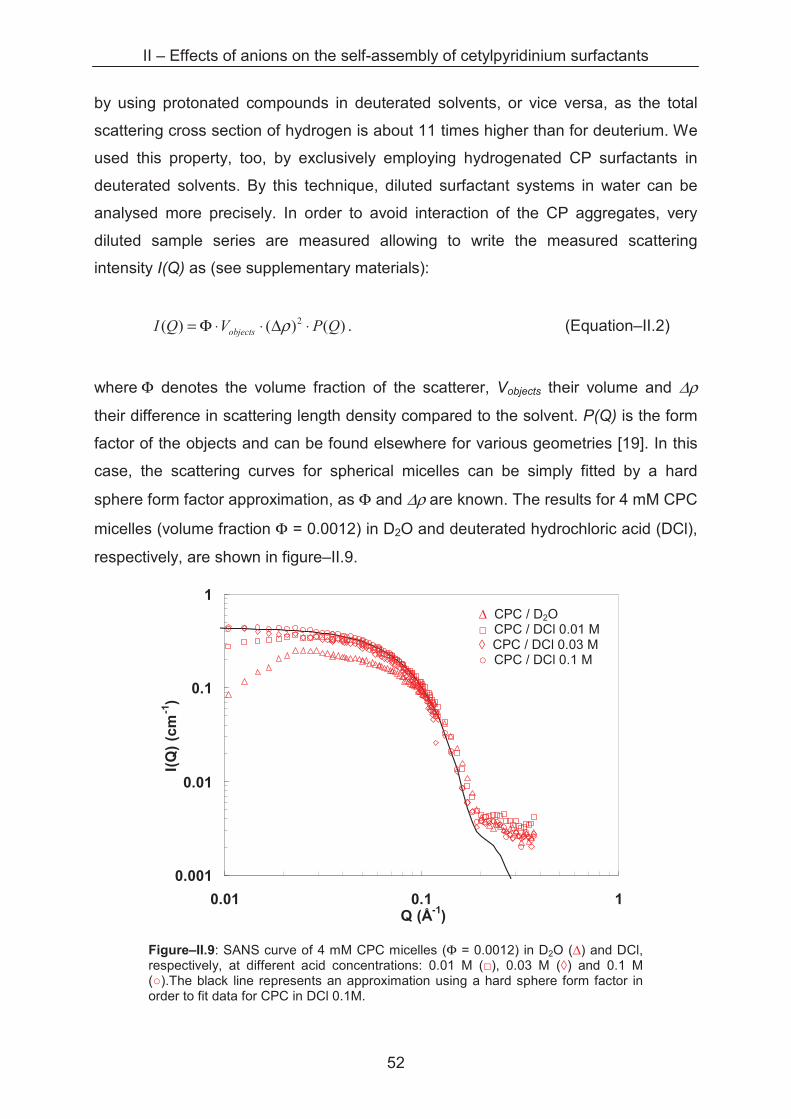
II – Effects of anions on the self-assembly of cetylpyridinium surfactants
52
by using protonated compounds in deuterated solvents, or vice versa, as the total
scattering cross section of hydrogen is about 11 times higher than for deuterium. We
used this property, too, by exclusively employing hydrogenated CP surfactants in
deuterated solvents. By this technique, diluted surfactant systems in water can be
analysed more precisely. In order to avoid interaction of the CP aggregates, very
diluted sample series are measured allowing to write the measured scattering
intensity I(Q) as (see supplementary materials):
)()()( 2 QPVQI objects ⋅∆⋅⋅Φ= ρ . (Equation–II.2)
where Φ denotes the volume fraction of the scatterer, Vobjects their volume and ∆ρ
their difference in scattering length density compared to the solvent. P(Q) is the form
factor of the objects and can be found elsewhere for various geometries [19]. In this
case, the scattering curves for spherical micelles can be simply fitted by a hard
sphere form factor approximation, as Φ and ∆ρ are known. The results for 4 mM CPC
micelles (volume fraction Φ = 0.0012) in D2O and deuterated hydrochloric acid (DCl),
respectively, are shown in figure–II.9.
0.001
0.01
0.1
1
0.01 0.1 1Q (Å-1)
I(Q
) (c
m-1
)
Figure–II.9: SANS curve of 4 mM CPC micelles (Φ = 0.0012) in D2O (∆) and DCl, respectively, at different acid concentrations: 0.01 M (�), 0.03 M (�) and 0.1 M (�).The black line represents an approximation using a hard sphere form factor in order to fit data for CPC in DCl 0.1M.
∆ CPC / D2O � CPC / DCl 0.01 M � CPC / DCl 0.03 M � CPC / DCl 0.1 M
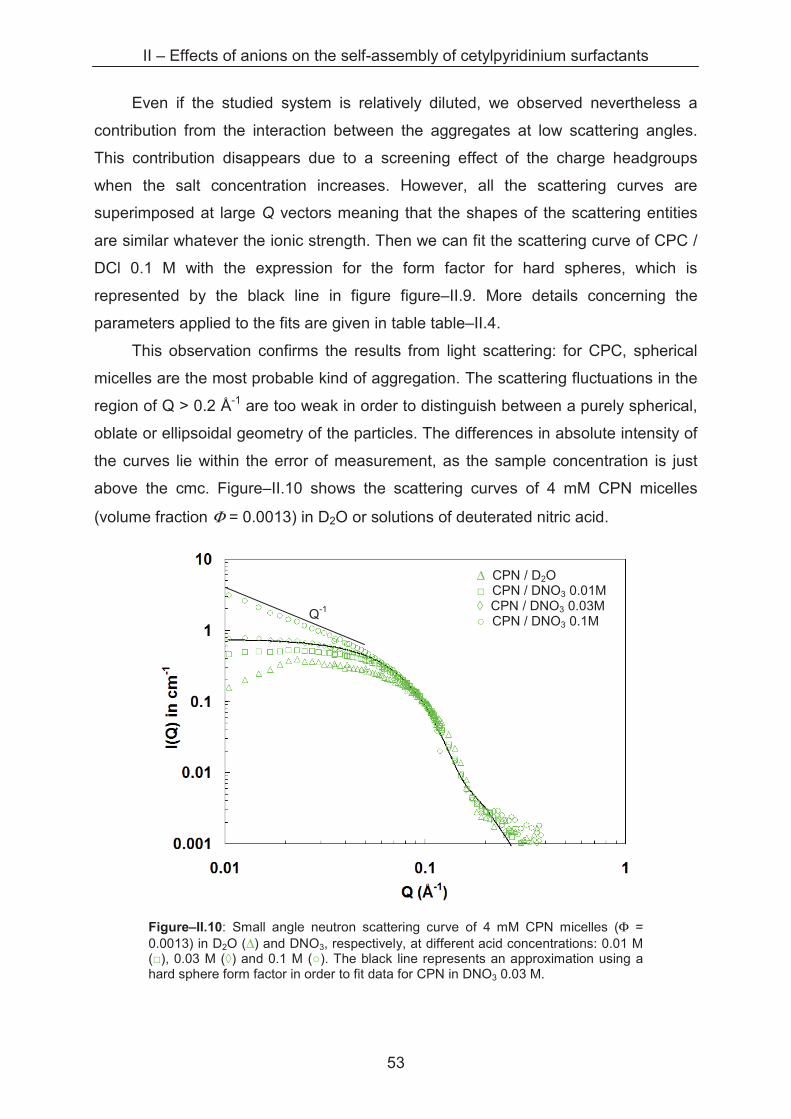
II – Effects of anions on the self-assembly of cetylpyridinium surfactants
53
Even if the studied system is relatively diluted, we observed nevertheless a
contribution from the interaction between the aggregates at low scattering angles.
This contribution disappears due to a screening effect of the charge headgroups
when the salt concentration increases. However, all the scattering curves are
superimposed at large Q vectors meaning that the shapes of the scattering entities
are similar whatever the ionic strength. Then we can fit the scattering curve of CPC /
DCl 0.1 M with the expression for the form factor for hard spheres, which is
represented by the black line in figure figure–II.9. More details concerning the
parameters applied to the fits are given in table table–II.4.
This observation confirms the results from light scattering: for CPC, spherical
micelles are the most probable kind of aggregation. The scattering fluctuations in the
region of Q > 0.2 Å-1 are too weak in order to distinguish between a purely spherical,
oblate or ellipsoidal geometry of the particles. The differences in absolute intensity of
the curves lie within the error of measurement, as the sample concentration is just
above the cmc. Figure–II.10 shows the scattering curves of 4 mM CPN micelles
(volume fraction Φ = 0.0013) in D2O or solutions of deuterated nitric acid.
Figure–II.10: Small angle neutron scattering curve of 4 mM CPN micelles (Φ = 0.0013) in D2O (∆) and DNO3, respectively, at different acid concentrations: 0.01 M (�), 0.03 M (�) and 0.1 M (�). The black line represents an approximation using a hard sphere form factor in order to fit data for CPN in DNO3 0.03 M.
∆ CPN / D2O � CPN / DNO3 0.01M � CPN / DNO3 0.03M � CPN / DNO3 0.1M Q-1
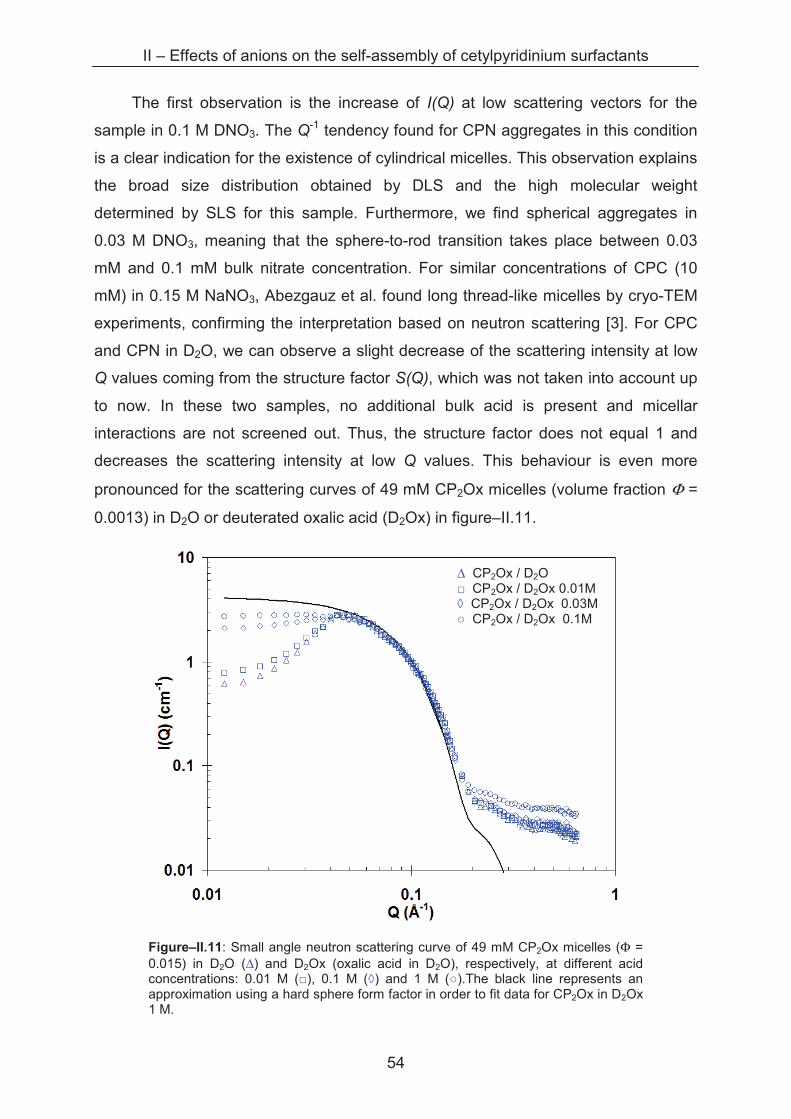
II – Effects of anions on the self-assembly of cetylpyridinium surfactants
54
The first observation is the increase of I(Q) at low scattering vectors for the
sample in 0.1 M DNO3. The Q-1 tendency found for CPN aggregates in this condition
is a clear indication for the existence of cylindrical micelles. This observation explains
the broad size distribution obtained by DLS and the high molecular weight
determined by SLS for this sample. Furthermore, we find spherical aggregates in
0.03 M DNO3, meaning that the sphere-to-rod transition takes place between 0.03
mM and 0.1 mM bulk nitrate concentration. For similar concentrations of CPC (10
mM) in 0.15 M NaNO3, Abezgauz et al. found long thread-like micelles by cryo-TEM
experiments, confirming the interpretation based on neutron scattering [3]. For CPC
and CPN in D2O, we can observe a slight decrease of the scattering intensity at low
Q values coming from the structure factor S(Q), which was not taken into account up
to now. In these two samples, no additional bulk acid is present and micellar
interactions are not screened out. Thus, the structure factor does not equal 1 and
decreases the scattering intensity at low Q values. This behaviour is even more
pronounced for the scattering curves of 49 mM CP2Ox micelles (volume fraction Φ =
0.0013) in D2O or deuterated oxalic acid (D2Ox) in figure–II.11.
Figure–II.11: Small angle neutron scattering curve of 49 mM CP2Ox micelles (Φ = 0.015) in D2O (∆) and D2Ox (oxalic acid in D2O), respectively, at different acid concentrations: 0.01 M (�), 0.1 M (�) and 1 M (�).The black line represents an approximation using a hard sphere form factor in order to fit data for CP2Ox in D2Ox 1 M.
∆ CP2Ox / D2O � CP2Ox / D2Ox 0.01M � CP2Ox / D2Ox 0.03M � CP2Ox / D2Ox 0.1M
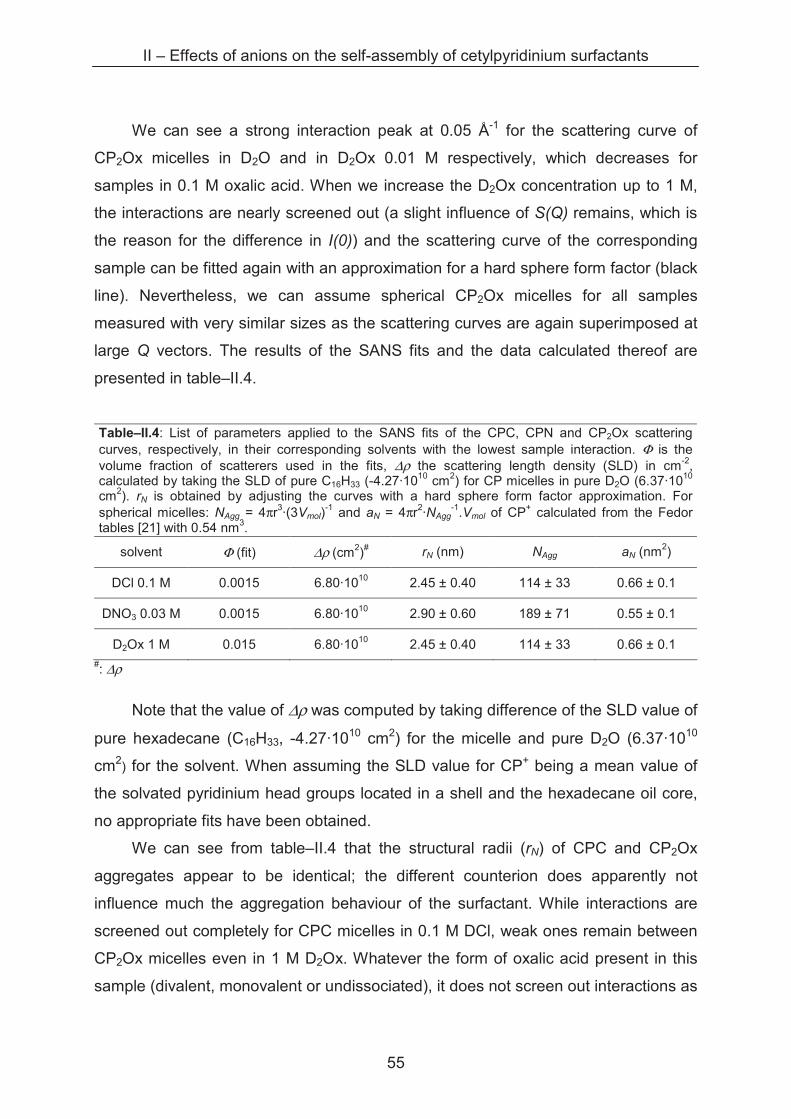
II – Effects of anions on the self-assembly of cetylpyridinium surfactants
55
We can see a strong interaction peak at 0.05 Å-1 for the scattering curve of
CP2Ox micelles in D2O and in D2Ox 0.01 M respectively, which decreases for
samples in 0.1 M oxalic acid. When we increase the D2Ox concentration up to 1 M,
the interactions are nearly screened out (a slight influence of S(Q) remains, which is
the reason for the difference in I(0)) and the scattering curve of the corresponding
sample can be fitted again with an approximation for a hard sphere form factor (black
line). Nevertheless, we can assume spherical CP2Ox micelles for all samples
measured with very similar sizes as the scattering curves are again superimposed at
large Q vectors. The results of the SANS fits and the data calculated thereof are
presented in table–II.4.
Table–II.4: List of parameters applied to the SANS fits of the CPC, CPN and CP2Ox scattering curves, respectively, in their corresponding solvents with the lowest sample interaction. Φ is the volume fraction of scatterers used in the fits, ∆ρ the scattering length density (SLD) in cm-2, calculated by taking the SLD of pure C16H33 (-4.27�1010 cm2) for CP micelles in pure D2O (6.37�1010
cm2). rN is obtained by adjusting the curves with a hard sphere form factor approximation. For spherical micelles: NAgg = 4πr3·(3Vmol)
-1 and aN = 4πr2·NAgg-1.Vmol of CP+ calculated from the Fedor
tables [21] with 0.54 nm3.
solvent Φ (fit) ∆ρ (cm2)# rN (nm) NAgg aN (nm2)
DCl 0.1 M 0.0015 6.80�1010 2.45 ± 0.40 114 ± 33 0.66 ± 0.1
DNO3 0.03 M 0.0015 6.80�1010 2.90 ± 0.60 189 ± 71 0.55 ± 0.1
D2Ox 1 M 0.015 6.80�1010 2.45 ± 0.40 114 ± 33 0.66 ± 0.1 #: ∆ρ
Note that the value of ∆ρ was computed by taking difference of the SLD value of
pure hexadecane (C16H33, -4.27�1010 cm2) for the micelle and pure D2O (6.37�1010
cm2) for the solvent. When assuming the SLD value for CP+ being a mean value of
the solvated pyridinium head groups located in a shell and the hexadecane oil core,
no appropriate fits have been obtained.
We can see from table–II.4 that the structural radii (rN) of CPC and CP2Ox
aggregates appear to be identical; the different counterion does apparently not
influence much the aggregation behaviour of the surfactant. While interactions are
screened out completely for CPC micelles in 0.1 M DCl, weak ones remain between
CP2Ox micelles even in 1 M D2Ox. Whatever the form of oxalic acid present in this
sample (divalent, monovalent or undissociated), it does not screen out interactions as
II – Effects of anions on the self-assembly of cetylpyridinium surfactants
56
effective as the chloride counterion. In contrast to DLS, no evolution of the
aggregates radius with the ionic strength could be observed.
When dividing the volume of the sphere calculated from rN by the molecular
volume of one CP molecule (Vmol = 0.54 nm3, from Fedor’s tables [21]), one obtains
the aggregation number NAgg of the micelles. After entering this variable in equation
(1) the head group surface area aN is obtained. At least for CPC we can see that the
aggregation number of 114 molecules per micelles is rather consistent compared to
the one from light scattering (102 molecules) at 0.1 M ionic strength.
The larger radius for CPN micelles in DNO3 is again attributed to the more
pronounced adsorption of nitrate leading to a more effective screening of the head
group charges thus reducing the surface area per head group. Indeed, we find the
lowest values of aN for CPN micelles at 0.55 nm2 which is close to the theoretical
values of a for cylinders (a < 0.5 nm2) allowing the assumption that the sample in
0.03 M DNO3 is just before the transition point to cylindrical aggregation, with
aggregation numbers close to 200. As we are not able to determine the limit of the Q-
1 region for the CPN cylinders in DNO3 0.1 M, the cylinder length is not known. In this
context, Odjik stated that the total length of cylindrical micelles depends strongly on
the surfactant concentration and the ionic strength of the solution [23].
The radii determined by SANS are somewhat lower than the ones obtained by
light scattering. The difference can be attributed to the different position of the
interface detected by each technique. The structural radius obtained by SANS comes
from the H–D interface position, which is the surfactant / solvent interface in our
system. Thus, rN equals the length of one CP molecule. Contrary to this, the
hydrodynamic radius from light scattering comprises also a hydrodynamic layer
around the micelle, which contains additional anions and bound water and is
estimated to range from 0.35 to 0.75 nm for CPC micelles by Amos [22], by
comparing light scattering with neutron scattering data. When the mean value (0.55
nm) is added to rN, we obtain 3.0 nm which is exactly the hydrodynamic radius for the
CPC samples in 0.1 M HCl.
In order to conclude the observations done by small angle neutron scattering,
we can say that spherical micelles exist as first approximation for all three surfactants
in water and at low ionic strength of 0.01 M corresponding acid. The geometries of
the micelles are very similar, only small variations of the radii are observed. Slightly
bigger micelles are found for cetylpyridinium nitrate, which also starts to form
II – Effects of anions on the self-assembly of cetylpyridinium surfactants
57
cylinders at sufficiently high nitrate concentrations (in our case above 0.03 M). At
least for CPC samples the aggregation numbers and the values for the
corresponding surface area per head groups seem reasonable compared with data
from DLS despite the simple model of a fixed Vmol for each surfactant.
In all cases, from the SANS experiments, we are not able to determine the
number of ions adsorbed per micelle. In order to get more information about this
question with a quantitative result, small angle X-ray scattering is carried out on the
same samples studied by SANS. As it is shown by Aswal et. al SAXS experiments
can provide information on the counterion distribution around micelles [24].
2.2.2.3 Small Angle X-ray Scattering (SAXS)
Unlike the two other scattering techniques, the contrast in X-rays
measurements arises from local fluctuations of the electron scattering length density
in a material, as X-rays are scattered by the electrons of an atom. Equation (2)
applies thus also for SAXS, only the definition of ∆ρ changes, because the difference
in electron density length between the sample and the solvent is important. The
calculation of ρ for a given compound in shown elsewhere [19].
Similar to SANS, SAXS allows to obtain structural information concerning the
aggregates in water with more precision than DLS. Furthermore, the micelles with
condensed counterions are expected to show a different scattering signature [24].
For this purpose, sample series are prepared at four different ionic strengths (0 M,
0.01 M, 0.1 M and 1 M, respectively) at fixed surfactant concentration of 5 mM for
CPC and CPN, respectively. SAXS measurements have been carried out before the
surfactant CP2Ox is introduced to this study, so no X-ray scattering curves of CP2Ox
have been measured. As the SAXS beam time has been planned after the SANS
beam time, the sample series prepared in deuterated solvents are used twice. The
scattering of CPC micelles in D2O and DCl, respectively, is shown in figure–II.12. The
same contrast parameters are used for fitting the curves of CPC in D2O, in DCl 0.01
M and in DCl 0.1 M, respectively, by using a radius of 2.0 nm for the hydrocarbon
core and 0.2 nm for the shell thickness. The fit is represented by the blue line. In 1 M
DCl, the scattering length densities in the micellar shell is changed slightly, but the
radii remain unchanged.
Note the slightly different Q-ranges of the following SAXS graphs (0.03 Å-1 to
0.3 Å-1) compared to their SANS counterparts. In all cases we can clearly see typical
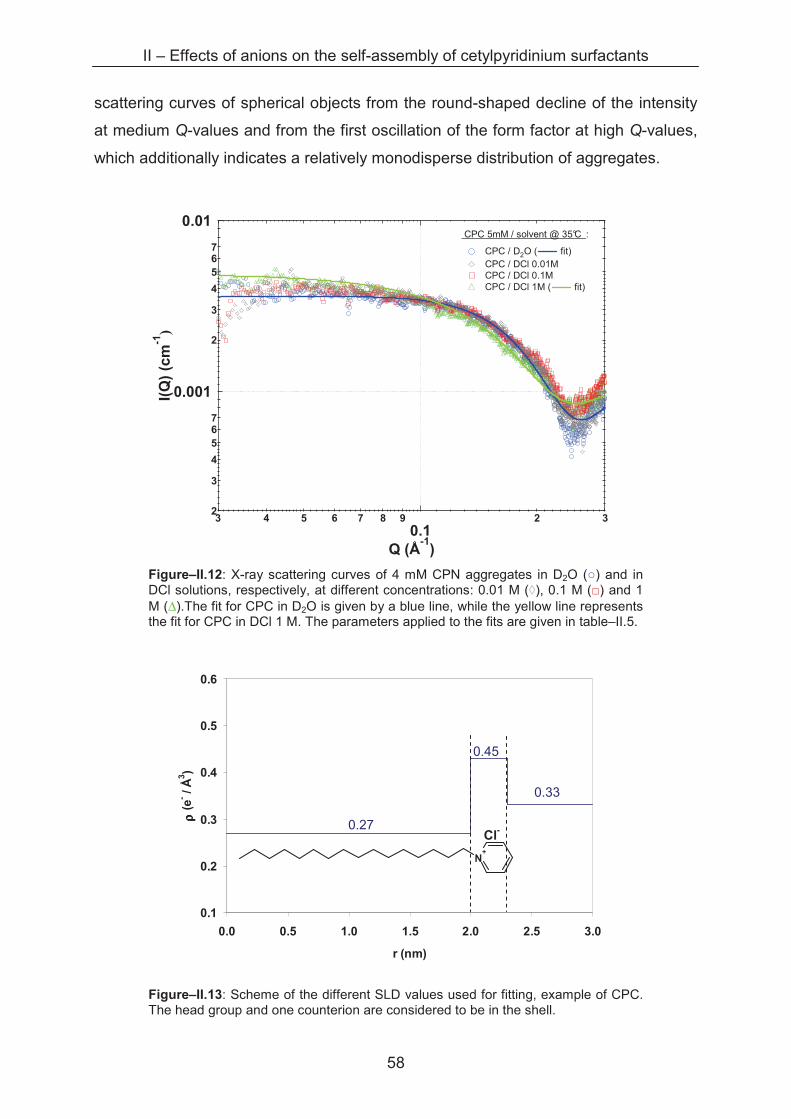
II – Effects of anions on the self-assembly of cetylpyridinium surfactants
58
scattering curves of spherical objects from the round-shaped decline of the intensity
at medium Q-values and from the first oscillation of the form factor at high Q-values,
which additionally indicates a relatively monodisperse distribution of aggregates.
2
3
4
567
0.001
2
3
4
567
0.01
I(Q
) (c
m-1
)
3 4 5 6 7 8 9
0.12 3
Q (Å-1
)
CPC 5mM / solvent @ 35°C :
CPC / D2O ( fit) CPC / DCl 0.01M CPC / DCl 0.1M CPC / DCl 1M ( fit)
Figure–II.12: X-ray scattering curves of 4 mM CPN aggregates in D2O (�) and in DCl solutions, respectively, at different concentrations: 0.01 M (�), 0.1 M (�) and 1 M (∆).The fit for CPC in D2O is given by a blue line, while the yellow line represents the fit for CPC in DCl 1 M. The parameters applied to the fits are given in table–II.5.
Figure–II.13: Scheme of the different SLD values used for fitting, example of CPC. The head group and one counterion are considered to be in the shell.
0.1
0.2
0.3
0.4
0.5
0.6
0.0 0.5 1.0 1.5 2.0 2.5 3.0
r (nm)
ρρ ρρ (
e- /
Å3)
N+
0.27
0.33
0.45
Cl-
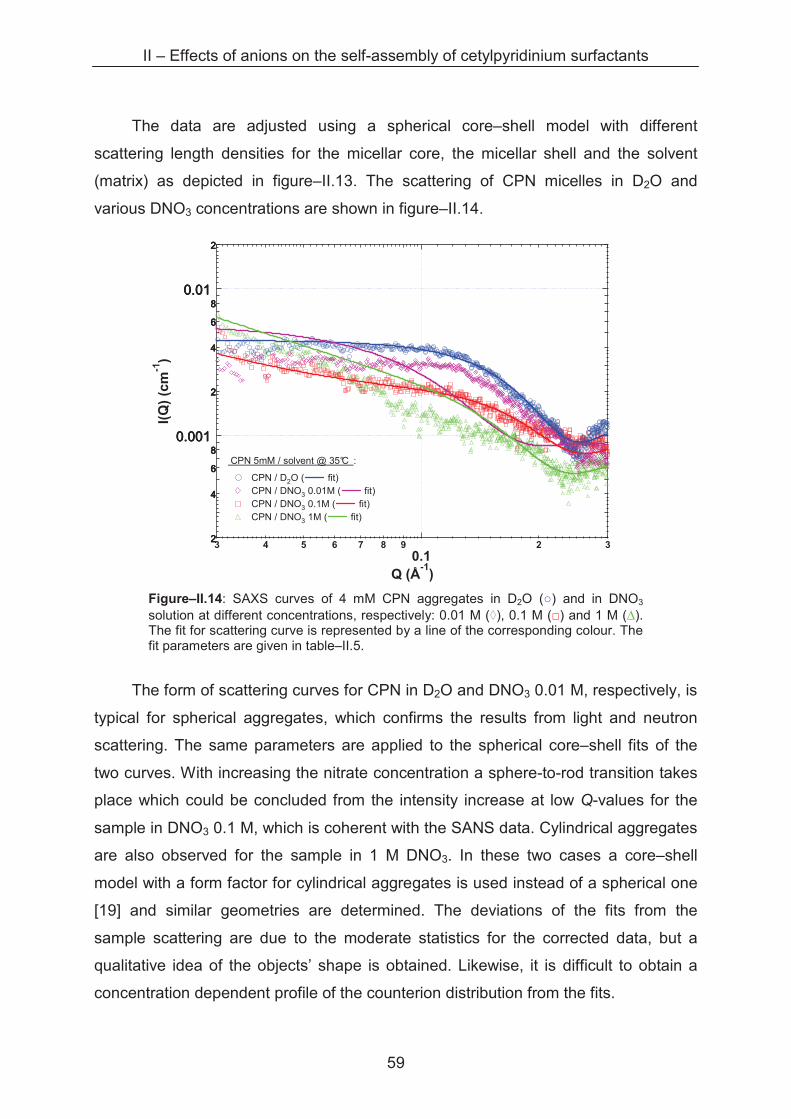
II – Effects of anions on the self-assembly of cetylpyridinium surfactants
59
The data are adjusted using a spherical core–shell model with different
scattering length densities for the micellar core, the micellar shell and the solvent
(matrix) as depicted in figure–II.13. The scattering of CPN micelles in D2O and
various DNO3 concentrations are shown in figure–II.14.
I(Q
) (c
m-1
)
3 4 5 6 7 8 90.1
2 3
Q (Å-1
)
CPN 5mM / solvent @ 35°C :
CPN / D2O ( fit) CPN / DNO3 0.01M ( fit) CPN / DNO3 0.1M ( fit) CPN / DNO3 1M ( fit)
Figure–II.14: SAXS curves of 4 mM CPN aggregates in D2O (�) and in DNO3
solution at different concentrations, respectively: 0.01 M (�), 0.1 M (�) and 1 M (∆). The fit for scattering curve is represented by a line of the corresponding colour. The fit parameters are given in table–II.5.
The form of scattering curves for CPN in D2O and DNO3 0.01 M, respectively, is
typical for spherical aggregates, which confirms the results from light and neutron
scattering. The same parameters are applied to the spherical core–shell fits of the
two curves. With increasing the nitrate concentration a sphere-to-rod transition takes
place which could be concluded from the intensity increase at low Q-values for the
sample in DNO3 0.1 M, which is coherent with the SANS data. Cylindrical aggregates
are also observed for the sample in 1 M DNO3. In these two cases a core–shell
model with a form factor for cylindrical aggregates is used instead of a spherical one
[19] and similar geometries are determined. The deviations of the fits from the
sample scattering are due to the moderate statistics for the corrected data, but a
qualitative idea of the objects’ shape is obtained. Likewise, it is difficult to obtain a
concentration dependent profile of the counterion distribution from the fits.
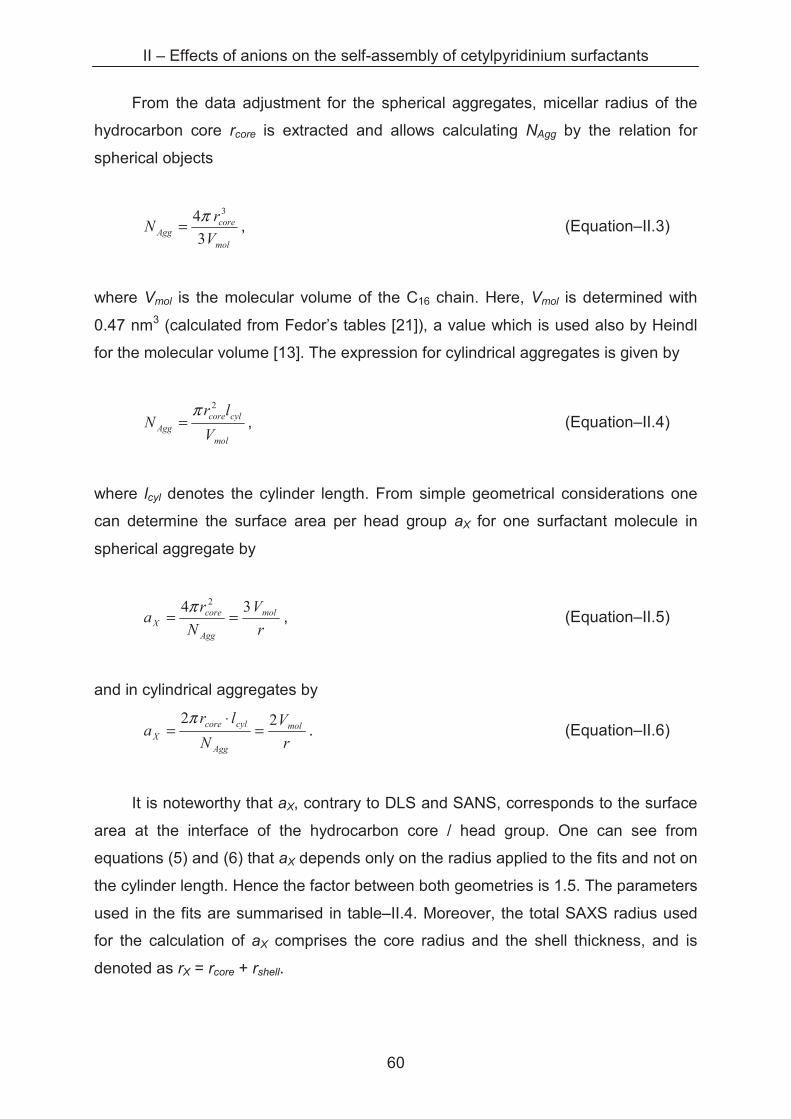
II – Effects of anions on the self-assembly of cetylpyridinium surfactants
60
From the data adjustment for the spherical aggregates, micellar radius of the
hydrocarbon core rcore is extracted and allows calculating NAgg by the relation for
spherical objects
mol
coreAgg
V
rN
3
4 3π= , (Equation–II.3)
where Vmol is the molecular volume of the C16 chain. Here, Vmol is determined with
0.47 nm3 (calculated from Fedor’s tables [21]), a value which is used also by Heindl
for the molecular volume [13]. The expression for cylindrical aggregates is given by
mol
cylcore
AggV
lrN
2π= , (Equation–II.4)
where lcyl denotes the cylinder length. From simple geometrical considerations one
can determine the surface area per head group aX for one surfactant molecule in
spherical aggregate by
r
V
N
ra mol
Agg
core
X
34 2
==π
, (Equation–II.5)
and in cylindrical aggregates by
r
V
N
lra mol
Agg
cylcore
X
22=
⋅=
π. (Equation–II.6)
It is noteworthy that aX, contrary to DLS and SANS, corresponds to the surface
area at the interface of the hydrocarbon core / head group. One can see from
equations (5) and (6) that aX depends only on the radius applied to the fits and not on
the cylinder length. Hence the factor between both geometries is 1.5. The parameters
used in the fits are summarised in table–II.4. Moreover, the total SAXS radius used
for the calculation of aX comprises the core radius and the shell thickness, and is
denoted as rX = rcore + rshell.
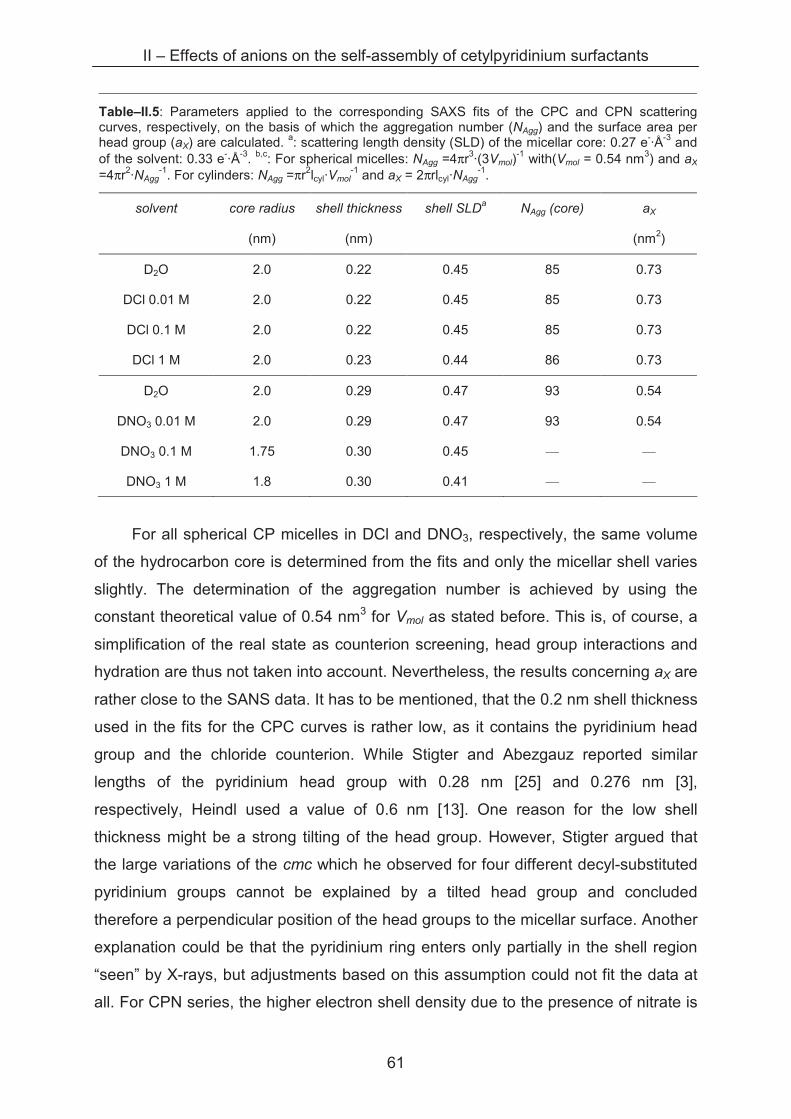
II – Effects of anions on the self-assembly of cetylpyridinium surfactants
61
Table–II.5: Parameters applied to the corresponding SAXS fits of the CPC and CPN scattering curves, respectively, on the basis of which the aggregation number (NAgg) and the surface area per head group (aX) are calculated. a: scattering length density (SLD) of the micellar core: 0.27 e-·Å-3 and of the solvent: 0.33 e-·Å-3. b,c: For spherical micelles: NAgg =4πr3·(3Vmol)
-1 with(Vmol = 0.54 nm3) and aX
=4πr2·NAgg-1. For cylinders: NAgg =πr2lcyl·Vmol
-1 and aX = 2πrlcyl·NAgg-1.
solvent core radius shell thickness shell SLDa NAgg (core) aX
(nm) (nm) (nm2)
D2O 2.0 0.22 0.45 85 0.73
DCl 0.01 M 2.0 0.22 0.45 85 0.73
DCl 0.1 M 2.0 0.22 0.45 85 0.73
DCl 1 M 2.0 0.23 0.44 86 0.73
D2O 2.0 0.29 0.47 93 0.54
DNO3 0.01 M 2.0 0.29 0.47 93 0.54
DNO3 0.1 M 1.75 0.30 0.45 — —
DNO3 1 M 1.8 0.30 0.41 — —
For all spherical CP micelles in DCl and DNO3, respectively, the same volume
of the hydrocarbon core is determined from the fits and only the micellar shell varies
slightly. The determination of the aggregation number is achieved by using the
constant theoretical value of 0.54 nm3 for Vmol as stated before. This is, of course, a
simplification of the real state as counterion screening, head group interactions and
hydration are thus not taken into account. Nevertheless, the results concerning aX are
rather close to the SANS data. It has to be mentioned, that the 0.2 nm shell thickness
used in the fits for the CPC curves is rather low, as it contains the pyridinium head
group and the chloride counterion. While Stigter and Abezgauz reported similar
lengths of the pyridinium head group with 0.28 nm [25] and 0.276 nm [3],
respectively, Heindl used a value of 0.6 nm [13]. One reason for the low shell
thickness might be a strong tilting of the head group. However, Stigter argued that
the large variations of the cmc which he observed for four different decyl-substituted
pyridinium groups cannot be explained by a tilted head group and concluded
therefore a perpendicular position of the head groups to the micellar surface. Another
explanation could be that the pyridinium ring enters only partially in the shell region
“seen” by X-rays, but adjustments based on this assumption could not fit the data at
all. For CPN series, the higher electron shell density due to the presence of nitrate is
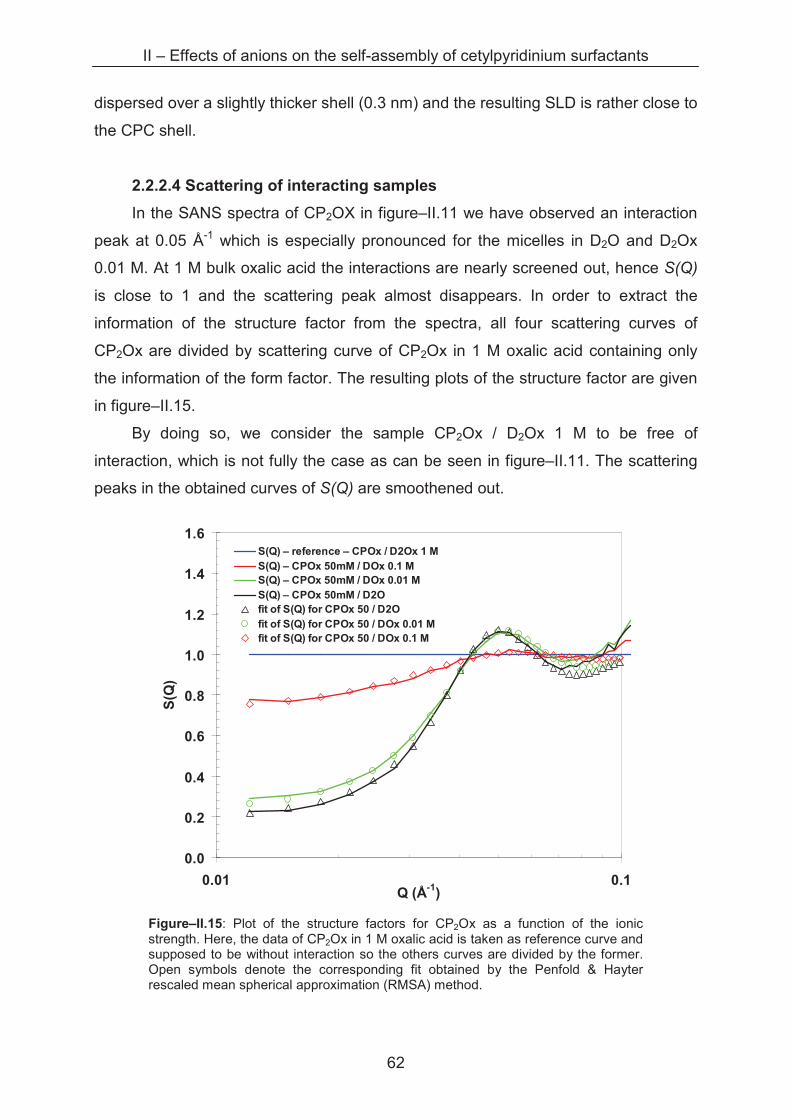
II – Effects of anions on the self-assembly of cetylpyridinium surfactants
62
dispersed over a slightly thicker shell (0.3 nm) and the resulting SLD is rather close to
the CPC shell.
2.2.2.4 Scattering of interacting samples
In the SANS spectra of CP2OX in figure–II.11 we have observed an interaction
peak at 0.05 Å-1 which is especially pronounced for the micelles in D2O and D2Ox
0.01 M. At 1 M bulk oxalic acid the interactions are nearly screened out, hence S(Q)
is close to 1 and the scattering peak almost disappears. In order to extract the
information of the structure factor from the spectra, all four scattering curves of
CP2Ox are divided by scattering curve of CP2Ox in 1 M oxalic acid containing only
the information of the form factor. The resulting plots of the structure factor are given
in figure–II.15.
By doing so, we consider the sample CP2Ox / D2Ox 1 M to be free of
interaction, which is not fully the case as can be seen in figure–II.11. The scattering
peaks in the obtained curves of S(Q) are smoothened out.
0.0
0.2
0.4
0.6
0.8
1.0
1.2
1.4
1.6
0.01 0.1Q (Å-1)
S(Q
)
S(Q) – reference – CPOx / D2Ox 1 M
S(Q) – CPOx 50mM / DOx 0.1 MS(Q) – CPOx 50mM / DOx 0.01 M
S(Q) – CPOx 50mM / D2Ofit of S(Q) for CPOx 50 / D2O
fit of S(Q) for CPOx 50 / DOx 0.01 Mfit of S(Q) for CPOx 50 / DOx 0.1 M
Figure–II.15: Plot of the structure factors for CP2Ox as a function of the ionic strength. Here, the data of CP2Ox in 1 M oxalic acid is taken as reference curve and supposed to be without interaction so the others curves are divided by the former. Open symbols denote the corresponding fit obtained by the Penfold & Hayter rescaled mean spherical approximation (RMSA) method.
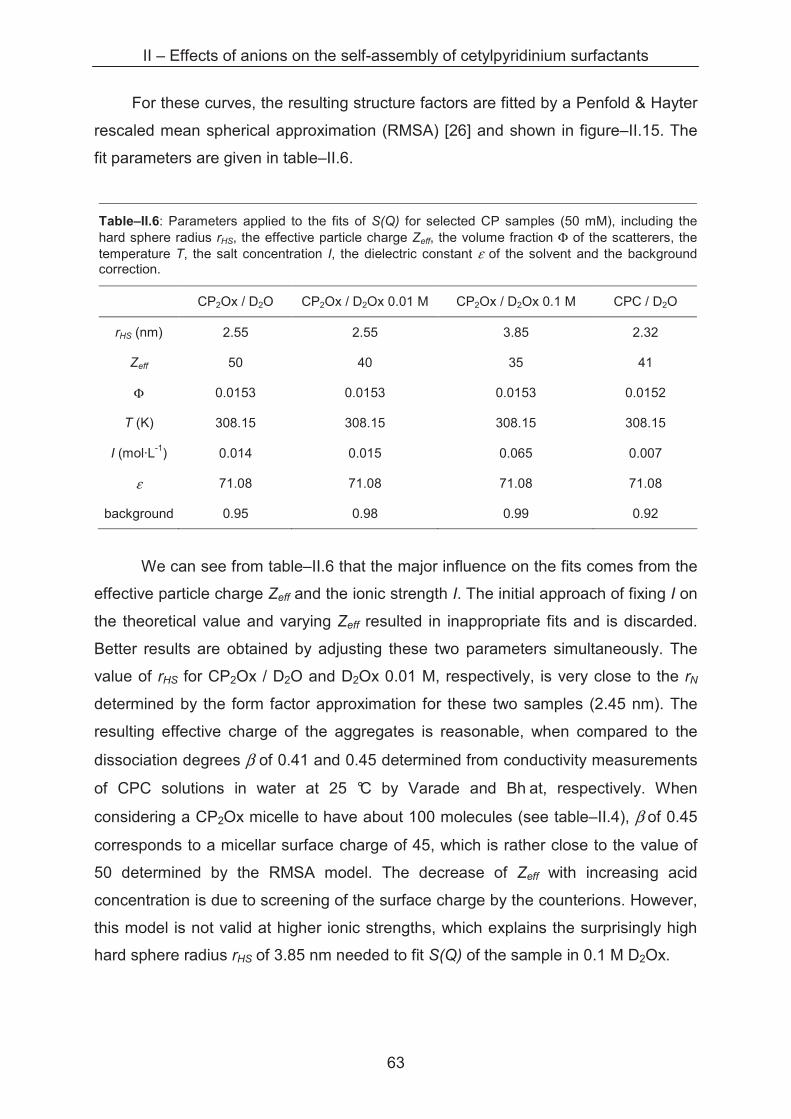
II – Effects of anions on the self-assembly of cetylpyridinium surfactants
63
For these curves, the resulting structure factors are fitted by a Penfold & Hayter
rescaled mean spherical approximation (RMSA) [26] and shown in figure–II.15. The
fit parameters are given in table–II.6.
Table–II.6: Parameters applied to the fits of S(Q) for selected CP samples (50 mM), including the hard sphere radius rHS, the effective particle charge Zeff, the volume fraction Φ of the scatterers, the temperature T, the salt concentration I, the dielectric constant ε of the solvent and the background correction.
CP2Ox / D2O CP2Ox / D2Ox 0.01 M CP2Ox / D2Ox 0.1 M CPC / D2O
rHS (nm) 2.55 2.55 3.85 2.32
Zeff 50 40 35 41
Φ 0.0153 0.0153 0.0153 0.0152
T (K) 308.15 308.15 308.15 308.15
I (mol·L-1) 0.014 0.015 0.065 0.007
ε 71.08 71.08 71.08 71.08
background 0.95 0.98 0.99 0.92
We can see from table–II.6 that the major influence on the fits comes from the
effective particle charge Zeff and the ionic strength I. The initial approach of fixing I on
the theoretical value and varying Zeff resulted in inappropriate fits and is discarded.
Better results are obtained by adjusting these two parameters simultaneously. The
value of rHS for CP2Ox / D2O and D2Ox 0.01 M, respectively, is very close to the rN
determined by the form factor approximation for these two samples (2.45 nm). The
resulting effective charge of the aggregates is reasonable, when compared to the
dissociation degrees β of 0.41 and 0.45 determined from conductivity measurements
of CPC solutions in water at 25 °C by Varade and Bh at, respectively. When
considering a CP2Ox micelle to have about 100 molecules (see table–II.4), β of 0.45
corresponds to a micellar surface charge of 45, which is rather close to the value of
50 determined by the RMSA model. The decrease of Zeff with increasing acid
concentration is due to screening of the surface charge by the counterions. However,
this model is not valid at higher ionic strengths, which explains the surprisingly high
hard sphere radius rHS of 3.85 nm needed to fit S(Q) of the sample in 0.1 M D2Ox.
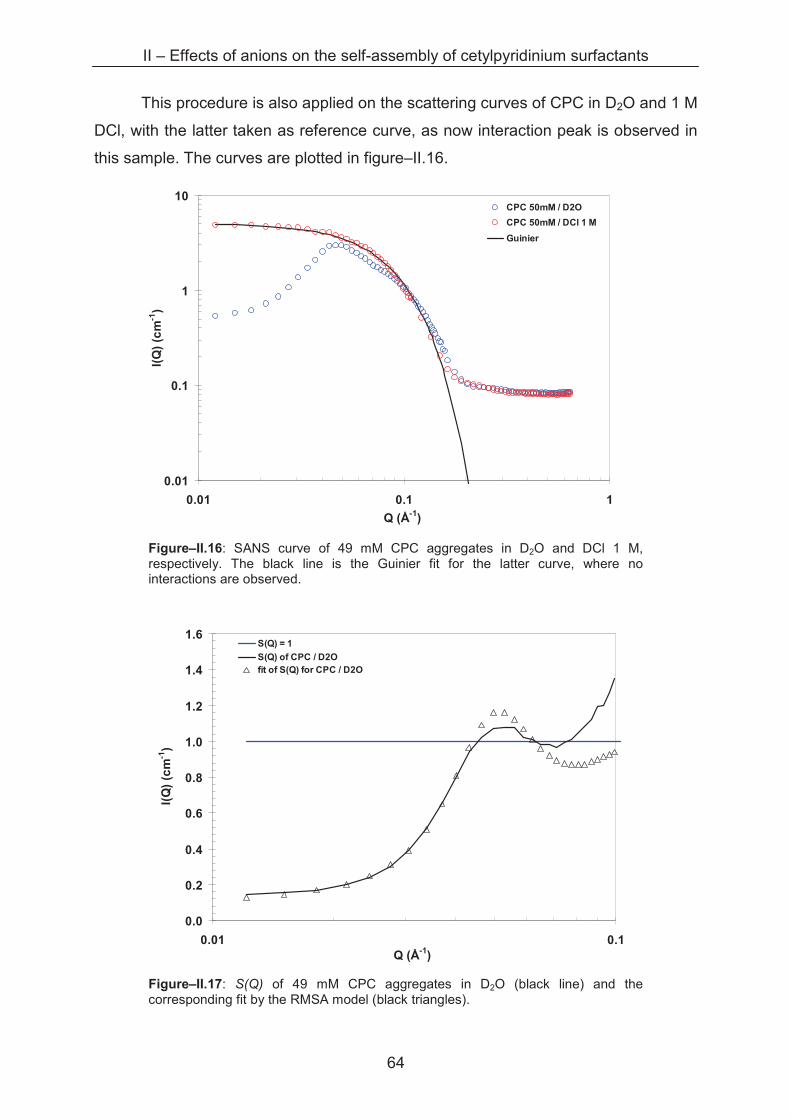
II – Effects of anions on the self-assembly of cetylpyridinium surfactants
64
This procedure is also applied on the scattering curves of CPC in D2O and 1 M
DCl, with the latter taken as reference curve, as now interaction peak is observed in
this sample. The curves are plotted in figure–II.16.
0.01
0.1
1
10
0.01 0.1 1
Q (Å-1)
I(Q
) (c
m-1
)
CPC 50mM / D2O
CPC 50mM / DCl 1 M
Guinier
Figure–II.16: SANS curve of 49 mM CPC aggregates in D2O and DCl 1 M, respectively. The black line is the Guinier fit for the latter curve, where no interactions are observed.
0.0
0.2
0.4
0.6
0.8
1.0
1.2
1.4
1.6
0.01 0.1Q (Å-1)
I(Q
) (c
m-1
)
S(Q) = 1
S(Q) of CPC / D2O
fit of S(Q) for CPC / D2O
Figure–II.17: S(Q) of 49 mM CPC aggregates in D2O (black line) and the corresponding fit by the RMSA model (black triangles).
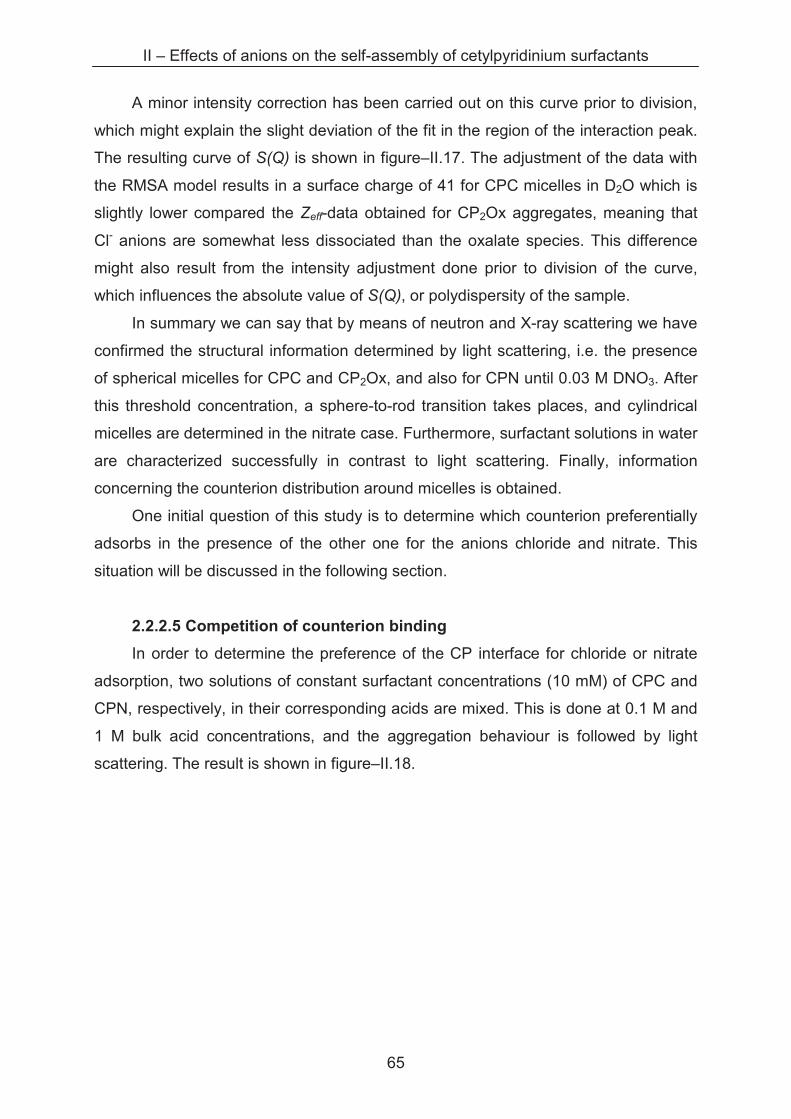
II – Effects of anions on the self-assembly of cetylpyridinium surfactants
65
A minor intensity correction has been carried out on this curve prior to division,
which might explain the slight deviation of the fit in the region of the interaction peak.
The resulting curve of S(Q) is shown in figure–II.17. The adjustment of the data with
the RMSA model results in a surface charge of 41 for CPC micelles in D2O which is
slightly lower compared the Zeff-data obtained for CP2Ox aggregates, meaning that
Cl- anions are somewhat less dissociated than the oxalate species. This difference
might also result from the intensity adjustment done prior to division of the curve,
which influences the absolute value of S(Q), or polydispersity of the sample.
In summary we can say that by means of neutron and X-ray scattering we have
confirmed the structural information determined by light scattering, i.e. the presence
of spherical micelles for CPC and CP2Ox, and also for CPN until 0.03 M DNO3. After
this threshold concentration, a sphere-to-rod transition takes places, and cylindrical
micelles are determined in the nitrate case. Furthermore, surfactant solutions in water
are characterized successfully in contrast to light scattering. Finally, information
concerning the counterion distribution around micelles is obtained.
One initial question of this study is to determine which counterion preferentially
adsorbs in the presence of the other one for the anions chloride and nitrate. This
situation will be discussed in the following section.
2.2.2.5 Competition of counterion binding
In order to determine the preference of the CP interface for chloride or nitrate
adsorption, two solutions of constant surfactant concentrations (10 mM) of CPC and
CPN, respectively, in their corresponding acids are mixed. This is done at 0.1 M and
1 M bulk acid concentrations, and the aggregation behaviour is followed by light
scattering. The result is shown in figure–II.18.
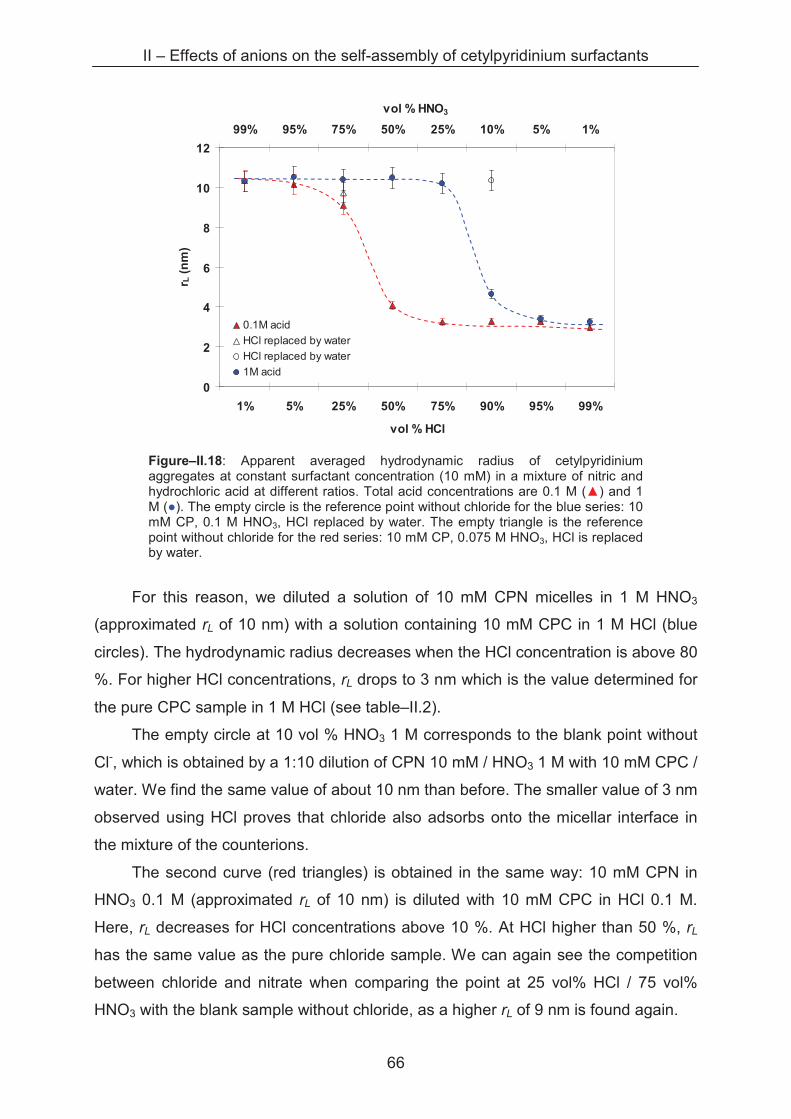
II – Effects of anions on the self-assembly of cetylpyridinium surfactants
66
0
2
4
6
8
10
12
1% 5% 25% 50% 75% 90% 95% 99%
vol % HCl
r L (
nm
)
99% 95% 75% 50% 25% 10% 5% 1%
vol % HNO3
0.1M acid
HCl replaced by water
HCl replaced by water
1M acid
Figure–II.18: Apparent averaged hydrodynamic radius of cetylpyridinium aggregates at constant surfactant concentration (10 mM) in a mixture of nitric and hydrochloric acid at different ratios. Total acid concentrations are 0.1 M (�) and 1 M (�). The empty circle is the reference point without chloride for the blue series: 10 mM CP, 0.1 M HNO3, HCl replaced by water. The empty triangle is the reference point without chloride for the red series: 10 mM CP, 0.075 M HNO3, HCl is replaced by water.
For this reason, we diluted a solution of 10 mM CPN micelles in 1 M HNO3
(approximated rL of 10 nm) with a solution containing 10 mM CPC in 1 M HCl (blue
circles). The hydrodynamic radius decreases when the HCl concentration is above 80
%. For higher HCl concentrations, rL drops to 3 nm which is the value determined for
the pure CPC sample in 1 M HCl (see table–II.2).
The empty circle at 10 vol % HNO3 1 M corresponds to the blank point without
Cl-, which is obtained by a 1:10 dilution of CPN 10 mM / HNO3 1 M with 10 mM CPC /
water. We find the same value of about 10 nm than before. The smaller value of 3 nm
observed using HCl proves that chloride also adsorbs onto the micellar interface in
the mixture of the counterions.
The second curve (red triangles) is obtained in the same way: 10 mM CPN in
HNO3 0.1 M (approximated rL of 10 nm) is diluted with 10 mM CPC in HCl 0.1 M.
Here, rL decreases for HCl concentrations above 10 %. At HCl higher than 50 %, rL
has the same value as the pure chloride sample. We can again see the competition
between chloride and nitrate when comparing the point at 25 vol% HCl / 75 vol%
HNO3 with the blank sample without chloride, as a higher rL of 9 nm is found again.
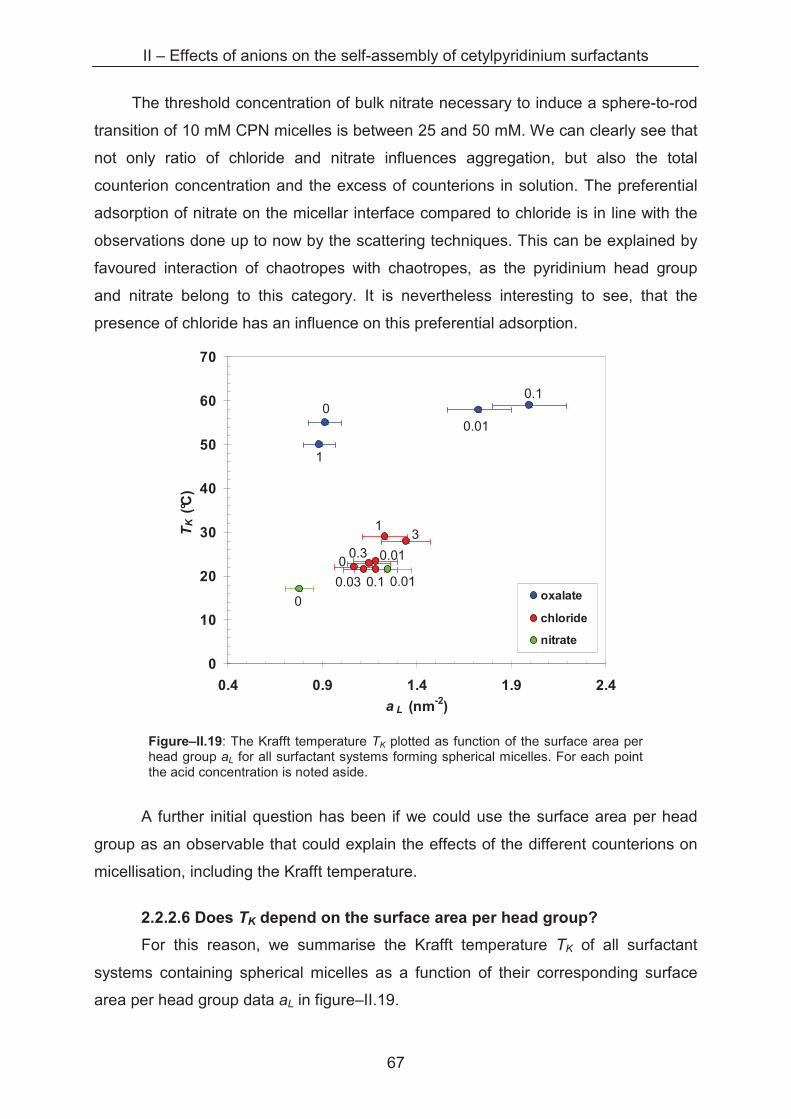
II – Effects of anions on the self-assembly of cetylpyridinium surfactants
67
The threshold concentration of bulk nitrate necessary to induce a sphere-to-rod
transition of 10 mM CPN micelles is between 25 and 50 mM. We can clearly see that
not only ratio of chloride and nitrate influences aggregation, but also the total
counterion concentration and the excess of counterions in solution. The preferential
adsorption of nitrate on the micellar interface compared to chloride is in line with the
observations done up to now by the scattering techniques. This can be explained by
favoured interaction of chaotropes with chaotropes, as the pyridinium head group
and nitrate belong to this category. It is nevertheless interesting to see, that the
presence of chloride has an influence on this preferential adsorption.
0
10
20
30
40
50
60
70
0.4 0.9 1.4 1.9 2.4
a L (nm-2)
TK
(°C
)
oxalate
chloride
nitrate
Figure–II.19: The Krafft temperature TK plotted as function of the surface area per head group aL for all surfactant systems forming spherical micelles. For each point the acid concentration is noted aside.
A further initial question has been if we could use the surface area per head
group as an observable that could explain the effects of the different counterions on
micellisation, including the Krafft temperature.
2.2.2.6 Does TK depend on the surface area per head group?
For this reason, we summarise the Krafft temperature TK of all surfactant
systems containing spherical micelles as a function of their corresponding surface
area per head group data aL in figure–II.19.
0.1
0.3
3 1
0.10.03
0.010
0.01
0
0.01 0
1
II – Effects of anions on the self-assembly of cetylpyridinium surfactants
68
Unfortunately, no clear influence of the surface are per head group at a fixed
ionic strength on the Krafft temperature can be deduced. For different head group
areas we find the same Krafft temperature. Nevertheless it cannot be excluded, that
our measurement techniques are not precise enough to determine small changes in
aL.
2.2.3 Lateral Equation of State (EOS)
The structural data on cetylpyridinium aggregates obtained in the previous parts
of this work can be used to determine the influence of anions on the free energy of
the polar head group in an aggregate, resulting in a lateral equation of state (EOS).
This equation allows quantifying the different interactions between the surfactants
heads within the aggregates whatever their shape, globular, cylindrical or planar
(monolayer or bilayer). Few articles focus on the determination of the lateral equation
of state [27, 28] and there is no generally established method to separate all
energetic contributions to the EOS. Consequently, much depend on the model
system used and specific approaches taken. Up to now in most studies osmotic
stress experiments are carried out on phospholipid bilayers or catanionic vesicles as
model systems [27, 28, 29, 30, 31]. In contrast to former works, where globally
neutral lipid-water interfaces are considered to charge up by adsorbing added salt
the reference state here consists of small spherical micelles with a highly curved and
charged interface. It has to be noted that we treat only spherical micelles in this
approach.
We focus on three main contributions to the total free energy: (i) the
hydrocarbon-water free energy which is modelled with a term of the interfacial
tension, (ii) the short range steric repulsion energy of the surfactant head groups and,
(iii) the electrostatic energy of interaction between the charged pyridinium head
groups and the “associated”, or “associated and adsorbed” counterions to the
micelle, respectively. This last point requires an exact definition of association and
adsorption.
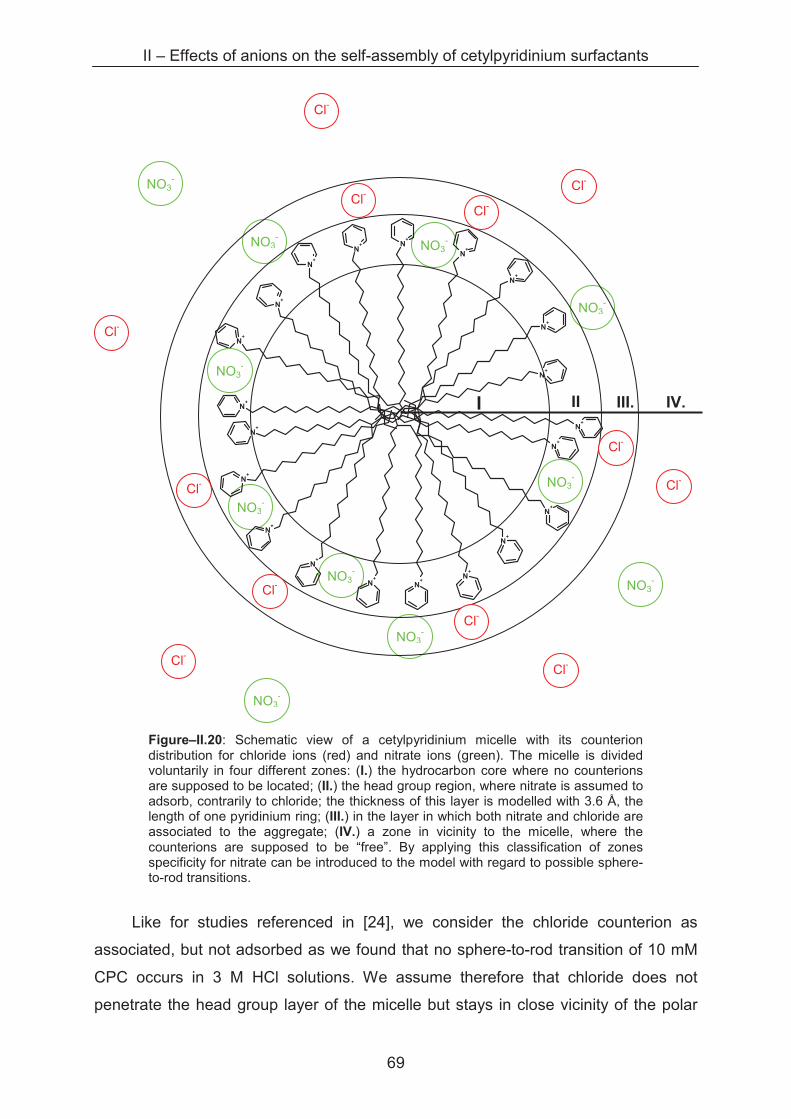
II – Effects of anions on the self-assembly of cetylpyridinium surfactants
69
Figure–II.20: Schematic view of a cetylpyridinium micelle with its counterion distribution for chloride ions (red) and nitrate ions (green). The micelle is divided voluntarily in four different zones: (I.) the hydrocarbon core where no counterions are supposed to be located; (II.) the head group region, where nitrate is assumed to adsorb, contrarily to chloride; the thickness of this layer is modelled with 3.6 Å, the length of one pyridinium ring; (III.) in the layer in which both nitrate and chloride are associated to the aggregate; (IV.) a zone in vicinity to the micelle, where the counterions are supposed to be “free”. By applying this classification of zones specificity for nitrate can be introduced to the model with regard to possible sphere-to-rod transitions.
Like for studies referenced in [24], we consider the chloride counterion as
associated, but not adsorbed as we found that no sphere-to-rod transition of 10 mM
CPC occurs in 3 M HCl solutions. We assume therefore that chloride does not
penetrate the head group layer of the micelle but stays in close vicinity of the polar
NO3-
NO3-
NO3-
NO3-
NO3-
NO3-
N+
N+
N+
N+
N+
N+
N+
N+
N+
N+
N+ N
+
N+
N+
N+
N+
N+
N+
N+
N+N
+
Cl-
Cl-
Cl-
Cl-
Cl-
Cl-
Cl-
Cl-
Cl-Cl-
Cl-
Cl-
I II.
III. IV.
NO3-
NO3-
NO3-
NO3-
NO3-
II – Effects of anions on the self-assembly of cetylpyridinium surfactants
70
head and we talk about counterion association. In contrast, we have observed that
depending on the ionic strength, the nitrate ion can induce a sphere-to-rod transition
for the micelles.
After analysing the scattering data we have deduced that the nitrate ion can be
considered as partially intercalated within the head group region. Thus, we define it
as an associated and adsorbed ion. These considerations are schematised in figure–
II.20. The three main contributions presented above account for the total free energy
of the polar corona, which can be written as a function of the surface area per head
group a:
elrepheadWLtotal FFFF ++= −/ (Equation–II.7)
In this equation of state, the surface tension term FL/W accounts for the
constraint of creating an amphiphile–water interface and is defined as:
)( 0/ aaF WL −= γ (Equation–II.8)
where γ denotes the surface tension of the amphiphile-water interface, a the head
group area and a0 the minimal head group area arising from pure steric
considerations and fixed at 36 nm2. As γ is not directly accessible, the value of the
pure hexadecane/water interface (47.5 mN·m-1) is taken as an approximation [5]. The
second term in the EOS corresponds to the short range repulsion between the head
groups and can be expressed as [27]
0
2 )(
aa
CF OH
rephead−
=−
µ. (Equation–II.9)
This term diverges when two polar heads are in contact and then a simple
power law in 1
0)( −− aa is considered. The factor C depends only on the chemical
potential of water. This parameter is adjusted by considering that at zero bulk ionic
strength the ion clouds around the micelle is homogeneous (and characterized by a
large Debye length). Due to the Gauss theorem the field inside this ion clouds is zero

II – Effects of anions on the self-assembly of cetylpyridinium surfactants
71
[32] and Fel is considered to be constant and negligible. Then, we can write for these
conditions:
0/ =+= −repheadWLtotal FFF (Equation–II.10)
Then, the Parameter C is calculated from this equation by taking the surface per
head group area aT from tensiometry measurements at the cmc (aT = 0.43 ± 0.02
nm2 for both CPC and CPN water [4]). It follows
2
0 )( aaC −= γ . (Equation–II.11)
With γ = 47.5 mN·m-1 = 0.1154 kT·Å-2, we obtain C = 5.65 kT for the chloride and the
nitrate case.
In the following part, the electrostatic energy term Fel is developed using two
different approaches in our system, depending on the counterion used. We can thus
distinguish between an “association” and an “association + adsorption”. For
kosmotropic counterions like chloride, a mean-field Poisson-Boltzmann approach is
considered as sufficient to account for the electrostatic interactions. Indeed, we
consider only the association of chloride with the pyridinium head groups in the
Debye layer. For nitrate, however, association and adsorption are both considered to
take place. The complete expression of the electrical term is given in equation–II.12
and will be detailed further the following.
{ } { }erelecPBrosmoticcoradspackingsiteNadselec FFFFTSEtotF int__ +−+−−=
contribution 1 contribution 2 contribution 3
(Equation–II.12)
For better understanding, this equation can be separated in three major
contributions:
1. The first contribution comes from the adsorption of ions on the micellar
surface, which concerns the first three terms NadsE , siteTS− and packingF− .
II – Effects of anions on the self-assembly of cetylpyridinium surfactants
72
Here, NadsE stands for the electrostatic energy of the ions adsorbed to the
surface and is given as:
[ ]2
10
2
8adsbare
coll
Nads NZR
eE −=
επε (Equation–II.13)
where e is the elementary charge, ε0 and ε1 the dielectric constants of the
vacuum and the solvent, respectively, Rcoll is the radius of the colloid, Zbare is
the bare charge of the micelle (i.e. the aggregation number NAgg) and Nads is
the number of adsorbed counterions. The second term is the contribution to
the mixing entropy for adsorbed ions and defined as
Nads
Zbaresite CkTTS ln−=− , (Equation–II.14)
with NAds
ZbareC being the binomial coefficient, i.e the combination of adsorption
sites and expressed as the factorial ratio !)!(
!
barebareads
ads
ZZN
N
− of the number of
adsorbed ions Nads and the number of available sites Zbare.
The last term of this first contribution is the packing entropy, i.e. the loss of
entropy due to the adsorption of ions in a site of volume Vsite between the polar
heads. It is defined as:
)ln( 0
siteadsPacking VNkTF ρ⋅−= (Equation–II.15)
with ρ0 being the volume fraction of the ions in the bulk phase.
2. The second major contribution comprises two other terms rosmoticcoradsF _ and
PBF . Here, the first term stands for the decrease of osmotic pressure when a
certain number of ions adsorb and is described as:
adsrosmoticcorads NkTF ⋅=_ (Equation–II.16)
II – Effects of anions on the self-assembly of cetylpyridinium surfactants
73
Finally, the last term is a corrective electrostatic term that takes into account
the electrostatic energy of the non-adsorbed ions, which are not distributed
homogeneously around the micelle. This term is a numerical solution of the
Poisson-Boltzmann equation for a spherical geometry obtained by a finite
difference method written as:
�−= rdVF elPB
�2/ρ (Equation–II.17)
with ρel being the charge density of the ions and V their electrostatic potential.
3. The third and last major contribution comes from the electrostatic repulsion
between the polar heads when the radius of the micelle is changing. We can
write this term for the charged micellar shell:
coll
Bbare
coll
bare
R
kTLZ
R
eZE
242
12
10
22 ⋅⋅=
⋅⋅=
επε (Equation–II.18)
where LB the Bjerrum length. So the energy per surfactant molecule becomes
coll
Bbareerelec
R
LZF
2int_
⋅= (Equation–II.19)
These considerations lead us to the definition of the following variables: a, Rcoll,
Zbare, Vsite, Nads. In order to simplify the approach, we can link Rcoll with a, the polar
head group area, by:
π4
aNR
Agg
coll
⋅= . (Equation–II.20)
Thus, when varying the surface per head group, the radius of the colloid will be
affected, too. Zbare is identical with NAgg as described above. Furthermore we define
the volume of adsorption site per head group (Vsite) by calculating the total volume of
the micellar shell (where the polar CP heads are located) and subtracting the
II – Effects of anions on the self-assembly of cetylpyridinium surfactants
74
constant volume that is sterically occupied by the CP heads. In this approach, each
CP head group is considered to have a volume corresponding to a0·l, where l is the
length of a CP head group. For l we take a value of 3.6 Å, determined by the software
Avogadro for the length of one pyridinium ion, which lies in between the data
published by Stigter (2.8 Å) and Heindl (6.0 Å). The total volume of all sites per
micelle is
( )[ ] ���
����
�−⋅−−=
2
033
33
4
coll
collcoll
tot
siteR
alRRV π (Equation–II.21)
and Vsite results by
Agg
tot
site
siteN
VV = . (Equation–II.22)
Our approach now consists in minimising equation–II.12 first with respect to amin
and then with respect to Nads. It has to be noted that for a kosmotropic counterion like
chloride which does not adsorb according to our model, Nads equals zero and the
three middle terms of equation–II.12 are left out. Only the contribution of the
electrostatic energy of adsorption [ ]2
10
2
8bare
coll
Nads ZR
eE
επε= and the free energy
calculated by the Poisson-Boltzmann approach �−= rdVF elPB
�2/ρ remain. In
contrast, for a chaotropic counterion like nitrate we consider a partial adsorption in
the sites of the micellar interface and all the six contributions of equation–II.12
influence the calculation of the electric energy.
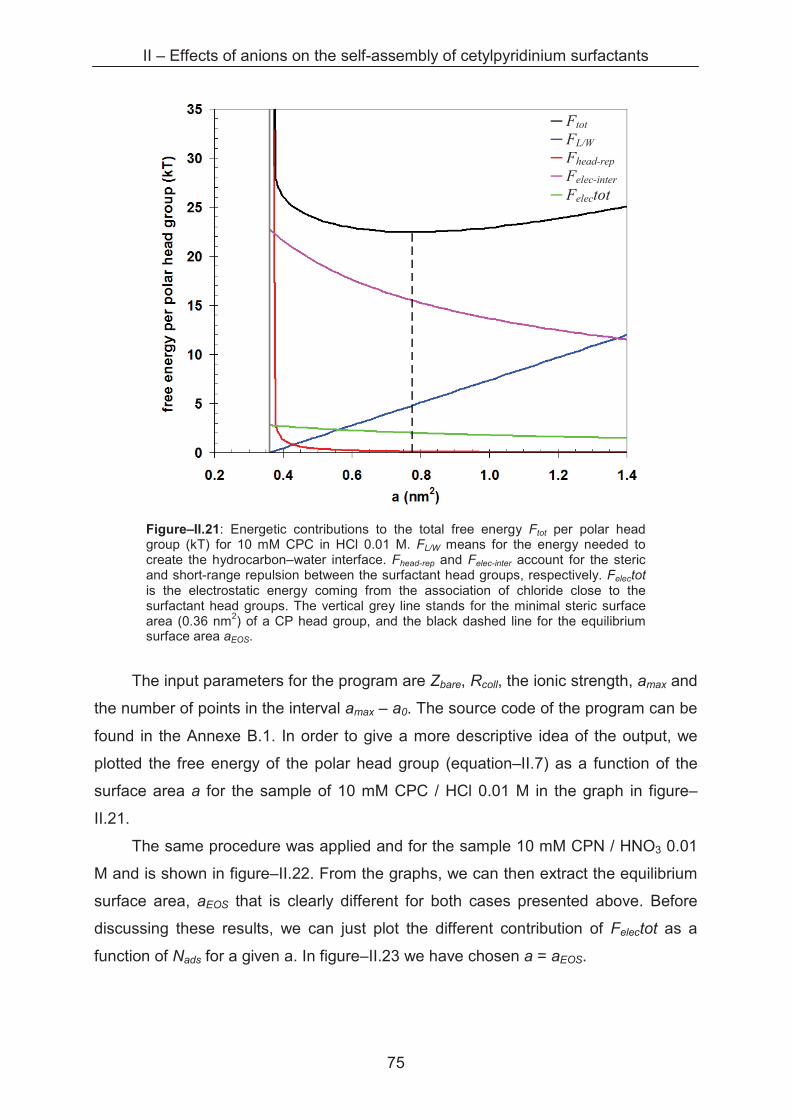
II – Effects of anions on the self-assembly of cetylpyridinium surfactants
75
Figure–II.21: Energetic contributions to the total free energy Ftot per polar head group (kT) for 10 mM CPC in HCl 0.01 M. FL/W means for the energy needed to create the hydrocarbon–water interface. Fhead-rep and Felec-inter account for the steric and short-range repulsion between the surfactant head groups, respectively. Felectot is the electrostatic energy coming from the association of chloride close to the surfactant head groups. The vertical grey line stands for the minimal steric surface area (0.36 nm2) of a CP head group, and the black dashed line for the equilibrium surface area aEOS.
The input parameters for the program are Zbare, Rcoll, the ionic strength, amax and
the number of points in the interval amax – a0. The source code of the program can be
found in the Annexe B.1. In order to give a more descriptive idea of the output, we
plotted the free energy of the polar head group (equation–II.7) as a function of the
surface area a for the sample of 10 mM CPC / HCl 0.01 M in the graph in figure–
II.21.
The same procedure was applied and for the sample 10 mM CPN / HNO3 0.01
M and is shown in figure–II.22. From the graphs, we can then extract the equilibrium
surface area, aEOS that is clearly different for both cases presented above. Before
discussing these results, we can just plot the different contribution of Felectot as a
function of Nads for a given a. In figure–II.23 we have chosen a = aEOS.
� Ftot
� FL/W
� Fhead-rep
� Felec-inter
� Felectot
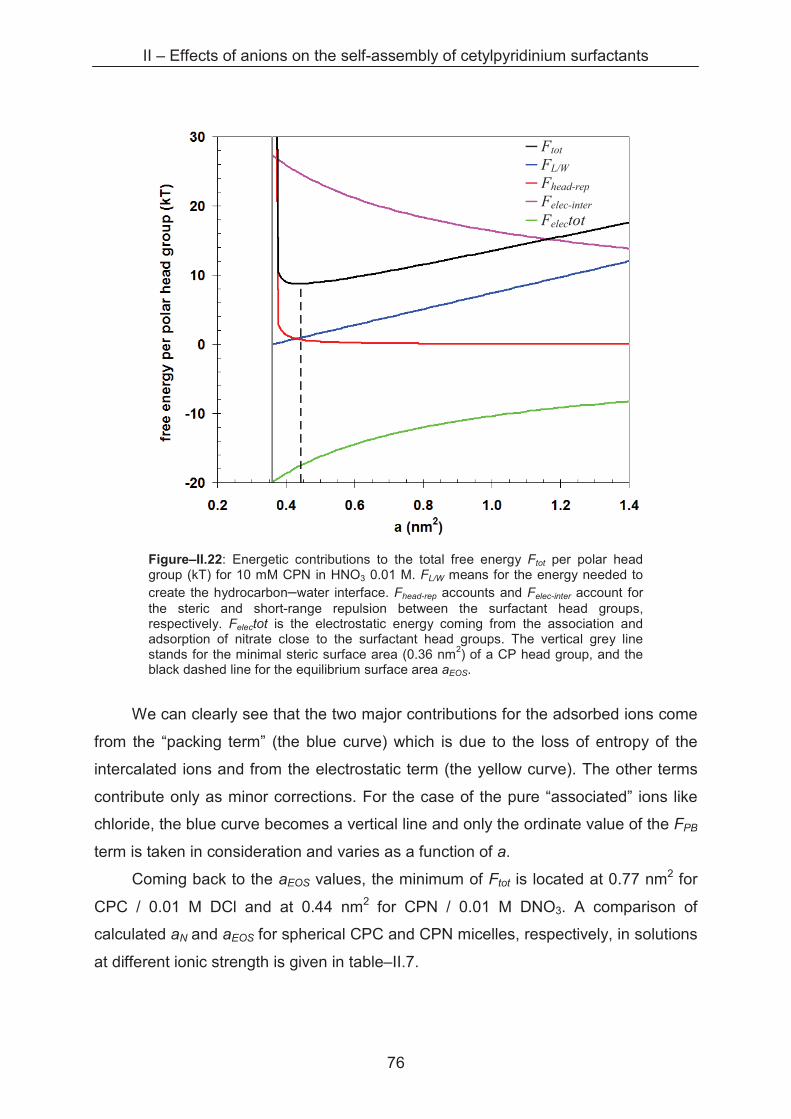
II – Effects of anions on the self-assembly of cetylpyridinium surfactants
76
Figure–II.22: Energetic contributions to the total free energy Ftot per polar head group (kT) for 10 mM CPN in HNO3 0.01 M. FL/W means for the energy needed to create the hydrocarbon–water interface. Fhead-rep accounts and Felec-inter account for the steric and short-range repulsion between the surfactant head groups, respectively. Felectot is the electrostatic energy coming from the association and adsorption of nitrate close to the surfactant head groups. The vertical grey line stands for the minimal steric surface area (0.36 nm2) of a CP head group, and the black dashed line for the equilibrium surface area aEOS.
We can clearly see that the two major contributions for the adsorbed ions come
from the “packing term” (the blue curve) which is due to the loss of entropy of the
intercalated ions and from the electrostatic term (the yellow curve). The other terms
contribute only as minor corrections. For the case of the pure “associated” ions like
chloride, the blue curve becomes a vertical line and only the ordinate value of the FPB
term is taken in consideration and varies as a function of a.
Coming back to the aEOS values, the minimum of Ftot is located at 0.77 nm2 for
CPC / 0.01 M DCl and at 0.44 nm2 for CPN / 0.01 M DNO3. A comparison of
calculated aN and aEOS for spherical CPC and CPN micelles, respectively, in solutions
at different ionic strength is given in table–II.7.
� Ftot
� FL/W
� Fhead-rep
� Felec-inter
� Felectot
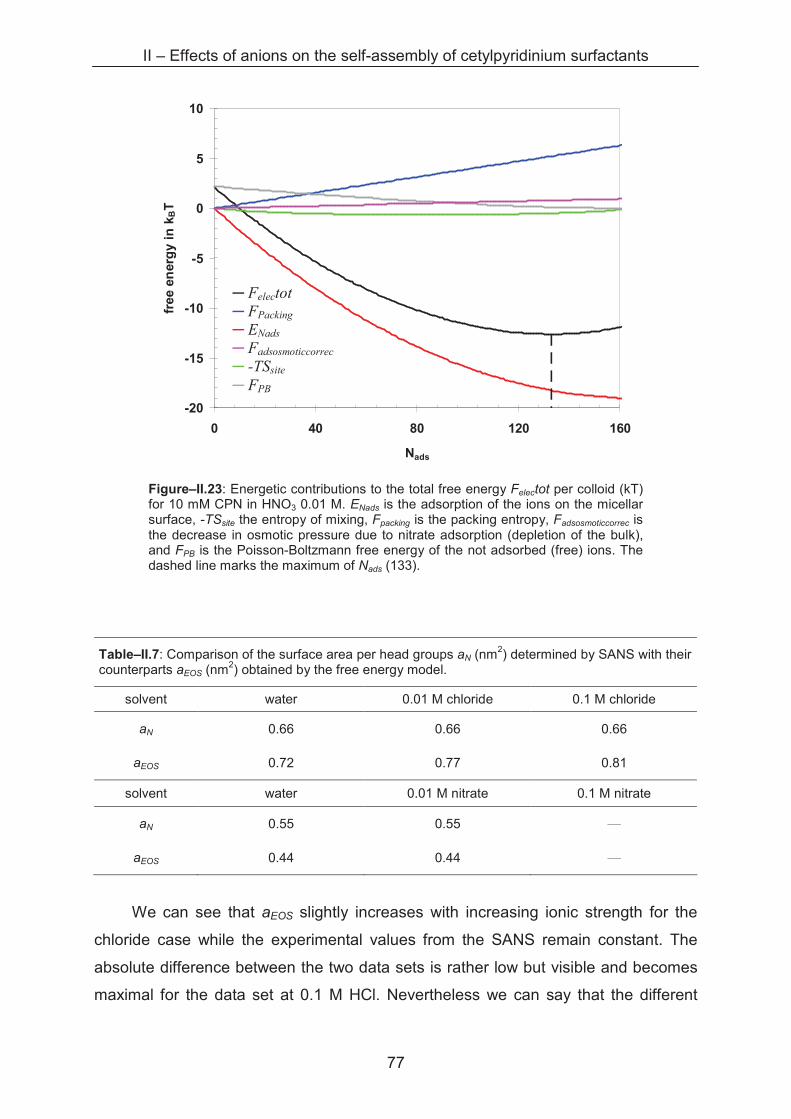
II – Effects of anions on the self-assembly of cetylpyridinium surfactants
77
-20
-15
-10
-5
0
5
10
0 40 80 120 160
Nads
free e
nerg
y i
n k
BT
Figure–II.23: Energetic contributions to the total free energy Felectot per colloid (kT) for 10 mM CPN in HNO3 0.01 M. ENads is the adsorption of the ions on the micellar surface, -TSsite the entropy of mixing, Fpacking is the packing entropy, Fadsosmoticcorrec is the decrease in osmotic pressure due to nitrate adsorption (depletion of the bulk), and FPB is the Poisson-Boltzmann free energy of the not adsorbed (free) ions. The dashed line marks the maximum of Nads (133).
Table–II.7: Comparison of the surface area per head groups aN (nm2) determined by SANS with their counterparts aEOS (nm2) obtained by the free energy model.
solvent water 0.01 M chloride 0.1 M chloride
aN 0.66 0.66 0.66
aEOS 0.72 0.77 0.81
solvent water 0.01 M nitrate 0.1 M nitrate
aN 0.55 0.55 —
aEOS 0.44 0.44 —
We can see that aEOS slightly increases with increasing ionic strength for the
chloride case while the experimental values from the SANS remain constant. The
absolute difference between the two data sets is rather low but visible and becomes
maximal for the data set at 0.1 M HCl. Nevertheless we can say that the different
� Felectot
� FPacking
� ENads
� Fadsosmoticcorrec
� -TSsite
� FPB
II – Effects of anions on the self-assembly of cetylpyridinium surfactants
78
contributions which influence a are satisfyingly taken into account within the model. In
the case for nitrate, the calculated aEOS remains constant at 0.44 nm2, which is close
to the purely sterical head group area of 0.36 nm2. The reason for this small value
comes from the important contribution of the electrical term due to nitrate adsorption.
The absolute value, though, is smaller than the one measured by SANS at 0.55 nm2.
We can say that the model succeeds in discriminating between the two types of
counterions and provides reasonable absolute surface per head group areas. It has
to be mentioned that the pure surfactant in water is modelled with 10-4 M ionic
strength, as we need an ionic strength different from zero as input parameter. The
introduction of a background salt does not change aEOS a lot. It is more interesting to
see the change when chloride is replaced by nitrate as counterion; in this case aEOS
is reduced significantly. At higher ionic strengths, no further change of aEOS is
observed for chloride. The limit of the Poisson-Boltzmann approach is reached, as
the activity of the ions which becomes important in these conditions is not taken into
account.
II – Effects of anions on the self-assembly of cetylpyridinium surfactants
79
2.3. Conclusion
In this contribution we have studied the system cetylpyridinium with counterions
of different hydrophilicity and complexing power. First we determined the micellisation
properties of CPC, CPN and CP2Ox, including the cmc and the Krafft points.
Especially the latter are found to be much higher for CP2Ox than for the two other
surfactants, which show rather similar TK at all bulk acid concentrations. Despite
these differences in solubility, spherical aggregates are found for all three surfactants
up to 0.01 M ionic strength. However, ellipsoidal geometry cannot be ruled out.
Above this concentration, CPN aggregates undergo a sphere-to-rod transition, while
CPC and CP2Ox micelles keep their spherical geometry, which is confirmed
coherently by light-, neutron- and X-ray scattering. Thus, it is clear that the anions
interact differently with the cetylpyridinium micelles. All data obtained for chloride
and nitrate, except the Krafft temperature, go hand in hand with their classification
according to the Hofmeister series and are explained by the stronger interaction of
the chaotropic nitrate anion with the likewise chaotropic pyridinium head group,
leading to a preferential adsorption compared with chloride. Nevertheless, there is a
competition between chloride and nitrate for adsorption, when the two ions are
present in solution. The hydrophilic oxalate is a special case, as it is an anion of a
weak acid and its speciation (H2Ox, HOx-, Ox2-) depends therefore on the pH and the
presence of surfactant. Besides being classified as kosmotropic, it shows a strong
interaction with cetylpyridinium in form of high solubility temperatures, which are
closer to the ones of double-chain surfactants.
The structural parameters obtained for the CPC and CPN micelles by neutron
scattering are introduced in a free energy model, which allows determining the free
energy of the polar head group per aggregate as a function of the different
counterions employed. The data obtained by the model is coherent with the
experimental results for nitrate, but a slight divergence between the theoretical and
experimental data is found for chloride. Nevertheless, the model succeeds in
discriminating between different interaction of chloride and nitrate, respectively,
concerning the micellar surface. The Poisson-Boltzmann approach used is not valid
for multivalent ions, which is why data from oxalate is not used.
II – Effects of anions on the self-assembly of cetylpyridinium surfactants
80
References
[1] HECKMANN, K., SCHWARZ, R., AND STRNAD, J.: "Determination of Krafft point and cmc of hexadecylpyridinium salts in electrolyte solutions". Journal of Colloid and Interface Science 120, 1 (Nov. 1987), 114–117.
[2] PERCHE, T., AUVRAY, X., PETIPAS, C., ANTHORE, R., PEREZ, E., RICO-LATTES, I.,AND LATTES, A.: "Micellization of n-alkylpyridinium halides in formamide tensiometric and small angle neutron scattering study". Langmuir 12, 4 (Jan 1996), 863–871.
[3] ABEZGAUZ, L., KUPERKAR, K., HASSAN, P. A., RAMON, O., BAHADUR, P., AND
DANINO, D.: "Effect of Hofmeister anions on micellization and micellar growth of the surfactant cetylpyridinium chloride". Journal Of Colloid And Interface Science 342, 1 (Feb 1, 2010), 83–92.
[4] VARADE, D., JOSHI, T., ASWAL, V., GOYAL, P., HASSAN, P., AND BAHADUR, P.: "Effect of salt on the micelles of cetyl pyridinium chloride". Colloids and Surfaces A: Physicochemical and Engineering Aspects 259, 1-3 (2005), 95–101.
[5] SEMMLER, A., AND KOHLER, H.: "Surface properties of alkylpyridinium chlorides and the applicability of the pendant drop technique". Journal of Colloid and Interface Science 218, 1 (1999), 137–144.
[6] BHAT, M., DAR, A., AMIN, A., RASHID, P., AND RATHER, G.: "Temperature dependence of transport and equilibrium properties of alkylpyridinium surfactants in aqueous solutions". The Journal of Chemical Thermodynamics 39, 11 (Nov 2007), 1500–1507.
[7] NAKAYAMA, H., AND SHINODA, K.: “Effect of added salts on solubilities and Krafft points of sodium dodecyl sulfate and potassium perfluoro-octanoate". Bulletin of the chemical Society of Japan 40, 8 (1967), 1797–1799.
[8] BOSTROM, M., WILLIAMS, D. R. M., AND NINHAM, B. W.: "Ion specificity of micelles explained by ionic dispersion forces". Langmuir 18, 16 (2002), 6010–6014.
[9] LEONTIDIS, E.: "Hofmeister anion effects on surfactant self-assembly and the formation of mesoporous solids". Current Opinion in Colloid & Interface Science 7, 1-2 (2002), 81–91.
[10] SASAKI, S.: "Metastable crystalline lamella of cetylpyridinium chloride in the Krafft transition". Journal of Physical Chemistry B 111, 10 (Mar 15, 2007), 2473–2476.
[11] SASAKI, S.: "Kinetic studies on hydrated solid transform of cetylpyridinium chloride in aqueous solution". Journal of Physical Chemistry B 113, 25 (Jun 25, 2009), 8545–8551.
II – Effects of anions on the self-assembly of cetylpyridinium surfactants
81
[12] ANACKER, E., AND GHOSE, H.: "Counterions and micelle size. 2. Light scattering by solutions of cetylpyridinium salts". Journal of the American Chemical Society 90, 12 (1968), 3161+.
[13] HEINDL, A., AND KOHLER, H.: "Rod formation of ionic surfactants: a thermodynamic model". Langmuir 12, 10 (May 15, 1996), 2464–2477.
[14] ANACKER, E.: "Light scattering by cetylpyridinium chloride solutions". Journal of Physical Chemistry 62, 1 (1958), 41–45.
[15] DEBYE, P.: "Molecular-weight determination by light scattering". Journal of Physical and Colloid Chemistry 51, 1 (1947), 18–32.
[16] ISRAELACHVILI, J., MITCHELL, D., AND NINHAM, B.: "Theory of self-assembly of hydrocarbon amphiphiles into micelles and bilayers". Journal of the Chemical Society - Faraday Transactions II 72, (1976), 1525–1568.
[17] MADAAN, P., AND TYAGI, V.: "Quaternary pyridinium salts: a review". Journal of Oleo Science 57, 4 (Apr 2008), 197–215.
[18] UNDERWOOD, A. L., AND ANACKER, E. W.: "Counterion lyotropy and micelle formation". Journal of Colloid and Interface Science 117, 1 (1987), 242–250.
[19] EZQUERRA, T., GARCIA-GUTIERREZ, M.-C., NOGALES, A., AND GOMEZ, M.: "Applications of synchrotron light to scattering and diffraction in materials and life sciences". Springer, 2009.
[20] GUINIER, A., AND FOURNET, G.: "Small-angle scattering of X-rays". Wiley-VCH, New York, 1955.
[21] FEDORS, R.: "A method for estimating both solubility parameters and molar volumes of liquids". Polymer Engineering and Science 14, 2 (1974), 147–154.
[22] AMOS, D., MARKELS, J., LYNN, S., AND RADKE, C.: "Osmotic pressure and interparticle interactions in ionic micellar surfactant solutions". The Journal of Physical Chemistry B 102, 15 (Apr 1998), 2739–2753.
[23] ODIJK, T.: "Ionic-strength dependence of the length of charged linear micelles". Journal of Physical Chemistry 93, 10 (May 18, 1989), 3888–3889.
[24] ASWAL, V., GOYAL, P., AMENITSCH, H., AND BERNSTORFF, S.: "Counterion condensation in ionic micelles as studied by a combined use of SANS and SAXS". Pramana-journal Of Physics 63, 2, (Aug 2004), 333–338. Conference on Neutron Scattering, Mumbai, India, Jan 02-04, 2004.
[25] STIGTER, D.: "Micelle formation by ionic surfactants 2. Specificity of head groups, micelle structure". Journal of Physical Chemistry 78, 24 (1974), 2480–2485.
II – Effects of anions on the self-assembly of cetylpyridinium surfactants
82
[26] HAYTER, J.: "A self-consistent theory of dressed micelles". Langmuir 8, 12 (Dec 1992), 2873–2876.
[27] ZEMB, T., BELLONI, L., DUBOIS, M., AROTI, A., AND LEONTIDIS, E.: "Can we use area per surfactant as a quantitative test model of specific ion effects?”. Current Opinion in Colloid & Interface Science 9, 1-2 (2004), 74–80.
[28] LEONTIDIS, E., AROTI, A., BELLONI, L., DUBOIS, M., AND ZEMB, T.: "Effects of monovalent anions of the Hofmeister series on DPPC lipid bilayers part II: Modeling the perpendicular and lateral equation-of-state". Biophysical Journal 93, 5 (Sep 2007), 1591–1607.
[29] FATTAL, D., AND ANDELMAN, D.AND BEN-SHAUL, A.: "The vesicle-micelle transition in mixed lipid-surfactant systems: a molecular model". Langmuir 11, 4 (1995), 1154–1161.
[30] YUET, P., AND BLANKSCHTEIN, D.: "Molecular-thermodynamic modeling of mixed cationic/anionic vesicles". Langmuir 12, 16 (Aug 7, 1996), 3802–3818.
[31] HARRIES, D., PODGORNIK, R., PARSEGIAN, V., MAR-OR, E., AND ANDELMAN, D.: "Ion induced lamellar-lamellar phase transition in charged surfactant systems". Journal of Chemical Physics 124, 22 (Jun 14, 2006).
[32] AKOUM, F., AND PARODI, O.: "Electrostatic interactions inside the aqueous core of spherical reversed micelles (L2 phase)". Journal de Physique 46, 10 (1985), 1675–1681.
[33] JAISWAL P.V., IJERI V.S., SRIVASTAVA, A. K., "Effect of surfactants on the dissociation constants of ascorbic and maleic acids." Colloids and Surfaces B : Biointerfaces, 10 (2005), 45–51.
III – Effects of alkaline cations on self-assembly of cetylpyridinium surfactants
83
Chapter III – Effects of alkaline cations on self-
assembly of cetylpyridinium surfactants
3.1 Introduction
Comprehensive studies have been carried out in order to describe the
aggregation behaviour of cationic surfactants forming micelles in aqueous and non-
aqueous media with different sizes and shapes. After studying the effect of anions on
CP self-assembly we concentrate now on monovalent cations from the alkaline
series, before studying the influence of multicharged metal cations in the next
chapter. As mentioned in the bibliographic introduction, the effect of cations is
expected to be much less pronounced than anions. It is hence the objective of this
study to determine the influence of alkaline cations from Li+ to Cs+ following the
Hofmeister series associated to chloride or nitrate anions on the self-assembly of
cetylpyridinium. Micellisation parameters like the shape of the aggregates,
aggregation numbers NAgg [2] the surface area per head group a and the Krafft
temperatures TK [6] of the cationic cetylpyridinium surfactant have been determined
for its chloride and nitrate forms. The obtained results are interpreted in terms of
counterion and coion adsorption [1, 4, 8, 11].
3.2 Results and Discussion
3.2.1 Krafft temperature measurements
The Krafft temperature TK of cetylpyridinium has been measured in order to
obtain information about the fluidity of the system. For this purpose, aqueous
surfactant solutions have been prepared in water and in 1 M alkaline salts solution
(chloride or nitrate). As before, surfactant concentrations are in all cases 10 mM thus
well above the cmc (about 1 mM [1, 6, 10]). The Krafft temperatures measured in 1 M
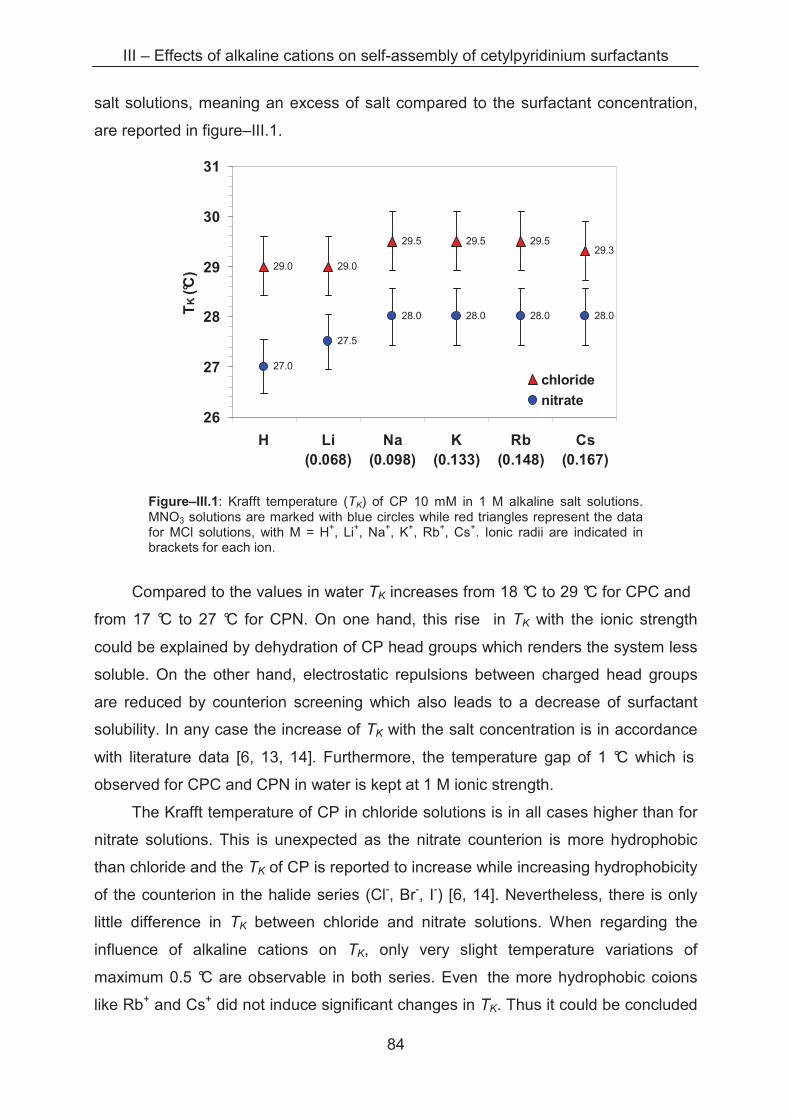
III – Effects of alkaline cations on self-assembly of cetylpyridinium surfactants
84
salt solutions, meaning an excess of salt compared to the surfactant concentration,
are reported in figure–III.1.
29.0 29.0
29.5 29.5 29.529.3
27.0
27.5
28.0 28.0 28.0 28.0
26
27
28
29
30
31
H Li(0.068)
Na(0.098)
K(0.133)
Rb(0.148)
Cs(0.167)
TK (
°C)
chloride
nitrate
Figure–III.1: Krafft temperature (TK) of CP 10 mM in 1 M alkaline salt solutions. MNO3 solutions are marked with blue circles while red triangles represent the data for MCl solutions, with M = H+, Li+, Na+, K+, Rb+, Cs+. Ionic radii are indicated in brackets for each ion.
Compared to the values in water TK increases from 18 °C to 29 °C for CPC and
from 17 °C to 27 °C for CPN. On one hand, this rise in TK with the ionic strength
could be explained by dehydration of CP head groups which renders the system less
soluble. On the other hand, electrostatic repulsions between charged head groups
are reduced by counterion screening which also leads to a decrease of surfactant
solubility. In any case the increase of TK with the salt concentration is in accordance
with literature data [6, 13, 14]. Furthermore, the temperature gap of 1 °C which is
observed for CPC and CPN in water is kept at 1 M ionic strength.
The Krafft temperature of CP in chloride solutions is in all cases higher than for
nitrate solutions. This is unexpected as the nitrate counterion is more hydrophobic
than chloride and the TK of CP is reported to increase while increasing hydrophobicity
of the counterion in the halide series (Cl-, Br-, I-) [6, 14]. Nevertheless, there is only
little difference in TK between chloride and nitrate solutions. When regarding the
influence of alkaline cations on TK, only very slight temperature variations of
maximum 0.5 °C are observable in both series. Even the more hydrophobic coions
like Rb+ and Cs+ did not induce significant changes in TK. Thus it could be concluded
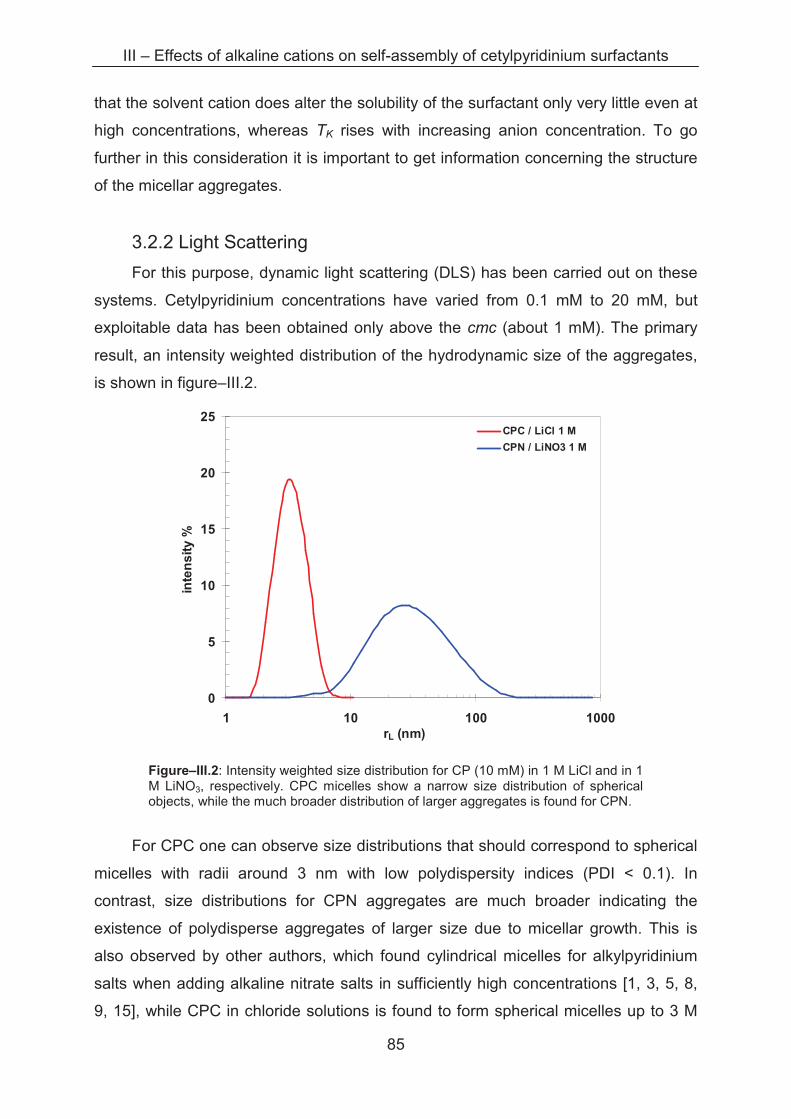
III – Effects of alkaline cations on self-assembly of cetylpyridinium surfactants
85
that the solvent cation does alter the solubility of the surfactant only very little even at
high concentrations, whereas TK rises with increasing anion concentration. To go
further in this consideration it is important to get information concerning the structure
of the micellar aggregates.
3.2.2 Light Scattering
For this purpose, dynamic light scattering (DLS) has been carried out on these
systems. Cetylpyridinium concentrations have varied from 0.1 mM to 20 mM, but
exploitable data has been obtained only above the cmc (about 1 mM). The primary
result, an intensity weighted distribution of the hydrodynamic size of the aggregates,
is shown in figure–III.2.
0
5
10
15
20
25
1 10 100 1000rL (nm)
inte
ns
ity
%
CPC / LiCl 1 M
CPN / LiNO3 1 M
Figure–III.2: Intensity weighted size distribution for CP (10 mM) in 1 M LiCl and in 1 M LiNO3, respectively. CPC micelles show a narrow size distribution of spherical objects, while the much broader distribution of larger aggregates is found for CPN.
For CPC one can observe size distributions that should correspond to spherical
micelles with radii around 3 nm with low polydispersity indices (PDI < 0.1). In
contrast, size distributions for CPN aggregates are much broader indicating the
existence of polydisperse aggregates of larger size due to micellar growth. This is
also observed by other authors, which found cylindrical micelles for alkylpyridinium
salts when adding alkaline nitrate salts in sufficiently high concentrations [1, 3, 5, 8,
9, 15], while CPC in chloride solutions is found to form spherical micelles up to 3 M
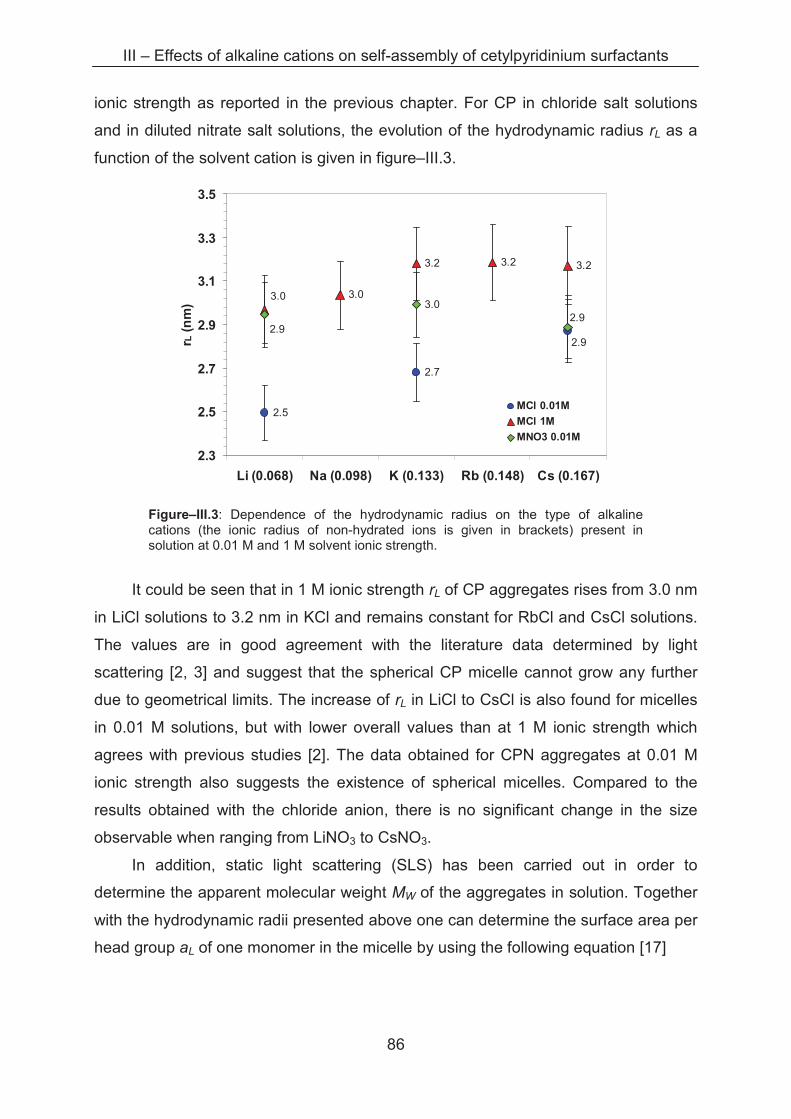
III – Effects of alkaline cations on self-assembly of cetylpyridinium surfactants
86
ionic strength as reported in the previous chapter. For CP in chloride salt solutions
and in diluted nitrate salt solutions, the evolution of the hydrodynamic radius rL as a
function of the solvent cation is given in figure–III.3.
2.5
2.7
3.0
3.2 3.2 3.2
3.0
2.9
3.0
2.92.9
2.3
2.5
2.7
2.9
3.1
3.3
3.5
Li (0.068) Na (0.098) K (0.133) Rb (0.148) Cs (0.167)
r L (
nm
)
MCl 0.01M
MCl 1M
MNO3 0.01M
Figure–III.3: Dependence of the hydrodynamic radius on the type of alkaline cations (the ionic radius of non-hydrated ions is given in brackets) present in solution at 0.01 M and 1 M solvent ionic strength.
It could be seen that in 1 M ionic strength rL of CP aggregates rises from 3.0 nm
in LiCl solutions to 3.2 nm in KCl and remains constant for RbCl and CsCl solutions.
The values are in good agreement with the literature data determined by light
scattering [2, 3] and suggest that the spherical CP micelle cannot grow any further
due to geometrical limits. The increase of rL in LiCl to CsCl is also found for micelles
in 0.01 M solutions, but with lower overall values than at 1 M ionic strength which
agrees with previous studies [2]. The data obtained for CPN aggregates at 0.01 M
ionic strength also suggests the existence of spherical micelles. Compared to the
results obtained with the chloride anion, there is no significant change in the size
observable when ranging from LiNO3 to CsNO3.
In addition, static light scattering (SLS) has been carried out in order to
determine the apparent molecular weight MW of the aggregates in solution. Together
with the hydrodynamic radii presented above one can determine the surface area per
head group aL of one monomer in the micelle by using the following equation [17]
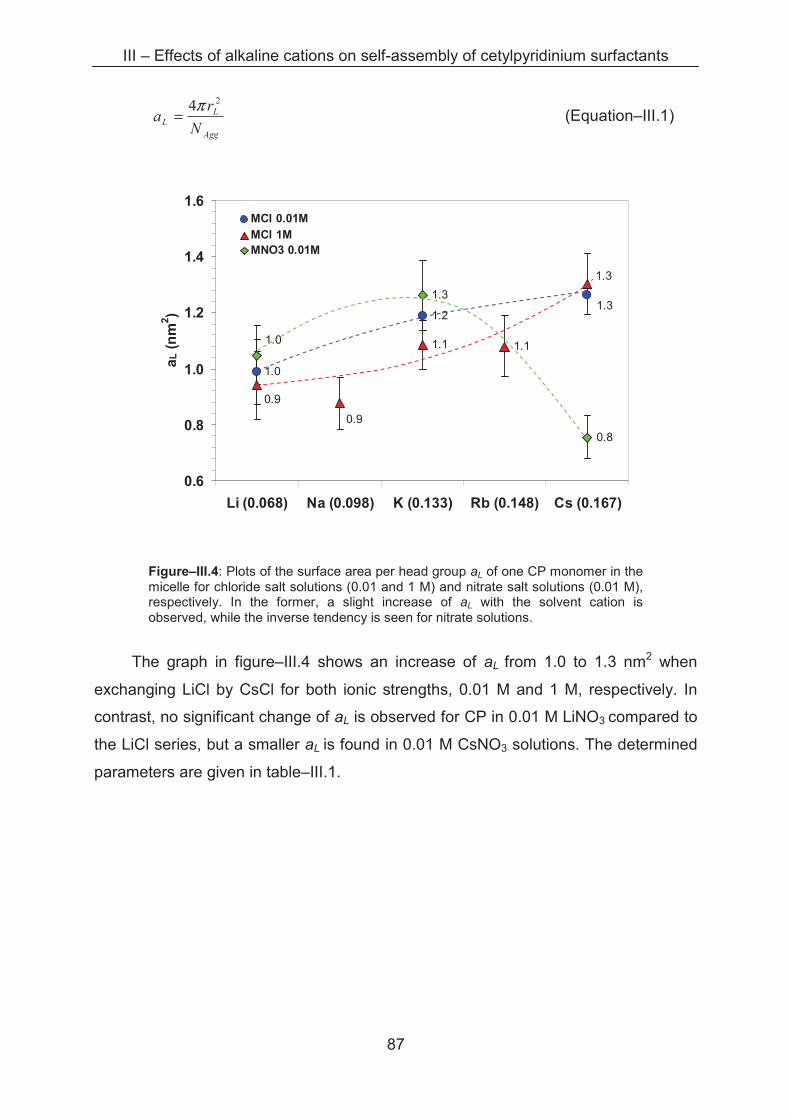
III – Effects of alkaline cations on self-assembly of cetylpyridinium surfactants
87
Agg
L
LN
ra
24π= (Equation–III.1)
1.2
1.1 1.1
1.3
0.8
1.3
1.0
1.3
0.9
0.9
1.0
0.6
0.8
1.0
1.2
1.4
1.6
Li (0.068) Na (0.098) K (0.133) Rb (0.148) Cs (0.167)
aL (
nm
2)
MCl 0.01M
MCl 1MMNO3 0.01M
Figure–III.4: Plots of the surface area per head group aL of one CP monomer in the micelle for chloride salt solutions (0.01 and 1 M) and nitrate salt solutions (0.01 M), respectively. In the former, a slight increase of aL with the solvent cation is observed, while the inverse tendency is seen for nitrate solutions.
The graph in figure–III.4 shows an increase of aL from 1.0 to 1.3 nm2 when
exchanging LiCl by CsCl for both ionic strengths, 0.01 M and 1 M, respectively. In
contrast, no significant change of aL is observed for CP in 0.01 M LiNO3 compared to
the LiCl series, but a smaller aL is found in 0.01 M CsNO3 solutions. The determined
parameters are given in table–III.1.
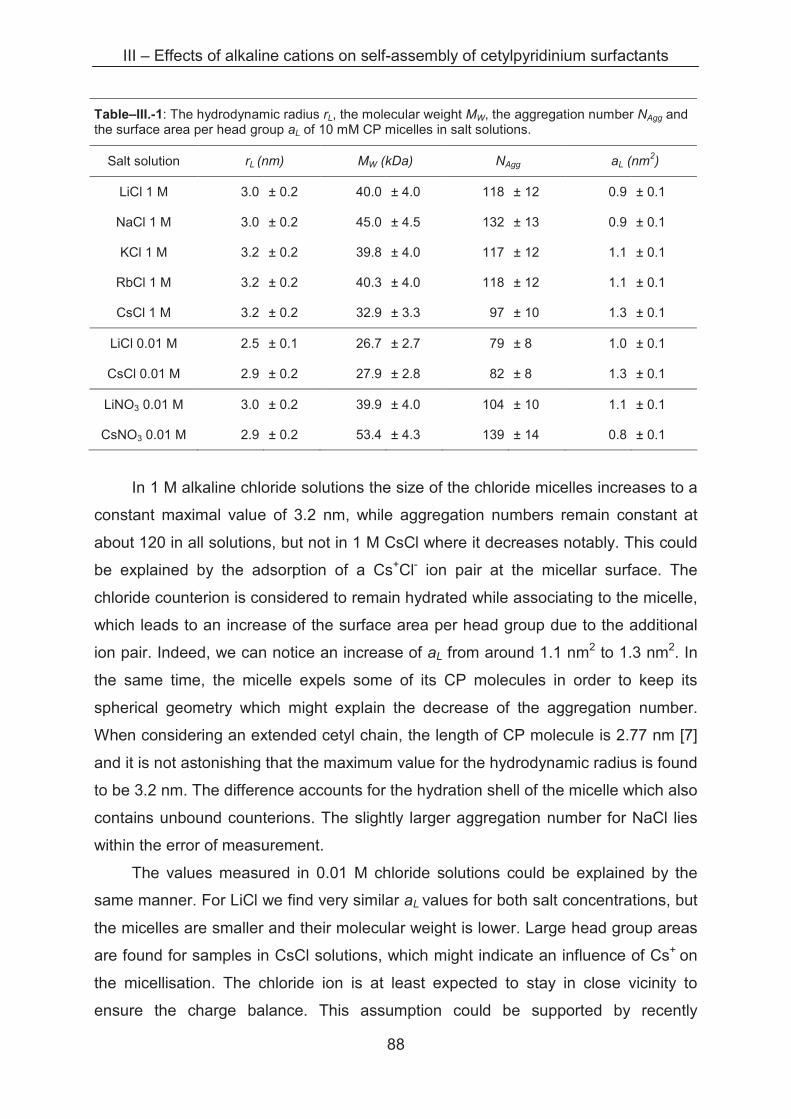
III – Effects of alkaline cations on self-assembly of cetylpyridinium surfactants
88
In 1 M alkaline chloride solutions the size of the chloride micelles increases to a
constant maximal value of 3.2 nm, while aggregation numbers remain constant at
about 120 in all solutions, but not in 1 M CsCl where it decreases notably. This could
be explained by the adsorption of a Cs+Cl- ion pair at the micellar surface. The
chloride counterion is considered to remain hydrated while associating to the micelle,
which leads to an increase of the surface area per head group due to the additional
ion pair. Indeed, we can notice an increase of aL from around 1.1 nm2 to 1.3 nm2. In
the same time, the micelle expels some of its CP molecules in order to keep its
spherical geometry which might explain the decrease of the aggregation number.
When considering an extended cetyl chain, the length of CP molecule is 2.77 nm [7]
and it is not astonishing that the maximum value for the hydrodynamic radius is found
to be 3.2 nm. The difference accounts for the hydration shell of the micelle which also
contains unbound counterions. The slightly larger aggregation number for NaCl lies
within the error of measurement.
The values measured in 0.01 M chloride solutions could be explained by the
same manner. For LiCl we find very similar aL values for both salt concentrations, but
the micelles are smaller and their molecular weight is lower. Large head group areas
are found for samples in CsCl solutions, which might indicate an influence of Cs+ on
the micellisation. The chloride ion is at least expected to stay in close vicinity to
ensure the charge balance. This assumption could be supported by recently
Table–III.-1: The hydrodynamic radius rL, the molecular weight MW, the aggregation number NAgg and the surface area per head group aL of 10 mM CP micelles in salt solutions.
Salt solution rL (nm) MW (kDa) NAgg aL (nm2)
LiCl 1 M 3.0 ± 0.2 40.0 ± 4.0 118 ± 12 0.9 ± 0.1
NaCl 1 M 3.0 ± 0.2 45.0 ± 4.5 132 ± 13 0.9 ± 0.1
KCl 1 M 3.2 ± 0.2 39.8 ± 4.0 117 ± 12 1.1 ± 0.1
RbCl 1 M 3.2 ± 0.2 40.3 ± 4.0 118 ± 12 1.1 ± 0.1
CsCl 1 M 3.2 ± 0.2 32.9 ± 3.3 97 ± 10 1.3 ± 0.1
LiCl 0.01 M 2.5 ± 0.1 26.7 ± 2.7 79 ± 8 1.0 ± 0.1
CsCl 0.01 M 2.9 ± 0.2 27.9 ± 2.8 82 ± 8 1.3 ± 0.1
LiNO3 0.01 M 3.0 ± 0.2 39.9 ± 4.0 104 ± 10 1.1 ± 0.1
CsNO3 0.01 M 2.9 ± 0.2 53.4 ± 4.3 139 ± 14 0.8 ± 0.1
III – Effects of alkaline cations on self-assembly of cetylpyridinium surfactants
89
published data, which state a close approach of cations to cationic interfaces in
micro-emulsions and lamellar phases due to non-electrostatic attractions which are
anion-independent [12]. However, the authors observed this attractive effect for Na+
and Rb+, two cases in which we do not observe a specific interaction, but these
differences might be attributed to the use of a different model system. Furthermore,
one might think of attractive dipole-dipole or cation-π interactions of Cs+ with the
delocalised π-system of the pyridinium head group.
In alkaline nitrate solutions, however, the inverse tendency compared to the
above described findings takes place. While the surface area per head group of
micelles in LiNO3 solutions is close to the data measured for LiCl, the value of 0.76
nm2 for aggregates in CsNO3 is much lower than for aggregates in CsCl. This is
accounted for an adsorption of CsNO3 with the difference to the chloride case that
the more hydrophobic nitrate is more easily dehydrated leading to a decrease of aL.
This mechanism is supported by considering the pyridinium head group as a
chaotropic cation which preferentially interacts with chaotropic counterions in order to
form ion pairs [16]. Together with the high aggregation number of 139 the small head
group area indicates that the spherical micelle in 0.01 M CsNO3 is close to its
geometrical limit [3] and further nitrate adsorption is expected to induce a sphere-to-
rod transition [1]. According to theoretical considerations of Kohler [7] this should
result in a deformation from a perfect sphere, whereas Anacker stated that for similar
aggregation numbers spherical CP micelles can not be excluded [2]. We can
conclude that Cs+ clearly has a slight effect on the aggregation of CP in chloride and
nitrate media, while the other alkaline cations do not seem to influence this process.
3.2.3 Small Angle X-ray Scattering (SAXS)
SAXS has been carried out in order to support data from DLS for the spherical
micelles and to obtain information on samples in 1 M nitrate solutions (for further
details see Annex A.1.5.2). For the analysis we created series at the same ionic
strengths as previously presented (0.01 M and 1 M) at fixed surfactant concentration
of 5 mM. In these conditions the micelles are unlikely to interact which allows to set
the structure factor S(Q) equal to 1 and the sample scattering I(Q) could be written as
follows:
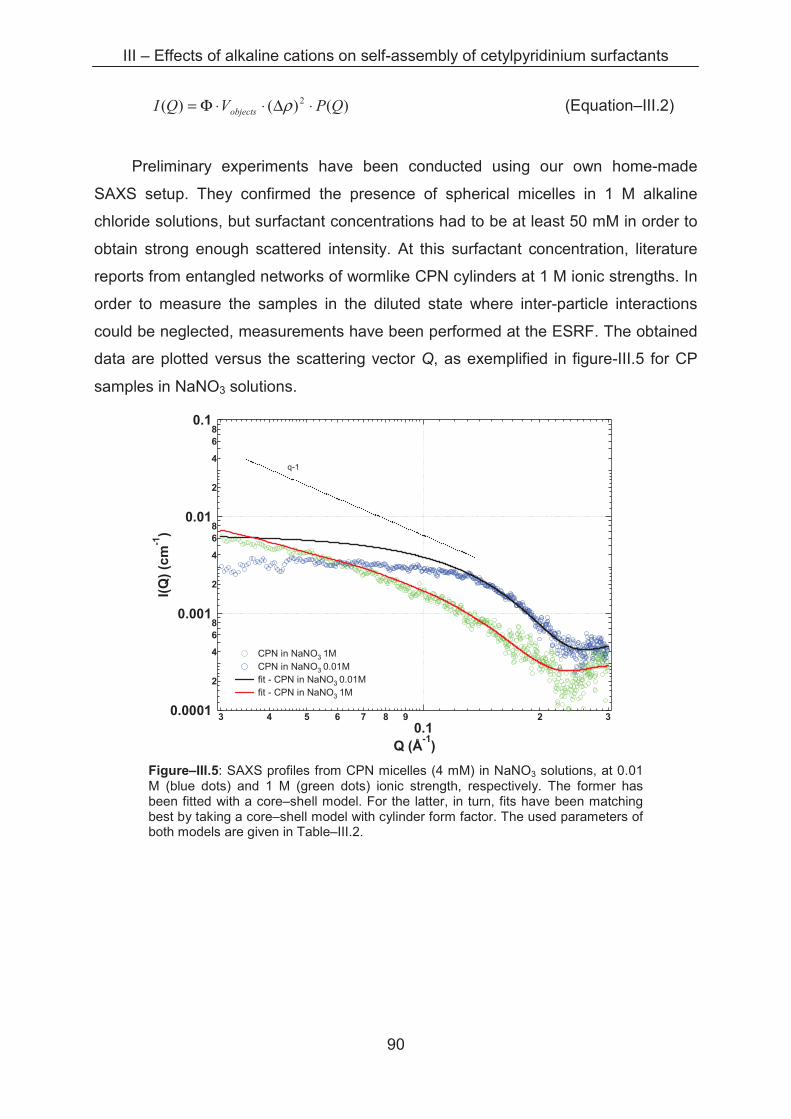
III – Effects of alkaline cations on self-assembly of cetylpyridinium surfactants
90
)()()( 2 QPVQI objects ⋅∆⋅⋅Φ= ρ (Equation–III.2)
Preliminary experiments have been conducted using our own home-made
SAXS setup. They confirmed the presence of spherical micelles in 1 M alkaline
chloride solutions, but surfactant concentrations had to be at least 50 mM in order to
obtain strong enough scattered intensity. At this surfactant concentration, literature
reports from entangled networks of wormlike CPN cylinders at 1 M ionic strengths. In
order to measure the samples in the diluted state where inter-particle interactions
could be neglected, measurements have been performed at the ESRF. The obtained
data are plotted versus the scattering vector Q, as exemplified in figure-III.5 for CP
samples in NaNO3 solutions.
0.0001
2
4
68
0.001
2
4
68
0.01
2
4
68
0.1
I(Q
) (c
m-1
)
3 4 5 6 7 8 90.1
2 3
Q (Å-1
)
q-1
CPN in NaNO3 1M CPN in NaNO3 0.01M fit - CPN in NaNO3 0.01M fit - CPN in NaNO3 1M
Figure–III.5: SAXS profiles from CPN micelles (4 mM) in NaNO3 solutions, at 0.01 M (blue dots) and 1 M (green dots) ionic strength, respectively. The former has been fitted with a core–shell model. For the latter, in turn, fits have been matching best by taking a core–shell model with cylinder form factor. The used parameters of both models are given in Table–III.2.
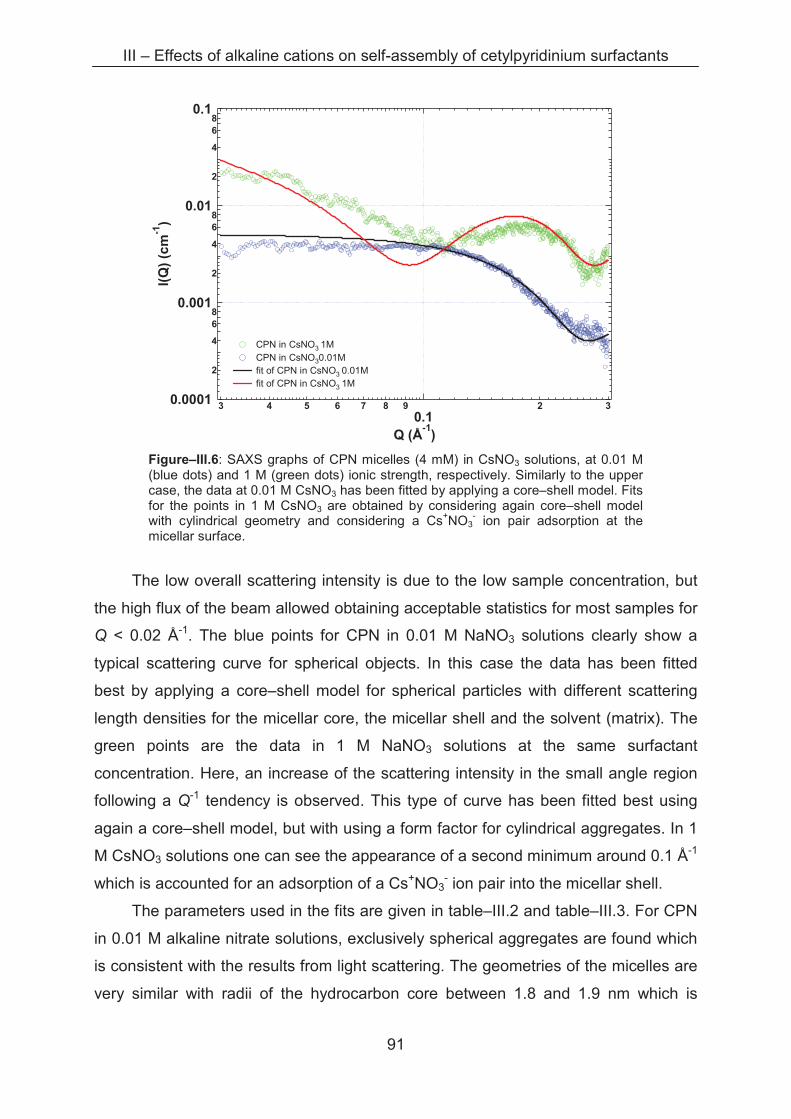
III – Effects of alkaline cations on self-assembly of cetylpyridinium surfactants
91
0.0001
2
4
68
0.001
2
4
68
0.01
2
4
68
0.1
I(Q
) (c
m-1
)
3 4 5 6 7 8 90.1
2 3
Q (Å-1
)
CPN in CsNO3 1M CPN in CsNO30.01M fit of CPN in CsNO3 0.01M fit of CPN in CsNO3 1M
Figure–III.6: SAXS graphs of CPN micelles (4 mM) in CsNO3 solutions, at 0.01 M (blue dots) and 1 M (green dots) ionic strength, respectively. Similarly to the upper case, the data at 0.01 M CsNO3 has been fitted by applying a core–shell model. Fits for the points in 1 M CsNO3 are obtained by considering again core–shell model with cylindrical geometry and considering a Cs+NO3
- ion pair adsorption at the micellar surface.
The low overall scattering intensity is due to the low sample concentration, but
the high flux of the beam allowed obtaining acceptable statistics for most samples for
Q < 0.02 Å-1. The blue points for CPN in 0.01 M NaNO3 solutions clearly show a
typical scattering curve for spherical objects. In this case the data has been fitted
best by applying a core–shell model for spherical particles with different scattering
length densities for the micellar core, the micellar shell and the solvent (matrix). The
green points are the data in 1 M NaNO3 solutions at the same surfactant
concentration. Here, an increase of the scattering intensity in the small angle region
following a Q-1 tendency is observed. This type of curve has been fitted best using
again a core–shell model, but with using a form factor for cylindrical aggregates. In 1
M CsNO3 solutions one can see the appearance of a second minimum around 0.1 Å-1
which is accounted for an adsorption of a Cs+NO3- ion pair into the micellar shell.
The parameters used in the fits are given in table–III.2 and table–III.3. For CPN
in 0.01 M alkaline nitrate solutions, exclusively spherical aggregates are found which
is consistent with the results from light scattering. The geometries of the micelles are
very similar with radii of the hydrocarbon core between 1.8 and 1.9 nm which is
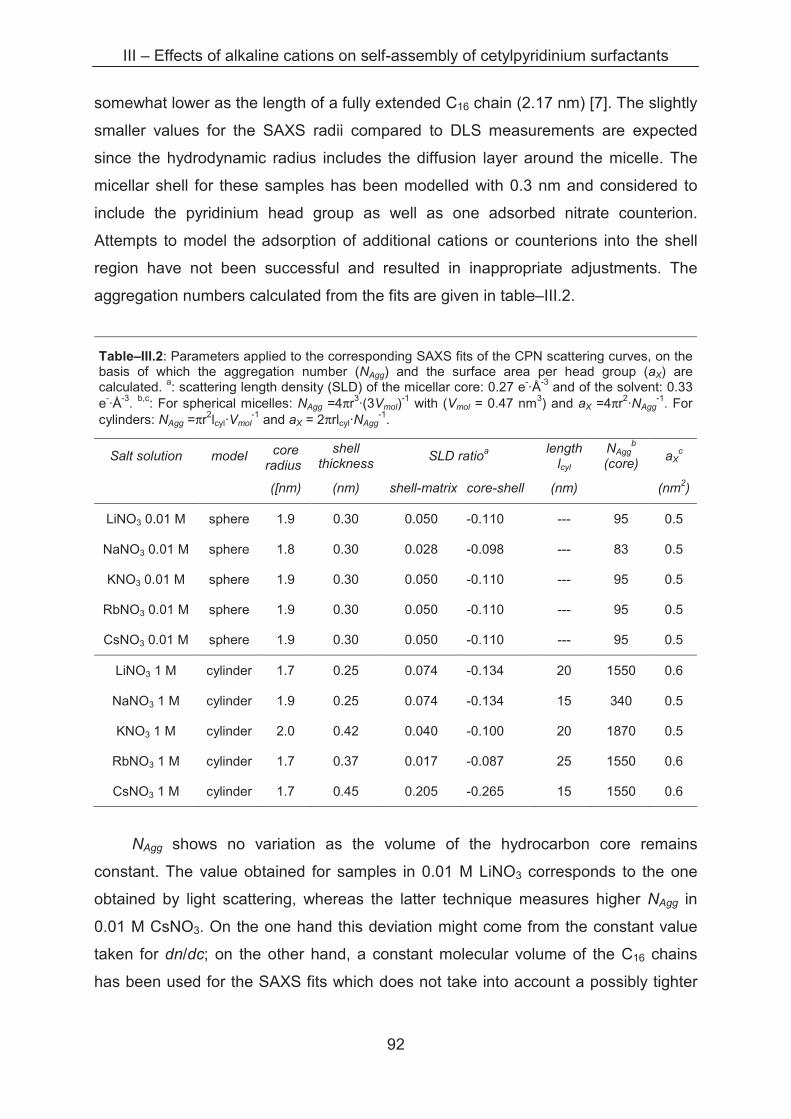
III – Effects of alkaline cations on self-assembly of cetylpyridinium surfactants
92
somewhat lower as the length of a fully extended C16 chain (2.17 nm) [7]. The slightly
smaller values for the SAXS radii compared to DLS measurements are expected
since the hydrodynamic radius includes the diffusion layer around the micelle. The
micellar shell for these samples has been modelled with 0.3 nm and considered to
include the pyridinium head group as well as one adsorbed nitrate counterion.
Attempts to model the adsorption of additional cations or counterions into the shell
region have not been successful and resulted in inappropriate adjustments. The
aggregation numbers calculated from the fits are given in table–III.2.
Table–III.2: Parameters applied to the corresponding SAXS fits of the CPN scattering curves, on the basis of which the aggregation number (NAgg) and the surface area per head group (aX) are calculated. a: scattering length density (SLD) of the micellar core: 0.27 e-·Å-3 and of the solvent: 0.33 e-·Å-3. b,c: For spherical micelles: NAgg =4πr3·(3Vmol)
-1 with (Vmol = 0.47 nm3) and aX =4πr2·NAgg-1. For
cylinders: NAgg =πr2lcyl·Vmol-1 and aX = 2πrlcyl·NAgg
-1.
Salt solution model core radius
shell thickness
SLD ratioa length
lcyl
NAggb
(core) aX
c
([nm) (nm) shell-matrix core-shell (nm) (nm2)
LiNO3 0.01 M sphere 1.9 0.30 0.050 -0.110 --- 95 0.5
NaNO3 0.01 M sphere 1.8 0.30 0.028 -0.098 --- 83 0.5
KNO3 0.01 M sphere 1.9 0.30 0.050 -0.110 --- 95 0.5
RbNO3 0.01 M sphere 1.9 0.30 0.050 -0.110 --- 95 0.5
CsNO3 0.01 M sphere 1.9 0.30 0.050 -0.110 --- 95 0.5
LiNO3 1 M cylinder 1.7 0.25 0.074 -0.134 20 1550 0.6
NaNO3 1 M cylinder 1.9 0.25 0.074 -0.134 15 340 0.5
KNO3 1 M cylinder 2.0 0.42 0.040 -0.100 20 1870 0.5
RbNO3 1 M cylinder 1.7 0.37 0.017 -0.087 25 1550 0.6
CsNO3 1 M cylinder 1.7 0.45 0.205 -0.265 15 1550 0.6
NAgg shows no variation as the volume of the hydrocarbon core remains
constant. The value obtained for samples in 0.01 M LiNO3 corresponds to the one
obtained by light scattering, whereas the latter technique measures higher NAgg in
0.01 M CsNO3. On the one hand this deviation might come from the constant value
taken for dn/dc; on the other hand, a constant molecular volume of the C16 chains
has been used for the SAXS fits which does not take into account a possibly tighter
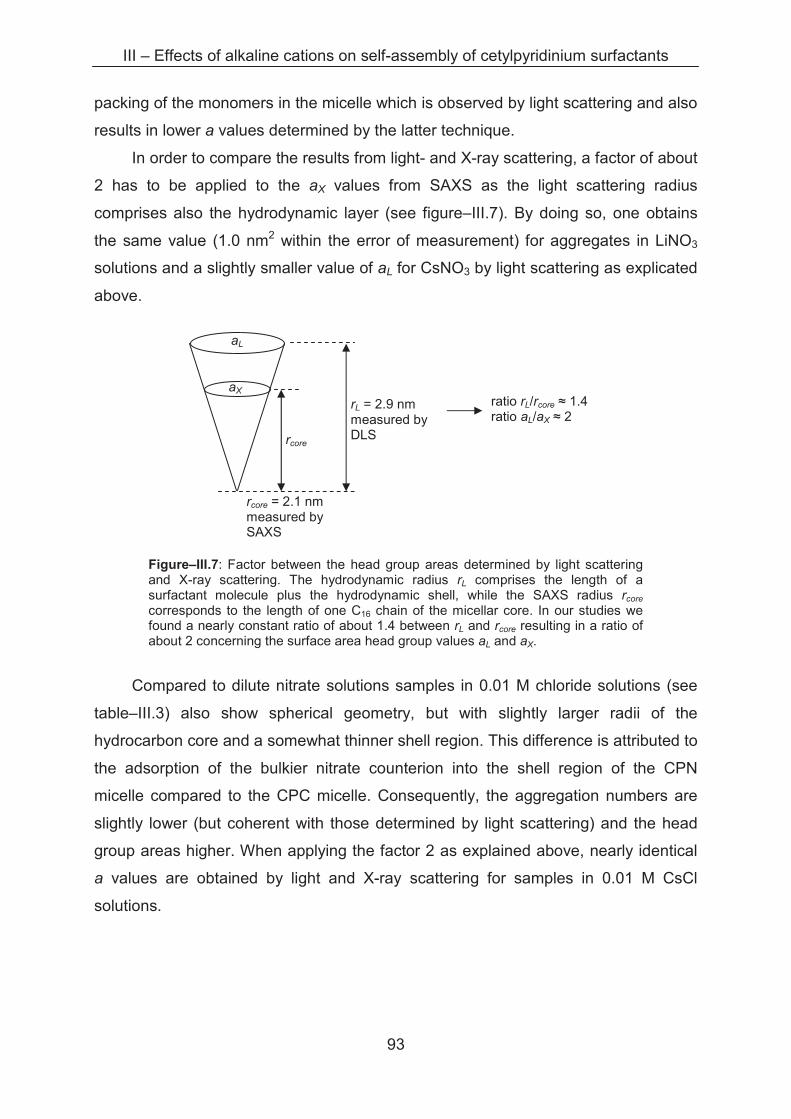
III – Effects of alkaline cations on self-assembly of cetylpyridinium surfactants
93
packing of the monomers in the micelle which is observed by light scattering and also
results in lower a values determined by the latter technique.
In order to compare the results from light- and X-ray scattering, a factor of about
2 has to be applied to the aX values from SAXS as the light scattering radius
comprises also the hydrodynamic layer (see figure–III.7). By doing so, one obtains
the same value (1.0 nm2 within the error of measurement) for aggregates in LiNO3
solutions and a slightly smaller value of aL for CsNO3 by light scattering as explicated
above.
Figure–III.7: Factor between the head group areas determined by light scattering and X-ray scattering. The hydrodynamic radius rL comprises the length of a surfactant molecule plus the hydrodynamic shell, while the SAXS radius rcore
corresponds to the length of one C16 chain of the micellar core. In our studies we found a nearly constant ratio of about 1.4 between rL and rcore resulting in a ratio of about 2 concerning the surface area head group values aL and aX.
Compared to dilute nitrate solutions samples in 0.01 M chloride solutions (see
table–III.3) also show spherical geometry, but with slightly larger radii of the
hydrocarbon core and a somewhat thinner shell region. This difference is attributed to
the adsorption of the bulkier nitrate counterion into the shell region of the CPN
micelle compared to the CPC micelle. Consequently, the aggregation numbers are
slightly lower (but coherent with those determined by light scattering) and the head
group areas higher. When applying the factor 2 as explained above, nearly identical
a values are obtained by light and X-ray scattering for samples in 0.01 M CsCl
solutions.
aX
aL
rcore = 2.1 nm measured by SAXS
rL = 2.9 nm measured by DLS
ratio rL/rcore � 1.4 ratio aL/aX � 2
rcore
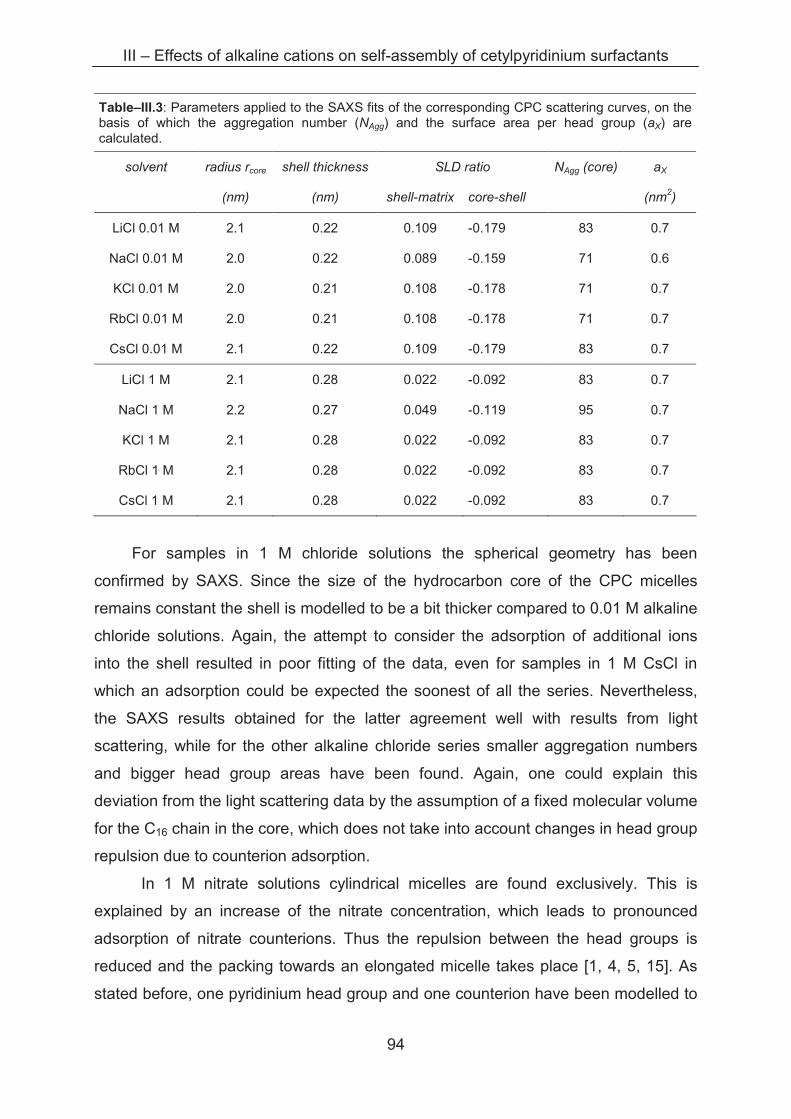
III – Effects of alkaline cations on self-assembly of cetylpyridinium surfactants
94
Table–III.3: Parameters applied to the SAXS fits of the corresponding CPC scattering curves, on the basis of which the aggregation number (NAgg) and the surface area per head group (aX) are calculated.
solvent radius rcore shell thickness SLD ratio NAgg (core) aX
(nm) (nm) shell-matrix core-shell (nm2)
LiCl 0.01 M 2.1 0.22 0.109 -0.179 83 0.7
NaCl 0.01 M 2.0 0.22 0.089 -0.159 71 0.6
KCl 0.01 M 2.0 0.21 0.108 -0.178 71 0.7
RbCl 0.01 M 2.0 0.21 0.108 -0.178 71 0.7
CsCl 0.01 M 2.1 0.22 0.109 -0.179 83 0.7
LiCl 1 M 2.1 0.28 0.022 -0.092 83 0.7
NaCl 1 M 2.2 0.27 0.049 -0.119 95 0.7
KCl 1 M 2.1 0.28 0.022 -0.092 83 0.7
RbCl 1 M 2.1 0.28 0.022 -0.092 83 0.7
CsCl 1 M 2.1 0.28 0.022 -0.092 83 0.7
For samples in 1 M chloride solutions the spherical geometry has been
confirmed by SAXS. Since the size of the hydrocarbon core of the CPC micelles
remains constant the shell is modelled to be a bit thicker compared to 0.01 M alkaline
chloride solutions. Again, the attempt to consider the adsorption of additional ions
into the shell resulted in poor fitting of the data, even for samples in 1 M CsCl in
which an adsorption could be expected the soonest of all the series. Nevertheless,
the SAXS results obtained for the latter agreement well with results from light
scattering, while for the other alkaline chloride series smaller aggregation numbers
and bigger head group areas have been found. Again, one could explain this
deviation from the light scattering data by the assumption of a fixed molecular volume
for the C16 chain in the core, which does not take into account changes in head group
repulsion due to counterion adsorption.
In 1 M nitrate solutions cylindrical micelles are found exclusively. This is
explained by an increase of the nitrate concentration, which leads to pronounced
adsorption of nitrate counterions. Thus the repulsion between the head groups is
reduced and the packing towards an elongated micelle takes place [1, 4, 5, 15]. As
stated before, one pyridinium head group and one counterion have been modelled to
III – Effects of alkaline cations on self-assembly of cetylpyridinium surfactants
95
be in the shell region for all samples. Thus, no strong variation of the SLD ratios for
both shell-matrix and core–shell has been observed. Only one exception of these
results has been discovered for the case of CPN in concentrated CsNO3 solutions.
Here, a second minimum appears in the scattering curve at Q = 0.1 Å-1. This
minimum has been fitted best considering the additional adsorption of a Cs+NO3+ ion
pair into the micellar shell which has been modelled to be 0.45 nm thick. Interestingly,
this adsorption is not seen for the other 1 M alkaline nitrate solutions where ion pairs
might exist as well, but do not adsorb onto the micellar surface. An indication of such
a tendency can be found when considering the evolution of the shell thickness used
to fit the cylinders in 1 M nitrate solutions, which is increasing from Li+ to Cs+, but only
in the latter case the adsorption takes place.
Furthermore, apart from this ion pair adsorption in the caesium nitrate case,
the geometries of the cylinders are rather similar with smaller core radii of 1.7 nm
than for the spherical micelles, corresponding to an 80 % extended C16 chain. The
aggregation number obtained from the SAXS fits is varying with the cylinder length
applied to the fits. Its absolute value cannot be determined precisely because the Q
region in the SAXS scattering curves is not sufficiently low to see the absolute length
of the cylinders.
It could be summed up that at 0.01 M ionic strength only slight changes
concerning the micellar geometries have been observed for the anions Cl- and NO3-,
respectively, and for the solvent cations introduced. The total ion concentration is
apparently too low to induce ion-specific effects like adsorption and the micellar radii
determined are very comparable. This argument is also valid for aggregates in 1 M
alkaline chloride solutions. A sphere-to-rod transition does not take place. In contrast,
cylindrical micelles of similar geometries have been found in 1 M nitrate solutions.
Furthermore, in the CPN / 1 M CsNO3 sample the adsorption of a Cs+NO3- ion pair
onto the micellar interface has been evidenced.
III – Effects of alkaline cations on self-assembly of cetylpyridinium surfactants
96
3.3. Conclusion
In this chapter we have studied the effect of the solvent cations following the
Hofmeister series on the micellisation properties of cetylpyridinium chloride and
nitrate, respectively. Special attention has been paid to create solutions containing
only one type of counterion, chloride or nitrate, and to avoid the undesirable
interference of any other counterion. Dynamic and static light scattering, as well as X-
ray scattering have been carried out to determine micellar morphology. We have
shown that alkaline chloride salts affect the micellisation only slightly and spherical
micelles have been found in all cases. In alkaline nitrate salt solutions, CP forms
cylinders at sufficiently high ionic strength (> 0.01 M) which is interpreted in terms of
counterion adsorption of the more hydrophobic nitrate ion. This leads to a reduced
surface area per head group and results in a denser packing towards cylindrical
geometry. One interpretation of the fits obtained in CsNO3 media is the adsorption of
a Cs+NO3- ion pair on the micellar surface. With the exception of Cs, the alkaline
cations have only a weak effect on micellisation parameters. Nevertheless, alkaline
cations should not be neglected when studying micellisation of cationic surfactants,
even if the effects of anionic counterions remain more pronounced.
After having studied the influence of monovalent cations on the structural and
micellisation parameters of cetylpyridinium surfactants, we will consider the effect of
chloride and nitrate salts of multivalent metal cations on the self-assembly of CP in
the following chapter
III – Effects of alkaline cations on self-assembly of cetylpyridinium surfactants
97
References
[1] ABEZGAUZ, L., KUPERKAR, K., HASSAN, P. A., RAMON, O., BAHADUR, P., AND
DANINO, D.: "Effect of Hofmeister anions on micellization and micellar growth of the surfactant cetylpyridinium chloride". Journal Of Colloid And Interface Science 342, 1 (Feb 1, 2010), 83–92.
[2] ANACKER, E.: "Light scattering by cetylpyridinium chloride solutions". Journal of Physical Chemistry 62, 1 (1958), 41–45.
[3] ANACKER, E., AND GHOSE, H.: "Counterions and micelle size. 2. Light scattering by solutions of cetylpyridinium salts". Journal of the American Chemical Society 90, 12 (1968), 3161+.
[4] ASWAL, V., AND GOYAL, P.: "Dependence of the size of micelles on the salt effect in ionic micellar solutions". Chemical Physics Letters 364, 1-2 (Sep 23, 2002), 44–50.
[5] BIJMA, K., RANK, E., AND ENGBERTS, J.: "Effect of counterion structure on micellar growth of alkylpyridinium surfactants in aqueous solution". Journal of Colloid and Interface Science 205, 2 (1998), 245 – 256.
[6] HECKMANN, K., SCHWARZ, R., AND STRNAD, J.: "Determination of Krafft point and cmc of hexadecylpyridinium salts in electrolyte solutions". Journal of Colloid and Interface Science 120, 1 (Nov. 1987), 114–117.
[7] HEINDL, A., AND KOHLER, H.: "Rod formation of ionic surfactants: a thermodynamic model". Langmuir 12, 10 (May 15, 1996), 2464–2477.
[8] IKEDA, S., AND FUJIO, K.: "The salt-induced sphere-rod transition of micelles of dodecylpyridinium iodide in aqueous NaI solutions". Colloid And Polymer Science 270, 10 (Oct 1992), 1009–1017.
[9] KUMAR, S., BANSAL, D., AND KABIR-UD-DIN.: "Micellar growth in the presence of salts and aromatic hydrocarbons: influence of the nature of the salt". Langmuir 15, 15 (July 1999), 4960–4965.
[10] MANDAL, A., AND NAIR, B.: "Cyclic voltammetric technique for the determination of the critical micelle concentration of surfactants, self-diffusion coefficient of micelles, and partition coefficient of an electrochemical probe". The Journal of Physical Chemistry 95, 22 (Oct 1991), 9008–9013.
[11] MUKERJEE, P., AND RAY, A.: "The specifity of counterion adsorption to micelles of dodecylpyridinium iodide and their critical concentrations". Jounal of Physical Chemistry 70 (1966), 2150–2157.
[12] MURGIA, S., PORTESANI, F., NINHAM, B. W., AND MONDUZZI, M.: "Interaction of sodium ions with cationic surfactant interfaces". Chemistry - A European Journal 12, 30 (Oct 16, 2006), 7889–7898.
III – Effects of alkaline cations on self-assembly of cetylpyridinium surfactants
98
[13] NAKAYAMA, H., AND SHINODA, K.: “Effect of added salts on solubilities and Krafft points of sodium dodecyl sulfate and potassium perfluoro-octanoate". Bulletin of the chemical Society of Japan 40, 8 (1967), 1797–1799.
[14] PERCHE, T., AUVRAY, X., PETIPAS, C., ANTHORE, R., PEREZ, E., RICO-LATTES, I.,AND LATTES, A.: "Micellization of n-alkylpyridinium halides in formamide tensiometric and small angle neutron scattering study". Langmuir 12, 4 (Jan 1996), 863–871.
[15] PORTE, G., AND APPELL, J.: "Growth and size distributions of cetylpyridinium bromide micelles in high ionic strength aqueous solutions". The Journal of Physical Chemistry 85, 17 (Aug 1981), 2511–2519.
[16] VLACHY, N., JAGODA-CWIKLIK, B., VÁCHA, R., TOURAUD, D., JUNGWIRTH, P., AND
KUNZ, W.: "Hofmeister series and specific interactions of charged headgroups with aqueous ions". Advances in Colloid and Interface Science 146, 1-2 (2009), 42–47.
[17] ZEMB, T., BELLONI, L., DUBOIS, M., AROTI, A., AND LEONTIDIS, E.: "Can we use area per surfactant as a quantitative test model of specific ion effects?". Current Opinion in Colloid & Interface Science 9, 1-2 (2004), 74–80.
IV – Precipitation of metal cations by cetylpyridinium surfactants
99
Chapter IV – Precipitation of metal cations by
cetylpyridinium surfactants
4.1 Introduction
In the domain of separation chemistry for nuclear industry, hydrometallurgical
processes (liquid–liquid extractions) are used to recycle spent nuclear fuel. It was
shown recently, that the self-assembly of selective extractants seems to play a major
role in the extraction process [1, 2, 3, 4, 5]. In the framework of the development of
sustainable recycling techniques, less complex processes are under investigation
and separation by precipitation is one of them. This technique was studied in the
early 80’s by Heckmann et al. [6, 7]. Indeed, he proposed a simple way to selectively
separate actinides by precipitation using cationic surfactants [8, 9]. However
fundamental questions arise concerning his observations and it is the aim of this
chapter to try to document theses questions and thus to provide a better
understanding of this precipitation technique.
In the previous chapter, we analysed micellisation parameters of cetylpyridinium
surfactants in salt solutions in the presence of monovalent cations. Now we will
consider divalent (Cu2+, Zn2+ and UO22+), trivalent (Nd3+, Eu3+, Fe3+) and tetravalent
(Th4+) metal ions in their chloride and nitrate form, respectively. The influence of the
ionic strength and the role of the different anions (chloride, nitrate) on the separation
process will be investigated, as well as the structure of the cetylpyridinium
aggregates in the presence of metals in solution and in the precipitate. Data on metal
extraction efficiency and corresponding stoichiometry with CP under varying
conditions will be discussed.
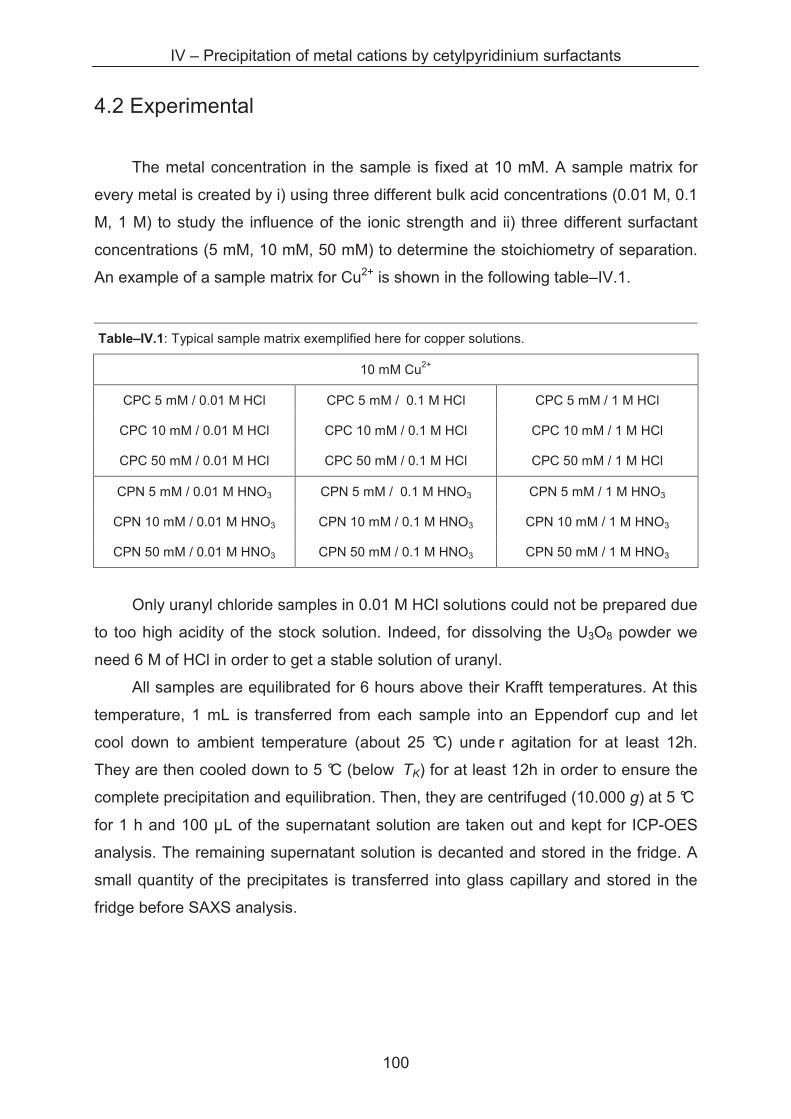
IV – Precipitation of metal cations by cetylpyridinium surfactants
100
4.2 Experimental
The metal concentration in the sample is fixed at 10 mM. A sample matrix for
every metal is created by i) using three different bulk acid concentrations (0.01 M, 0.1
M, 1 M) to study the influence of the ionic strength and ii) three different surfactant
concentrations (5 mM, 10 mM, 50 mM) to determine the stoichiometry of separation.
An example of a sample matrix for Cu2+ is shown in the following table–IV.1.
Table–IV.1: Typical sample matrix exemplified here for copper solutions.
10 mM Cu2+
CPC 5 mM / 0.01 M HCl CPC 5 mM / 0.1 M HCl CPC 5 mM / 1 M HCl
CPC 10 mM / 0.01 M HCl CPC 10 mM / 0.1 M HCl CPC 10 mM / 1 M HCl
CPC 50 mM / 0.01 M HCl CPC 50 mM / 0.1 M HCl CPC 50 mM / 1 M HCl
CPN 5 mM / 0.01 M HNO3 CPN 5 mM / 0.1 M HNO3 CPN 5 mM / 1 M HNO3
CPN 10 mM / 0.01 M HNO3 CPN 10 mM / 0.1 M HNO3 CPN 10 mM / 1 M HNO3
CPN 50 mM / 0.01 M HNO3 CPN 50 mM / 0.1 M HNO3 CPN 50 mM / 1 M HNO3
Only uranyl chloride samples in 0.01 M HCl solutions could not be prepared due
to too high acidity of the stock solution. Indeed, for dissolving the U3O8 powder we
need 6 M of HCl in order to get a stable solution of uranyl.
All samples are equilibrated for 6 hours above their Krafft temperatures. At this
temperature, 1 mL is transferred from each sample into an Eppendorf cup and let
cool down to ambient temperature (about 25 °C) unde r agitation for at least 12h.
They are then cooled down to 5 °C (below TK) for at least 12h in order to ensure the
complete precipitation and equilibration. Then, they are centrifuged (10.000 g) at 5 °C
for 1 h and 100 µL of the supernatant solution are taken out and kept for ICP-OES
analysis. The remaining supernatant solution is decanted and stored in the fridge. A
small quantity of the precipitates is transferred into glass capillary and stored in the
fridge before SAXS analysis.
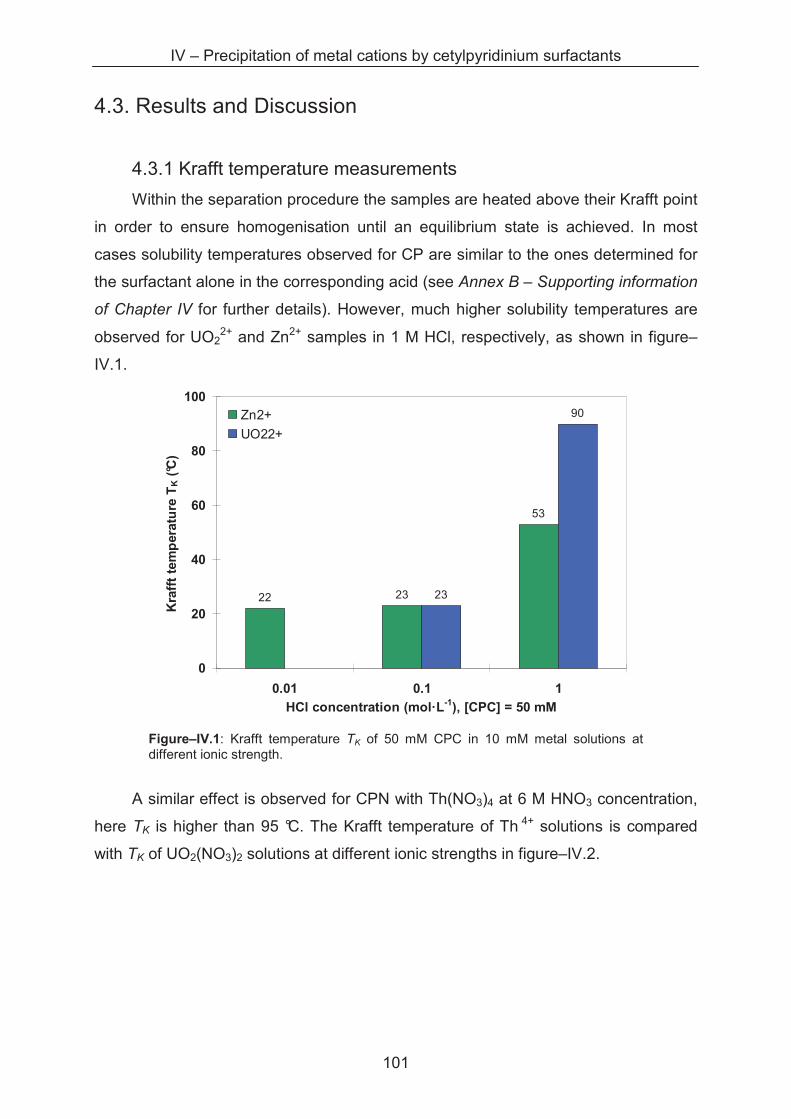
IV – Precipitation of metal cations by cetylpyridinium surfactants
101
4.3. Results and Discussion
4.3.1 Krafft temperature measurements
Within the separation procedure the samples are heated above their Krafft point
in order to ensure homogenisation until an equilibrium state is achieved. In most
cases solubility temperatures observed for CP are similar to the ones determined for
the surfactant alone in the corresponding acid (see Annex B – Supporting information
of Chapter IV for further details). However, much higher solubility temperatures are
observed for UO22+ and Zn2+ samples in 1 M HCl, respectively, as shown in figure–
IV.1.
22 23
53
23
90
0
20
40
60
80
100
0.01 0.1 1
HCl concentration (mol·L-1), [CPC] = 50 mM
Kra
fft
tem
per
atu
re T
K (
°C)
Zn2+
UO22+
Figure–IV.1: Krafft temperature TK of 50 mM CPC in 10 mM metal solutions at different ionic strength.
A similar effect is observed for CPN with Th(NO3)4 at 6 M HNO3 concentration,
here TK is higher than 95 °C. The Krafft temperature of Th 4+ solutions is compared
with TK of UO2(NO3)2 solutions at different ionic strengths in figure–IV.2.
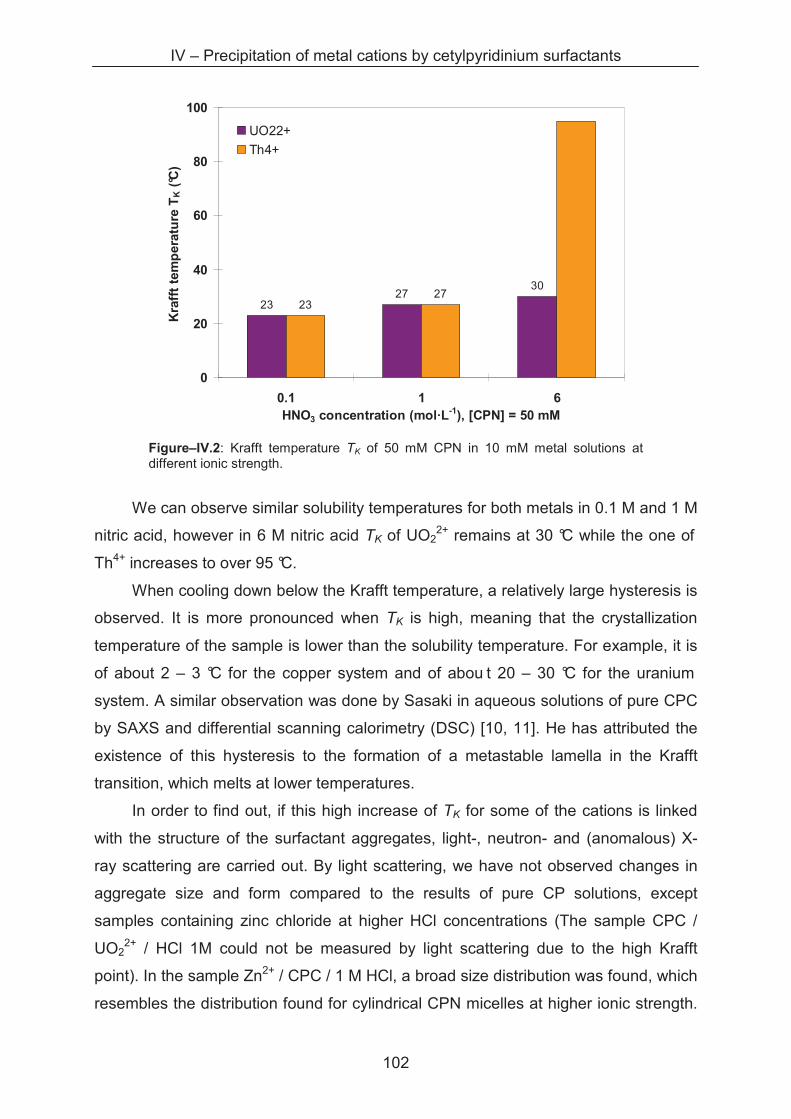
IV – Precipitation of metal cations by cetylpyridinium surfactants
102
2327
30
2327
0
20
40
60
80
100
0.1 1 6HNO3 concentration (mol·L-1), [CPN] = 50 mM
Kra
fft
tem
pera
ture
TK (
°C)
UO22+
Th4+
Figure–IV.2: Krafft temperature TK of 50 mM CPN in 10 mM metal solutions at different ionic strength.
We can observe similar solubility temperatures for both metals in 0.1 M and 1 M
nitric acid, however in 6 M nitric acid TK of UO22+ remains at 30 °C while the one of
Th4+ increases to over 95 °C.
When cooling down below the Krafft temperature, a relatively large hysteresis is
observed. It is more pronounced when TK is high, meaning that the crystallization
temperature of the sample is lower than the solubility temperature. For example, it is
of about 2 – 3 °C for the copper system and of abou t 20 – 30 °C for the uranium
system. A similar observation was done by Sasaki in aqueous solutions of pure CPC
by SAXS and differential scanning calorimetry (DSC) [10, 11]. He has attributed the
existence of this hysteresis to the formation of a metastable lamella in the Krafft
transition, which melts at lower temperatures.
In order to find out, if this high increase of TK for some of the cations is linked
with the structure of the surfactant aggregates, light-, neutron- and (anomalous) X-
ray scattering are carried out. By light scattering, we have not observed changes in
aggregate size and form compared to the results of pure CP solutions, except
samples containing zinc chloride at higher HCl concentrations (The sample CPC /
UO22+ / HCl 1M could not be measured by light scattering due to the high Krafft
point). In the sample Zn2+ / CPC / 1 M HCl, a broad size distribution was found, which
resembles the distribution found for cylindrical CPN micelles at higher ionic strength.
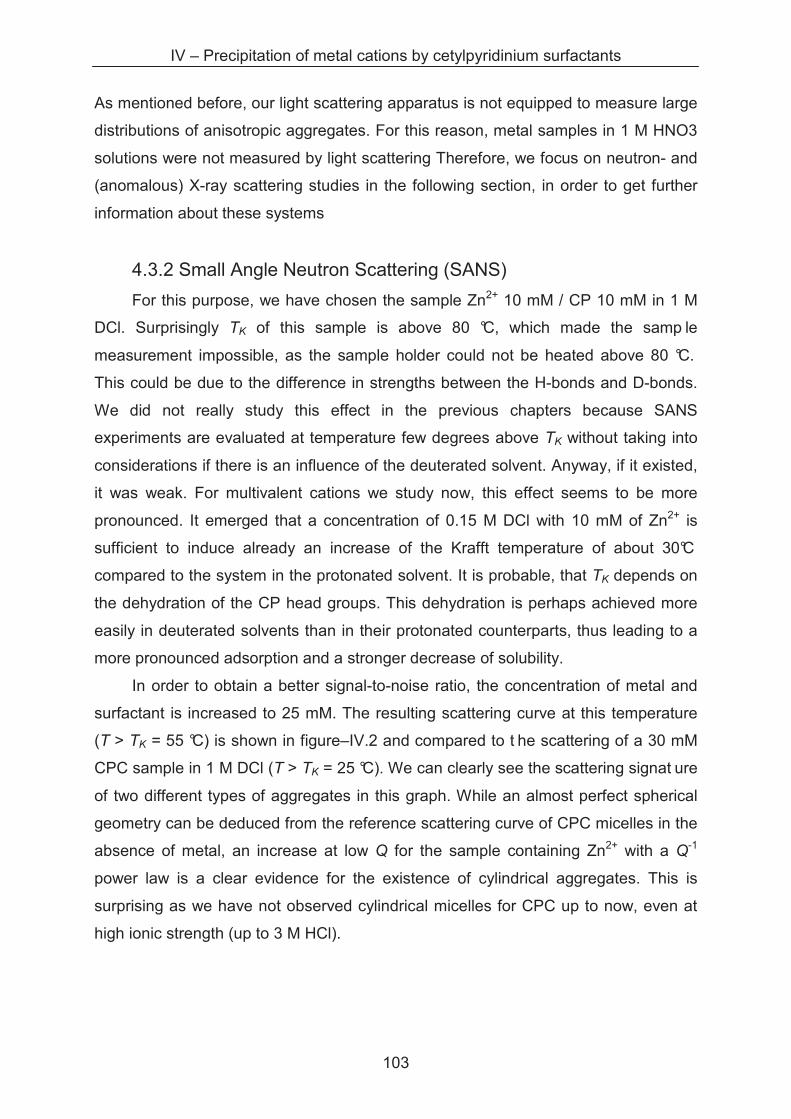
IV – Precipitation of metal cations by cetylpyridinium surfactants
103
As mentioned before, our light scattering apparatus is not equipped to measure large
distributions of anisotropic aggregates. For this reason, metal samples in 1 M HNO3
solutions were not measured by light scattering Therefore, we focus on neutron- and
(anomalous) X-ray scattering studies in the following section, in order to get further
information about these systems
4.3.2 Small Angle Neutron Scattering (SANS)
For this purpose, we have chosen the sample Zn2+ 10 mM / CP 10 mM in 1 M
DCl. Surprisingly TK of this sample is above 80 °C, which made the samp le
measurement impossible, as the sample holder could not be heated above 80 °C.
This could be due to the difference in strengths between the H-bonds and D-bonds.
We did not really study this effect in the previous chapters because SANS
experiments are evaluated at temperature few degrees above TK without taking into
considerations if there is an influence of the deuterated solvent. Anyway, if it existed,
it was weak. For multivalent cations we study now, this effect seems to be more
pronounced. It emerged that a concentration of 0.15 M DCl with 10 mM of Zn2+ is
sufficient to induce already an increase of the Krafft temperature of about 30°C
compared to the system in the protonated solvent. It is probable, that TK depends on
the dehydration of the CP head groups. This dehydration is perhaps achieved more
easily in deuterated solvents than in their protonated counterparts, thus leading to a
more pronounced adsorption and a stronger decrease of solubility.
In order to obtain a better signal-to-noise ratio, the concentration of metal and
surfactant is increased to 25 mM. The resulting scattering curve at this temperature
(T > TK = 55 °C) is shown in figure–IV.2 and compared to t he scattering of a 30 mM
CPC sample in 1 M DCl (T > TK = 25 °C). We can clearly see the scattering signat ure
of two different types of aggregates in this graph. While an almost perfect spherical
geometry can be deduced from the reference scattering curve of CPC micelles in the
absence of metal, an increase at low Q for the sample containing Zn2+ with a Q-1
power law is a clear evidence for the existence of cylindrical aggregates. This is
surprising as we have not observed cylindrical micelles for CPC up to now, even at
high ionic strength (up to 3 M HCl).
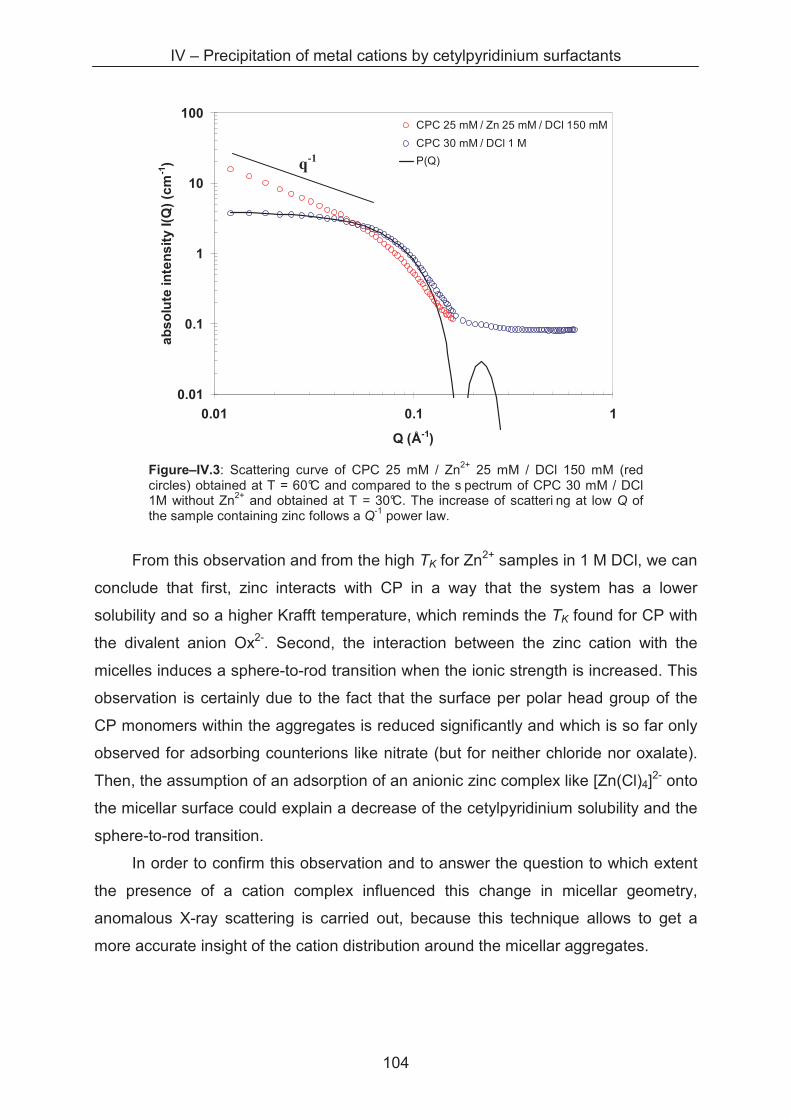
IV – Precipitation of metal cations by cetylpyridinium surfactants
104
0.01
0.1
1
10
100
0.01 0.1 1
Q (Å-1)
ab
so
lute
inte
ns
ity
I(Q
) (c
m-1
)
CPC 25 mM / Zn 25 mM / DCl 150 mM
CPC 30 mM / DCl 1 M
P(Q)
Figure–IV.3: Scattering curve of CPC 25 mM / Zn2+ 25 mM / DCl 150 mM (red circles) obtained at T = 60°C and compared to the s pectrum of CPC 30 mM / DCl 1M without Zn2+ and obtained at T = 30°C. The increase of scatteri ng at low Q of the sample containing zinc follows a Q-1 power law.
From this observation and from the high TK for Zn2+ samples in 1 M DCl, we can
conclude that first, zinc interacts with CP in a way that the system has a lower
solubility and so a higher Krafft temperature, which reminds the TK found for CP with
the divalent anion Ox2-. Second, the interaction between the zinc cation with the
micelles induces a sphere-to-rod transition when the ionic strength is increased. This
observation is certainly due to the fact that the surface per polar head group of the
CP monomers within the aggregates is reduced significantly and which is so far only
observed for adsorbing counterions like nitrate (but for neither chloride nor oxalate).
Then, the assumption of an adsorption of an anionic zinc complex like [Zn(Cl)4]2- onto
the micellar surface could explain a decrease of the cetylpyridinium solubility and the
sphere-to-rod transition.
In order to confirm this observation and to answer the question to which extent
the presence of a cation complex influenced this change in micellar geometry,
anomalous X-ray scattering is carried out, because this technique allows to get a
more accurate insight of the cation distribution around the micellar aggregates.
q-1
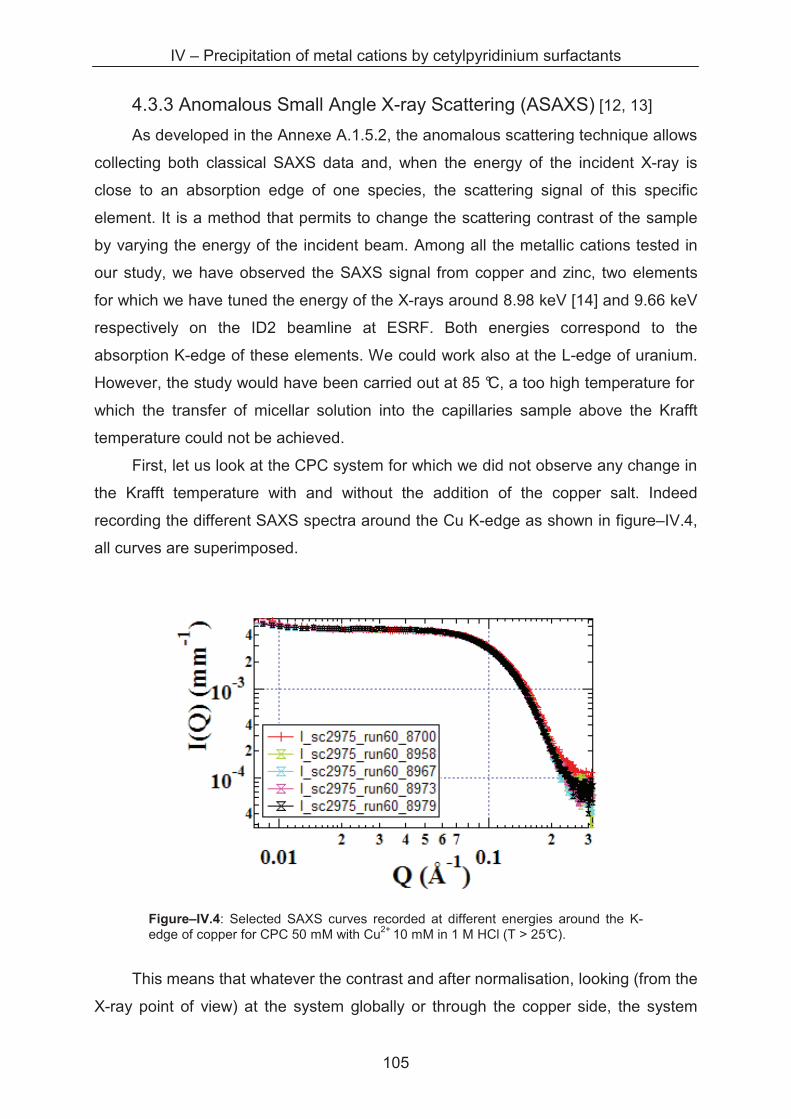
IV – Precipitation of metal cations by cetylpyridinium surfactants
105
4.3.3 Anomalous Small Angle X-ray Scattering (ASAXS) [12, 13]
As developed in the Annexe A.1.5.2, the anomalous scattering technique allows
collecting both classical SAXS data and, when the energy of the incident X-ray is
close to an absorption edge of one species, the scattering signal of this specific
element. It is a method that permits to change the scattering contrast of the sample
by varying the energy of the incident beam. Among all the metallic cations tested in
our study, we have observed the SAXS signal from copper and zinc, two elements
for which we have tuned the energy of the X-rays around 8.98 keV [14] and 9.66 keV
respectively on the ID2 beamline at ESRF. Both energies correspond to the
absorption K-edge of these elements. We could work also at the L-edge of uranium.
However, the study would have been carried out at 85 °C, a too high temperature for
which the transfer of micellar solution into the capillaries sample above the Krafft
temperature could not be achieved.
First, let us look at the CPC system for which we did not observe any change in
the Krafft temperature with and without the addition of the copper salt. Indeed
recording the different SAXS spectra around the Cu K-edge as shown in figure–IV.4,
all curves are superimposed.
Figure–IV.4: Selected SAXS curves recorded at different energies around the K-edge of copper for CPC 50 mM with Cu2+ 10 mM in 1 M HCl (T > 25°C).
This means that whatever the contrast and after normalisation, looking (from the
X-ray point of view) at the system globally or through the copper side, the system
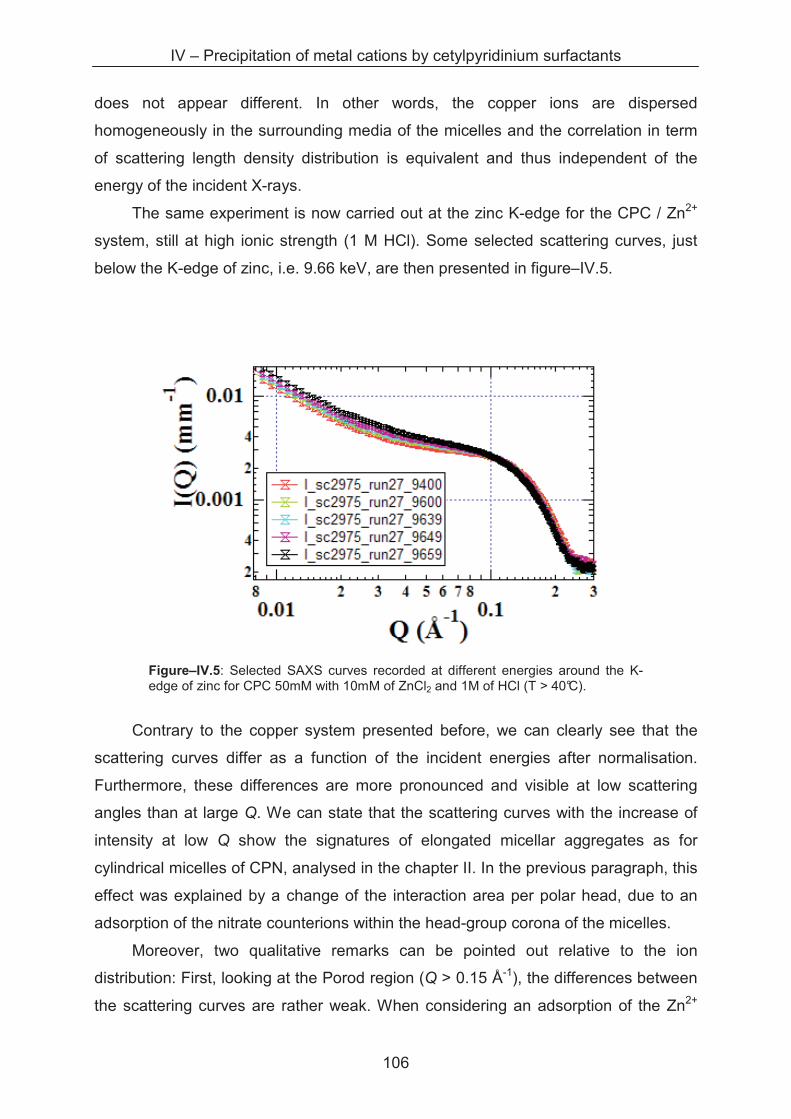
IV – Precipitation of metal cations by cetylpyridinium surfactants
106
does not appear different. In other words, the copper ions are dispersed
homogeneously in the surrounding media of the micelles and the correlation in term
of scattering length density distribution is equivalent and thus independent of the
energy of the incident X-rays.
The same experiment is now carried out at the zinc K-edge for the CPC / Zn2+
system, still at high ionic strength (1 M HCl). Some selected scattering curves, just
below the K-edge of zinc, i.e. 9.66 keV, are then presented in figure–IV.5.
Figure–IV.5: Selected SAXS curves recorded at different energies around the K-edge of zinc for CPC 50mM with 10mM of ZnCl2 and 1M of HCl (T > 40°C).
Contrary to the copper system presented before, we can clearly see that the
scattering curves differ as a function of the incident energies after normalisation.
Furthermore, these differences are more pronounced and visible at low scattering
angles than at large Q. We can state that the scattering curves with the increase of
intensity at low Q show the signatures of elongated micellar aggregates as for
cylindrical micelles of CPN, analysed in the chapter II. In the previous paragraph, this
effect was explained by a change of the interaction area per polar head, due to an
adsorption of the nitrate counterions within the head-group corona of the micelles.
Moreover, two qualitative remarks can be pointed out relative to the ion
distribution: First, looking at the Porod region (Q > 0.15 Å-1), the differences between
the scattering curves are rather weak. When considering an adsorption of the Zn2+
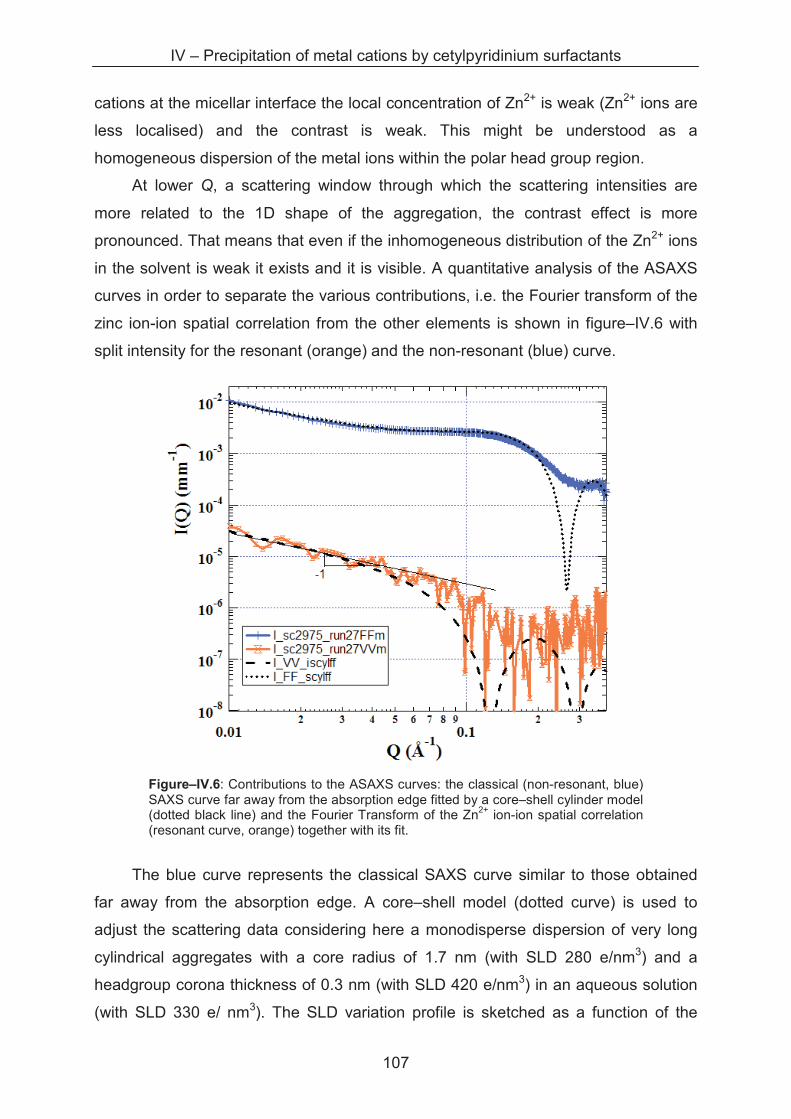
IV – Precipitation of metal cations by cetylpyridinium surfactants
107
cations at the micellar interface the local concentration of Zn2+ is weak (Zn2+ ions are
less localised) and the contrast is weak. This might be understood as a
homogeneous dispersion of the metal ions within the polar head group region.
At lower Q, a scattering window through which the scattering intensities are
more related to the 1D shape of the aggregation, the contrast effect is more
pronounced. That means that even if the inhomogeneous distribution of the Zn2+ ions
in the solvent is weak it exists and it is visible. A quantitative analysis of the ASAXS
curves in order to separate the various contributions, i.e. the Fourier transform of the
zinc ion-ion spatial correlation from the other elements is shown in figure–IV.6 with
split intensity for the resonant (orange) and the non-resonant (blue) curve.
Figure–IV.6: Contributions to the ASAXS curves: the classical (non-resonant, blue) SAXS curve far away from the absorption edge fitted by a core–shell cylinder model (dotted black line) and the Fourier Transform of the Zn2+ ion-ion spatial correlation (resonant curve, orange) together with its fit.
The blue curve represents the classical SAXS curve similar to those obtained
far away from the absorption edge. A core–shell model (dotted curve) is used to
adjust the scattering data considering here a monodisperse dispersion of very long
cylindrical aggregates with a core radius of 1.7 nm (with SLD 280 e/nm3) and a
headgroup corona thickness of 0.3 nm (with SLD 420 e/nm3) in an aqueous solution
(with SLD 330 e/ nm3). The SLD variation profile is sketched as a function of the
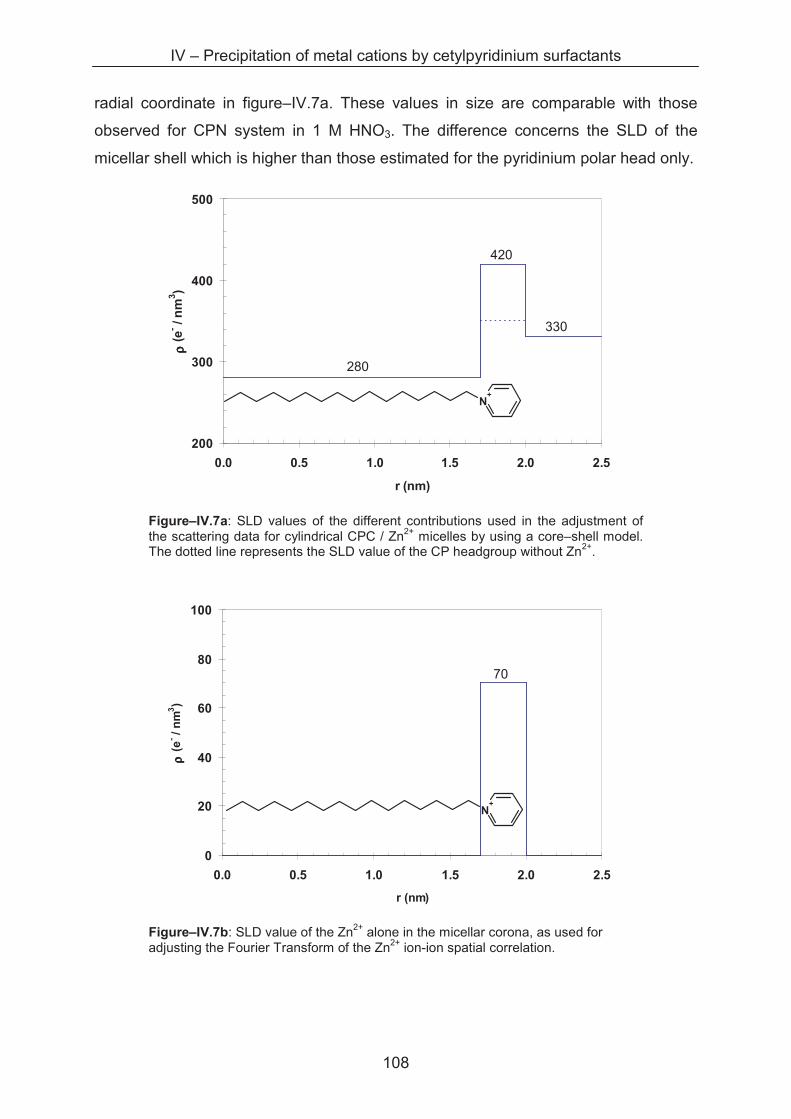
IV – Precipitation of metal cations by cetylpyridinium surfactants
108
radial coordinate in figure–IV.7a. These values in size are comparable with those
observed for CPN system in 1 M HNO3. The difference concerns the SLD of the
micellar shell which is higher than those estimated for the pyridinium polar head only.
200
300
400
500
0.0 0.5 1.0 1.5 2.0 2.5
r (nm)
ρρ ρρ (
e- /
nm
3)
Figure–IV.7a: SLD values of the different contributions used in the adjustment of the scattering data for cylindrical CPC / Zn2+ micelles by using a core–shell model. The dotted line represents the SLD value of the CP headgroup without Zn2+.
0
20
40
60
80
100
0.0 0.5 1.0 1.5 2.0 2.5
r (nm)
ρρ ρρ (
e- /
nm
3)
Figure–IV.7b: SLD value of the Zn2+ alone in the micellar corona, as used for adjusting the Fourier Transform of the Zn2+ ion-ion spatial correlation.
N+
70
280
330
420
N+
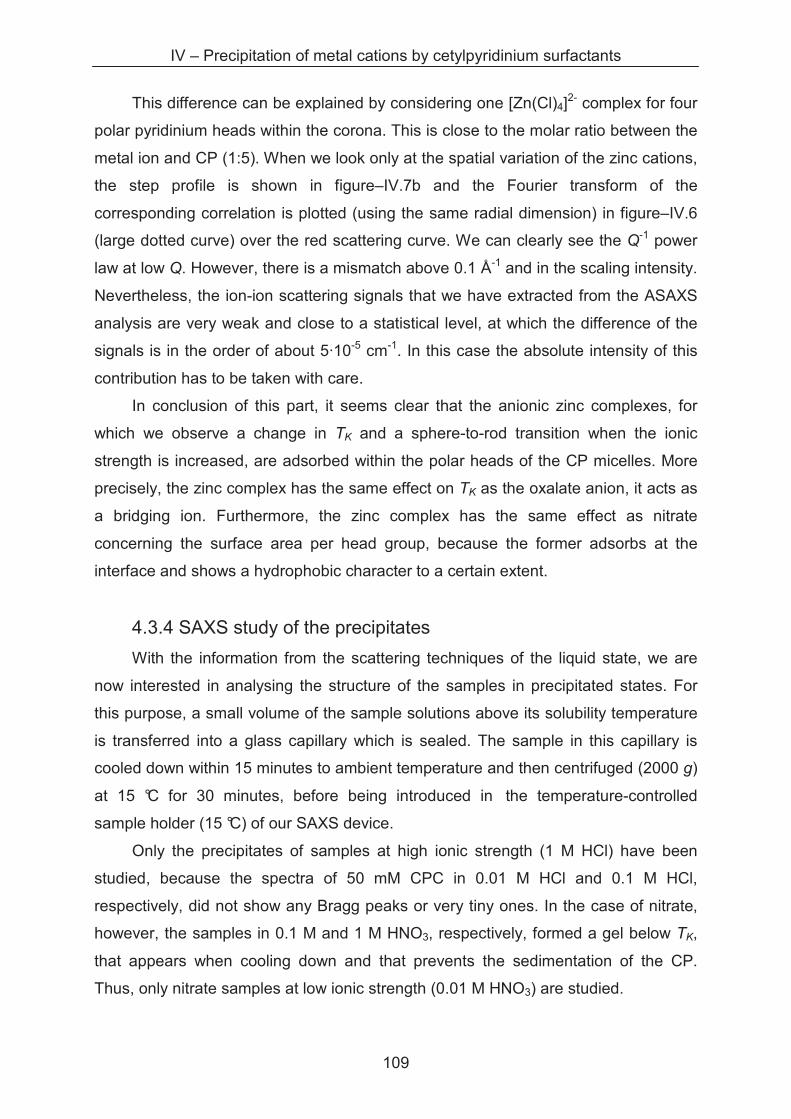
IV – Precipitation of metal cations by cetylpyridinium surfactants
109
This difference can be explained by considering one [Zn(Cl)4]2- complex for four
polar pyridinium heads within the corona. This is close to the molar ratio between the
metal ion and CP (1:5). When we look only at the spatial variation of the zinc cations,
the step profile is shown in figure–IV.7b and the Fourier transform of the
corresponding correlation is plotted (using the same radial dimension) in figure–IV.6
(large dotted curve) over the red scattering curve. We can clearly see the Q-1 power
law at low Q. However, there is a mismatch above 0.1 Å-1 and in the scaling intensity.
Nevertheless, the ion-ion scattering signals that we have extracted from the ASAXS
analysis are very weak and close to a statistical level, at which the difference of the
signals is in the order of about 5·10-5 cm-1. In this case the absolute intensity of this
contribution has to be taken with care.
In conclusion of this part, it seems clear that the anionic zinc complexes, for
which we observe a change in TK and a sphere-to-rod transition when the ionic
strength is increased, are adsorbed within the polar heads of the CP micelles. More
precisely, the zinc complex has the same effect on TK as the oxalate anion, it acts as
a bridging ion. Furthermore, the zinc complex has the same effect as nitrate
concerning the surface area per head group, because the former adsorbs at the
interface and shows a hydrophobic character to a certain extent.
4.3.4 SAXS study of the precipitates
With the information from the scattering techniques of the liquid state, we are
now interested in analysing the structure of the samples in precipitated states. For
this purpose, a small volume of the sample solutions above its solubility temperature
is transferred into a glass capillary which is sealed. The sample in this capillary is
cooled down within 15 minutes to ambient temperature and then centrifuged (2000 g)
at 15 °C for 30 minutes, before being introduced in the temperature-controlled
sample holder (15 °C) of our SAXS device.
Only the precipitates of samples at high ionic strength (1 M HCl) have been
studied, because the spectra of 50 mM CPC in 0.01 M HCl and 0.1 M HCl,
respectively, did not show any Bragg peaks or very tiny ones. In the case of nitrate,
however, the samples in 0.1 M and 1 M HNO3, respectively, formed a gel below TK,
that appears when cooling down and that prevents the sedimentation of the CP.
Thus, only nitrate samples at low ionic strength (0.01 M HNO3) are studied.
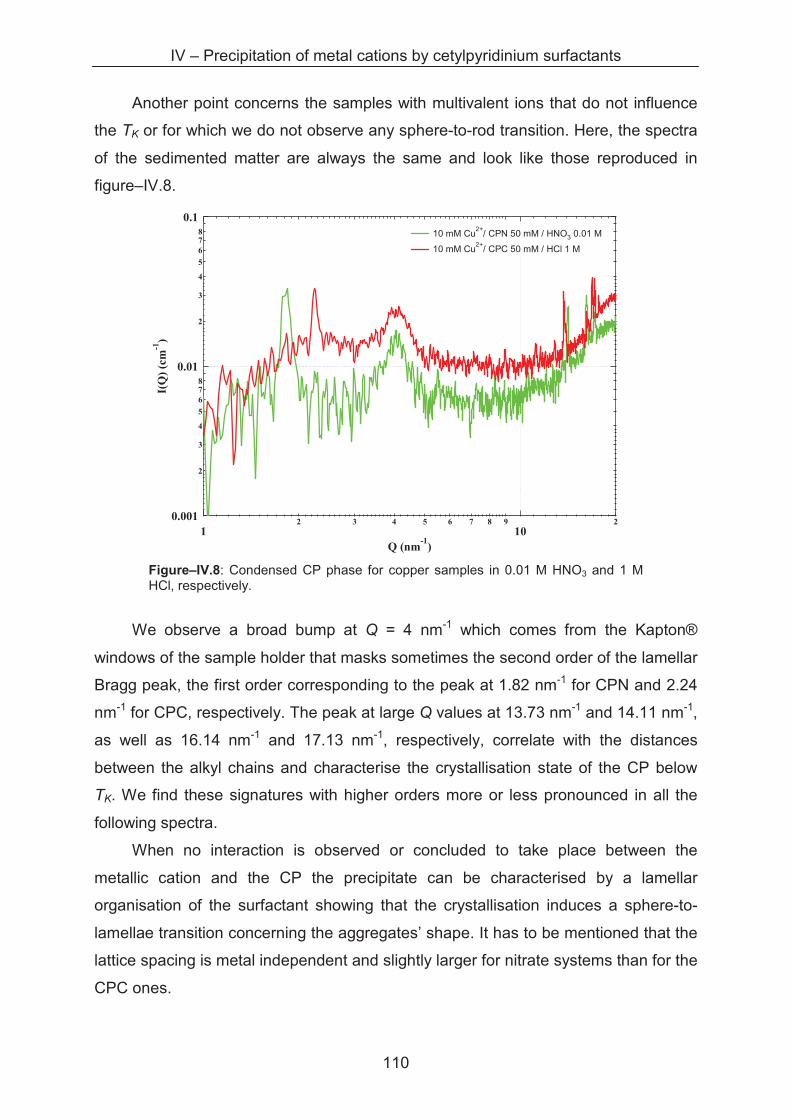
IV – Precipitation of metal cations by cetylpyridinium surfactants
110
Another point concerns the samples with multivalent ions that do not influence
the TK or for which we do not observe any sphere-to-rod transition. Here, the spectra
of the sedimented matter are always the same and look like those reproduced in
figure–IV.8.
0.001
2
3
4
5
6
78
0.01
2
3
4
5
6
78
0.1
I(Q
) (c
m-1
)
12 3 4 5 6 7 8 9
102
Q (nm-1
)
10 mM Cu2+
/ CPN 50 mM / HNO3 0.01 M
10 mM Cu2+
/ CPC 50 mM / HCl 1 M
Figure–IV.8: Condensed CP phase for copper samples in 0.01 M HNO3 and 1 M HCl, respectively.
We observe a broad bump at Q = 4 nm-1 which comes from the Kapton®
windows of the sample holder that masks sometimes the second order of the lamellar
Bragg peak, the first order corresponding to the peak at 1.82 nm-1 for CPN and 2.24
nm-1 for CPC, respectively. The peak at large Q values at 13.73 nm-1 and 14.11 nm-1,
as well as 16.14 nm-1 and 17.13 nm-1, respectively, correlate with the distances
between the alkyl chains and characterise the crystallisation state of the CP below
TK. We find these signatures with higher orders more or less pronounced in all the
following spectra.
When no interaction is observed or concluded to take place between the
metallic cation and the CP the precipitate can be characterised by a lamellar
organisation of the surfactant showing that the crystallisation induces a sphere-to-
lamellae transition concerning the aggregates’ shape. It has to be mentioned that the
lattice spacing is metal independent and slightly larger for nitrate systems than for the
CPC ones.
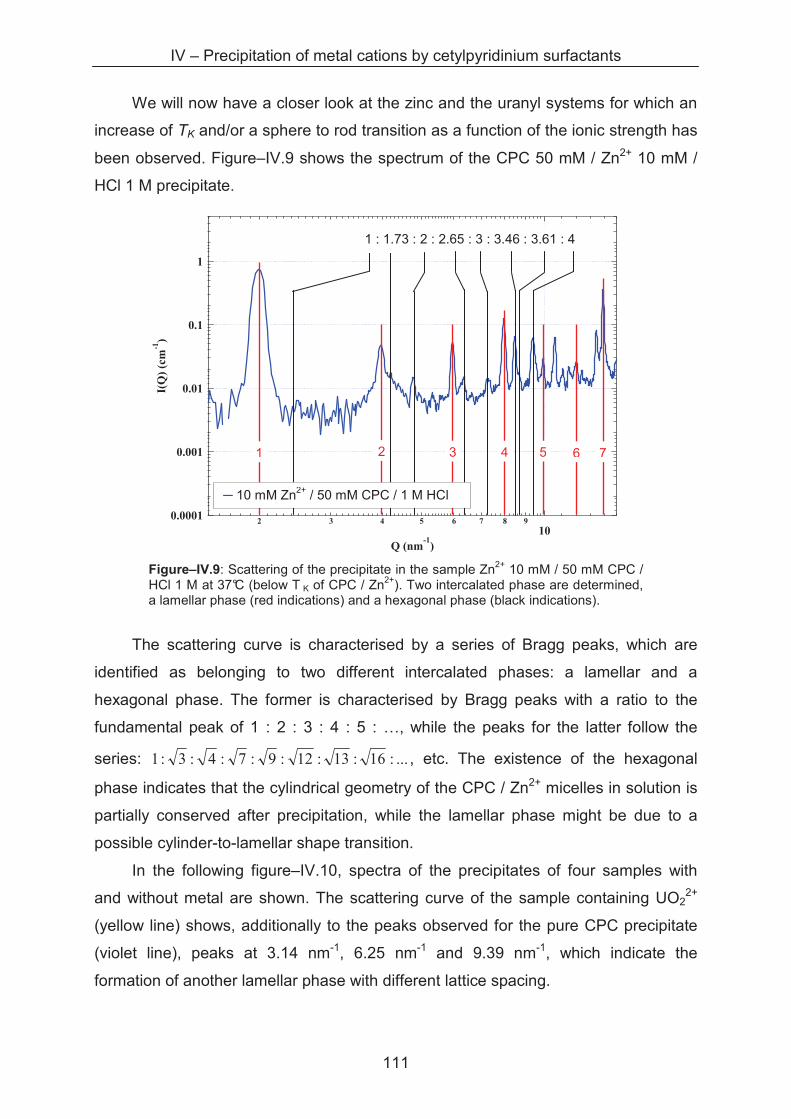
IV – Precipitation of metal cations by cetylpyridinium surfactants
111
We will now have a closer look at the zinc and the uranyl systems for which an
increase of TK and/or a sphere to rod transition as a function of the ionic strength has
been observed. Figure–IV.9 shows the spectrum of the CPC 50 mM / Zn2+ 10 mM /
HCl 1 M precipitate.
0.0001
0.001
0.01
0.1
1
I(Q
) (c
m-1
)
2 3 4 5 6 7 8 9
10
Q (nm-1
)
10 mM Zn2+
/ 50 mM CPC / 1M HCl
Figure–IV.9: Scattering of the precipitate in the sample Zn2+ 10 mM / 50 mM CPC / HCl 1 M at 37°C (below T K of CPC / Zn2+). Two intercalated phase are determined, a lamellar phase (red indications) and a hexagonal phase (black indications).
The scattering curve is characterised by a series of Bragg peaks, which are
identified as belonging to two different intercalated phases: a lamellar and a
hexagonal phase. The former is characterised by Bragg peaks with a ratio to the
fundamental peak of 1 : 2 : 3 : 4 : 5 : …, while the peaks for the latter follow the
series: ...:16:13:12:9:7:4:3:1 , etc. The existence of the hexagonal
phase indicates that the cylindrical geometry of the CPC / Zn2+ micelles in solution is
partially conserved after precipitation, while the lamellar phase might be due to a
possible cylinder-to-lamellar shape transition.
In the following figure–IV.10, spectra of the precipitates of four samples with
and without metal are shown. The scattering curve of the sample containing UO22+
(yellow line) shows, additionally to the peaks observed for the pure CPC precipitate
(violet line), peaks at 3.14 nm-1, 6.25 nm-1 and 9.39 nm-1, which indicate the
formation of another lamellar phase with different lattice spacing.
1 : 1.73 : 2 : 2.65 : 3 : 3.46 : 3.61 : 4
21 3
� 10 mM Zn2+ / 50 mM CPC / 1 M HCl
4 5 6 7
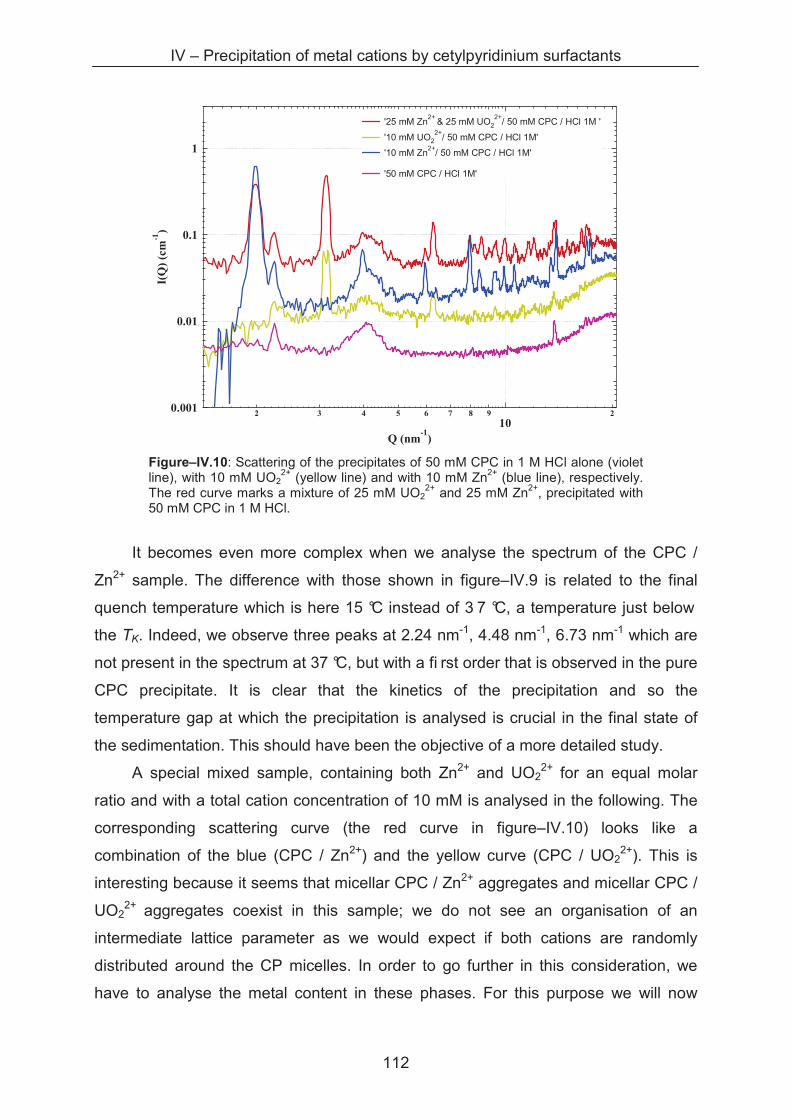
IV – Precipitation of metal cations by cetylpyridinium surfactants
112
0.001
0.01
0.1
1I(
Q)
(cm
-1)
2 3 4 5 6 7 8 9
102
Q (nm-1
)
'25 mM Zn2+
& 25 mM UO22+
/ 50 mM CPC / HCl 1M '
'10 mM UO22+
/ 50 mM CPC / HCl 1M'
'10 mM Zn2+
/ 50 mM CPC / HCl 1M'
'50 mM CPC / HCl 1M'
Figure–IV.10: Scattering of the precipitates of 50 mM CPC in 1 M HCl alone (violet line), with 10 mM UO2
2+ (yellow line) and with 10 mM Zn2+ (blue line), respectively. The red curve marks a mixture of 25 mM UO2
2+ and 25 mM Zn2+, precipitated with 50 mM CPC in 1 M HCl.
It becomes even more complex when we analyse the spectrum of the CPC /
Zn2+ sample. The difference with those shown in figure–IV.9 is related to the final
quench temperature which is here 15 °C instead of 3 7 °C, a temperature just below
the TK. Indeed, we observe three peaks at 2.24 nm-1, 4.48 nm-1, 6.73 nm-1 which are
not present in the spectrum at 37 °C, but with a fi rst order that is observed in the pure
CPC precipitate. It is clear that the kinetics of the precipitation and so the
temperature gap at which the precipitation is analysed is crucial in the final state of
the sedimentation. This should have been the objective of a more detailed study.
A special mixed sample, containing both Zn2+ and UO22+ for an equal molar
ratio and with a total cation concentration of 10 mM is analysed in the following. The
corresponding scattering curve (the red curve in figure–IV.10) looks like a
combination of the blue (CPC / Zn2+) and the yellow curve (CPC / UO22+). This is
interesting because it seems that micellar CPC / Zn2+ aggregates and micellar CPC /
UO22+ aggregates coexist in this sample; we do not see an organisation of an
intermediate lattice parameter as we would expect if both cations are randomly
distributed around the CP micelles. In order to go further in this consideration, we
have to analyse the metal content in these phases. For this purpose we will now
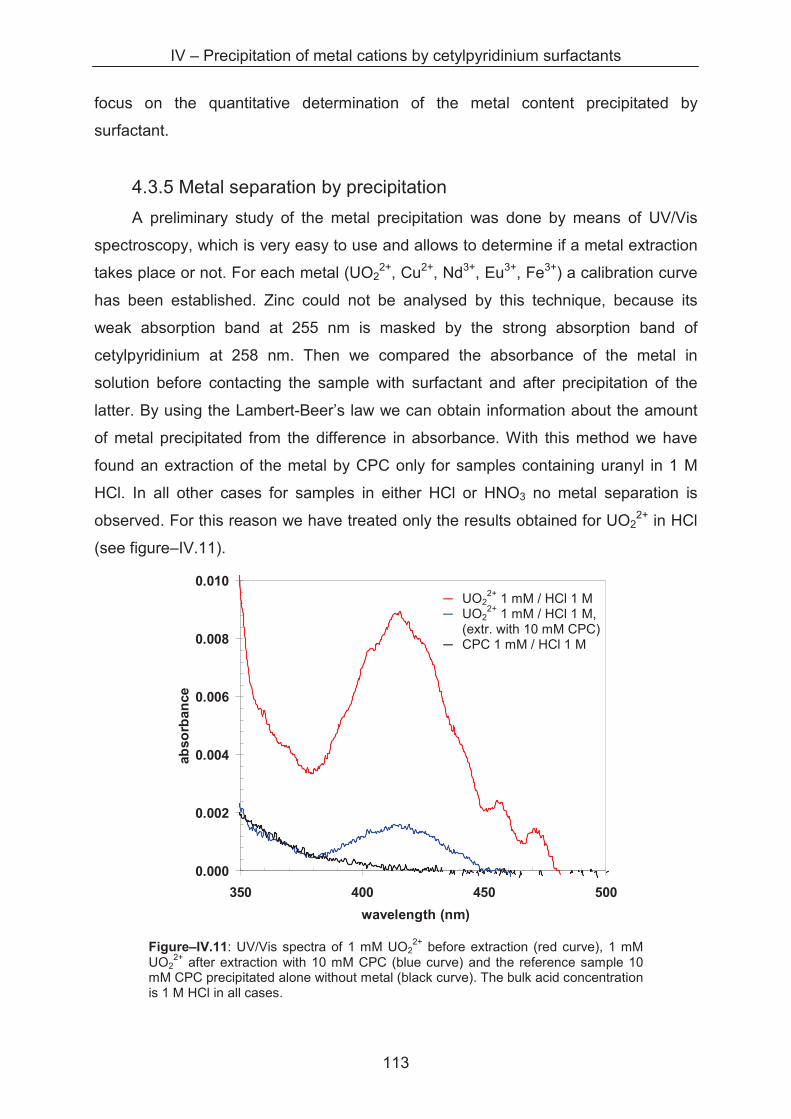
IV – Precipitation of metal cations by cetylpyridinium surfactants
113
focus on the quantitative determination of the metal content precipitated by
surfactant.
4.3.5 Metal separation by precipitation
A preliminary study of the metal precipitation was done by means of UV/Vis
spectroscopy, which is very easy to use and allows to determine if a metal extraction
takes place or not. For each metal (UO22+, Cu2+, Nd3+, Eu3+, Fe3+) a calibration curve
has been established. Zinc could not be analysed by this technique, because its
weak absorption band at 255 nm is masked by the strong absorption band of
cetylpyridinium at 258 nm. Then we compared the absorbance of the metal in
solution before contacting the sample with surfactant and after precipitation of the
latter. By using the Lambert-Beer’s law we can obtain information about the amount
of metal precipitated from the difference in absorbance. With this method we have
found an extraction of the metal by CPC only for samples containing uranyl in 1 M
HCl. In all other cases for samples in either HCl or HNO3 no metal separation is
observed. For this reason we have treated only the results obtained for UO22+ in HCl
(see figure–IV.11).
0.000
0.002
0.004
0.006
0.008
0.010
350 400 450 500
wavelength (nm)
ab
so
rban
ce
Figure–IV.11: UV/Vis spectra of 1 mM UO22+ before extraction (red curve), 1 mM
UO22+ after extraction with 10 mM CPC (blue curve) and the reference sample 10
mM CPC precipitated alone without metal (black curve). The bulk acid concentration is 1 M HCl in all cases.
� UO22+ 1 mM / HCl 1 M
� UO22+ 1 mM / HCl 1 M,
(extr. with 10 mM CPC) � CPC 1 mM / HCl 1 M
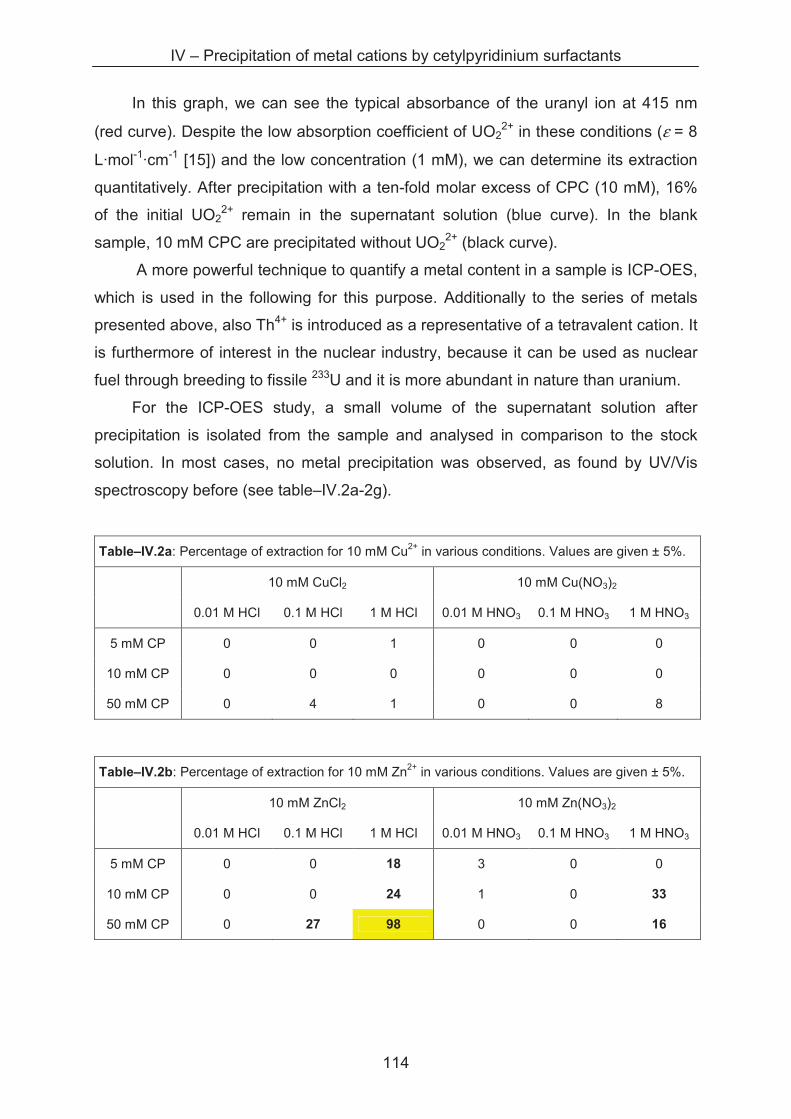
IV – Precipitation of metal cations by cetylpyridinium surfactants
114
In this graph, we can see the typical absorbance of the uranyl ion at 415 nm
(red curve). Despite the low absorption coefficient of UO22+ in these conditions (ε = 8
L·mol-1·cm-1 [15]) and the low concentration (1 mM), we can determine its extraction
quantitatively. After precipitation with a ten-fold molar excess of CPC (10 mM), 16%
of the initial UO22+ remain in the supernatant solution (blue curve). In the blank
sample, 10 mM CPC are precipitated without UO22+ (black curve).
A more powerful technique to quantify a metal content in a sample is ICP-OES,
which is used in the following for this purpose. Additionally to the series of metals
presented above, also Th4+ is introduced as a representative of a tetravalent cation. It
is furthermore of interest in the nuclear industry, because it can be used as nuclear
fuel through breeding to fissile 233U and it is more abundant in nature than uranium.
For the ICP-OES study, a small volume of the supernatant solution after
precipitation is isolated from the sample and analysed in comparison to the stock
solution. In most cases, no metal precipitation was observed, as found by UV/Vis
spectroscopy before (see table–IV.2a-2g).
Table–IV.2a: Percentage of extraction for 10 mM Cu2+ in various conditions. Values are given ± 5%.
10 mM CuCl2 10 mM Cu(NO3)2
0.01 M HCl 0.1 M HCl 1 M HCl 0.01 M HNO3 0.1 M HNO3 1 M HNO3
5 mM CP 0 0 1 0 0 0
10 mM CP 0 0 0 0 0 0
50 mM CP 0 4 1 0 0 8
Table–IV.2b: Percentage of extraction for 10 mM Zn2+ in various conditions. Values are given ± 5%.
10 mM ZnCl2 10 mM Zn(NO3)2
0.01 M HCl 0.1 M HCl 1 M HCl 0.01 M HNO3 0.1 M HNO3 1 M HNO3
5 mM CP 0 0 18 3 0 0
10 mM CP 0 0 24 1 0 33
50 mM CP 0 27 98 0 0 16
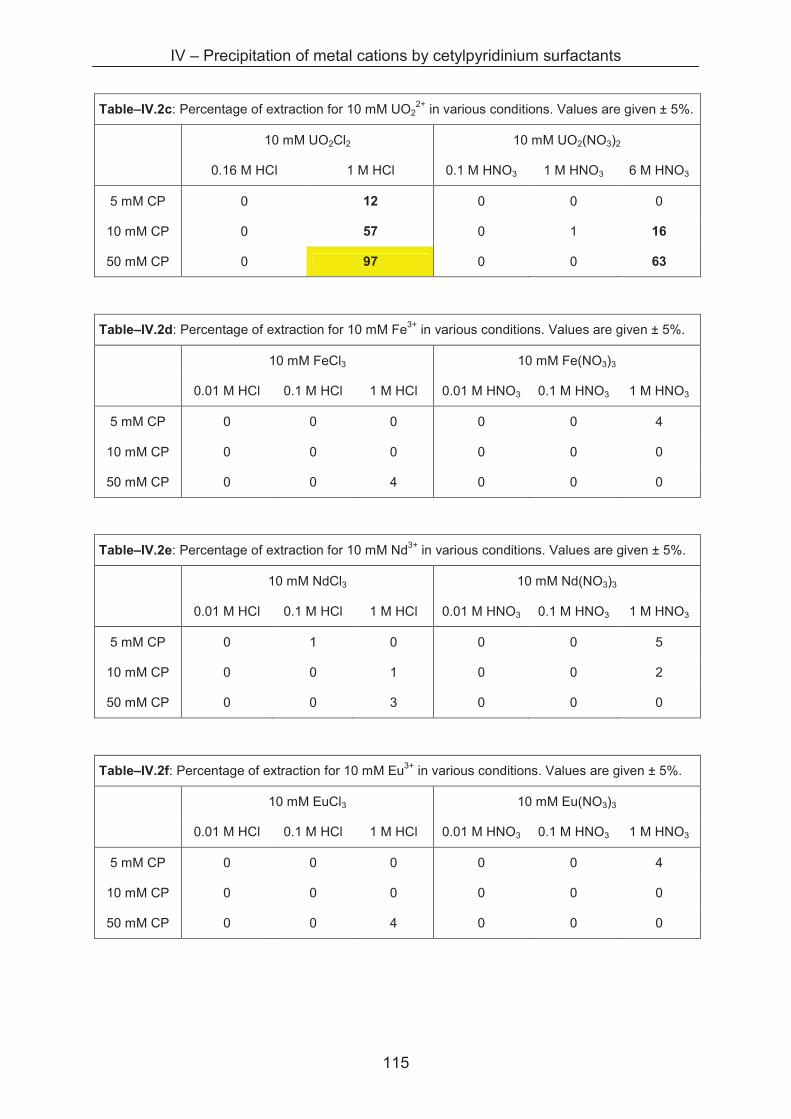
IV – Precipitation of metal cations by cetylpyridinium surfactants
115
Table–IV.2c: Percentage of extraction for 10 mM UO22+ in various conditions. Values are given ± 5%.
10 mM UO2Cl2 10 mM UO2(NO3)2
0.16 M HCl 1 M HCl 0.1 M HNO3 1 M HNO3 6 M HNO3
5 mM CP 0 12 0 0 0
10 mM CP 0 57 0 1 16
50 mM CP 0 97 0 0 63
Table–IV.2d: Percentage of extraction for 10 mM Fe3+ in various conditions. Values are given ± 5%.
10 mM FeCl3 10 mM Fe(NO3)3
0.01 M HCl 0.1 M HCl 1 M HCl 0.01 M HNO3 0.1 M HNO3 1 M HNO3
5 mM CP 0 0 0 0 0 4
10 mM CP 0 0 0 0 0 0
50 mM CP 0 0 4 0 0 0
Table–IV.2e: Percentage of extraction for 10 mM Nd3+ in various conditions. Values are given ± 5%.
10 mM NdCl3 10 mM Nd(NO3)3
0.01 M HCl 0.1 M HCl 1 M HCl 0.01 M HNO3 0.1 M HNO3 1 M HNO3
5 mM CP 0 1 0 0 0 5
10 mM CP 0 0 1 0 0 2
50 mM CP 0 0 3 0 0 0
Table–IV.2f: Percentage of extraction for 10 mM Eu3+ in various conditions. Values are given ± 5%.
10 mM EuCl3 10 mM Eu(NO3)3
0.01 M HCl 0.1 M HCl 1 M HCl 0.01 M HNO3 0.1 M HNO3 1 M HNO3
5 mM CP 0 0 0 0 0 4
10 mM CP 0 0 0 0 0 0
50 mM CP 0 0 4 0 0 0
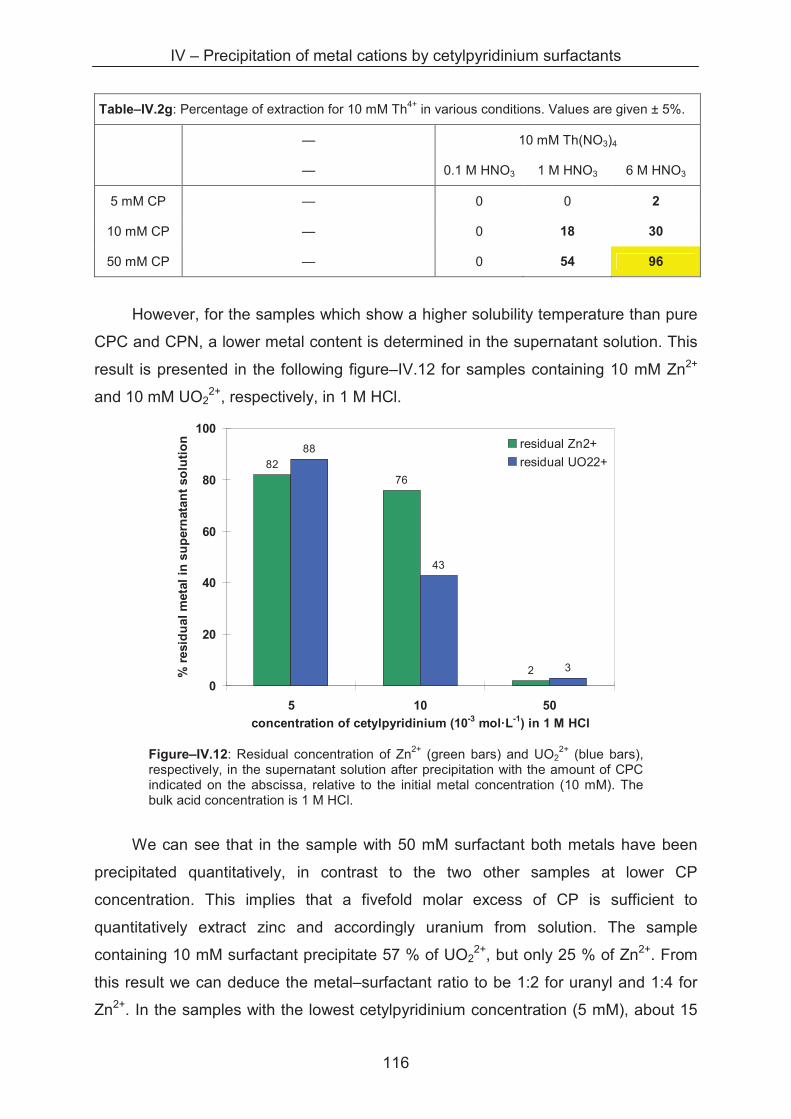
IV – Precipitation of metal cations by cetylpyridinium surfactants
116
Table–IV.2g: Percentage of extraction for 10 mM Th4+ in various conditions. Values are given ± 5%.
— 10 mM Th(NO3)4
— 0.1 M HNO3 1 M HNO3 6 M HNO3
5 mM CP — 0 0 2
10 mM CP — 0 18 30
50 mM CP — 0 54 96
However, for the samples which show a higher solubility temperature than pure
CPC and CPN, a lower metal content is determined in the supernatant solution. This
result is presented in the following figure–IV.12 for samples containing 10 mM Zn2+
and 10 mM UO22+, respectively, in 1 M HCl.
82
76
2
88
43
3
0
20
40
60
80
100
5 10 50
concentration of cetylpyridinium (10-3 mol·L-1) in 1 M HCl
% r
esid
ual
meta
l in
su
pern
ata
nt
so
luti
on residual Zn2+
residual UO22+
Figure–IV.12: Residual concentration of Zn2+ (green bars) and UO22+ (blue bars),
respectively, in the supernatant solution after precipitation with the amount of CPC indicated on the abscissa, relative to the initial metal concentration (10 mM). The bulk acid concentration is 1 M HCl.
We can see that in the sample with 50 mM surfactant both metals have been
precipitated quantitatively, in contrast to the two other samples at lower CP
concentration. This implies that a fivefold molar excess of CP is sufficient to
quantitatively extract zinc and accordingly uranium from solution. The sample
containing 10 mM surfactant precipitate 57 % of UO22+, but only 25 % of Zn2+. From
this result we can deduce the metal–surfactant ratio to be 1:2 for uranyl and 1:4 for
Zn2+. In the samples with the lowest cetylpyridinium concentration (5 mM), about 15
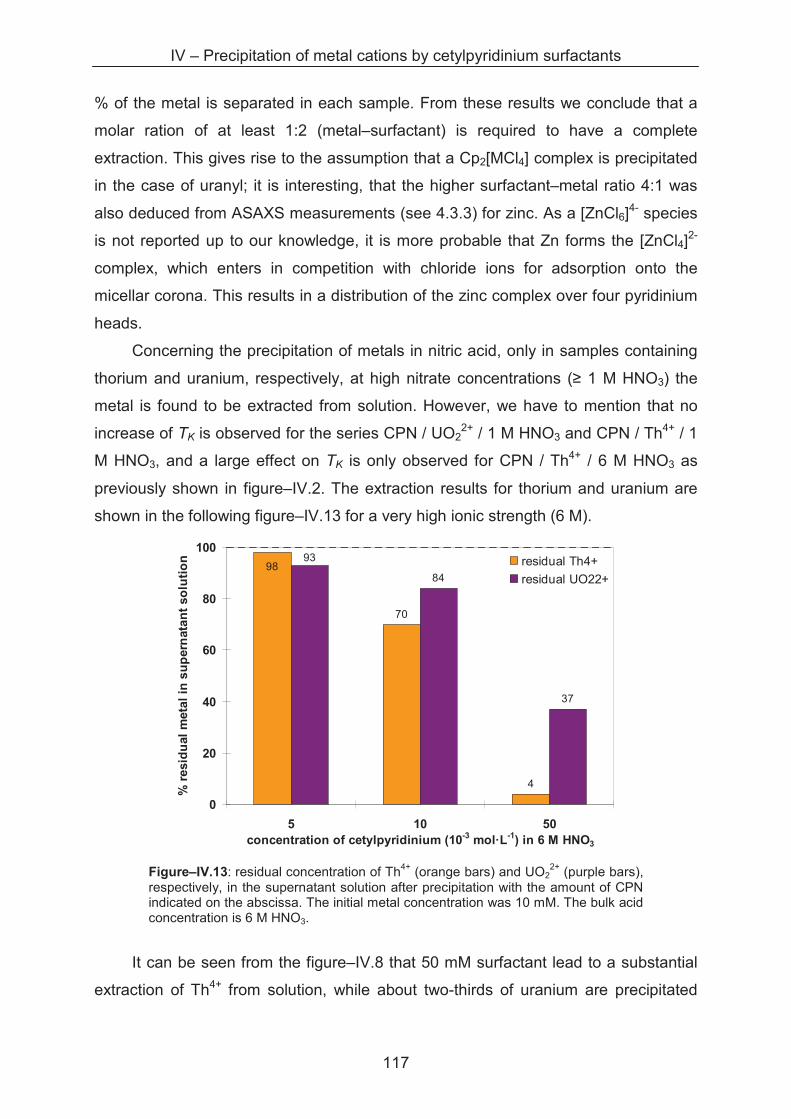
IV – Precipitation of metal cations by cetylpyridinium surfactants
117
% of the metal is separated in each sample. From these results we conclude that a
molar ration of at least 1:2 (metal–surfactant) is required to have a complete
extraction. This gives rise to the assumption that a Cp2[MCl4] complex is precipitated
in the case of uranyl; it is interesting, that the higher surfactant–metal ratio 4:1 was
also deduced from ASAXS measurements (see 4.3.3) for zinc. As a [ZnCl6]4- species
is not reported up to our knowledge, it is more probable that Zn forms the [ZnCl4]2-
complex, which enters in competition with chloride ions for adsorption onto the
micellar corona. This results in a distribution of the zinc complex over four pyridinium
heads.
Concerning the precipitation of metals in nitric acid, only in samples containing
thorium and uranium, respectively, at high nitrate concentrations (� 1 M HNO3) the
metal is found to be extracted from solution. However, we have to mention that no
increase of TK is observed for the series CPN / UO22+ / 1 M HNO3 and CPN / Th4+ / 1
M HNO3, and a large effect on TK is only observed for CPN / Th4+ / 6 M HNO3 as
previously shown in figure–IV.2. The extraction results for thorium and uranium are
shown in the following figure–IV.13 for a very high ionic strength (6 M).
70
4
84
37
9893
0
20
40
60
80
100
5 10 50concentration of cetylpyridinium (10-3 mol·L-1) in 6 M HNO3
% r
esid
ual
meta
l in
su
pern
ata
nt
so
luti
on residual Th4+
residual UO22+
Figure–IV.13: residual concentration of Th4+ (orange bars) and UO22+ (purple bars),
respectively, in the supernatant solution after precipitation with the amount of CPN indicated on the abscissa. The initial metal concentration was 10 mM. The bulk acid concentration is 6 M HNO3.
It can be seen from the figure–IV.8 that 50 mM surfactant lead to a substantial
extraction of Th4+ from solution, while about two-thirds of uranium are precipitated
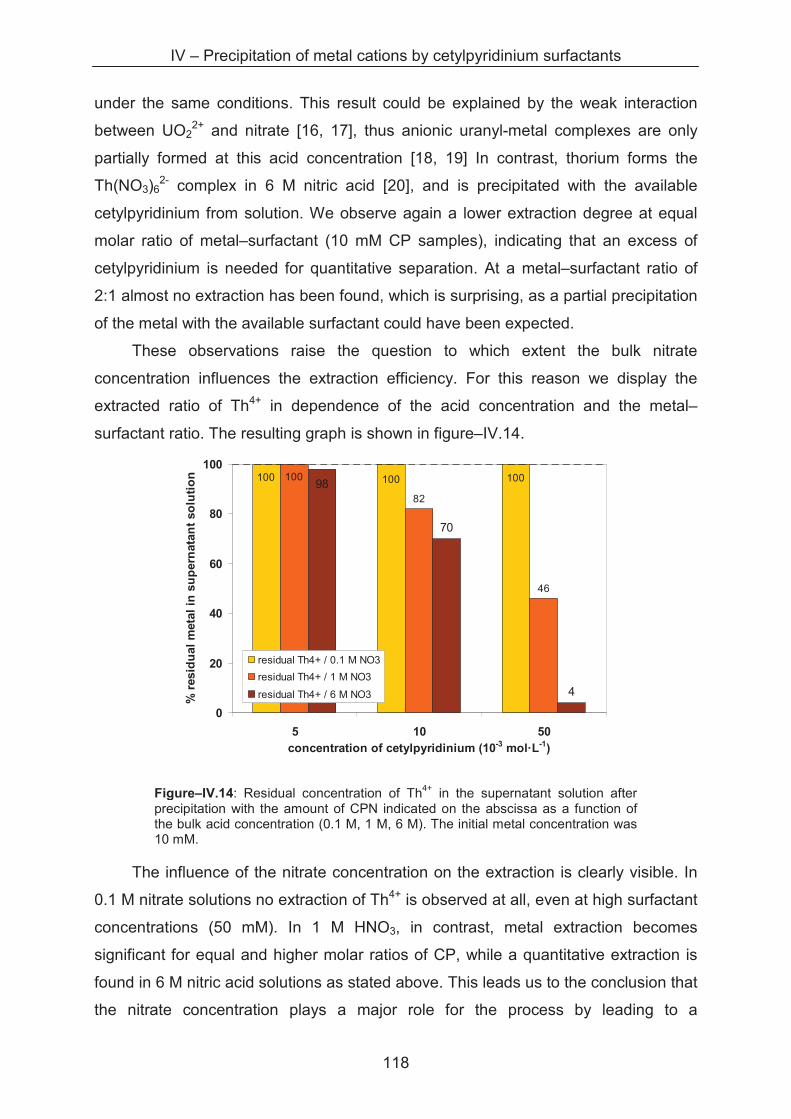
IV – Precipitation of metal cations by cetylpyridinium surfactants
118
under the same conditions. This result could be explained by the weak interaction
between UO22+ and nitrate [16, 17], thus anionic uranyl-metal complexes are only
partially formed at this acid concentration [18, 19] In contrast, thorium forms the
Th(NO3)62- complex in 6 M nitric acid [20], and is precipitated with the available
cetylpyridinium from solution. We observe again a lower extraction degree at equal
molar ratio of metal–surfactant (10 mM CP samples), indicating that an excess of
cetylpyridinium is needed for quantitative separation. At a metal–surfactant ratio of
2:1 almost no extraction has been found, which is surprising, as a partial precipitation
of the metal with the available surfactant could have been expected.
These observations raise the question to which extent the bulk nitrate
concentration influences the extraction efficiency. For this reason we display the
extracted ratio of Th4+ in dependence of the acid concentration and the metal–
surfactant ratio. The resulting graph is shown in figure–IV.14.
82
46
70
4
100100 10010098
0
20
40
60
80
100
5 10 50
concentration of cetylpyridinium (10-3 mol·L-1)
% r
esid
ual
met
al
in s
up
ern
ata
nt
solu
tio
n
residual Th4+ / 0.1 M NO3
residual Th4+ / 1 M NO3
residual Th4+ / 6 M NO3
The influence of the nitrate concentration on the extraction is clearly visible. In
0.1 M nitrate solutions no extraction of Th4+ is observed at all, even at high surfactant
concentrations (50 mM). In 1 M HNO3, in contrast, metal extraction becomes
significant for equal and higher molar ratios of CP, while a quantitative extraction is
found in 6 M nitric acid solutions as stated above. This leads us to the conclusion that
the nitrate concentration plays a major role for the process by leading to a
Figure–IV.14: Residual concentration of Th4+ in the supernatant solution after precipitation with the amount of CPN indicated on the abscissa as a function of the bulk acid concentration (0.1 M, 1 M, 6 M). The initial metal concentration was 10 mM.
IV – Precipitation of metal cations by cetylpyridinium surfactants
119
neutralization or reversal of the positive charge of the metal ion due to complexation.
From this point of view, the major requirement needed for a metal to be separated by
this technique is to form anionic complexes at the used acid concentration [8].
A further influence on the extraction was supposed to come from the cool-down
kinetics applied on the precipitation procedure. In order to get information concerning
this question, we tested an alternative procedure with a fast cool-down of the
samples. In contrast to the method explained above, the samples are directly
transferred from the thermostatic bath (in solubilised state) into the fridge at 5°C
without any intermediate cooling step and without any agitation. 24 hours later, they
are centrifuged (10.000 g) at 5 °C for 30 minutes and the supernatant soluti on is
analysed by ICP-OES. In contrast to the results presented previously, we did not
observe any metal extraction for each of these samples. From this observation, two
conclusions can be suggested: i) a certain equilibration time is needed in order to
form the insoluble metal–surfactant complex, and that ii) the time needed to achieve
this equilibrium state is also influenced by the agitation. In order to elucidate the
influence of these important parameters on the extraction process a more specialised
study has to be carried out.
4.4 Conclusion
It is shown by Heckmann et al. that cetylpyridinium surfactants are capable to
precipitate anionic metal complexes from sufficiently concentrated acid solutions.
Basing on this work we have determined that a fivefold molar excess of surfactant is
enough to extract the metal quantitatively. In all cases where we observed an
increase of the solubility temperature of the samples metal precipitation took place.
Exceptions are thorium and uranium samples in 1 M HNO3, where a metal extraction
is found without a specific increase of TK. This result suggests that more than one
type of interaction is responsible for the formation of the metal–surfactant complex.
The precipitates of CP containing metal show a rich variety of phases which even
coexist for different metals in one sample, and further studies have to clarify this
point. This structure formation of the precipitates containing metals is of high interest
for precursor design, as the precipitated mesophase could lead to the formation of a
IV – Precipitation of metal cations by cetylpyridinium surfactants
120
mesoporous metal sample in adequate conditions. Furthermore, the kinetics applied
to the precipitation technique plays a major role in the extraction efficiency of the
metal. This should be subject of a dedicated study in future works on this topic.
IV – Precipitation of metal cations by cetylpyridinium surfactants
121
References
[1] MERIDIANO, Y., BERTHON, L., CROZES, X., SOREL, C., DANNUS, P., ANTONIO, M. R.,CHIARIZIA, R., AND ZEMB, T.: "Aggregation in organic solutions of malonamides: consequences for water extraction". Solvent Extraction and Ion Exchange 27, 5 (2009), 607–637.
[2] TESTARD, F., BAUDUIN, P., MARTINET, L., ABECASSIS, B., BERTHON, L., MADIC, C.,AND ZEMB, T.: "Self-assembling properties of malonamide extractants used in separation processes". Radiochimica Acta 96, 4-5 (May 2008), 265–272.
[3] NAVE, S., MANDIN, C., MARTINET, L., BERTHON, L., TESTARD, F., MADIC, C., AND
ZEMB, T.: "Supramolecular organisation of tri-n-butyl phosphate in organic diluent on approaching third phase transition". Physical Chemistry Chemical Physics 6, 4 (2004), 799–808.
[4] BERTHON, L., MARTINET, L., TESTARD, F., MADIC, C., AND ZEMB, T.: "Solvent penetration and sterical stabilization of reverse aggregates based on the DIAMEX process extracting molecules: Consequences for the third phase formation". Solvent Extraction And Ion Exchange 25, 5 (Sep-Oct 2007), 545–576.
[5] TESTARD, F., BERTHON, L., AND ZEMB, T.: "Liquid-liquid extraction: An adsorption isotherm at divided interface?". Comptes Rendus Chimie 10, 10-11 (2007), 1034–1041.
[6] STRNAD, J., HECKMANN, K., AND GOMPPER, K.: "Separation of plutonium from intermediate level liquid waste by precipitation with alkyl-pyridinium nitrates". Monatshefte Für Chemie 120, 1 (Jan. 1989), 21–23.
[7] STRNAD, J., AND HECKMANN, K.: "Separation of actinides with alkylpyridinium salts". Journal Of Radioanalytical And Nuclear Chemistry-Articles 163, 1 (Nov 1992), 47–57.
[8] HECKMANN, K. AND SPURNY, J.: "Process for the selective separation of uranium from accompanying metals", United States Patent 4,486,392. Dec 4, 1984.
[9] HECKMANN, K. AND SPURNY, J.: "Process for selective separation of plutonium from uranium and other metals", United States Patent 4,609,533. Sep 2, 1986.
[10] SASAKI, S.: "Metastable crystalline lamella of cetylpyridinium chloride in the Krafft transition". Journal of Physical Chemistry B 111, 10 (Mar 15, 2007), 2473–2476.
[11] SASAKI, S.: "Kinetic studies on hydrated solid transform of cetylpyridinium chloride in aqueous solution". Journal of Physical Chemistry B 113, 25 (Jun 25, 2009), 8545–8551.
IV – Precipitation of metal cations by cetylpyridinium surfactants
122
[12] EZQUERRA, T., GARCIA-GUTIERREZ, M.-C., NOGALES, A., AND GOMEZ, M.: "Applications of synchrotron light to scattering and diffraction in materials and life sciences". Springer, 2009.
[13] MORFIN, I., EHRBURGER-DOLLE, F., GRILLO, I., LIVET, F., AND BLEY, F.: "ASAXS, SAXS and SANS investigations of vulcanized elastomers filled with carbon black". Journal of Synchrotron Radiation 13, 6 (Nov 2006), 445–452.
[14] LI, M., HUANG, Y.-S., JENG, U.-S., HSU, I.-J., SERMON WU, Y., LAI, Y.-H., SU, C.-H.,LEE, J.-F., WANG, Y., AND CHANG, C.-C.: "Resonant X-ray scattering and absorption for the global and local structures of cu-modified metallothioneins in solution". Biophys J. 97, 2 (July 2009), 609–617.
[15] LOPEZ, M., AND BIRCH, D.: "Characterisation of the dimer formed by hydrolysis of uranyl in aqueous solution and its role in the biexponential luminescence decay". Chemical Physics Letters 268, 1-2 (Apr 4, 1997), 125–132.
[16] SULEIMENOV, O., SEWARD, T., AND HOVEY, J.: "A spectrophotometric study on uranyl nitrate complexation to 150 °C". Journal of Solution Chemistry 36 (2007), 1093–1102.
[17] YE, X., SMITH, R. B., CUI, S., DE ALMEIDA, V., AND KHOMAMI, B.: "Influence of nitric acid on uranyl nitrate association in aqueous solutions: a molecular dynamics simulation study". Solvent Extraction and Ion Exchange 28, 1 (2010), 1–18.
[18] MOULIN, C., DECAMBOX, P., AND MAUCHIEN, P.: "State of the art in time-resolved laser-induced fluorescence for actinides analysis: Applications and trends". Journal of Radioanalytical and Nuclear Chemistry 226, 1-2 (Dec 1997), 135–138. 6th International Conference on Low-Level Measurements of Actinides and Long-Lived Radionuclides in Biological and Environmental Samples, Cherbourg, France, Sep 09-13, 1996.
[19] MOULIN, C.: "On the use of time-resolved laser-induced fluorescence (TRLIF) and electrospray mass spectrometry (ES-MS) for speciation studies". Radiochimica Acta 91, 11-2003 (Nov 2003), 651–658.
[20] VESELSKY, J.: "Some remarks on the extraction of Pu(IV) and Th with tridodecylamine from nitric acid soil leach solutions and the possible existence of a univalent anionic Th-nitrate complex". Journal of Radioanalytical and Nuclear Chemistry 46 (1978), 247–253.
125
General conclusion
The aim of this thesis was to provide information for better understanding the
extraction process of metal cations by cationic amphiphiles and especially with a
cetylpyridinium surfactant in chloride or nitrate form, a process described by
Heckmann et al. almost 30 years ago. For this purpose, this surfactant system was
investigated using a physico-chemical approach.
A first step consisted in characterising the pure surfactants in their
corresponding acid solutions, namely CPC in HCl, CPN in HNO3 and CP2Ox in H2Ox,
respectively. We determined micellisation parameters like the critical micellar
concentration (cmc) and the solubility temperature (Krafft temperature, TK) as well as
structural parameters of the aggregates, including their radius, their aggregation
numbers and the corresponding surface area per polar head. TK is found to be much
higher for CP2Ox than for CPC and CPN, while the inverse tendency was observed
and measured for the cmc; the latter increases in the series CP2Ox < CPN < CPC.
These rather surprising results indicate that CP2Ox behaves more like a double-chain
surfactant than a single-chain surfactant. We explain this by the fact that oxalate
counterions bridge two cetylpyridinium head groups but without influencing too much
the curvature of the aggregates. Despite the differences between the three
surfactants, at first approximation spherical aggregates are the preferred aggregation
form for the three surfactants at low ionic strength (< 0.01 M), but at higher ionic
strength (> 0.01 M), CPN undergoes a sphere-to-rod transition, while CPC and
CP2Ox aggregates remain spherical. This proves that different interactions between
the aggregates and the counterions take place. The results for nitrate are explained
by an adsorption of the chaotropic nitrate within the micellar interface, while the
kosmotropic chloride interacts less strongly with the micelle. These results go hand in
hand with the position of the anion within the Hofmeister series. Oxalate can be
regarded as kosmotrope, too, as we find a spherical geometry of the CP2Ox
aggregates; this clearly proves that there is no adsorption of oxalate at the micellar
interface and that the interactions are purely of electrostatic nature.
Moreover, the results for CPC and CPN could be described by a free energy
model, which successfully discriminates between the interaction of chloride and
nitrate concerning the micellar surface. The equilibrium head group surface area of
126
CPC was determined with 1.04 nm2, which is about 20 percent higher than the value
determined by SANS, while the smaller head group area for CPN (0.75 nm2), due to
nitrate adsorption, is very close to the experimentally determined value at 0.71 nm2.
The second step consisted in studying the effect of the monovalent cations of
the alkaline series on the micellisation properties, before analysing the influence of
multivalent cations in the system. We have shown that alkaline chloride salts affect
surfactant aggregation of both cetylpyridinium chloride and nitrate only slightly.
Spherical micelles of similar size and weight were determined in all cases for CPC,
whatever alkaline metal used. Nitrate salts, however, lead to sphere-to-cylinders
formation at sufficiently high ionic strength (> 0.01 M). This is again interpreted in
terms of counterion adsorption of the more hydrophobic nitrate ion at the micellar
surface, leading to a decrease of the surface area per head group and resulting in a
denser packing towards cylindrical geometry. Moreover, CsNO3 was shown to adsorb
at the micellar interface in concentrated CsNO3 solutions (1 M) in form of ion pairs, as
evidenced by the presence of a second minimum in the corresponding SAXS
analyses. This minimum has been fit best by including a Cs+NO3- ion pair into the
micellar shell. With this exception of Cs+, the alkaline cations have only a weak effect
on the aggregates’ geometry and on micellisation parameters of cetylpyridinium.
In the last part of this work, we have studied the influence of multivalent cations
on the extraction system cetylpyridinium in acidic solutions, based on the work of
Heckmann et al. in the 80’s. By the variation of different physico-chemical parameters
we tried to give more detailed explanations of the separation mechanism and provide
more details concerning the influence of the aggregates structure, the ionic strength
and the counterion in the extraction process.
Our studies confirm the results of Heckmann and it was concluded that the
metal needs to form anionic complexes with the counterions in order to interact with
the cationic surfactant; this complexation of the metal depends strongly on the ionic
strength, and allows therefore considering a selective extraction of metals, when the
appropriate conditions are chosen. We have found these conditions for the metals
zinc and uranium in 1 M hydrochloric acid, and for the metals uranium and thorium in
nitric acid solutions at 1 M concentration or higher. We can conclude that there exists
no simple correlation between the Krafft temperature of the metal-surfactant
complexes and metal extraction. Indeed, we have also determined a metal
separation in samples containing UO22+ and Th4+ in 1 M HNO3, which did not show
127
an increase of TK. A possible explanation for this result is the formation of
monovalent anionic metal complexes (UO2(NO3)3-, Th(NO3)5
-) in vicinity to the
micellar interface and their consecutive adsorption. In this case, however, the
solubility is not reduced as strongly as it is for the adsorption of divalent metal
complexes on the micelle. This latter point explains the high Krafft temperatures
found for Cp2[UO2Cl4] (about 85 °C) and for Cp 2[Th(NO3)6] complexes (> 95 °C).
Furthermore, it was shown that a five-fold excess of surfactant is sufficient to
completely precipitate the anionic metal complex, which confirms the results of
Heckmann determined for the precipitation of UO22+ in chloride solutions, who stated
the need of a 1 to 10-fold molar excess. These precipitates have been found to form
highly structured condensed mesophases and to partially keep the structure they had
in solution, like the cylindrical micelles of CPC with adsorbed [Zn(Cl)4]2- complexes
[CP4Cl2]2+·[Zn(Cl)4]
2- which are organised in a hexagonal phase. The latter was found
to undergo a hexagonal-to-lamellar phase transition, which indicates that precipitated
structure can be a metastable one. Another important factor concerning the
precipitation efficiency comes from the kinetics of the cool-down process and the
sample homogenisation, since we have shown that a too fast decrease below the
Krafft temperature of the surfactant does not lead to metal extraction.
Perspectives and Outlook
This study revealed the need for further work on this separation by precipitation
technique. A next step could be to address more profoundly the questions how the
precipitation kinetics influences the formation of a condensed phase in order to
control the structures formed. This would interest also future investigations with
regard to the use as precursors for new generation of nuclear fuel elements, as the
structured precipitates can be possibly transformed into mesoporous materials.
Another possible way to continue this work consists in extending the study to flotation
processes, because this surfactant is a very foaming agent which was also shown by
Heckmann in his first patent [1]. This could be a matter of concern in the uranium
mining and in order to recover actinides from leached ores. At the same time,
128
separation by flotation techniques might be reconsidered as recycling techniques in
terms of a sustainable nuclear fuel cycle.
But not only nuclear applications come into mind; this precipitation technique
can be widely used in applications that need to separate metals from aqueous
solutions, like the decontamination of water from heavy metals. Metals like gold that
form anionic complexes in water could be easily separated from the solution.
Finally, it would be interesting to improve the free energy model used to
distinguish between “adsorption” and “association” of the counterions with respect to
the surfactant. This model could be extended by accounting more precisely for the
“lyotropy” of the anions. This could be possibly achieved by introducing a lyotropic
parameter (according to the lyotropic number) which considers the specific
interaction between pairs of anions and surfactant head groups. A further
improvement could consist in adapting the model for divalent counter-anions. For
multivalent cations, however, this approach is not really sensible, because it is the
complex formed by the cation, which has to be considered and not the cation alone.
References
[1] HECKMANN, K. AND SPURNY, J.: "Process for the selective separation of uranium from accompanying metals", United States Patent 4,486,392. Dec 4, 1984.
(http://www.freepatentsonline.com/4486392.html)
Annexe A – Experimental and Techniques
129
Annexe A – Experimental and techniques
A.1 Techniques: theory and experimental procedures
A.1.1 Infra-red (IR) spectroscopy
Infra-red (IR) spectroscopy is an analysis technique in which a substance is
irradiated with light of a wavelength between 800 and 106 nm. IR spectroscopy is
subdivided into-near IR which extends from 800 nm (12500 cm-1) to 2500 nm (4000
cm-1), the mid-IR region from 2500 nm (4000 cm-1) to 25000 nm (400 cm-1) and the
far-IR region from 25000 nm (400 cm-1) to 106 nm (10 cm-1). Here, only the near-IR
region is important, because the energy window is useful in order to see
characteristic vibrations of organic compounds, especially functional groups [1].
Vibrations of the molecule can be subdivided in different type of oscillations like
stretching, bending, wagging, rocking and twisting, respectively. In order to interact
with incident radiation (IR-active), the substance needs an electric dipole moment
(induced or permanent). If the oscillation is symmetric to the centre of symmetry, the
substance is IR-inactive.
Normally, an IR spectrum is given as a diagram of the transmission as a
function of the wave number (in cm-1). The intensity of the bands is proportional to
the concentration of the components in the sample. This relation is expressed in the
Lambert-Beer-Law [2] as:
dcI
IA T ⋅⋅=��
�
����
�−= λλ ε
0
log , (Equation–A.1)
where Aλ stands for the absorbance at a specific wavelength λ, IT and I0 for the
transmitted and incident intensity of the light, respectively, ελ the molar absorption
coefficient, c the concentration of the sample and d its thickness.
Mainly two types of mid-IR spectrometers are available today, dispersive and
Fourier-Transform IR spectrometers. The latter have significant advantages, like the
simultaneous measurement of radiation from all wavelengths resulting in shorter
Annexe A – Experimental and Techniques
130
measurement times and higher sensitivity, whereas dispersive spectrometers
measure all wavelengths consecutively [1]. Concerning the measurement
techniques, we used the attenuated total reflectance (ATR) technique [3], which
allows to measure samples directly, independent of the samples state (gas, liquid
and solid). This technique bases on the total reflection of a beam when it comes in
contact with a sample. When the IR-beam enters an optical dense crystal (high
refractive index), an evanescent wave is created, which protrudes only a few µm
beyond the surface into the sample. In IR-regions where the sample absorbs energy,
the evanescent wave will be attenuated or altered, which is observable in the IR-
spectrum.
Experimental setup: Infrared spectroscopy was carried out with a Perkin-
Elmer Spectrum 100 FT-IR spectrometer equipped with the Universal ATR
(attenuated total reflection) Sampling Accessory. The spectrum of the dried
surfactant powders have been recorded in the mid IR (400 and 4000 cm-1) region
with a count rate of 0.25 cm-1.
A.1.2 Krafft temperature measurements
A definition of the Krafft temperature (TK) was given in Chapter I – Bibliographic
introduction 1.2. For this reason, only the experimental procedure is explained in the
following.
Experimental setup: The Krafft temperatures have been measured by
observing the gradual heating of the samples visually in a thermostatic Julabo MB-
5M bath (see figure–A.1) beginning from 4 °C up to complete dissolution of CP
crystals. The heating steps have been 0.5 °C with 1 0 min equilibration time at each
temperature. In addition to the measurement of integrated temperature sensor
(accuracy 0.1 °C) the temperature was controlled wi th a glass thermometer
(accuracy of 0.2 °C), especially as the thermostati c bath is not certified to control the
temperature below 20 °C. The samples have been not stirred during the heating
process.
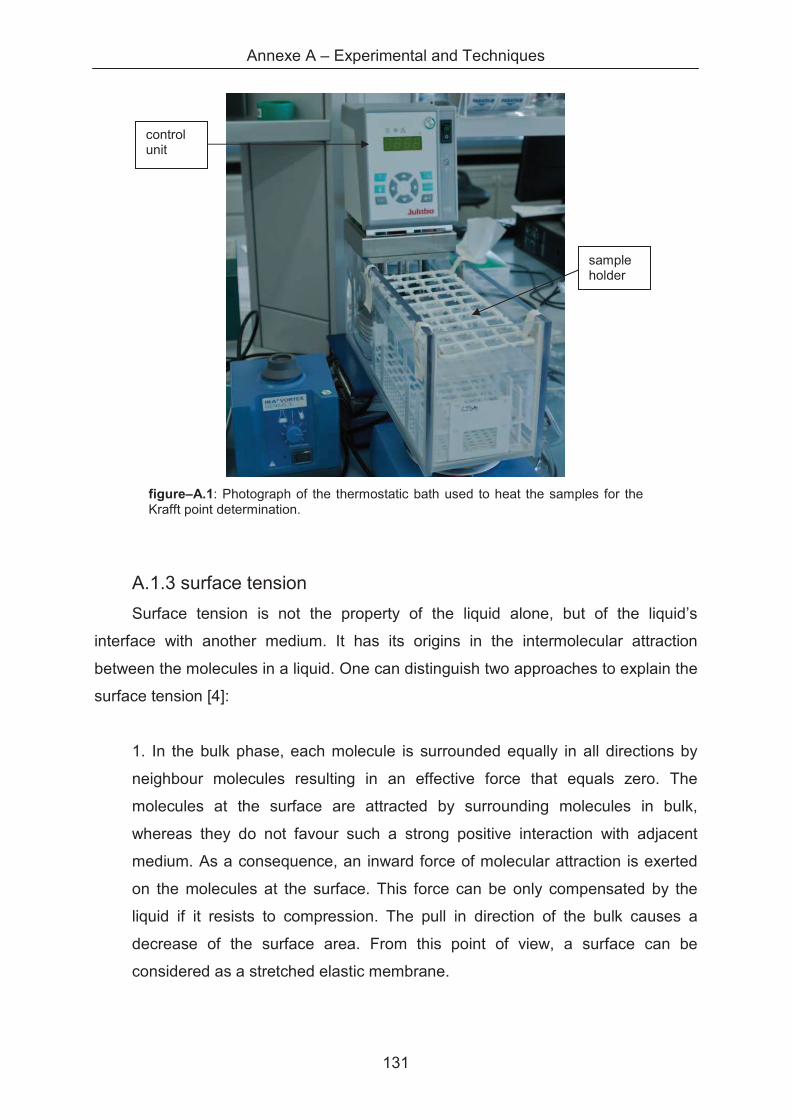
Annexe A – Experimental and Techniques
131
figure–A.1: Photograph of the thermostatic bath used to heat the samples for the Krafft point determination.
A.1.3 surface tension
Surface tension is not the property of the liquid alone, but of the liquid’s
interface with another medium. It has its origins in the intermolecular attraction
between the molecules in a liquid. One can distinguish two approaches to explain the
surface tension [4]:
1. In the bulk phase, each molecule is surrounded equally in all directions by
neighbour molecules resulting in an effective force that equals zero. The
molecules at the surface are attracted by surrounding molecules in bulk,
whereas they do not favour such a strong positive interaction with adjacent
medium. As a consequence, an inward force of molecular attraction is exerted
on the molecules at the surface. This force can be only compensated by the
liquid if it resists to compression. The pull in direction of the bulk causes a
decrease of the surface area. From this point of view, a surface can be
considered as a stretched elastic membrane.
sample holder
control unit
Annexe A – Experimental and Techniques
132
2. When focusing on energetic considerations, it can be assumed that every
molecule that is not surrounded by the same kind of molecules is in a higher
state of energy. While bulk molecules are surrounded by as many molecules of
the same kind as possible, the surface molecules have fewer neighbours and
are thus in a higher state of energy. In order to decrease the free energy, the
liquid decreases the number of surface molecules to a minimum resulting in a
minimisation of its surface area [5].
Thus, the surface tension tends to make a medium adopt the shape with
smallest surface area possible. When no forces act between two surfaces, the
surface is a flat plane. As soon as a difference in surface pressure is encountered
between bordering media, a force results which is proportional to the surface area
time the pressure difference. The surface tension balances this force leading to a
curvature. The Young-Laplace equation
RRRp
γγ
211
21
=���
����
�+=∆ (Equation–A.2)
describes the equilibrium state of the considerations mentioned above, with R1 and
R2 being the radii of curvature in the axis parallel to the surface. By solving this
equation, the shape of menisci, soap bubbles or water droplets can be described.
Experimental Setup: Surface tension measurements have been carried out
with a Krüss DSA 100 tensiometer. Hamilton 1750 TLL syringes (500 µL) have been
used with Krüss steel needles of known diameter (1.494 to 2.090 mm). The samples
of CPC and CPN have been equilibrated one day at room temperature (about 25 °C)
and those containing CP2Ox at 55°C for 3 hours before the measurement. All
equipment in contact with the samples has been cleaned with ethanol and thoroughly
rinsed with ultrapure water.
About 400 µL of the sample solution was filled into the syringe, which in turn
was fixed in the tensiometer. The surface tension of pure water was measured at the
beginning of each series to check reproducibility of the measurements. Values
between 72.3 and 73.1 mN·m-1 are obtained and are in good agreement with the
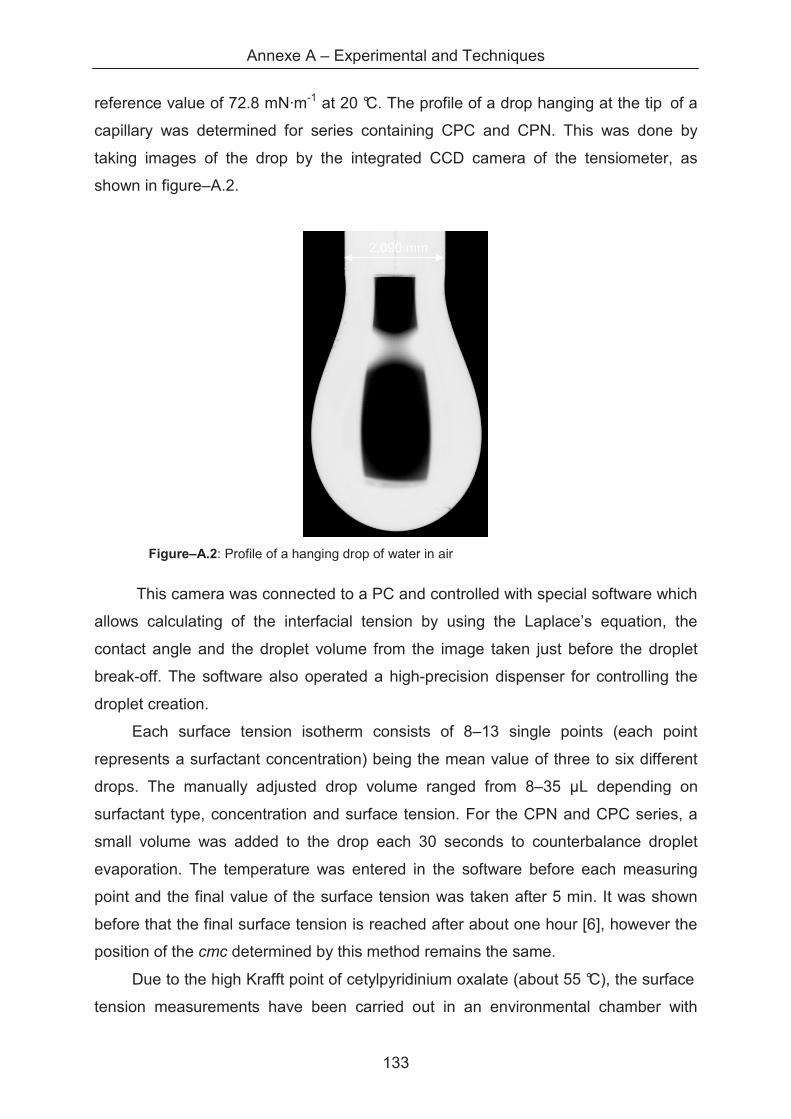
Annexe A – Experimental and Techniques
133
reference value of 72.8 mN·m-1 at 20 °C. The profile of a drop hanging at the tip of a
capillary was determined for series containing CPC and CPN. This was done by
taking images of the drop by the integrated CCD camera of the tensiometer, as
shown in figure–A.2.
Figure–A.2: Profile of a hanging drop of water in air
This camera was connected to a PC and controlled with special software which
allows calculating of the interfacial tension by using the Laplace’s equation, the
contact angle and the droplet volume from the image taken just before the droplet
break-off. The software also operated a high-precision dispenser for controlling the
droplet creation.
Each surface tension isotherm consists of 8–13 single points (each point
represents a surfactant concentration) being the mean value of three to six different
drops. The manually adjusted drop volume ranged from 8–35 µL depending on
surfactant type, concentration and surface tension. For the CPN and CPC series, a
small volume was added to the drop each 30 seconds to counterbalance droplet
evaporation. The temperature was entered in the software before each measuring
point and the final value of the surface tension was taken after 5 min. It was shown
before that the final surface tension is reached after about one hour [6], however the
position of the cmc determined by this method remains the same.
Due to the high Krafft point of cetylpyridinium oxalate (about 55 °C), the surface
tension measurements have been carried out in an environmental chamber with
2.090 mm
Annexe A – Experimental and Techniques
134
temperature (TC-40) and humidity (HC-10) control. The temperature chamber was
equipped with a Peltier element which was cooled by an external thermostatic bath.
A metal cover with two side windows was fixed over the Peltier element for reducing
the volume of the chamber and a temperature sensor was fixed inside. Contrary to
the top -> bottom arrangement, a bottom -> top system was chosen for CP2Ox,
consisting of a small glass cube filled with the surfactant solution, in which an air
bubble was created. Thus, droplet evaporation could be effectively avoided and by
inserting small vessel filled with water, sample evaporation was slowed down
considerably, as even after one hour at 55 °C only five per cent of the sample volume
had evaporated. Condensation of humidity at the glass windows was prevented by a
flow of dry and oil-free air at the walls of the chamber.
A.1.4 pH measurements
The pH is defined as )lg()lg( ++ ⋅−=−=HH
cfapH , where aH+ is the
dimensionless activity of the hydrogen ions, f the activity coefficient and cH+ the H+
concentration [7]. The pH is measured by an ion-selective electrode, which responds
to the hydrogen activity (combined glass electrode) [8]. The potential difference
potential E between an electrode sensitive to aH+ and a reference electrode (HgCl or
AgCl electrode) is measured and related in form of the Nernst equation:
)ln(0+⋅+=
Ha
zF
RTEE (Equation–A.3)
where E0 is the standard potential for an activity = 1, R is the molar gas constant, T is
the absolute temperature, z is the number of electrons participating in the reaction
and F is the Faraday constant [9]. As the hydrogen activity cannot be measured
directly, the electrode is calibrated with solutions of known pH values. Equation (2)
can be written as
FRT
EEpH
/303.2
0
⋅
−= . (Equation–A.4)
Annexe A – Experimental and Techniques
135
Experimental setup: the pH was measured by a Metrohm 781 pH/ion meter
with a Metrohm 6.0234.100 glass electrode (pH 0 – 14, 0 – 80 °C) stored in 3 M KCl.
The calibration was carried out with two solutions of known pH (4.00 ± 0.02, 7.00 ±
0.02 at 25 °C) at the required measurement temperat ure of 35 °C for CPC, CPN and
55 °C for CP 2Ox respectively. The samples have been equilibrated at least 10
minutes under stirring before recording the pH value. Every sample was at least
measured twice in order to check reproducibility of the measurement.
A.1.5 Scattering techniques
Scattering techniques represent very powerful methods to characterise size and
shape of particles in solution. Compared to other techniques like microscopy, they
are non-invasive and yield physical quantities such as specific surface or particle
volume averaged over the whole sample. In the following we will distinguish between
different radiations such as light, X-rays and neutrons as each one have its own
properties depending on how it interacts with matter [10]. The scattering of light is
due to fluctuations of the refractive indices while X-ray scattering originates from the
differences in the electron density of the sample. In contrast, neutrons are scattered
by atomic nuclei. These differences in interaction with the sample make the three
techniques very complementary [11]. They share some common principles of
scattering which are presented in the following.
A.1.5.1 Light scattering
Light can be described as an oscillating electromagnetic wave and when
impinging on a sample, it can interact with it by absorption or scattering [12]. In the
case of no interaction, the light is transmitted through the substance. We will only
focus on the case of scattering, as it is of interest in this study. It is a combination of
light absorption and re-emission. Light scattering is due to fluctuations of the optical
properties of a sample, mainly based on differences of the index of refraction of a
species from its surrounding solvent, which is also the case for the surfactant
solutions investigated in this work. Light scattering can be further divided in two
techniques, dynamic and static light scattering.
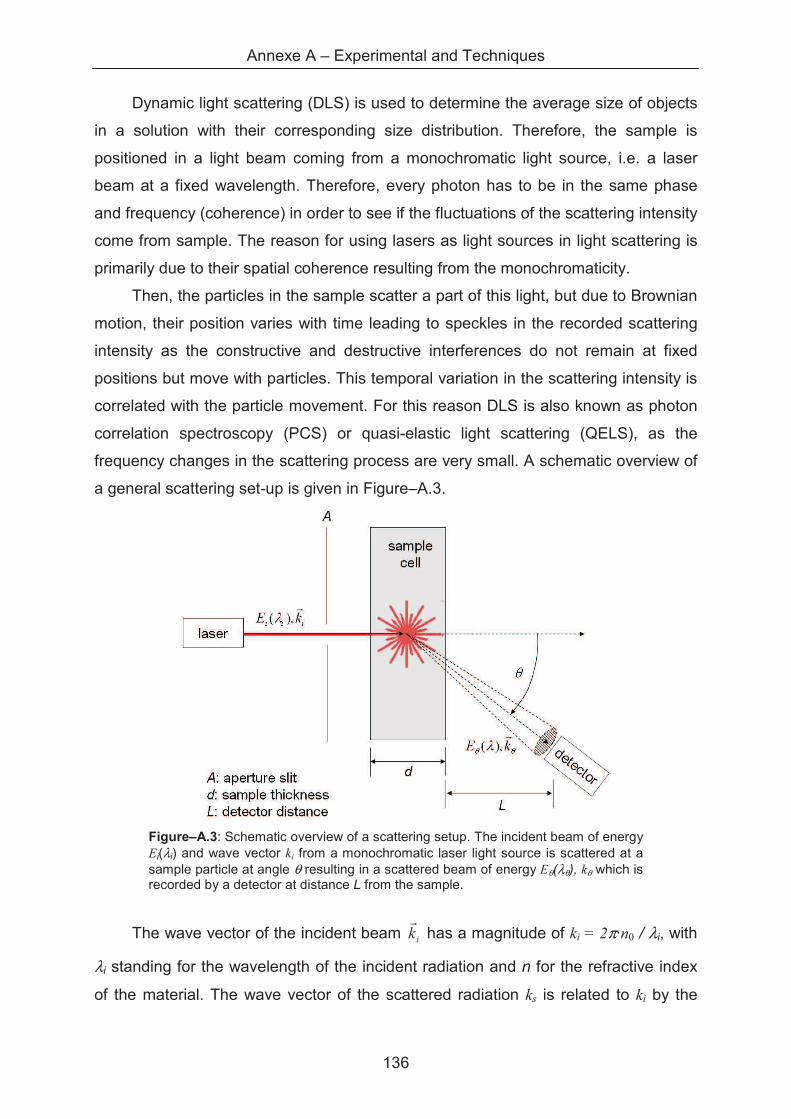
Annexe A – Experimental and Techniques
136
Dynamic light scattering (DLS) is used to determine the average size of objects
in a solution with their corresponding size distribution. Therefore, the sample is
positioned in a light beam coming from a monochromatic light source, i.e. a laser
beam at a fixed wavelength. Therefore, every photon has to be in the same phase
and frequency (coherence) in order to see if the fluctuations of the scattering intensity
come from sample. The reason for using lasers as light sources in light scattering is
primarily due to their spatial coherence resulting from the monochromaticity.
Then, the particles in the sample scatter a part of this light, but due to Brownian
motion, their position varies with time leading to speckles in the recorded scattering
intensity as the constructive and destructive interferences do not remain at fixed
positions but move with particles. This temporal variation in the scattering intensity is
correlated with the particle movement. For this reason DLS is also known as photon
correlation spectroscopy (PCS) or quasi-elastic light scattering (QELS), as the
frequency changes in the scattering process are very small. A schematic overview of
a general scattering set-up is given in Figure–A.3.
Figure–A.3: Schematic overview of a scattering setup. The incident beam of energy Ei(λi) and wave vector ki from a monochromatic laser light source is scattered at a sample particle at angle θ resulting in a scattered beam of energy Eθ(λθ), kθ which is recorded by a detector at distance L from the sample.
The wave vector of the incident beam ik�
has a magnitude of ki = 2π·n0 / λi, with
λi standing for the wavelength of the incident radiation and n for the refractive index
of the material. The wave vector of the scattered radiation ks is related to ki by the
Annexe A – Experimental and Techniques
137
scattering vector si kkQ���
−= , which is a more convenient parameter to compare
results from different setups varying in detector distance, wavelengths and different
angles. Q�
is defined as
��
���
�⋅=
2sin
4
0
0 θ
λ
π nQ�
. (Equation–A.4)
As mentioned above, changes in the frequency of incident light to scattered light are
very small in dynamic light scattering, the scattering process is quasi-elastic, we can
thus set is kk��
= . As the particles are moving constantly due to Brownian motion, they
change their position with time and the scattering (speckle) pattern will change from
one configuration to another. When comparing the scattering of one sample
configuration at a certain time t with the scattering at the next configuration at t+∆t,
one can establish a correlation between the two signals by the correlation function
written as
( ) ( )( ) ( )
( ) 2
2,,
,QI
tQItQItQg
τ∆+⋅= . (Equation–A.5)
Equation (A-5) can be related to the normalised correlation function of the scattered
light g(1)(Q,t) by the Siegert relationship as:
( ) ( ) ( ) ( )[ ]222 ,1, tQgtQg β+= . (Equation–A.6)
where � is a spatial coherence factor depending on the geometry of the detection
system. In a monodisperse solution of spherical particles the decay of the correlation
function with time follows the relationship
( ) ( ) ( )ttQg Γ−= exp,1 (Equation–A.7)
where the decay rate Γ is defined as
Annexe A – Experimental and Techniques
138
DQ 2=Γ . (Equation–A.8)
In the latter equation, D stands for the diffusion coefficient which is, in turn, linked to
the hydrodynamic radius rL by the Stokes-Einstein equation
( )QSr
TkD
L
B ⋅=ηπ6
, (Equation–A.9)
where kB means the Boltzmann constant, T the absolute temperature in Kelvin, η the
sample viscosity and rL the hydrodynamic radius of the diffusing particle. S(Q) is the
structure factor and accounts for the influence of interactions between the particles
on D. In the case of dilute surfactant solutions with sufficiently high concentration of
background salt, interactions are screened out and we can consider S(Q) = 1. It is
thus possible to determine the particle size by accurately performed light scattering
measurements. Furthermore, the polydispersity index (PDI) can be deduced from the
scattering experiment. One approach which was also used in this work consists in a
cumulant analysis by expanding the correlation function as follows:
( ) ( ) ( ) ��
���
�+−+⋅Γ−= �
33221
!3!21exp, ttttQg
µµ (Equation–A.10)
in which the cumulants µ2 = µ3, Γ are obtained by least square techniques. The first
cumulant provides the apparent hydrodynamic radius as explained above while the
second cumulant µ2/Γ2 contains information about the polydispersity of the sample.
This type of analysis can be applied in case of a narrow size distribution of objects in
solution; for more concentrated and polydisperse sample, inverse Laplace
transformation and related methods (CONTIN analysis) or the maximum entropy
method are better suited for evaluation. In general, the polydispersity index can be
classified as shown in table–A.1.
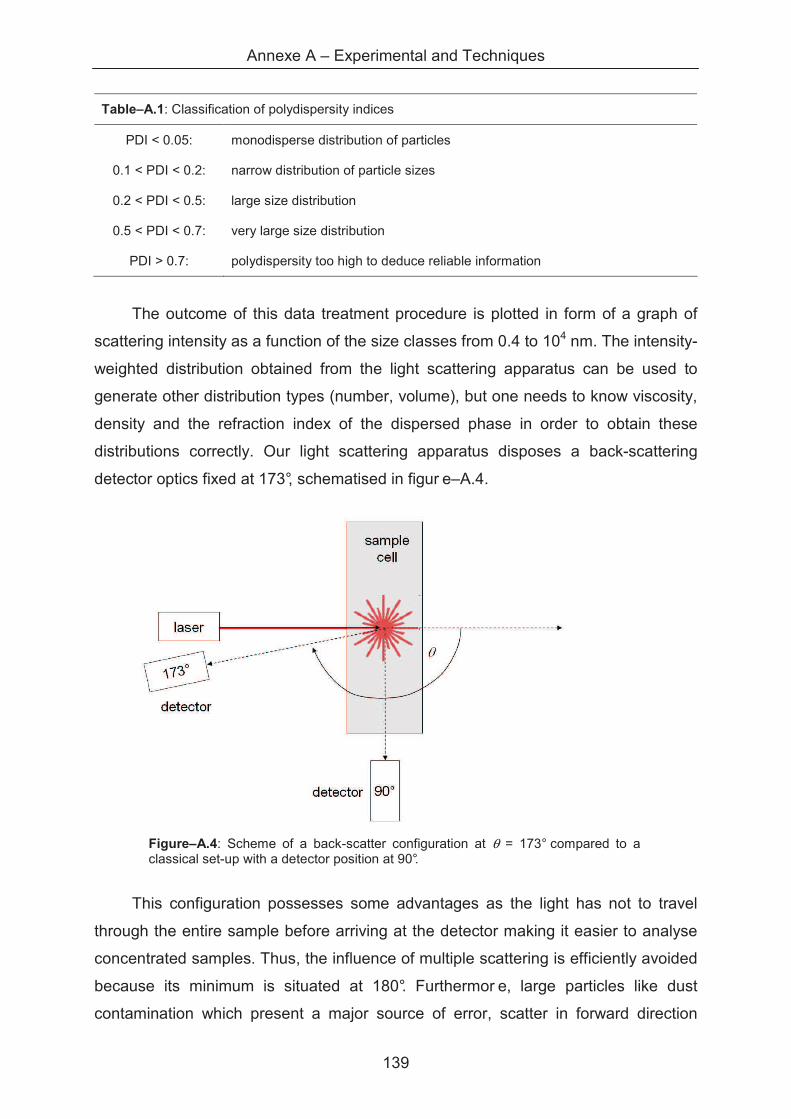
Annexe A – Experimental and Techniques
139
Table–A.1: Classification of polydispersity indices
PDI < 0.05: monodisperse distribution of particles
0.1 < PDI < 0.2: narrow distribution of particle sizes
0.2 < PDI < 0.5: large size distribution
0.5 < PDI < 0.7: very large size distribution
PDI > 0.7: polydispersity too high to deduce reliable information
The outcome of this data treatment procedure is plotted in form of a graph of
scattering intensity as a function of the size classes from 0.4 to 104 nm. The intensity-
weighted distribution obtained from the light scattering apparatus can be used to
generate other distribution types (number, volume), but one needs to know viscosity,
density and the refraction index of the dispersed phase in order to obtain these
distributions correctly. Our light scattering apparatus disposes a back-scattering
detector optics fixed at 173°, schematised in figur e–A.4.
Figure–A.4: Scheme of a back-scatter configuration at θ = 173° compared to a classical set-up with a detector position at 90°.
This configuration possesses some advantages as the light has not to travel
through the entire sample before arriving at the detector making it easier to analyse
concentrated samples. Thus, the influence of multiple scattering is efficiently avoided
because its minimum is situated at 180°. Furthermor e, large particles like dust
contamination which present a major source of error, scatter in forward direction
Annexe A – Experimental and Techniques
140
which is why their contribution to scattering is reduced significantly by using back-
scatterer optics.
Another way to gather information of the light scattered by sample is performed
by the static light scattering (SLS). In contrast to DLS where the time-dependent
fluctuations of the scattering intensity are measured and correlated, SLS measures
the scattered intensity at a certain angle. When using a goniometer set-up, one is
able to adjust different measuring angles consecutively, which allows to obtain
information about the molecular weight and the radius of gyration of the objects in the
sample, making SLS a complementary technique to DLS. However, our light
scattering apparatus is not equipped with goniometer, and the scattering intensity is
measured at 90°. The total scattering intensity rec orded consists of scattering
contributions from the cell walls, the solvent and the sample. It is hence necessary to
subtract the solvent only scattering in order to obtain the net sample scattering. For a
suspension of particles, the scattering intensity I(Q) can be given in form of a general
expression as [13]
)()()( QSQPKQI ⋅⋅= , (Equation–A.11)
where K stands for a constant which depends on the optical properties of the
samples for light scattering, P(Q) is the form factor and S(Q) the structure factor. The
latter has the same signification as above. P(Q) contains information about the
particle size and shape as a function of the scattering angle, and given exemplary in
the following graph for hard spheres and cylinders (figure–A.5). Form factors for
different geometries are given here [11]. Depending on wavelength used in the light
scattering set-up, the accessible Q-range allows detecting particle sizes from 100 nm
to about 10000 nm. If the sample contains particles which are much smaller than this
size window, which is the case for small spherical surfactant micelles, the form factor
is not detected and set to 1. The structure factor incorporates information of particle-
particle interaction.
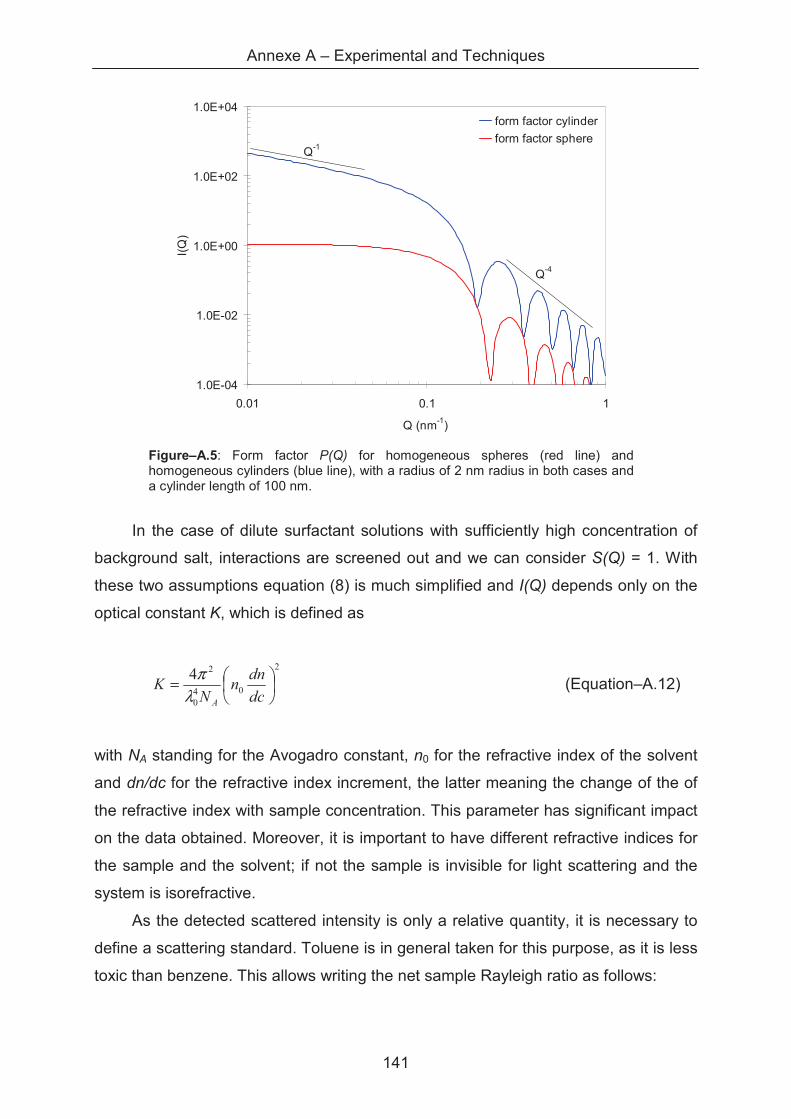
Annexe A – Experimental and Techniques
141
1.0E-04
1.0E-02
1.0E+00
1.0E+02
1.0E+04
0.01 0.1 1
Q (nm-1)
I(Q
)
form factor cylinder
form factor sphereQ-1
Q-4
Figure–A.5: Form factor P(Q) for homogeneous spheres (red line) and homogeneous cylinders (blue line), with a radius of 2 nm radius in both cases and a cylinder length of 100 nm.
In the case of dilute surfactant solutions with sufficiently high concentration of
background salt, interactions are screened out and we can consider S(Q) = 1. With
these two assumptions equation (8) is much simplified and I(Q) depends only on the
optical constant K, which is defined as
2
04
0
24��
���
�=
dc
dnn
NK
Aλ
π (Equation–A.12)
with NA standing for the Avogadro constant, n0 for the refractive index of the solvent
and dn/dc for the refractive index increment, the latter meaning the change of the of
the refractive index with sample concentration. This parameter has significant impact
on the data obtained. Moreover, it is important to have different refractive indices for
the sample and the solvent; if not the sample is invisible for light scattering and the
system is isorefractive.
As the detected scattered intensity is only a relative quantity, it is necessary to
define a scattering standard. Toluene is in general taken for this purpose, as it is less
toxic than benzene. This allows writing the net sample Rayleigh ratio as follows:
Annexe A – Experimental and Techniques
142
( )McKR
nI
nIIR T
TT
=−
=2
2
00θ . (Equation–A.13)
Where I0 stands for the solvent only scattering, IT, RT, nT for the scattering intensity,
Rayleigh ratio and refractive index of toluene, respectively, and M is the molecular
weight of the sample particles. Another expression of the Rayleigh ratio allows
relating to the osmotic pressure with the molecular mass by Π = cRT / M, and by
applying a virial extension of solution osmotic pressure, we obtain the Rayleigh
equation:
cAMR
cmccK22
1)(+=
−⋅
θ
(Equation–A.14)
When now measuring a sample at different concentrations, one is able to extract the
molecular weight M by plotting the left side of equation–A.14 as function of the
concentration, which is known as the Debye plot technique [14]. When the light
scattering set-up is equipped with a goniometer, different measuring angles can be
selected which allows determining the influence of the scattering angle on the form
factor and obtaining information about the particle size. In this case the results are
often given in form of the Zimm plot. This technique is of interest, when particle sizes
exceed the limit r > λ0/20, as bigger particles scatter stronger in forward direction and
the scattering intensity depends on the measuring angle.
Experimental setup: Static and dynamic light scattering (SLS and DLS)
measurements have been carried out using a Malvern ZEN3600 Zetasizer Nano ZS
apparatus at a fixed angle (173°, backscatterer). T he wavelength of the 4 mW HeNe
laser was 633 nm. The device allows conducting DLS and SLS measurements one
after another while keeping the sample at the same position. The detectable particle
sizes range from 0.6 nm to 6 µm and the molecular weight from 103 – 107 Daltons.
Prior to each measurements, the samples have been heated in a thermostatic
bath for 15 minutes at 35 °C (CPC, CPN) or 60 °C (C P2Ox), before 60 µL solution
have been transferred into a 45 µL Quartz cell (Hellma) and sealed with a Teflon cap.
The slightly higher volume than necessary (60 µL) guaranteed proper cell windows,
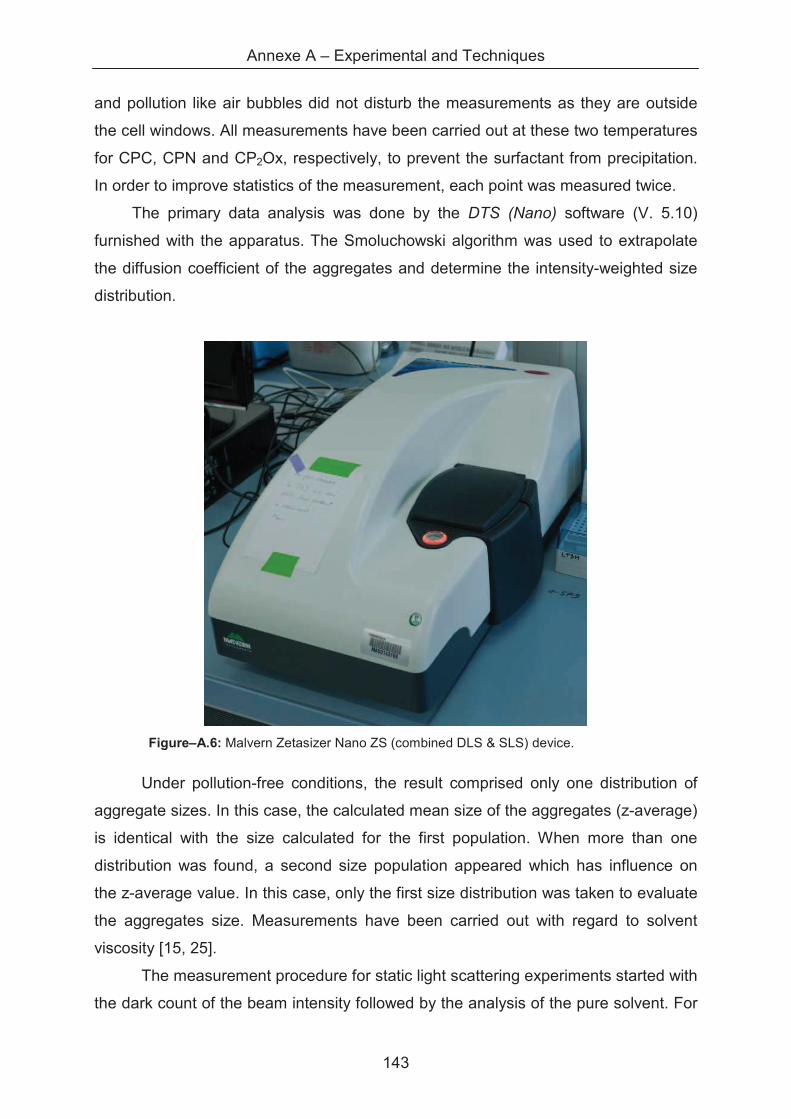
Annexe A – Experimental and Techniques
143
and pollution like air bubbles did not disturb the measurements as they are outside
the cell windows. All measurements have been carried out at these two temperatures
for CPC, CPN and CP2Ox, respectively, to prevent the surfactant from precipitation.
In order to improve statistics of the measurement, each point was measured twice.
The primary data analysis was done by the DTS (Nano) software (V. 5.10)
furnished with the apparatus. The Smoluchowski algorithm was used to extrapolate
the diffusion coefficient of the aggregates and determine the intensity-weighted size
distribution.
Figure–A.6: Malvern Zetasizer Nano ZS (combined DLS & SLS) device.
Under pollution-free conditions, the result comprised only one distribution of
aggregate sizes. In this case, the calculated mean size of the aggregates (z-average)
is identical with the size calculated for the first population. When more than one
distribution was found, a second size population appeared which has influence on
the z-average value. In this case, only the first size distribution was taken to evaluate
the aggregates size. Measurements have been carried out with regard to solvent
viscosity [15, 25].
The measurement procedure for static light scattering experiments started with
the dark count of the beam intensity followed by the analysis of the pure solvent. For
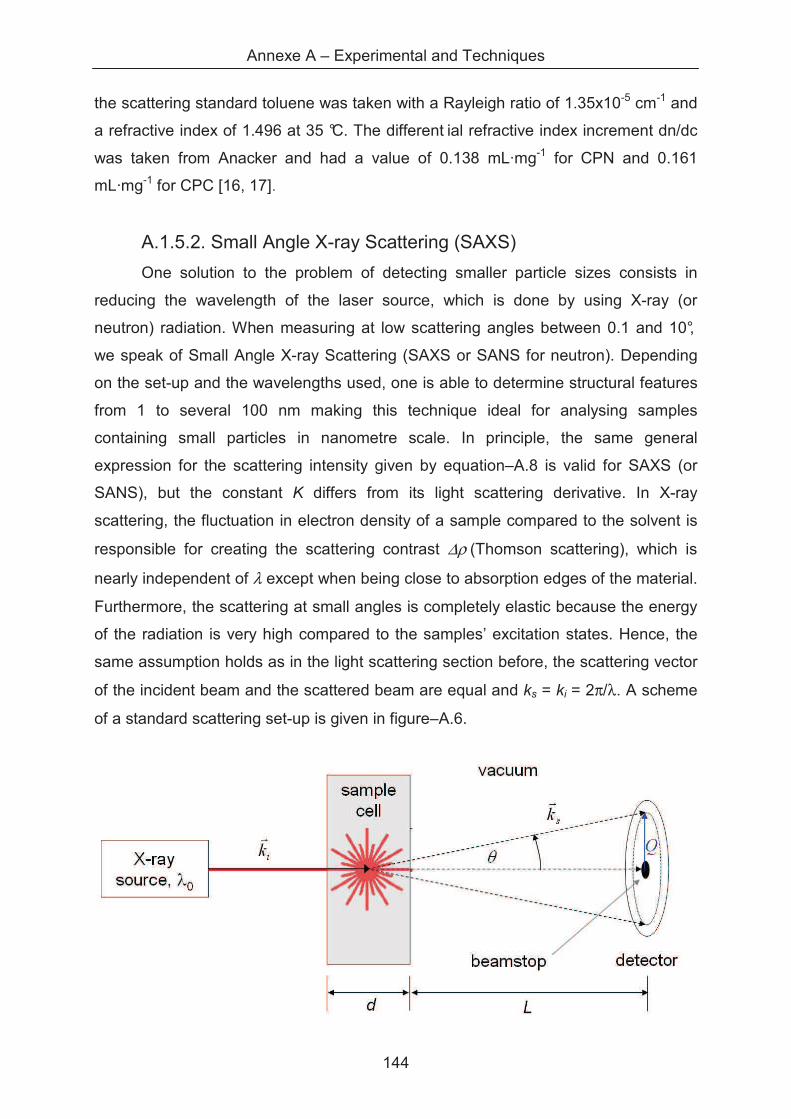
Annexe A – Experimental and Techniques
144
the scattering standard toluene was taken with a Rayleigh ratio of 1.35x10⁻⁵ cm-1 and
a refractive index of 1.496 at 35 °C. The different ial refractive index increment dn/dc
was taken from Anacker and had a value of 0.138 mL·mg-1 for CPN and 0.161
mL·mg-1 for CPC [16, 17].
A.1.5.2. Small Angle X-ray Scattering (SAXS)
One solution to the problem of detecting smaller particle sizes consists in
reducing the wavelength of the laser source, which is done by using X-ray (or
neutron) radiation. When measuring at low scattering angles between 0.1 and 10°,
we speak of Small Angle X-ray Scattering (SAXS or SANS for neutron). Depending
on the set-up and the wavelengths used, one is able to determine structural features
from 1 to several 100 nm making this technique ideal for analysing samples
containing small particles in nanometre scale. In principle, the same general
expression for the scattering intensity given by equation–A.8 is valid for SAXS (or
SANS), but the constant K differs from its light scattering derivative. In X-ray
scattering, the fluctuation in electron density of a sample compared to the solvent is
responsible for creating the scattering contrast ∆ρ (Thomson scattering), which is
nearly independent of λ except when being close to absorption edges of the material.
Furthermore, the scattering at small angles is completely elastic because the energy
of the radiation is very high compared to the samples’ excitation states. Hence, the
same assumption holds as in the light scattering section before, the scattering vector
of the incident beam and the scattered beam are equal and ks = ki = 2π/λ. A scheme
of a standard scattering set-up is given in figure–A.6.
Annexe A – Experimental and Techniques
145
Figure–A.7: schema of a SAXS or SANS set-up with the incident, scattered and transmitted beams, the sample of thickness d in distance L from the 2-D detector and the scattering vector Q.
The typical Q-range obtained can cover three orders of magnitude in the
reciprocal space, ranging from 0.01 – 6 nm-1 when using a synchrotron (or a neutron)
radiation source, which corresponds to real space dimensions of 600 nm down to 1
nm [11]. For laboratory setups, one orders of magnitude can be covered usually, e.g.
from 0.2 – 2.5 nm-1 but can be extended to larger Q-values (smaller dimensions)
when the experiments are carried out on a custom built instrument like the one we
used from XENOCS (Sassenage, France). When restating equation–A.8 and
substituting the optical constant K by a series of constants adapted for SAXS
scattering, we can write the sample scattering intensity as
)()()()( 2 QSQPVQI p ⋅⋅∆⋅⋅Φ= ρ (Equation–A.15)
where Φ denotes the volume fraction of the scatterer, Vp its volume, ∆ρ the scattering
contrast between the sample and the solvent and with the scattering vector Q defined
as Q = 4π/λ0·sin(θ/2). ρ, the scattering length density (SLD) can be calculated for a
given species as
e
W
AMe rM
Ndn=ρ , (Equation–A.16)
where ne is the number of electrons an MW the molecular mass of the molecule, dM
the density, NA the Avogadro constant and re the electron radius.
I(Q) is usually measured in absolute units (cm-1) [18, 19]. Similarly to light
scattering, the same assumptions hold for uncorrelated particles as explained before
and the S(Q) tends to 1. Then, the scattering intensity is given by the Guinier
approximation [20, 21]
( )3/exp)0()( 22QRIQI g−⋅≈ (Equation–A.17)
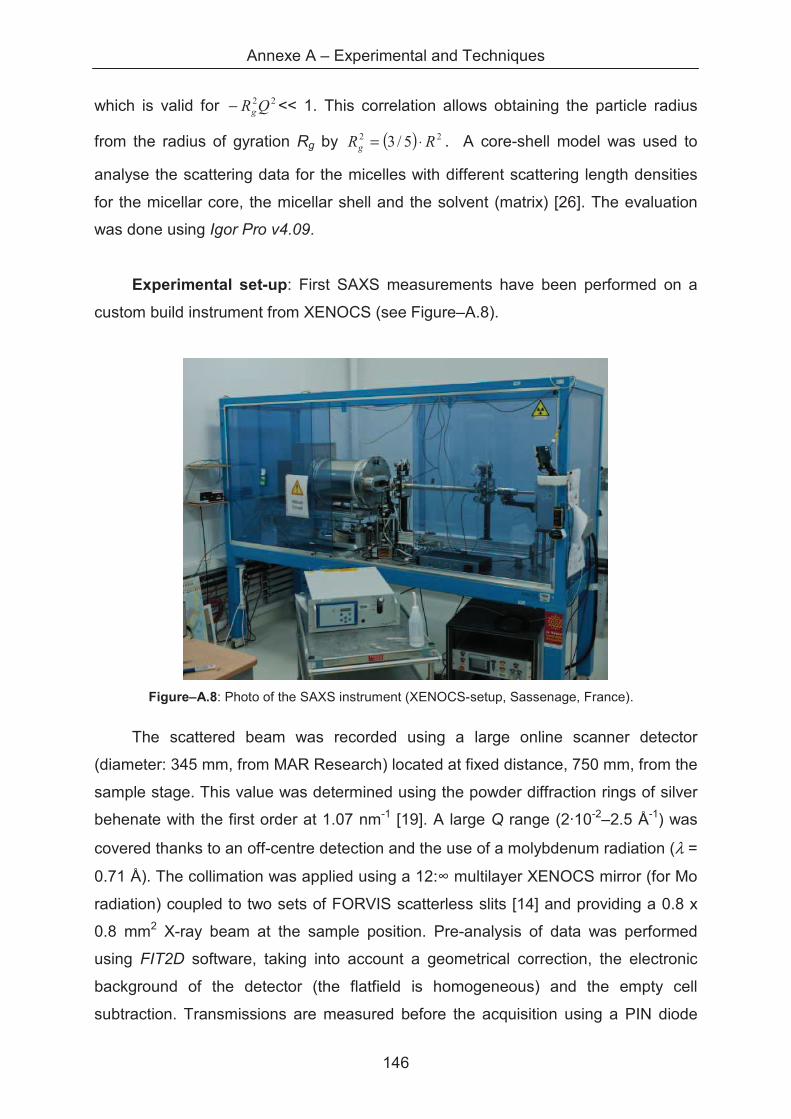
Annexe A – Experimental and Techniques
146
which is valid for 22QRg− << 1. This correlation allows obtaining the particle radius
from the radius of gyration Rg by ( ) 22 5/3 RRg ⋅= . A core-shell model was used to
analyse the scattering data for the micelles with different scattering length densities
for the micellar core, the micellar shell and the solvent (matrix) [26]. The evaluation
was done using Igor Pro v4.09.
Experimental set-up: First SAXS measurements have been performed on a
custom build instrument from XENOCS (see Figure–A.8).
Figure–A.8: Photo of the SAXS instrument (XENOCS-setup, Sassenage, France).
The scattered beam was recorded using a large online scanner detector
(diameter: 345 mm, from MAR Research) located at fixed distance, 750 mm, from the
sample stage. This value was determined using the powder diffraction rings of silver
behenate with the first order at 1.07 nm-1 [19]. A large Q range (2·10-2–2.5 Å-1) was
covered thanks to an off-centre detection and the use of a molybdenum radiation (λ =
0.71 Å). The collimation was applied using a 12:� multilayer XENOCS mirror (for Mo
radiation) coupled to two sets of FORVIS scatterless slits [14] and providing a 0.8 x
0.8 mm2 X-ray beam at the sample position. Pre-analysis of data was performed
using FIT2D software, taking into account a geometrical correction, the electronic
background of the detector (the flatfield is homogeneous) and the empty cell
subtraction. Transmissions are measured before the acquisition using a PIN diode
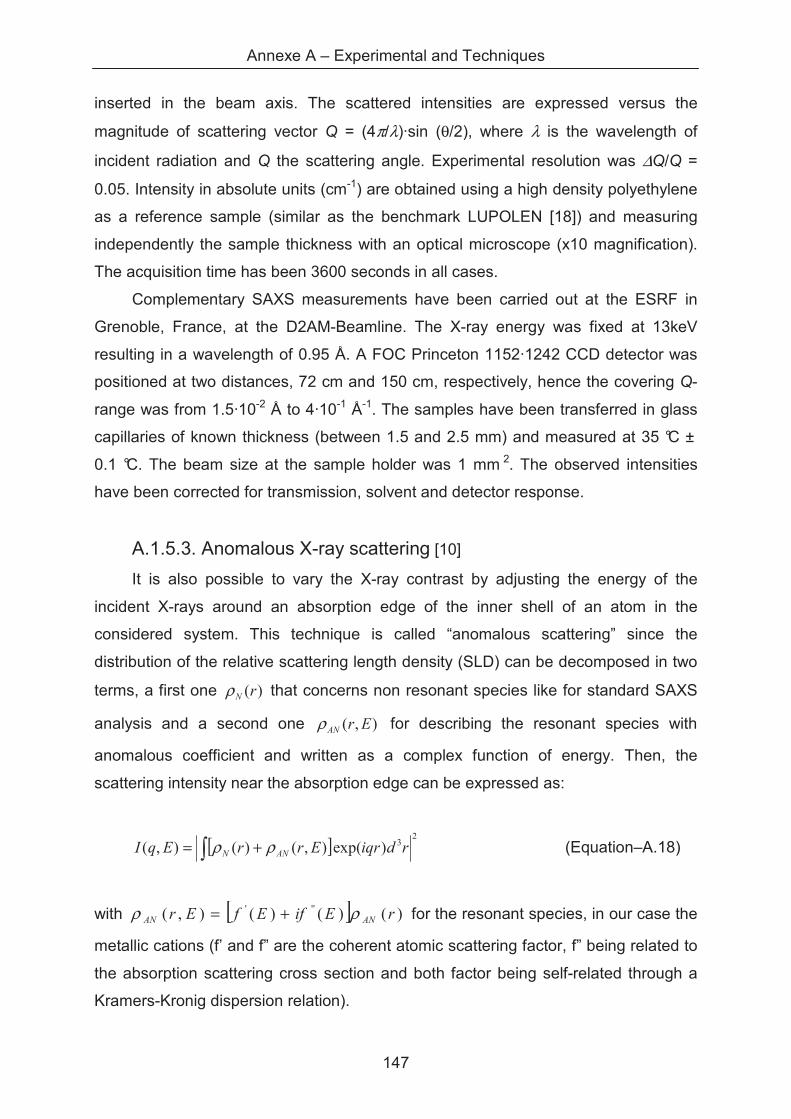
Annexe A – Experimental and Techniques
147
inserted in the beam axis. The scattered intensities are expressed versus the
magnitude of scattering vector Q = (4π/λ)·sin (θ/2), where λ is the wavelength of
incident radiation and Q the scattering angle. Experimental resolution was ∆Q/Q =
0.05. Intensity in absolute units (cm-1) are obtained using a high density polyethylene
as a reference sample (similar as the benchmark LUPOLEN [18]) and measuring
independently the sample thickness with an optical microscope (x10 magnification).
The acquisition time has been 3600 seconds in all cases.
Complementary SAXS measurements have been carried out at the ESRF in
Grenoble, France, at the D2AM-Beamline. The X-ray energy was fixed at 13keV
resulting in a wavelength of 0.95 Å. A FOC Princeton 1152·1242 CCD detector was
positioned at two distances, 72 cm and 150 cm, respectively, hence the covering Q-
range was from 1.5·10-2 Å to 4·10-1 Å-1. The samples have been transferred in glass
capillaries of known thickness (between 1.5 and 2.5 mm) and measured at 35 °C ±
0.1 °C. The beam size at the sample holder was 1 mm 2. The observed intensities
have been corrected for transmission, solvent and detector response.
A.1.5.3. Anomalous X-ray scattering [10]
It is also possible to vary the X-ray contrast by adjusting the energy of the
incident X-rays around an absorption edge of the inner shell of an atom in the
considered system. This technique is called “anomalous scattering” since the
distribution of the relative scattering length density (SLD) can be decomposed in two
terms, a first one )(rNρ that concerns non resonant species like for standard SAXS
analysis and a second one ),( ErANρ for describing the resonant species with
anomalous coefficient and written as a complex function of energy. Then, the
scattering intensity near the absorption edge can be expressed as:
[ ]2
3)exp(),()(),( � += rdiqrErrEqI ANN ρρ (Equation–A.18)
with [ ] )()()(),( ''' rEifEfEr ANAN ρρ += for the resonant species, in our case the
metallic cations (f’ and f” are the coherent atomic scattering factor, f” being related to
the absorption scattering cross section and both factor being self-related through a
Kramers-Kronig dispersion relation).
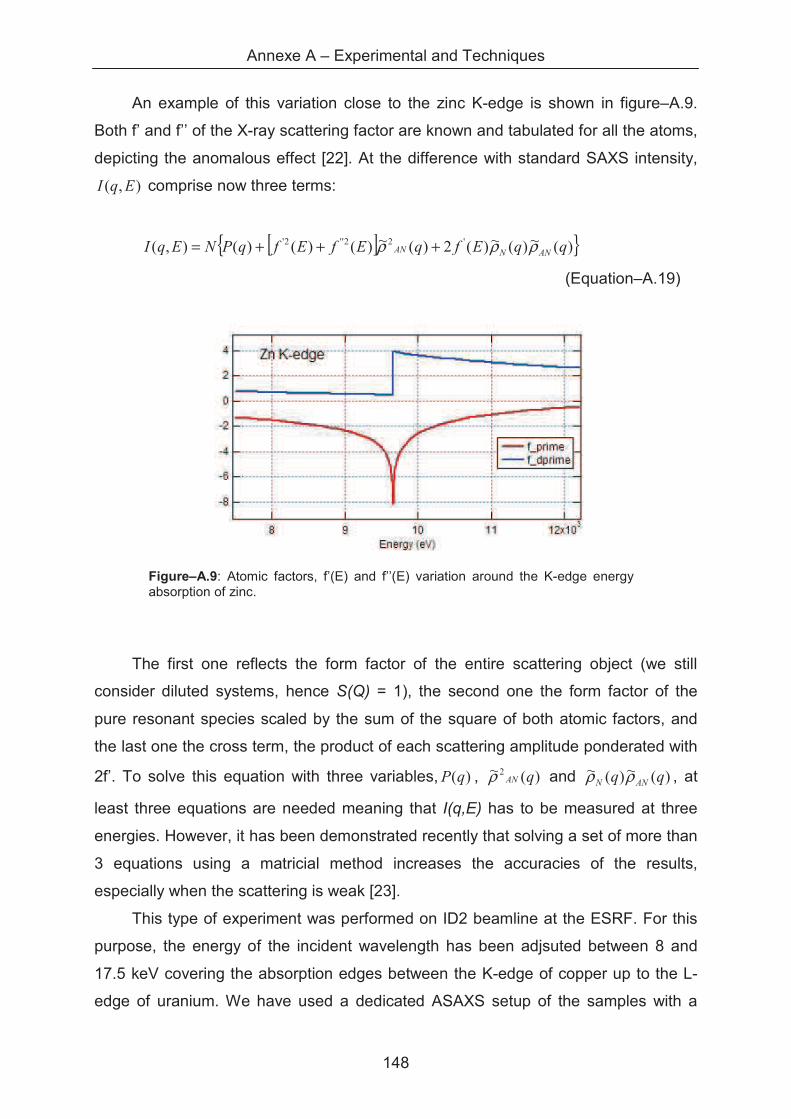
Annexe A – Experimental and Techniques
148
An example of this variation close to the zinc K-edge is shown in figure–A.9.
Both f’ and f’’ of the X-ray scattering factor are known and tabulated for all the atoms,
depicting the anomalous effect [22]. At the difference with standard SAXS intensity,
),( EqI comprise now three terms:
[ ]{ })(~)(~)(2)(~)()()(),( '22''2' qqEfqEfEfqPNEqI ANNAN ρρρ +++=
(Equation–A.19)
Figure–A.9: Atomic factors, f’(E) and f’’(E) variation around the K-edge energy absorption of zinc.
The first one reflects the form factor of the entire scattering object (we still
consider diluted systems, hence S(Q) = 1), the second one the form factor of the
pure resonant species scaled by the sum of the square of both atomic factors, and
the last one the cross term, the product of each scattering amplitude ponderated with
2f’. To solve this equation with three variables, )(qP , )(~2 qANρ and )(~)(~ qq ANN ρρ , at
least three equations are needed meaning that I(q,E) has to be measured at three
energies. However, it has been demonstrated recently that solving a set of more than
3 equations using a matricial method increases the accuracies of the results,
especially when the scattering is weak [23].
This type of experiment was performed on ID2 beamline at the ESRF. For this
purpose, the energy of the incident wavelength has been adjsuted between 8 and
17.5 keV covering the absorption edges between the K-edge of copper up to the L-
edge of uranium. We have used a dedicated ASAXS setup of the samples with a
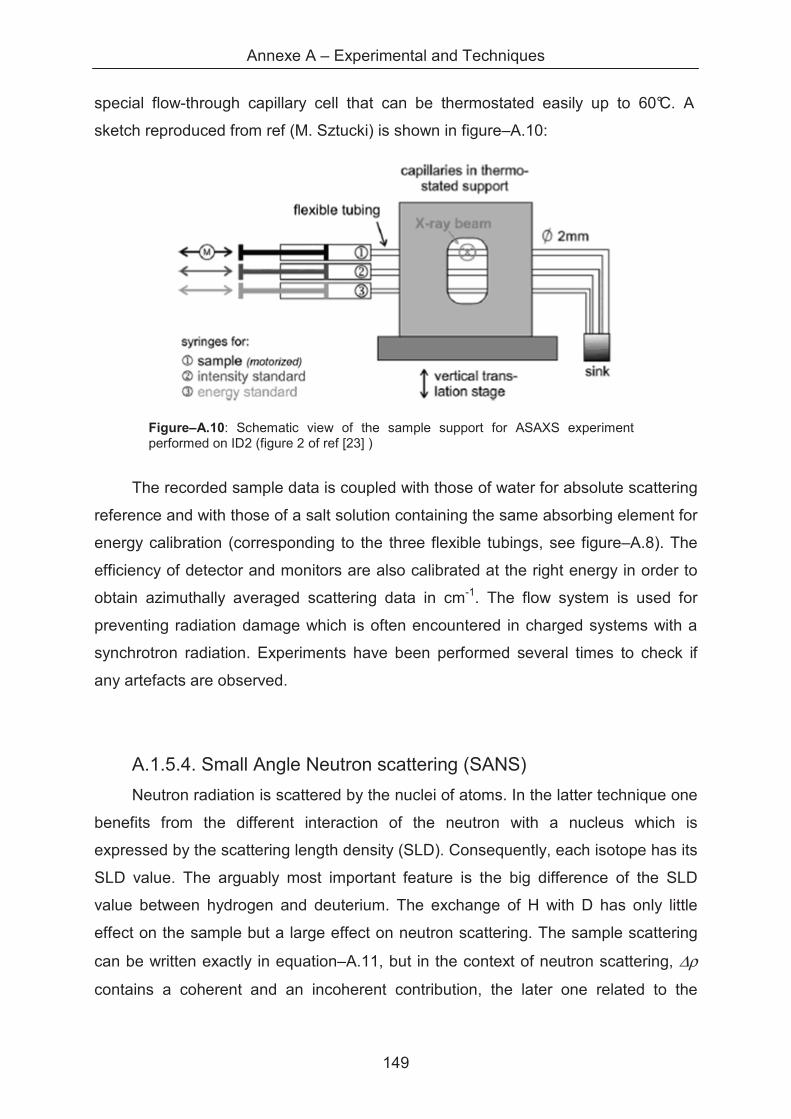
Annexe A – Experimental and Techniques
149
special flow-through capillary cell that can be thermostated easily up to 60°C. A
sketch reproduced from ref (M. Sztucki) is shown in figure–A.10:
Figure–A.10: Schematic view of the sample support for ASAXS experiment performed on ID2 (figure 2 of ref [23] )
The recorded sample data is coupled with those of water for absolute scattering
reference and with those of a salt solution containing the same absorbing element for
energy calibration (corresponding to the three flexible tubings, see figure–A.8). The
efficiency of detector and monitors are also calibrated at the right energy in order to
obtain azimuthally averaged scattering data in cm-1. The flow system is used for
preventing radiation damage which is often encountered in charged systems with a
synchrotron radiation. Experiments have been performed several times to check if
any artefacts are observed.
A.1.5.4. Small Angle Neutron scattering (SANS)
Neutron radiation is scattered by the nuclei of atoms. In the latter technique one
benefits from the different interaction of the neutron with a nucleus which is
expressed by the scattering length density (SLD). Consequently, each isotope has its
SLD value. The arguably most important feature is the big difference of the SLD
value between hydrogen and deuterium. The exchange of H with D has only little
effect on the sample but a large effect on neutron scattering. The sample scattering
can be written exactly in equation–A.11, but in the context of neutron scattering, ∆ρ
contains a coherent and an incoherent contribution, the later one related to the
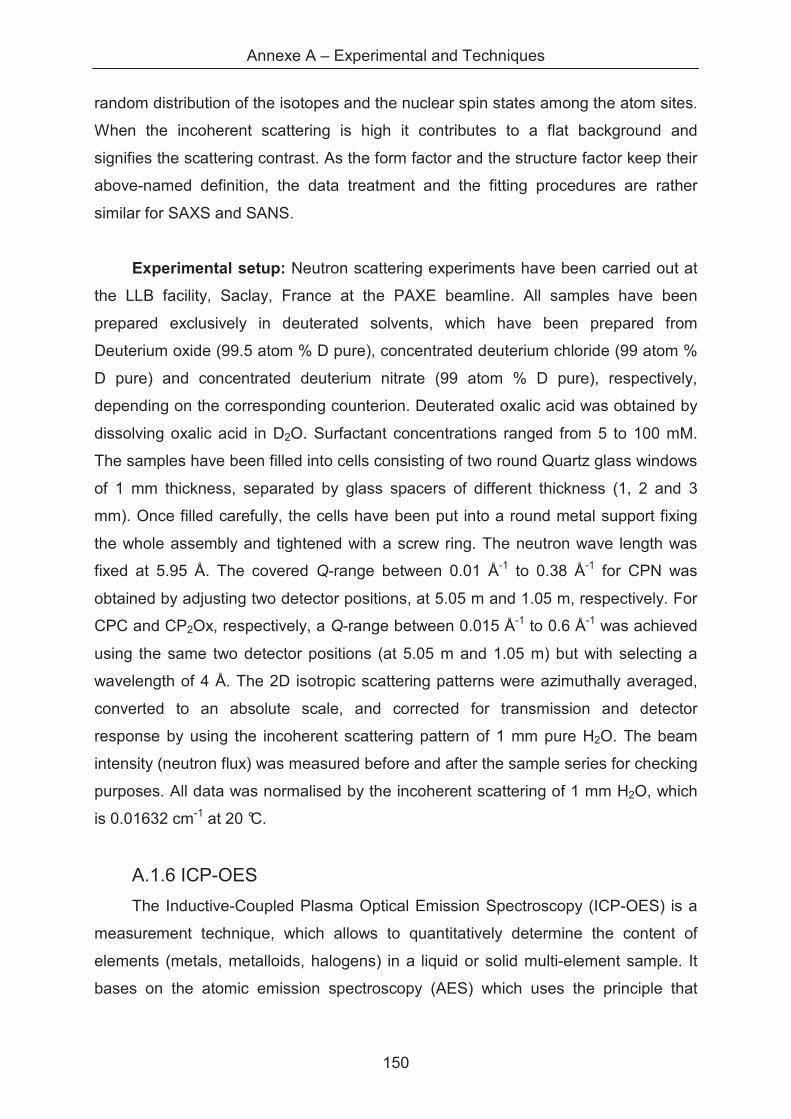
Annexe A – Experimental and Techniques
150
random distribution of the isotopes and the nuclear spin states among the atom sites.
When the incoherent scattering is high it contributes to a flat background and
signifies the scattering contrast. As the form factor and the structure factor keep their
above-named definition, the data treatment and the fitting procedures are rather
similar for SAXS and SANS.
Experimental setup: Neutron scattering experiments have been carried out at
the LLB facility, Saclay, France at the PAXE beamline. All samples have been
prepared exclusively in deuterated solvents, which have been prepared from
Deuterium oxide (99.5 atom % D pure), concentrated deuterium chloride (99 atom %
D pure) and concentrated deuterium nitrate (99 atom % D pure), respectively,
depending on the corresponding counterion. Deuterated oxalic acid was obtained by
dissolving oxalic acid in D2O. Surfactant concentrations ranged from 5 to 100 mM.
The samples have been filled into cells consisting of two round Quartz glass windows
of 1 mm thickness, separated by glass spacers of different thickness (1, 2 and 3
mm). Once filled carefully, the cells have been put into a round metal support fixing
the whole assembly and tightened with a screw ring. The neutron wave length was
fixed at 5.95 Å. The covered Q-range between 0.01 Å-1 to 0.38 Å-1 for CPN was
obtained by adjusting two detector positions, at 5.05 m and 1.05 m, respectively. For
CPC and CP2Ox, respectively, a Q-range between 0.015 Å-1 to 0.6 Å-1 was achieved
using the same two detector positions (at 5.05 m and 1.05 m) but with selecting a
wavelength of 4 Å. The 2D isotropic scattering patterns were azimuthally averaged,
converted to an absolute scale, and corrected for transmission and detector
response by using the incoherent scattering pattern of 1 mm pure H2O. The beam
intensity (neutron flux) was measured before and after the sample series for checking
purposes. All data was normalised by the incoherent scattering of 1 mm H2O, which
is 0.01632 cm-1 at 20 °C.
A.1.6 ICP-OES
The Inductive-Coupled Plasma Optical Emission Spectroscopy (ICP-OES) is a
measurement technique, which allows to quantitatively determine the content of
elements (metals, metalloids, halogens) in a liquid or solid multi-element sample. It
bases on the atomic emission spectroscopy (AES) which uses the principle that
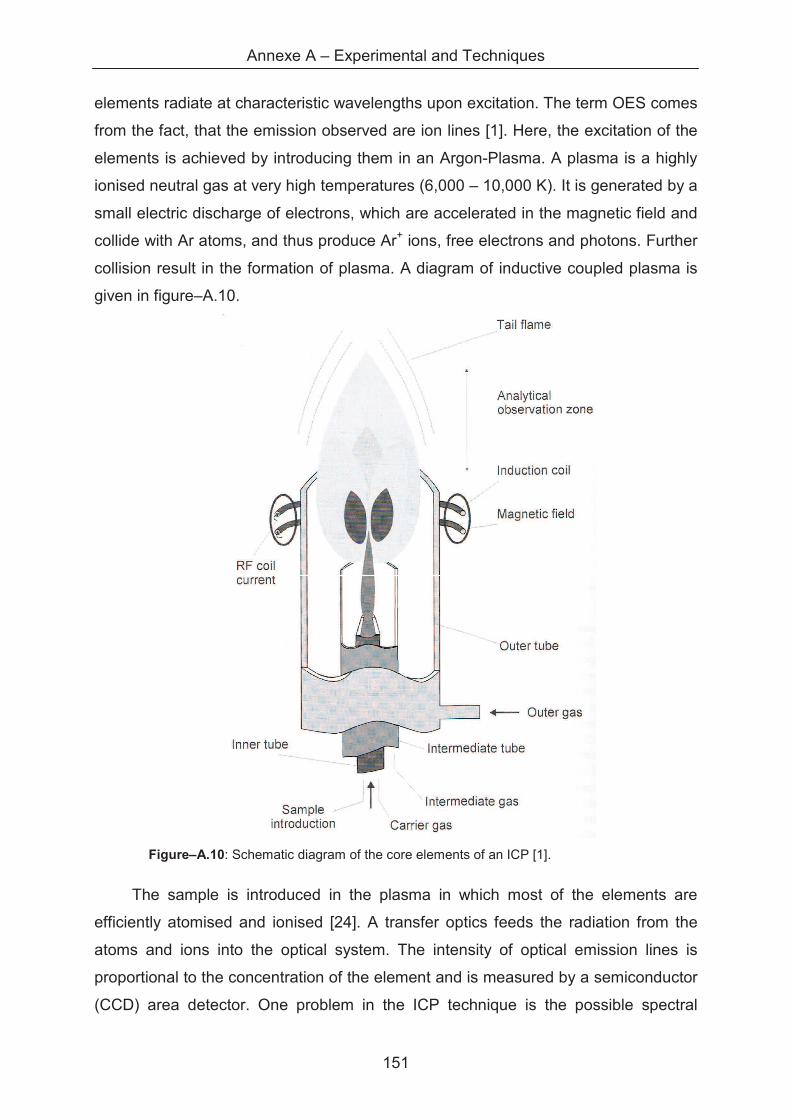
Annexe A – Experimental and Techniques
151
elements radiate at characteristic wavelengths upon excitation. The term OES comes
from the fact, that the emission observed are ion lines [1]. Here, the excitation of the
elements is achieved by introducing them in an Argon-Plasma. A plasma is a highly
ionised neutral gas at very high temperatures (6,000 – 10,000 K). It is generated by a
small electric discharge of electrons, which are accelerated in the magnetic field and
collide with Ar atoms, and thus produce Ar+ ions, free electrons and photons. Further
collision result in the formation of plasma. A diagram of inductive coupled plasma is
given in figure–A.10.
Figure–A.10: Schematic diagram of the core elements of an ICP [1].
The sample is introduced in the plasma in which most of the elements are
efficiently atomised and ionised [24]. A transfer optics feeds the radiation from the
atoms and ions into the optical system. The intensity of optical emission lines is
proportional to the concentration of the element and is measured by a semiconductor
(CCD) area detector. One problem in the ICP technique is the possible spectral
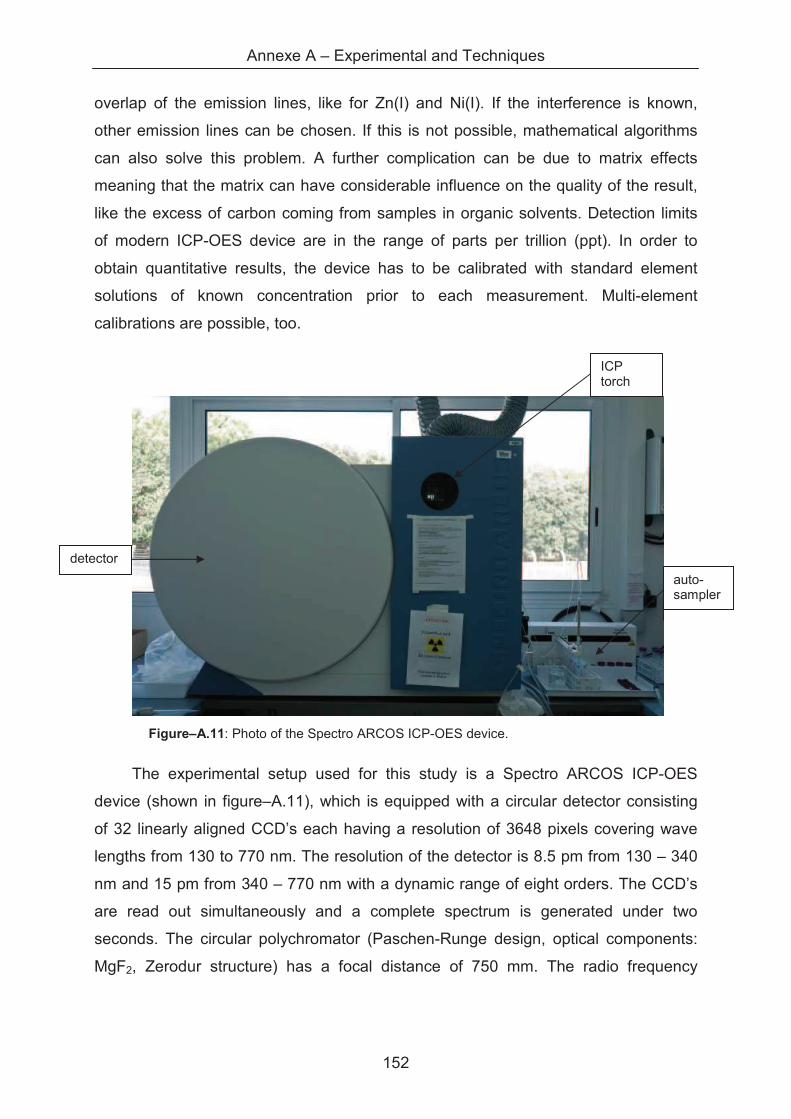
Annexe A – Experimental and Techniques
152
overlap of the emission lines, like for Zn(I) and Ni(I). If the interference is known,
other emission lines can be chosen. If this is not possible, mathematical algorithms
can also solve this problem. A further complication can be due to matrix effects
meaning that the matrix can have considerable influence on the quality of the result,
like the excess of carbon coming from samples in organic solvents. Detection limits
of modern ICP-OES device are in the range of parts per trillion (ppt). In order to
obtain quantitative results, the device has to be calibrated with standard element
solutions of known concentration prior to each measurement. Multi-element
calibrations are possible, too.
Figure–A.11: Photo of the Spectro ARCOS ICP-OES device.
The experimental setup used for this study is a Spectro ARCOS ICP-OES
device (shown in figure–A.11), which is equipped with a circular detector consisting
of 32 linearly aligned CCD’s each having a resolution of 3648 pixels covering wave
lengths from 130 to 770 nm. The resolution of the detector is 8.5 pm from 130 – 340
nm and 15 pm from 340 – 770 nm with a dynamic range of eight orders. The CCD’s
are read out simultaneously and a complete spectrum is generated under two
seconds. The circular polychromator (Paschen-Runge design, optical components:
MgF2, Zerodur structure) has a focal distance of 750 mm. The radio frequency
ICP torch
auto- sampler
detector
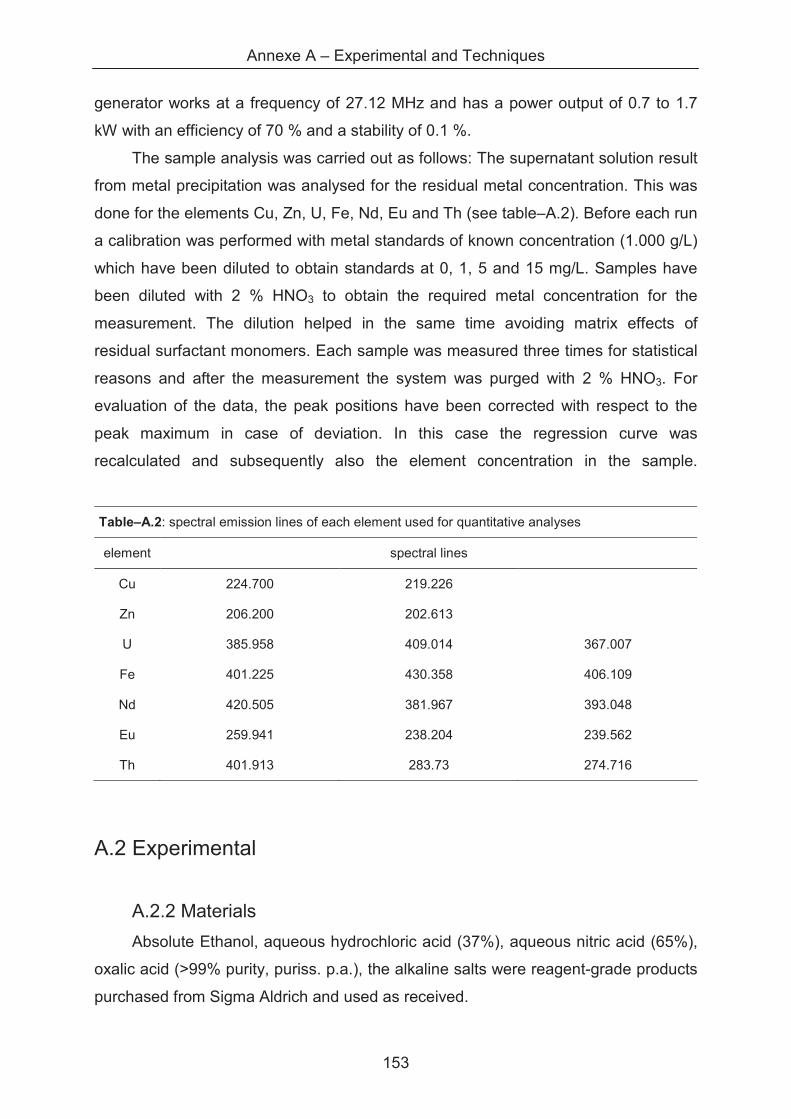
Annexe A – Experimental and Techniques
153
generator works at a frequency of 27.12 MHz and has a power output of 0.7 to 1.7
kW with an efficiency of 70 % and a stability of 0.1 %.
The sample analysis was carried out as follows: The supernatant solution result
from metal precipitation was analysed for the residual metal concentration. This was
done for the elements Cu, Zn, U, Fe, Nd, Eu and Th (see table–A.2). Before each run
a calibration was performed with metal standards of known concentration (1.000 g/L)
which have been diluted to obtain standards at 0, 1, 5 and 15 mg/L. Samples have
been diluted with 2 % HNO3 to obtain the required metal concentration for the
measurement. The dilution helped in the same time avoiding matrix effects of
residual surfactant monomers. Each sample was measured three times for statistical
reasons and after the measurement the system was purged with 2 % HNO3. For
evaluation of the data, the peak positions have been corrected with respect to the
peak maximum in case of deviation. In this case the regression curve was
recalculated and subsequently also the element concentration in the sample.
Table–A.2: spectral emission lines of each element used for quantitative analyses
element spectral lines
Cu 224.700 219.226
Zn 206.200 202.613
U 385.958 409.014 367.007
Fe 401.225 430.358 406.109
Nd 420.505 381.967 393.048
Eu 259.941 238.204 239.562
Th 401.913 283.73 274.716
A.2 Experimental
A.2.2 Materials
Absolute Ethanol, aqueous hydrochloric acid (37%), aqueous nitric acid (65%),
oxalic acid (>99% purity, puriss. p.a.), the alkaline salts were reagent-grade products
purchased from Sigma Aldrich and used as received.
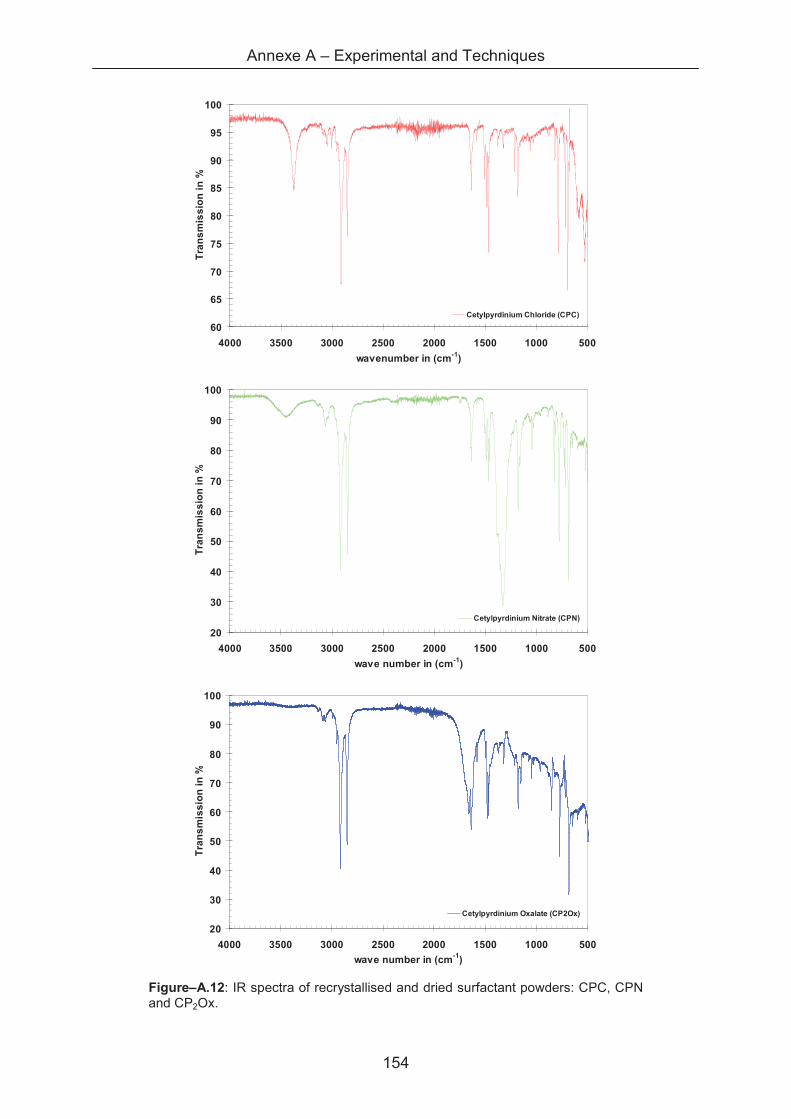
Annexe A – Experimental and Techniques
154
60
65
70
75
80
85
90
95
100
5001000150020002500300035004000
wavenumber in (cm-1)
Tra
ns
mis
sio
n i
n %
Cetylpyrdinium Chloride (CPC)
20
30
40
50
60
70
80
90
100
5001000150020002500300035004000
wave number in (cm-1)
Tra
ns
mis
sio
n i
n %
Cetylpyrdinium Nitrate (CPN)
20
30
40
50
60
70
80
90
100
5001000150020002500300035004000
wave number in (cm-1)
Tra
ns
mis
sio
n i
n %
Cetylpyrdinium Oxalate (CP2Ox)
Figure–A.12: IR spectra of recrystallised and dried surfactant powders: CPC, CPN and CP2Ox.
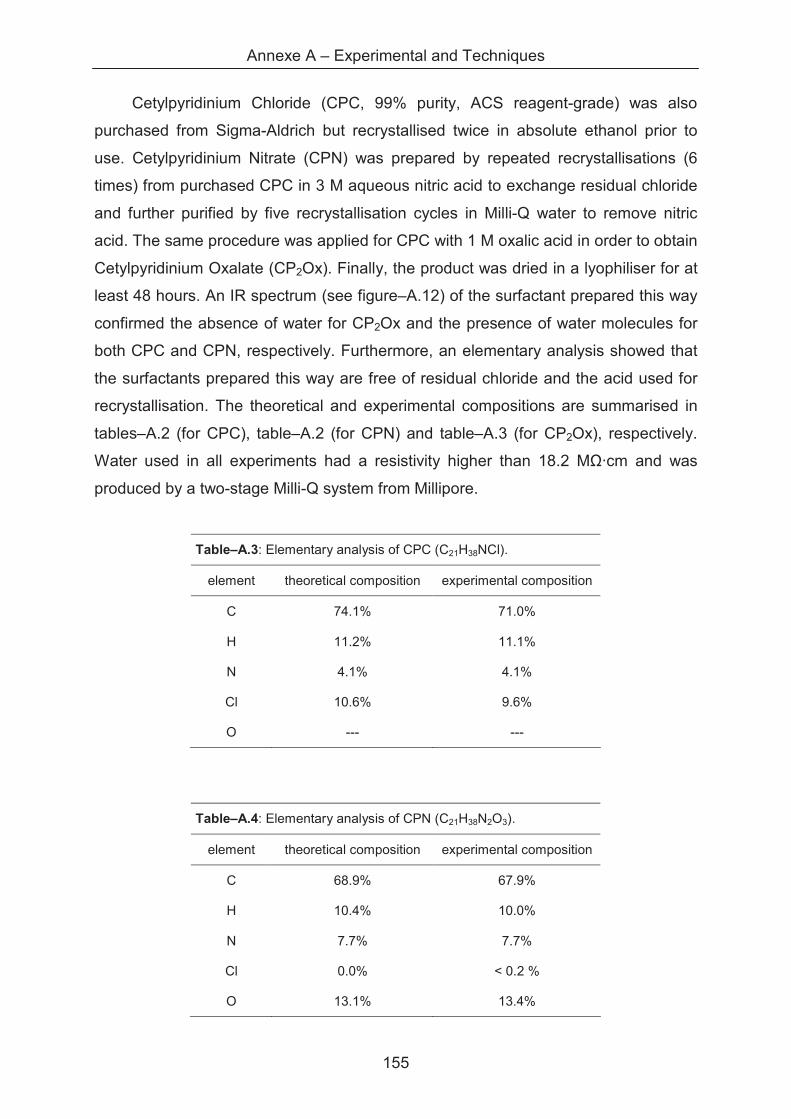
Annexe A – Experimental and Techniques
155
Cetylpyridinium Chloride (CPC, 99% purity, ACS reagent-grade) was also
purchased from Sigma-Aldrich but recrystallised twice in absolute ethanol prior to
use. Cetylpyridinium Nitrate (CPN) was prepared by repeated recrystallisations (6
times) from purchased CPC in 3 M aqueous nitric acid to exchange residual chloride
and further purified by five recrystallisation cycles in Milli-Q water to remove nitric
acid. The same procedure was applied for CPC with 1 M oxalic acid in order to obtain
Cetylpyridinium Oxalate (CP2Ox). Finally, the product was dried in a lyophiliser for at
least 48 hours. An IR spectrum (see figure–A.12) of the surfactant prepared this way
confirmed the absence of water for CP2Ox and the presence of water molecules for
both CPC and CPN, respectively. Furthermore, an elementary analysis showed that
the surfactants prepared this way are free of residual chloride and the acid used for
recrystallisation. The theoretical and experimental compositions are summarised in
tables–A.2 (for CPC), table–A.2 (for CPN) and table–A.3 (for CP2Ox), respectively.
Water used in all experiments had a resistivity higher than 18.2 M�·cm and was
produced by a two-stage Milli-Q system from Millipore.
Table–A.3: Elementary analysis of CPC (C21H38NCl).
element theoretical composition experimental composition
C 74.1% 71.0%
H 11.2% 11.1%
N 4.1% 4.1%
Cl 10.6% 9.6%
O --- ---
Table–A.4: Elementary analysis of CPN (C21H38N2O3).
element theoretical composition experimental composition
C 68.9% 67.9%
H 10.4% 10.0%
N 7.7% 7.7%
Cl 0.0% < 0.2 %
O 13.1% 13.4%
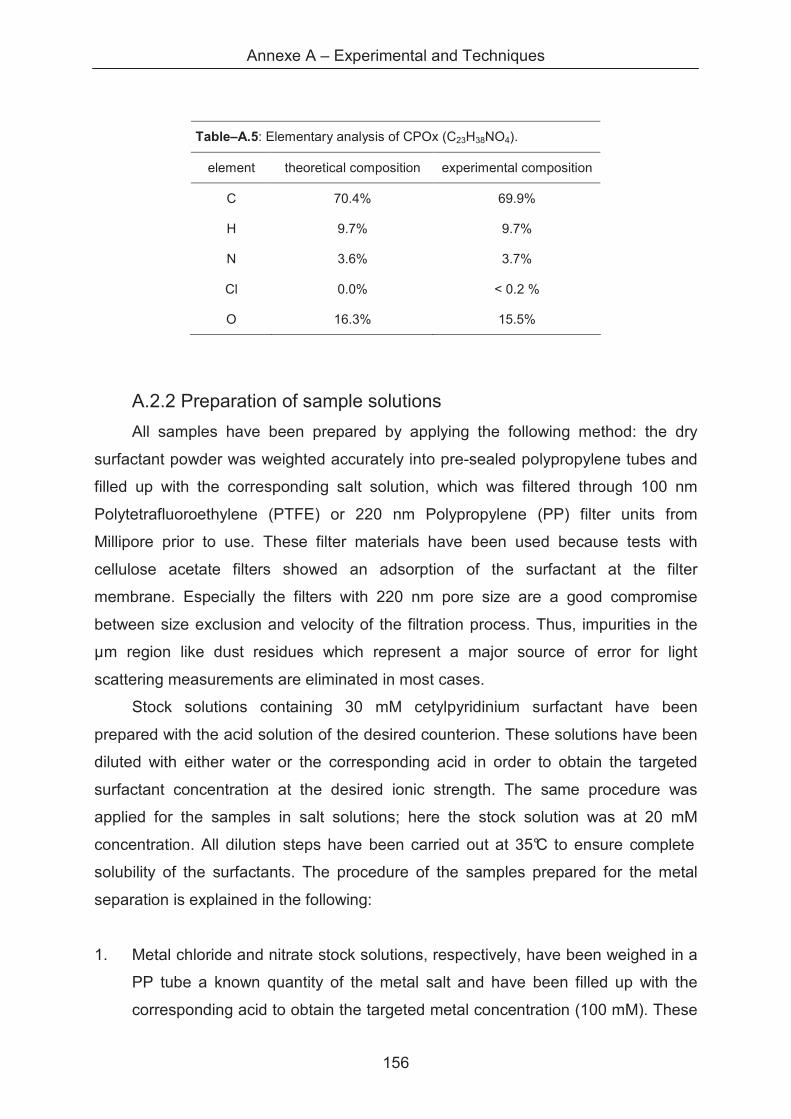
Annexe A – Experimental and Techniques
156
Table–A.5: Elementary analysis of CPOx (C23H38NO4).
element theoretical composition experimental composition
C 70.4% 69.9%
H 9.7% 9.7%
N 3.6% 3.7%
Cl 0.0% < 0.2 %
O 16.3% 15.5%
A.2.2 Preparation of sample solutions
All samples have been prepared by applying the following method: the dry
surfactant powder was weighted accurately into pre-sealed polypropylene tubes and
filled up with the corresponding salt solution, which was filtered through 100 nm
Polytetrafluoroethylene (PTFE) or 220 nm Polypropylene (PP) filter units from
Millipore prior to use. These filter materials have been used because tests with
cellulose acetate filters showed an adsorption of the surfactant at the filter
membrane. Especially the filters with 220 nm pore size are a good compromise
between size exclusion and velocity of the filtration process. Thus, impurities in the
µm region like dust residues which represent a major source of error for light
scattering measurements are eliminated in most cases.
Stock solutions containing 30 mM cetylpyridinium surfactant have been
prepared with the acid solution of the desired counterion. These solutions have been
diluted with either water or the corresponding acid in order to obtain the targeted
surfactant concentration at the desired ionic strength. The same procedure was
applied for the samples in salt solutions; here the stock solution was at 20 mM
concentration. All dilution steps have been carried out at 35°C to ensure complete
solubility of the surfactants. The procedure of the samples prepared for the metal
separation is explained in the following:
1. Metal chloride and nitrate stock solutions, respectively, have been weighed in a
PP tube a known quantity of the metal salt and have been filled up with the
corresponding acid to obtain the targeted metal concentration (100 mM). These

Annexe A – Experimental and Techniques
157
solutions have been diluted either by acid or by water in order to obtain metal
solutions (10 mM) at different ionic strengths (0.01 M, 0.1 M, 1 M bulk acid
concentration).
2. A known quantity of Cetylpyridinium chloride, or nitrate, was weighed accurately
in pre-sealed PP tubes and filled up with the corresponding metal salt solution
prepared above.
Annexe A – Experimental and Techniques
158
References
[1] GAUGLITZ, G., AND VO-DINH, T.: "Handbook of Spectroscopy". Vol. 1, Wiley-VCH, Weinheim, Germany, 2003.
[2] BEER, A.: "Bestimmung der Absorption des rothen Lichts in farbigen Flüssigkeiten". Annalen der Physik und Chemie 86 (1852), 78–88.
[3] PERKIN ELMER LIFE AND ANALYTICAL SCIENCES: “FT-IR spectroscopy - attenuated total reflectance (ATR)”. 2005. (http://las.perkinelmer.com/content/TechnicalInfo/TCH_FTIRATR.pdf)
[4] EVANS, F., AND WENNERSTRÖM, H.: "The Colloidal Domain: Where Physics, Chemistry, Biology and Technology meet". 2nd Edition, Wiley-VCH, 1999.
[5] BIRDI, K.: "Handbook of Surface and Colloid Chemistry", 3rd Edition, CRC Press, 2009.
[6] SEMMLER, A., AND KOHLER, H.: "Surface properties of alkylpyridinium chlorides and the applicability of the pendant drop technique". Journal of Colloid and Interface Science 218, 1 (1999), 137–144.
[7] SORENSEN, S.: "Enzymstudien II: Ueber die Messung und die Bedeutung der Wasserstoffionenkonzentration bei enzymatischen Prozessen". Biochem. Zeitschr. 21 (1909), 131–304.
[8] CREMER, M.: "Über die Ursache der elektromotorischen Eigenschaften der Gewebe, zugleich ein Beitrag zur Lehre von polyphasischen Elektrolytketten". Z. Biol. 47 (1906), 56.
[9] BOYES, W.: "Instrumentation Reference Book", 4th Edition, Elsevier, 2010.
[10] LINDNER, P., AND ZEMB, TH.: "Neutrons, X-rays and Light: Scattering methods applied to soft condensed matter". Elsevier, 2002.
[11] EZQUERRA, T., GARCIA-GUTIERREZ, M.-C., NOGALES, A., AND GOMEZ, M.: "Applications of synchrotron light to scattering and diffraction in materials and life sciences". Springer, 2009.
[12] SCHÄRTL, W.: "Light scattering from polymer solutions and nanoparticle dispersions". Springer, 2007.
[13] HOLMBERG, K., SHAH, D. AND SCHWUGER, M.: "Handbook of Applied Surface and Colloid Chemistry”. Vol. 2, Wiley-VCH, 2002.
[14] DEBYE, P.: "Molecular-weight determination by light scattering". Journal of Physical and Colloid Chemistry 51, 1 (1947), 18–32.
[15] Solvay Chemicals Inc.: “Hydrochloric acid - dynamic viscosity”. Electronic document, 2005.
Annexe A – Experimental and Techniques
159
[16] ANACKER, E.: "Light scattering by cetylpyridinium chloride solutions". Journal of Physical Chemistry 62, 1 (1958), 41–45.
[17] ANACKER, E., AND GHOSE, H.: "Counterions and micelle size. 2. Light scattering by solutions of cetylpyridinium salts". Journal of the American Chemical Society 90, 12 (1968), 3161+.
[18] ZEMB, T., TACHE, O., NE, F., AND SPALLA, O.: "Improving sensitivity of a small angle X-ray scattering camera with pinhole collimation using separated optical elements". Review of Scientific Instruments 74, 4 (Apr 2003), 2456–2462.
[19] TIERS, G., AND BROSTROM, M.: "Lead mercaptides: materials useful as powder secondary standards and internal references for calibration of X-ray diffractometers at small and medium angles". Journal of Applied Crystallography 33, 2, Part 3 (Jun 1, 2000), 915–920.
[20] GUINIER, A., AND FOURNET, G.: "Small-angle scattering of X-rays". Wiley, New York, 1955.
[21] GLATTER, O., AND KRATKY, O.: "Small angle X-ray scattering". Academic Press London, 1982.
[22] BRENNAN, S., AND COWAN, P.: "Ttable of X-ray scattering factors for all elements", 1992. (http://ftp.esrf.fr/pub/scisoft/xop2.3/DabaxFiles/f1f2_BrennanCowan.dat)
[23] SZTUCKI, M., DI COLA, E., AND NARAYANAN, T.: "Instrumental developments for anomalous small-angle X-ray scattering from soft matter systems". Journal of Applied Crystallography 43, 6 (Aug 2010).
[24] OLESIK, J. W.: "Elemental analysis using ICP-OES and ICP/MS". Analytical Chemistry 63, 1 (1991), 12A–21A.
[25] LIDE, D.: "Handbook of Chemistry and Physics". CRC Press Taylor & Francis, 2006-2007.
[26] PEDERSEN, J.: “Analysis of small-angle scattering data from colloids and polymer solutions: modeling and least-squares fitting”. Advances in Colloid and Interface Science 70 (1997), 171–210.

Annexe A – Experimental and Techniques
160
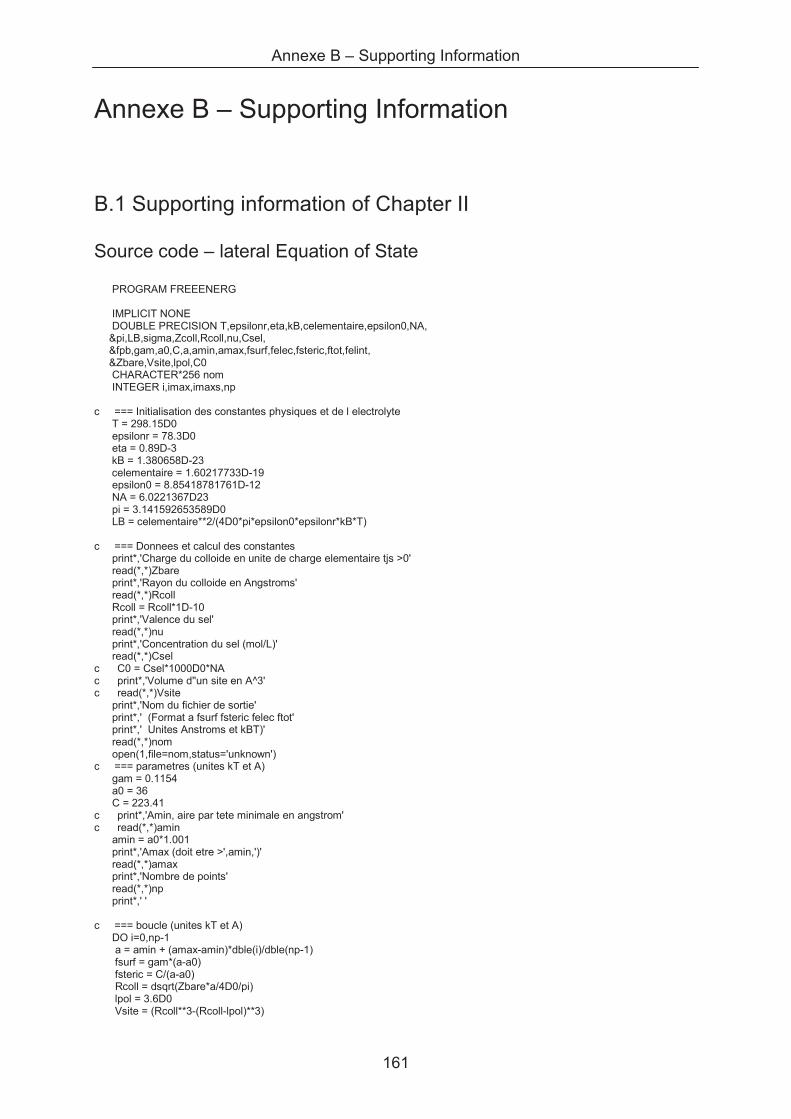
Annexe B – Supporting Information
161
Annexe B – Supporting Information
B.1 Supporting information of Chapter II
Source code – lateral Equation of State
PROGRAM FREEENERG
IMPLICIT NONE DOUBLE PRECISION T,epsilonr,eta,kB,celementaire,epsilon0,NA, &pi,LB,sigma,Zcoll,Rcoll,nu,Csel, &fpb,gam,a0,C,a,amin,amax,fsurf,felec,fsteric,ftot,felint, &Zbare,Vsite,lpol,C0 CHARACTER*256 nom INTEGER i,imax,imaxs,np
c === Initialisation des constantes physiques et de l electrolyte T = 298.15D0 epsilonr = 78.3D0 eta = 0.89D-3 kB = 1.380658D-23 celementaire = 1.60217733D-19 epsilon0 = 8.85418781761D-12 NA = 6.0221367D23 pi = 3.141592653589D0 LB = celementaire**2/(4D0*pi*epsilon0*epsilonr*kB*T) c === Donnees et calcul des constantes print*,'Charge du colloide en unite de charge elementaire tjs >0' read(*,*)Zbare print*,'Rayon du colloide en Angstroms' read(*,*)Rcoll Rcoll = Rcoll*1D-10 print*,'Valence du sel' read(*,*)nu print*,'Concentration du sel (mol/L)' read(*,*)Csel c C0 = Csel*1000D0*NA c print*,'Volume d''un site en A^3' c read(*,*)Vsite print*,'Nom du fichier de sortie' print*,' (Format a fsurf fsteric felec ftot' print*,' Unites Anstroms et kBT)' read(*,*)nom open(1,file=nom,status='unknown') c === parametres (unites kT et A) gam = 0.1154 a0 = 36 C = 223.41 c print*,'Amin, aire par tete minimale en angstrom' c read(*,*)amin amin = a0*1.001 print*,'Amax (doit etre >',amin,')' read(*,*)amax print*,'Nombre de points' read(*,*)np print*,' '
c === boucle (unites kT et A) DO i=0,np-1 a = amin + (amax-amin)*dble(i)/dble(np-1) fsurf = gam*(a-a0) fsteric = C/(a-a0) Rcoll = dsqrt(Zbare*a/4D0/pi) lpol = 3.6D0 Vsite = (Rcoll**3-(Rcoll-lpol)**3)
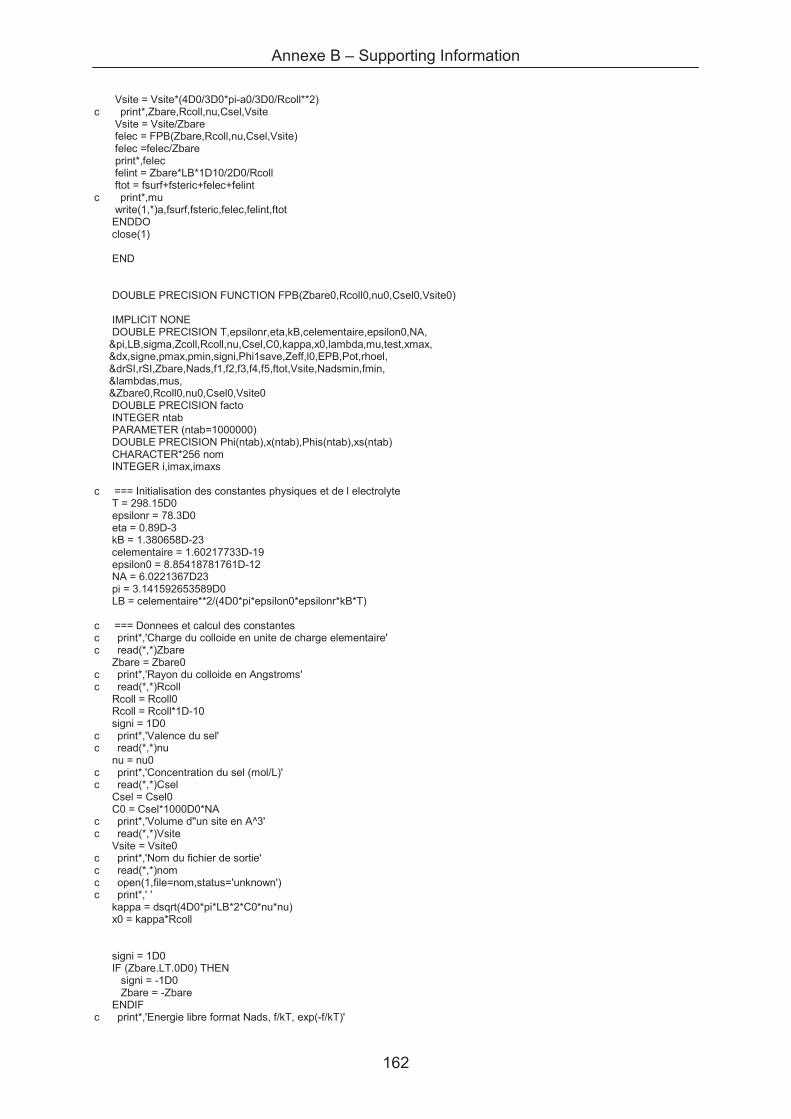
Annexe B – Supporting Information
162
Vsite = Vsite*(4D0/3D0*pi-a0/3D0/Rcoll**2) c print*,Zbare,Rcoll,nu,Csel,Vsite Vsite = Vsite/Zbare felec = FPB(Zbare,Rcoll,nu,Csel,Vsite) felec =felec/Zbare print*,felec felint = Zbare*LB*1D10/2D0/Rcoll ftot = fsurf+fsteric+felec+felint c print*,mu write(1,*)a,fsurf,fsteric,felec,felint,ftot ENDDO close(1)
END
DOUBLE PRECISION FUNCTION FPB(Zbare0,Rcoll0,nu0,Csel0,Vsite0)
IMPLICIT NONE DOUBLE PRECISION T,epsilonr,eta,kB,celementaire,epsilon0,NA, &pi,LB,sigma,Zcoll,Rcoll,nu,Csel,C0,kappa,x0,lambda,mu,test,xmax, &dx,signe,pmax,pmin,signi,Phi1save,Zeff,l0,EPB,Pot,rhoel, &drSI,rSI,Zbare,Nads,f1,f2,f3,f4,f5,ftot,Vsite,Nadsmin,fmin, &lambdas,mus, &Zbare0,Rcoll0,nu0,Csel0,Vsite0 DOUBLE PRECISION facto INTEGER ntab PARAMETER (ntab=1000000) DOUBLE PRECISION Phi(ntab),x(ntab),Phis(ntab),xs(ntab) CHARACTER*256 nom INTEGER i,imax,imaxs
c === Initialisation des constantes physiques et de l electrolyte T = 298.15D0 epsilonr = 78.3D0 eta = 0.89D-3 kB = 1.380658D-23 celementaire = 1.60217733D-19 epsilon0 = 8.85418781761D-12 NA = 6.0221367D23 pi = 3.141592653589D0 LB = celementaire**2/(4D0*pi*epsilon0*epsilonr*kB*T) c === Donnees et calcul des constantes c print*,'Charge du colloide en unite de charge elementaire' c read(*,*)Zbare Zbare = Zbare0 c print*,'Rayon du colloide en Angstroms' c read(*,*)Rcoll Rcoll = Rcoll0 Rcoll = Rcoll*1D-10 signi = 1D0 c print*,'Valence du sel' c read(*,*)nu nu = nu0 c print*,'Concentration du sel (mol/L)' c read(*,*)Csel Csel = Csel0 C0 = Csel*1000D0*NA c print*,'Volume d''un site en A^3' c read(*,*)Vsite Vsite = Vsite0 c print*,'Nom du fichier de sortie' c read(*,*)nom c open(1,file=nom,status='unknown') c print*,' ' kappa = dsqrt(4D0*pi*LB*2*C0*nu*nu) x0 = kappa*Rcoll
signi = 1D0 IF (Zbare.LT.0D0) THEN signi = -1D0 Zbare = -Zbare ENDIF c print*,'Energie libre format Nads, f/kT, exp(-f/kT)'

Annexe B – Supporting Information
163
c Valeur de fmin pour la minimsation extrement grande au début pour que tous les termes soieent plus petits fmin = 1D300 c === Boucle sur tous les types de micelles Nads = -1D0 DO WHILE (Nads.LT.0D0) Nads = Nads + 1D0 Zcoll = Zbare - Nads sigma = Zcoll*celementaire/4/pi/Rcoll/Rcoll lambda = (epsilon0*epsilonr*kB*T)/celementaire/sigma mu = 1D0/kappa/lambda c print*,'kappa = ',kappa c print*,'Longueur de Debye = ',1D0/kappa c print*,'kappa Rcoll = ',x0 c print*,'LGouy = ',lambda c print*,'Derivee de Phi a l''origine = ',-mu IF (x0.GT.1D0) THEN xmax = 10D0*x0 ELSE xmax = 10D0 ENDIF dx = 1D-2 IF (dabs(mu).GT.1D0) THEN dx = dx/dabs(mu) ENDIF Phi(1) = 1D0*dabs(sigma)/sigma i = 1 x(i) = x0 DO WHILE (x(i).LT.xmax) i = i+1 x(i) = x(i-1)+dx ENDDO imax = i c === Boucle de calcul de Phi pmin = 0D0 pmax = 0D0 test = 0D0 DO WHILE (test.EQ.0D0) test = 1D0 Phi1save = Phi(1) Phi(2) = Phi(1) - mu*dx c print*,'&',Phi(1) i = 2D0 DO WHILE (i.LE.imax-1) Phi(i+1) = (2D0*Phi(i)+dsinh(Phi(i))*dx*dx)/(1D0+dx/x(i)) & - Phi(i-1)*(1D0-dx/x(i))/(1D0+dx/x(i)) IF (Phi(i+1).GT.Phi(i)) THEN c print*,x(i+1) pmax = Phi(1) test = 0D0 IF (pmin.EQ.0D0) THEN Phi(1) = Phi(1)/2D0 ELSE Phi(1) = (pmin+pmax)/2D0 ENDIF IF (dabs((Phi(1)-Phi1save)/Phi(1)).LT.1D-10) THEN test = 1D0 imax = i xmax = x(imax) ENDIF i = imax-1 ENDIF IF (Phi(i+1).LT.0D0) THEN c print*,x(i+1) pmin = Phi(1) test = 0D0 IF (pmax.EQ.0D0) THEN c === pour eviter de trouver un mouvement stable ou fait un nombre proche de 2 mais pas exactement 2 (en fait inutile car dichotomie ?) Phi(1) = 1.9874593845D0*Phi(1) ELSE Phi(1) = (pmin+pmax)/2D0 ENDIF IF (dabs((Phi(1)-Phi1save)/Phi(1)).LT.1D-10) THEN test = 1D0 imax = i

Annexe B – Supporting Information
164
xmax = x(imax) ENDIF i = imax-1 ENDIF i = i+1 ENDDO ENDDO DO i=1,imax Phi(i)= signi*Phi(i) ENDDO
c === Calcul de l'energie electrostatique EPB = 0D0 drSI = dx/kappa DO i=1,imax rhoel = 1D3*NA*Csel*celementaire*nu*(exp(-Phi(i))-exp(Phi(i))) Pot = Phi(i)*kB*T/nu/celementaire rSI = x(i)/kappa EPB = EPB + 4D0*pi*rSI**2*Pot*rhoel*drSI ENDDO EPB = EPB/2 c print*,'Energie electrostatique en unite de kT = ',EPB/kB/T
f1 = LB/2/Rcoll * (-2D0*Zbare*Nads + Nads**2)c print*,'t' c print*,'terme en log',facto(Zbare)/facto(Nads)/facto(Zbare-Nads) f2 = - dlog(facto(Zbare)/facto(Nads)/facto(Zbare-Nads)) f3 = -Nads*dlog(C0*Vsite*1D-30) f4 = Nads f5 = -EPB/kB/T ftot = f1+f2+f3+f4+f5
c print*,Nads,ftot,exp(-ftot)
c === Si c'est un minimum de f on le dit et on sauve... IF (Nads.EQ.0D0) THEN Nadsmin = Nads fmin = ftot DO i=1,imax Phis(i) = Phi(i) xs(i) = x(i) ENDDO imaxs = imax lambdas = lambda mus = mu ENDIF c print*,'Detail',f1,f2,f3,f4,f5
ENDDO
c === On donne le minimum et on reprend ses valeurs de constantes c print*,'Valeur de Nabs = ',Nadsmin Nads = Nadsmin ftot = fmin DO i=1,imaxs Phi(i) = Phis(i) x(i) = xs(i) ENDDO imax = imaxs lambda = lambdas mu = mus
c === On reprend le calcul avec la valeur trouvée Zcoll = Zbare - Nadsmin c print*,'Charge de la micelle avec les ions adsorbes : ',Zcoll c print*,'kappa = ',kappa c print*,'Longueur de Debye = ',1D0/kappa c print*,'kappa Rcoll = ',x0 c print*,'LGouy = ',lambda c print*,'Derivee de Phi a l''origine = ',-mu
c === Boucle d'affichage c DO i=1,imax
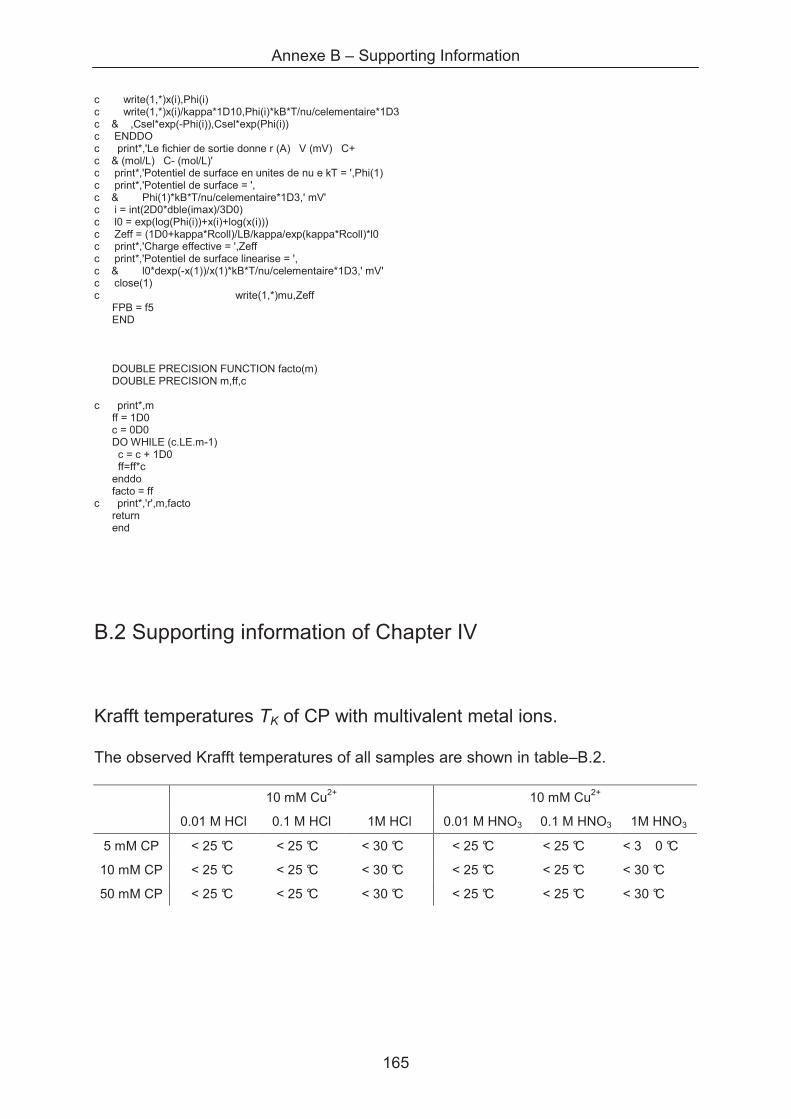
Annexe B – Supporting Information
165
c write(1,*)x(i),Phi(i) c write(1,*)x(i)/kappa*1D10,Phi(i)*kB*T/nu/celementaire*1D3 c & ,Csel*exp(-Phi(i)),Csel*exp(Phi(i)) c ENDDO c print*,'Le fichier de sortie donne r (A) V (mV) C+ c & (mol/L) C- (mol/L)' c print*,'Potentiel de surface en unites de nu e kT = ',Phi(1) c print*,'Potentiel de surface = ', c & Phi(1)*kB*T/nu/celementaire*1D3,' mV'c i = int(2D0*dble(imax)/3D0) c l0 = exp(log(Phi(i))+x(i)+log(x(i))) c Zeff = (1D0+kappa*Rcoll)/LB/kappa/exp(kappa*Rcoll)*l0 c print*,'Charge effective = ',Zeff c print*,'Potentiel de surface linearise = ', c & l0*dexp(-x(1))/x(1)*kB*T/nu/celementaire*1D3,' mV' c close(1) c write(1,*)mu,Zeff FPB = f5 END
DOUBLE PRECISION FUNCTION facto(m) DOUBLE PRECISION m,ff,c
c print*,m ff = 1D0 c = 0D0 DO WHILE (c.LE.m-1) c = c + 1D0 ff=ff*c enddo facto = ff c print*,'r',m,facto return end
B.2 Supporting information of Chapter IV
Krafft temperatures TK of CP with multivalent metal ions.
The observed Krafft temperatures of all samples are shown in table–B.2.
10 mM Cu2+ 10 mM Cu2+
0.01 M HCl 0.1 M HCl 1M HCl 0.01 M HNO3 0.1 M HNO3 1M HNO3
5 mM CP < 25 °C < 25 °C < 30 °C < 25 °C < 25 °C < 3 0 °C
10 mM CP < 25 °C < 25 °C < 30 °C < 25 °C < 25 °C < 30 °C
50 mM CP < 25 °C < 25 °C < 30 °C < 25 °C < 25 °C < 30 °C
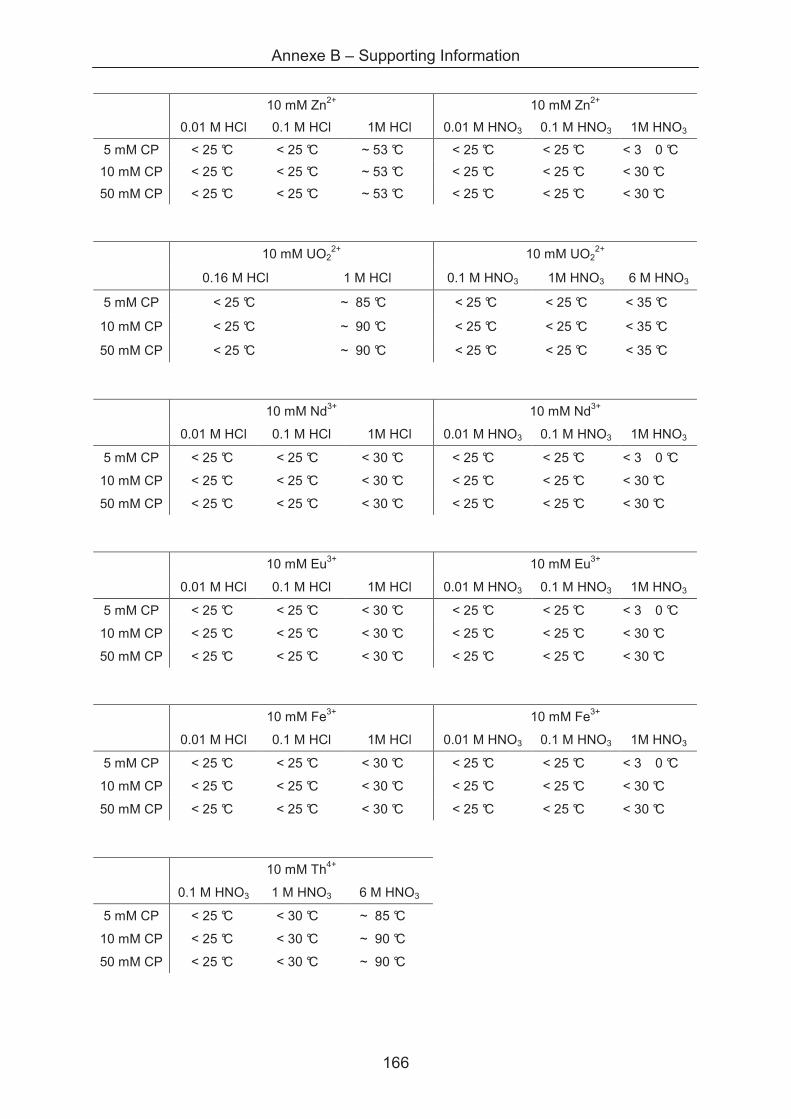
Annexe B – Supporting Information
166
10 mM Zn2+ 10 mM Zn2+
0.01 M HCl 0.1 M HCl 1M HCl 0.01 M HNO3 0.1 M HNO3 1M HNO3
5 mM CP < 25 °C < 25 °C ~ 53 °C < 25 °C < 25 °C < 3 0 °C
10 mM CP < 25 °C < 25 °C ~ 53 °C < 25 °C < 25 °C < 30 °C
50 mM CP < 25 °C < 25 °C ~ 53 °C < 25 °C < 25 °C < 30 °C
10 mM UO22+ 10 mM UO2
2+
0.16 M HCl 1 M HCl 0.1 M HNO3 1M HNO3 6 M HNO3
5 mM CP < 25 °C ~ 85 °C < 25 °C < 25 °C < 35 °C
10 mM CP < 25 °C ~ 90 °C < 25 °C < 25 °C < 35 °C
50 mM CP < 25 °C ~ 90 °C < 25 °C < 25 °C < 35 °C
10 mM Nd3+ 10 mM Nd3+
0.01 M HCl 0.1 M HCl 1M HCl 0.01 M HNO3 0.1 M HNO3 1M HNO3
5 mM CP < 25 °C < 25 °C < 30 °C < 25 °C < 25 °C < 3 0 °C
10 mM CP < 25 °C < 25 °C < 30 °C < 25 °C < 25 °C < 30 °C
50 mM CP < 25 °C < 25 °C < 30 °C < 25 °C < 25 °C < 30 °C
10 mM Eu3+ 10 mM Eu3+
0.01 M HCl 0.1 M HCl 1M HCl 0.01 M HNO3 0.1 M HNO3 1M HNO3
5 mM CP < 25 °C < 25 °C < 30 °C < 25 °C < 25 °C < 3 0 °C
10 mM CP < 25 °C < 25 °C < 30 °C < 25 °C < 25 °C < 30 °C
50 mM CP < 25 °C < 25 °C < 30 °C < 25 °C < 25 °C < 30 °C
10 mM Fe3+ 10 mM Fe3+
0.01 M HCl 0.1 M HCl 1M HCl 0.01 M HNO3 0.1 M HNO3 1M HNO3
5 mM CP < 25 °C < 25 °C < 30 °C < 25 °C < 25 °C < 3 0 °C
10 mM CP < 25 °C < 25 °C < 30 °C < 25 °C < 25 °C < 30 °C
50 mM CP < 25 °C < 25 °C < 30 °C < 25 °C < 25 °C < 30 °C
10 mM Th4+
0.1 M HNO3 1 M HNO3 6 M HNO3
5 mM CP < 25 °C < 30 °C ~ 85 °C
10 mM CP < 25 °C < 30 °C ~ 90 °C
50 mM CP < 25 °C < 30 °C ~ 90 °C

Annexe B – Supporting Information
167
B.2 Patent of Prof. K. Heckmann (4,609,533)
The patent is freely available under:
http://www.freepatentsonline.com/4609533.pdf
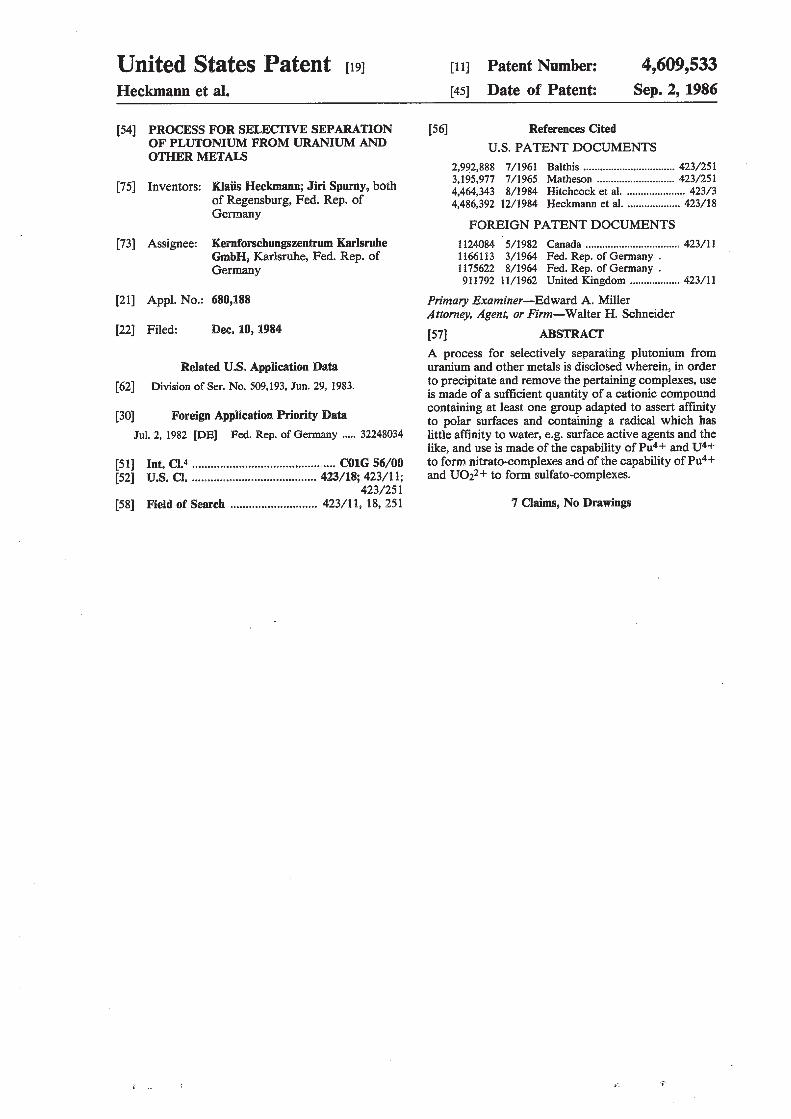
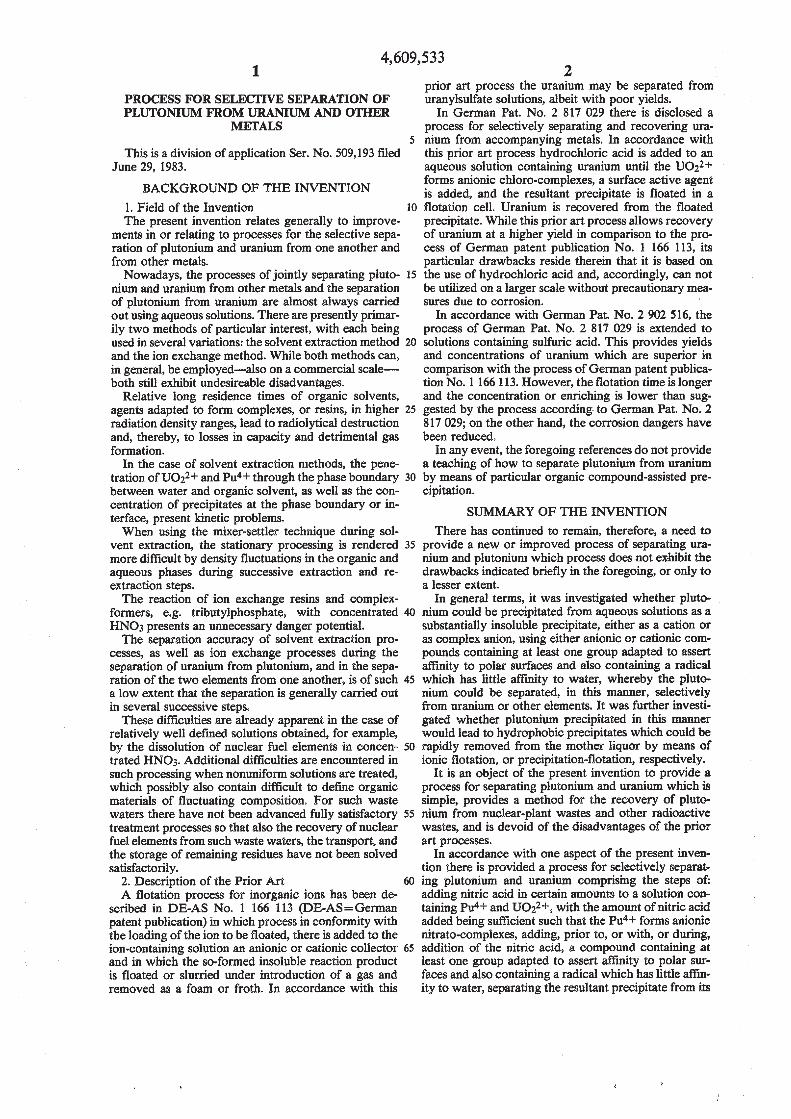
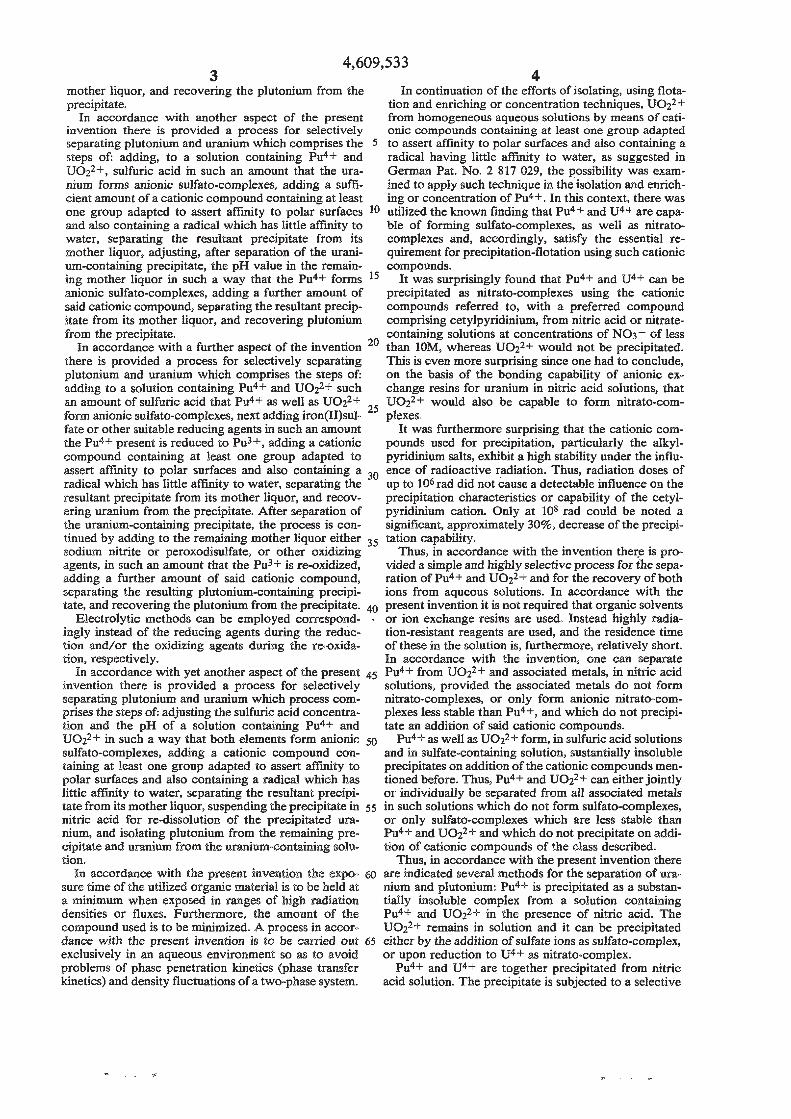
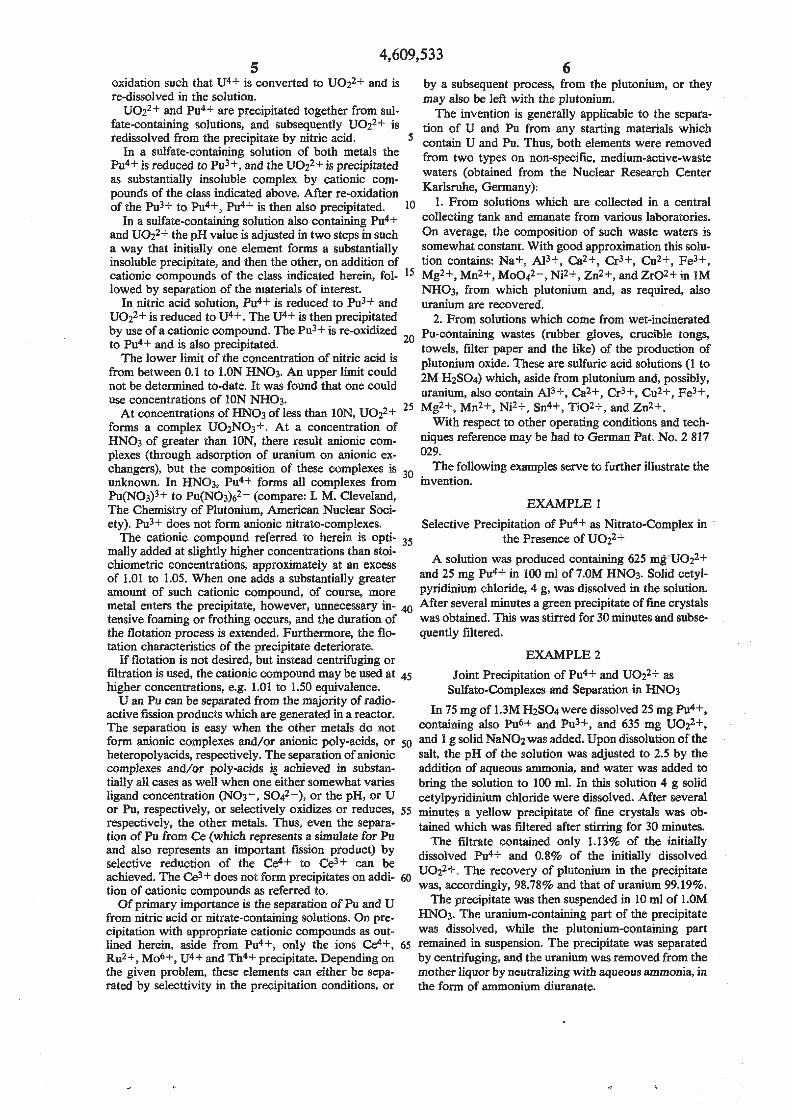
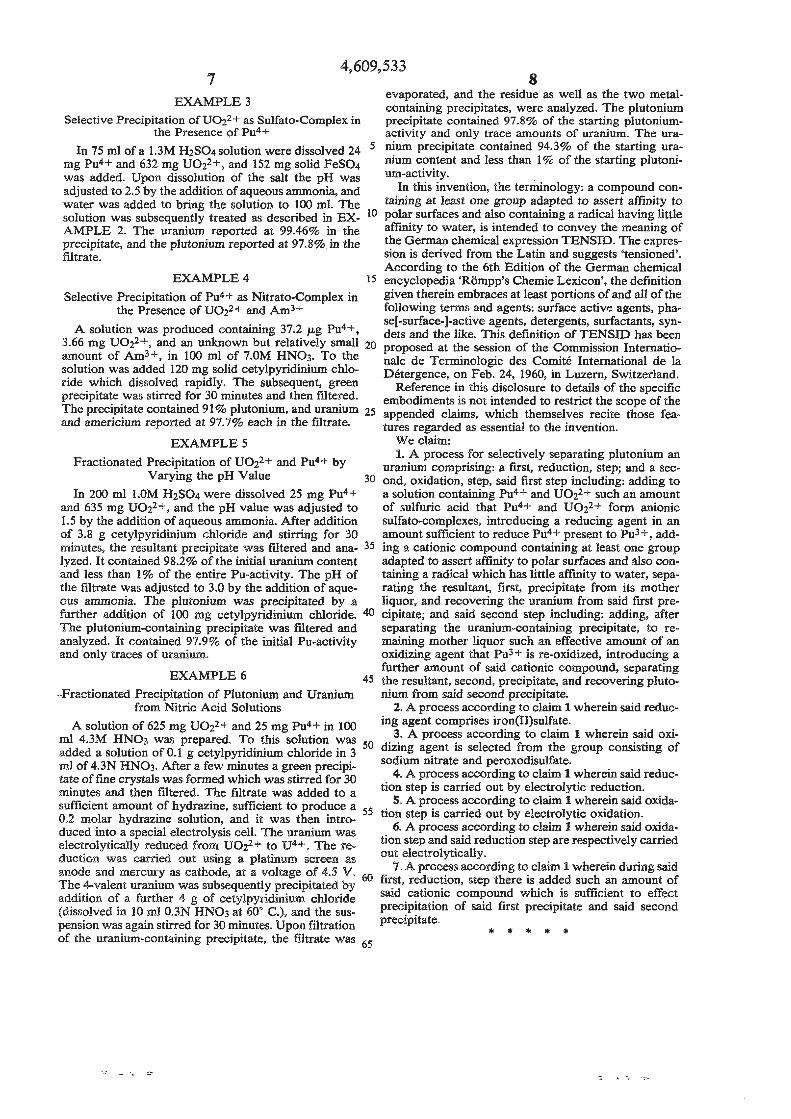

Annexe C – French summary of the thesis
174
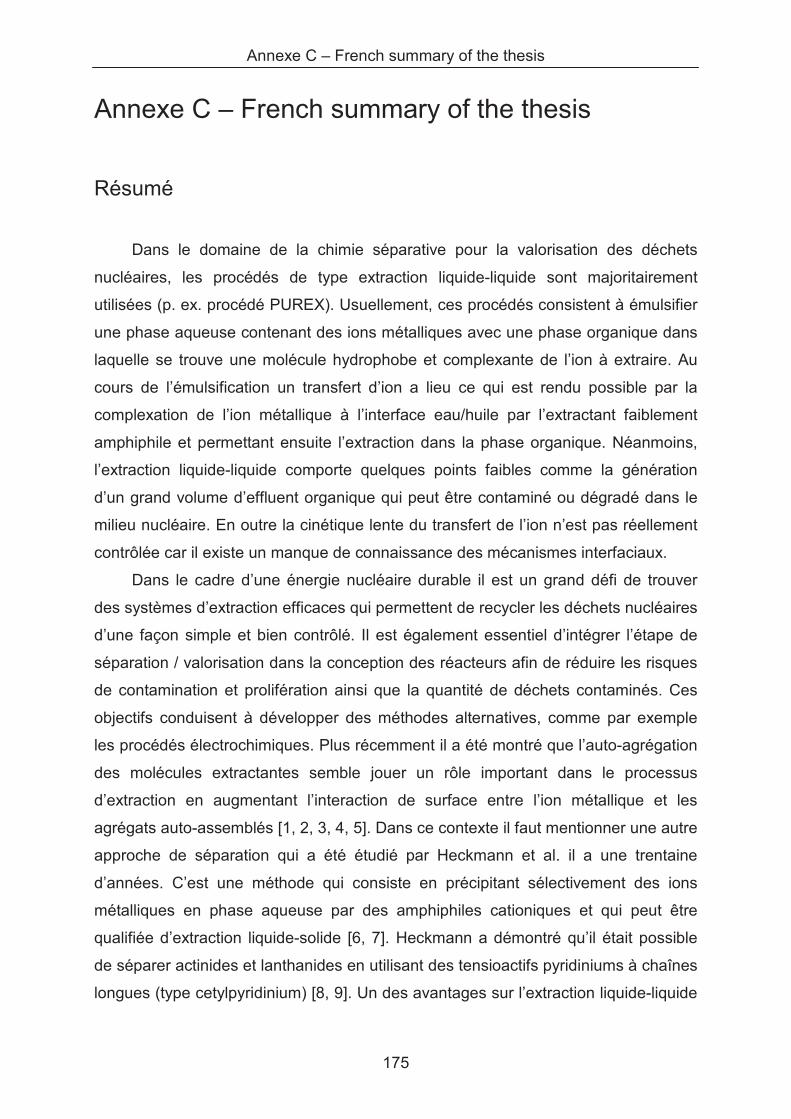
Annexe C – French summary of the thesis
175
Annexe C – French summary of the thesis
Résumé
Dans le domaine de la chimie séparative pour la valorisation des déchets
nucléaires, les procédés de type extraction liquide-liquide sont majoritairement
utilisées (p. ex. procédé PUREX). Usuellement, ces procédés consistent à émulsifier
une phase aqueuse contenant des ions métalliques avec une phase organique dans
laquelle se trouve une molécule hydrophobe et complexante de l’ion à extraire. Au
cours de l’émulsification un transfert d’ion a lieu ce qui est rendu possible par la
complexation de l’ion métallique à l’interface eau/huile par l’extractant faiblement
amphiphile et permettant ensuite l’extraction dans la phase organique. Néanmoins,
l’extraction liquide-liquide comporte quelques points faibles comme la génération
d’un grand volume d’effluent organique qui peut être contaminé ou dégradé dans le
milieu nucléaire. En outre la cinétique lente du transfert de l’ion n’est pas réellement
contrôlée car il existe un manque de connaissance des mécanismes interfaciaux.
Dans le cadre d’une énergie nucléaire durable il est un grand défi de trouver
des systèmes d’extraction efficaces qui permettent de recycler les déchets nucléaires
d’une façon simple et bien contrôlé. Il est également essentiel d’intégrer l’étape de
séparation / valorisation dans la conception des réacteurs afin de réduire les risques
de contamination et prolifération ainsi que la quantité de déchets contaminés. Ces
objectifs conduisent à développer des méthodes alternatives, comme par exemple
les procédés électrochimiques. Plus récemment il a été montré que l’auto-agrégation
des molécules extractantes semble jouer un rôle important dans le processus
d’extraction en augmentant l’interaction de surface entre l’ion métallique et les
agrégats auto-assemblés [1, 2, 3, 4, 5]. Dans ce contexte il faut mentionner une autre
approche de séparation qui a été étudié par Heckmann et al. il a une trentaine
d’années. C’est une méthode qui consiste en précipitant sélectivement des ions
métalliques en phase aqueuse par des amphiphiles cationiques et qui peut être
qualifiée d’extraction liquide-solide [6, 7]. Heckmann a démontré qu’il était possible
de séparer actinides et lanthanides en utilisant des tensioactifs pyridiniums à chaînes
longues (type cetylpyridinium) [8, 9]. Un des avantages sur l’extraction liquide-liquide
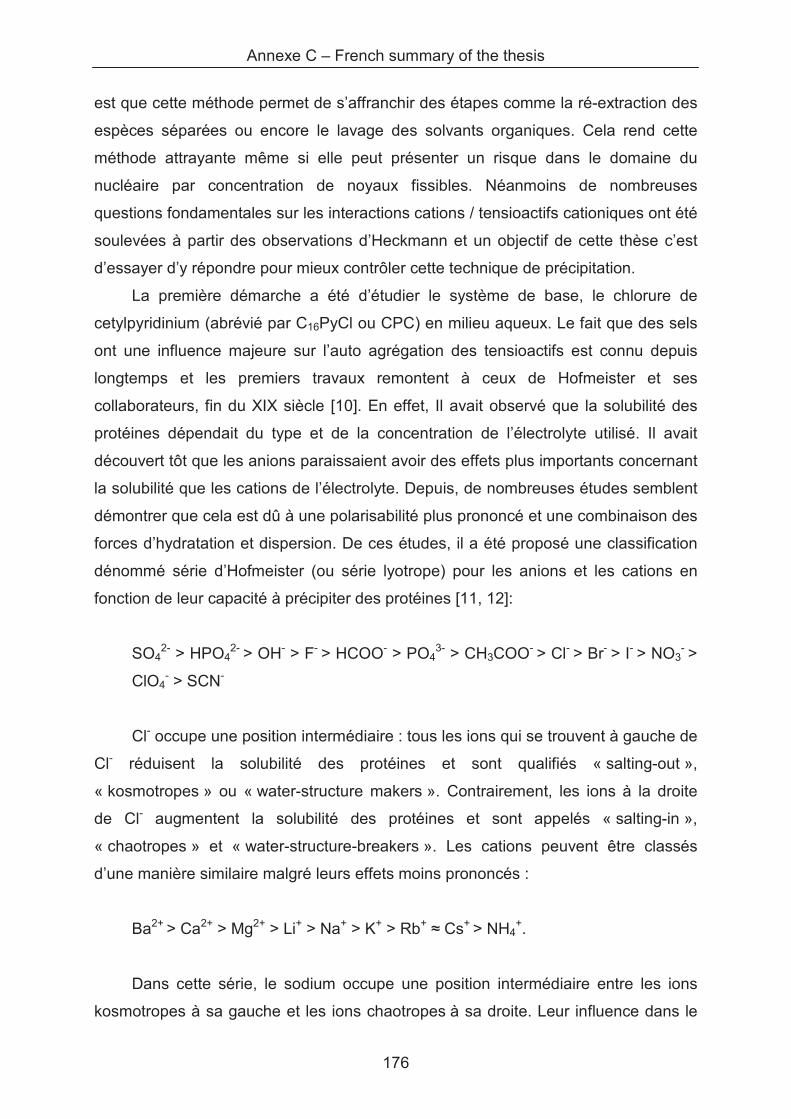
Annexe C – French summary of the thesis
176
est que cette méthode permet de s’affranchir des étapes comme la ré-extraction des
espèces séparées ou encore le lavage des solvants organiques. Cela rend cette
méthode attrayante même si elle peut présenter un risque dans le domaine du
nucléaire par concentration de noyaux fissibles. Néanmoins de nombreuses
questions fondamentales sur les interactions cations / tensioactifs cationiques ont été
soulevées à partir des observations d’Heckmann et un objectif de cette thèse c’est
d’essayer d’y répondre pour mieux contrôler cette technique de précipitation.
La première démarche a été d’étudier le système de base, le chlorure de
cetylpyridinium (abrévié par C16PyCl ou CPC) en milieu aqueux. Le fait que des sels
ont une influence majeure sur l’auto agrégation des tensioactifs est connu depuis
longtemps et les premiers travaux remontent à ceux de Hofmeister et ses
collaborateurs, fin du XIX siècle [10]. En effet, Il avait observé que la solubilité des
protéines dépendait du type et de la concentration de l’électrolyte utilisé. Il avait
découvert tôt que les anions paraissaient avoir des effets plus importants concernant
la solubilité que les cations de l’électrolyte. Depuis, de nombreuses études semblent
démontrer que cela est dû à une polarisabilité plus prononcé et une combinaison des
forces d’hydratation et dispersion. De ces études, il a été proposé une classification
dénommé série d’Hofmeister (ou série lyotrope) pour les anions et les cations en
fonction de leur capacité à précipiter des protéines [11, 12]:
SO42- > HPO4
2- > OH- > F- > HCOO- > PO43- > CH3COO- > Cl- > Br- > I- > NO3
- >
ClO4- > SCN-
Cl- occupe une position intermédiaire : tous les ions qui se trouvent à gauche de
Cl- réduisent la solubilité des protéines et sont qualifiés « salting-out »,
« kosmotropes » ou « water-structure makers ». Contrairement, les ions à la droite
de Cl- augmentent la solubilité des protéines et sont appelés « salting-in »,
« chaotropes » et « water-structure-breakers ». Les cations peuvent être classés
d’une manière similaire malgré leurs effets moins prononcés :
Ba2+ > Ca2+ > Mg2+ > Li+ > Na+ > K+ > Rb+� Cs+ > NH4
+.
Dans cette série, le sodium occupe une position intermédiaire entre les ions
kosmotropes à sa gauche et les ions chaotropes à sa droite. Leur influence dans le
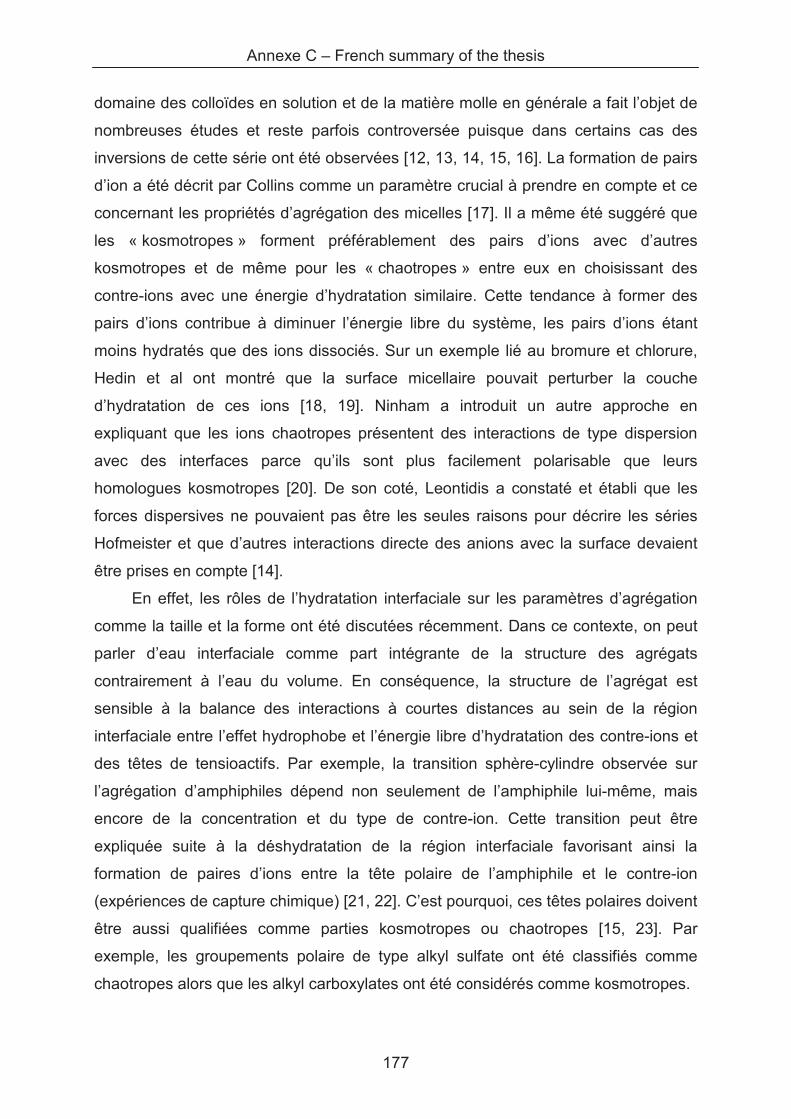
Annexe C – French summary of the thesis
177
domaine des colloïdes en solution et de la matière molle en générale a fait l’objet de
nombreuses études et reste parfois controversée puisque dans certains cas des
inversions de cette série ont été observées [12, 13, 14, 15, 16]. La formation de pairs
d’ion a été décrit par Collins comme un paramètre crucial à prendre en compte et ce
concernant les propriétés d’agrégation des micelles [17]. Il a même été suggéré que
les « kosmotropes » forment préférablement des pairs d’ions avec d’autres
kosmotropes et de même pour les « chaotropes » entre eux en choisissant des
contre-ions avec une énergie d’hydratation similaire. Cette tendance à former des
pairs d’ions contribue à diminuer l’énergie libre du système, les pairs d’ions étant
moins hydratés que des ions dissociés. Sur un exemple lié au bromure et chlorure,
Hedin et al ont montré que la surface micellaire pouvait perturber la couche
d’hydratation de ces ions [18, 19]. Ninham a introduit un autre approche en
expliquant que les ions chaotropes présentent des interactions de type dispersion
avec des interfaces parce qu’ils sont plus facilement polarisable que leurs
homologues kosmotropes [20]. De son coté, Leontidis a constaté et établi que les
forces dispersives ne pouvaient pas être les seules raisons pour décrire les séries
Hofmeister et que d’autres interactions directe des anions avec la surface devaient
être prises en compte [14].
En effet, les rôles de l’hydratation interfaciale sur les paramètres d’agrégation
comme la taille et la forme ont été discutées récemment. Dans ce contexte, on peut
parler d’eau interfaciale comme part intégrante de la structure des agrégats
contrairement à l’eau du volume. En conséquence, la structure de l’agrégat est
sensible à la balance des interactions à courtes distances au sein de la région
interfaciale entre l’effet hydrophobe et l’énergie libre d’hydratation des contre-ions et
des têtes de tensioactifs. Par exemple, la transition sphère-cylindre observée sur
l’agrégation d’amphiphiles dépend non seulement de l’amphiphile lui-même, mais
encore de la concentration et du type de contre-ion. Cette transition peut être
expliquée suite à la déshydratation de la région interfaciale favorisant ainsi la
formation de paires d’ions entre la tête polaire de l’amphiphile et le contre-ion
(expériences de capture chimique) [21, 22]. C’est pourquoi, ces têtes polaires doivent
être aussi qualifiées comme parties kosmotropes ou chaotropes [15, 23]. Par
exemple, les groupements polaire de type alkyl sulfate ont été classifiés comme
chaotropes alors que les alkyl carboxylates ont été considérés comme kosmotropes.
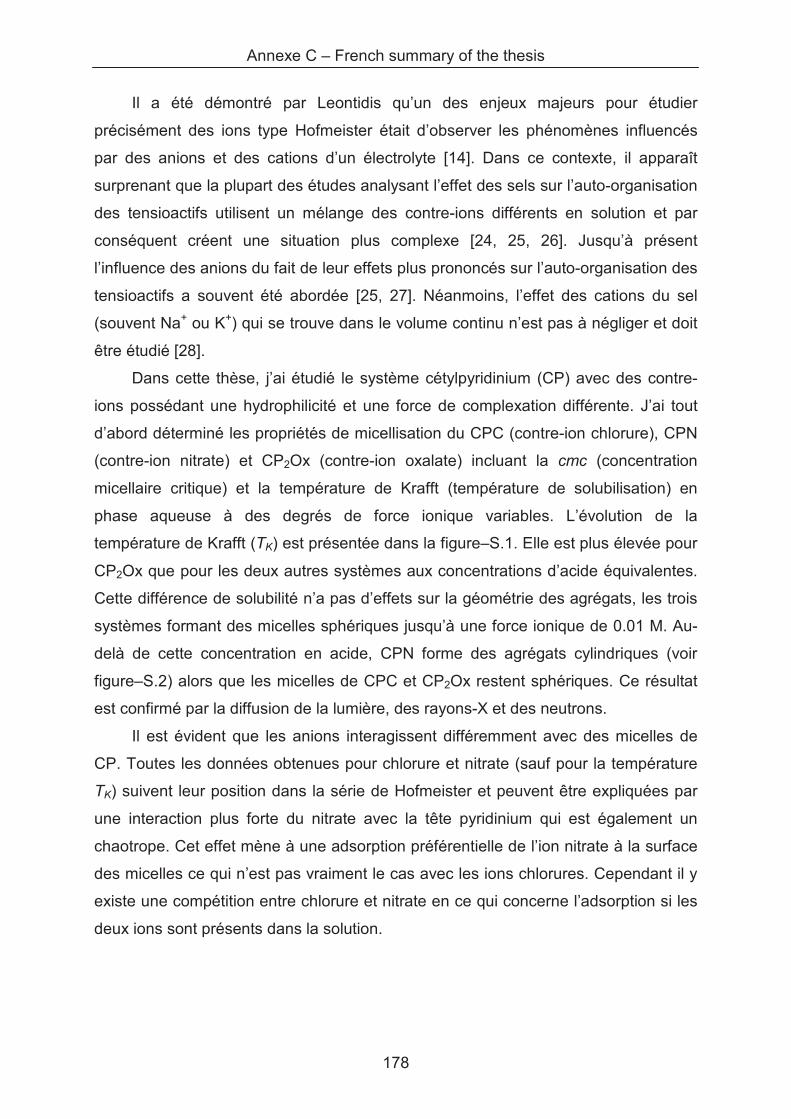
Annexe C – French summary of the thesis
178
Il a été démontré par Leontidis qu’un des enjeux majeurs pour étudier
précisément des ions type Hofmeister était d’observer les phénomènes influencés
par des anions et des cations d’un électrolyte [14]. Dans ce contexte, il apparaît
surprenant que la plupart des études analysant l’effet des sels sur l’auto-organisation
des tensioactifs utilisent un mélange des contre-ions différents en solution et par
conséquent créent une situation plus complexe [24, 25, 26]. Jusqu’à présent
l’influence des anions du fait de leur effets plus prononcés sur l’auto-organisation des
tensioactifs a souvent été abordée [25, 27]. Néanmoins, l’effet des cations du sel
(souvent Na+ ou K+) qui se trouve dans le volume continu n’est pas à négliger et doit
être étudié [28].
Dans cette thèse, j’ai étudié le système cétylpyridinium (CP) avec des contre-
ions possédant une hydrophilicité et une force de complexation différente. J’ai tout
d’abord déterminé les propriétés de micellisation du CPC (contre-ion chlorure), CPN
(contre-ion nitrate) et CP2Ox (contre-ion oxalate) incluant la cmc (concentration
micellaire critique) et la température de Krafft (température de solubilisation) en
phase aqueuse à des degrés de force ionique variables. L’évolution de la
température de Krafft (TK) est présentée dans la figure–S.1. Elle est plus élevée pour
CP2Ox que pour les deux autres systèmes aux concentrations d’acide équivalentes.
Cette différence de solubilité n’a pas d’effets sur la géométrie des agrégats, les trois
systèmes formant des micelles sphériques jusqu’à une force ionique de 0.01 M. Au-
delà de cette concentration en acide, CPN forme des agrégats cylindriques (voir
figure–S.2) alors que les micelles de CPC et CP2Ox restent sphériques. Ce résultat
est confirmé par la diffusion de la lumière, des rayons-X et des neutrons.
Il est évident que les anions interagissent différemment avec des micelles de
CP. Toutes les données obtenues pour chlorure et nitrate (sauf pour la température
TK) suivent leur position dans la série de Hofmeister et peuvent être expliquées par
une interaction plus forte du nitrate avec la tête pyridinium qui est également un
chaotrope. Cet effet mène à une adsorption préférentielle de l’ion nitrate à la surface
des micelles ce qui n’est pas vraiment le cas avec les ions chlorures. Cependant il y
existe une compétition entre chlorure et nitrate en ce qui concerne l’adsorption si les
deux ions sont présents dans la solution.
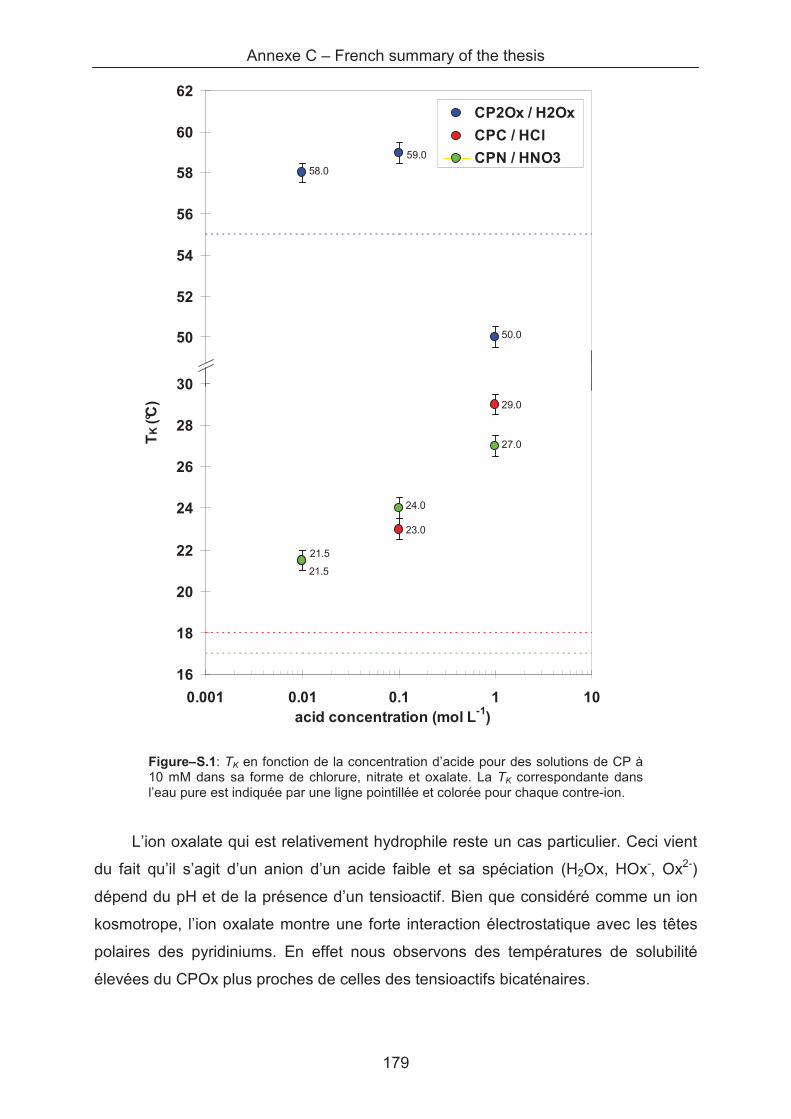
Annexe C – French summary of the thesis
179
L’ion oxalate qui est relativement hydrophile reste un cas particulier. Ceci vient
du fait qu’il s’agit d’un anion d’un acide faible et sa spéciation (H2Ox, HOx-, Ox2-)
dépend du pH et de la présence d’un tensioactif. Bien que considéré comme un ion
kosmotrope, l’ion oxalate montre une forte interaction électrostatique avec les têtes
polaires des pyridiniums. En effet nous observons des températures de solubilité
élevées du CPOx plus proches de celles des tensioactifs bicaténaires.
Figure–S.1: TK en fonction de la concentration d’acide pour des solutions de CP à 10 mM dans sa forme de chlorure, nitrate et oxalate. La TK correspondante dans l’eau pure est indiquée par une ligne pointillée et colorée pour chaque contre-ion.
58.0
59.0
50.0
48
50
52
54
56
58
60
62
0.001 0.01 0.1 1 10acid concentration (mol L-1)
CP2Ox / H2Ox
CPC / HCl
CPN / HNO3
29.0
23.0
21.5
27.0
24.0
21.5
16
18
20
22
24
26
28
30
0.001 0.01 0.1 1 10acid concentration (mol L-1)
TK (
°C)
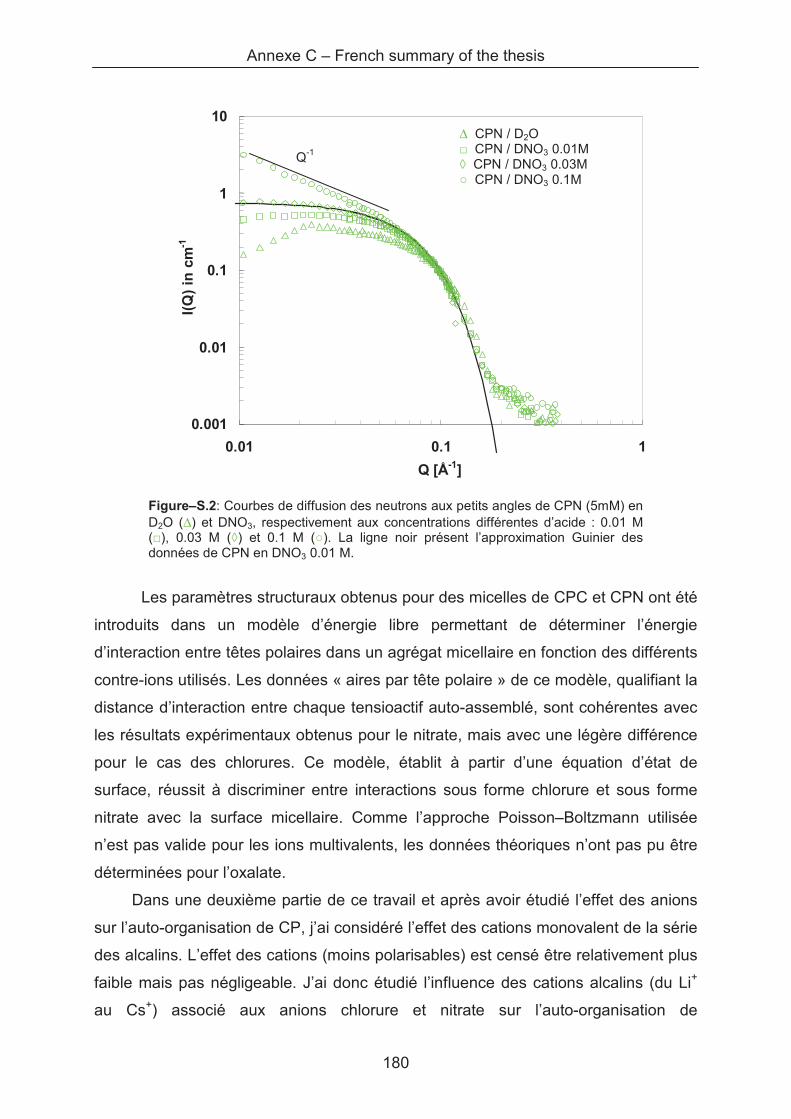
Annexe C – French summary of the thesis
180
0.001
0.01
0.1
1
10
0.01 0.1 1
Q [Å-1]
I(Q
) in
cm
-1
Figure–S.2: Courbes de diffusion des neutrons aux petits angles de CPN (5mM) en D2O (∆) et DNO3, respectivement aux concentrations différentes d’acide : 0.01 M (�), 0.03 M (�) et 0.1 M (�). La ligne noir présent l’approximation Guinier des données de CPN en DNO3 0.01 M.
Les paramètres structuraux obtenus pour des micelles de CPC et CPN ont été
introduits dans un modèle d’énergie libre permettant de déterminer l’énergie
d’interaction entre têtes polaires dans un agrégat micellaire en fonction des différents
contre-ions utilisés. Les données « aires par tête polaire » de ce modèle, qualifiant la
distance d’interaction entre chaque tensioactif auto-assemblé, sont cohérentes avec
les résultats expérimentaux obtenus pour le nitrate, mais avec une légère différence
pour le cas des chlorures. Ce modèle, établit à partir d’une équation d’état de
surface, réussit à discriminer entre interactions sous forme chlorure et sous forme
nitrate avec la surface micellaire. Comme l’approche Poisson–Boltzmann utilisée
n’est pas valide pour les ions multivalents, les données théoriques n’ont pas pu être
déterminées pour l’oxalate.
Dans une deuxième partie de ce travail et après avoir étudié l’effet des anions
sur l’auto-organisation de CP, j’ai considéré l’effet des cations monovalent de la série
des alcalins. L’effet des cations (moins polarisables) est censé être relativement plus
faible mais pas négligeable. J’ai donc étudié l’influence des cations alcalins (du Li+
au Cs+) associé aux anions chlorure et nitrate sur l’auto-organisation de
Q-1
∆ CPN / D2O � CPN / DNO3 0.01M � CPN / DNO3 0.03M � CPN / DNO3 0.1M
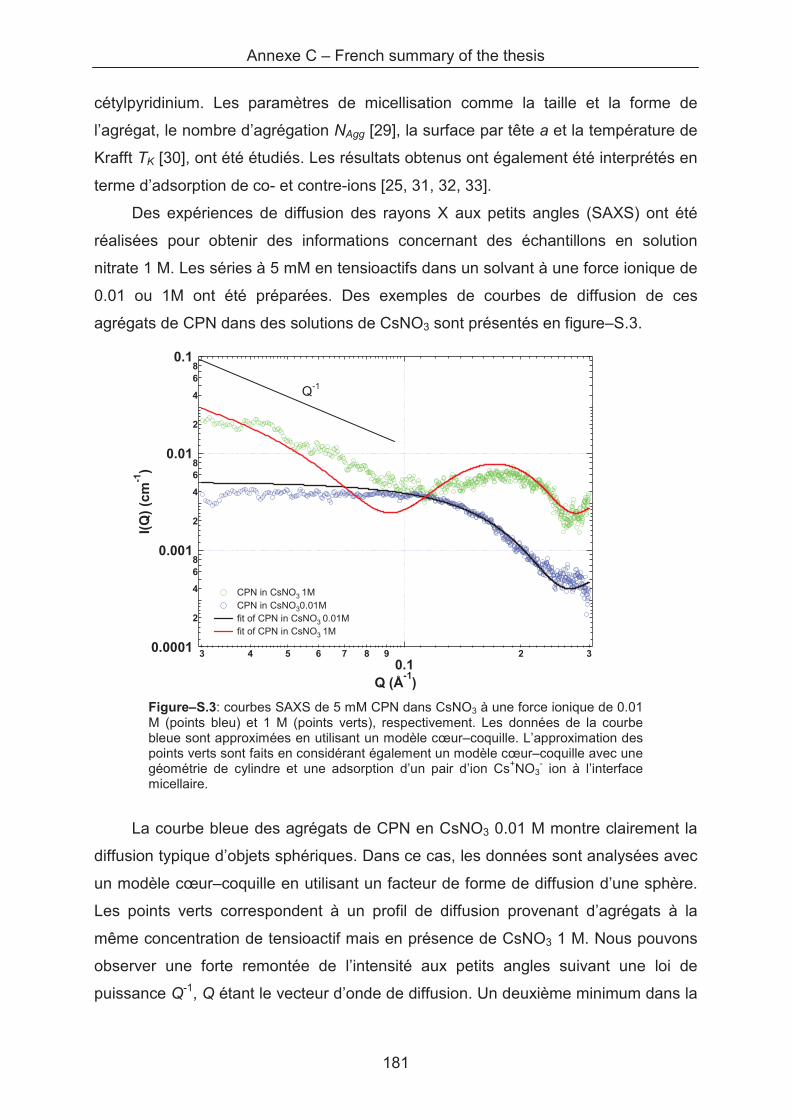
Annexe C – French summary of the thesis
181
cétylpyridinium. Les paramètres de micellisation comme la taille et la forme de
l’agrégat, le nombre d’agrégation NAgg [29], la surface par tête a et la température de
Krafft TK [30], ont été étudiés. Les résultats obtenus ont également été interprétés en
terme d’adsorption de co- et contre-ions [25, 31, 32, 33].
Des expériences de diffusion des rayons X aux petits angles (SAXS) ont été
réalisées pour obtenir des informations concernant des échantillons en solution
nitrate 1 M. Les séries à 5 mM en tensioactifs dans un solvant à une force ionique de
0.01 ou 1M ont été préparées. Des exemples de courbes de diffusion de ces
agrégats de CPN dans des solutions de CsNO3 sont présentés en figure–S.3.
0.0001
2
4
68
0.001
2
4
68
0.01
2
4
68
0.1
I(Q
) (c
m-1
)
3 4 5 6 7 8 90.1
2 3
Q (Å-1
)
CPN in CsNO3 1M CPN in CsNO30.01M fit of CPN in CsNO3 0.01M fit of CPN in CsNO3 1M
Figure–S.3: courbes SAXS de 5 mM CPN dans CsNO3 à une force ionique de 0.01 M (points bleu) et 1 M (points verts), respectivement. Les données de la courbe bleue sont approximées en utilisant un modèle cœur–coquille. L’approximation des points verts sont faits en considérant également un modèle cœur–coquille avec une géométrie de cylindre et une adsorption d’un pair d’ion Cs+NO3
- ion à l’interface micellaire.
La courbe bleue des agrégats de CPN en CsNO3 0.01 M montre clairement la
diffusion typique d’objets sphériques. Dans ce cas, les données sont analysées avec
un modèle cœur–coquille en utilisant un facteur de forme de diffusion d’une sphère.
Les points verts correspondent à un profil de diffusion provenant d’agrégats à la
même concentration de tensioactif mais en présence de CsNO3 1 M. Nous pouvons
observer une forte remontée de l’intensité aux petits angles suivant une loi de
puissance Q-1, Q étant le vecteur d’onde de diffusion. Un deuxième minimum dans la
Q-1
Annexe C – French summary of the thesis
182
région de 0.1 Å-1 est clairement identifié et peut être attribué à la signature de
l’adsorption d’une paire d’ion Cs+NO3- dans la couronne micellaire.
Dans cette partie il était important de s’assurer de la présence d’un seul type de
contre-ion dans la solution au cours de la préparation. La géométrie des micelles a
aussi été validée par d’autres techniques complémentaires comme la diffusion de la
lumière ou des neutrons techniques permettant d’analyser les structures avec des
contrastes différents. J’ai démontré que comme dans des études précédentes les
sels alcalins de chlorure font apparaitre une moindre influence sur l’auto-organisation
et la géométrie des micelles ; quelques soient les paramètres de force ionique ou de
température, les micelles sont sphériques. Par contre, dans les solutions des nitrates
d’alcalins, les tensioactifs s’auto-assemblent pour former des cylindres si la force
ionique est suffisamment élevée (> 0.01 M). Cette transition de forme est interprétée
comme étant liée à l’adsorption des nitrates, des anions plus hydrophobes que les
ions chlorures, ce qui entraine une réduction de la surface d’interaction ou l’aire par
tête du tensioactif et permet ainsi une organisation dans une géométrie cylindrique
caractéristique d’une courbure moins prononcée de la surface des micelles (au
moins dans une direction – l’axe des cylindres). Une interprétation des analyses
quantitatives obtenue des courbes de diffusion des agrégats de CP en CsNO3 1 M
est bien l’adsorption d’une paire d’ion Cs+NO3- par tête de pyridinium, dans la
couronne de la micelle. Dans l’ensemble, les ions alcalins montrent un effet faible
mais mesurable sur les paramètres de micellisation. En conséquence, l’influence des
ions alcalins ne doit pas être omise dans l’évaluation de ces paramètres, même si
l’effet des anions sur l’auto-organisation des tensioactifs cationiques est plus
prononcé.
La troisième partie de cette étude concerne l’effet des cations métalliques
multivalents sur l’auto-agrégation des tensioactifs cétylpyridinium. A cette fin on a
choisi des ions métalliques divalents (Cu2+, Zn2+ and UO22+), trivalents (Nd3+, Eu3+,
Fe3+) et tétravalents (Th4+) dans leur forme chlorure et nitrate. L’influence de la force
ionique ainsi que le rôle des anions sur le procédé d’extraction en jouant avec la
température de Krafft a donc été étudiées. Je me suis intéressé à la structure de
l’auto-association des cétylpyridinium dans la solution et dans le précipité (en
dessous de la température de Krafft, en présence des ions métalliques. Les données
concernant la stœchiométrie et l’efficacité de l’extraction sous conditions variables
ont été discutées.
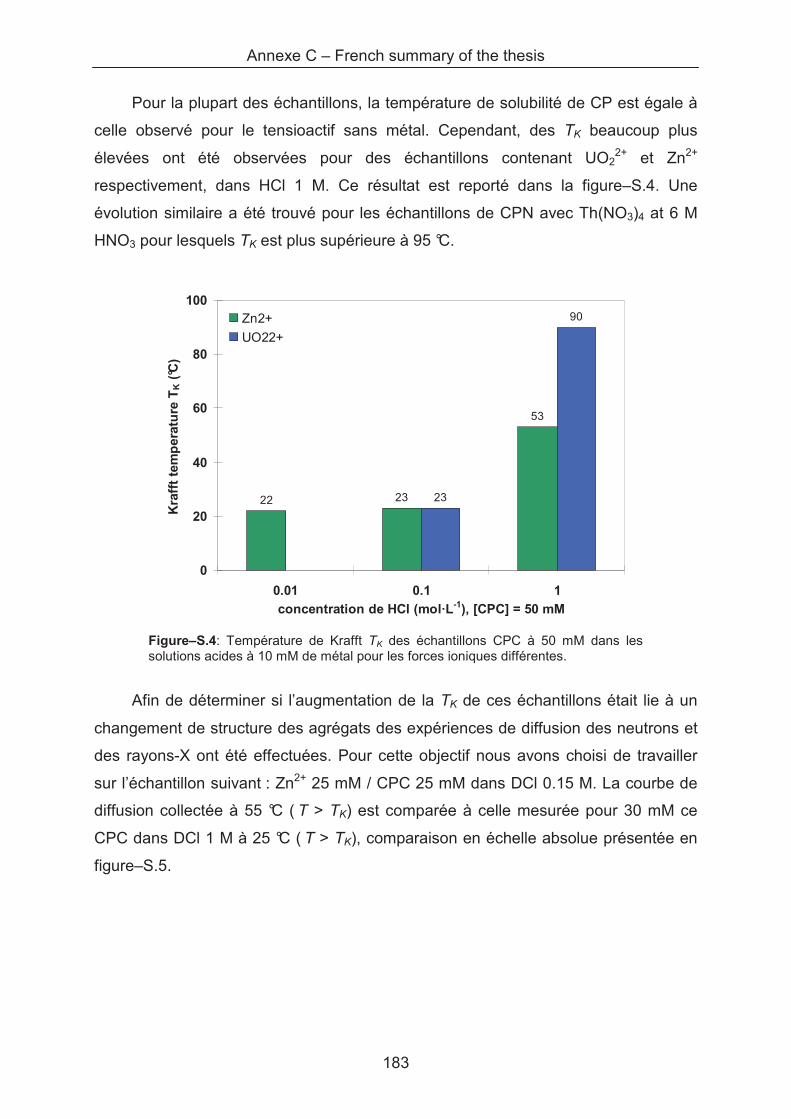
Annexe C – French summary of the thesis
183
Pour la plupart des échantillons, la température de solubilité de CP est égale à
celle observé pour le tensioactif sans métal. Cependant, des TK beaucoup plus
élevées ont été observées pour des échantillons contenant UO22+ et Zn2+
respectivement, dans HCl 1 M. Ce résultat est reporté dans la figure–S.4. Une
évolution similaire a été trouvé pour les échantillons de CPN avec Th(NO3)4 at 6 M
HNO3 pour lesquels TK est plus supérieure à 95 °C.
22 23
53
23
90
0
20
40
60
80
100
0.01 0.1 1
concentration de HCl (mol·L-1), [CPC] = 50 mM
Kra
fft
tem
pera
ture
TK (
°C)
Zn2+
UO22+
Figure–S.4: Température de Krafft TK des échantillons CPC à 50 mM dans les solutions acides à 10 mM de métal pour les forces ioniques différentes.
Afin de déterminer si l’augmentation de la TK de ces échantillons était lie à un
changement de structure des agrégats des expériences de diffusion des neutrons et
des rayons-X ont été effectuées. Pour cette objectif nous avons choisi de travailler
sur l’échantillon suivant : Zn2+ 25 mM / CPC 25 mM dans DCl 0.15 M. La courbe de
diffusion collectée à 55 °C ( T > TK) est comparée à celle mesurée pour 30 mM ce
CPC dans DCl 1 M à 25 °C ( T > TK), comparaison en échelle absolue présentée en
figure–S.5.
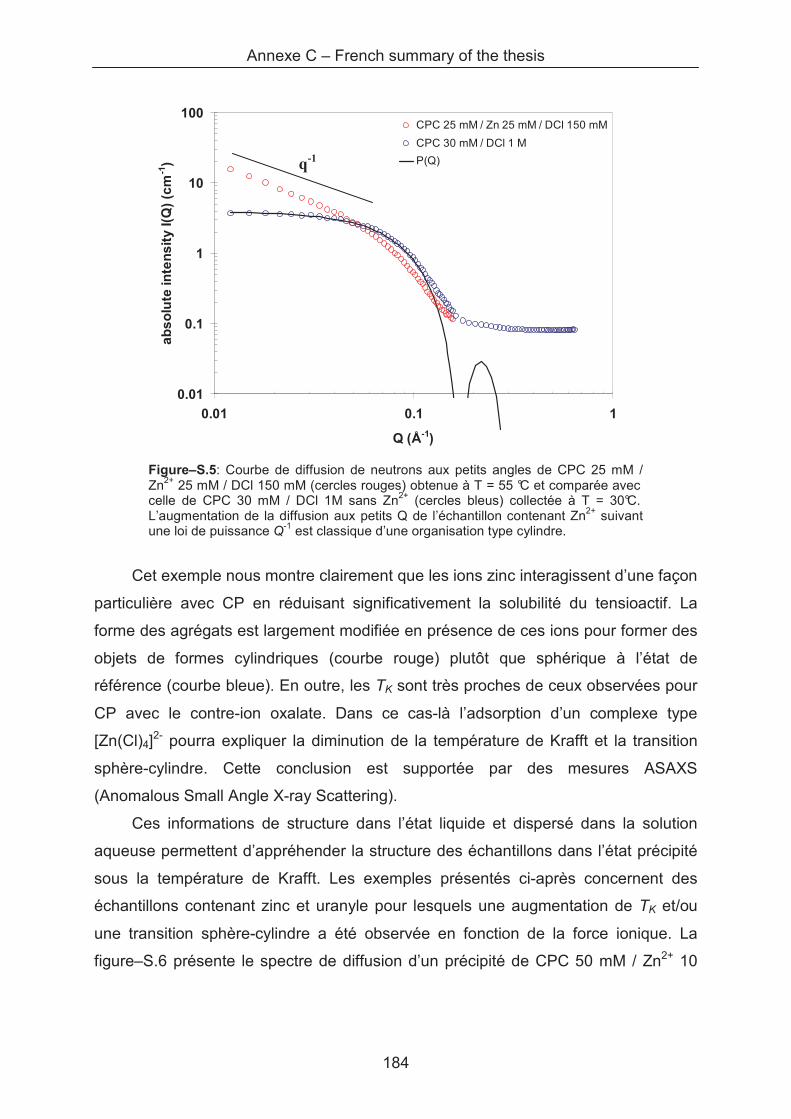
Annexe C – French summary of the thesis
184
0.01
0.1
1
10
100
0.01 0.1 1
Q (Å-1)
ab
so
lute
inte
ns
ity
I(Q
) (c
m-1
)
CPC 25 mM / Zn 25 mM / DCl 150 mM
CPC 30 mM / DCl 1 M
P(Q)
Figure–S.5: Courbe de diffusion de neutrons aux petits angles de CPC 25 mM / Zn2+ 25 mM / DCl 150 mM (cercles rouges) obtenue à T = 55 °C et comparée avec celle de CPC 30 mM / DCl 1M sans Zn2+ (cercles bleus) collectée à T = 30°C. L’augmentation de la diffusion aux petits Q de l’échantillon contenant Zn2+ suivant une loi de puissance Q-1 est classique d’une organisation type cylindre.
Cet exemple nous montre clairement que les ions zinc interagissent d’une façon
particulière avec CP en réduisant significativement la solubilité du tensioactif. La
forme des agrégats est largement modifiée en présence de ces ions pour former des
objets de formes cylindriques (courbe rouge) plutôt que sphérique à l’état de
référence (courbe bleue). En outre, les TK sont très proches de ceux observées pour
CP avec le contre-ion oxalate. Dans ce cas-là l’adsorption d’un complexe type
[Zn(Cl)4]2- pourra expliquer la diminution de la température de Krafft et la transition
sphère-cylindre. Cette conclusion est supportée par des mesures ASAXS
(Anomalous Small Angle X-ray Scattering).
Ces informations de structure dans l’état liquide et dispersé dans la solution
aqueuse permettent d’appréhender la structure des échantillons dans l’état précipité
sous la température de Krafft. Les exemples présentés ci-après concernent des
échantillons contenant zinc et uranyle pour lesquels une augmentation de TK et/ou
une transition sphère-cylindre a été observée en fonction de la force ionique. La
figure–S.6 présente le spectre de diffusion d’un précipité de CPC 50 mM / Zn2+ 10
q-1
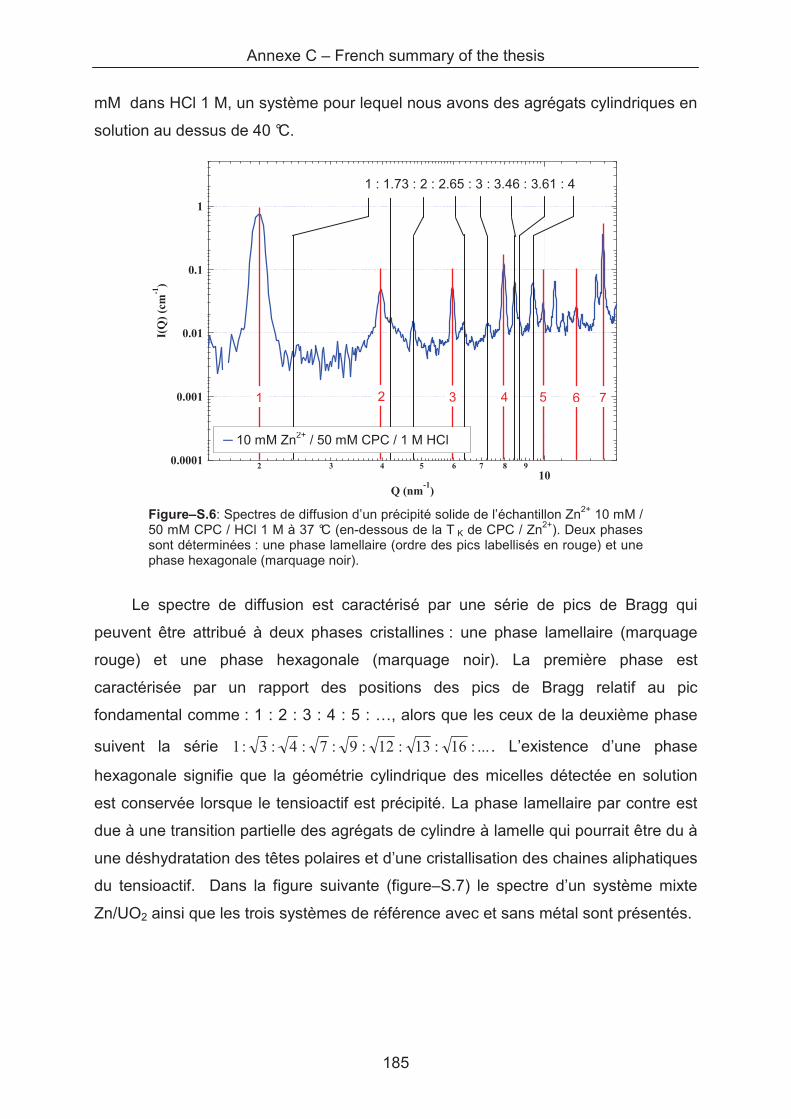
Annexe C – French summary of the thesis
185
mM dans HCl 1 M, un système pour lequel nous avons des agrégats cylindriques en
solution au dessus de 40 °C.
0.0001
0.001
0.01
0.1
1
I(Q
) (c
m-1
)
2 3 4 5 6 7 8 9
10
Q (nm-1
)
10 mM Zn2+
/ 50 mM CPC / 1M HCl
Figure–S.6: Spectres de diffusion d’un précipité solide de l’échantillon Zn2+ 10 mM / 50 mM CPC / HCl 1 M à 37 °C (en-dessous de la T K de CPC / Zn2+). Deux phases sont déterminées : une phase lamellaire (ordre des pics labellisés en rouge) et une phase hexagonale (marquage noir).
Le spectre de diffusion est caractérisé par une série de pics de Bragg qui
peuvent être attribué à deux phases cristallines : une phase lamellaire (marquage
rouge) et une phase hexagonale (marquage noir). La première phase est
caractérisée par un rapport des positions des pics de Bragg relatif au pic
fondamental comme : 1 : 2 : 3 : 4 : 5 : …, alors que les ceux de la deuxième phase
suivent la série ...:16:13:12:9:7:4:3:1 . L’existence d’une phase
hexagonale signifie que la géométrie cylindrique des micelles détectée en solution
est conservée lorsque le tensioactif est précipité. La phase lamellaire par contre est
due à une transition partielle des agrégats de cylindre à lamelle qui pourrait être du à
une déshydratation des têtes polaires et d’une cristallisation des chaines aliphatiques
du tensioactif. Dans la figure suivante (figure–S.7) le spectre d’un système mixte
Zn/UO2 ainsi que les trois systèmes de référence avec et sans métal sont présentés.
1 : 1.73 : 2 : 2.65 : 3 : 3.46 : 3.61 : 4
21 3
� 10 mM Zn2+ / 50 mM CPC / 1 M HCl
4 5 6 7
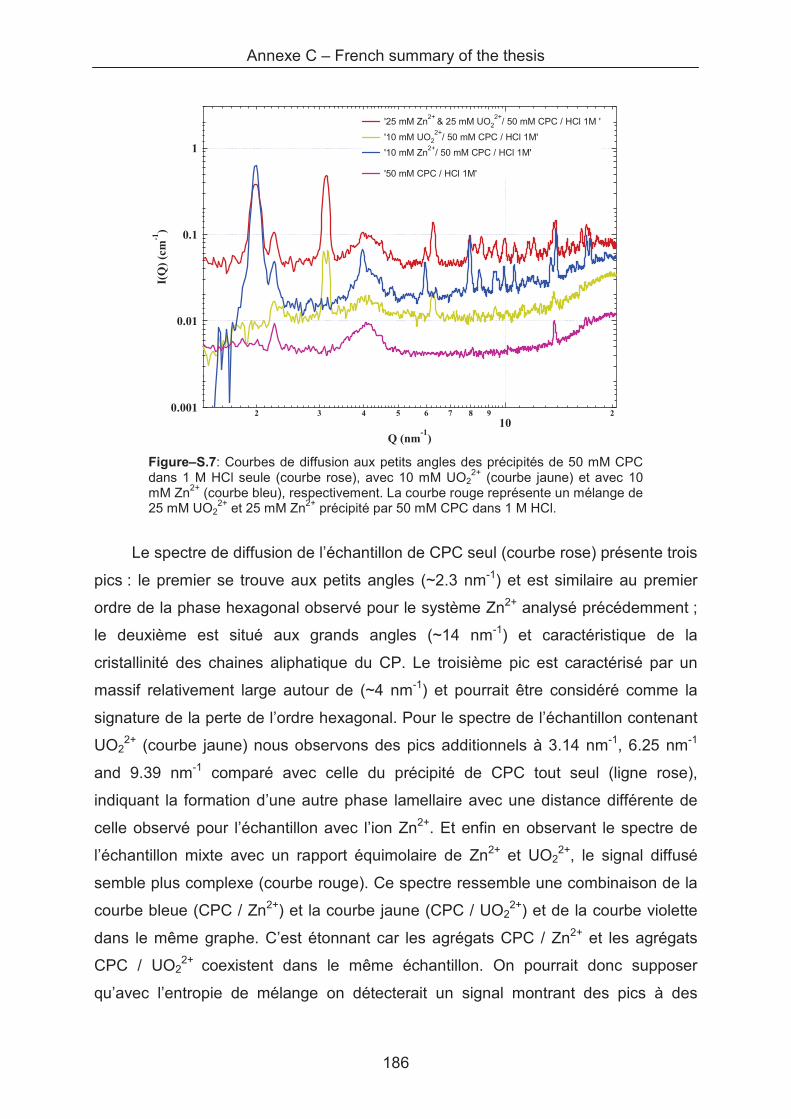
Annexe C – French summary of the thesis
186
0.001
0.01
0.1
1I(
Q)
(cm
-1)
2 3 4 5 6 7 8 9
102
Q (nm-1
)
'25 mM Zn2+
& 25 mM UO22+
/ 50 mM CPC / HCl 1M '
'10 mM UO22+
/ 50 mM CPC / HCl 1M'
'10 mM Zn2+
/ 50 mM CPC / HCl 1M'
'50 mM CPC / HCl 1M'
Figure–S.7: Courbes de diffusion aux petits angles des précipités de 50 mM CPC dans 1 M HCl seule (courbe rose), avec 10 mM UO2
2+ (courbe jaune) et avec 10 mM Zn2+ (courbe bleu), respectivement. La courbe rouge représente un mélange de 25 mM UO2
2+ et 25 mM Zn2+ précipité par 50 mM CPC dans 1 M HCl.
Le spectre de diffusion de l’échantillon de CPC seul (courbe rose) présente trois
pics : le premier se trouve aux petits angles (~2.3 nm-1) et est similaire au premier
ordre de la phase hexagonal observé pour le système Zn2+ analysé précédemment ;
le deuxième est situé aux grands angles (~14 nm-1) et caractéristique de la
cristallinité des chaines aliphatique du CP. Le troisième pic est caractérisé par un
massif relativement large autour de (~4 nm-1) et pourrait être considéré comme la
signature de la perte de l’ordre hexagonal. Pour le spectre de l’échantillon contenant
UO22+ (courbe jaune) nous observons des pics additionnels à 3.14 nm-1, 6.25 nm-1
and 9.39 nm-1 comparé avec celle du précipité de CPC tout seul (ligne rose),
indiquant la formation d’une autre phase lamellaire avec une distance différente de
celle observé pour l’échantillon avec l’ion Zn2+. Et enfin en observant le spectre de
l’échantillon mixte avec un rapport équimolaire de Zn2+ et UO22+, le signal diffusé
semble plus complexe (courbe rouge). Ce spectre ressemble une combinaison de la
courbe bleue (CPC / Zn2+) et la courbe jaune (CPC / UO22+) et de la courbe violette
dans le même graphe. C’est étonnant car les agrégats CPC / Zn2+ et les agrégats
CPC / UO22+ coexistent dans le même échantillon. On pourrait donc supposer
qu’avec l’entropie de mélange on détecterait un signal montrant des pics à des
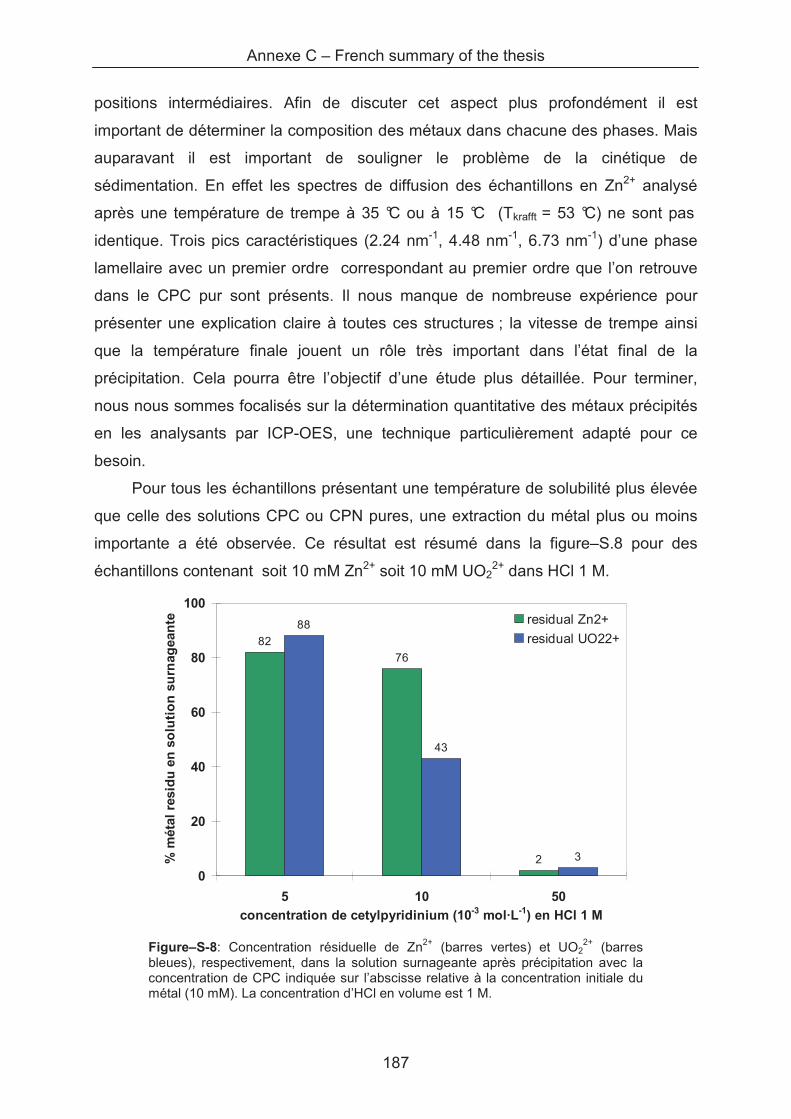
Annexe C – French summary of the thesis
187
positions intermédiaires. Afin de discuter cet aspect plus profondément il est
important de déterminer la composition des métaux dans chacune des phases. Mais
auparavant il est important de souligner le problème de la cinétique de
sédimentation. En effet les spectres de diffusion des échantillons en Zn2+ analysé
après une température de trempe à 35 °C ou à 15 °C (Tkrafft = 53 °C) ne sont pas
identique. Trois pics caractéristiques (2.24 nm-1, 4.48 nm-1, 6.73 nm-1) d’une phase
lamellaire avec un premier ordre correspondant au premier ordre que l’on retrouve
dans le CPC pur sont présents. Il nous manque de nombreuse expérience pour
présenter une explication claire à toutes ces structures ; la vitesse de trempe ainsi
que la température finale jouent un rôle très important dans l’état final de la
précipitation. Cela pourra être l’objectif d’une étude plus détaillée. Pour terminer,
nous nous sommes focalisés sur la détermination quantitative des métaux précipités
en les analysants par ICP-OES, une technique particulièrement adapté pour ce
besoin.
Pour tous les échantillons présentant une température de solubilité plus élevée
que celle des solutions CPC ou CPN pures, une extraction du métal plus ou moins
importante a été observée. Ce résultat est résumé dans la figure–S.8 pour des
échantillons contenant soit 10 mM Zn2+ soit 10 mM UO22+ dans HCl 1 M.
82
76
2
88
43
3
0
20
40
60
80
100
5 10 50
concentration de cetylpyridinium (10-3 mol·L-1) en HCl 1 M
% m
éta
l re
sid
u e
n s
olu
tio
n s
urn
ag
ean
te residual Zn2+
residual UO22+
Figure–S-8: Concentration résiduelle de Zn2+ (barres vertes) et UO22+ (barres
bleues), respectivement, dans la solution surnageante après précipitation avec la concentration de CPC indiquée sur l’abscisse relative à la concentration initiale du métal (10 mM). La concentration d’HCl en volume est 1 M.
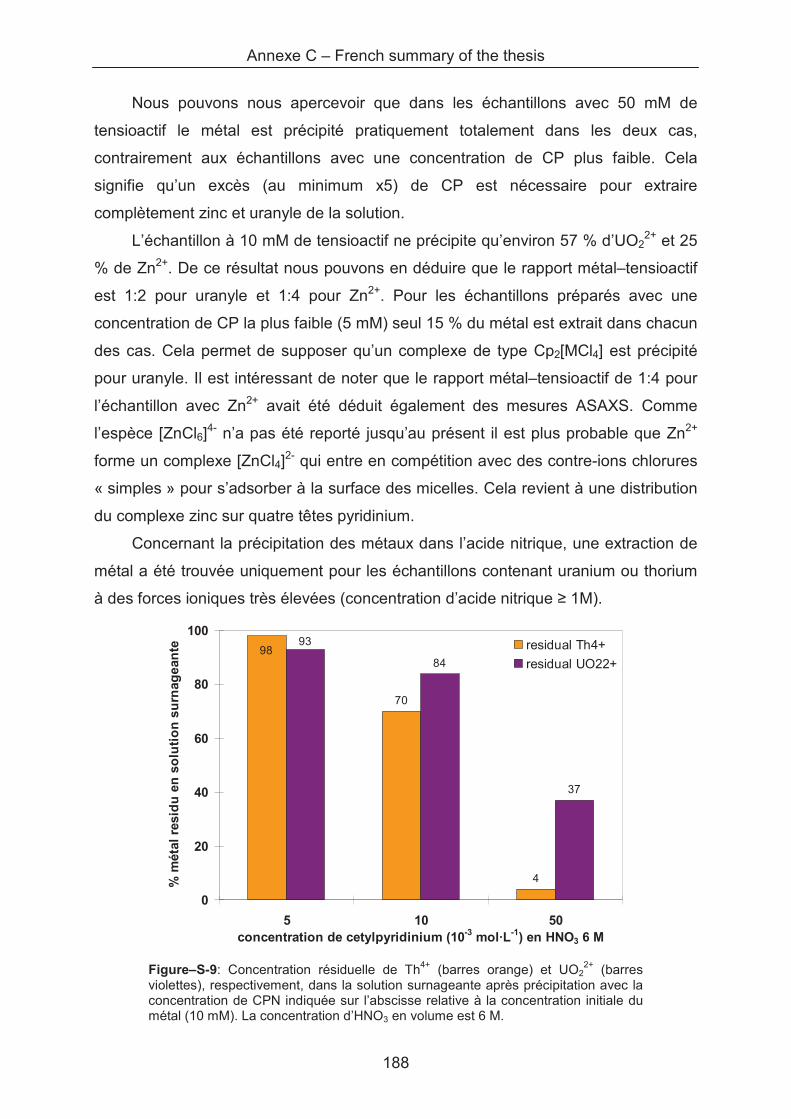
Annexe C – French summary of the thesis
188
Nous pouvons nous apercevoir que dans les échantillons avec 50 mM de
tensioactif le métal est précipité pratiquement totalement dans les deux cas,
contrairement aux échantillons avec une concentration de CP plus faible. Cela
signifie qu’un excès (au minimum x5) de CP est nécessaire pour extraire
complètement zinc et uranyle de la solution.
L’échantillon à 10 mM de tensioactif ne précipite qu’environ 57 % d’UO22+ et 25
% de Zn2+. De ce résultat nous pouvons en déduire que le rapport métal–tensioactif
est 1:2 pour uranyle et 1:4 pour Zn2+. Pour les échantillons préparés avec une
concentration de CP la plus faible (5 mM) seul 15 % du métal est extrait dans chacun
des cas. Cela permet de supposer qu’un complexe de type Cp2[MCl4] est précipité
pour uranyle. Il est intéressant de noter que le rapport métal–tensioactif de 1:4 pour
l’échantillon avec Zn2+ avait été déduit également des mesures ASAXS. Comme
l’espèce [ZnCl6]4- n’a pas été reporté jusqu’au présent il est plus probable que Zn2+
forme un complexe [ZnCl4]2- qui entre en compétition avec des contre-ions chlorures
« simples » pour s’adsorber à la surface des micelles. Cela revient à une distribution
du complexe zinc sur quatre têtes pyridinium.
Concernant la précipitation des métaux dans l’acide nitrique, une extraction de
métal a été trouvée uniquement pour les échantillons contenant uranium ou thorium
à des forces ioniques très élevées (concentration d’acide nitrique � 1M).
70
4
84
37
9893
0
20
40
60
80
100
5 10 50concentration de cetylpyridinium (10-3 mol·L-1) en HNO3 6 M
% m
éta
l re
sid
u e
n s
olu
tio
n s
urn
ag
ean
te residual Th4+
residual UO22+
Figure–S-9: Concentration résiduelle de Th4+ (barres orange) et UO22+ (barres
violettes), respectivement, dans la solution surnageante après précipitation avec la concentration de CPN indiquée sur l’abscisse relative à la concentration initiale du métal (10 mM). La concentration d’HNO3 en volume est 6 M.
Annexe C – French summary of the thesis
189
Dans ce contexte il faut mentionner que nous n’avons pas observée une
augmentation de la TK pour les séries CPN / UO22+ / 1 M HNO3 et CPN / Th4+ / 1 M
HNO3. Une augmentation forte de TK était uniquement observée pour l’échantillon
CPN / Th4+ / 6 M HNO3. Les résultats d’extraction sont présentés sur la figure–S.9
pour des solutions fortement acides (6 M HNO3).
Il est clair sur cette dernière figure que 50 mM de tensioactif permettent une
extraction quasi-totale du Th4+ de la solution tandis que seuls environ les deux tiers
de l’uranyle sont précipités dans les mêmes conditions. Ce résultat est expliqué par
une interaction faible entre UO22+ et nitrate [34, 35], c’est-à-dire que les complexes
anioniques sont juste partiellement formés à ces concentrations d’acide [36, 37].
Contrairement au thorium qui forme le complexe Th(NO3)62- dans l’acide nitrique 6 M
[38] et qui peut donc être précipité de la solution par le tensioactif disponible. Nous
observons de façon similaire au cas précédent en chlorure qu’un degré d’extraction
plus faible à un ratio équimolaire de métal–tensioactif (échantillons à 10 mM CP) ne
permet pas d’extraire le métal et qu’un excès de CP est nécessaire pour une
séparation quantitative.
Pour conclure l’ensemble de ces travaux, il a été supposé par Heckmann et
collaborateurs que des tensioactifs cationiques type cétylpyridinium étaient capables
de précipiter des complexes anioniques des métaux d’une solution acide. Nous
avons confirmé ces hypothèses et déterminé qu’un excès de tensioactifs était
nécessaire pour précipiter le métal dans sa quasi-totalité. Pour une extraction du
métal par précipitation du tensioactif en dessous de la température de Krafft, il faut
une interaction forte de type adsorption entre un complexe anionique de l’ion avec
les anions de la solution acide sur la surface des micelles entrainant alors une
augmentation important de la température de Krafft. Dans tous les cas dans lesquels
TK augmente, les métaux ont été extraits. Il existe néanmoins des cas comme celui
du Thorium dans HNO3 1 M pour lesquels nous observons une extraction partielle et
non négligeable sans une réelle augmentation de la température de Krafft. Une
explication dans ce cas est que le complexe anionique formé n’est que monovalent
et donc pas fortement adsorbé à la surface des micelles. C’est pourquoi une petite
partie des ions est alors entrainée par sédimentation sous le seuil de solubilité.
Les précipités de CP contenant des métaux montrent une riche variété de
phases qui parfois coexistent dans le même échantillon. D’autres études sont

Annexe C – French summary of the thesis
190
nécessaires pour clarifier ce point. La formation de structure dans les précipités est
d’un grand intérêt pour la conception de précurseurs car la mésophase précipitée
pourrait guider la fabrication d’un échantillon mésoporeux du métal dans les
conditions adéquates. En outre, la cinétique de précipitation joue un rôle primordial et
détermine l’efficacité d’extraction du métal. Mais cela fera l’objet d’une étude future.
Annexe C – French summary of the thesis
191
Références :
[1] MERIDIANO, Y., BERTHON, L., CROZES, X., SOREL, C., DANNUS, P., ANTONIO, M. R.,CHIARIZIA, R., AND ZEMB, T.: "Aggregation in organic solutions of malonamides: consequences for water extraction". Solvent Extraction and Ion Exchange 27, 5 (2009), 607–637.
[2] TESTARD, F., BAUDUIN, P., MARTINET, L., ABECASSIS, B., BERTHON, L., MADIC, C.,AND ZEMB, T.: "Self-assembling properties of malonamide extractants used in separation processes". Radiochimica Acta 96, 4-5 (May 2008), 265–272.
[3] NAVE, S., MANDIN, C., MARTINET, L., BERTHON, L., TESTARD, F., MADIC, C., AND
ZEMB, T.: "Supramolecular organisation of tri-n-butyl phosphate in organic diluent on approaching third phase transition". Physical Chemistry Chemical Physics 6, 4 (2004), 799–808.
[4] BERTHON, L., MARTINET, L., TESTARD, F., MADIC, C., AND ZEMB, T.: "Solvent penetration and sterical stabilization of reverse aggregates based on the DIAMEX process extracting molecules: Consequences for the third phase formation". Solvent Extraction And Ion Exchange 25, 5 (Sep-Oct 2007), 545–576.
[5] TESTARD, F., BERTHON, L., AND ZEMB, T.: "Liquid-liquid extraction: An adsorption isotherm at divided interface?". Comptes Rendus Chimie 10, 10-11 (2007), 1034–1041.
[6] STRNAD, J., HECKMANN, K., AND GOMPPER, K.: "Separation of plutonium from intermediate level liquid waste by precipitation with alkyl-pyridinium nitrates". Monatshefte Für Chemie 120, 1 (Jan. 1989), 21–23.
[7] STRNAD, J., AND HECKMANN, K.: "Separation of actinides with alkylpyridinium salts". Journal Of Radioanalytical And Nuclear Chemistry-Articles 163, 1 (Nov 1992), 47–57.
[8] HECKMANN, K. AND SPURNY, J.: "Process for the selective separation of uranium from accompanying metals", United States Patent 4,486,392. Dec 4, 1984.
[9] HECKMANN, K. AND SPURNY, J.: "Process for selective separation of plutonium from uranium and other metals", United States Patent 4,609,533. Sep 2, 1986.
[10] KUNZ, W., HENLE, J., AND NINHAM, B.: "’Zur Lehre von der Wirkung der Salze’ (about the science of the effect of salts): Franz Hofmeister’s historical papers". Current Opinion in Colloid and Interfaces Science 9, 1-2 (Aug 2004), 19–37.
[11] ZHANG, Y., AND CREMER, P.: "Interactions between macromolecules and ions: The Hofmeister series". Current Opinion in Chemical Biology 10, 6 (2006), 658–663. Model systems / Biopolymers.
Annexe C – French summary of the thesis
192
[12] PINNA, M., BAUDUIN, P., TOURAUD, D., MONDUZZI, M., NINHAM, B., AND KUNZ, W.: "Hofmeister effects in biology: Effect of choline addition on the salt-induced super activity of horseradish peroxidase and its implication for salt resistance of plants". Journal Of Physical Chemistry B 109, 34 (Sep 1, 2005), 16511–16514.
[13] SCHWIERZ, N., HORINEK, D., AND NETZ, R.: "Reversed anionic Hofmeister series: The interplay of surface charge and surface polarity". Langmuir 26, 10 (May 18, 2010), 7370–7379.
[14] LEONTIDIS, E.: "Hofmeister anion effects on surfactant self-assembly and the formation of mesoporous solids". Current Opinion in Colloid & Interface Science 7, 1-2 (2002), 81–91.
[15] VLACHY, N., JAGODA-CWIKLIK, B., VACHA, R., TOURAUD, D., JUNGWIRTH, P., AND
KUNZ, W.: "Hofmeister series and specific interactions of charged headgroups with aqueous ions". Advances in Colloid and Interface Science 146, 1-2 (2009), 42–47.
[16] LO NOSTRO, P., LO NOSTRO, A., NINHAM, B., PESAVENTO, G., FRATONI, L., AND
BAGLIONI, P.: "Hofmeister specific ion effects in two biological systems". Current Opinion in Colloid & Interface Science 9, 1-2 (2004), 97–101.
[17] COLLINS, K.: "Charge density-dependent strength of hydration and biological structure". Biophysical Journal 72, 1 (Jan 1997), 65–76.
[18] HEDIN, N., AND FURO, I.: "Fast diffusion of Br- ions on a micellar surface". The Journal of Physical Chemistry B 103, 44 (1999), 9640–9644.
[19] HEDIN, N., FURO, I., AND ERIKSSON, P. O.: "Fast diffusion of the Cl- ion in the headgroup region of an oppositely charged micelle. A 35Cl–NMR spin relaxation study". The Journal of Physical Chemistry B 104, 35 (2000), 8544–8547.
[20] BOSTROM, M., WILLIAMS, D. R. M., AND NINHAM, B. W.: "Ion specificity of micelles explained by ionic dispersion forces". Langmuir 18, 16 (2002), 6010–6014.
[21] GENG, Y., ROMSTED, L., FROEHNER, S., ZANETTE, D., MAGID, L., CUCCOVIA, I., AND
CHAIMOVICH, H.: "Origin of the sphere-to-rod transition in cationic micelles with aromatic counterions: specific ion hydration in the interfacial region matters". Langmuir 21, 2 (Jan 18, 2005), 562–568.
[22] ROMSTED, L.: "Do amphiphile aggregate morphologies and interfacial compositions depend primarily on interfacial hydration and ion-specific interactions? The evidence from chemical trapping". Langmuir 23, 2 (Jan 16, 2007), 414–424.
[23] VLACHY, N., DRECHSLER, M., VERBAVATZ, J.-M., TOURAUD, D., AND KUNZ, W.: "Role of the surfactant headgroup on the counterion specificity in the micelle-to-vesicle transition through salt addition". Journal of Colloid and Interface Science 319, 2 (Mar 15, 2008), 542–548.
Annexe C – French summary of the thesis
193
[24] KUMAR, S., BANSAL, D., AND KABIR-UD-DIN.: "Micellar growth in the presence of salts and aromatic hydrocarbons: influence of the nature of the salt". Langmuir 15, 15 (July 1999), 4960–4965.
[25] ABEZGAUZ, L., KUPERKAR, K., HASSAN, P. A., RAMON, O., BAHADUR, P., AND
DANINO, D.: "Effect of Hofmeister anions on micellization and micellar growth of the surfactant cetylpyridinium chloride". Journal Of Colloid And Interface Science 342, 1 (Feb 1, 2010), 83–92.
[26] ASWAL, V., GOYAL, P., MENON, S., AND DASANNACHARYA, B.: "Role of inter-micellar interaction on micellar growth". Physica B 213, (Aug 1995), 607–609.
[27] ASWAL, V., AND GOYAL, P.: "Role of counterion distribution on the structure of micelles in aqueous salt solutions: small-angle neutron scattering study". Chemical Physics Letters 357, 5-6 (May 17, 2002), 491–497.
[28] BHAT, M., DAR, A., AMIN, A., AND RATHER, G.: "Co- and counterion effect on the micellization characteristics of dodecylpyridinium chloride". Journal of Dispersion Science and Technology 29, 4 (Apr 2008), 514–520.
[29] ANACKER, E.: "Light scattering by cetylpyridinium chloride solutions". Journal of Physical Chemistry 62, 1 (1958), 41–45.
[30] HECKMANN, K., SCHWARZ, R., AND STRNAD, J.: "Determination of Krafft point and cmc of hexadecylpyridinium salts in electrolyte solutions". Journal of Colloid and Interface Science 120, 1 (Nov. 1987), 114–117.
[31] ASWAL, V., AND GOYAL, P.: "Dependence of the size of micelles on the salt effect in ionic micellar solutions". Chemical Physics Letters 364, 1-2 (Sep 23, 2002), 44–50.
[32] IKEDA, S., AND FUJIO, K.: "The salt-induced sphere-rod transition of micelles of dodecylpyridinium iodide in aqueous NaI solutions". Colloid And Polymer Science 270, 10 (Oct 1992), 1009–1017.
[33] MUKERJEE, P., AND RAY, A.: “The specifity of counterion adsorption to micelles of dodecylpyridinium iodide and their critical concentrations”. Jounal of Physical Chemistry 70, (1966), 2150–2157.
[34] SULEIMENOV, O., SEWARD, T., AND HOVEY, J.: "A spectrophotometric study on uranyl nitrate complexation to 150 °C". Journal of Solution Chemistry 36, (2007), 1093–1102.
[35] YE, X., SMITH, R. B., CUI, S., DE ALMEIDA, V., AND KHOMAMI, B.: “Influence of nitric acid on uranyl nitrate association in aqueous solutions: A molecular dynamics simulation study”. Solvent Extraction and Ion Exchange 28, 1 (2010), 1–18.
Annexe C – French summary of the thesis
194
[36] MOULIN, C., DECAMBOX, P., AND MAUCHIEN, P.: "State of the art in time-resolved laser-induced fluorescence for actinides analysis: Applications and trends". Journal Of Radioanalytical And Nuclear Chemistry 226, 1-2 (Dec 1997), 135–138. 6th International Conference on Low-Level Measurements of Actinides and Long-Lived Radionuclides in Biological and Environmental Samples, Cherbourg, France, Sep 09-13, 1996.
[37] MOULIN, C.: "On the use of time-resolved laser-induced fluorescence (TRLIF) and electrospray mass spectrometry (ES-MS) for speciation studies". Radiochimica Acta 91, (Nov. 2003), 651–658.
[38] VESELSKY, J.: "Some remarks on the extraction of Pu(IV) and Th with tridodecylamine from nitric acid soil leach solutions and the possible existence of a univalent anionic Th-nitrate complex". Journal of Radioanalytical and Nuclear Chemistry 46, (1978), 247–253.

Notes

Notes

Notes

Notes
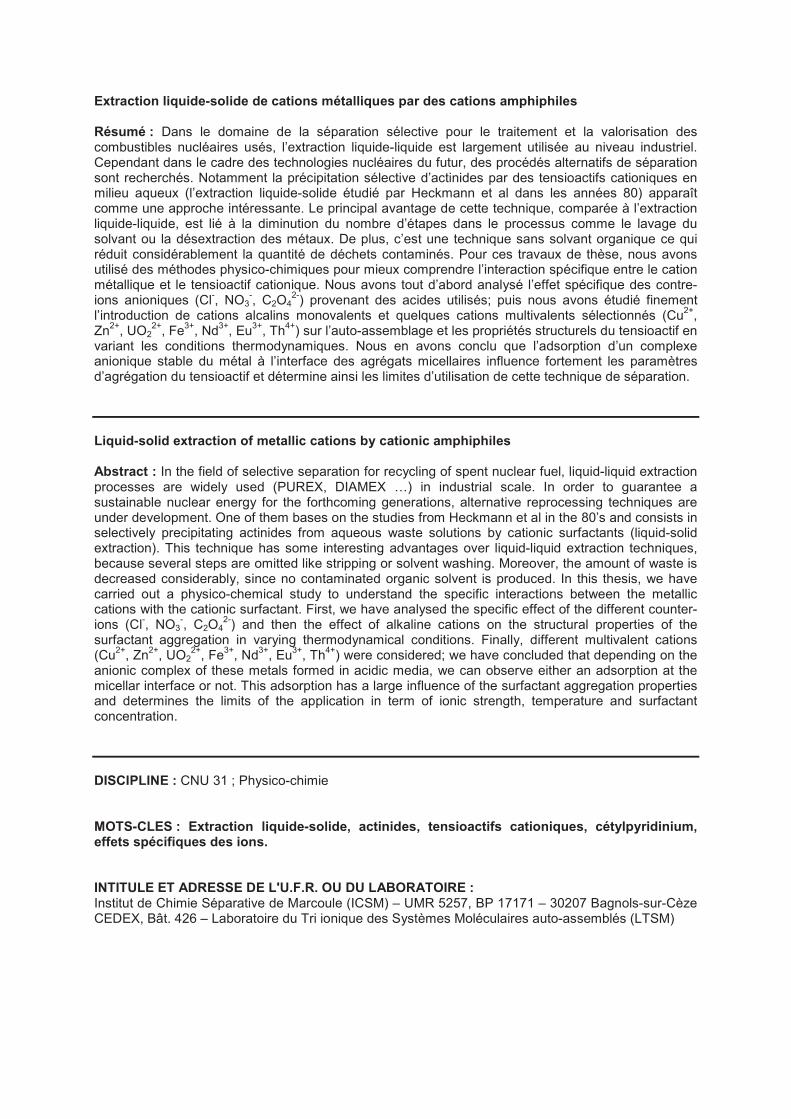
Extraction liquide-solide de cations métalliques par des cations amphiphiles
Résumé : Dans le domaine de la séparation sélective pour le traitement et la valorisation des combustibles nucléaires usés, l’extraction liquide-liquide est largement utilisée au niveau industriel. Cependant dans le cadre des technologies nucléaires du futur, des procédés alternatifs de séparation sont recherchés. Notamment la précipitation sélective d’actinides par des tensioactifs cationiques en milieu aqueux (l’extraction liquide-solide étudié par Heckmann et al dans les années 80) apparaît comme une approche intéressante. Le principal avantage de cette technique, comparée à l’extraction liquide-liquide, est lié à la diminution du nombre d’étapes dans le processus comme le lavage du solvant ou la désextraction des métaux. De plus, c’est une technique sans solvant organique ce qui réduit considérablement la quantité de déchets contaminés. Pour ces travaux de thèse, nous avons utilisé des méthodes physico-chimiques pour mieux comprendre l’interaction spécifique entre le cation métallique et le tensioactif cationique. Nous avons tout d’abord analysé l’effet spécifique des contre-ions anioniques (Cl-, NO3
-, C2O42-) provenant des acides utilisés; puis nous avons étudié finement
l’introduction de cations alcalins monovalents et quelques cations multivalents sélectionnés (Cu2+, Zn2+, UO2
2+, Fe3+, Nd3+, Eu3+, Th4+) sur l’auto-assemblage et les propriétés structurels du tensioactif en variant les conditions thermodynamiques. Nous en avons conclu que l’adsorption d’un complexe anionique stable du métal à l’interface des agrégats micellaires influence fortement les paramètres d’agrégation du tensioactif et détermine ainsi les limites d’utilisation de cette technique de séparation.
Liquid-solid extraction of metallic cations by cationic amphiphiles
Abstract : In the field of selective separation for recycling of spent nuclear fuel, liquid-liquid extraction processes are widely used (PUREX, DIAMEX …) in industrial scale. In order to guarantee a sustainable nuclear energy for the forthcoming generations, alternative reprocessing techniques are under development. One of them bases on the studies from Heckmann et al in the 80’s and consists in selectively precipitating actinides from aqueous waste solutions by cationic surfactants (liquid-solid extraction). This technique has some interesting advantages over liquid-liquid extraction techniques, because several steps are omitted like stripping or solvent washing. Moreover, the amount of waste is decreased considerably, since no contaminated organic solvent is produced. In this thesis, we have carried out a physico-chemical study to understand the specific interactions between the metallic cations with the cationic surfactant. First, we have analysed the specific effect of the different counter-ions (Cl-, NO3
-, C2O42-) and then the effect of alkaline cations on the structural properties of the
surfactant aggregation in varying thermodynamical conditions. Finally, different multivalent cations (Cu2+, Zn2+, UO2
2+, Fe3+, Nd3+, Eu3+, Th4+) were considered; we have concluded that depending on the anionic complex of these metals formed in acidic media, we can observe either an adsorption at the micellar interface or not. This adsorption has a large influence of the surfactant aggregation properties and determines the limits of the application in term of ionic strength, temperature and surfactant concentration.
DISCIPLINE : CNU 31 ; Physico-chimie
MOTS-CLES : Extraction liquide-solide, actinides, tensioactifs cationiques, cétylpyridinium, effets spécifiques des ions.
INTITULE ET ADRESSE DE L'U.F.R. OU DU LABORATOIRE :Institut de Chimie Séparative de Marcoule (ICSM) – UMR 5257, BP 17171 – 30207 Bagnols-sur-Cèze CEDEX, Bât. 426 – Laboratoire du Tri ionique des Systèmes Moléculaires auto-assemblés (LTSM)
Copyright © 2022 FDOKUMEN