
The Archives of Allied Health Sciences (Arch AHS) is ... - ThaiJo
72
-
Upload
khangminh22 -
Category
Documents
-
view
6 -
download
0
Transcript of The Archives of Allied Health Sciences (Arch AHS) is ... - ThaiJo


Editor-in-Chief:
Sugalya Amatachaya, School of Physical Therapy, Khon Kaen University, TH.
Associate Editors:
Anchalee Techasen, School of Medical Technology, Khon Kaen University, TH.
Thiwabhorn Thaweewannakij, School of Physical Therapy, Khon Kaen University, TH.
Editorial Board Members: Neil Robert, Clinical Research and Imaging Centre, UK. Marco Pang, Department of Rehabilitation Sciences, HK. Michael Hamlin, Department of Sport and Exercise Sciences, NZ. Wang Xingze, Research Center in Sport and Exercise Sciences, CN. Prawit Janwantanakul, Chulalongkorn University, TH. Eiji Sugihara, Research and Development Center for Precision Medicine, JP. Charoonsak Somboonporn, Department of Radiology, Khon Kaen University, TH. Wichai Eungpinichpong, School of Physical Therapy, Khon Kaen University, TH.
Production and editorial assistance:
Arpassanan Wiyanad Pakwipa ChokphukiaoRoongnapa Intaruk
The Archives of Allied Health Sciences (Arch AHS) is an international peer-review multi-disciplinary journal published in English. It is owned by the Faculty of Associated Medical Sciences, Khon Kaen University, Thailand. The Arch AHS was formally known as Journal of Medical Technology and Physical Therapy (JMTPT), which was founded in 1989. The title of the journal was changed to the Archives of Allied Health Sciences (Arch AHS) from 2020 (volume 32 issue 2: May – August) onward.
The Arch AHS aims to be a leading forum for research and knowledge in evidence-based practice relating to Allied Health Sciences. Contributions from all parts of the world and from different professionals in Allied Health Sciences are encouraged. Original articles, reviews, special reports, short
communications, and letters to the editor are published 3 regular issues per year, online and in print.

Production and editorial assistance:Arpassanan Wiyanad Pakwipa ChokphukiaoRoongnapa Intaruk
All correspondence concerning manuscripts, editorial issues and subscription should be addressed to: Editorial Officer: [email protected] of Associated Medical Sciences,
Khon Kaen University, Thailand.
Publication information:Arch AHS (ISSN: 2730-1990; eISSN: 2730-2008) appears 3 issues a year.Issue 1 January – April;Issue 2 May – August;Issue 3 September – December.
Indexing: Arch AHS is indexed in Thai Citation Index (TCI tier 1) and
ASEAN Citation Index (ACI) databases.
Manuscript preparation: Please review author guideline for manuscript preparation: https://drive.google.com/drive/folders/1kO5FijEnuLSYwzgKcnQ9mxO74ZZ0wGRA
Link to website

Contents
Clinical chemistry normal ranges of healthy adult population in Nong Khai, ThailandChanin Yotsakullert, Apisamart Klongkayan, Molin Wongwattanakul, Jureerut Daduang Patcharee Jearanaikoon, Patcharaporn Tippayawat
1
Effects of a 12-week yoga intervention on postural sway in rugby union playersTilak Raj, Catherine Elliot, Michael J. Hamlin
13
CACNA1C gene mutation in Thai young adult with sudden unexplained deathJittiput Thitinilnithi, Worada Samosornsuk, Suranarong Srisuwan, Worawee Waiyawuth, Seksun Samosornsuk
22
Anemia and thalassemia in the Kui (Suay) elderly living in Sisaket Province located at the lower Northeastern Thailand
Roongnalin Bunthupanich, Rossarin Karnpean, Anuwat Pinyachat, Nawinda Jiambunsri, Nattapol Prakobkaew
32
Effects of a lower extremity strength training program on range of motion in children with spastic cerebral palsy
Ratchadaporn Borkam, Wanida Donpunha, Punnee Peungsuwan, Raoyrin Chanavirut, Sainatee Pratanaphon, Pisamai Malila
39
Association of alpha fibrinogen -58G/A genetic polymorphisms with acute coronary syndrome in type 2 diabetes mellitus
Chananikan Makmool, Nantarat Komanasin, Burabha Pussadhamma, Wit Lueangwattananon
50
Comparison of the effects of constant force and gradual increased force of intermittent cervical traction in cervical radiculopathy
Krittika Thepsoda
58

ORIGINAL ARTICLE Arch AHS
1
Archives of Allied Health Sciences 2020; 32(3): 1-12.
ABSTRACT
Normal range is a range of values used for clinical decision-making in early diagnosis, prediction and therapeutic monitoring of diseases. Due to the lack of a locally-established normal range, western population ranges acquired from reagent companies are commonly used for patients. Clinical normal ranges are in high demand for clinical trials and practice studies. Improvement of the normal range for the population in northeastern Thailand would be valuable for the development of healthcare quality. A newly-established range could act as control for a normal population for laboratory testing in nearby regions and countries. This study was initiated in October 2010 and lasted until May 2018 using 2,589 healthy adults who visited a hospital in Nong Khai, Thailand for health check-ups. In terms of laboratory testing, 6 clinical chemistry tests consisted of AST, ALT, ALP, Creatinine, HDL, and LDL. For data management and statistical analysis, STATA 10.1 software was used to manage and analyze the laboratory result data. Each group of samples was tested with mean, median and percentile range for all parameters to establish new normal ranges for the population. Data mining and a filtering model were created based on normal reference ranges. This model was used to filter only a population of healthy adults. The dataset of 91,829 recorded laboratory results from 9,398 people, with only 30,296 records from 1,051 men and 1,538 women enlisted for further study. This study provides a simple guideline that can serve as a model for clinical laboratories intending to establish their own normal ranges with local data.
* Corresponding author: Patcharaporn Tippayawat, MT, PhD. School of Medical Technology, Faculty of Associated Medical Sciences, Khon Kaen University, Thailand. E-mail: [email protected]: 10 January 2020/ Revised: 16 March 2020/ Accepted: 4 May 2020
KEYWORDS
Normal range; Reference interval; Liver function parameters.
Clinical chemistry normal ranges of healthy adult population in Nong Khai, Thailand
Chanin Yotsakullert1,2, Apisamart Klongkayan3, Molin Wongwattanakul2,4, Jureerut Daduang2,4, Patcharee Jearanaikoon2,4, Patcharaporn Tippayawat2,4*
1 Biomedical science program, Graduate school, Khon Kaen University, Khon Kaen, Thailand.2 Centre of Excellence on Medical Biotechnology, Faculty of Associated Medical Sciences, Khon Kaen University, Khon Kaen, Thailand.3 Nong Khai hospital, Nong Khai, Thailand. 4 Centre for Research and Development of Medical Diagnostic Laboratories, Faculty of Associated Medical Sciences, Khon Kaen University, Khon Kaen, Thailand.

Arch AHS 2020; 32(3): 1-12.Yotsakullert et al.
2
Introduction Normal ranges comprise the range of values used for medical decision-making. For prompt diagnosis, estimation and therapeutic observation, especially for patients with certain diseases, clinical decisions can be critical. By assessing samples from a healthy population, normal ranges can be established. They are usually determined from the central 95% of values from a healthy and normal population(1). For enhancing the quality of healthcare, population-based normal ranges can be a useful tool for clinical decision-making. These values become universally accepted and comprise the best method in clinical laboratory literature. Currently, standard clinical laboratory ranges are widely available in scientific journals and publications for demographics from industrialized nations. However, the population in Thailand has limited data for normal ranges in various regions, with the most widely used range originating from articles or data appended from reagent companies. Further, the upper and lower limits can vary greatly and differ between hospitals(2). Moreover, internal factors including race(3,4), and environmental factors such as lifestyle, biological changes with advanced age and sex(5,6) mean normal ranges can vary. Consequently, records from western countries may not be used for populations in other regions, as demonstrated by various studies(5,7 -10), As a requirement before submission, the United States Food and Drug Administration (USFDA) states manufacturers of diagnostic reagents must establish a new normal range for their product(11). Collecting statistics from all over the nation where the automations are to be used can fulfill this prerequisite. However, for people and patients
in certain demographic regions, the population used for these studies may not be appropriate. Along with the Clinical Laboratory Improvement Act (CLIA), therefore, the laboratory standards allow a clinical laboratory to verify the suitability of normal ranges for certain demographics. The current research intends to improve the normal range in Northeastern Thailand, with Nong Khai chosen as the study area. About 517,260 people live in the province, which covers 3,027 square kilometers(12,13). The study determines clinical chemistry parameters for normal ranges representing the population and compare them with other factors within the population, including age and gender. This article discusses the selected clinical chemistry laboratory normal ranges for healthy adults from Nong Khai Province, located in Northeastern Thailand. For normal populations in a laboratory for surrounding areas and nations, the locally determined normal range can act as control.
Materials and methods Study subjects and sample size This study was conducted from October 2010 to May 2018 with 2,589 healthy adults aged 18 years and older who visited Nong Khai Hospital, Nong Khai Province, Thailand for health check-ups (Figure 1). In terms of laboratory testing, 6 clinical chemistry tests consisted of AST, ALT, ALP, Creatinine, HDL and LDL. Data mining and a filtering model were created according to the normal reference range. From CLSI guidelines(14), the number of samples that permitted 90% confidence interval in order to estimate a normal range was 120 samples. The calculations were described as recommendations by Reed et al(15).

Basic blood chemistry normal ranges of Nong Khai population, ThailandArch AHS 2020; 32(3): 1-12.
3
4 This study was conducted from October 2010 to May 2018 with 2,589 healthy adults aged 1 18 years and older who visited Nong Khai Hospital, Nong Khai Province, Thailand for health check-2 ups (Figure 1). In terms of laboratory testing, 6 clinical chemistry tests consisted of AST, ALT, ALP, 3 Creatinine, HDL and LDL. Data mining and a filtering model were created according to the normal 4 reference range. From CLSI guidelines( 14) , the number of samples that permitted 90% confidence 5 interval in order to estimate a normal range was 120 samples. The calculations were described as 6 recommendations by Reed et al(15). 7 8
9 10 11 12 13 14 15 16 17 18 19 20 21 22 23 Figure 1 The population region in the study 24
(Retrieve from Google map: https://goo.gl/maps/12RdDWib2Am7wd269) 25 26 Data management 27 In statistical analysis, STATA software (1996–2019, StataCorp LLC) version 10.1 was used 28 to manage laboratory results data. After inspection of the data, some records were excluded due to 29 being defective (because of human errors in the laboratory or failure in automation) as they seemed 30 to be physiologically unfeasible. The standardization procedure consisted of eliminating duplications 31 and format checking of the records. These steps eliminated major errors and inconsistencies (e.g. 32
Figure 1 The population region in the study (Retrieve from Google map: https://goo.gl/maps/12RdDWib2Am7wd269)
Data management In statistical analysis, STATA software (1996–2019, StataCorp LLC) version 10.1 was used to manage laboratory results data. After inspection of the data, some records were excluded due to being defective (because of human errors in the laboratory or failure in automation) as they seemed to be physiologically unfeasible. The standardization procedure consisted of eliminating duplications and format checking of the records. These steps eliminated major errors and inconsistencies (e.g. incorrect, unsuitable, mistaken or irrelevant parts of the data) when multiple types of data were gathered into one dataset.
Inclusion and exclusion criteria This study is a part of Mediage project, government funding project, which aims to create health data library and health index from the clinical and physical parameters for the Thai
population. The inclusion criteria for healthy population are aged between 18-80 years, BMI < 30, systolic blood pressure < 140 mmHg, diastolic blood pressure < 90 mmHg. The exclusion criteria are subject regularly taking medication or has any underlying disease e.g. alcohol consumption, recent illness, blood donor, lactation, blood pressure, abnormal obesity, drug abuse, drug prescription, oral contraceptives, pregnancy, surgery, tobacco use, recent transfusion, hospitalization, current/recent vitamin abuse, presence of uncontrolled hypertension, diabetes, pulmonary, hepatic, pancreatic, or renal diseases. Subjects who reported clinical parameters not higher than the means and standard deviations (3 to 4 SD) of the reference value based on the normal range set by the American Medical Association (AMA): AST>60, ALT>80, ALP>350, creatinine <0.4 or >2.0, LDL>130, HDL<20 or >90, were also included based on a Korean study(16). All

Arch AHS 2020; 32(3): 1-12.Yotsakullert et al.
4
records from subjects who received more than one medical check-up were excluded, leaving only the results from their first check-up.
Continuity of the data and other disturbing factor effects Principal component analysis (PCA) was used to test the continuity of the data between
years to ensure that there was no effect from the disconnection of quality controls in the laboratory. Unscrambler X 10.4 software with PCA function was used to identify variations and draw out patterns in the dataset. There was no visual indication of subdivision from data distribution in the PCA score plot (Figure 2).
1 Figure 2 Unsupervised dataset in PCA scores plotted by year (differences in symbols and colors) 2
3 Statistical analysis 4 In statistical analysis, STATA version 10. 1 was used to analyze the laboratory result data. 5 To test mean, median and 95 percentile range for each parameter to determine the new normal 6 range for the population, descriptive statistics were applied. Based on the Shapiro–Wilk test for 7 normality, not all measured parameters followed Gaussian distribution( 17) . Nonparametric statistical 8 methods were used to summarize the normal range from the data. This method is recommended in 9 the CLSI guidelines( 14) . Independent sample T- test (Wilcoxon two- sample for nonparametric data) 10 and one-way ANOVA (Kruskal–Wallis for nonparametric data) were utilized to ascertain the variation 11 between sex and age, respectively. p-values ≤ 0.05 were deemed to be statistically significant. 12 Ethical consent 13 This study is a part of the pro e t alled ealth nde of the elderly in ortheastern 14 Thailand for the urpose of ifestyle odifi ation and ealth onitoring before Disease 15
urren e ( 6 2172) . A ording to the affirmation of elsin i and good lini al pra ti e 16 guidelines the hon aen niversity thi s ommittee for uman Resear h reviewed this wor (18). 17 Any information a uired during the study remained private. 18 19 20 21 22
Figure 2 Unsupervised dataset in PCA scores plotted by year (differences in symbols and colors)
Statistical analysis In statistical analysis, STATA version 10.1 was used to analyze the laboratory result data. To test mean, median and 95 percentile range for each parameter to determine the new normal range for the population, descriptive statistics were applied. Based on the Shapiro–Wilk test for normality, not all measured parameters followed Gaussian distribution(17). Nonparametric statistical methods were used to summarize the normal range from the data. This method is recommended in the CLSI guidelines(14). Independent sample T-test (Wilcoxon two-sample for nonparametric data) and one-way ANOVA (Kruskal–Wallis for nonparametric data) were utilized to ascertain
the variation between sex and age, respectively. p-values ≤ 0.05 were deemed to be statistically significant.
Ethical consent This study is a part of the project called “Health Index of the elderly in Northeastern Thailand for the Purpose of Lifestyle Modification and Health Monitoring before Disease Occurrence” (HE602172). According to the affirmation of Helsinki and ICH good clinical practice guidelines, the Khon Kaen University Ethics Committee for Human Research reviewed this work(18). Any information acquired during the study remained private.

Basic blood chemistry normal ranges of Nong Khai population, ThailandArch AHS 2020; 32(3): 1-12.
5
Results Study population In order to screen for a healthy, adult population and eliminate errors as well as inconsistencies in the raw data, including incorrect, unsuitable, mistaken and irrelevant parts of the data, a dataset comprising 91,829 result records from 9,398 people were filtered, leaving only 30,296 records from 1,051 men and 1,538 women. Data management and inclusion criteria were applied to this step. The data was enlisted in Table 1, consisting of the population categorized by gender and age. More than half of the population comprised people ranging in age between 35 and 54 years old.
Normal range of Nong Khai population After the pre-analysis step, the organized data was ready to be used in the normal range calculation. Tables 2 and 3 show the investigated mean, median and 2.5th-97.5th percentile range values for clinical chemistry parameters according to gender and age, respectively. Conventional mean values for AST, ALT, ALP, creatinine, LDL and HDL among contributors were 23.7 U/L, 20.1 U/L, 67.9 U/L, 0.77 mg/dL, 85.3 mg/dL and 55.5 mg/dL, respectively. To investigate differentiation in the normal range for demographic groups (gender and age), a laboratory can derive a separate normal range for different demographic groups. One criterion reinforcing this decision is the p-value for the variance between male and female contributors. Males had normal ranges of AST at 16-35 U/L com-pared to females at 15-33 U/L, ALT value of 12-32 U/L against females of 12-31 U/L, ALP of 40-114 U/L against females of 40-111 U/L, creatinine of 0.64-1.28 mg/dL against females of 0.51-0.91 mg/
dL, LDL of 40-98 mg/dL against females of 47-99 mg/dL and HDL of 40-78 mg/dL against females of 41-86 mg/dL. Compared to males, females had much (p-value < 0.05) higher mean values for HDL. Conversely, much higher (p-value < 0.05) mean values for AST, ALT and creatinine were seen in males compared to females (Table 2). In the mean values for AST, ALT and HDL, there was no significant difference across all groups of participants (p-value > 0.05). The reverse was true for ALP and creatinine. Both of these parameters tend to increase with higher age. As shown in Table 2 and 3, a normal range was not seen for some parameters (LDL and HDL) among groups of participants based on sex and age because the sample size was small. This result suggests that there is no age dependency in these parameters. There is no increasing or decreasing trend in the same direction for ALP and creatinine. However, this result showed that the normal range for these tests should be derived in separated gender groups rather than a combined gender group, especially for creatinine.
Comparison between the present study and currently used To compare clinical chemistry parameters for normal range between the currently used at hospital and the present study (Table 4), the upper limits of ALT, ALP and creatinine were lower in the present study compared to those currently used. The lower limits for AST, ALT, creatinine and HDL were higher in the current study compared to those currently used. This result made overall normal ranges for AST, ALT, ALP, creatinine, LDL and HDL for adults, narrower than those currently used at hospital.

Arch AHS 2020; 32(3): 1-12.Yotsakullert et al.
6
Table 1 Statistical data relating to the individualities of the study contributors
Number Percent Number of Result Recordsof Person AST ALT ALP Creatinine HDL LDL
Sex
Male 1,051 40.6 830 884 804 927 154 26*
Female 1,538 59.4 1,258 1,311 1,232 1,333 265 52*
Age (years)
18-24 127 3.9 66* 80* 58* 83* 37* 7*
25-34 366 11.2 192 194 174 208 123 14*
35-44 971 29.6 637 680 622 685 119* 20*
45-54 1,032 31.5 674 710 667 720 96* 15*
55-64 625 19.1 412 420 409 445 36* 15*
156 4.8 107* 111* 106* 119* 8* 7*
Note: *n < 120
Table 2 Average, standard, and 2.5th-97.5th percentile of clinical chemistry orientation values concerning the sex of healthy adults in Nong Khai
Parameters Male Female Combined
Mean Median
2.5th-
97.5th
Percentile
Range
Mean Median
2.5th-97.5th
Percentile
Range
P-value Mean Median
2.5th-
97.5th
Percentile
Range
AST (U/L) 25.20 25.00 16-35 22.77 22.00 15-33 0.00 23.73 23.00 15-34
ALT (U/L) 21.97 22.00 12-32 18.89 18.00 12-31 0.00 20.13 19.00 12-31
ALP (U/L) 68.95 66.00 40-114 67.26 65.00 40-111 0.128 67.93 65.50 40-113
Creatinine
(mg/dL)
0.92 0.91 0.64-1.288 0.67 0.66 0.51-0.91 0.00 0.77 0.74 0.53-1.17
LDL (mg/dL) 80.73 87.50 40-98* 87.71 91.50 47-99* 0.506 85.38 89.50 48-99*
HDL (mg/dL) 52.13 50.00 40-78 57.48 56.00 41-86 0.00 55.51 53.00 41-85
Note: *n < 120
≥ 65

Basic blood chemistry normal ranges of Nong Khai population, ThailandArch AHS 2020; 32(3): 1-12.
7
Table 3 Average, standard, and 2.5th-97.5th percentile of clinical chemistry orientation values concerning the age summary of healthy adults in Nong Khai
Age(years)
AST (U/L)
ALT (U/L)
ALP (U/L)
Creatinine (mg/dL)
HDL (mg/dL)
18-24 Mean 21.74 18.39 65.98 0.76 55.22
Median 21.00 16.50 61.50 0.76 54.00
2.5th Percentile 14.00* 12.00* 37.00* 0.52* 40.00*
97.5th Percentile 34.33* 30.98* 130.58* 1.13* 77.00*
25-34 Mean 22.64 19.40 63.03 0.74 55.23
Median 22.00 18.00 59.00 0.71 53.00
2.5th Percentile 14.83 12.00 38.00 0.52 40.10
97.5th Percentile 34.00 31.00 105.88 1.09 82.80
35-44 Mean 22.84 19.40 63.39 0.74 55.88
Median 23.00 18.00 61.00 0.70 54.00
2.5th Percentile 15.00 12.00 39.58 0.52 41*
97.5th Percentile 33.00 31.00 105.43 1.11 83*
45-54 Mean 24.08 20.63 69.10 0.78 55.66
Median 24.00 20.00 67.00 0.75 52.00
2.5th Percentile 16.00 12.00 40.00 0.53 40.43*
97.5th Percentile 34.00 31.23 113.30 1.17 91.45*
55-64 Mean 24.81 21.04 74.47 0.81 55.03
Median 24.00 21.00 72.00 0.78 51.50
2.5th Percentile 17.00 12.00 42.50 0.53 40.00*
97.5th Percentile 34.00 31.00 119.00 1.29 105.00*
>64 Mean 25.86 20.52 71.08 0.86 56.13
Median 26.00 20.00 68.00 0.82 52
2.5th Percentile 16.00* 12.00* 40.68* 0.57* 47.00*
97.5th Percentile 34.00* 31.00* 112.28* 1.33* 87.00*
P-value 0.39 0.17 0.00 0.00 0.13
Note: *n < 120

Arch AHS 2020; 32(3): 1-12.Yotsakullert et al.
8
Table 4 Divergence between orientation range values for clinical chemistry parameters in the current study with hospital used at present
Parameters Sex
Present study
(Nong Khai,
Northeast
Thailand)
AMS Laboratory,
Khon Kaen
University
(Northeast
Thailand)
Han
population(26)
(Northern
China)
American population(10)
(USA)
Thai Thai Chinese White Black Hispanic
AST (U/L) Combined 15.00-34.00 12.00-32.00 12.00-38.00 N/A N/A N/A
Male 16.00-35.00 N/A 13.00-38.00 N/A N/A N/A
Female 15.00-33.00 N/A 11.00-37.60 N/A N/A N/A
ALT (U/L) Combined 12.00-31.00 4.00-36.00 7.00-49.00 N/A N/A N/A
Male 12.00-32.00 N/A 8.10-55.90 12.00-87.00 11.00-64.00 12.00-102.00
Female 12.00-31.00 N/A 6.20-44.40 11.00-58.00 9.00-41.00 10.00-62.00
ALP (U/L) Combined 40.00-113.00 42.00-121.00 36.20-112.00 N/A N/A N/A
Male 40.00-114.00 N/A 45.10-113.00 35.00-107.00 38.00-114.00 43.00-126.00
Female 40.00-111.00 N/A 30.20-108.60 31.00-115.00 33.00-121.00 40.00-123.00
Creatinine
(mg/dL)
Combined 0.53-1.17 0.50 -1.50 0.50-1.05 N/A N/A N/A
Male 0.64-1.29 N/A 0.62-1.13 0.70-1.27 0.73-1.45 0.65-1.34
Female 0.51-0.91 N/A 0.47-0.87 0.50-1.10 0.52-1.15 0.46-0.99
HDL
(mg/dL)
Combined 41.00-85.25 20.00-35.00 16.92-41.94 N/A N/A N/A
Male 40.00-75.00 N/A 16.20-39.24 N/A N/A N/A
Female 41.00-86.25 N/A 19.08-43.20 N/A N/A N/A
Discussion The basis for laboratory testing is the normal range, which helps differentiate the healthy population. A normal range is important for disease screening, diagnosis, progression, and treatment monitoring. Consequently, patients in the area of study are the people who get the most benefit from establishing a distinctive normal range. In the same way, physicians can have more confidence in the interpretation of their test results. For clinical trials and practice, applicable clinical normal ranges are compulsory. For laboratories in adjacent districts and nations, the determined range could also be a reference and comparison source. Physicians frequently require normal range data from the local population to conduct clinical trial studies(19). In addition, various organizations value the importance of normal ranges, such as the USFDA(11). The International Organization for
Standardization (ISO) 15189 standard for laboratory certification circumstances must be regularly re-evaluated by laboratories for their own normal range(20). The Joint Commission on International Accreditation Standards for Laboratories (JCI) also requires laboratories to establish their own normal ranges for cytogenetics testing(21). In present study, the criteria for enlisting candidate was only the subject who visited health check-up at Nong Khai hospital. Consequently, it was difficult to declare that this group of population are accurately healthy. In current study, subjects were excluded as outlier that based on standard deviations of the reference value, possibly leadings to bias result. Ideally, candidate who participate in reference value study should have done a questionnaire to exclude subject with underlying disease. CLSI guideline recommend that a minimum of 120 observations

Basic blood chemistry normal ranges of Nong Khai population, ThailandArch AHS 2020; 32(3): 1-12.
9
are required, before applying statistical analysis with 90% confidence(14,15). To assess the homogeneity of data collection over eight years, an unsupervised statistical method was employed in the dataset by PCA(22, 23). The results from PCA only showed discrete patterns in one large group from PC1 but did not show any sign of clustering in the whole dataset. There was no data disturbance from unexpected factors such as human or machine error in the process of accumulating data. Moreover, this indicated the homogeneity of the dataset gathered over a period of eight years. Furthermore, quantitative methods based on information selection, such as the Gaussian (Normal) distribution, are referred to as “parametric” since they make particular suppositions concerning population-based data. Thus, the reference interval would be: RI = µ ± 1.96σ if a normal range study for a Gaussian distribution of the data was assumed, when µ is the average and σ is the standard deviation for the dataset. Conversely, non-parametric methods do not conceive of distributed data and offer ways to assess and compare data sets with undetermined or unstable distributions. The central 95% of the data can be regulated by arranging from the lowest to the highest values and excluding the highest 2.5% and lowest 2.5% of values when distribution is not Gaussian. The residual highest and lowest values delineate the orientation interval mentioned previously in the method(12). Based on the Shapiro–Wilk test for normality, not all measured parameters in this study followed a Gaussian distribution(14). Consequently, this research selected nonparametric statistical methods. In the values for ALP and LDL between men and women, this study identified a non-significant difference (p-value > 0.05) (Table 2). In the values for AST, ALT and creatinine, the result exhibited a noteworthy difference (p-value < 0.05). Normal ranges of AST and ALT have changed slightly in practical use. On the other hand, creatinine has an entirely different normal range. For analyzing chronic kidney disease (CKD) under UK guidelines, the appraised glomerular filtration rate (eGFR) from statistical models, such as Modification of
Diet in Renal Disease (MDRD) is suggested(24). For physicians to contrast patients’ results, therefore, details to evaluate renal function, normal ranges of serum creatinine (Scr) are needed. The reference value displayed deterioration in renal function with age, causing a trend of intensifying serum creatinine. Creatinine is the product of muscle metabolism. Serum creatinine ranges are lower in women because women have less muscle mass and, therefore, a lower rate of creatinine excretion. In the present study, the reference values for serum creatinine were significantly different in men and women (p-value < 0.05). Another study in a Caucasian population likewise revealed Scr-age reliance begins to diverge between men and women at around the age of 15. Further, this disparity between men and women increases to a value of 0.25 mg/dL by the time they reach the age of 30 years(25). The normal range of creatinine is superior when based on patient gender because of this. To assess whether or not joint or gender-specific normal ranges should be employed, this research used p-value as a value. The percentage of laboratory values that would be organized differently if a common range instead of the gender-specific range is used is an alternative approach to estimating whether a normal range for both sexes is appropriate. However, this approach will need a new dataset from the population in Nong Khai in order to be arranged as ‘normal’ or ‘abnormal’. Thus, testing could be carried out on the combined normal range and separate ranges. Reference interval of liver enzyme including AST, ALT and ALP in Han population(26) are found similar to Thai population. But the liver enzyme ranges from our study are narrower than the ranges from Han population. While ALT of other American ethnic groups(10) are diverse and difficult to apply to East Asian population. On the other hand, reference value of HDL in present study has a distinct value from Chinese result which has a tendency to increase. Reference values of creatinine from present study are similar to Han population which men are higher than women in every ethnic group. It shows that reference interval should base on their own population.

Arch AHS 2020; 32(3): 1-12.Yotsakullert et al.
10
Including sample data being greater, including the broadest age range, and making it possible to fill the gaps revealed by healthy- volunteer studies using these results to confirm the theories or re-assessed normal range between ethnic groups, there are various advantages for indirect (data mining) methods over direct methods (study in healthy individuals) when applied for retrospective hospital data(10). All of the datasets from this study can contribute to larger projects that may require data from thousands of subjects in a healthy population. In this context, it can be used to create a model to predict or assess the health and aging statuses of people in the Thai population based on their laboratory test results and other related factors(16). Conclusion Based on the orientation values produced from a western population, the normal range for healthy adults in Nong Khai displayed disparity concerning the study of clinical chemistry parameters. Compared to those from the manufacturer and developed countries, the inclusive normal ranges for AST, ALT, ALP, creatinine, LDL and HDL for adult were more limited. Likewise, there were differences in the normal ranges in terms of age and sex. Additional research is needed to determine the normal ranges for the population in Thailand because there is no national database and a shifting standard for data management. In order to advance quality healthcare and reduce excessive costs of healthcare, the results highlight the need for assessing normal ranges in various populations.
Take home messages Normal range of clinical chemistry parameters for healthy adults in Nong Khai showed disparity, compared to those from the manufacturer and developed countries. Establishment of normal range for individual population is necessary to distinguish between groups, especially between normal and abnormal subjects. Therefore, every population group requires specific reference values.
Conflicts of interest The authors declare no conflict of interest.
Acknowledgements The Center of Excellence on Medical Biotechnology (CEMB), S & T Postgraduate Education and Research Development Office (PERDO), Office of Higher Education Commission (OHEC), Thailand provided financial support for the completion of this study, for which we are grateful. We acknowledge Nong Khai Hospital for granting permission to use its laboratory results in this study, as well as for the time and patience provided.
References1. Ashwood ER, Burtis CA, Tietz NW. Tietz fundamentals of clinical chemistry: Elsevier; 2001.2. Solberg HE. The IFCC recommendation on estimation of reference intervals. The RefVal program. Clinical Chemistry and Laboratory Medicine (CCLM) 2004; 42(7): 710-4.3. Horn PS, Pesce AJ. Effect of ethnicity on reference intervals. Clinical chemistry 2002; 48(10): 1802-4.4. Nduka N, Aneke C, Maxwell-Owhochuku S. Comparison of some haematological indices of Africans and Caucasians resident in the same Nigerian environment. Haematologia 1988; 21(1): 57-63.5. Rödöö P, Ridefelt P, Aldrimer M, Niklasson F, Gustafsson J, Hellberg D. Population-based pediatric reference intervals for HbA1c, bilirubin, albumin, CRP, myoglobin and serum enzymes. Scandinavian journal of clinical and laboratory investigation 2013; 73(5): 361-7.6. Kratz A, Ferraro M, Sluss PM, Lewandrowski KB. Laboratory reference values. N Engl J Med 2004; 351: 1548-64.7. Furruqh S, Anitha D, Venkatesh T. Estimation of reference values in liver function test in health plan individuals of an urban south Indian population. Indian J Clin Biochem 2004; 19(2): 72-9.

Basic blood chemistry normal ranges of Nong Khai population, ThailandArch AHS 2020; 32(3): 1-12.
11
8. Yadav D, Mishra S, Gupta M, John PJ, Sharma P. Establishment of reference interval for liver specific biochemical parameters in apparently healthy north Indian population. Indian J Clin Biochem 2013; 28(1): 30-7.9. Lugada ES, Mermin J, Kaharuza F, Ulvestad E, Were W, Langeland N, Asjo B, Malamba S, Downing R. Population-based hematologic and immunologic reference values for a healthy Ugandan population. Clin Diagn Lab Immunol 2004; 11(1): 29-34.10. Lim E, Miyamura J, Chen JJ. Racial/ ethnic-specific reference intervals for common laboratory tests: a comparison among Asians, Blacks, Hispanics, and White. Hawai’i J Med Public Health 2015; 74(9): 302.11. US Food and Drug administration. “Replacement Reagent and Instrument Family Policy” for in vitro diagnostic (IVD) devices; 2003 [cited 2019Oct21]. Available from: https://www.fda. gov/media/111186/download.12. Area of each district in Nong Khai Province [Internet]. [cited 2020 Dec 10]. Available from: http://www.e-report.energy.go.th/ area/Nongkai.htm13. The Royal Gazette published the number of citizens across the Kingdom 66.5 million people, [Internet]. [cited 2020 Dec 10]. Available from: https://moe360.blog/ 2020/02/01/ ราชกิิจจานุุเบกิเผยแพร่-2/14. Clinical and Laboratory Standards Institute. Defining, establishing, and verifying reference intervals in the clinical laboratory; approved guideline. CLSI Document C28-A3 (3rd Edition). 2008.15. Reed AH, Henry RJ, Mason WB. Influence of statistical method used on the resulting estimate of normal range. Clinical chemistry 1971; 17(4): 275-84.16. Kang YG, Suh E, Lee JW, Kim DW, Cho KH, Bae CY. Biological age as a health index for mortality and major age-related disease incidence in Koreans: National health Insurance service–health screening 11-year follow-up study. Clin Interv Aging 2018; 13: 429.
17. Royston P. Approximating the Shapiro-Wilk W-Test for non-normality. Statistics and computing 1992; 2(3): 117-9.18. General Assembly of the World Medical Association. World Medical Association Declaration of Helsinki: ethical principles for medical research involving human subjects. J Am Coll Dent 2014; 81(3): 14.19. Eller LA, Eller MA, Ouma B, Kataaha P, Kyabaggu D, Tumusiime R, Wandege J, Sanya R, Sateren WB, Wabwire-Mangen F, Kibuuka H. Reference intervals in healthy adult Ugandan blood donors and their impact on conducting international vaccine trials. PLOS one 2008; 3(12): e3919. 20. Pereira P. ISO 15189: 2012 Medical laboratories-Requirements for quality and competence.21. Joint Commission International. Joint Commission International; 1017 [cited 2019Oct10]. Available from: https://www. jointcommissioninternational.org/assets/3/7/ JCI_Standards_for_Laboratories_STANDARDS- ONLY.pdf22. Lima DC, dos Santos AM, Araujo RG, Scarminio IS, Bruns RE, Ferreira SL. Principal component analysis and hierarchical cluster analysis for homogeneity evaluation during the preparation of a wheat flour laboratory reference material for inorganic analysis. Microchemical Journal 2010; 95(2): 222-6.23. Dobos L, Abonyi J. On-line detection of homogeneous operation ranges by dynamic principal component analysis based time-series segmentation. Chemical Engineering Science 2012; 75: 96-105.24. Joint Specialty Committee on Renal Medicine (Great Britain), Renal Association (Great Britain). Chronic kidney disease in adults: UK guidelines for identification, management and referral. Royal College of Physicians.25. Pottel H, Vrydags N, Mahieu B, Vandewynckele E, Croes K, Martens F. Establishing age/sex related serum creatinine reference intervals from hospital laboratory data based on different statistical methods. Clinica chimica acta 2008; 396(1-2): 49-55.

Arch AHS 2020; 32(3): 1-12.Yotsakullert et al.
12
26. Yang S, Qiao R, Li Z, Wu Y, Yao B, Wang H, Cui L, Yang Y, Zhang J. Establishment of reference intervals of 24 chemistries in apparently healthy adult Han population of Northern China. Clin Biochem 2012; 45(15): 1213-8.

ORIGINAL ARTICLE Arch AHS
13
Archives of Allied Health Sciences 2020; 32(3): 13-21.
ABSTRACT
In an attempt to reduce the risk of injury that accompanies poor balance, many strength and conditioning coaches and trainers incorporate balance and postural control training into players’ training regimes. However, relatively few balance interventions involve yoga. Therefore, the purpose of this study was to evaluate the effect of a modified yoga programme on postural sway in rugby union players. Twenty-nine male rugby union players, (19 ± 1.3 years old, mean ± SD) were randomly assigned to two groups: a yoga group (YG, n =15), which practiced yoga for one hour, two times a week alongside their regular rugby training, and a control group (CG, n = 14), which only participated in their standard rugby training. Postural sway was measured during various 30s balance activities at baseline (pre-season) and at the end of the 12-week playing season (post-season) on a force platform. The yoga group showed a significantly reduced sway signal in the 2-legged eyes closed balance test in the antero-posterior (-109.7% ± 82.9 mean ± 95% CI, p-value < 0.005) and medial-lateral (-115.5% ± 92.1, p-value < 0.005) directions. However, no significant between-group change was found in the 1-legged eyes closed or 1 or 2-legged eyes open balance tests. The results suggest that practising yoga may reduce postural sway in specific directions which may improve balance in rugby union players.
* Corresponding author: Tilak Raj, Faculty of Environment Society and Design, Department of Tourism, Sport & Society, Lincoln University, New Zealand. P O Box 85084, Lincoln 7647, Canterbury, New Zealand. Tel: +64 274262195 E-mail: [email protected]: 22 July 2020/ Revised: 25 August 2020/ Accepted: 15 September 2020
KEYWORDS
Exercise; Proprioception; Sports performance; Balance training.
Effects of a 12-week yoga intervention on postural sway in rugby union players
Tilak Raj1*, Catherine Elliot1, Michael J. Hamlin1
1 Department of Tourism, Sport & Society, Lincoln University, New Zealand.

Arch AHS 2020; 32(3): 13-21.Raj et al.
14
Introduction Rugby union (hereinafter referred to as “rugby”) is a field-based contact sport with a growing player base of approximately 9.1 million players registered worldwide, making it one of the most popular sports in England, Ireland, Australia, and New Zealand(1). Rugby players are typically strong and engage in many bouts of high-intensity activity(2) including running, jumping, kicking, and other quick, agile movements(2). The fast pace and physical contact in rugby makes it essential that players are able to quickly control posture and return to a steady position when exposed to balance perturbations(3). In addition, rugby players need to maintain a stable posture for the safe execution of efficient and effective movements(4, 5). Therefore, better postural stability, or improved balance, plays a vital role in rugby players’ performance. Rugby is dynamic in nature, and rugby players are required to actively balance their body weight depending on the game situation(2). As part of the game, rugby players tackle opposing players to gain possession of the ball or are occasionally required to kick the ball while running, which requires good balance, sometimes on one leg as well as in compromising positions(3). To control posture, a player must maintain control of his centre of gravity by remaining as close to the centre as possible using hip and ankle balance strategies(2,6). If the change in the centre of gravity is large due to either inappropriate neuromuscular strategies selected by the player or an impaired ability to use the sensory feedback efficiently, the player may develop impaired balance and increased postural instability(5), which have been associated with an increased risk of injury(7). Postural sway is a method of observing the sway of a player’s centre of pressure (COP) displacement and body weight distribution and can be used as a measure of balance(8,9). To reduce postural sway, an efficient sensory- muscular feedback response is required(8,10) and any delay or inattention to this response may increase postural sway, particularly in the anterior -posterior and medial-lateral planes, which may result in undesired movement patterns, which could possibly affect a player’s performance(10,11).
Hatha yoga, the yoga used in this study, is an ancient Indian system involving various static and dynamic stretching positions, as well as breathing, and relaxation techniques. It is progressive in nature and low-cost, only requiring a trained yoga teacher and no specialised equipment. While yoga has been shown to improve balance in athletes(12,13) and older adults(14,15) little research has addressed the contribution of yoga towards enhancing the balance of rugby union players. This study is designed to determine the effects of a 12-week yoga intervention on single- and double-legged postural sway of male rugby union players.
Materials and methods A yoga intervention was exclusively designed for rugby players and delivered by a yoga instructor (registered exercise professional, New Zealand). The number of participants required for the study was calculated using a spreadsheet with the smallest worthwhile change in performance being 1.0% and the typical error or within-subject SD in similar tests of 0.7%(16). This calculation estimated we needed 7 participants in each group in a controlled trial research design. All participants were in the same yoga class, and all sessions were completed in a large open fitness room. The centre of pressure (COP) is evaluated by collecting the raw data on the magnitude of the force signals applied from the player’s body through his feet in the anterior-posterior, and the medial-lateral, directions. COP is also derived from the data collected in the vertical direction on the force platform. To assess postural sway, the movement of the COP is computed by calculating the pressure applied in the direction of the action and then the system measures the associated pressure underneath the foot of the player on the platform. The mean velocity of the raw signal received in anterior-posterior, medial-lateral, and vertical directions and a combination of all were used to assess postural sway using COP(17). During the intervention, players spent the first 10 min performing a set of 12 dynamic stretching postures used as a warm-up (sun-salutation sequence), an easy to follow routine to standardise the practice throughout the study. Players then performed 17 sets of 30 s stretches focussing on quadriceps,

Postural sway of rugby union playersArch AHS 2020; 32(3): 13-21.
15
hamstring, calves in five different postures, three postures with 13 sets of 20 s stretches focusing on hamstring, 17 sets of 10 s stretches focussing on gluteal and lower back area in eight postures, 10 sets of 15 s stretches focussing on shoulders, upper-back, and abdominal area in six postures, 4 sets of 15 s stretching focussing on middle back in four posture, and 4 sets of 20 s stretching focussing on hip abductor and hip adductors in two postures. The postures performed during the intervention are typically a combination of joints and muscles.
Participants The inclusion criteria for the study included currently playing rugby at club level, having no past experience of yoga, and having no current or previous injury which may affect their participation in the study. Twenty-nine male club-level rugby union players (19 ± 1.3 years, mean ± SD) (Table 1) volunteered to participate in the study, and were divided into two groups: a yoga group (YG n =14), which practiced yoga for one hour, two times a week in addition to normal rugby training and a control group (CG n = 15), that completed their normal rugby training without yoga. During the study, players were asked to refrain from physical activities that might affect balance outside of those provided by their strength and conditioning coach. All players completed a medical questionnaire (Physical Activity Readiness Questionnaire) and reported no contraindications to engaging in maximal exercise. All players were also informed about the possible risks of volunteering for this study and provided written informed consent prior to the study. Following the Declaration of Helsinki, this research was approved by the institutional Human Ethics Committee.
Table1 Baseline characteristics of the players
CharacteristicsYoga Group
(n = 15)Control Group
(n = 14)Age (y) 19 ± 1.3 19 ± 2.0
Height (cm) 181.3 ± 8.4 182.7 ± 4.2
Weight (kg) 88.9 ± 18.7 85.5 ± 9.8
BMI (kg/m2) 26.9 ± 4.8 25.6 ± 2.8Note: Data are mean ± SD.
Yoga intervention A registered yoga instructor led the 60 min yoga intervention classes twice a week for 12 weeks, with the intervention starting at the beginning of the rugby season. Each yoga session consisted of a warm-up of 10 min (Surya-namaskar a dynamic stretching sequence of postures), followed by 35 min of yoga postures (10 min standing, 10 min sitting, and 15 min of supine and prone postures and a mix of static and dynamic postures), and 10 min relaxation in the final resting position (lying in supine position without any stretching exercise). A total of 5 min was allocated for the transition between the yoga postures. The sessions consisted of 32 yoga postures (including standing, sitting, forward bending, backward bending, spinal twist, core engagement and body inversion), targeting the major muscle groups of the body (e.g., gastrocnemius, hip flexors, hip extensors, abdominals, and trapezius). Basic breathing and relaxation techniques were taught in the first 2 weeks of the intervention after the initial session players practised these two techniques for the remaining six weeks. The yoga postures were modified to improve the range of motion, and promote the progression of difficulty and intensity with the support of yoga props (such as blocks, straps, or ropes), so movements were performed as accurately as possible without inducing pain beyond that experienced with stretching.
Postural sway measurement Data were collected over a 30 s period with a sampling frequency of 100 Hz in the morning between 0900-1200 using a force platform (Bertec Corp, Columbus, OH) which amplifies, filters, and digitises the raw signals from the strain gauge amplifiers inside the force plate. The resulting output is a six-channel 16-bit digital signal containing the forces and moments in the x, y, and z axes. The digital signals were subsequently converted via an external analogue amplifier (AM6501, Bertec Corporation). The initial centre of pressure signals was calculated with respect to the centre of the force-plate before normalization. Data were collected on two occasions (baseline and after the 12-week intervention). The players were instructed to stand normally on the force platform barefoot, with feet in the centre of

Arch AHS 2020; 32(3): 13-21.Raj et al.
16
a marked area and their arms hanging by their side. While standing on the force platform, players were asked to concentrate on a fixed spot on the wall in front of them and to maintain their balance as much as possible (or to maintain balance for as long as possible in the eyes closed test). The data was collected once players said they were comfortable with their standing position. The leg(s) was/were tested (right, left, and 2-legged) and the order of each task was randomly allocated. During testing, the players were asked to complete the following tasks: 1-legged stance with eyes open (right and left leg), a 2-legged stance with eyes open and eyes closed. Each position was held for 30 s and players were given a 1-min rest between each task, where they chose to either sit or stand and were allowed to drink water. The measurement took approximately 5-6 min for each player to complete. All players were required not to perform any strenuous exercise for 24 hours prior to testing. The testing was completed at the same time of day under similar climatic conditions for both testing days.
Statistical analysis Data were collected from the force platform which included movement in the: antero-posterior, medial-lateral, and vertical directions, and also included centre of pressure in anterior-posterior and medial-lateral directions, and exported to Microsoft excel and analysed using R studio (2019) (Boston, MA, USA). To analyse the raw data, a protocol described by Önell(18) was employed. Firstly, the players’ body mass was normalised with the signal collected. To remove the body oscillations due to the heartbeat, the signal was sent through a 4th-order Butterworth high pass filter with a cut-off frequency of 0.1 Hz. The signal was also low pass filtered with a cut-off frequency of 15 Hz to reduce measurement noise to remove slow drifts in the signal which are not directly associated with spontaneous sway. The standard deviation of the mean of each 30 s signal was used as an indicator of postural sway variability. A total of 9 measures were recorded, since the data were normalised with mass of the player, mass signal was removed from the analysis and
the following measures were used for the final analysis. The standard deviation (SD) of the antero-posterior, medial-lateral, and vertical, directions and centre of pressure in antero-posterior and medial-lateral directions. The data presented in the table 2 are the mean and the standard deviation of each task within the group. The between-group percentage change from baseline to post-intervention was then calculated. Changes within and between groups were estimated using a mixed modelling procedure (Proc Mixed) in the Statistical Analysis System (Version 9.3, SAS Institute, Cary, North Carolina, USA) with an alpha level of 0.05.
Results The average yoga session attendance rate was 21 sessions (75%), with some players attending all 24 sessions and some attending only 16 sessions (60%), however no players missed two consecutive sessions. Total time spent on stretches amounted to 35 ± 2 min (mean ± SD) at each yoga session. Players spent approximately 25 ± 3 min performing dynamic stretching, which included 10 min of sun-salutation practice, and around 12 - 15 min in both dynamic and static stretching postures. Players were also required to complete 10 min of a mindful relaxation or mental recovery (savasana) at the end of each session. Compared to the control group, the yoga group that incorporated 12 weeks of yoga into their rugby training routines had a significantly reduced postural sway in the 2-legged eyes closed antero-posterior -109.7% ± 82.9 and medial- lateral -115.5% ± 92.1 (mean ± 95% CI, p-value < 0.005) directions (Table 2). The yoga group demonstrated, in most cases, non-significant decreases in postural sway in a number of balance markers in all stance conditions (right leg eyes open, left leg eyes open, both legs eyes closed, both legs eyes open), when compared to the control group (Table 2).

Postural sway of rugby union playersArch AHS 2020; 32(3): 13-21.
17
Table 2 Data of balance tests before and after 12 weeks of yoga in the yoga and control groups and the between group differences
Balance markersControl group Yoga group Pre-post between
group differences (%) Mean ± 95%CIBaseline
12-week Post
Baseline12-week
PostOne-legged Right Leg Eyes Open Medio-lateral 0.04 ± 0.02 0.04 ± 0.01 0.03 ± 0.02 0.02 ± 0.01 -84.0% ± 155.4
Antero-posterior 0.03 ± 0.01 0.04 ± 0.01 0.03 ± 0.01 0.03 ± 0.03 -69.1% ± 143.6
Vertical 0.05 ± 0.03 0.08 ± 0.02 0.05 ± 0.03 0.05 ± 0.04 -133.4% ± 289.2
Medio-lateral COP 0.00 ± 0.01 0.00 ± 0.00 0.00 ± 0.00 0.00 ± 0.00 15.4% ± 246.9
Antero-posterior COP 0.00 ± 0.01 0.00 ± 0.00 0.00 ± 0.01 0.00 ± 0.00 -48.2% ± 269.6
One-legged Left Leg Eyes OpenMedio-lateral 0.04 ± 0.02 0.05 ± 0.02 0.03 ± 0.02 0.03 ± 0.01 -59.5% ± 90.2
Antero-posterior 0.03 ± 0.01 0.06 ± 0.02 0.03 ± 0.01 0.03 ± 0.01 -39.2% ± 68.3
Vertical 0.05 ± 0.03 0.11 ± 0.05 0.05 ± 0.03 0.05 ± 0.02 -101.7% ± 277.7
Medio-lateral COP 0.02 ± 0.05 0.00 ± 0.00 0.01 ± 0.02 0.00 ± 0.00 83.1% ± 274.1
Antero-posterior COP 0.01 ± 0.03 0.00 ± 0.00 0.01 ± 0.02 0.00 ± 0.00 -14.5% ± 273.8
Two-legged Eyes OpenMedio-lateral 0.01 ± 0.01 0.03 ± 0.01 0.01 ± 0.01 0.02 ± 0.01 -64.2% ± 90.0
Antero-posterior 0.01 ± 0.00 0.01 ± 0.00 0.01 ± 0.00 0.01 ± 0.00 -62.7% ± 80.5
Vertical 0.01 ± 0.01 0.04 ± 0.01 0.01 ± 0.00 0.01 ± 0.00 -141.9% ± 221.5
Medio-lateral COP 0.00 ± 0.00 0.00 ± 0.00 0.00 ± 0.00 0.00 ± 0.00 -38.7% ± 58.4
Antero-posterior COP 0.00 ± 0.00 0.00 ± 0.00 0.00 ± 0.00 0.00 ± 0.00 -45.8% ± 97.1
Two-legged Eyes ClosedMedio-lateral 0.03 ± 0.03 0.02 ± 0.00 0.02 ± 0.01 0.01 ± 0.00 -115.5% ± 92.1*
Antero-posterior 0.01 ± 0.00 0.02 ± 0.00 0.00 ± 0.01 0.00 ± 0.01 -109.7% ± 82.9*
Vertical 0.01 ± 0.00 0.05 ± 0.01 0.00 ± 0.01 0.00 ± 0.01 -175.7% ± 197.7
Medio-lateral COP 0.01 ± 0.02 0.00 ± 0.00 0.00 ± 0.01 0.00 ± 0.00 -33.7% ± 242.1
Antero-posterior COP 0.00 ± 0.01 0.00 ± 0.00 0.00 ± 0.01 0.00 ± 0.00 -113.4% ± 281.4Note: Data are mean ± SD of each group and the difference between groups given as the percent mean difference ± 95% confidence interval. *Statistically significant between groups (p-value < 0.05). COP, Centre of pressure.
Discussion Findings of this study suggest that 12 weeks of practising a standard yoga routine twice weekly for one hour in addition to normal rugby training can maintain and, in some cases, improve postural sway in male rugby union players. The improvement was particularly prevalent in the antero-posterior and medial-lateral directions in the 2-legged eyes closed stance. Although there were no significant differences in the other sway characteristics of
either 1-legged or 2-legged stances, the yoga group mostly showed improvements in all balance measures, when compared to the control group. The results of this study supports previous findings indicating that regular yoga practice may decrease postural sway and improve balance for athletes(12,13) and other individuals(19-21). The yoga group also had the lowest signal magnitude in the vertical direction in all standing positions, suggesting a more stable stance than the control

Arch AHS 2020; 32(3): 13-21.Raj et al.
18
group. This reflects reduced underfoot activity and improved perceptual-motor skill, allowing the player to maintain a steady position(22). In this study, the yoga intervention integrated a series of mind-body exercises together with breathing, alignment, relaxation, flexibility and stretching as used by previous researchers(23-26). Practicing mind-body exercises can result in significantly improved balance (23-25, 27). For example, Gatts and Woollacott(25) reported that Tai-chi, a routine similar to yoga, improved neuromuscular activation in older adults when compared to a control group that did not practice Tai-chi. There is mounting evidence that an efficient musculo-skeletal system improves muscle proprioception which may result in improved balance(4,5,23,24,28). It has been reported that yoga helps individuals to improve their balance, enhances feedback from the muscles and tendons surrounding the joints(29), and reduces underfoot activity(22). A rugby player uses the lower body extensively to run at various speeds(30), and uses a hip-ankle strategy to change the direction swiftly(2). Thus, the improved balance of players in the yoga group may help them in the directional play required in rugby. Consequently by practicing yoga postures included in the current study, players may have upregulated strategies to maintain balance(21,31), thereby leading to an efficient musculo-skeletal system which improved muscle proprioception and resulted in less sway and possibly better balance(4,5,23,24,28). Efficient functional movement requires the intergration of sensory feedback systems to maintain stability and balance. These systems are particularly important in tasks that occur at high speed and when directional change is involved(32). If the improved static balance witnessed as a result of yoga in this study, also translates to improved dynmamic balance, it will benefit athletes like rugby players, by improving their agility(33) and ability to maintain balance while performing movements during the rugby game.
Previous research has also indicated that balance training with eyes closed may also have a positive effect on the vestibular system(34). Performing balance tasks without visual feedback increases the reliance on the somatosensory stimuli(35) which may have a training effect. Therefore, a combination of mind-body exercises including postures with eyes closed (as in some of the postures in the yoga group of this study) may have improved neural and sensory feedback systems thereby increasing sensitivity to somatosensory and vestibular feedback which may have improved balance and reduced postural sway in the yoga group.
Limitations In the current study, only male players were contacted to participate in the study, therefore the application of these results is limited to males and further research is required to investigate the possible effects on females. The fact that all players were from the same club, means that the intervention practised and information provided to the yoga group, may have reached the control group also, and some control subjects may have practiced the intervention without our knowledge. Another limitation of the study was the fact that the assessor of the of the balance variables was not blinded to the intervention groups which may introduce some bias. However, since the results are mainly objective measures (e.g. force platform signals), the possibility of bias is reduced. The study could have been improved with a larger sample size, or a crossover design with sufficient time for washout of effects. Finally, while the sway significantly improved in the 2-legged eyes-closed test for the yoga group, the relevance of an eyes-closed balance test to balance control during a rugby game (with eyes open) is unknown. Hence, the results will remain exploratory until a more thorough longitudinal study is conducted on a larger sample with more applied balance tests for rugby players.

Postural sway of rugby union playersArch AHS 2020; 32(3): 13-21.
19
Conclusion In conclusion, practicing yoga for 12 weeks significantly improved postural sway in the yoga group in the antero-posterior and medial-lateral directions in the two-legged eyes-closed balance task. If a reduction in postural sway is equivalentto improved balance, the yoga group improvedbalance compared to the control group (at least the antero-posterior and medial-lateral directions in two-legged eyes-closed task). Such balance improvements may assist rugby players by reducing unwanted movements on the rugby field, keeping joints and body parts aligned and possibly reducing injuries. Postural sway was also improved in most other balance tasks although the reductions in postural sway did not meet statistical significance.Therefore, the overall effect of yoga on 1-legged and 2-legged eyes open balance tasks remains speculative until further research can consistently show a positive
Take home messages Yoga helps to reduce postural sway in the double-legged eyes-closed balance test in rugby players. Including yoga into the training routines of rugby players may therfore help to improve their balance, resulting in better stability and muscular control.
Conflicts of interest The authors declare no conflict of interest.
Acknowledgements No financial support was obtained for the current study. We would like to acknowledge the volunteered time of the coaches and players for the current study.
References 1. Rugby W. World Rugby Year in Review 2017. Online: World Rugby, 2017.2. Chow GC, Fong SS, Chung JW, Chung LM, Ma AW, Macfarlane DJ. Determinants of sport- specific postural control strategy and balance performance of amateur rugby players. J Sci Med Sport 2016; 19(11): 946-50.
3. Matsuda S, Demura S, Uchiyama M. Centre of pressure sway characteristics during static one-legged stance of athletes from different sports. J Sports Sci 2008 ; 26(7): 775-9.4. McClay IS, Robinson JR, Andriacchi TP, Frederick EC, Gross T, Martin P, et al. A Profile of Ground Reaction Forces in Professional Basketball. J Appl Biomech 1994; 10(3): 222-36.5. Horak FB. Postural orientation and equilibrium: what do we need to know about neural control of balance to prevent falls? Age Ageing 2006; 35(Suppl 2): ii7-11.6. Cherng R-J, Hsu Y-W, Chen Y-J, Chen J-Y. S tand ing ba lance of ch i ldren wi th developmental coordination disorder under altered sensory conditions. Hum Mov Sci 2007; 26(6): 913-26.7. Hrysomallis C. Relationship between balance ability, training and sports injury risk. Sports Med 2007; 37(6): 547-56.8. Chagdes JR, Rietdyk S, Haddad JM, Zelaznik HN, Cinelli ME, Denomme LT, et al. Limit cycle oscillations in standing human posture. J Biomech 2016 2016; 49(7): 1170-9.9. Morasso PG, Spada G, Capra R. Computing the COM from the COP in postural sway movements. Hum Mov Sci 1999; 18(6): 759-67.10. Guskiewicz KM. Assessment of postural stability following sport-related concussion. Curr Sports Med Rep 2003; 2(1): 24-30.11. Talarico MK, Lynall RC, Mauntel TC, Weinhold PS, Padua DA, Mihalik JP. Static and dynamic single leg postural control performance during dual-task paradigms. J Sports Sci 2017; 35(11): 1118-24.12. Iftekher SNM, Bakhtiar M, Rahaman KS. Effects of yoga on flexibility and balance: a quasi- experimental study. Asian J Med Biol Res 2017; 3(2): 276-81.13. Polsgrove MJ, Eggleston BM, Lockyer RJ. Impact of 10-weeks of yoga practice on flexibility and balance of college athletes. Int J Yoga 2016; 9(1): 27-34.

Arch AHS 2020; 32(3): 13-21.Raj et al.
20
14. Nick N, Petramfar P, Ghodsbin F, Keshavarzi S, Jahanbin I. The Effect of Yoga on Balance and Fear of Falling in Older Adults. PM & R : the journal of injury, function, and rehabilitation 2016; 8(2): 145-51.15. Schmid AA, Van Puymbroeck M, Koceja DM. Effect of a 12-week yoga intervention on fear of falling and balance in older adults: a pilot study. Arch Phys Med Rehabil 2010; 91(4): 576-83.16. Hopkins WG. Estimating Sample Size for Magnitude-Based Inferences. Sportscience 2017; 21.17. Black FO, Wall C, 3rd, O’Leary DP. Computerized screening of the human vestibulospinal system. Ann Otol Rhinol Laryngol 1978; 87 (6 Pt 1): 853-60.18. Önell A. The vertical ground reaction force for analysis of balance? Gait Posture 2000; 12(1): 7-13.19. Youkhana S, Dean CM, Wolff M, Sherrington C, Tiedemann A. Yoga-based exercise improves balance and mobility in people aged 60 and over: a systematic review and meta-analysis. Age Ageing 2016; 45(1):21-9.20. Ikai S, Uchida H, Suzuki T, Tsunoda K, Mimura M, Fujii Y. Effects of yoga therapy on postural stability in patients with schizophrenia- spectrum disorders: A single-blind randomized controlled trial. J Psychiatr Res; 47(11): 1744-50.21. Mondal K, Majumdar D, Pramanik A, Chatterjee S, Darmora M. Application of Yoga as an Effective Tool for Improving Postural Balance in Healthy Young Indian Adults. International Journal of Chinese Medicine 2017; 1(2): 62-9.22. Stins JF, Michielsen ME, Roerdink M, Beek PJ. Sway regularity reflects attentional involvement in postural control: Effects of expertise, vision and cognition. Gait Posture; 30(1):106-9.23. Stoller CC, Greuel JH, Cimini LS, Fowler MS, Koomar JA. Effects of sensory-enhanced yoga on symptoms of combat stress in deployed military personnel. Am J Occup Ther 2012; 66(1): 59-68.
24. Fiori F, David N, Aglioti SM. Processing of proprioceptive and vestibular body signals and self-transcendence in Ashtanga yoga practitioners. Front Hum Neurosci 2014; 8: 734. 25. Gatts SK, Woollacott MH. Neural mechanisms underlying balance improvement with short term Tai Chi training. Aging Clin Exp Res 2006; 18(1): 7-19.26. Rogers ME, Fernandez JE, Bohlken RM. Training to reduce postural sway and increase functional reach in the elderly. J Occup Rehabil; 11(4): 291-8.27. Fong SSM, Guo X, Liu KPY, Ki WY, Louie LHT, Chung RCK, et al. Task-Specific Balance Training Improves the Sensory Organisation of Balance Control in Children with Developmental Coordination Disorder: A Randomised Controlled Trial. Sci Rep 2016; 6(20945): 1-8.28. Proske U, Gandevia SC. The Proprioceptive Senses: Their Roles in Signaling Body Shape, Body Position and Movement, and Muscle Force. Physiol Rev 2012; 92(4): 1651-97.29. Burke-Doe A, Hudson A, Werth H, Riordan DG. Knowledge of osteoporosis risk factors and prevalence of risk factors for osteoporosis, falls, and fracture in functionally independent older adults. J Geriatr Phys Ther 2008; 31(1): 11-7.30. Gabbett TJ, Kelly JN, Sheppard JM. Speed, change of direction speed, and reactive agility of rugby league players. J Strength Cond Res 2008; 22(1): 174-81.31. Wang MY, Yu SS, Hashish R, Samarawickrame SD, Kazadi L, Greendale GA, et al. The biomechanical demands of standing yoga poses in seniors: The Yoga empowers seniors study (YESS). BMC Complement Altern Med 2012; 13(8): 1-13.32. Green BS, Blake C, Caulfield BM. A comparison of cutting technique performance in rugby union players. J Strength Cond Res 2011; 25(10): 2668-80.

Postural sway of rugby union playersArch AHS 2020; 32(3): 13-21.
21
33. Wikstrom EA, Tillman MD, Smith AN, Borsa PA. A new force-plate technology measure of dynamic postural stability: the dynamic postural stability index. J Athl Train 2005; 40(4): 305-9. 34. Ledin T, Kronhed AC, Möller C, Möller M, Odkvist LM, Olsson B. Effects of balance training in elderly evaluated by clinical tests and dynamic posturography. J Vestib Res 1990-1991; 1(2): 129-38.
35. Prado ET, Raso V, Scharlach RC, Kasse CA. Hatha yoga on body balance. Int J Yoga 2014; 7(2): 133-7.

ORIGINAL ARTICLEArch AHS
22
Archives of Allied Health Sciences 2020; 32(3): 22-31.
ABSTRACT
Sudden unexplained death syndrome (SUDS) is an unexpected natural death in young healthy adults, especially Southeastern Asian populations, wherein no severe diseases can be detected to explain death’s cause. Several studies confirmed that SUDS associated with genetically changed cardiac ion channels. However, CACNA1C mutations in SUDS are rarely reported in the Thai population. This study aimed to characterize CACNA1C gene mutation in Thai young adults who died with SUDS. Characteristics data of 32 SUDS cases in the Thai population were collected. Blood samples were collected from 27 males and 5 females of which categorized as an unexplained cause of death in a postmortem examination. Genomic DNA was extracted, amplified, and screened for nine variants mutation of CACNA1C gene, using pyrosequencing assay. Most cases were domiciled in the central region of Thailand. Men aged 19 - 39 years old (mean age 29.44 ± 5.59) is the most common SUDS cases. In a total of 32 cases, we detected 7 cases (21.9 %) with heterozygous A/G, c.720016 G > A within exon 44. The variation was defined as a missense mutation of p. R1880Q at C-terminus of α1C subunit of the L-type cardiac calcium channel. The heterozygous missense mutation of p. R1880Q of CACNA1C gene was identified in Thai SUDS. However, there is no evidence of studies about the effect of function and pathogenicity of CACNA1C-R1880Q. Further study is needed to clarify the role of this variant in the functional effect of pathogenesis in SUDS.
* Corresponding author: Seksun Samosornsuk, PhD. Department of Medical Technology, Faculty of Allied Health Sciences, Tham-masat University, Thailand. E-mail: [email protected]: 21 February 2020/ Revised: 30 April 2020/ Accepted: 9 May 2020
KEYWORDS
Molecular autopsy; Sudden unexplained death syndrome; Sudden death; Cardiac ion channelopathies.
CACNA1C gene mutation in Thai young adult with sudden unexplained death
Jittiput Thitinilnithi1,2, Worada Samosornsuk3, Suranarong Srisuwan1, Worawee Waiyawuth1, Seksun Samosornsuk3*
1 Central Institute of Forensic Science, Ministry of Justice, Bangkok, Thailand.2 Master of Science Program, Department of Forensic Science, Faculty of Allied Health Sciences, Thammasat University, Bangkok, Thailand.3 Department of Medical Technology, Faculty of Allied Health Sciences, Thammasat University, Bangkok, Thailand.

CACNA1C gene mutation and sudden unexplained deathArch AHS 2020; 32(3): 22-31.
23
Introduction Sudden unexplained death syndrome (SUDS) is defined as a sudden unexpected death that a significant cause of death of young adults and healthy. The annual report of SUDS incidence rate showed about 37, 43 and 38 cases per 100,000 populations in Japan, Philippine and Thailand, respectively(1-3). This syndrome usually occurs within a short period of time after the onset of acute symptoms(4). The SUDS cases are often due to primary electrical diseases or cardiac channelopathies that are genetically changed in ion channels or regulatory proteins of the heart muscle that lead to an increased risk of arrhythmia and SUDS in individuals with a structurally normal heart(5). The abnormal ECG pattern of right bundle-branch block and ST-segment elevation in Lead V1 through V3, is indicated as Brugada syndrome (BrS) in Thai SUDS patients(6).In addition, the epidemiological and clinical characteristics like BrS among SUDS cases were related to SCN5A gene mutations associated with a sodium ion channel(7). Recently, several studies from many countries including Thailand have focused on this gene and its phenotype characteristics(8-11). The SCN5A gene mutation associated with BrS was found in 11-28 % of SUDS patients(12-13) followed by CACNA1C gene mutation (6-7 %)(14). CACNA1C gene encodes the pore-forming α1c subunit of the L-type cardiac calcium channel (LTCC). The α1c subunit comprises four transmembrane domains (DI, DII, DIII, and DIV). The α1c subunit pore is known to mediate the influx of calcium ions into the cardiac muscle cell upon membrane polarization. In a normal heart, this plays an important role in excitation- contraction coupling(15). However, an insufficient amount of calcium inward depolarizing current can trigger the development of potentially fatal ventricular fibrillation, whereas the enhancement of calcium current can prolong cardiac of action potential duration, thereby conferring an increased risk of sudden death.
CACNA1C gene mutation was reported in some mental illnesses. CACNA1C gene contributes to the depolarization of neurons through calcium ion influx. Variations in SNPs in CACNA1C gene affect both the structure and function of the nervous system, including synaptic plasticity and neuron viability. In 2016, Kim et al. reported that CACNA1C rs723672 and rs1051375 SNPs were associated with bipolar disorder in the Korean population(16). CACNA1C gene also plays an important role in the development of dendrites, neuron survival, synaptic plasticity, and memory formation. Dysfunction of ion channels plays a key role in the pathogenesis of hereditary ataxia(17). Although CACNA1C gene mutation was reported in several diseases other than SUDS. Gene mutation of each disease was found on different exon. The first implication of mutations in CACNA1C was found in cardiac arrhythmias with Timothy syndrome (TS), a rare multisystem disorder associated with long QT syndrome (LQTS8), and childhood sudden death(18). Since then, several CACNA1C mutations have recently been identified in a patient presenting with cardiac ion channelopathies, including the long QT syndrome type 8 (LQTS8)(19-20), the short QT syndrome type 4 (SQTS4), as well as the Brugada syndrome type 3 (BrS3)(14,21). These different-point mutations of CACNA1C lead to different molecular mechanisms, either gain-of-function or loss-of-function of the L-type calcium channel (LTCC), resulting in abnormality of calcium ion concentration in the cardiac muscle cells. Then it was found to cause the failure of excitation- contraction coupling until sudden death. A mutation in exon 2, A39V reduced current density in the wake of impaired channel trafficking for the α1C of LTCC(14). A mutation in exon 8a, G406R revealed a marked reduction in voltage- dependent inactivation (VDI) and an increase in Ca2+ influx is known to prolong the potential of cardiac action(18-20). However, the data of CACNA1C mutation has been limited among the Thai population. This study, therefore, aimed to characterize CACNA1C gene mutation in Thai young adults with death from SUDS.

Arch AHS 2020; 32(3): 22-31.Thitinilnithi et al.
24
Materials and methods Subjects of study This study was approved by the Research Ethics Committee of Thammasat University (COE No.054/2560) and Central Institute of Forensic Science, Ministry of Justice, Thailand (CIFS). Blood samples were collected from 32 SUDS cases submitted to Forensic Pathology of CIFS, Bangkok, Thailand, during April 2017 - December 2018. The information of 32 cases was collected from postmortem inquest reports and postmortem examination reports. The inclusion criteria of SUDS subjects included factors as follows: (1) Thai nationality, (2) young adult (18 - 39 years of age), and (3) negative comprehensive postmortem investigation such as autopsy, toxicology, histology, and death-scene investigation. Meanwhile, decomposition cases of which the post-mortem changes occur from 12 - 24 hours after death were excluded from this study. The characteristics of 32 SUDS subjects are summarized in Table 1.
Regional classification of SUDS cases The address of civil registration is used to classify 5 regions of SUDS subjects including Central, Northeastern, Northern, Western, and Southern. Each region was sub-classified into separated provinces
Genomic DNA extraction Genomic DNA was extracted from 300 µL whole blood using the Genomic DNA Mini Kit (Blood/Cultured Cell) (Geneaid, Taiwan). The DNA was quantified by measuring the optical density of 260 nm and 280 nm using spectrophotometer (e-spect malcom, Japan).
Primer design The polymerase chain reaction (PCR) and sequencing primers of CACNA1C (GenBank, accession no.NG_008801.2) were designed using PyroMark Assay Design program 2.0 (Qiagen, Singapore) to obtain primer sets that were assigned as 1-7 assays (Table 2). The target genes were amplified using biotin tagged on 5´-end of forward primer in assay 1, 2, 3, 4, and 7, whereas assay 5 and 6 using biotin was tagged on 5´-end of reverse primer.
Polymerase Chain Reaction PCR mixture consisted of 5 ng/µL of DNA template. Pyromark® PCR kit (Qiagen, Germany), including 12.5 µl of 2x PyroMark PCR Master Mix, 2.5 µl of 10x CoralLoad Concentrate and DNase free water, was used in the reaction. 0.5 µL of 10 µM forward and reverse primers were added for total volume 25 µL/reaction. These reactions were performed with 45 cycles of denaturation at 94 °C for 30 s, primer annealing at 56 °C (68 °C for assay 6) for 30 s and extension at 72 °C for 30 s. This amplification was achieved using a T100TM Thermal cycler (Bio-RAD Laboratories, USA).
DNA Sequencing by pyrosequencing assayBased on the sequencing-by-synthesis principle, pyrosequencing is a DNA sequencing method that is based on the detection of released pyrophosphate (PPi) during DNA synthesis. Pyrosequencing analysis was performed using PyroMark® Q48 Advanced Reagents (Qiagen, Hilden, Germany) and analyzed on Pyromark Q48 Autoprep system (Qiagen, Hilden, Germany) with the sequencing primers. The performed steps ensured compliance with the manufacturer’s instruction. Biotinylated PCR products were added into each well of a PyroMark Q48 Autoprep disc. Thereafter, it was immobilized with sepharose magnetic beads. Subsequently, nucleotides, lyophilized enzyme, substrate mixture, and pyromark binding buffer from PyroMark® Q48 Advanced Reagents were automatically added into the cartridge chambers. When nucleotides are incorporated into the analyzed DNA strand, pyrophosphate (PPi) is released and converted to ATP. The generation of ATP drives a detectable light signal through a luciferase reaction and this is proportional to the number of nucleotides incorporated. The pyrograms data were then analyzed using pyrosequencing software (PyroMark Q48 software).

CACNA1C gene mutation and sudden unexplained deathArch AHS 2020; 32(3): 22-31.
25
Table 1 Characteristics of each SUDS subject
Domicile/
Province ID Gender Age Occupation
Month of death
(2017-2018)
Time of death
(24 hr.)
BMI
(kg/m2)
Heart Weigh
(g)
CACNA1C gene
Mutation
Central region
C1
1
2
3
4
5
6
F
M
M
M
M
M
25
21
19
30
20
36
Bl
Bl
Bl
Me
St
Bl
May 2017
August 2017
August 2017
July 2017
May 2018
June 2018
07.30
01.00
08.00
06.50
08.00
05.45
23.2
20.8
22.1
23.9
20.8
21.5
305
350
345
380
325
375
g.720016 G > A
g.720016 G > A
g.720016 G > A
-
-
-
C2 7 M 29 Bl April 2017 08.51 27.7 350 -
C3
8
9
10
M
M
M
36
29
37
Bl
Bl
Me
May 2017
September 2018
May 2017
08.46
18.00
11.05
23.9
27.5
26.2
370
370
385
g.720016 G > A
-
-
C4 11 M 30 Bl June 2018 08.30 26.3 375 -
C5 12 M 32 Bl August 2017 07.00 23.2 310 -
C6 13
14
F
M
34
25
Bl
Bl
September 2017
March 2018
16.43
8.50
22.2
21.2
296
390
-
-
C715
16
F
M
37
39
Bl
Bl
January 2018
June 2018
6.30
6.50
20.7
29.7
270
425
-
-
C8 17 M 33 Bl May 2018 7.00 22.3 420 -
Northeastern region
NE1 18 M 30 Bl April 2017 02.30 25.2 380 g.720016 G > A
NE2 19 M 37 Bl May 2017 22.00 22 355 -
NE3 20
21
M
M
27
25
Bl
Bl
May 2017
December 2017
10.30
09.45
21.5
28
290
335
-
-
NE4 22 M 31 Bl May 2017 09.05 22.4 365 -
NE5 23
24
M
M
35
23
Go
Bl
June 2017
March 2018
08.00
23.30
25.7
22.2
390
425
g.720016 G > A
-
NE6 25 M 26 Bl August 2017 15.15 24.1 295 g.720016 G > A
NE7 26 M 19 Bl March 2018 8.30 29.8 420 -
NE8 27 F 28 Bl June 2018 8.00 21.8 250 -
NE9 28
29
M
M
27
24
Bl
Bl
May 2018
June 2018
16.30
09.00
20.8
20.2
350
305
-
-
NE10 30 M 32 Bl October 2017 06.30 30.4 385 -
Northern region
N1 31 M 26 Bl March 2018 01.30 21.5 380 -
Western region
W1 32 F 30 Bl June 2017 06.00 22.8 315 -
Age (Mean ± SD) 29.44 ± 5.59
BMI (Mean ± SD) 23.8 ± 2.96
Heart weight (Mean ± SD) 352.53 ± 45.86
Note: NE, Northeastern; C, Bangkok and Central; N, Northern; W, Western; M, male; F, female BMI, Body mass index (normal range) = 18.5 - 24.9 kg/m2 (26)
Bl, Blue-collar construction workers; Me, Merchant; St, Student; Go, Government official

Arch AHS 2020; 32(3): 22-31.Thitinilnithi et al.
26
Table 2 Sequence of oligonucleotide primers used for PCR and pyrosequencing
AssayExon/Amino acid change
PrimerProduct size (bp)
Ref.
1 2p. A39V
Forward B 5´-TTG CCA CAG GTT CCA ACT ATG-3´Reverse 5´-TCT TGG GTT TCC CAT ATT GCT-3´Sequence 5´-GGG GAT GTG CTC AGG-3´
231 [14]
2 8p. G406R
Forward B 5´-GGC CCT GGA TCT ATT TTG TTA CAC-3´Reverse 5´-ATA CAG CCA GGA ATA GCA GAA AGA-3´Sequence 5´-CCT TGG TCC TGC TTA C-3´
155 [15,16]
3 10p. G490R
Forward B 5´-GAG CAT GCC CAC CAG TGA GA-3´Reverse 5´-CTC GCC GTG CCT ACT CAC GC-3´Sequence 5´-ACG CCA GCC TGG CCC-3´
108 [14]
4 19p. E850 del
Forward B 5´-TAA GTG GGA GTG CTG GAG TTA TT-3´Reverse 5´-TGG GCA CTG CCT TTT CCT TA-3´Sequence 5´- CGA CAG GCA TCT CTG G -3´
138 [18]
5 42/43 (45)p. C1837Y
Forward 5´-GTT CGG CAA CCA CGT CAG CT-3´Reverse B 5´-TTG GAG CCG GTG GAC GAG TA-3´Sequence 5´-GCT GCA CAT CAA CAA G-3´
186 [18]
6 44 p. R1880Q46p. G1911R48p. Q1916R
Forward 5´-AGG ATG ACG AAA ATC GGC AAC T-3´Reverse B 5´-GCC TGT CCA AAA GTG TGA GCT AC-3´Sequence 1 5´-GAC AAG AGG GAC ATC C-3´Sequence 2 5´-CGA CAG AAG GAC CGA-3´
546 [18] [19]
7 47p. V2014I
Forward B 5´-ATC CAT CCA CTG CGG CTC CT-3´Reverse 5´-CGA GTC ACC TAC CGC TTC CAC-3´Sequence 5´-GCA CCA TGA GGG AGA-3´
166 [18]
Note: B is biotinylated on end of primer. Sequence shows primers was used in pyrosequencing.
Results Characteristics of SUDS cases The domicile of 32 Thai SUDS cases was reported in different regions of Thailand (Table 1). Among 6 regions, we found SUDS cases in 4 regions: the central region, the northeastern region, and the western region of Thailand. There were 9 of 22, 9 of 20, 1 of 9, and 1 of 5 provinces reported with SUDS cases in the central, the northeastern, the northern, and the western region, respectively. Most cases were found in the central region (18 cases, 56.25 %) and the highest cases were in C1 (7 cases, 38 %), followed by the northeastern region (12 cases, 37.5). The other 2 cases were found in the northern (3.12 %) and the western region (3.12 %). There were 27 males
(84.4 %) and 5 females (15.6 %) in the age range of 19-39 years with a mean age of 29.44 ± 5.59 years with 30 years of age being the most common. Twenty-eight of the 32 SUDS cases (87.5 %) were blue-collar construction workers, followed by 2 merchants (6.25 %), 1 government official (3.12 %), and 1 student (3.12 %). In 2017, the monthly incidence of 18 SUDS cases was relatively higher in May (6 cases, 33 %) followed by August (4 cases, 22%), whereas. While, in 2018, the monthly incidence of 14 SUDS cases was relatively higher in June (5 cases, 36 %) followed by March (4 cases, 29 %). SUDS victims died in 6 periods. Eighteen cases (53.13 %) died from 6 to 9 A.M. followed by 4 cases (12.5 %) died from 9 to 12 A.M. , 4 cases (12.5%) died from 3 to 6 P.M., and 3 cases (9.38%) died

CACNA1C gene mutation and sudden unexplained deathArch AHS 2020; 32(3): 22-31.
27
from 0 to 3 A.M. Finally, 2 cases (6.25 %) of the victims died from 21 to 24 P.M. and 03:01 to 06:00 A.M. respectively.For body mass index (BMI), 21cases (65.6 %) and 11 cases (34.4 %) had a normal BMD (18.5 - 24.9 kg/m2) and high BMD (23.8 ± 2.96 kg/m2), respectively. The autopsy data showed the mean heart weight of 352.53 ± 45.86 g, ranging from 250 to 425 g. All 32 cases were found a normal structural appearance.
Genetic analysis This study found a heterozygous missense mutation transition of A→G at position 720016 of CACNA1C (GenBank, accession no. NG_008801.2) in the exon 44 that forecasted a substitution of arginine to glutamine at position 1880 (p. R1880Q, rs182208896) located in the intracellular C-terminus of CaV1.2 α1C. It was identified in 7 SUDS cases (21.9 %) (ID: 1,2,3,8,18,23 and 25), including 6 males (22.3 %) and 1 female (20 %).
Discussion In this study, the domicile of 32 Thai SUDS cases was in different regions of Thailand. Most cases (53.13 %) were found in the central region, especially province C1 (6 cases, 35.3 %), followed by the northeastern region (40.6 %). Contrary to other Thai studies, most SUDS cases were found in the northeastern region(2, 23-25). This is the novel evidence indicating that the most common SUDS cases were not from the northeastern region. Interestingly, the majority of SUDS cases were found in province C1 in the central region. Field investigations of SUDS families or villages of this province should be further focused on reducing the burden of sudden death at a young age. Males (27 cases, 84.4 %) were found more than females (5 cases, 15.6 %), which is consistent with previous reports(2,25-29). The prominent sex difference may be possible pathogenesis of heart-related problems. Valladares reported cardiac vagal tone significantly declined while sympathetic nerve activity markedly increased during the rapid eye movement sleep in the male as compared with the female(30).
The mean age in this study was 29.44 ± 5.59 and was close to that in the previous of Thai SUDS cases(3,24-25). Simultaneously, the population aged 18 - 39 in our study was is in line with the results of previous studies (3,23-25). The study of Cheng, 80.56 % of the SUDS cases were related to overwork including psychological and physical stress resulting in high fatigue level(31). related to overwork including psychological and physical stress resulting in high fatigue level(31). The high occurrence rates for SUDS were blue-collar construction as several studies reported in Thailand(26, 23-25) and southern China study(31).These workers seem to be susceptible to SUDS because of sympathetic nervous activity increase(30) and blood oxygen decrease(31) after heavy physical labor. Taken together, these factors combined with a genetic predisposition may contribute to the death of SUDS cases. The incidence of SUDS cases relatively peaked in the summer and monsoon months that was May 2017, followed by August 2017 June 2018, and March 2018 respectively, which are consistent with the findings reported from previous Thai studies(23-24) and a Chinese study(31). The summer and monsoon climate in the South of China and Southeast Asia including Thai land general ly have high temperatures all year round resulting in hot weather and humidity. Cheng reported that these seasons emerge more fever symptoms of SUDS cases(31). Also, ante-mortem symptoms such as headache and fever in SUDS cases(28) may be a predisposing factor of death. The mean BMI (23.8 ± 2.96 kg/m2) of Thai SUDS cases in this study was within normal range which is consistent with previous Thai studies, whereas the mean heart weight (352.53 ± 45.86 g) was in over range compared to that of Thai SUDS cases in other studies(24-25). However, the mean heart weight was similar to that of southern China study in 148 SUDS cases which found mean heart weight of 352.0 ± 54.4 g(26). There seems to be the association of heart weight increase and death as described in Steinhaus et al. about sudden arrhythmia death from the increased mean cardiac mass(33).

Arch AHS 2020; 32(3): 22-31.Thitinilnithi et al.
28
This study demonstrated CACNA1C gene mutation in 32 SUDS cases in the Thai population using nine different exon amino acid changes including CACNA1C-A39V, CACNA1C-G406R, CACNA1C-G490R, CACNA1C-E850del, CACNA1C -C1837Y, CACNA1C-R1880Q, CACNA1C-G1911R, CACNA1C-Q1916R, and CACNA1C-V2014I. The only one mutation CACNA1C-R1880Q was detected in 7 cases (21.9 %). It was different from other reports including CACNA1C-N547S, CACNA1C-R632R, CACNA1C-R858H, CACNA1C-R1780H, CACNA1C-C1855Y, CACNA1C-R1910Q(20) CACNA1C-A519Y(25)
and CACNA1C-N2091S(34). Owing to different exon amino acid changes of CACNA1C gene selection for each study, those variants were not identified in our study. Hereby, we reported a missense mutation of CACNA1C-R1880Q, rs182208896 similar to Risgaard et al. (2013). They studied the prevalence of genetic variants associated with Brugada syndrome (BrS) of 6152 persons in the Exome Sequencing Project. The missense mutation of CACNA1C-R1880Q was rarely reported in 6 cases of European Americans genotype and 1 case of African Americans genotype(35). This gene mutation was also reported in 1 case associated with BrS of 205 patients associated with BrS, BrS/SQT, idiopathic ventricular fibrillation (IVF), and early repolarization syndrome (ERS)(21). Contrary to our study, Suktitipat et al. (2017)(25) detected only 1 female indicated as the missense mutation of CACNA1C-A519Y. The most common mutation was TTN gene found in 44 % of the cases. From our study, the missense mutation of CACNA1C-R1880Q is only located at exon 44 in the C-terminus of the α1 subunit of L-type calcium channel (LTCC). Burashnikov et al. (2010)(21) studied the functional effect in p. E1829_1833dup and p. V2014I-CACNA1C mutations at exon 43 and 46, respectively. They found that these variant mutations lead to loss of function for LTCC. However, functional studies for other mutations including the missense mutation of CACNA1C-R1880Q have not been done yet. Besides, previous studies analyzed variants data and classified actionable pathogenic single-nucleotide variants in 500 European and 500 African-ancestry participants(36), in 4300 European and 2203
African-ancestry participants(37). These reported that CACNA1C - R1880Q was classified as likely benign classification of highly penetrant pathogenic variants. In addition, Campuzano et al. (2019)(38) reviewed data of 42 genes associated with BrS and classified CACNA1C-R1880Q as a variant of uncertain significance (VUS). To date, there is no evidence of studies about the effect of function and pathogenicity of CACNA1C-R1880Q.
Conclusion From the results, only one missense mutation of CACNA1C-R1880Q was found in Thai SUDS; hence it may not a major cause of the disease. Therefore, further study is needed to clarify the role of this variant in the functional effect of pathogenesis in SUDS. In addition, identification of all genes associated with cardiac ion channelopathies in SUDS cases could potentially be used for familial risk screening or surviving relatives and help predict the prognosis of the channelopathies gene mutation along with the diagnostic tool to identify patients who might be at a higher risk of sudden deaths in the future. In addition, identification of all genes associated with cardiac ion channelopathies in SUDS cases could potentially predict the real prognosis of the channelopathies gene mutation.
Take home messages A heterozygous missense mutation
of CACNA1C-R1880Q at C-terminus of α1C subunit of the L-type cardiac calcium channel were found in Thai SUDS. Seven cases (21.9 %) with heterozygous A/G, c.720016 G>A within exon 44 were detected. This genetic variant is associated with Brugada syndrome (BrS).
Conflicts of interest The authors declare no conflict of interest.
Acknowledgements We would like to thank the Faculty of Allied Health Sciences, Thammasat University, Thailand, and Central Institute of Forensic Science, Thailand, for supporting. The financial was

CACNA1C gene mutation and sudden unexplained deathArch AHS 2020; 32(3): 22-31.
29
supported by Capacity Building Program for New Researcher 2018 from National Research Council of Thailand NRCT) Contact Number 8/2561) and Thammasat University Research Fund, Thailand (Contact Number 111/2560).
References1. Tokashiki T, Muratani A, Kimura Y, Muratani H, Fukiyama K. Sudden death in the general population in Okinawa: Incidence and causes of death. Jpn Circ J 1999; 63: 37-42. 2. Gervacio-Domingo G, Punzalan FE, Amarillo ML, Dans A. Sudden unexplained death during sleep occurred commonly in the general population in the Philippines: A sub study of the national nutrition and health survey. J Clin Epidemiol 2007; 60: 567-71. 3. Tungsanga K, Sriboonlue P. Sudden unexplained death syndrome in north-east Thailand. Int J Epidemiol 1993; 22: 81-7.4. Priori SG, Aliot E, Blomstrom-Lundqvist C, Bossaert L, Breithardt G, Brugada P, et al. Task Force on Sudden Cardiac Death, European Soc iety of Card io logy. Summary of recommendations. Ital Heart J Suppl 2002; 3: 1051-65.5. Campuzano O, Beltran-Alvares P, Iglesias A, Scornik F, Perez G, Brugada R. Genetics and cardiac channelopathies. Genet Med 2010; 12: 260-7.6. Nademanee K, Veerakul G, Nimmannit S, Chaowakul V, Bhuripanyo K, Likittanasombat K, et al. Arrhythmogenic marker for the sudden unexplained death syndrome in Thai men, Circulation 1996; 96: 2595-600.7. Vatta M, Dumaine R, Varghese G, Richard TA, Shimizu W, Aihara N, et al. Genetic and biophysical basis of sudden unexplained nocturnal death syndrome (SUNDS), a disease allelic to Brugada syndrome. Hum Mol Genet 2002; 11: 337-45.8. Sangwatanaroj S , Yanatasneej i t P, Sunsaneewitayakul B, Sitthisook S. Linkage analyses and SCN5A mutations screening in five sudden unexplained death syndrome (Lai-tai) families. J Med Assoc Thail 2002; 85: S54-61.
9. Makarawate P, Chaosuwannakit N , Vannaprasaht S, Sahasthas D, Koo SH, Lee EJD, et al. SCN5A Genetic Polymorphisms Associated With Increased Defibrillator Shocks in Brugada Syndrome. J Am Heart Assoc 2017; 6(6): e005009.10. Pitiwararom R, Vongpaisarnsin K, Hoonwijit U. SCN5A gene exome sequencing profile in sudden unexplained nocturnal death syndrome in Thai population. Chula Med J 2019; 63: 111-8.11. Yanatatsaneejit P. (2001). Detection of SCN5Agene mutation and linkage analysis study in SCN5A, KCND2 and KCND3 gene in sudden unexplained death syndrome families. M.Sc. Thesis, Medical Sciences, Chulalongkorn University, TH. 12. Chen Q, Kirsch GE, Zhang D, Genetic basis and molecular mechanism for idiopatic ventricular fibrillation. Nature 1998; 392: 293-6.13. Kapplinger JD, Tester DJ, Alders M, Benito B, Berthet M, Brugada J, et al. An international compendium of mutations in the SCN5A- encoded cardiac sodium channel in patients referred for Brugada syndrome genetic testing. Heart Rhythm 2010; 7: 33-46.14. Antzelevitch C, Pollevick GD, Coideiro JM, Casis O, Sanguinetti M.C, Aizawa Y, et al. Loss of function mutations in the cardiac calcium channel underlie a new clinical entity characterized by ST segment elevation, short QT intervals, and sudden cardiac death. Circulation 2007; 115: 442-9. 15. Schultz D, Mikala G, Yatani A, Engle D B, IIes D E, Segers B, et al. Cloning, chromosomal localization, and functional expression of the alpha 1 subunit of the L-type voltage- dependent calcium channel from normal human heart. Proc Natl Acad Sci U S A 1993; 90(13): 6228-32. 16. Kim S, Cho CH, Geum D, Lee HJ. Association of CACNA1C Variants with Bipolar Disorder in the Korean Population. Psychiatry Investig 2016; 13(4): 453-7.

Arch AHS 2020; 32(3): 22-31.Thitinilnithi et al.
30
17. Chen J, Sun Y, Liu X, Li J. Identification of a novel mutation in the CACNA1C gene in a Chinese family with autosomal dominant cerebellar ataxia. BMC Neurol 2019; 19 (1): 157.18. Splawski I, Timothy KW, Sharpe LM, Decher N, Kumar P, Bloise R, et al. Cav1.2 calcium channel dysfunction causes a multisystem disorder including arrhythmia and autism. Cell 2004; 119: 19–31.19. Barrett CF, Tsien RW. The Timothy syndrome mutation differentially affects voltage- and calcium-dependent inactivation of CaV1.2 L-type calcium channels. Proc Natl Acad Sci U S A 2008; 105(6): 2157-62. 20. Fukuyama M, Wang Q, Kato K, Ohno S, Ding WG, Toyoda F, et al. Long QT syndrome type 8: novel CACNA1C mutations causing QT prolongation and variant phenotypes. Europace 2014; 16: 1828-37. 21. Burashnikov E, Pfeiffer R, Barajas-Martinez H, Delpón E, Hu D, Desai M, et al. Mutations in the cardiac L-type calcium channel associated with inherited J-wave syndromes and sudden cardiac death. Heart Rhythm 2010; 7(12): 1872-82.22. Liu X, Shen Y, Xie J, Bao H, Cao Q, Wan R, et al. A mutation in the CACNA1C gene leads to ear ly repolar izat ion syndrome with incomplete penetrance: A Chinese family study. PLoS ONE 2017; 12(5): 1-18. 23. Tatsanavivat P, Chiravatkul A, Klungboonkrong, Chaisiri S, Jarerntanyaruk L, Munger RG, et al. Sudden and unexplained deaths in sleep (Lai tai) of young men in rural northeastern Thailand. Int J Epidemiol 1992; 21: 904-10.24. Srettabunjong S, Sudden Unexplained Nocturnal Death Syndrome: Epidemiological and Morphological Characteristics in Thai Autopsy Cases. J Forensic Sci 2019; 64(3): 773-7.25. Sukt i t ipat B , Sath i ra reuangcha i S , Roothumnong E, Thongnoppakhun W, Wangkiratikant P, Vorasan N, et al. Molecular investigation by whole exome sequencing revealed a high proportion of pathogenic variants among Thai victims of sudden unexpected death syndrome. PLoS One 2017; 12(7): e0180056.
26. Zhang L, Tester DJ, Lang D, Chen Y, Zheng J, Gao R, et al. Does sudden unexplained nocturnal death syndrome remain the autopsy-negative disorder: a gross, microscopic, and molecular autopsy investigation in Southern China. Mayo Clin Proc 2016; 91: 1503-14. 27. Zheng J, Huang E, Tang S, Wu Q, Huang L, Zhang D, et al. A case control study of sudden unexplained nocturnal death syndrome in the southern Chinese Han population. Am J Forensic Med Pathol 2015; 36: 39-43.28. Chen Z, Mu J, Chen X. Sudden unexplained nocturnal death syndrome in Central China (Hubei): a 16-year retrospective study of autopsy cases. Medicine 2016; 95: e2882.29. Zheng J, Zheng D, Su T, Cheng J. Sudden unexplained nocturnal death syndrome: the hundred years’ enigma. J Am Heart Assoc 2018; 7(5): e007837.30. Valladares EM, Eljammal SM, Motivala S, Ehlers CL, Irwin MR. Sex differences in cardiac sympathovagal balance and vagal tone during nocturnalsleep. Sleep Med 2008; 9: 310-6.31. Cheng J, Makielski C J, Yuan P, Shi N, Zhou F, Ye B, et al. Sudden unexplained nocturnal death syndrome in southern China: epidemiological survey and SCN5A gene screening. Am J Forensic Med Pathol 2011; 32(4): 359-63.32. Charoenpan P, Muntarbhorn K, Boongird P, Puavilai G, Ratanaprakarn R, Indraprasit S, et al. Nocturnal physiological and 15 biochemicalchanges in sudden unexplained death syndrome: a preliminary report of a case control study.Southeast. Asian J Trop Med Public Health 1994; 25: 335-40.33. Steinhaus DA, Vittinghoff E, Moffatt E, Hart AP, Ursell P, Tseng ZH. Characteristics of sudden arrhythmic death in a diverse, urban community. Am Heart J 2012; 163: 25-31.34. Sutphin BS, Boczek NJ, Barajas-Martínez H, Hu D, Ye D, Tester DJ, et al. Molecular and Functional Characterization of Rare CACNA1C Variants in Sudden Unexplained Death in the Young. Congenit Heart Dis 2016; 11(6): 683-92.

CACNA1C gene mutation and sudden unexplained deathArch AHS 2020; 32(3): 22-31.
31
35. Risgaard B, Jabbari R, Refsgaard L, Holst AG, Haunsø S, Sadjadieh A, et al. High prevalence of genetic variants previously associated with Brugada syndrome in new exome data. Clin Genet 2013: 84(5): 489-95. 36. Dorschner MO, Amendola LM, Turner EH, Robertson PD., Shirts BH. , Gallego CJ, et al. Actionable, pathogenic incidental findings in 1,000 participants’ exomes. Am J Hum Genet 2013; 93(4): 631-40.
37. Amendola LM, Dorschner MO, Robertson PD, Salama JS, Hart R, Shirts BH, et al. Actionable exomic inc identa l findings in 6503 part ic ipants: chal lenges of var iant classification. Genome Res 2015; 25(3): 305-15. 38. Campuzano O, Brugada G-S, Fernandez- Falgueras A, Cesar S, Coll M, Mates J, et al. Genetic interpretation and clinical translation of minor genes related to Brugada syndrome. Human Mutation 2019; 40: 749-64.

ORIGINAL ARTICLEArch AHS
32
Archives of Allied Health Sciences 2020; 32(3): 32-38.
ABSTRACT
This study investigated the prevalence of anemia and thalassemia in the Suay elderly population. The study conducted on 63 apparently healthy individuals with an age range of 60-85 years. Blood samples were collected to determine the following laboratory tests; red blood cell (RBC) parameters, hemoglobin analysis, and globin genotyping. Based on established WHO criteria, the overall prevalence of anemia was found to be 47.6%. The astoundingly high prevalence of thalassemia was found in non-anemic subjects for 84.8% and anemic subjects for 93.3%. As expected, the high frequency of Hb E and α+-thalassemia was observed in this population, consistent with the evidence previously known in the region. A high prevalence of α0-thalassemia (SEA deletion) was found in Suay ethnic group. Also, α-thalassemia and Hb E related diseases like AEBart’s and EEBart’s were found in this population. These data indicated that health burden resulting from Hb Bart’s hydrops fetalis may be serious in Suay ethnic group and complex thalassemia disease was found to be health problem in the elderly. Our findings provide not only baseline information, potentially useful for implementing appropriate control measures, but also an enhanced awareness and understanding of anemia and health care advice among the Suay elderly population.
* Corresponding author: Rossarin Karnpean, MT, PhD, College of Medicine and Public Health, Ubon Ratchathani University, Ubon Ratchathani, Thailand. E-mail: [email protected]: 22 March 2020/ Revised: 8 April 2020/ Accepted: 2 June 2020
KEYWORDS
Anemia; Thalassemia; Elderly; Suay ethnicity; The lower Northeastern Thailand.
Anemia and thalassemia in the Kui (Suay) elderly living in Sisaket Province located at the lower Northeastern Thailand
Roongnalin Bunthupanich1, Rossarin Karnpean2*, Anuwat Pinyachat2, Nawinda Jiambunsri2, Nattapol Prakobkaew3
1 Graduate student from Biomedical Sciences Program, College of Medicine and Public Health, Ubon Ratchathani University, Ubon Ratchathani, Thailand.2 College of Medicine and Public Health, Ubon Ratchathani University, Ubon Ratchathani, Thailand.3 Faculty of Allied Health Sciences, Burapha University, Chonburi, Thailand.

Anemia and thalassemia in the Suay elderlyArch AHS 2020; 32(3): 32-38.
33
Introduction Anemia in the elderly is common and increasing as the population ages. In older patients, anemia of any degree contributes significantly to morbidity and mortality and has a significant effect on the quality of life. Part of the problem here relates to its definition, which is based on WHO-criteria established in 1968(1). The WHO definition of anemia is hemoglobin (Hb) less than 130 g/L (13 g/dL) in men, Hb less than 120 g/L (12 g/dL) in non-pregnant women, and less than 110 g/L (11 g/dL) in pregnant women. Hb levels decline with age, and there has been a debate as to whether these values are applicable to older people, although there is no acceptable alternative definition of anemia in this age group. The prevalence of anemia in the elderly has been found to range from 8 to 44%, with the highest prevalence in men 85 years and older(1-3). Clinical symptoms of anemia vary, including mild pallor, weakness, shortness of breath, fatigue, and reduced work or productivity(4, 5). Anemia has multiple etiologies, including iron deficiency (ID), chronic inflammatory disorders, micronutrient deficiencies, parasitic infections, excessive bleeding, and congenital defects of Hb production such as thalassemia and hemoglobinopathies(6). From several studies, it has been clear that anemic subjects with combined thalassemia and iron deficiency (ID) are apparently associated with more severe hematological phenotypes than those with thalassemia or ID alone(7-10). Ascertaining anemia and defining its underlying causes are essential for providing appropriate care and management of the patients as well as the establishment of a control program. From this context, the survey of thalassemia prevalence in the endemic areas of thalassemia and hemoglobinopathies such as the Northeastern (NE) Thailand is necessary. The community-based study of anemia in the elderly in NE Thailand revealed that the overall prevalence of anemia was found to be 47.7% and thalassemia was considered to be significant contributors to anemia(11). As far as we know, community-based surveys on anemia and its relationship to thalassemia within ethnic populations distributed in many areas of Thailand
are limited, despite the information that ethnic minorities are prone to several health problems including anemia. In 2018, the study of anemia, iron deficiency, and thalassemia in a group of hill tribe, Pakakayo-Karen in Northern Thailand revealed that anemia in the minority is more likely due to thalassemia than ID(12). To the best of our knowledge, the survey of anemia and thalassemia in the ethnic minority in NE Thailand has never been reported. Our study aimed to survey the prevalence of anemia and thalassemia in the older population of Kui or Suay ethnic group. Suay is a Mon-Khmer language of the West Katuic branch, spoken in the southeastern part of the Northeastern (NE) Thailand, especially in the provinces of Surin and Sisaket and the adjoining areas of Cambodia and Laos(13). In NE Thailand, Suay minority, about 273,570 people, resides in 686 villages in Surin, Sisaket, Buriram, and Ubon Ratchathani(14). This ethnic minority has been previously observed as having the high prevalence of Hb E(15). The findings herein will serve as baseline information and a better understanding of health situation in the region. This data will be useful for appropriate health care advice to this population.
Materials and methods Subjects The study protocol was approved by the Institution Review Board (IRB) of Ubon Ratchathani University, Ubon Ratchathani, Thailand (UBU-REC-36/2561). A total of 63 samples belong to Suay ethnic group distributed in seven villages in two districts (Muang Chan and Kantharalak) of Sisaket Province were selected as the study population. The criteria for volunteer enrollment in this study were as follows; look healthy, over 60 years of age, unrelated, and recognized as a member of the Suay ethnic population for at least three generations with no admixture from other populations. Venous blood specimens (EDTA as an anticoagulant) of volunteers were obtained after signing informed consents.
Laboratory investigation Complete blood count (CBC) was performed in routine practice at Ubon Ratchathani University Hospital using the Sysmex XE-2100 Hematology

Arch AHS 2020; 32(3): 32-38.Bunthupanich et al.
34
Analyzer (Sysmex, Kobe, Japan) within 24 hours. A Hb level of less than 13.0 g/dL in males and 12.0 g/dL in females was identified as anemia according to the WHO criteria(16). Hemoglobin analysis was done using capil lary zone electrophoresis (Minicap: Sebia, Lisses, France). For globin gene genotyping, DNA was extracted from peripheral blood leukocytes using the standard method and identifications of common α-thalassemia including α0-thalassemia (SEA & THAI deletions) and α+-thalassemia (-α3.7 & -α4.2) were performed using the gap-PCR methods described elsewhere(17,18). Identifications of Hb Constant Spring and Hb Pakse′ were done using allele-specific PCR based methods (19,20).
Statistical analysis Data processing was done using IBM SPSS Statistic 20 software (SPSS Inc, Chicago, IL, USA)
Descriptive statistics, i.e., percentage, mean and standard deviation, were used to describe the prevalence of anemia and thalassemia as well as hematological features.
Results Among 63 Suay elderly subjects aged 60-85 years, non-anemia and anemia were detected in 33 (52.4%) and 30 (47.6%) subjects, respectively. The overall MCV results suggested that most cases expressed microcytic red blood cells. The mean of MCV in non-anemic males and females was 76.3 and 78.0 fL, respectively. The mean of MCV in anemic males and females was 71.2 and 68.4 fL, respectively. The characteristics of subjects including sex, age, and RBC parameters were summarized in Table 1.
Table 1 Characteristics of 63 Suay elderly subjects classified as non-anemic and anemic subjects (data expressed as mean ± SD and min-max in parentheses)
Sex
RBC Parameters
RBC
[10^6/uL]
HGB [g/
dL]
HCT
[%]
MCV
[fL]
MCH
[pg]
MCHC [g/
dL]
RDW-CV
[%]
Non-Anemia
n = 33 (52.4%)
Male (14)5.37 ±0.52
(4.61-6.53)
14.0±0.8
(13.1-16.2)
40.7±2.3
(38.7-47.5)
76.3±6.9
(61.7-86.8)
26.2±2.5
(21.4-30.0)
34.3±0.6
(33.2-35.5)
14.9±1.7
(13-19.6)
Female (19)4.97±0.36
(4.18-5.54)
13.0±0.8
(12-14.3)
38.7±2.1
(36.2-43.3)
78.0±4.8
(67.9-88.5)
26.1±1.6
(23.1-30.4)
33.5±0.7
(32.6-34.5)
14.6±1.0
(12.7-17.2)
Anemia
n = 30 (47.6%)
Male (11)4.97±0.59
(4.16-6.05)
11.8±0.8
(10.3-12.9)
35.1±2.9
(29.3-38.2)
71.2±7.6
(58.2-85.5)
24.0±2.5
(20.5-28.1)
33.8±1.5
(32.2-36.6)
16.4±2.1
(13.8-20.8)
Female (19)4.72±0.56
(3.4-5.73)
10.6±1.3
(6.7-11.9)
32.2±4.1
(19.2-36.1)
68.4±7.9
(52.8-81.7)
22.6±2.4
(16.8-27.4)
33.0±1.0
(31.5-34.9)
16.7±3.6
(12.9-29.5)
Table 2 described the thalassemia types in non-anemic and anemic subjects. The extremely high prevalence of thalassemia was observed in the Suay elderly population, with the prevalence of 84.8 and 93.3% in non-anemic and anemic subjects, respectively. The most common thalassemia found in Suay elderly was heterozygous Hb E, followed by heterozygous Hb E with α-thalassemia and heterozygous α+-thalassemia. Out of the 63 Suay elderly, the overall prevalences of Hb E, and α0-thalassemia
were 76.2, and 7.9%, respectively, whereas, no β-thalassemia was found in this population. The heterozygous α0-thalassemia was found in 6.7% of the anemic group. Thalassemia diseases were also found in three cases including two cases of AEBart’s disease (--SEA/-α3.7, βΑ/βΕ and a case of EEBart’s disease (--SEA/-α3.7, βΕ/βΕ). The homozygous Hb E with α-thalassemia 2 female subjects had the lowest Hb level (6.7 g/dL) and subject with AEBart’s disease had the lowest MCV (52.8 fL) and MCH (16.8 pg) values in this study.

Anemia and thalassemia in the Suay elderlyArch AHS 2020; 32(3): 32-38.
35
Table 2 Thalassemia types and globin genotypes of 63 Suay elderly subjects in this study
Thalassemia type Globin genotypeNon-Anemia Anemia
n (%) n (%)Non-thalassemia 5 (15.2) 2 (6.7)
Thalassemia 28 (84.8) 28 (93.3)
1. Heterozygous α+-thalassemia αα/-α3.7, βΑ/βΑ 3 (9.1) 2 (6.7)
2. Homozygous α+-thalassemia -α3.7/-α3.7, βA/βA, - 1 (3.3)
3. Heterzygous α0-thalassemia --SEA/ αα, βA/βA - 2 (6.7)
4. Heterozygous Hb E αα/αα, βΑ/βΕ 14 (42.4) 8 (26.7)
5. Heterozygous Hb E with α-thalassemia αα/-α3.7, βΑ/βΕ 5 (15.2) 3 (10)
αα/αCSα, βΑ/βE 3 (9.1) -
αα/αPSα, βΑ/βΕ 1 (3.0) -
αCSα/-α3.7, βΑ/βE 1 (3.0) 2 (6.7)
αPSα/-α3.7, βΑ/βE - 1 (3.3)
αCSα/αPSα, βΑ/βΕ - 1 (3.3)
6. Homozygous Hb E with α-thalassemia αα/-α3.7, βΕ/βΕ 1 (3.0) 2 (6.7)
αα/αCSα, βΕ/βE - 2 (6.7)
αCSα/αPSα, βΕ/βE - 1 (3.3)
7. Thalassemia disease --SEA/-α3.7, βΑ/βΕ - 2 (6.7)
--SEA/-α3.7, βΕ/βΕ - 1 (3.3)
Total 33 (100) 30 (100)Note: Data are numbers with percentages in parentheses.
Discussion This study is the first report that focuses on the prevalence of anemia and thalassemia in the Suay elderly. Suay ethnic population in this study is one of the most common minorities in the lower NE Thailand(14). This survey revealed a high prevalence of anemia in approximately 47.6% of Suay elderly people living in Sisaket Province which is located near the border region of Thailand, Lao PDR, and Cambodia. The prevalence of anemia found in this study was equal to that in a previous study in the elderly living in Udon Thani Province of NE Thailand(11). Unlike this study, several community-based studies conducted in Western and Northeastern Asian countries reported a relatively low prevalence of anemia in the elderly people (11-18%)(21-23). Conversely, a relatively higher prevalence of anemia (21-34%) has been reported in a group of African-American
elderly(21,24,25). Concerning the variations in genetic background, it is noteworthy that the higher anemia prevalence has been observed within those ethnicities having high carrier rates of thalassemia. Previous studies conducted in this area suggested that the most likely causative factor in more than half of the anemic individuals identified may be the presence of thalassemia(8,10,26). The study in a group of hill tribe, Pakakayo-Karen in Northern Thailand also confirmed that anemia in the minority is more likely due to thalassemia than ID(12). This study investigated all common forms of thalassemia (α0-thal, β-thal, Hb E, and α+-thal) in the Suay elderly population. Surprisingly, astoundingly high prevalence of thalassemia was found in non-anemic (84.8%) and anemic (93.3%) Suay elderly population. As expected, the finding of a high frequency of α+-thalassemia in this study

Arch AHS 2020; 32(3): 32-38.Bunthupanich et al.
36
was consistent with the evidence in the southern part of NE Thailand(27). The high prevalence of Hb E herein confirmed the study of Fucharoen G, et al(15) which revealed the high frequency of Hb E in Suay and Khmer, and close relation was observed in these two ethnic groups. No occurrence of β-thalassemia was found in the Suay elderly population and this seemed to be consistent with the evidence of the low prevalence of β-thalassemia in the lower part of NE Thailand(27). High prevalence of α0-thalassemia (SEA deletion) was found in Suay ethnic group, heterozygous α0-thalassemia was found in two cases and also, α-thalassemia and Hb E related diseases like AEBart’s and EEBart’s were found in this study. In conclusion, the prevalence of major thalassemia was 76.2, 7.9, and 0% for Hb E, α0-thalassemia, and β-thalassemia, respectively. These data indicated that health burden resulting from Hb Bart’s hydrops fetalis may be serious in Suay ethnic group and complex diseases like AEBart’s and EEBart’s were important health problems in Suay elderly. Moreover, since the extremely high prevalence of thalassemia was found in the Suay elderly, the awareness of ID should be concerned in this group because of the information that anemic subjects with combined thalassemia and ID are apparently associated with more severe hematological phenotypes(7-10). Unfortunately, this study has some limitations, particularly, the small sample size and the lack of finding out other causes of anemia. The understanding of the cause of the low Hb in female subject with homozygous Hb E/α+-thalassemia has been limited; thereby, ID or other causes may result in this appearance. Further study focusing on the cause of anemia in this population will be of benefit to public health effort to provide better health care. However, the findings in this study might suggest that thalassemia and hemoglobinopathies are one of the causes that should be taken into account in any proposed anemia control program conducted within the Suay population. It is therefore essential that health workers understand this outcome so that they can provide informed advice and/or more effective management strategies for the affected individuals.
Conclusion This study is the first report that focuses on the prevalence of anemia and thalassemia in the Suay elderly. The high prevalence of anemia (47.6%) was found in this population. The overall prevalence of Hb E, and α0-thalassemia were 76.2, and 7.9%, respectively, whereas, no β-thalassemia was found in this population. Thalassemia diseases were also found in three cases including two cases of AEBart’s disease and a case of EEBart’s disease. This study might suggest that thalassemia and hemoglobinopathies are one of the causes that should be considered in any proposed anemia control program conducted within the Suay population.
Take home messages The prevalence of anemia in the Suay elderly was 47.6%. The finding of a high prevalence of Hb E, α+-thalassemia, and α0-thalassemia indicated that complex thalassemia diseases like AEBart’s and EEBart’s were health problems in the elderly and Hb Bart’s hydrops fetalis should be concerned in the Suay population.
Conflicts of interest The authors declare no conflict of interest.
Acknowledgements This study was supported by a grant from the Thailand Research Fund (TRF) and Office of the Higher Education Commission (OHEC) and Ubon Ratchathani University (MRG6180197) and a grant from the College of Medicine and Public Health Research, Ubon Ratchathani University (2563). We thank all volunteers and staff from Takon Health Promoting Hospital, Muang Chan District, and Banbungmalu Health Promoting Hospital, Kantharalak District, Si Sa Ket province. We thank the medical technologists of Ubon Ratchathani University Hospital for helping with laboratory analysis.

Anemia and thalassemia in the Suay elderlyArch AHS 2020; 32(3): 32-38.
37
References1. Blanc B, Finch CA, Hallberg L, Lawkowicz W, Layrisse M, Mollin DL, et al. Nutritional anaemias. WHO Tech Rep Ser 1968; 405: 1-40.2. Cheng CK, Chan J, Cembrowski GS, van Assendelft OW. Complete blood count reference interval diagrams derived from NHANES III: stratification by age, sex, and race. Lab Hematol 2004; 10: 42-53. 3. Zakai NA, Katz R, Hirsch C, Shlipak MG, Chaves PHM, Newman AB, et al. A Prospective study of anemia status, hemoglobin concentration, and mortality in an elderly cohort: The Cardiovascular Health Study. Arch Intern Med 2005; 165: 2214-20. 4. McLean E, Cogswell M, Egli I, Wojdyla D, de Benoist B: Worldwide prevalence of anemia, WHO vitamin and mineral nutrition information system, 1993–2005. Public Health Nutr 2009; 12: 444-54.5. Lasch KF, Evans CJ, Schatell D: A qualitative analysis of patient-reported symptoms of anemia. Nephrol Nurs J 2009; 36: 621-44.6. Evatt BL, Gibbs WN, Lewis SM, McArthur JR: Fundamental Diagnostic Hematology: Anemia, ed 2. Geneva, World Health Organization, 2002.7. Pansuwan A, Fuchareon G, Fuchareon S, Himakhun B, Dangwiboon S. Anemia, iron deficiency and thalassemia among adolescents in Northeast Thailand: results from two independent surveys. Acta Haematol 2011; 125: 186-92.8. Panomai N, Sanchaisuriya K, Yamsri S, Sanchaisuriya P, Fucharoen G, Fucharoen S, et al. Thalassemia and iron deficiency in a group of northeast Thai school children: relationship to the occurrence of anemia. Eur J Pediatr 2010; 169: 1317-22.9. Thurlow RA, Winichagoon P, Green T, Wasantwisut E, Pongcharoen T, Bailey KB, et al. Only a small proportion of anemia in northeast Thai schoolchildren is associated with iron deficiency. Am J Clin Nutr 2005; 82: 380-87.
10. Sanchaisuriya K, Fucharoen S, Ratanasiri T, Sanchaisuriya P, Fucharoen G, Dietz E, et al. Thalassemia and hemoglobinopathies rather than iron deficiency are major causes of pregnancy-related anemia in northeast Thailand. Blood Cells Mol Dis 2006; 37: 8-11.11. Deeruksa L, Sanchaisuriya K. Anemia in the elderly in Northeastern Thailand: A community based study investigating prevalence, contributing factors, and hematologic features. Acta Haematologica 2017; 138: 96-102.12. Deeruksa L, Raksasang M, Sanchaisuriya K. Anemia, Iron Deficiency and Iron Deficiency Anemia in a Group of Hill-Tribe, Pakakayo- Karen. KKU Journal for Public Health Research 2018; 11: 18-27.13. Smith, KD. A lexico-statistical study of Mon-Khmer language. In: Gonzalez AB, Thomas DD, Editors. Linguistics Across Continents: Studies in Honor of Richard S. Pittman. Manila (Philippines): The Linguistic Society of the Philippines, 1981: 180–205. 14. van der Haak F, Woykos B. Kui dialect survey in Surin and Sisaket. Mon-Khmer Studies 1990; 16: 109–142.15. Fucharoen G, Fucharoen S, Sanchaisuriya K, Sae-Ung N, Suyasunanond U, Sriwilai P, et al. Frequency Distribution and Haplotypic Heterogeneity of beta(E)-Globin Gene among Eight Minority Groups of Northeast Thailand. Hum Hered 2002; 53: 18-2216. Iron deficiency anemia: assessment, prevention and control. A guide for program managers. Document WHO/NHD/01.3. Geneva, World Health Organization, 2001.17. Sae-ung N, Fucharoen G, Sanchaisuriya K, Fucharoen S. α0-Thalassemia and related disorders in northeast Thailand: a molecular and hematological characterization. Acta Haematol 2007; 117: 78-82.18. Charoenwijitkul T, Singha K, Fucharoen G, Sanchaisuriya K, Thepphitak P, Wintachai P,et al. Molecular characteristics of α+-thalassemia (3.7 kb deletion) in Southeast Asia: Molecular subtypes, haplotypic heterogeneity, multiple founder effects and laboratory diagnostics. Clin Biochem 2019; 71: 31-7.

Arch AHS 2020; 32(3): 32-38.Bunthupanich et al.
38
19. Fucharoen S, Fucharoen G, Fukumaki Y. Simple non-radioactive method for detecting haemoglobin Constant Spring gene. Lancet 1990; 335(8704): 1527.20. Sanchaisuriya K, Fucharoen G, Fucharoen S. Hb Paksé [(α2) codon 142 (TAA→TAT or Term→Tyr)] in Thai patients with EAbart’s disease and Hb H disease. Hemoglobin 2002; 26: 227-35.21. Guralnik JM, Eisenstaedt RS, Ferrucci L, Klein HG, Woodman RC: Prevalence of anemia in persons 65 years and older in the United States: evidence for a high rate of unexplained anemia. Blood 2004; 104: 2263-8.22. Choi CW, Lee J, Park KH, Yoon SY, Choi IK, Oh SC, et al. Prevalence and characteristics of anemia in the elderly: cross-sectional study of three urban Korean population samples. Am J Hematol 2004; 77: 26-30.23. Yamada M, Wong FL, Suzuki G: Longitudinal trends of hemoglobin levels in a Japanese population – RERF’s Adult Health Study subjects. Eur J Haematol 2003; 70: 129-35.
24. Wang JL, Shaw NS. Iron status of the Taiwanese elderly: the prevalence of iron deficiency and elevated iron stores. Asia Pac J Clin Nutr 2005; 14: 278-84.25. Denny SD, Kuchibhatla MN, Cohen HJ: Impact of anemia on mortality, cognition, and function in community-dwelling elderly. Am J Med 2006; 119: 327-34. 26. Carnley BP, Prior JF, Gilbert A, Lim E, Devenish R, Sing H, et al: The prevalence and molecular basis of hemoglobinopathies in Cambodia. Hemoglobin 2006; 30: 463-70. 27. Tritipsombut J, Sanchaisuriya K, Phollarp P, Bouakhasith D, Sanchaisuriya P, Fucharoen G, et al. Micromapping of thalassemia and hemoglobinopathies in different regions of Northeast Thailand and Vietaine, Laos People’s Democratic Republic. Hemoglobin 2012; 36: 47-56.

ORIGINAL ARTICLE Arch AHS
39
Archives of Allied Health Sciences 2020; 32(3): 39-49.
ABSTRACT
Muscle weakness and limited range of motion (ROM) are common problems which cause activity limitation in children with spastic cerebral palsy (CP). A sliding rehabilitation machine is a rehabilitation machine that allows closed kinetic chain exercises of the lower extremity and exercise using the sliding rehabilitation machine can improve muscle strength and walking ability of children with CP. The objective of this study was to evaluate the effects of a lower extremity strength training program using a sliding rehabilitation machine on active range of motion (AROM) of the lower extremity in children with spastic CP. A single-blind randomized controlled trial was conducted in children with spastic CP, aged 7-18 years, who were randomly allocated into either an exercise (EG) or control group (CG). EG received a lower extremity strength training program using a sliding rehabilitation machine, 3 times per week for 6 weeks. The training loads were progressed every 2 weeks. Both EC and CG received prolonged muscle stretching by standing on a tilt table for 30 minutes, once a week for 6 weeks. AROM of the lower extremity was measured before and after the training. The result showed that AROM for hip extension, hip flexion, knee flexion and ankle dorsiflexion in the EG were improved significantly greater than that in the CG (all, p-value < 0.05). In conclusions, the strength training program using a sliding rehabilitation machine could improve AROM of the lower extremity in children with spastic CP.
* Corresponding author: Wanida Donpunha, PT, PhD. School of Physical Therapy, Faculty of Associated Medical Sciences, Khon Kaen University, Thailand. E-mail: [email protected]: 1 September 2019/ Revised: 4 February 2020/ Accepted: 7 June 2020
KEYWORDS
Cerebral palsy; Exercise; Strength training; Range of motion; ROM.
Effects of a lower extremity strength training program on range of motion in children with spastic cerebral palsy
Ratchadaporn Borkam1,2, Wanida Donpunha2,3*, Punnee Peungsuwan3, Raoyrin Chanavirut3, Sainatee Pratanaphon4, Pisamai Malila3
1 Student of Doctor of Philosophy Program in Human Movement Sciences (International Program), Faculty of Associated Medical Sciences, Khon Kaen University, Thailand.2 Research Center in Back, Neck, Other Joint Pain and Human Performance (BNOJPH), Khon Kaen University, Thailand.3 School of Physical Therapy, Faculty of Associated Medical Sciences, Khon Kaen University, Thailand.4 Department of Physical Therapy, Faculty of Associated Medical Sciences, Chiang Mai University, Thailand.

Arch AHS 2020; 32(3): 39-49.Borkam et al.
40
Introduction Cerebral palsy (CP) is a group of permanent disorder of the development of posture and movement which is caused by a non-progressive lesion in the immature brain(1,2) and the common type of CP is spastic CP. The main problems of these children are weakness of the lower extremity and abnormal range of motion (ROM). It has been shown that ROM of the lower extremity which is correlated with alignment in the upright position and walking. Asymmetric alignment in standing is often present in children with spastic CP(3,4)
resulting in standing and walking ability limitations(3,4). Therefore, the important treatment goals for spastic CP are to restore abnormal ROM and maximize their ability to perform their functional activities. Several studies reported that muscle weakness had a strong association with mobility limitations in children with CP rather than spasticity(5-8). Systematic reviews have shown that muscle strength training improves functional activity and strength in CP without adverse effect on spasticity or range of motion(1,9). Children with spastic CP improved their muscle tone, muscle strength, GMFM scores, basic motor abilities including standing and walking and gait function after receiving a functional strength training program(10-12) or a progressive resistance training for the lower extremity(13). A study suggested that ankle plantar flexor strength training program may lead to improvements in strength and spatiotemporal gait parameters of children with CP(14). Eagleton et al. found that a 6-week trunk and lower extremity strength training program using free weights and weight machines improved distance walked in 3 minutes, gait velocity, step length and cadence in adolescents with cerebral palsy(15). Therefore, using exercise machines for children with spasticity CP may be a method for improving ROM, especially when the joint is moved by the muscle that acts on the joint; it is known as active range of motion (AROM). Functional strength training exercise such as sit-to-stand training has become of interest. It was found that sit-to-stand training can improve basic motor abilities, muscle strength, and walking efficiency in children with CP (10). Nevertheless,
the application of sit-to-stand exercises is limited to children who have sufficient power to maintain a standing position or who do not have severe contractures of the plantar flexor. Previous studies reported that exercise using the sliding rehabilitation machine can improve muscle strength and walking ability of children with CP(16,17). Additionally, the sliding rehabilitation machine can provide partial body weight support by altering the inclination of the supporting bearing. Moreover, it is closed-kinetic chain exercises that can prevent the compensatory movement that occurs during exercise. It was also possible to allow children’s feet to make full contact with the plate and to adjust for weight bearing exercise by controlling center-of-gravity movement(16,17). However, there are few studies that have observed at the benefit of strengthening exercise using a sliding rehabilitation machine on AROM of hip, knee and ankle joint in children with spastic CP. Thus, the study aimed to evaluate the effects of a lower extremity strength training program using the sliding rehabilitation machine on AROM in children with spastic CP.
Materials and methods Participants and study design Children who were diagnosed with spastic CP, aged 7-18 years, were recruited from Sri Sangvalya Khon Kaen School in Khon Kaen Province. All subjects were classified in the gross motor function classification system (GMFCS) level I-III, able to stand up from a chair 5 times independently without hand support, and understand and follow verbal instructions. The study excluded children who had a history of medical treatment for seizures, spasticity using botulinum toxin injections up to 3 months or orthopedic surgical procedures up to 6 months prior to the study. Written informed consent was obtained from participants and their parents or legal guardian. This study was approved by the Ethics Committee for Human Research, Khon Kaen University (HE592389). A single-blind randomized controlled trial was conducted. Twenty-eight participants were randomly assigned to either the exercise group (EG) or the control group (CG) using stratified

Lower limb strength training on ROM in spastic CPArch AHS 2020; 32(3): 39-49.
41
randomization of age range (7-12 years, and 13-18 years) and GMFCS by computer. During the research process, 2 participants were lost per group, and then at the end of the experiment,
there were 12 volunteers in each group. The characteristics of participants in the study are shown in Table 1 and the participation flow chart is shown in Figure 1.
Table 1 General characteristics of the participants
CharacteristicsExercise group
(n=12)Control group
(n=12)p-value
Gender: male/female (n) 6/6 7/5 -
Age (years) 12.58 ± 2.57 12.92 ± 2.15 0.734
Weight (kg) 33.39 ± 9.34 34.03 ± 9.38 0.870
Height (cm)BMI (kg/m2)
138.06 ± 16.5417.48 ± 3.92
137.48 ± 18.91 17.85 ± 2.84
0.9380.792
(GMFCS: I/II/III) (n) 4/4/4 4/4/4 -
Note: Data are expressed as Mean ± SD, BMI: body mass index, GMFCS: Gross Motor Function Classification System
Experimental protocol Both EC and CG received a prolonged muscle stretching which was performed by standing on a tilt table for 30 minutes, once a week for 6 weeks as a conventional physical therapy (PT). Participants in the EG received the lower extremity strength training program for 20 minutes, 3 days per week for 6 weeks. The training program was supervised by an experienced physiotherapist. Five-minute ergometer cycling with free load was conducted as a warm-up period before training session(12). The 10-minute exercise program included active exercise of the lower extremity against the body weight vest at loads 100% of 8 repetition maximum (8 RM). The 8 RM test was determined based on a previous study(11). A sliding rehabilitation machine was used for supporting the participants during exercise in EC
group (Figure 2). The machine consists of a pad for supporting the body; the footplate and Velcro straps for the safety; and a rail system for helping participants to perform exercises by up and down positioning. Participant was in a starting position of hip flexion to at least 90o, the knee flexion at 90o, and the feet evenly placed on the footplate (Figure 2A). A body weight vest (Figure 2C) with the determined loads was wrapped around the trunk. Then, participant was asked to extend the hips and knees (Figure 2B). The exercise was performed 8 repetitions per set, 3 sets a day with a 90-second resting interval. The training intensity was progressed by increasing load every two weeks using the 8 RM test. Another five-minute passive stretching for lower extremity was performed as a cool-down period and was conducted by a physical therapist, as previously described(10,12).

Arch AHS 2020; 32(3): 39-49.Borkam et al.
42
Figure 1 Participation flow chart

Lower limb strength training on ROM in spastic CPArch AHS 2020; 32(3): 39-49.
43
Figure 2 Strength training exercise using a sliding rehabilitation machine; A: starting position, B: participant is lifting up with knees and hip extension, C: weight vest
Outcome measurement The measurements of AROM of lower extremity were taken using a standard goniometer including hip joint (flexion, extension), knee joint (flexion, extension) and ankle joint (dorsiflexion, plantarflexion) by a blind assessor at pre- and post-test. Previous study showed that the intra-rater reliability of the AROM measurement in children with spastic CP was high(18). This study
showed that the intraclass correlation coefficients (ICCs) were within an acceptable range (ICCs > 0.9, all p-value < 0.001). The weaker leg represented the leg that has less movement of AROM of hip extension than the stronger leg.
Statistical analysis Statistical analysis was performed with SPSS 17.0 for Windows. Non-parametric tests were used when the data were not normally distributed.

Arch AHS 2020; 32(3): 39-49.Borkam et al.
44
Descriptive statistics were applied to explain baseline demographics. Intraclass correlation coefficient (ICC) was used to analyze the reliability of the AROM measurement. The mean values of the AROM between pre- and post-test within group were analyzed using Wilcoxon signed-rank test, and Mann Whitney U test was used for comparison of the AROM between two groups, with p-values less than 0.05 considered as statistically significant.
Results The AROM for hip flexion and extension, knee flexion, and ankle dorsiflexion and
plantarflexion of both legs in EG improved significantly after receiving program compared to those in the pre-test (all, p-value < 0.05) (Table 2). AROM of CG significantly improved for hip flexion and extension, and ankle dorsiflexion of both legs, and knee flexion of weaker leg (all, p-value < 0.05) (Table 3). In addition, the AROM of hip extension and knee flexion of both legs, hip flexion and ankle dorsiflexion of a weaker leg increased significantly in EG greater than CG (all, p-value < 0.05) (Table 4).
Table 2 Mean values of AROM for a weaker and a stronger leg in the exercise group (n = 12)
AROM(Degree)
Pre-test (Mean±SD)
Post-test (Mean±SD)
Mean Change (Mean±SD)
95% CI p-value
Weaker leg Hip joint Flexion 94.67 ± 20.84 132.25 ± 14.07 37.58 ± 17.70 26.34 – 48.83 0.002*
Extension 5.75 ± 4.98 29.42 ± 8.11 23.67 ± 8.08 18.53 – 28.80 0.002*
Knee joint Flexion 111.83 ± 28.51 135.42 ± 22.20 23.58 ± 11.91 16.02 – 31.15 0.002*
Extension - 4.75 ± 11.44 - 1.92 ± 5.27 2.83 ± 6.62 - 1.37 – 7.04 0.157
Ankle joint Dorsiflexion 3.42 ± 14.71 19.92 ± 15.79 16.50 ± 8.56 11.07 – 21.94 0.002*
Plantarflexion 36.50 ± 14.90 54.08 ± 8.26 17.58 ± 15.59 7.68 – 27.49 0.004*
Stronger leg Hip joint Flexion 102.50 ± 18.01 133.00 ± 13.11 30.50 ± 11.90 22.94 – 38.06 0.001*
Extension 8.08 ± 6.71 30.67 ± 7.96 22.58 ± 8.47 17.20 – 27.96 0.002*
Knee joint Flexion 116.17 ± 25.87 142.08 ± 15.05 25.92 ± 15.73 15.92 – 35.91 0.002*
Extension - 3.58 ± 11.5 - 0.83 ± 2.89 2.75 ± 8.63 - 2.73 – 8.23 0.180
Ankle joint Dorsiflexion 5.92 ± 4.30 19.67 ± 8.24 13.75 ± 7.93 8.71 – 18.79 0.002*
Plantarflexion 37.92 ± 14.53 54.83 ± 8.71 16.92 ± 11.34 9.71 – 24.12 0.002*
Note: Mean ± SD: Mean ± Standard deviation, * p-value < 0.05

Lower limb strength training on ROM in spastic CPArch AHS 2020; 32(3): 39-49.
45
Table 3 Mean values of AROM for a weaker and a stronger leg in control group (n=12)
AROM(Degree)
Pre-test (Mean±SD)
Post-test (Mean±SD)
Mean Change (Mean±SD)
95% CI p-value
Weaker leg Hip joint Flexion 91.08 ± 31.64 109.00 ± 18.58 17.92 ± 16.75 7.27 – 28.56 0.003*
Extension 8.42 ± 7.49 16.33 ± 12.01 7.92 ± 6.69 3.66 – 12.17 0.008*
Knee joint Flexion 109.50 ± 38.21 117.33 ± 31.47 7.83 ± 11.65 0.43 – 15.24 0.036*
Extension - 5.67 ± 11.94 - 4.17 ± 10.19 1.5 ± 2.65 - 0.18 – 3.18 0.066
Ankle joint Dorsiflexion 5.17 ± 4.86 14.25 ± 9.01 9.08 ± 7.93 4.05 – 14.12 0.006*
Plantarflexion 38.67 ± 19.46 44.83 ± 7.83 6.17 ± 17.25 - 4.79 – 17.13 0.332
Stronger leg Hip joint Flexion 90.00 ± 24.02 112.58 ± 22.55 22.58 ± 14.37 13.45 – 31.71 0.003*
Extension 12.00 ± 9.52 16.08 ± 12.38 4.08 ± 5.50 0.59 – 7.58 0.035*
Knee joint Flexion 114.75 ± 35.76 ±27.87 6.08 ± 16.86 - 4.63 – 16.79 0.141
Extension - 4.83 ± 10.15 - 4.17 ± 9.00 0.67 ± 1.61 - 0.26 – 1.69 0.180
Ankle joint Dorsiflexion 8.75 ± 6.84 14.83 ± 6.56 6.08 ± 7.09 1.58 – 10.59 0.024*
Plantarflexion 36.67 ± 20.82 46.25 ± 11.51 9.58 ± 19.94 - 3.09 – 22.25 0.125
Note: Mean ± SD: Mean ± Standard deviation, * p-value < 0.05
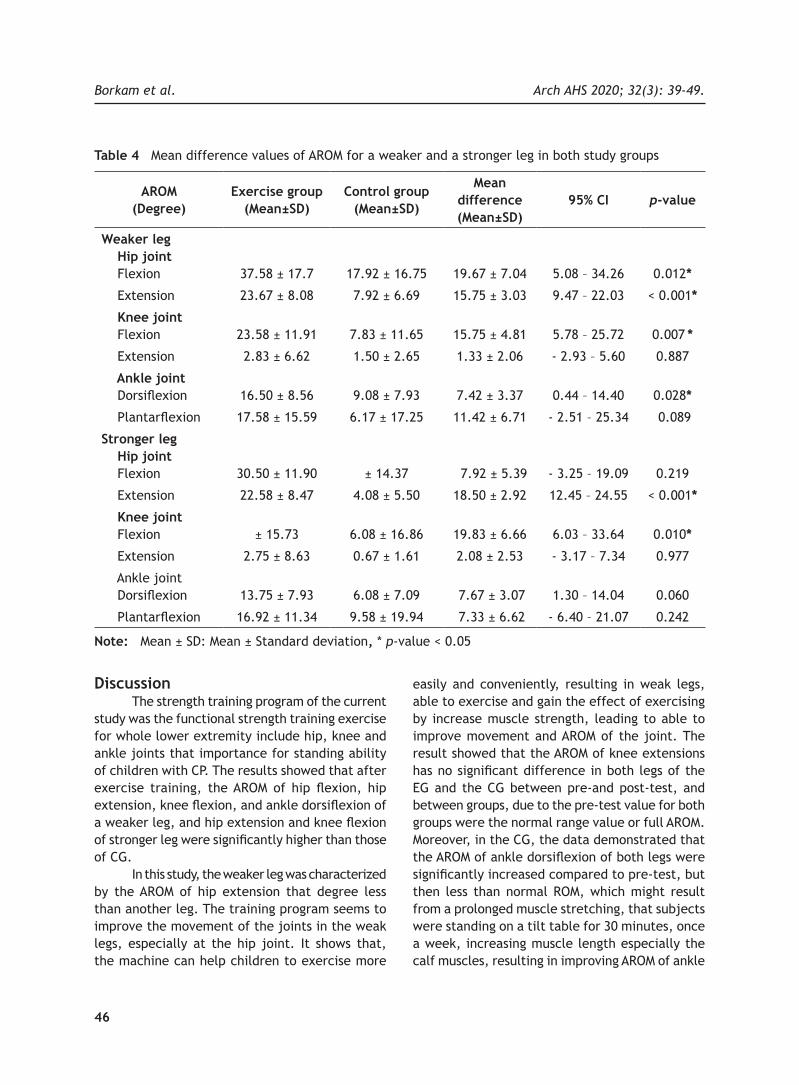
Arch AHS 2020; 32(3): 39-49.Borkam et al.
46
Table 4 Mean difference values of AROM for a weaker and a stronger leg in both study groups
AROM(Degree)
Exercise group (Mean±SD)
Control group (Mean±SD)
Mean difference(Mean±SD)
95% CI p-value
Weaker leg Hip joint Flexion 37.58 ± 17.7 17.92 ± 16.75 19.67 ± 7.04 5.08 – 34.26 0.012*
Extension 23.67 ± 8.08 7.92 ± 6.69 15.75 ± 3.03 9.47 – 22.03 < 0.001*
Knee joint Flexion 23.58 ± 11.91 7.83 ± 11.65 15.75 ± 4.81 5.78 – 25.72 0.007 *
Extension 2.83 ± 6.62 1.50 ± 2.65 1.33 ± 2.06 - 2.93 – 5.60 0.887
Ankle joint Dorsiflexion 16.50 ± 8.56 9.08 ± 7.93 7.42 ± 3.37 0.44 – 14.40 0.028*
Plantarflexion 17.58 ± 15.59 6.17 ± 17.25 11.42 ± 6.71 - 2.51 – 25.34 0.089
Stronger leg Hip joint Flexion
30.50 ± 11.90 ± 14.37 7.92 ± 5.39 - 3.25 – 19.09
0.219
Extension 22.58 ± 8.47 4.08 ± 5.50 18.50 ± 2.92 12.45 – 24.55 < 0.001*
Knee joint Flexion ± 15.73 6.08 ± 16.86 19.83 ± 6.66 6.03 – 33.64 0.010*
Extension 2.75 ± 8.63 0.67 ± 1.61 2.08 ± 2.53 - 3.17 – 7.34 0.977
Ankle joint Dorsiflexion 13.75 ± 7.93 6.08 ± 7.09 7.67 ± 3.07 1.30 – 14.04 0.060
Plantarflexion 16.92 ± 11.34 9.58 ± 19.94 7.33 ± 6.62 - 6.40 – 21.07 0.242
Note: Mean ± SD: Mean ± Standard deviation, * p-value < 0.05
Discussion The strength training program of the current study was the functional strength training exercise for whole lower extremity include hip, knee and ankle joints that importance for standing ability of children with CP. The results showed that after exercise training, the AROM of hip flexion, hip extension, knee flexion, and ankle dorsiflexion of a weaker leg, and hip extension and knee flexion of stronger leg were significantly higher than those of CG. In this study, the weaker leg was characterized by the AROM of hip extension that degree less than another leg. The training program seems to improve the movement of the joints in the weak legs, especially at the hip joint. It shows that, the machine can help children to exercise more
easily and conveniently, resulting in weak legs, able to exercise and gain the effect of exercising by increase muscle strength, leading to able to improve movement and AROM of the joint. The result showed that the AROM of knee extensions has no significant difference in both legs of the EG and the CG between pre-and post-test, and between groups, due to the pre-test value for both groups were the normal range value or full AROM. Moreover, in the CG, the data demonstrated that the AROM of ankle dorsiflexion of both legs were significantly increased compared to pre-test, but then less than normal ROM, which might result from a prolonged muscle stretching, that subjects were standing on a tilt table for 30 minutes, once a week, increasing muscle length especially the calf muscles, resulting in improving AROM of ankle

Lower limb strength training on ROM in spastic CPArch AHS 2020; 32(3): 39-49.
47
dorsiflexion. For the EC, it was found that both AROM of ankle dorsiflexion and plantarflexion were significantly increased compared to pre-test and were within the normal range(19). However, the result shown that only ankle dorsiflexion was significant differences as compared to the control group. This may be due to the effect of stretching the calf muscles and the exercise. Previous study suggested the starting position at outer range of lower extremity like the optimal joint range of motion and sarcomere, the maximum number of crossbridges can form and shown maximum force of muscle(20), which is consistent with the exercise program in this study, the participants began in standing with hip and knee flexed at least 90º and then extended hip and knee maximally, and returned to starting position. In this exercise position was shown highly effective improve strength of hip extensors, hip flexors, knee flexors and ankle dorsiflexors as found the significant difference of AROM of the EG when compared with CG. Even though the AROM of the hip flexion and ankle dorsiflexion were found the significant different in weaker leg, it might be possible that the pre-test value of the weaker leg was lower than the strong leg, causing the differences after exercise to be more different, and it was indicated that this intervention can help restore muscle function, especially in muscles with severe weakness. These results were consistent with Park et al. which suggest that functional training using the sliding rehabilitation machine may have some effect on the mobility of ankle joint and balance in children with CP and reported that the ROM of the ankle dorsiflexion was significantly increased to the normal range after the functional training using the sliding rehabilitation machine and there were significant differences between the pre- and post-test in the pediatric balance scale (PBS) and GMFM(17). It was indicated that ROM of lower extremities of children with spastic CP correlates with alignment in the upright position and walking(21-23). The improvements in AROM of lower extremity could be explained by the effects of strength training program on muscle strength. Subsequently, an increase in muscle strength and optimize tone
might leads to an increase in functional mobility of lower extremity(11,20,21) and lead to an improve in the AROM of joints with abnormalities. Active exercise in form of dynamic stretching might be another explanation for these discrepancies. Previous study reported that stretching muscles may prevent contractures and promote muscle growth(24,25). Slow and continuous stretching which lasts for 30 minutes to 2 hours could decrease spasticity(26). It may be possible that prolonged stretching can improve muscle length and joint mobility of lower extremity, such as the results found in the CG. This study’s strengths included a lower extremity strength training program that safe and easily deployed for whole muscles group of lower extremity. It would be useful for physical therapists, professional health care, teachers as well as parents to promote range of motion for children with CP. Limitations of this study was the progressive program provide by take the sand weight bag on a vest, which may be inaccurate and requires many materials.
Conclusion A lower extremity strength training program by using a sliding rehabilitation machine was effective to improve the AROM of the lower extremity and useful for promoting AROM of the lower extremity in children with spastic CP. Further studies are needed to study the relationship between the AROM of lower extremity and gross motor abilities of lower extremity after receiving strength training program.
Take home messages Research findings indicate that a lower extremity strength training program using a sliding rehabilitation machine was effective to improve and promote active range of motion (AROM) of lower extremity in spastic CP. Results showed that AROM of the lower extremity in the exercise group improved significantly as compared with control group (p-value < 0.05).

Arch AHS 2020; 32(3): 39-49.Borkam et al.
48
Conflicts of interest The authors declare no conflict of interest.
Acknowledgements The authors wish to thank the Research Center in Back, Neck, Other Joint Pain and Human Performance (BNOJPH), Khon Kaen University, Thailand for their financial support. We also thank all participants who were students of Sri Sangvalya Khon Kaen School, Khon Kaen Province, Thailand who participated in this study.
References 1. Dodd KJ, Taylor NF, Damiano DL. A systematic review of the effectiveness of strength-training programs for people with cerebral palsy. Arch Phys Med Rehabil 2002; 83(8): 1157-64.2. Bax M, Goldstein M, Rosenbaum P, Levition A, Paneth N, Dan B, et al. Proposed definition and classification of cerebral palsy. Dev Med Child Neurol 2005; 47(8): 571-6.3. Nordmark E, Hagglund G, Pedersen HL, Wagner P, Westbom L. Development of lower limb range of motion from early childhood to adolescence in cerebral palsy: a population-based study. BMC Medicine 2009; 65(7): 1-11.4. Thompson N, Stebbins J, Seniorou M, Newham D. Muscle strength and walking ability in diplegic cerebral palsy: implications for assessment and management. Gait & Posture 2011; 33(3): 321-5.5. Gates PE, Banks D, Johnston TE, Campbell SR, Gaughan JP, Ross SA, et al. Randomized controlled trial assessing participation and quality of life in a supported speed treadmill training exercise program vs. a strengthening program for children with cerebral palsy. J Pediatr Rehabil Med 2012; 5(2): 75-88.6. Kim JH, Seo HJ. Effects of trunk-hip strengthening on standing in children with spastic diplegia: a comparative pilot study. J Phys Ther Sci 2015; 27(5): 1337-40.7. Scholtes VA, Becher JG, Comuth A, Dekkers H, Dijk LV, Dallmeijer AJ. Effectiveness of functional progressive resistance exercise strength training on muscle strength and mobility in children with cerebral palsy: a randomized controlled trial. Dev Med Child Neurol 2010; 52(6): e107-13.
8. Ross SA, Engsberg JR. Relationships between spasticity, strength, gait, and the GMFM-66 in persons with spastic diplegia cerebral palsy. Arch Phys Med Rehabil 2007; 88(9): 1114-20.9. Anttila H, Autti-Ramo I, Suoranta J, Makela M, Malmivaara A. Effectiveness of physical therapy interventions for children with cerebral palsy: a systemayic review. BMC Pediatr 2008; 8(14): 1-10.10. Liao HF, Liu YC, Liu WY, Lin YT. Effectiveness of loaded sit-to-stand resistance exercise for children with mild spastic diplegia: a randomized clinical trial. Arch Phys Med Rehabil 2007; 88(1): 25-31.11. Scholtes VA, Dallmeijer AJ, Rameckers EA, Verschuren O, Tempelaars E, Hensen M, et al. Lower limb strength training in children with cerebral palsy – a randomized controlled trial protocol for functional strength training based on progressive resistance exercise principles. BMC Pediatr 2008; 41(8): 1-11.12. Eek MN, Tranberg R, Zugner R, Alkema K, Beckung E. Muscle strength training to improve gait function in children with cerebral palsy. Dev Med Child Neurol 2008; 50(10): 759-64.13. Morton JF, Brownlee M, McFadyen AK. The effects of progressive resistance training for children with cerebral palsy. Clin Rehabil 2005; 19(2): 283-9.14. Jung JW, Her JG, Ko J. Effect of strength training of ankle plantarflexors on selective voluntary motor control, gait parameters, and gross motor function of children with cerebral palsy. J Phys Ther Sci 2013; 25(10): 1259-63.15. Eagleton M, Iams A, McDowell J, Morrison R, Evans CL. The effects of strength training on gait in adolescents with cerebral palsy. Pediatr Phys Ther 2004; 16(1): 22-30.16. Lee Y, Kim W, Park J. The effect of exercise using a sliding rehabilitation machine on the gait function of children with cerebral palsy. J Phys Ther Sci 2014; 26(11): 1667–9.17. Park J W, Kim W B. The effect of functional training using a sliding rehabilitation machine on the mobility of the ankle joint and balance in children with CP. J Korean Soc Phys 2014; 9(3): 293-9.

Lower limb strength training on ROM in spastic CPArch AHS 2020; 32(3): 39-49.
49
18. Mutlu A, Livanelioglu A, Gunel MK. Reliability of goniometric measurements in children with spastic cerebral palsy. Med Sci Monit 2007; 13(7): CR323-9.19. Soucie JM, Wang C, Forsyth A, Funk S, Senny M, Roach KE, Boone D. Range of motion measurements: reference values and a database for comparison studies. Haemophilia 2011; 17: 500–7. 20, Chankavee N, Thaweewannakij T, Amatachaya S, Mato L. Starting positions and range of motion to produce maximal force of lower limb muscles: data from healthy individuals. J Med Tech Phy Ther 2017; 29(3): 252-64.21. Elshafey MA, Abd-Elaziem A, Gouda RE. Functional stretching exercise submitted for spastic diplegic children: a randomized control study. Rehabil Res Pract 2014: 1-7.22. Joseph B, Reddy K, Varghese RA, Shah H, Doddabasappa SN. Management of severe crouch gait in children and adolescents with cerebral palsy. J Pediatr Orthop 2010; 30(8): 832-9.
23. Zhou J, Butler E, Rose J. Neurologic Correlates of Gait Abnormalities in Cerebral Palsy: Implications for Treatment. 11: 1-20. 24. Rassafiani M, Sahaf R. Hypertonicity in children with cerebral palsy: a new perspective. Iran Rehabil J 2011; 9: 66-74.25. Cusick A, McIntyre S, Novak I, Lannin N, Lowe K. A comparison of goal attainment scaling and the canadian occupational performance measure for paediatric rehabilitation research. J Pediatr Rehabi 2009: 149-57.26. Dalvand H, Dehghan L, Feizi A, Hosseini SA, Amirsalari S. The impacts of hinged and solid ankle-foot orthoses on standing and walking in children with spastic diplegia. Iran J Child Neurol 2013; 7(4): 12-9.

ORIGINAL ARTICLEArch AHS
50
Archives of Allied Health Sciences 2020; 32(3): 50-57.
ABSTRACT
Fibrinogen is one of the inflammatory markers and plays a crucial role in pathophysiological process of cardiovascular diseases (CVD). High levels of fibrinogen are associated with atherosclerosis progression and CVD complication in type 2 diabetes mellitus (DM). Furthermore, fibrinogen genetic polymorphisms are one of the important factors affecting their levels. Therefore, this study aimed to evaluate the associations of FGA -58G/A polymorphism with clinical manifestations of coronary artery disease (CAD) in type 2 DM. A case-control study included 123 documented DM patients presenting with either acute coronary syndrome (ACS) or stable CAD and 86 control individuals without DM and presenting none or less than 50 % stenosis of coronary artery. All subjects were genotyped for the FGA -58G/A polymorphism using polymerase chain reaction-restriction fragment length polymorphism technique. The results showed that AA genotype and A allele of the FGA -58G/A polymorphism were independently associated with DM [adjusted OR (95 %CI) = 3.3 (1.2, 8.9) and 3.3 (1.6, 6.6), respectively]. Moreover, the AA genotype and A allele were also significantly associated with ACS in diabetic patients [adjusted OR (95 %CI) = 3.9 (1.3, 11.7) and 2.0 (1.2, 3.5), respectively], while the association with stable CAD was not observed. In conclusion, the results of this study may indicate the association of the FGA -58G/A polymorphism with the atherosclerotic progression which may in turn leads to the severe clinical manifestation of CAD in DM.
* Corresponding author: Nantarat Komanasin, MT, PhD. School of Medical Technology, Faculty of Associated Medical Sciences, Khon Kaen, Thailand. E-mail: [email protected]: 26 July 2019/ Revised: 18 August 2019/ Accepted: 20 March 2020
KEYWORDS
Fibrinogen; Polymorphism; Diabetes mellitus; Acute coronary syndrome.
Association of alpha fibrinogen -58G/A genetic polymorphisms with acute coronary syndrome in type 2 diabetes mellitus
Chananikan Makmool1,2, Nantarat Komanasin2,3*, Burabha Pussadhamma2,4, Wit Lueangwattananon5
1 Biomedical Sciences Program, Graduate School, Khon Kaen University, Khon Kaen, Thailand. 2 Cardiovascular Research Group, Khon Kaen University, Khon Kaen, Thailand.3 School of Medical Technology, Faculty of Associated Medical Sciences, Khon Kaen University, Khon Kaen, Thailand.4 Department of Medicine, Faculty of Medicine, Khon Kaen University, Khon Kaen, Thailand. 5 Queen Sirikit Heart Center of the Northeast, Khon Kaen University, Khon Kaen, Thailand.

Polymorphism of FGA -58G/A in ACS patientsArch AHS 2020; 32(3): 50-57.
51
Introduction Diabetes mellitus (DM) is a major risk factor for coronary artery disease (CAD). It has been known that cardiovascular disease (CVD) is the most important complication of type 2 diabetic patients. A number of studies showed that the diabetic patients had a 2 - 4 fold increased risk of developing CAD. Moreover, the incidence of severe clinical CVD complication in DM is higher than those in non-DM(1). However, there is no selective agent responsible for the atherosclerotic process in diabetic patients due to its several influences. Assessment of some biomarkers and conventional risk factors has been ineffective in completely predicting the development of the atherosclerotic process suggesting that specific genetic factor should be taken into account. Recently, many studies have suggested that endothelial dysfunction occurs in response to cardiovascular risk factors resulting in the development of atherosclerosis(2). One of the most important causes of endothelial dysfunction is inflammation. Inflammation is implicated in the pathogenesis of type 2 diabetes and in the development of atherosclerotic plaque and their destabilization(3,4). Inflammatory processes involve altering of endothelial and smooth muscle cells, leukocytes recruitment, as well as complement activation(5). Fibrinogen is one of acute phase reactant proteins which is elevated in response to inflammatory conditions. It plays a crucial role in the early stages of plaque formation and late complications of CVD(6). In addition, fibrinogen strongly affects hemostasis, blood rheology, and platelet aggregation. Increased levels of fibrin-ogen have been reported to be associated with enhancing atherosclerosis, reducing blood flow, and predisposing to thrombosis(7). Some reports demonstrated that the elevated plasma fibrino-gen concentration is not only responsible for CVD but also is increased in other cardiovascular risk factors such as metabolic syndrome, hyperten-sion, obesity and diabetes mellitus(8, 9). Thus, high plasma fibrinogen levels could contribute to the excess cardiovascular morbidity and mortality in these conditions.
A p rev ious s tudy sugges ted that approximately 50 % of the total variability in fibrinogen levels is determined by the genes encoding the three fibrinogen chains: alpha, beta, and gamma (FGA, FGB, and FGG genes, respectively(10). FGA -58G/A (rs2070011) is a single nucleotide polymorphism (SNP) in a promoter of the FGA gene which has been reported to affect the levels of fibrinogen and associate with DM(11). However, there is no study investigating the possible relationship of the polymorphism with DM and the progression of atherosclerotic plaque in coronary artery of the patients with macrovascular complication. Therefore, we decided to investigate whether the FGA -58G/A polymorphism influence the progression of CAD complication in type 2 DM.
Materials and methods Study subjects A total of 207 participants who attended to the Cardiac Catheterization Unit, Queen Sirikit Heart Center of the Northeast Hospital, Khon Kaen University, were recruited in this study. Patients with cancer, autoimmune disease, infectious diseases, renal failure, and immune-compromised individuals were excluded. Type 2 DM was diagnosed according to the criteria of the World Health Organization(12). According to the coronary angiographic results, the DM patients (n = 123) presented with either acute coronary syndrome (ACS) (n = 56) or stable CAD (n = 67) which was defined as more than 50% stenosis in at least one of the three main coronary vessels. ACS was defined as unstable angina, non-ST-elevation myocardial infarction (NSTEMI) or ST-elevation myocardial infarction (STEMI)corresponding to European Society of Cardiology (ESC), American College of Cardiology Foundation (ACCF) and American Heart Association (AHA)(13). The individuals without DM and presenting none or less than 50% stenosis of the coronary artery were classified as a control group (n = 84). Other clinical variables including age, sex, CAD risk factors, and use of medicines were obtained from medical records. Individuals presenting at least one of the following parameters including total cholesterol (TC) ≥ 240 mg/dL, triglyceride ≥ 200 mg/dL, high density

Arch AHS 2020; 32(3): 50-57.Makmool et al.
52
lipoprotein-cholesterol (HDL - C) < 40 mg/dL, and low density lipoprotein-cholesterol (LDL - C) ≥ 160 mg/dL or use of lipid - lowering drugs were diagnosed as dyslipidemia(14). Individuals who had blood pressure ≥ 140/90 mmHg and/or used anti-hypertensive drugs were defined as hypertension(15). Participants with body mass index (BMI) ≥ 25 kg/m2 were classified as obesity(16). Metabolic syndrome was considered if any three of the five risk factors were present: (i) waist circumference ≥ 90 cm in male and ≥ 80 cm in female, (ii) TG ≥ 150 mg/dL or on lipid - lowering drug treatment, (iii) HDL - C < 40 mg/dL in male and < 50 mg/dL in female, (iv) blood pressure ≥ 130/85 mmHg or use of anti-hypertensive medications, and (v) fasting blood glucose (FBG) ≥ 100 mg/dL or use of glucose-lowering drugs(17). The study protocol was approved by the Khon Kaen University Ethics Committee for Human Research (HE621240) and consent forms were obtained from all participants.
Genotyping Genomic DNA was extracted from peripheral white blood cells using a Flexi Gene DNA extraction kit (QIAGEN, Hilden, Germany). Genotyping of FGA -58G/A polymorphism was determined by polymerase chain reaction- restriction fragment length polymorphism (PCR - RFLP). The genomic DNA was amplified by PCR using specific primers including forward primer (5’GAG GGT TGA CTG TCT ACA CA 3’) and reverse primer (5’CAG GCC TGG GGT CAT AAA 3’). The optimal condition for the PCR reaction was an annealing temperature of 58 °C. The PCR product was further digested with 2 units of AciI restriction enzyme (New England Biolabs Inc., MA, USA). Each genotype of the polymorphism was interpreted with different sizes of amplicons as follows: GG homozygote demonstrated 236 and 83 base pair (bp) bands; GA heterozygote demonstrated 318, 236 and 83 bp bands; and AA homozygote demonstrated 318 bp band.
Statistical analysis Statistical analysis was performed using SPSS software version 17.0 (SPSS Inc, IL, USA). Distributions of genotype and allele frequencies, categorical variables and the Hardy-Weinberg equilibrium were determined using a Chi-square test. Kolmogorov-Smirnov test was used to assess whether the data is normal distribution. Continuous variables were expressed as means ± standard deviations (SDs) and categorical variables were reported as number and percentages. Continuous variables without normal distribution were reported as a geometric means ± SDs. Logistic regression analysis was performed to evaluate the association between the FGA -58G/A polymorphism with DM and severity of CAD complication in DM patients. Statistical significance was defined as a p-value less than 0.05.
Results Clinical and demographic characteristics of the study individuals are shown in Table 1. Individuals in DM group presented higher proportions of hypertension, metabolic syndrome, as well as levels of FBG and LDL-C as compared to controls. No significant differences between both groups were observed for SBP, DBP, BMI, TC, TG, and HDL-C. The allele and genotype frequencies of the FGA -58G/A polymorphism in DM patients and controls are presented in Table 2. The SNP was in agreement with Hardy–Weinberg equilibrium in each group. The significant differences were observed in genotype (p-value = 0.022) and allele (p-value = 0.015) frequencies between DM patients and controls. To evaluate the association of genetic variations with DM, multivariate logistic regression analysis was performed. The results demonstrated that presences of AA genotype and A allele of the FGA -58G/A polymorphism were independently associated with DM after adjustment for sex, age, hypertension, and metabolic syndrome (Table 2).

Polymorphism of FGA -58G/A in ACS patientsArch AHS 2020; 32(3): 50-57.
53
Table 1 Demographic data of the study subjects
VariablesControls(n=84)
DM(n=123)
p-value
Age (years)* 59.6±8.8 61.5±9.0 0.136
Gender
Male, n (%) 38 (45.2) 69 (56.1) 0.125
Female, n (%) 46 (54.8) 54 (43.9)
DS, n (%) 69 (82.1) 108 (87.8) 0.256
HT, n (%) 59 (70.2) 101 (82.1) 0.045
MET, n (%) 38 (45.2) 113 (91.9) <0.001
Obesity, n (%) 42 (50.0) 57 (46.3) 0.605
SBP (mmHg) 127.9 ± 18.1 135.3 ± 22.0 0.399
DBP (mmHg) 73.1 ± 9.5 74.7 ± 11.3 0.115
BMI (kg/m2) 25.3 ± 3.7 24.8 ± 3.6 0.316
FBG (mg/dL)* 92.5 ± 12.3 155.2 ± 66.2 0.002
TC (mg/dL)* 166.0 ± 41.9 173.7 ± 50.2 0.537
TG (mg/dL)* 133.5 ± 82.8 154.2 ± 113.6 0.071
LDL-C (mg/dL)* 87.4 ± 35.4 103.4 ± 41.4 0.010
HDL-C (mg/dL)* 43.5 ± 14.3 38.7 ± 10.4 0.244
Note: Independent sample t-test and Chi-square test were used to compare continuous values and categorical variables between both groups, respectively. Category data are expressed as n (%), continuous data are expressed as mean ± SD. * Values are presented as geometric means ± SD. DM, diabetes mellitus; DS, dyslipidemia; HT, hypertension; MET, metabolic syndrome; SBP, systolic blood pressure; DBS, diastolic blood pressure; BMI, body mass index; FBG, fasting blood glucose; TG, triglyceride; TC, total cholesterol; LDL-C, low-density lipoprotein cholesterol; HDL-C, high-density lipoprotein cholesterol

Arch AHS 2020; 32(3): 50-57.Makmool et al.
54
Table 2 Genotype distributions of the FGA -58G/A polymorphism in study subjects and its association with DM
Genotype/ allele
Frequency, n (%)p-value
OR (95% CI)p-valueControls
(n=84)DM
(n=123)Crude OR p-value Adjusted OR*
GG 26(31.0)
29 (23.6)
0.022 1.0 - 1.0 -
GA 45(53.6)
54 (43.9)
1.1 (0.6,2.1)
0.8281.3 (0.6,2.9)
0.573
AA 13(15.5)
40 (32.5)
2.8 (1.2,6.3)
0.0153.3 (1.2,8.9)
0.021
G allele 97(57.7)
112 (45.5)
0.015 1.0 - 1.0 -
A allele 71(42.3)
134 (54.5)
2.8 (1.5,4.9)
0.0013.3 (1.6,6.6)
0.001
Note: Chi-square test was used to compare the frequencies of genotypes between DM and control groups. *Conditional logistic regression model adjustment for sex, age, hypertension and metabolic syndrome. DM, Diabetes mellitus; OR, Odds ratio; CI=Confidence interval
To assess the influence of the FGA -58G/A polymorphism on the severity of CAD compli-cation, DM individuals were divided into two subgroups including DM with stable-CAD and with ACS. Significant differences were found in the frequencies of AA genotype (p-value = 0.003) and A allele (p-value = 0.004) in DM with ACS when compared to controls. However, the significant differences were not found in patients with
stable-CAD when compared to controls (Table 3). Multivariate logistic regression analysis was performed to investigate the relationship between the FGA -58G/A polymorphism and ACS in diabetic individuals (Table 4). The results demonstrated that after adjustment for sex, age, hypertension, and metabolic syndrome, the AA genotype and A allele were significantly associated with an increased risk of ACS.
Table 3 Genotype distributions of the FGA -58G/A polymorphism in DM with CAD according to clinical manifestation
Genotype/allele
(1)Controls(n=84)
Frequency, n (%)p-value
DM with CAD manifestation
(2)stable CAD
(n=67)
(3)ACS
(n=56)
(2) vs. (1)
(3) vs. (1)
GGGAAAG alleleA allele
26 (31.0)45 (53.6)13 (15.5)97 (57.7)71 (42.3)
17 (25.4)33 (49.3)17 (25.4)67 (50.0)67 (50.0)
12 (21.4)21 (37.5)23 (41.1)45 (40.2)67 (59.8)
0.304
0.180
0.003
0.004
Note: Chi-square test was performed for comparison of the frequencies of each genotype among the study groups. DM, Diabetes mellitus; CAD, Coronary artery disease; ACS, Acute coronary syndrome

Polymorphism of FGA -58G/A in ACS patientsArch AHS 2020; 32(3): 50-57.
55
Table 4 Association of the FGA -58G/A polymorphism with ACS in DM
Genotype/alleleOR (95% CI)
Crude OR p-value Adjusted OR* p-valueGG 1.0 - 1.0 -
GA 1.0 (0.4, 2.4) 0.980 1.0 (0.4, 2.8) 1.000
AA 3.8 (1.5, 10.1) 0.006 3.9 (1.3, 11.7) 0.014
G allele 1.0 - 1.0 -
A allele 2.0 (1.3, 3.3) 0.004 2.0 (1.2, 3.5) 0.014
Note: *Conditional logistic regression model adjustment for sex, age, hypertension and metabolic syndrome. DM, diabetes mellitus; ACS, acute coronary syndrome; OR, Odds ratio; CI, Confidence interval
Discussion Fibrinogen is a complex protein composed of three pairs of subunits (FGA, FGB, and FGG). In addition to its physiological role as a cofactor for platelet aggregation and a precursor of fibrin, fibrinogen is involved in many pathophysiological processes such as inflammation, atherosclerosis, and thrombosis(18). A previous study showed that fibrinogen is a potential biomarker for predic-tion of future risk of CVD(19). A high fibrinogen concentration has been reported to enhance the risk of CVD in diabetic individuals(20). In addition, several studies also have provided evidence for the relation between plasma fibrinogen levels and DM. Actually, the elevated level of fibrinogen was observed in type 2 DM patients, and predicted the progression of CVD in diabetes. Several poly-morphisms inducing overproduction of the three fibrinogen subunits might influence the high levels of plasma fibrinogen, which in turn develop type 2 DM and CAD. Therefore, the genetic variations in these genes may define susceptibility to the disease. A previous study demonstrated that the nucleotide base substitutions of the FGA -58G/A polymorphism in the 5’ UTR (promoter) of the FGA gene can modulate the FGA gene expression through accelerating the mRNA transcription, which may affect increasing mRNA levels and resulting in the high level of fibrinogen(21). This study demonstrated the association of the FGA -58G/A polymorphism with the plaque progression leading to ACS in type 2 diabetic pa-tients. To the best of our knowledge, this study is the first report of the effect of the FGA -58G/A
polymorphism on the severity of CAD complication in diabetes. We have observed that AA genotype and minor A allele of the FGA -58G/A polymorphism was associated with an increased risk of DM in this population. This result supported the previous study reported by Hwang et al.(11) which suggested that major G allele of this polymorphism had a protective effect on DM. Our study also found that diabetic individuals carrying the minor A allele of the polymorphism were independently associated with ACS. These results suggested that the FGA -58G/A polymorphism may affect the occurrence and severe progression of atherosclerosis in type 2 DM. However, the mechanism that links genetic variations of the FGA -58G/A polymorphism to risk of DM and severe CAD complication in diabetic individuals remains unclear. To date, genome-wide association studies (GWAS) have identified a large number of robust associations between genetic variations and type 2 DM. Ban HJ and colleagues(22) found that the FGA -58G/A polymorphism combined with the rs9658173 of peroxisome proliferator-activated receptor PPAR-δ (PPARD) gene was associated with contributing risk of type 2 DM, through elevating the levels of FBG(23). Moreover, the polymorphism was significantly related to the increased plasma levels of TG and TC(11). Therefore, this polymorphism may have a possible role in the developing of DM via modulating plasma concentrations of lipids and glucose. Mannila et al.(24) demonstrated that the FGA -58G/A polymorphism appeared to influence the relation between plasma fibrinogen concentration

Arch AHS 2020; 32(3): 50-57.Makmool et al.
56
and fibrin clot porosity. They found that the presence of homozygous for the A allele leads to increase fibrinogen concentration and decrease fibrin clot porosity. In addition, prior study has shown that FGA -58G/A polymorphism was in a strong linkage disequilibrium with FGA Thr312Ala polymorphism (rs6050) (11). As Thr312Ala polymorphism influences clot stability through increasing factor XIII cross-linking(25) leading to thicker fibrin fibers which resist to lysis(26). This might be an evidence to explain a possible effect of the FGA -58G/A polymorphism on an increased ACS risk in patients with DM. However, it should be noted that the sample size was not large enough and this might have reduced the statistical power of tests. Thus, further investigation with a larger sample size is needed to elucidate the effect of FGA -58G/A polymorphism on ACS in type 2 DM.
Conclusion The present study has demonstrated the association of the FGA -58G/A polymorphism with ACS in type 2 DM. This relationship suggested the importance of genetic variations of the FGA -58G/A which may eventually be used as the ACS risk assessment in diabetic individuals.
Take home messages • A allele of the FGA -58G/A polymorphism
were independently associated with DM. • FGA -58G/A polymorphism was associated
with ACS in type 2 DM.• The genetic variations of the FGA -58G/A
may eventually be used as the ACS risk assessment in diabetic individuals.
Conflicts of interest The authors declare no conflict of interest.
Acknowledgements The authors would be appreciating to Cardiovascular Research Group (CVRG) and Research Fund for Supporting Lecturer to Admit High Potential Student to Study and Research
on His Expert Program of Graduate School and Faculty of Associated Medical Sciences, Khon Kaen University.
References1. Kannel WB, McGee DL. Diabetes and cardiovascular risk factors: the Framingham study. Circulation 1979; 59: 8-13.2. Hadi HAR, Carr CS, Al Suwaidi J. Endothelial dysfunction: cardiovascular risk factors, therapy, and outcome. Vasc Health Risk Manag 2005; 1: 183-98.3. Madjid M, Willerson JT. Inflammatory markers in coronary heart disease. Br Med Bull 2011; 100: 23-38.4. Sjoholm A, Nystrom T. Inflammation and the etiology of type 2 diabetes. Diabetes-Metab Res 2006; 22: 4-10.5. Ross R. Atherosclerosis--an inflammatory disease. N Engl J Med 1999; 340: 115-26.6. Bruno G, Cavallo-Perin P, Bargero G, Borra M, D’Errico N, Pagano G. Association of fibrinogen with glycemic control and albumin excretion rate in patients with non-insulin-dependent diabetes mellitus. Ann Intern Med 1996; 125: 653-7.7. Kattula S, Byrnes JR, Wolberg AS. Fibrinogen and fibrin in hemostasis and thrombosis. Arterioscler Thromb Vasc Biol 2017; 37: e13-21.8. Mahendra JV, Kumar SD, Anuradha TS, Talikoti P, Nagaraj RS, Vishali V. Plasma fibrinogen in type 2 diabetic patients with metabolic syndrome and its relation with ischemic heart disease (IHD) and retinopathy. J Clin Diagn Res 2015; 9: BC18-21.9. Shankar A, Wang JJ, Rochtchina E, Mitchell P. Positive association between plasma fibrinogen level and incident hypertension among men: population-based cohort study. Hypertension 2006; 48: 1043-9.10. Jacquemin B, Antoniades C, Nyberg F, Plana E, Muller M, Greven S, et al. Common genetic polymorphisms and haplotypes of fibrinogen alpha, beta, and gamma chains affect fibrinogen levels and the response to proinflammatory stimulation in myocardial infarction survivors: the AIRGENE study. J Am Coll Cardiol 2008; 52: 941-52.

Polymorphism of FGA -58G/A in ACS patientsArch AHS 2020; 32(3): 50-57.
57
11. Hwang J-Y, Ryu M-H, Go M, Oh B, Shin Cho Y. Association between single nucleotide polymorphisms of the fibrinogen alpha chain (FGA) gene and type 2 diabetes mellitus in the korean population. Genomics Inform 2009; 7: 57-64.12. World Health Organization. Definition and diagnosis of diabetes mellitus and intermediate hyperglycemia: Report of a WHO/IDF consultation. Geneva: WHO; 2006.13. Thygesen K, Alpert JS, Jaffe AS, Chaitman BR, Bax JJ, Morrow DA, et al. Fourth universal definition of myocardial infarction. Circulation 2018; 138: e618–51.14. National Cholesterol Education P. ATP III guidelines at-a-glance quick desk reference: [Bethesda, Md.] : [National Institutes of Health, National Heart, Lung, and Blood Institute], [2001]; 2001.15. Whitworth JA. 2003 World Health Organization (WHO)/International Society of Hypertension ( ISH) statement on management of hypertension. J Hypertens 2003; 21: 1983-92.16. World Health Organization. Refining Obesity and its Treatment. The Asia-Pacific Perspective. Sydney: Health Communications Australia; 2000.17. Alberti KG, Eckel RH, Grundy SM, Zimmet PZ, Cleeman JI, Donato KA, et al. Harmonizing the metabolic syndrome: a joint interim statement of the international diabetes federation task force on epidemiology and prevention; national heart, lung, and blood institute; american heart association; world heart federation; international atherosclerosis society; and international association for the study of obesity. Circulation 2009; 120: 1640-5.18. Kamath S, Lip GYH. Fibrinogen: biochemistry, epidemiology and determinants. QJM-INT J MED 2003; 96: 711-29.
19. Wang J, Tan G-J, Han L-N, Bai Y-Y, He M, Liu H-B. Novel biomarkers for cardiovascular risk prediction. J Geriatr Cardiol 2017; 14: 135-50.20. Bembde AS. A study of plasma fibrinogen level in type-2 diabetes mellitus and its relation to glycemic control. Indian J Hematol Blood Transfus 2012; 28: 105-8.21. Smith EB, Thompson WD, Crosbie L, Stirk CM. Fibrinogen/fibrin in atherogenesis. Eur J Epidemiol 1992; 8: 83-7.22. Ban HJ, Heo JY, Oh KS, Park KJ. Identification of type 2 diabetes-associated combination of SNPs using support vector machine. BMC Genet 2010; 11: 26-7.23. Shin HD, Park BL, Kim LH, Jung HS, Cho YM, Moon MK, et al. Genetic polymorphisms in peroxisome proliferator-activated receptor delta associated with obesity. Diabetes 2004; 53: 847-51.24. Mannila MN, Eriksson P, Ericsson CG, Hamsten A, Silveira A. Epistatic and pleiotropic effects of polymorphisms in the fibrinogen and coagulation factor XIII genes on plasma fibrinogen concentration, fibrin gel structure and risk of myocardial infarction. Thromb Haemost 2006; 95: 420-7.25 Standeven KF, Grant PJ, Carter AM, Scheiner T, Weisel JW, Ariens RA. Functional analysis of the fibrinogen Aalpha Thr312Ala polymorphism: effects on fibrin structure and function. Circulation 2003; 107: 2326-30.26 Li J-F, Lin Y, Yang Y-H, Gan H-L, Liang Y, Liu J, et al. Fibrinogen Aα Thr312Ala polymorphism spec ifica l ly contr ibutes to chron ic thromboembolic pulmonary hypertension by increasing fibrin resistance. PLoS One 2013; 8: e69635-36.

ORIGINAL ARTICLEArch AHS
58
Archives of Allied Health Sciences 2020; 32(3): 58-67.
ABSTRACT
Cervical radiculopathy is a common disorder of the nerve root and is a pathologic process, which has been defined as pain in the distribution of a specific cervical nerve root. Mechanical cervical traction is one of the physical therapy interventions that has been proposed in the management of cervical radiculopathy. An important element that affects the efficiency of the cervical traction is using force or weight, which can be set as appropriate. Many studies have presented the effectiveness of intermittent cervical traction, but rarely mentioned about the efficiency or the reasonable force being used. Therefore, this study aimed to compare the therapeutic effect between constant force and gradual increased force of intermittent cervical traction on pain and the self-evaluated disability of cervical radiculopathy patients. Sixty-four cervical radiculopathy patients were randomly screened; eleven did not comply with the inclusion criteria and withdrew. The remaining 53 patients were divided into two groups. Group I (n=24) received constant force, and Group II (n=29) received gradual increased force of intermittent cervical traction. All patients were treated with superficial heat, a neck retraction exercise program to consistently practice at home every day, together with instructions on the correct neck posture and principles of ergonomics in activities of daily living. For Group II, the gradual increased force was required to be recorded and the increase of the force was discontinued in the event of pain or other forms of discomfort. Each patient reported responsiveness within a period of seven visits. The results of the first and last visits were collected with a visual analog scale (VAS) and the neck disability index (NDI). The findings showed that both groups experienced a significant (p-value < 0.01) improvement of pain (VAS) and disability (NDI). A comparison of the improvement, or the reduction of pre and post-treatment between both groups, found that Group II experienced a greater reduction than Group I for both evaluations with a significant difference (p-value < 0.01). This included the results of the gradual increased force (Group II) that found 48.27% of the patients had to discontinue at the fourth visit with the force 15.18 ± 0.98% of the total body weight (TBW). The mean duration of the physical therapy of Group I was 6.46 ± 1.06 visits and Group II was 5.66 ± 1.49 visits. It could be concluded that using gradual increased force of intermittent cervical traction displayed significant effective results for the treatment of pain and self-evaluated disability in a short period of time. This should be applied along with neck retraction exercises and postural education.
* Corresponding author: Krittika Thepsoda, PT, MSc. Department of Physical Therapy, Nan Hospital, Thailand. E-mail: [email protected]: 27 April 2020/ Revised: 13 May 2020/ Accepted: 23 November 2020
KEYWORDS
Cervical traction; Cervical radiculopathy; Traction force; Traction weight; Cervical nerve root compression.
Comparison of the effects of constant force and gradual increased force of intermittent cervical traction in cervical radiculopathy
Krittika Thepsoda1*
1Department of Physical Therapy, Nan Hospital, Thailand.

Comparison of the effects of constant force and gradual increased forceArch AHS 2020; 32(3): 58-67.
59
Introduction Cervical radiculopathy is a common disorder in patients with neck pain. The symptoms are pain, paresthesia or numbness, weakness, or a combination of these signs and symptoms of the upper extremity. Common causes of these symptoms are associated with cervical disc herniation or the degenerative change or reduction in disc height, which can result in the foraminal compression of the spinal nerve(1-3). The management strategies of cervical radiculopathy range from conservative approaches to surgery(4). Frequently, the intervention of physical therapy used for cervical radiculopathy includes cervical traction, postural education, therapeutic exercises and manual therapy(3). Spinal traction including cervical or lumbar traction can distract joint surfaces, reduce the protrusion of nuclear discal material, stretch soft tissue, relax muscles, and mobilize joints(2). This study focused on cervical electrical mechanical traction that was used with other interventions in the Physical Therapy Unit of Nan Hospital, Mueang District, Nan Province, Thailand. Cervical mechanical traction is available in intermittent traction, as well as continuous or static traction. The effectiveness has been shown in several studies(6). These studies have revealed moderate evidence of the benefits for intermittent traction(3) and moderate evidence of no benefits for continuous traction(6,7). Intermittent traction has been effective in relieving pain, increasing the frequency of myoelectric signals, improving the blood flow in affected muscles, and improving the imbibition signs of disc nutrition through distraction and compression. Moreover, it has been used to reduce radicular symptoms by decreasing the foraminal compression and intradiscal pressures(25). Higher forces were poorly tolerated with constant traction, and the need of greater forces to obtain the outcome of surface resistance was best used with intermittent traction. Therefore, intermittent traction therapy is a method in which the traction force and time are changed to make the therapy more effective. Gentle alternation of stretching and relaxation of the spinal column’s soft tissue structures would prevent the formation of adhesions of the dural
sleeve. In addition, intermittent traction produces would be applied twice as much as the separation for sustained traction. If the separation of the vertebral bodies is desired, high traction forces applied for short periods of time would achieve that goal(1). Intermittent traction was therefore used in this study. A considerable part of the method was using the appropriate force or application of the weight. When the goal was to decrease the compression on a spinal nerve root or facet joint, sufficient force must be used to separate the facets of the joints in the area being treated. The force of traction could be adjusted during the treatment as recommended for improved results(2). Many studies have presented the effectiveness of intermittent cervical traction, not only by using constant force, but also gradually increasing the force. However, the benefits of this method were not clearly presented, and they rarely mentioned about the efficiency or reasonable amount of force being used(8-10). Consequently, how to determine the level of the traction force to obtain the most effective or beneficial treatment for the patient was not known. Angela et al. concluded that the addition of intermittent cervical traction with TENS and exercise was even more effective in the management of cervical radiculopathy. The traction force was 10% of the patient’s body weight, but the increment was adjusted according to the patient’s tolerance. The frequency of the treatment received by the patients was five days per week for four weeks. However, their study did not mention about the amount of the force of traction used(9). In cervical radiculopathy, 9-13 kg (20-30 lbs.), or approximately 7% of the patient’s body weight is generally sufficient to achieve the appropriate outcome(2). Nevertheless, increasing more traction force may produce improved results. MRI scans were used to assess the effect of traction on the neural foramen between the second and seventh cervical vertebrae in the supine position with a neutral cervical spine posture. The study found that increasing the traction force by 5 kg, 10 kg, and 15 kg resulted in the elongation of the width of the foramen by averaging 3.75%, 8.67% and 10.43% respectively,

Arch AHS 2020; 32(3): 58-67.Thepsoda et al.
60
but did not find any significant difference between 10 kg and 15 kg(11). Ten percent of the total body weight (TBW) of continuous cervical traction significantly reduced the intensity of the pain in cervical radiculopathy patients who had three sessions per week for four weeks(12). Hoseinpour et al. revealed that three weeks of physiotherapy, including intermittent cervical traction with 7% of the body weight, was more effective than acupuncture and strengthening exercises in cervical disc disease patients(13). Additionally, Jellad et al. assessed the effect of intermittent cervical traction and discussed that manual traction below 6 kg gave similar results to mechanical traction up to 12 kg(14). Bukhari et al also reported cervical mechanical traction with force that was equal to 10-15% of the body weight was more effective than manual traction(15). Furthermore, Akinbo et al. investigated the effect of three different cervical traction weights, which were 7.5%, 10%, and 15%, respectively of the TBW. It was established that 10% of the TBW was the ideal weight with minimal side effects and had the highest therapeutic efficacy(16). All those studies provided various recommendations about the traction force, and some studies took a longer period of time to provide treatment. Moreover, it should be noted that treatment that takes too long or has a high number of visits infers a low efficiency. In addition to making the treatment more difficult, this would also increase the cost. A more appropriate way of treatment would still
be required. In the opinion of the author, when skeletal soft tissues are forced mechanically by traction, the stress-strain curve should probably be considered(1,17). Constant or changing force may be applied to tissue with consequent changes in deformation: the main regions of the stress-strain curve are the toe, elastics region, and from the yield point to the failure point, which is called the plastics region(18). For the purpose of effective treatment, the force of traction should be considered in order for enough stress to be used to enter the plastics region, which patients would improve faster and prevent recurrent symptoms without failure or any adverse reaction. The purpose of this study was to compare the therapeutic effect of constant force and gradual increased force of intermittent cervical traction on pain and self-evaluated disability of cervical radiculopathy patients.
Materials and methods A randomized prospective study of cervical radiculopathy patients was conducted at the Physical Therapy Unit in Nan Hospital. All patients gave their informed consent to participate in this study, and this study was approved by the Ethics Committee of Nan Hospital (COA No.011). The patients with unilateral upper extremity pain, paresthesia, or numbness, with or without neck pain, were screened by a physical therapist. Patients who met the criteria were included in the study (Table 1).
Table 1 Inclusion and exclusion criteria
Inclusion criteria Exclusion criteria▪ Aged 30-70 years▪ Male and female▪ Unilateral upper extremity pain, paresthesia, or numbness▪ Three of four tests of clinical examination:(3-5)
- Spurling’s Test - Distraction Test - Upper Limb Tension Test - Passive Accessory Central Vertebral Pressure Test
▪ History of previous cervical or thoracic spine surgery▪ Bilateral upper extremity symptoms▪ Signs or symptoms of upper motor neuron disease▪ Medical “red flags” (e.g. tumor, fracture, rheumatoid, arthritis, and osteoporosis)▪ Psychological problems▪ Communication problems

Comparison of the effects of constant force and gradual increased forceArch AHS 2020; 32(3): 58-67.
61
Randomized patients were screened for participa-tion (n=64), and six were excluded or refused to participate for a variety of reasons (Figure 1). Fif-ty-eight patients were assigned to one of the two groups alternately. Group I (n=28) received the constant force of intermittent cervical traction in a supine position, superficial heat, and therapeutic exercises, and Group II (n=30) received gradual
increased force of intermittent cervical traction in the same position, superficial heat, and thera-peutic exercises. Five subjects withdrew because they moved to another location, and it would be inconvenient for them to travel, which resulted in Group I having 24 participants and Group II having 29. A flow chart of the patients’ recruitment and retention is presented in Figure 1.
Figure 1 Flow chart of the patients’ recruitment and retention

Arch AHS 2020; 32(3): 58-67.Thepsoda et al.
62
The intervention of both groups had different traction methods while other treatments were the same (Figure 1). In Group II, the intermittent traction force was started at about 10% of the patient’s TBW(13), and increased by one kilogram each visit, depending on if the symptoms were the same or reduced, and stopped when the subject experienced increased pain or other forms of discomfort. The maximum force used was not more than 20% of the patient’s body weight(13). Each group was blind about the traction force. Mechanical traction was performed in the supine position(19) with the neck at 20-30 degrees(2) of flexion. In the beginning, the force for both groups was calculated as 10%(16) of the body weight and rounded down to an integer number if it was < 0.5 kg and rounded up if it was ≥ 0.5 kg. In Group II, the force was gradually increased based on the patient’s requirement and symptom response. If the symptoms improved or were unchanged, the force of traction would be increased. When the patient experienced more pain, or did not want to increase the force due to other forms of discomfort, the force would be maintained in this visit which would be considered to be increased in the next visit. All patients received the same instruction program with the documents about the correct neck posture and principles of ergonomics in activities of daily living together with the descriptions of recommended neck retraction exercises (10 times/set and three sets/three hours). Superficial heat was used primarily to control pain, and increase the soft tissue extensibility and circulation for about 20 minutes before cervical traction(2). All remedies were conducted daily (five visits per week), and the patients reported a daily response within a period of seven visits. In each patient’s final visit, they were evaluated to continue or discontinue the program of treatment according to their symptoms and requirements. The visual analog scale (VAS) was applied to capture the patient’s pain in every visit. VAS is a horizontal line, 100 mm in length, anchored
by word descriptions at each end ranging from “no pain” to “very severe pain”. Patients were asked to indicate the intensity of pain using marks on the line at the point that they felt, which represented their current pain. The VAS score was determined by measuring in millimeters from the left-hand end of the line to the point that the patient marked(2,20,21). The neck disability index (NDI), self-report measures, was used in the first and last visits. NDI was collected at the baseline that contained 10 items with seven related to activities of daily living, two related to pain, and one related to concentration. Each item was scored from zero to five, and the total score was expressed as a percentage with the higher scores corresponding to greater disability. The maximum score was therefore 50. It should also be noted that the Thai version of the NDI is a valid and reliable measurement method of evaluating neck pain disability(22).
Statistical analysis All statistical analyses were performed with statistical software. The independent t-test and chi-square test were used for comparing the two study groups, and the dependent t-test was used for comparing the pretreatment and post-treatment of the VAS and NDI of both groups.
Results Fifty-three patients comprising 33 males and 20 females underwent analysis. They were screened into two groups, which Group I was the constant force and Group II was the gradual increased force. The mean age of both groups was 52.83 ± 7.34 years and 54.31 ± 10.31 years, the body mass index (BMI) was 23.53 ± 2.93 kg/m2
and 22.53 ± 1.79 kg/m2, and the duration of the symptoms was 10.83 ± 19.48 weeks and 4.97 ± 5.42 weeks, respectively. There were no differences between the groups in terms of age, BMI, duration of symptoms, and gender (Table 2).

Comparison of the effects of constant force and gradual increased forceArch AHS 2020; 32(3): 58-67.
63
Table 2 Comparisons of the baseline data in the study population
Characteristics
Group IConstant Force
(n = 24)
Group IIGradual Increased Force
(n = 29) p-value
Mean ± SD Min – Max Mean ± SD Min – MaxAge (years) 52.83 ± 7.34 37 – 67 54.31 ± 10.31 36 – 76 0.559BMI (kg/m2) 23.53 ± 2.93 18.22 – 28.28 22.53 ± 1.79 19.72 – 27.39 0.157Duration of symptoms (weeks) 10.83 ± 19.48 1 – 96 4.97 ± 5.42 1 – 24 0.164Gender: Male/Female 16 / 8 17 / 12 0.582
The firs t g roup had a s ign ificant (p-value < 0.01) improvement of both pain (VAS) and disability (NDI) after the treatment from a VAS value of 56.33 ± 17.51 to 32.08 ± 19.10 mm, and NDI value of 17.42 ± 6.60 to 13.13 ± 5.85. Furthermore, the second group had a significant (p-value < 0.01) improvement of pain and disability from a VAS value of 53.14 ± 19.50 to 9.79 ± 8.83 mm, and NDI value of 16.14 ± 5.67 to 5.59 ± 3.76. Comparing the improvement or the reduction of
the pre and post-treatment between both groups, the study found that Group II had a greater reduction of the VAS and NDI than Group I with a significant difference (p-value < 0.01), whereas the reduction of the VAS and NDI in Group I was 24.25 ± 13.91 and 4.29 ± 4.89 and Group II was 43.34 ± 19.22 and 10.55 ± 5.08, respectively. Within the period of seven scheduled visits, the mean of Group I was 6.46 ±1.06 visits and Group II was 5.66 ± 1.49 visits (Table 3).
Table 3 Comparison of the VAS and NDI in the pre and post-treatment of the same group, and the reduction between both groups
VariableGroup I : Constant Force
(Mean = 6.46 ± 1.06 visits)Group II : Gradual Increased Force
(Mean = 5.66 ± 1.49 visits)
Both Groups Comparison of Reduction
n Treatment Mean ± SD p-value n Treatment Mean ± SD p-value p-value
VAS 24PrePost
56.33 ± 17.5132.08 ± 19.10
< 0.01 29PrePost
53.14 ± 19.509.79 ± 8.83
< 0.01 < 0.01
Reduction 24.25 ± 13.91 Reduction 43.34 ± 19.22
NDI 24
PrePost
17.42 ± 6.6013.13 ± 5.85
< 0.01 29PrePost
16.14 ± 5.675.59 ± 3.76
< 0.01 < 0.01
Reduction 4.29 ± 4.89 Reduction 10.55 ± 5.08
In Group II, when the force was gradually increased and stopped by the patients when required, it was recorded in every visit. From the records, the patients requested to discontinue their force in days 2-5 in which the number of patients was one (3.45%), seven (24.14%), 14 (48.27%) and seven (24.14%), respectively. The
mean of the maximum force used in visits 2-5 was 9.00 ± 0.00 kg, 8.14 ± 0.38 kg, 8.86 ± 0.36 kg, and 9.71 ± 0.95 kg, respectively. This was converted to a percentage of TBW, which was 11.69 ± 0.00%, 14.07 ± 0.64%, 15.18 ± 0.98% and 16.65 ± 0.84%, respectively ordered by day (Table 4).

Arch AHS 2020; 32(3): 58-67.Thepsoda et al.
64
Table 4 Day of the request to discontinue increasing the force (Group II): number, body weight, maximum force of traction and % force of TBW on the date of treatment
Day of the Request to Discontinue Increasing the Force (Group II)
Day of Treatment 1st 2nd 3rd 4th 5th 6th 7th
Number(n=29)
Number - 1 7 14 7 - -
Percentage - 3.45% 24.14% 48.27% 24.14% - -
Total Body Weight (TBW)(Mean ± SD)
- 77 ± 0.00 58.00 ± 4.00 58.57 ± 4.54 58.57 ± 7.28 - -
Maximum Force
Kg(Mean ± SD)
- 9.00 ± 0.00 8.14 ± 0.38 8.86 ± 0.36 9.71 ± 0.95 - -
% of TBW(Mean ± SD)
- 11.69 ± 0.00 14.07 ± 0.64 15.18 ± 0.98 16.65 ± 0.84 - -
Discussion This randomized study investigated the effects of the traction force. The results indicated significant differences (p-value < 0.01) of the VAS and NDI between the pretreatment and post-treatment in the same group. The gradual increased force (Group II) showed more significance (p-value < 0.01) of the VAS and NDI than the constant force (Group I) within a period of seven visits. The average number of Group I was 6.46 ± 1.06 visits, and Group II was 5.66 ± 1.49 visits. This method created awareness of how to set the force in mechanical cervical traction for the effective treatment of cervical radiculopathy patients. The biomechanical effect of the traction on the cervical spine from C2 to C7 was an elon-gation of 1.39 mm, and reduction disc protrusion and increase in medullar canal surface area of 11.21 mm(2,23). An MRI probe showed significant reduction of the disc protrusion in 72% of the cases with a load of 13.6 kg (30 lbs.)(24). The study of Hafez and Zakaria(25) found that intermittent traction was more effective than sustained traction in the treatment of cervical spondylosis patients using three sessions per week for 12 weeks with no mention about the force. Fritz et al.(10) found that the addition of mechanical traction to exercise with cervical radiculopathy for four weeks resulted in decreased disability and pain although there was no mention about the force. Several researchers had reported favorable results. The conclusion of the intermittent
traction study was an effective modality for patients with mild and moderate cervical osteoarthritis. One study had subjects performing three sessions a week for 10 weeks with a force of approximately 10% of the body weight, and the force was increased by one kilogram every three sessions. The maximum force used in the study was 13 kg(26). Furthermore, the addition of intermittent cervical traction, that used a traction force of 10% of the patient’s body weight and was adjusted incrementally according to the patient’s tolerance together with TENS and exercise, was more effective in the management of cervical radiculopathy at five days per week for four weeks(9). While this study showed a gradual increase of one kilogram of force for each time along with daily treatment and a suitable home program, it only took a short period of treatment with an average of 5.66 ± 1.49 visits. Moreover, it could make a significant difference of the evaluation of the VAS and NDI that reduced or improved in the same group, as well as when this was compared between the two groups. Regarding the request to discontinue the increase in force, this ascertainment showed that the most appropriate force (48.27% of the number of Group II) in the fourth time was 15.18 + 0.98% of the TBW (Table 4). This force not only improved the symptoms of the patients, but also did not cause any adverse reaction or discomfort, which most patients were satisfied. As for too much traction force at 20% of the body weight or more, this caused more subtle perturbation in

Comparison of the effects of constant force and gradual increased forceArch AHS 2020; 32(3): 58-67.
65
the autonomic system and was accompanied by a higher incidence of discomfort(27). In the author’s opinion, the stress-strain curve(18) could probably explain the result of discontinuing the increasing force in that at the beginning of the traction, the tension of skeletal soft tissue was in the toe region. In that region, the relationship between the stress and strain was non-linear, and the slope increased with the increased loading. The reason for the increasing slope was the straightening of the wavy-like collagen fibrils. After the collagen fibrils were completely straightened, the elastic region began. In the elastic ranges, all changes of tissue were still reversible. When the force of traction was further increased from the elastic region, the slope of the curve changed, and the plastics region began. In the plastic region, when the traction force was sufficient, irreversible changes occurred in the tissue, and it did not return to the original strain. Although once the force was completely removed, the patients consistently improved, but after the plastic region, sudden failure of the tissue occurred and stress disappeared. The point of the breakdown is called the failure point, which is a warning sign of the traction. Increasing force was discontinued when it was found that the patient had more pain or another form of discomfort. If the force at the beginning was 10% of the TBW, it caused minimal side effects(16), likewise gradual increased force with precautions was beneficial. A series case study in 11 patients with cervical radiculopathy found that 91% improved when they were treated with a standardized approach, including manual physical therapy, cervical traction, and strengthening exercises. The mechanical traction in this series was started at 8.2 kg (18 lbs.), and was increased to a maximum of 0.5-0.9 kg (1-2 lbs.) per session and was adjusted to optimally produce centralization or reduction of the patient’s symptoms, following a mean of 7.1 physical therapy visits. The study, however, did not show the maximum force used on the patient(28). In the present study, neck retraction exercises were an elemental part in establishing the effectiveness of these results because the
exercises promoted cervical root decompression, as well as reduced radicular pain(29). Neck resting posture following neck retraction could reduce the mechanical forces on the intervertebral disc resulting in a decompression effect and pain reduction(30,31). However, there were no studies using traction without adjuvant therapy, so further study should be conducted to compare the retraction exercises with and without traction. The correct neck posture and principles of ergonomics in activities of daily living were also instructed to the patients. Because living tissue had a biological memory, then the tissue was changed by external force and restored to its origin. Although the traction force was not stretched to the plastic region because of the side effects, it would be possible that retraction exercises and correct neck posture may be effective to improve the nature of the tissue changes. Apart from that, the duration of the symptoms of the subjects was about five to 11 weeks on average. The overall improvement might be because the subjects had experienced their symptoms less than three months before starting the treatment, so additional studies of a longer duration of symptoms should be conducted to confirm these results. Additionally, the age range and gender of the subjects in this study were wide, so further research must divide this into the respective sessions. The force of the cervical traction is an important aspect for effective treatment in cervical radiculopathy. Based on the response to the treatment in this study, using gradual increased force was a significant proposal, as there were substantial effective results for the treatment of pain and self-evaluated disability in a short period of time, which should be applied together with neck retraction exercises and postural education. Clinicians could consider these methods in managing neck disorders requiring traction. Furthermore, in a larger sample population, patients with a prolonged duration of symptoms, long-term tracking, and division of the age range and/or gender should be implemented to approve the effectiveness.

Arch AHS 2020; 32(3): 58-67.Thepsoda et al.
66
Conclusion It could be concluded that using a gradual increased force of intermittent cervical traction showed significant effective results for the treatment of pain and self-evaluated disability in a short period of time. This should be applied together with neck retraction exercises and postural education.
Take home messages Cervical traction is an effective treatment
for cervical radiculopathy disorder but the appropriate force should be carefully considered, in conjunction with therapeutic exercises and posture correction for each individual.
Conflicts of interest The authors declare no conflict of interest.
Acknowledgements The researcher thanks for support and contribution from the Physical Therapy Department and Orthopedics Department, Nan hospital, Thailand.
References1. Donatelli R, Wooden M. Orthopaedic physical therapy, 4th ed. In: Stratton SA, Bryan JM. Dysfunction, evaluation, and treatment of the cervical spine and thoracic inlet. New York: Churchill Livingstone; 2010: 127-60.2. Cameron M. Physical agents in rehabilitation, f rom research to pract ice. 4 th ed. Philadelphia: Saunders; 2013.3. Childs JD, Cleland JA, Elliott JM, Teyhen DS, Wainner RS, Whitman JM, et al. Neck pain: Clinical practice guidelines link to the international classification of functioning, disability, health from the orthopedics section of the American physical therapy association. J Orthop Sports Phys Ther 2008; 38(9): A1-34.4. Magee D. Orthopeadic physical assessment. 4th ed. Philadelphia: Saunders; 2006.
5. Thepsoda K. Posteroanterior central vertebral pressure test for detection of nerve root compression within spine in radicular pain patients. Thai J Phys Ther 2011; 33(2): 89-98.6. Graham N, Gross AR, Goldsmith C. Mechanical traction for mechanical neck disorders: a systemic review. J Rehabil Med 2006; 38: 145-52. 7. Moffett JA, Hughes GI. An investigation of the effects of cervical traction. part I :clinical effectiveness. Clin Rehabil 1990; 4: 205-11.8. Cleland JA, Fritz JM, Whitman JM, Heath R. Predictors of short-term outcome in people with a clinical diagnosis of cervical radiculopathy. Phys Ther 2007; 87(12): 1619-32.9. Angela Tao NG, Arora R, Arora L. Effective of cervical traction on pain and disability in cervical radiculopathy. IJRSR 2015; 6: 3609-11.10. Fritz JM, Thackeray A, Brennan GP, Childs JD. Exercise only, exercise with mechanical traction, or exercise with over-door traction for patients with cervical radiculopathy, with or without consideration of status on a previously described subgrouping rule: a randomized clinical trial. J Orthop Sports Phys Ther 2014; 44(2): 45-57.11. Lui J, Ebraheim NA, Sanford CG, Patil V, Elsamalory H, Treuhafi K, et al. Quantitative changes in the cervical neural foramen resulting from axial traction: in vivo imaging study. Spine J 2008; 8: 619-23.12. Ojoawo AO, Olabode A, Esan O, Badru A, Odejide S, Arilewola B. Therapeutic efficacy of cervical traction in the management of cervical radiculopathy. Rwanda J Health Sci 2013; 2(2): 25-9.13. Hoseinpour S, Amanollahi A, Sobhani V, Mohseni A, Arazi E. Comparison of neck and shoulder strengthening exercises with weight, traction plus physiotherapy, and acupuncture in the treatment of patients with chronic cervical disk herniation. IJSRK 2015; 3(4): 114-20.

Comparison of the effects of constant force and gradual increased forceArch AHS 2020; 32(3): 58-67.
67
14. Jellad A, Salah ZB, Boudokhane S, Migaou H, Bahri I, Rejeb N. The value of intermittent cervical traction in resent cervical radiculopathy. Ann Phys Rehabil Med 2009; 53: 638-52.15. Bukhari SRI, Shakil-ur-Rehamn S, Ahmad S, Naeem A. Comparison between effectiveness of mechanical and manual traction combined with mobilization and exercise therapy in patients with cervical radiculopathy. Pak J Mef Sci 2016; 32(1): 31-4.16. Akinbo SR, Noronha CC, Okanlawon AO, Danesi MA. Effects of different cervical traction weight on neck pain and mobility. Niger Postgrad Med J 2006; 13(3): 230-35.17. Donatelli R, Wooden M. Orthopaedic physical therapy, 4th ed. In: Moore H, Nichols C, Engles ML. Tissue response. New York: Churchill Livingstone; 2010: 1-26.18. Korhonen RK, Saarakkala S. Biomechanics and modeling of skeletal soft tissues, Theoretical Biomechanics. [Internet]. 2011: 113-31.Available from: http://www. intechopen. com/books/theoretical- b i omechan i c s / b i omechan i c s - and - modeling-of-skeletal-soft-tissues19. Akinbo SR, Danesi MA, Oke DA, Aiyejusunle CB, Adeyomote AA. Comparison of supine and sitting positions cervical traction on cardiovascular parameter, pain and neck mobility in patients with cervical spondylosis. The internet J Rheumatology 2013; 8(1): 1-9.20. Wewers ME, Lowe NK. A critical review of visual analogue scales in the measurement of clinical phenomena. Res Nurs Health 1990; 13: 227-36.21. Hawker GA, Mian S, Kendzerska T, French M. Measures of Adult Pain. AC&R 2011; 63: S240-52.22. Luksanapruksa P, Wathana-apis i t T, Wanasinthop S, Sanpakit S, Chavasiri C. Reliability and validity study of thai version of the neck disability index in patients with neck pain. J Med Assoc Thai 2012; 95(5): 681-88.
23. Sari H, Akarimak U, Karacan I, Akman H. Evalution of effects of cervical traction on sp ina l s t ructures by computer i zed tomography. Adv Physiother 2003; 5: 114-21.24. Chung TS, LeeYJ, Kang SW, Shim YW. Reducibility of cervical disk herniation: evaluation at MR imaging during cervical traction with a nonmagnetic traction device. Radiology 2002; 225: 895-900.25. Hafez AR, Zakaria AR. Intermittent versus sustained cervical traction in treatment of cervical spondylosis. Bull Fac Ph Cairo Univ 2009: 14(2): 123-30.26. Akbari M, Bayat M. Effects of intermittent traction in patients with cervical osteoarthritis. MJIRI 2010; 24(1): 23-8.27. Pan PJ, Tsai PH, Tsai CC, Chou CL, Lo MT, Chiu JHC. Clinical response and automatics modulation as seen in heart rate variability in mechanical intermittent cervical traction. J Rehabil Med 2012; 44: 229-34.28. Cleland JA, Whitman JM, Fritz JM, Palmer JA. Manual physical therapy, cervical traction, and strengthening exercises in patients with cervical radiculopathy: a case series. J Orthop Sports Phys Ther 2005; 35(12): 802-11.29. Neeraj K, Shiv V. To compare the effect of strengthening neck exercise and Mckenzie neck exercise in neck pain subjects. Br J Med Health Res 2016; 3(10): 69-79.30. Rathore S, Use of McKenzie cervical protocol in the treatment of radicular neck pain in a mechine operator. JCCA 2003; 47(4): 291-97.31. Abdulwahab SS, Sabbahi M. Neck retractions, cervical root decompression, and radicular pain. J Orthop Sports Phys Ther 2000; 30(1): 4-12.