Development of Automotive Permanent Magnet Alternator with ...
Upload
independentCategory
view
3download
0
Earth and Planetary Science Letters 278 (2009) 297–307
Contents lists available at ScienceDirect
Earth and Planetary Science Letters
j ourna l homepage: www.e lsev ie r.com/ locate /eps l
Thallium isotope evidence for a permanent increase in marine organic carbon exportin the early Eocene
Sune G. Nielsen a,⁎, Sarah Mar-Gerrison a, Abdelmouhcine Gannoun a, Doug LaRowe b, Veronika Klemm c,Alex N. Halliday a, Kevin W. Burton a, James R. Hein d
a Department of Earth Sciences, University of Oxford, Parks Road, Oxford, OX1 3PR, UKb Utrecht University, Department of Earth Science, 3508 TA Utrecht, Netherlandsc ETH-Zurich, Department of Earth Science, 8092 Zurich, Switzerlandd US Geological Survey, 345 Middlefield Road, Menlo Park, CA 94025, USA
⁎ Corresponding author.E-mail address: [email protected] (S.G. Ni
0012-821X/$ – see front matter © 2008 Elsevier B.V. Aldoi:10.1016/j.epsl.2008.12.010
a b s t r a c t
a r t i c l e i n f oArticle history:
The first high resolution th Received 10 July 2008Received in revised form 22 October 2008Accepted 8 December 2008Available online 12 January 2009Editor: P. DeMenocal
Keywords:thallium isotopesFe–Mn crustsCenozoic climateorganic carbon burialearly Eocene
allium (Tl) isotope records in two ferromanganese crusts (Fe–Mn crusts), CD29and D11 from the Pacific Ocean are presented. The crusts record pronounced but systematic changes in 205Tl/203Tl that are unlikely to reflect diagenetic overprinting or changes in isotope fractionation between seawaterand Fe–Mn crusts. It appears more likely that the Fe–Mn crusts track the Tl isotope composition of seawaterover time. The present-day oceanic residence time of Tl is estimated to be about 20,000 yr, such that theisotopic composition should reflect ocean-wide events.New and published Os isotope data are used to construct age models for these crusts that are consistent witheach other and significantly different from previous age models. Application of these age models reveals thatthe Tl isotope composition of seawater changed systematically between ~55 Ma and ~45 Ma. Using a simplebox model it is shown that the present day Tl isotope composition of seawater depends almost exclusively onthe ratio between the two principal output fluxes of marine Tl. These fluxes are the rate of removal of Tl fromseawater via scavenging by authigenic Fe–Mn oxyhydroxide precipitation and the uptake rate of Tl during lowtemperature alteration of oceanic crust. It is highly unlikely that the latter has changed greatly. Therefore,assuming that the marine Tl budget has also not changed significantly during the Cenozoic, the low 205Tl/203Tlduring the Paleocene is best explained by a more than four-fold higher sequestration of Tl by Fe–Mnoxyhydroxides compared with at the present day.The calculated Cenozoic Tl isotopic seawater curve displays a striking similarity to that of S, providing evidencethat both systemsmayhave responded to the same change in themarine environment. A plausible explanationis a marked and permanent increase in organic carbon export from ~55 Ma to ~45 Ma, which led to higherpyrite burial rates and a significantly reduced flux of Fe–Mn oxide removal as a result of increased biologicaluptake of Fe and Mn.
© 2008 Elsevier B.V. All rights reserved.
1. Introduction
Hydrogenetic ferromanganese (Fe–Mn) crusts are chemical pre-cipitates from seawater that grow slowly in areas of little or no othersedimentation. Due to the slow growth rate, a thickness of 15 cm mayrepresent asmuch as 80million yr of seawater precipitationmaking Fe–Mn crusts a unique archive for monitoring changes in Cenozoic oceanchemistry. Previous studies have mainly investigated variations inradiogenic isotope tracers such as Nd, Hf, Os and Pb, which haveprovided important information about past weathering regimes andocean circulation (Burton et al., 1999; Christensen et al., 1997; Frank,2002; Frank et al., 1999; Klemm et al., 2005, 2007; Lee et al., 1999;Piotrowski et al., 2000; van de Flierdt et al., 2002). More recently, new
elsen).
l rights reserved.
unconventional stable isotope tracers such as molybdenum, iron andthallium(Chu et al., 2006; Levasseur et al., 2004; Rehkämper et al., 2004,2002; Siebert et al., 2003) have also been examined in attempts todevelop new proxies that may offer additional evidence regarding thecauses and effects of changes in Cenozoic ocean chemistry and climate.
One of the most difficult aspects of Fe–Mn crust studies is thedetermination of accurate and precise ages for sections older than~10 Ma. Younger sections can be dated by measuring cosmogenic 10Beabundances, whereas older sections conventionally have been dated bya combination of extrapolating growth rates inferred from 10Be in theupper sections (Segl et al.,1984) and assuming a constant fluxof Co intothe crust (Halbach et al., 1983). Both these methods, however, areunreliable because they cannot detect hiatuses in crust growth.Additionally, it is questionable whether the assumptions of constantgrowth rate and Co flux are valid, further hampering the use of thesemethods. Recently, Os isotope stratigraphy as a new means of age
298 S.G. Nielsen et al. / Earth and Planetary Science Letters 278 (2009) 297–307
determination in Fe–Mn crusts was developed (Burton, 2006; Klemmet al., 2005). This method is analogous to Sr isotope stratigraphy(Depaolo and Ingram, 1985; Jones and Jenkyns, 2001), where theisotopic composition of a sample is compared with an independentlydetermined seawater curve, yielding an age calibration for the sample.The Os isotope seawater curve is not very well defined through theentire Cenozoic, but it has enough distinctive features to produce asignificant advance in the reliability of Fe–Mn crust age determinations.
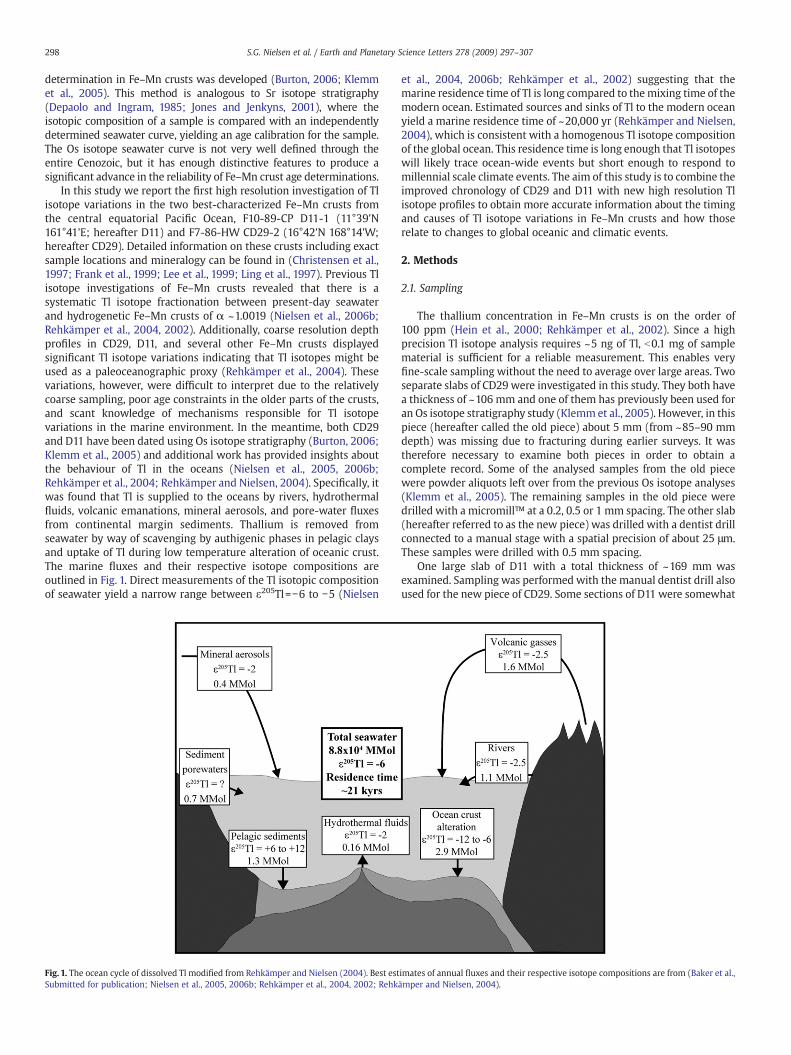
In this study we report the first high resolution investigation of Tlisotope variations in the two best-characterized Fe–Mn crusts fromthe central equatorial Pacific Ocean, F10-89-CP D11-1 (11°39'N161°41'E; hereafter D11) and F7-86-HW CD29-2 (16°42'N 168°14'W;hereafter CD29). Detailed information on these crusts including exactsample locations and mineralogy can be found in (Christensen et al.,1997; Frank et al., 1999; Lee et al., 1999; Ling et al., 1997). Previous Tlisotope investigations of Fe–Mn crusts revealed that there is asystematic Tl isotope fractionation between present-day seawaterand hydrogenetic Fe–Mn crusts of α ~1.0019 (Nielsen et al., 2006b;Rehkämper et al., 2004, 2002). Additionally, coarse resolution depthprofiles in CD29, D11, and several other Fe–Mn crusts displayedsignificant Tl isotope variations indicating that Tl isotopes might beused as a paleoceanographic proxy (Rehkämper et al., 2004). Thesevariations, however, were difficult to interpret due to the relativelycoarse sampling, poor age constraints in the older parts of the crusts,and scant knowledge of mechanisms responsible for Tl isotopevariations in the marine environment. In the meantime, both CD29and D11 have been dated using Os isotope stratigraphy (Burton, 2006;Klemm et al., 2005) and additional work has provided insights aboutthe behaviour of Tl in the oceans (Nielsen et al., 2005, 2006b;Rehkämper et al., 2004; Rehkämper and Nielsen, 2004). Specifically, itwas found that Tl is supplied to the oceans by rivers, hydrothermalfluids, volcanic emanations, mineral aerosols, and pore-water fluxesfrom continental margin sediments. Thallium is removed fromseawater by way of scavenging by authigenic phases in pelagic claysand uptake of Tl during low temperature alteration of oceanic crust.The marine fluxes and their respective isotope compositions areoutlined in Fig. 1. Direct measurements of the Tl isotopic compositionof seawater yield a narrow range between ε205Tl=−6 to −5 (Nielsen
Fig. 1. The ocean cycle of dissolved Tl modified from Rehkämper and Nielsen (2004). Best estSubmitted for publication; Nielsen et al., 2005, 2006b; Rehkämper et al., 2004, 2002; Rehk
et al., 2004, 2006b; Rehkämper et al., 2002) suggesting that themarine residence time of Tl is long compared to themixing time of themodern ocean. Estimated sources and sinks of Tl to the modern oceanyield a marine residence time of ~20,000 yr (Rehkämper and Nielsen,2004), which is consistent with a homogenous Tl isotope compositionof the global ocean. This residence time is long enough that Tl isotopeswill likely trace ocean-wide events but short enough to respond tomillennial scale climate events. The aim of this study is to combine theimproved chronology of CD29 and D11 with new high resolution Tlisotope profiles to obtain more accurate information about the timingand causes of Tl isotope variations in Fe–Mn crusts and how thoserelate to changes to global oceanic and climatic events.
2. Methods
2.1. Sampling
The thallium concentration in Fe–Mn crusts is on the order of100 ppm (Hein et al., 2000; Rehkämper et al., 2002). Since a highprecision Tl isotope analysis requires ~5 ng of Tl, b0.1 mg of samplematerial is sufficient for a reliable measurement. This enables veryfine-scale sampling without the need to average over large areas. Twoseparate slabs of CD29 were investigated in this study. They both havea thickness of ~106 mm and one of them has previously been used foran Os isotope stratigraphy study (Klemm et al., 2005). However, in thispiece (hereafter called the old piece) about 5 mm (from ~85–90 mmdepth) was missing due to fracturing during earlier surveys. It wastherefore necessary to examine both pieces in order to obtain acomplete record. Some of the analysed samples from the old piecewere powder aliquots left over from the previous Os isotope analyses(Klemm et al., 2005). The remaining samples in the old piece weredrilled with a micromill™ at a 0.2, 0.5 or 1 mm spacing. The other slab(hereafter referred to as the new piece) was drilled with a dentist drillconnected to a manual stage with a spatial precision of about 25 μm.These samples were drilled with 0.5 mm spacing.
One large slab of D11 with a total thickness of ~169 mm wasexamined. Sampling was performed with the manual dentist drill alsoused for the new piece of CD29. Some sections of D11 were somewhat
imates of annual fluxes and their respective isotope compositions are from (Baker et al.,ämper and Nielsen, 2004).
299S.G. Nielsen et al. / Earth and Planetary Science Letters 278 (2009) 297–307
brittle resulting in larger chunks being sampled and thereby averagingcertain depth intervals, at most 2 mm. For all drilling procedures thesample surfaces and drill bits were cleaned between each drilling withcompressed air to avoid cross contamination.
In addition to the small high resolution samples a minor set oflarger samples (~5 mg per sample) were taken in the D11 and CD29new piece slabs. These were sampled in sections suspected to containthe Cretaceous–Tertiary or Eocene–Oligocene boundaries that areboth marked by significant Os isotope excursions (Peucker-Ehren-brink and Ravizza, 2000; Ravizza and Peucker-Ehrenbrink, 2003).These samples were analysed for both Os and Tl isotope ratios in orderto obtain a more direct calibration between the Os isotope chronologyand Fe–Mn crust Tl isotope record.
2.2. Thallium separation and mass spectrometry
Sample powders (or in rare cases chunks) were transferred into7 ml savillex Teflon beakers and dissolved in 1–2 ml ~1 M HClovernight on a hotplate (~120 °C). Samples were then cooled and 50–100μl of MilliQ water saturated with Br2 was added to ensure that allTl was oxidised to Tl3+. Thallium was separated from sample matrixusing a single mini column (Nielsen et al., 2004; Rehkämper et al.,2002; Rehkämper and Halliday, 1999).
The Tl isotope compositions were determined at University ofOxford on a Nu Plasmamultiple collector inductively coupled plasma-mass spectrometer (MC-ICPMS). Previously described techniques thatutilize both external normalization to NIST SRM 981 Pb and standard-sample bracketing were applied for mass bias correction (Nielsenet al., 2004). Thallium isotope compositions are reported relative tothe NIST SRM 997 Tl standard in parts per 10,000 such that
ε205Tl = 10;000× 205Tl=203Tlsample−205Tl=203TlSRM 997
� �= 205Tl=203TlSRM 997
� �
ð1Þ
Under normal circumstances Tl concentrations can be estimatedfrom the Tl ion beam intensities encountered during the isotopemeasurements (Nielsen et al., 2007, 2006a; Rehkämper et al., 2002;Rehkämper and Halliday, 1999). However, due to the very smallsample sizes the uncertainties on the sample weights are so large thatno attempt was made to determine quantitative Tl concentrations.However, a qualitative comparison of the Tl recovered from the anionexchange chemistry with estimated sample weights indicates that allsamples have Tl abundances similar to those normally encountered inFe–Mn crusts.
Total procedural blanks throughout this study were b3 pg, which isinsignificant compared to the minimum amount processed for anindividual sample of ~5 ng.
2.3. Osmium isotope analyses
Samples were weighed in Teflon savillex beakers, spiked with amixed 185Re-190Os spike and dissolved in 1 M HCl on a hotplateovernight. After dissolution a small aliquot was taken for Tl isotopeanalysis. These aliquots were then processed as all other Tl samples.After drying, this step was followed by oxidation of Os using Br2–CrO3–HNO3. Osmium was then extracted into the liquid bromine(Birck et al., 1997). The supernatent left after Os extraction was usedfor Re chemistry following a solvent extraction technique (Birck et al.,1997). Osmiumwas analysed on high purity Pt filaments using the ioncounting electron multiplier on the Thermo-Finnigan TRITON®. Rewas measured on the Nu Plasma MC-ICPMS at the Oxford Universityusing Ir for mass fractionation correction (Klemm et al., 2005).
Four osmium blanks were run as part of this study. The 187Os/188Osof 0.306±0.032 and Os concentration of 0.019 pg for D11 samples(n=2) and the 187Os/188Os of 0.191±0.027 and Os concentration of
0.042 pg for CD29 samples (n=2). The blank correction was normallynot greater than 1.05% and 9% for D11 and CD29 samples, respectively.These corrections are minor compared with the overall Os isotopevariability in CD29 and D11, which is in excess of 400%. The mean187Os/188Os ratio for 1 pg JM standard yields 0.17412±0.00052 (n=8).
3. Results and discussion
3.1. Thallium isotope records
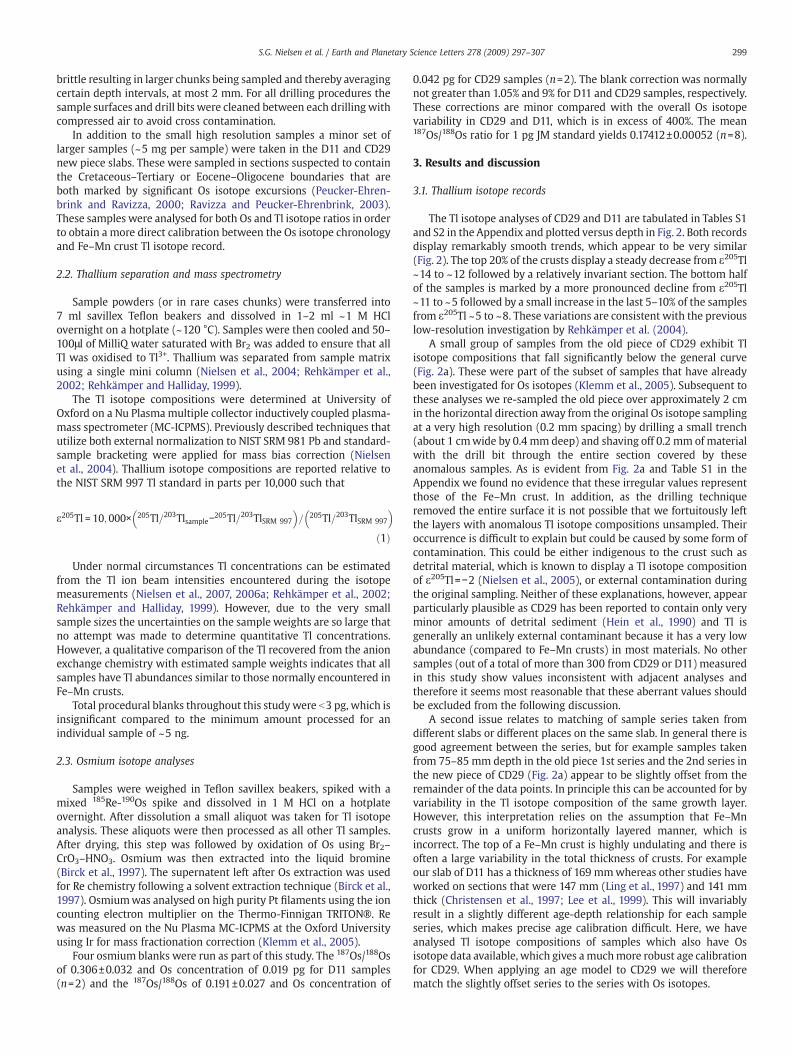
The Tl isotope analyses of CD29 and D11 are tabulated in Tables S1and S2 in the Appendix and plotted versus depth in Fig. 2. Both recordsdisplay remarkably smooth trends, which appear to be very similar(Fig. 2). The top 20% of the crusts display a steady decrease from ε205Tl~14 to ~12 followed by a relatively invariant section. The bottom halfof the samples is marked by a more pronounced decline from ε205Tl~11 to ~5 followed by a small increase in the last 5–10% of the samplesfrom ε205Tl ~5 to ~8. These variations are consistent with the previouslow-resolution investigation by Rehkämper et al. (2004).
A small group of samples from the old piece of CD29 exhibit Tlisotope compositions that fall significantly below the general curve(Fig. 2a). These were part of the subset of samples that have alreadybeen investigated for Os isotopes (Klemm et al., 2005). Subsequent tothese analyses we re-sampled the old piece over approximately 2 cmin the horizontal direction away from the original Os isotope samplingat a very high resolution (0.2 mm spacing) by drilling a small trench(about 1 cmwide by 0.4 mm deep) and shaving off 0.2 mm of materialwith the drill bit through the entire section covered by theseanomalous samples. As is evident from Fig. 2a and Table S1 in theAppendix we found no evidence that these irregular values representthose of the Fe–Mn crust. In addition, as the drilling techniqueremoved the entire surface it is not possible that we fortuitously leftthe layers with anomalous Tl isotope compositions unsampled. Theiroccurrence is difficult to explain but could be caused by some form ofcontamination. This could be either indigenous to the crust such asdetrital material, which is known to display a Tl isotope compositionof ε205Tl=−2 (Nielsen et al., 2005), or external contamination duringthe original sampling. Neither of these explanations, however, appearparticularly plausible as CD29 has been reported to contain only veryminor amounts of detrital sediment (Hein et al., 1990) and Tl isgenerally an unlikely external contaminant because it has a very lowabundance (compared to Fe–Mn crusts) in most materials. No othersamples (out of a total of more than 300 from CD29 or D11) measuredin this study show values inconsistent with adjacent analyses andtherefore it seems most reasonable that these aberrant values shouldbe excluded from the following discussion.
A second issue relates to matching of sample series taken fromdifferent slabs or different places on the same slab. In general there isgood agreement between the series, but for example samples takenfrom 75–85 mm depth in the old piece 1st series and the 2nd series inthe new piece of CD29 (Fig. 2a) appear to be slightly offset from theremainder of the data points. In principle this can be accounted for byvariability in the Tl isotope composition of the same growth layer.However, this interpretation relies on the assumption that Fe–Mncrusts grow in a uniform horizontally layered manner, which isincorrect. The top of a Fe–Mn crust is highly undulating and there isoften a large variability in the total thickness of crusts. For exampleour slab of D11 has a thickness of 169 mmwhereas other studies haveworked on sections that were 147 mm (Ling et al., 1997) and 141 mmthick (Christensen et al., 1997; Lee et al., 1999). This will invariablyresult in a slightly different age-depth relationship for each sampleseries, which makes precise age calibration difficult. Here, we haveanalysed Tl isotope compositions of samples which also have Osisotope data available, which gives amuchmore robust age calibrationfor CD29. When applying an age model to CD29 we will thereforematch the slightly offset series to the series with Os isotopes.
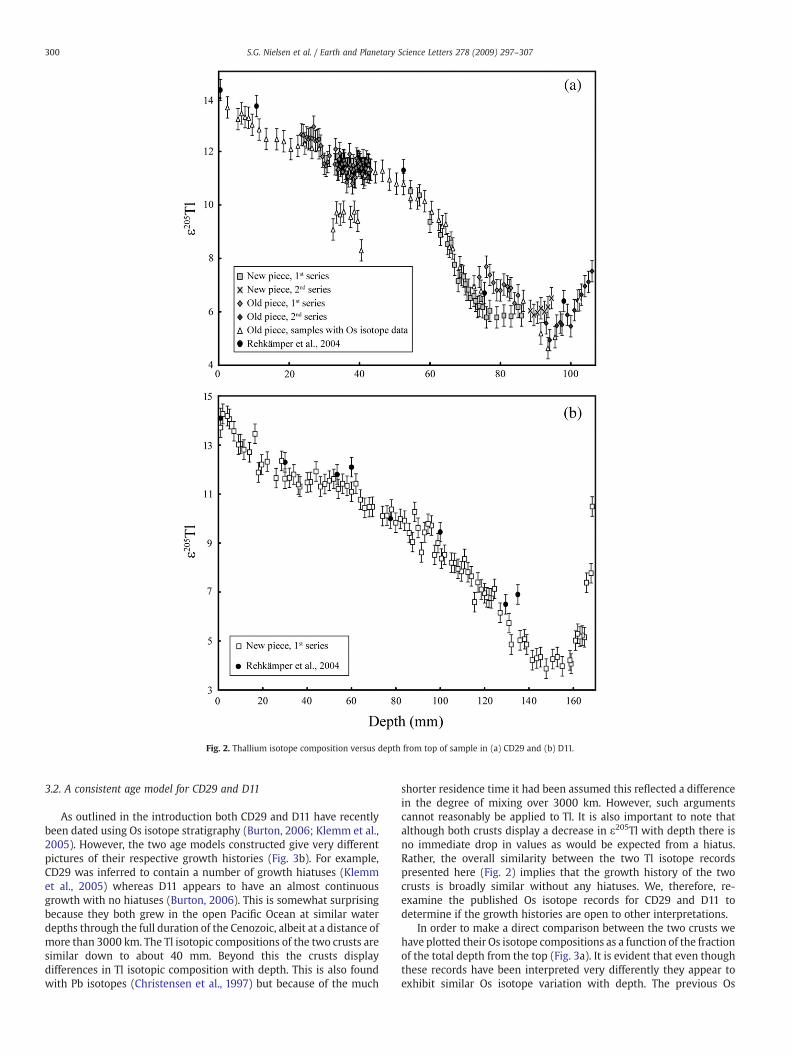
Fig. 2. Thallium isotope composition versus depth from top of sample in (a) CD29 and (b) D11.
300 S.G. Nielsen et al. / Earth and Planetary Science Letters 278 (2009) 297–307
3.2. A consistent age model for CD29 and D11
As outlined in the introduction both CD29 and D11 have recentlybeen dated using Os isotope stratigraphy (Burton, 2006; Klemm et al.,2005). However, the two age models constructed give very differentpictures of their respective growth histories (Fig. 3b). For example,CD29 was inferred to contain a number of growth hiatuses (Klemmet al., 2005) whereas D11 appears to have an almost continuousgrowth with no hiatuses (Burton, 2006). This is somewhat surprisingbecause they both grew in the open Pacific Ocean at similar waterdepths through the full duration of the Cenozoic, albeit at a distance ofmore than 3000 km. The Tl isotopic compositions of the two crusts aresimilar down to about 40 mm. Beyond this the crusts displaydifferences in Tl isotopic composition with depth. This is also foundwith Pb isotopes (Christensen et al., 1997) but because of the much
shorter residence time it had been assumed this reflected a differencein the degree of mixing over 3000 km. However, such argumentscannot reasonably be applied to Tl. It is also important to note thatalthough both crusts display a decrease in ε205Tl with depth there isno immediate drop in values as would be expected from a hiatus.Rather, the overall similarity between the two Tl isotope recordspresented here (Fig. 2) implies that the growth history of the twocrusts is broadly similar without any hiatuses. We, therefore, re-examine the published Os isotope records for CD29 and D11 todetermine if the growth histories are open to other interpretations.
In order to make a direct comparison between the two crusts wehave plotted their Os isotope compositions as a function of the fractionof the total depth from the top (Fig. 3a). It is evident that even thoughthese records have been interpreted very differently they appear toexhibit similar Os isotope variation with depth. The previous Os
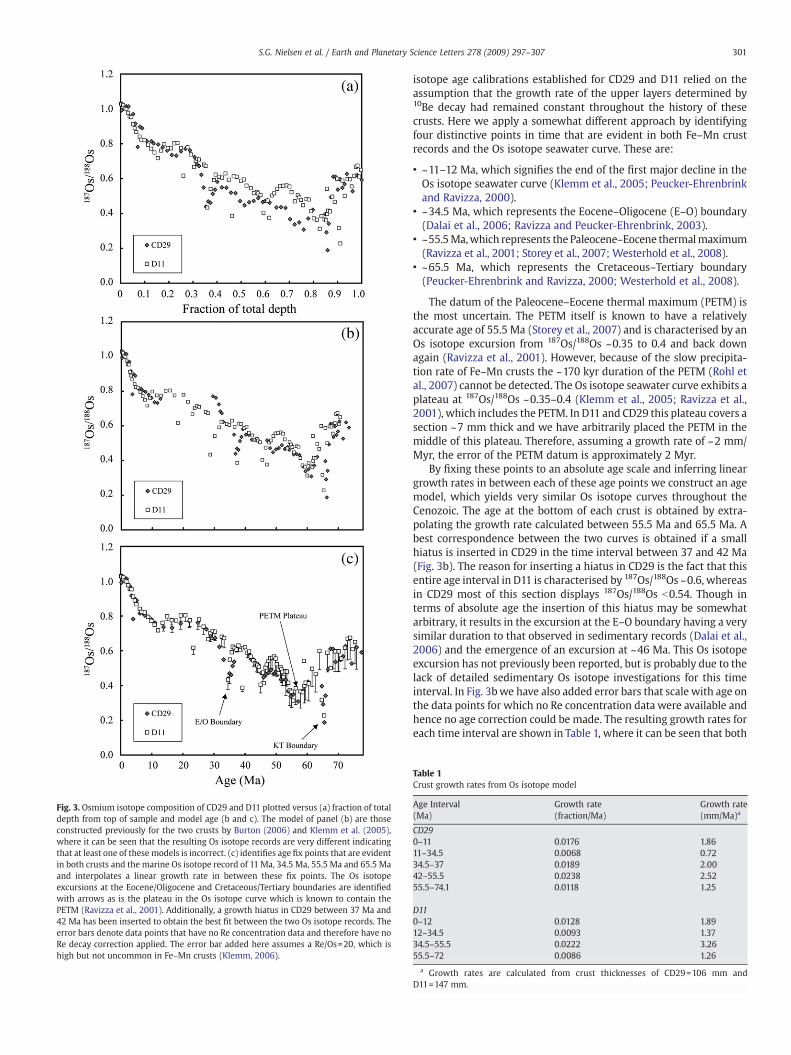
Fig. 3. Osmium isotope composition of CD29 and D11 plotted versus (a) fraction of totaldepth from top of sample and model age (b and c). The model of panel (b) are thoseconstructed previously for the two crusts by Burton (2006) and Klemm et al. (2005),where it can be seen that the resulting Os isotope records are very different indicatingthat at least one of these models is incorrect. (c) identifies age fix points that are evidentin both crusts and the marine Os isotope record of 11 Ma, 34.5 Ma, 55.5 Ma and 65.5 Maand interpolates a linear growth rate in between these fix points. The Os isotopeexcursions at the Eocene/Oligocene and Cretaceous/Tertiary boundaries are identifiedwith arrows as is the plateau in the Os isotope curve which is known to contain thePETM (Ravizza et al., 2001). Additionally, a growth hiatus in CD29 between 37 Ma and42 Ma has been inserted to obtain the best fit between the two Os isotope records. Theerror bars denote data points that have no Re concentration data and therefore have noRe decay correction applied. The error bar added here assumes a Re/Os=20, which ishigh but not uncommon in Fe–Mn crusts (Klemm, 2006).
301S.G. Nielsen et al. / Earth and Planetary Science Letters 278 (2009) 297–307
isotope age calibrations established for CD29 and D11 relied on theassumption that the growth rate of the upper layers determined by10Be decay had remained constant throughout the history of thesecrusts. Here we apply a somewhat different approach by identifyingfour distinctive points in time that are evident in both Fe–Mn crustrecords and the Os isotope seawater curve. These are:
• ~11–12 Ma, which signifies the end of the first major decline in theOs isotope seawater curve (Klemm et al., 2005; Peucker-Ehrenbrinkand Ravizza, 2000).
• ~34.5 Ma, which represents the Eocene–Oligocene (E–O) boundary(Dalai et al., 2006; Ravizza and Peucker-Ehrenbrink, 2003).
• ~55.5Ma,which represents the Paleocene–Eocene thermalmaximum(Ravizza et al., 2001; Storey et al., 2007; Westerhold et al., 2008).
• ~65.5 Ma, which represents the Cretaceous–Tertiary boundary(Peucker-Ehrenbrink and Ravizza, 2000; Westerhold et al., 2008).
The datum of the Paleocene–Eocene thermal maximum (PETM) isthe most uncertain. The PETM itself is known to have a relativelyaccurate age of 55.5 Ma (Storey et al., 2007) and is characterised by anOs isotope excursion from 187Os/188Os ~0.35 to 0.4 and back downagain (Ravizza et al., 2001). However, because of the slow precipita-tion rate of Fe–Mn crusts the ~170 kyr duration of the PETM (Rohl etal., 2007) cannot be detected. The Os isotope seawater curve exhibits aplateau at 187Os/188Os ~0.35–0.4 (Klemm et al., 2005; Ravizza et al.,2001), which includes the PETM. In D11 and CD29 this plateau covers asection ~7 mm thick and we have arbitrarily placed the PETM in themiddle of this plateau. Therefore, assuming a growth rate of ~2 mm/Myr, the error of the PETM datum is approximately 2 Myr.
By fixing these points to an absolute age scale and inferring lineargrowth rates in between each of these age points we construct an agemodel, which yields very similar Os isotope curves throughout theCenozoic. The age at the bottom of each crust is obtained by extra-polating the growth rate calculated between 55.5 Ma and 65.5 Ma. Abest correspondence between the two curves is obtained if a smallhiatus is inserted in CD29 in the time interval between 37 and 42 Ma(Fig. 3b). The reason for inserting a hiatus in CD29 is the fact that thisentire age interval in D11 is characterised by 187Os/188Os ~0.6, whereasin CD29 most of this section displays 187Os/188Os b0.54. Though interms of absolute age the insertion of this hiatus may be somewhatarbitrary, it results in the excursion at the E–O boundary having a verysimilar duration to that observed in sedimentary records (Dalai et al.,2006) and the emergence of an excursion at ~46 Ma. This Os isotopeexcursion has not previously been reported, but is probably due to thelack of detailed sedimentary Os isotope investigations for this timeinterval. In Fig. 3bwe have also added error bars that scale with age onthe data points for which no Re concentration data were available andhence no age correction could be made. The resulting growth rates foreach time interval are shown in Table 1, where it can be seen that both
Table 1Crust growth rates from Os isotope model
Age Interval(Ma)
Growth rate(fraction/Ma)
Growth rate(mm/Ma)a
CD290–11 0.0176 1.8611–34.5 0.0068 0.7234.5–37 0.0189 2.0042–55.5 0.0238 2.5255.5–74.1 0.0118 1.25
D110–12 0.0128 1.8912–34.5 0.0093 1.3734.5–55.5 0.0222 3.2655.5–72 0.0086 1.26
a Growth rates are calculated from crust thicknesses of CD29=106 mm andD11=147 mm.
302 S.G. Nielsen et al. / Earth and Planetary Science Letters 278 (2009) 297–307
crusts experienced large changes in their growth rates through theCenozoic. Keeping this in mind, it is probable that the growth modelspresented here aremuch simpler than the actual history of these crustsas there is no specific reason for the changes in growth rate to haveoccurred exactly or only at the points in time marked by Os isotopeexcursions in the seawater curve. Nevertheless, we are confident thatthese age models are good approximations for both CD29 and D11.
3.3. Cenozoic thallium isotope curve
Having constructed consistent age models for CD29 and D11 wecan now apply these to the Tl isotope data. The resulting curves areshown in Fig. 4 and these display an almost identical evolution overthe entire Cenozoic, strongly suggesting that these crusts are trackingthe same phenomenon and also re-enforcing that the age models forCD29 and D11 are likely to be correct. Only two age intervals show aslight difference. Between ~35–50 Ma and between ~55–65 Ma D11displays slightly lower ε205Tl than CD29 (Fig. 4). This could either becaused by a true offset between the Tl isotope compositions that wereincorporated into the two crusts at the time of deposition or if thedepth versus age relationships inferred for one or both of the crustsare inaccurate thus creating an apparent offset.
Considering that we have a direct Os-Tl age model for CD29 suchinaccuracy is most likely to occur in D11. We can evaluate whether theagemodel (Table 1) is accurate for the slice of D11 investigated here bymeasuring Os and Tl isotope compositions in samples from D11 thatencompass one of the Os isotope excursions recognised in D11 andCD29 already. The Tl isotope compositions recorded in CD29 and D11at the stratigraphic level of these Os isotope excursions can then becompared. We sampled two sets of four samples in D11 at depths of~83–87 mm and ~130–134 mm and both intervals display asignificant Os isotope excursion (Table S2 in the Appendix). Themagnitude of these excursions combined with their approximatepositions in D11 are most compatible with the excursions we hereinterpret to have ages of ~46 Ma and ~65.5 Ma (Fig. 3b). In D11, the Tlisotope compositions measured for these two intervals are ε205Tl ~9.6and 5.5, respectively (Table S2 in the Appendix), which is indis-tinguishable from the Tl isotope compositions recorded in CD29 atthese excursions of ε205Tl ~10.3 and 6.0 (Table S1 in the Appendix).
Fig. 4. Thallium isotope compositions of CD29 and D
We therefore conclude that the offsets in timing observed betweenCD29 and D11 (Fig. 4) are due to variable growth rates of D11 in thedifferent slabs investigated for Os and Tl isotopes. This appearsparticularly reasonable considering the section of D11 used for the Tlisotope investigationwas ~169mm thick whereas the piece examinedfor Os isotopes was ~146 mm thick (Gannoun et al., 2000). For thisreason, and because we have a direct Os-Tl age calibration for CD29,we infer that the timing of the Tl isotope variations is likely to be moreaccurate in CD29. This implies that the main feature of the Cenozoic Tlisotope curve is an increase occurring from ~55 Ma to ~45 Ma (Fig. 4).
Based on the arguments presented above, it also follows that theages deduced for the Cretaceous sections of CD29 and D11 are verypoorly constrained. At best we can probably infer that the lateCretaceous was characterised by a decline in ε205Tl from ~10 to ~4followed by an increase to ε205Tl ~6 that was completed before the KTboundary. The total or individual durations of these two changes arenot possible to constrain at present. The ages plotted in Fig. 4 for theCretaceous should therefore also been viewed entirely as estimates.
4. Interpretation of Cenozoic thallium isotope records
4.1. Causes of thallium isotope variations in Fe–Mn crusts
There are several processes that can explain the observed Tlisotope variations in CD29 and D11. Firstly, it is possible that secondarydiagenetic processes subsequent to Fe–Mn crust deposition alteredthe original Tl isotope compositions of the samples. Themost commonform of diagenesis in Fe–Mn crusts is phosphatisation, which mostlikely occurs as replacement of carbonate in Fe–Mn crust pore spaceby carbonate fluorapatite (CFA) (Hein et al., 1993; Klemm, 2006). Thisprocess essentially adds material to the original Fe–Mn deposit andcould therefore perturb the bulk composition if the element of interesthas a high concentration in the phosphate phase. However, Tl+, thepredominant Tl valence state in seawater, has a very large ionic radius(Shannon, 1976) that fits poorly in the carbonate and apatite lattices,which more readily accommodate smaller cations like the rare earthelements. Also, with the improved depth-age relationship constructedhere (Fig. 3b), the approximate depth of the stratigraphically highestappearance of CFA in D11 and CD29 (Ling et al., 1997) have Fe–Mn
11 plotted versus the ages calculated in Fig. 3c.
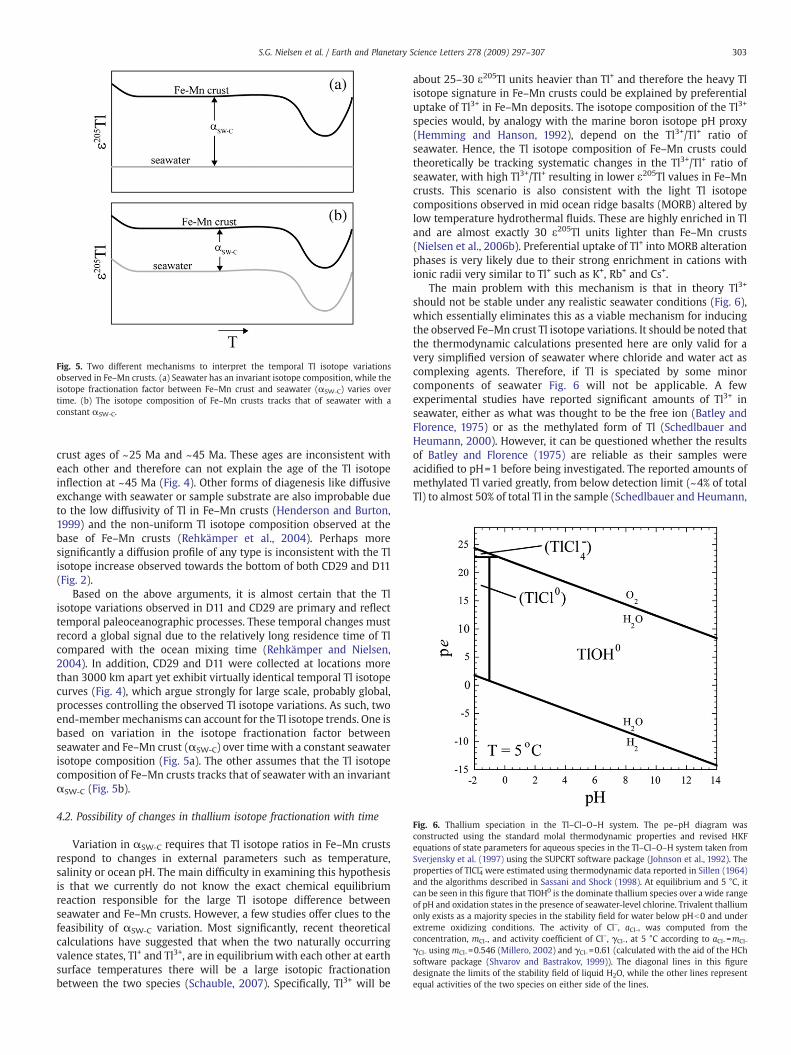
Fig. 5. Two different mechanisms to interpret the temporal Tl isotope variationsobserved in Fe–Mn crusts. (a) Seawater has an invariant isotope composition, while theisotope fractionation factor between Fe–Mn crust and seawater (αSW-C) varies overtime. (b) The isotope composition of Fe–Mn crusts tracks that of seawater with aconstant αSW-C.
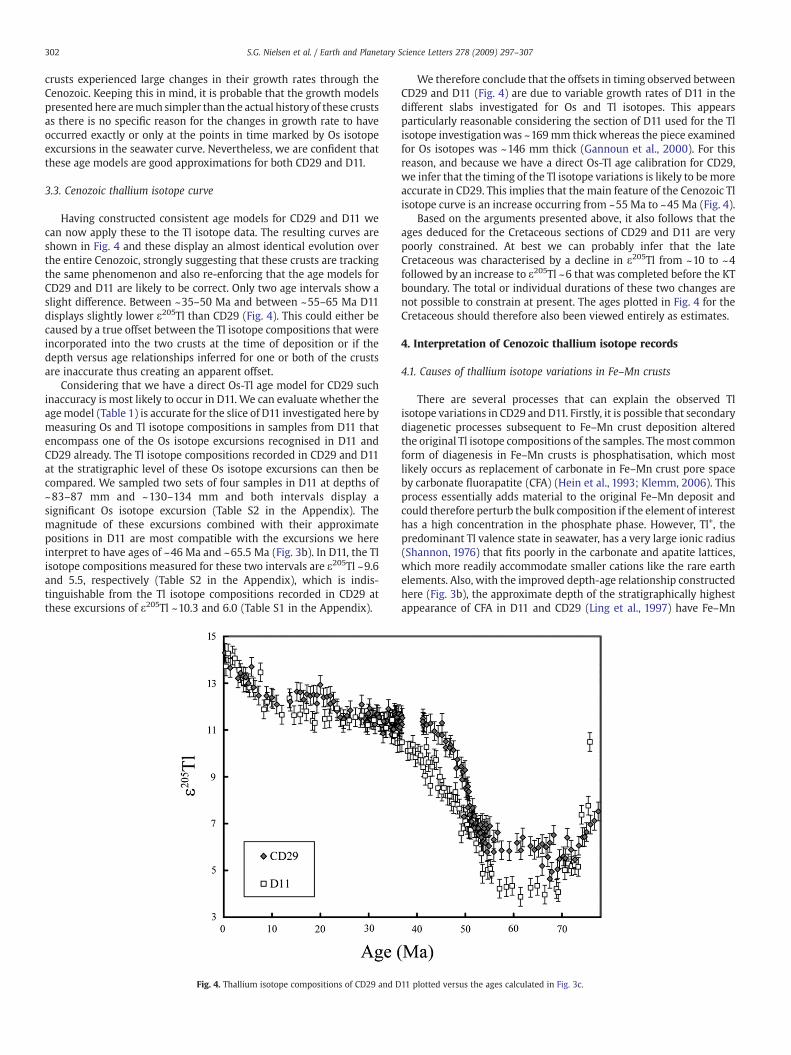
Fig. 6. Thallium speciation in the Tl–Cl–O–H system. The pe–pH diagram wasconstructed using the standard molal thermodynamic properties and revised HKFequations of state parameters for aqueous species in the Tl–Cl–O–H system taken fromSverjensky et al. (1997) using the SUPCRT software package (Johnson et al., 1992). Theproperties of TlCl4− were estimated using thermodynamic data reported in Sillen (1964)and the algorithms described in Sassani and Shock (1998). At equilibrium and 5 °C, itcan be seen in this figure that TlOH0 is the dominate thallium species over a wide rangeof pH and oxidation states in the presence of seawater-level chlorine. Trivalent thalliumonly exists as a majority species in the stability field for water below pHb0 and underextreme oxidizing conditions. The activity of Cl−, aCl-, was computed from theconcentration, mCl-, and activity coefficient of Cl−, γCl-, at 5 °C according to aCl-=mCl-
γCl- using mCl-=0.546 (Millero, 2002) and γCl-=0.61 (calculated with the aid of the HChsoftware package (Shvarov and Bastrakov, 1999)). The diagonal lines in this figuredesignate the limits of the stability field of liquid H2O, while the other lines representequal activities of the two species on either side of the lines.
303S.G. Nielsen et al. / Earth and Planetary Science Letters 278 (2009) 297–307
crust ages of ~25 Ma and ~45 Ma. These ages are inconsistent witheach other and therefore can not explain the age of the Tl isotopeinflection at ~45 Ma (Fig. 4). Other forms of diagenesis like diffusiveexchange with seawater or sample substrate are also improbable dueto the low diffusivity of Tl in Fe–Mn crusts (Henderson and Burton,1999) and the non-uniform Tl isotope composition observed at thebase of Fe–Mn crusts (Rehkämper et al., 2004). Perhaps moresignificantly a diffusion profile of any type is inconsistent with the Tlisotope increase observed towards the bottom of both CD29 and D11(Fig. 2).
Based on the above arguments, it is almost certain that the Tlisotope variations observed in D11 and CD29 are primary and reflecttemporal paleoceanographic processes. These temporal changes mustrecord a global signal due to the relatively long residence time of Tlcompared with the ocean mixing time (Rehkämper and Nielsen,2004). In addition, CD29 and D11 were collected at locations morethan 3000 km apart yet exhibit virtually identical temporal Tl isotopecurves (Fig. 4), which argue strongly for large scale, probably global,processes controlling the observed Tl isotope variations. As such, twoend-membermechanisms can account for the Tl isotope trends. One isbased on variation in the isotope fractionation factor betweenseawater and Fe–Mn crust (αSW-C) over time with a constant seawaterisotope composition (Fig. 5a). The other assumes that the Tl isotopecomposition of Fe–Mn crusts tracks that of seawater with an invariantαSW-C (Fig. 5b).
4.2. Possibility of changes in thallium isotope fractionation with time
Variation in αSW-C requires that Tl isotope ratios in Fe–Mn crustsrespond to changes in external parameters such as temperature,salinity or ocean pH. The main difficulty in examining this hypothesisis that we currently do not know the exact chemical equilibriumreaction responsible for the large Tl isotope difference betweenseawater and Fe–Mn crusts. However, a few studies offer clues to thefeasibility of αSW-C variation. Most significantly, recent theoreticalcalculations have suggested that when the two naturally occurringvalence states, Tl+ and Tl3+, are in equilibriumwith each other at earthsurface temperatures there will be a large isotopic fractionationbetween the two species (Schauble, 2007). Specifically, Tl3+ will be
about 25–30 ε205Tl units heavier than Tl+ and therefore the heavy Tlisotope signature in Fe–Mn crusts could be explained by preferentialuptake of Tl3+ in Fe–Mn deposits. The isotope composition of the Tl3+
species would, by analogy with the marine boron isotope pH proxy(Hemming and Hanson, 1992), depend on the Tl3+/Tl+ ratio ofseawater. Hence, the Tl isotope composition of Fe–Mn crusts couldtheoretically be tracking systematic changes in the Tl3+/Tl+ ratio ofseawater, with high Tl3+/Tl+ resulting in lower ε205Tl values in Fe–Mncrusts. This scenario is also consistent with the light Tl isotopecompositions observed in mid ocean ridge basalts (MORB) altered bylow temperature hydrothermal fluids. These are highly enriched in Tland are almost exactly 30 ε205Tl units lighter than Fe–Mn crusts(Nielsen et al., 2006b). Preferential uptake of Tl+ into MORB alterationphases is very likely due to their strong enrichment in cations withionic radii very similar to Tl+ such as K+, Rb+ and Cs+.
The main problem with this mechanism is that in theory Tl3+
should not be stable under any realistic seawater conditions (Fig. 6),which essentially eliminates this as a viable mechanism for inducingthe observed Fe–Mn crust Tl isotope variations. It should be noted thatthe thermodynamic calculations presented here are only valid for avery simplified version of seawater where chloride and water act ascomplexing agents. Therefore, if Tl is speciated by some minorcomponents of seawater Fig. 6 will not be applicable. A fewexperimental studies have reported significant amounts of Tl3+ inseawater, either as what was thought to be the free ion (Batley andFlorence, 1975) or as the methylated form of Tl (Schedlbauer andHeumann, 2000). However, it can be questioned whether the resultsof Batley and Florence (1975) are reliable as their samples wereacidified to pH=1 before being investigated. The reported amounts ofmethylated Tl varied greatly, from below detection limit (~4% of totalTl) to almost 50% of total Tl in the sample (Schedlbauer and Heumann,
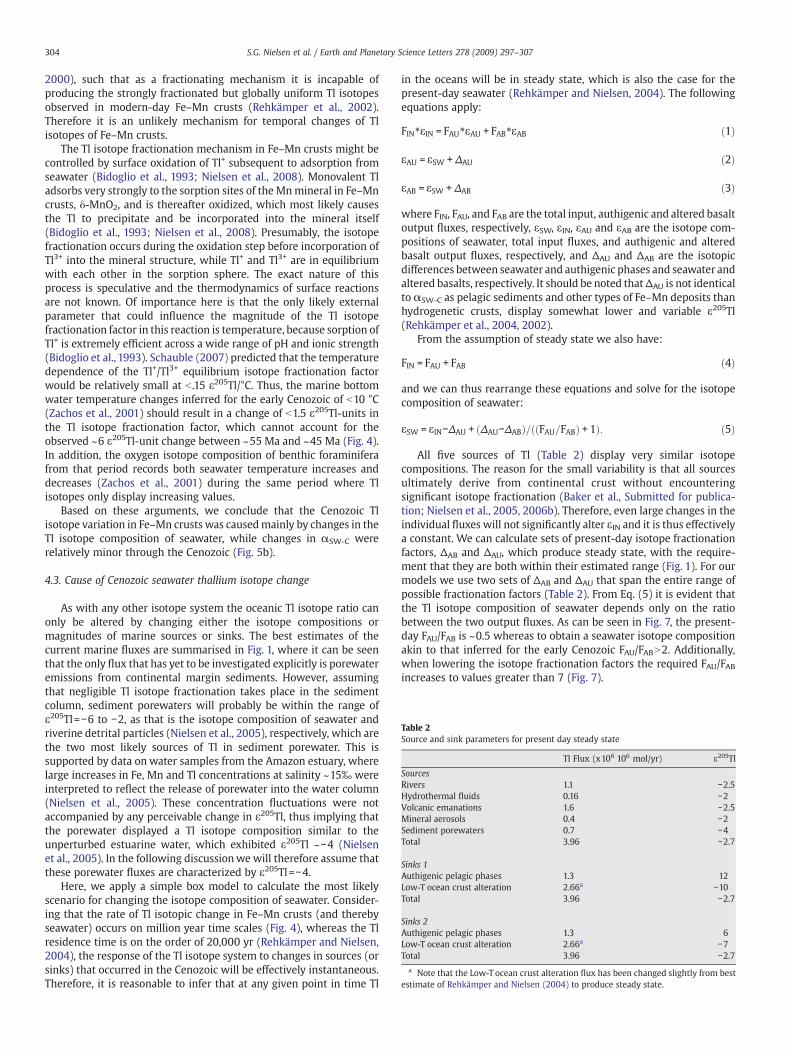
Table 2Source and sink parameters for present day steady state
Tl Flux (x106 106 mol/yr) ε205Tl
SourcesRivers 1.1 −2.5Hydrothermal fluids 0.16 −2Volcanic emanations 1.6 −2.5Mineral aerosols 0.4 −2Sediment porewaters 0.7 −4Total 3.96 −2.7
Sinks 1Authigenic pelagic phases 1.3 12Low-T ocean crust alteration 2.66a −10Total 3.96 −2.7
Sinks 2Authigenic pelagic phases 1.3 6Low-T ocean crust alteration 2.66a −7Total 3.96 −2.7
a Note that the Low-T ocean crust alteration flux has been changed slightly from bestestimate of Rehkämper and Nielsen (2004) to produce steady state.
304 S.G. Nielsen et al. / Earth and Planetary Science Letters 278 (2009) 297–307
2000), such that as a fractionating mechanism it is incapable ofproducing the strongly fractionated but globally uniform Tl isotopesobserved in modern-day Fe–Mn crusts (Rehkämper et al., 2002).Therefore it is an unlikely mechanism for temporal changes of Tlisotopes of Fe–Mn crusts.
The Tl isotope fractionation mechanism in Fe–Mn crusts might becontrolled by surface oxidation of Tl+ subsequent to adsorption fromseawater (Bidoglio et al., 1993; Nielsen et al., 2008). Monovalent Tladsorbs very strongly to the sorption sites of the Mnmineral in Fe–Mncrusts, δ-MnO2, and is thereafter oxidized, which most likely causesthe Tl to precipitate and be incorporated into the mineral itself(Bidoglio et al., 1993; Nielsen et al., 2008). Presumably, the isotopefractionation occurs during the oxidation step before incorporation ofTl3+ into the mineral structure, while Tl+ and Tl3+ are in equilibriumwith each other in the sorption sphere. The exact nature of thisprocess is speculative and the thermodynamics of surface reactionsare not known. Of importance here is that the only likely externalparameter that could influence the magnitude of the Tl isotopefractionation factor in this reaction is temperature, because sorption ofTl+ is extremely efficient across a wide range of pH and ionic strength(Bidoglio et al., 1993). Schauble (2007) predicted that the temperaturedependence of the Tl+/Tl3+ equilibrium isotope fractionation factorwould be relatively small at b .15 ε205Tl/°C. Thus, the marine bottomwater temperature changes inferred for the early Cenozoic of b10 °C(Zachos et al., 2001) should result in a change of b1.5 ε205Tl-units inthe Tl isotope fractionation factor, which cannot account for theobserved ~6 ε205Tl-unit change between ~55 Ma and ~45 Ma (Fig. 4).In addition, the oxygen isotope composition of benthic foraminiferafrom that period records both seawater temperature increases anddecreases (Zachos et al., 2001) during the same period where Tlisotopes only display increasing values.
Based on these arguments, we conclude that the Cenozoic Tlisotope variation in Fe–Mn crusts was causedmainly by changes in theTl isotope composition of seawater, while changes in αSW-C wererelatively minor through the Cenozoic (Fig. 5b).
4.3. Cause of Cenozoic seawater thallium isotope change
As with any other isotope system the oceanic Tl isotope ratio canonly be altered by changing either the isotope compositions ormagnitudes of marine sources or sinks. The best estimates of thecurrent marine fluxes are summarised in Fig. 1, where it can be seenthat the only flux that has yet to be investigated explicitly is porewateremissions from continental margin sediments. However, assumingthat negligible Tl isotope fractionation takes place in the sedimentcolumn, sediment porewaters will probably be within the range ofε205Tl=−6 to −2, as that is the isotope composition of seawater andriverine detrital particles (Nielsen et al., 2005), respectively, which arethe two most likely sources of Tl in sediment porewater. This issupported by data on water samples from the Amazon estuary, wherelarge increases in Fe, Mn and Tl concentrations at salinity ~15‰ wereinterpreted to reflect the release of porewater into the water column(Nielsen et al., 2005). These concentration fluctuations were notaccompanied by any perceivable change in ε205Tl, thus implying thatthe porewater displayed a Tl isotope composition similar to theunperturbed estuarine water, which exhibited ε205Tl ~−4 (Nielsenet al., 2005). In the following discussionwe will therefore assume thatthese porewater fluxes are characterized by ε205Tl=−4.
Here, we apply a simple box model to calculate the most likelyscenario for changing the isotope composition of seawater. Consider-ing that the rate of Tl isotopic change in Fe–Mn crusts (and therebyseawater) occurs on million year time scales (Fig. 4), whereas the Tlresidence time is on the order of 20,000 yr (Rehkämper and Nielsen,2004), the response of the Tl isotope system to changes in sources (orsinks) that occurred in the Cenozoic will be effectively instantaneous.Therefore, it is reasonable to infer that at any given point in time Tl
in the oceans will be in steady state, which is also the case for thepresent-day seawater (Rehkämper and Nielsen, 2004). The followingequations apply:
FIN4εIN = FAU4εAU + FAB4εAB ð1Þ
εAU = εSW +ΔAU ð2Þ
εAB = εSW +ΔAB ð3Þ
where FIN, FAU, and FAB are the total input, authigenic and altered basaltoutput fluxes, respectively, εSW, εIN, εAU and εAB are the isotope com-positions of seawater, total input fluxes, and authigenic and alteredbasalt output fluxes, respectively, and ΔAU and ΔAB are the isotopicdifferences between seawater and authigenic phases and seawater andaltered basalts, respectively. It should be noted thatΔAU is not identicalto αSW-C as pelagic sediments and other types of Fe–Mn deposits thanhydrogenetic crusts, display somewhat lower and variable ε205Tl(Rehkämper et al., 2004, 2002).
From the assumption of steady state we also have:
FIN = FAU + FAB ð4Þ
and we can thus rearrange these equations and solve for the isotopecomposition of seawater:
εSW = εIN−ΔAU + ΔAU−ΔABð Þ= FAU=FABð Þ + 1ð Þ: ð5Þ
All five sources of Tl (Table 2) display very similar isotopecompositions. The reason for the small variability is that all sourcesultimately derive from continental crust without encounteringsignificant isotope fractionation (Baker et al., Submitted for publica-tion; Nielsen et al., 2005, 2006b). Therefore, even large changes in theindividual fluxes will not significantly alter εIN and it is thus effectivelya constant. We can calculate sets of present-day isotope fractionationfactors, ΔAB and ΔAU, which produce steady state, with the require-ment that they are both within their estimated range (Fig. 1). For ourmodels we use two sets of ΔAB and ΔAU that span the entire range ofpossible fractionation factors (Table 2). From Eq. (5) it is evident thatthe Tl isotope composition of seawater depends only on the ratiobetween the two output fluxes. As can be seen in Fig. 7, the present-day FAU/FAB is ~0.5 whereas to obtain a seawater isotope compositionakin to that inferred for the early Cenozoic FAU/FABN2. Additionally,when lowering the isotope fractionation factors the required FAU/FABincreases to values greater than 7 (Fig. 7).
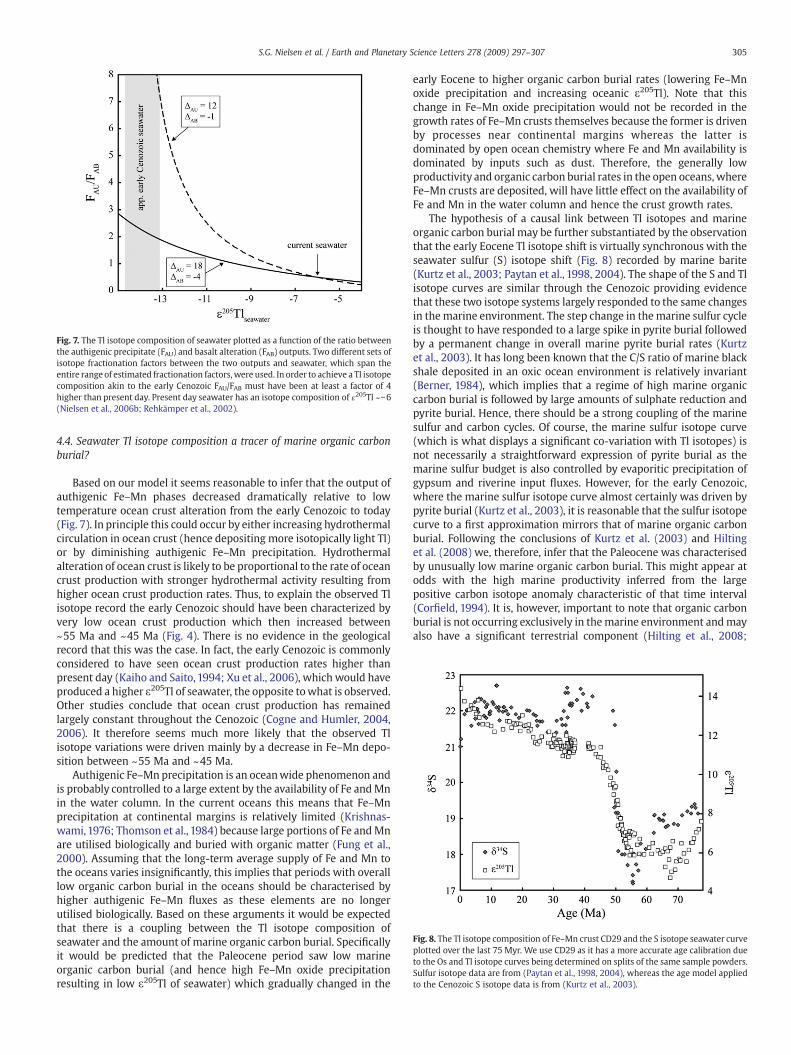
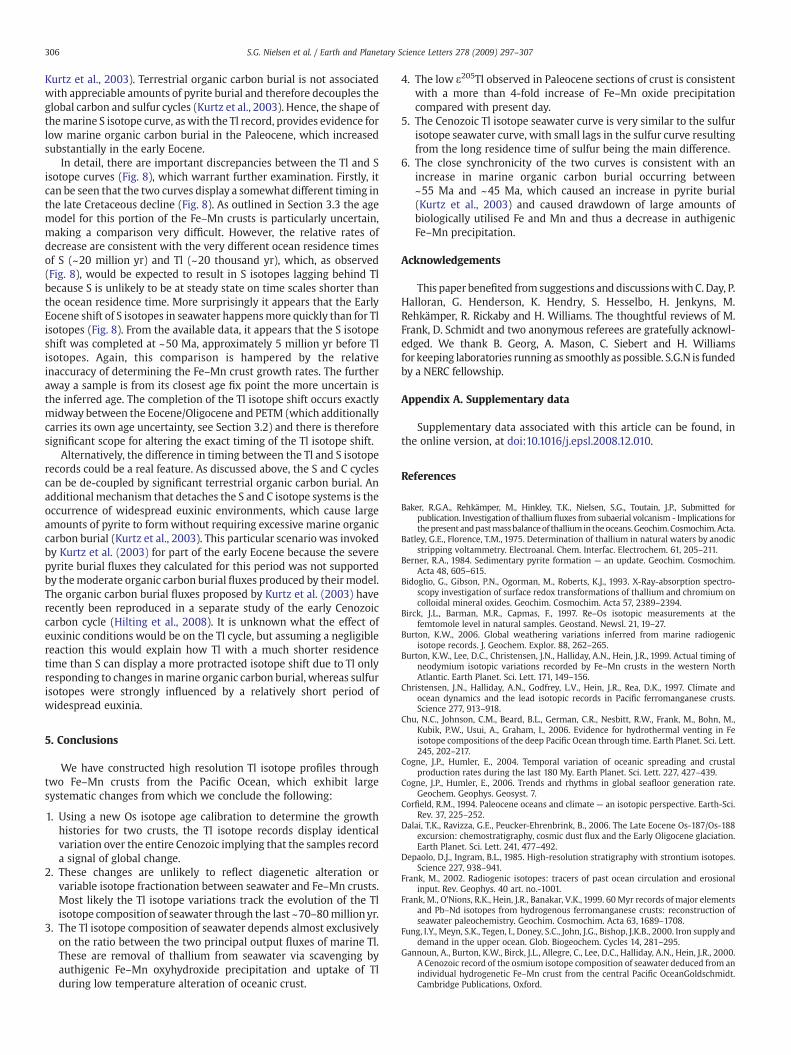
Fig. 8. The Tl isotope composition of Fe–Mn crust CD29 and the S isotope seawater curveplotted over the last 75 Myr. We use CD29 as it has a more accurate age calibration dueto the Os and Tl isotope curves being determined on splits of the same sample powders.Sulfur isotope data are from (Paytan et al., 1998, 2004), whereas the age model appliedto the Cenozoic S isotope data is from (Kurtz et al., 2003).
Fig. 7. The Tl isotope composition of seawater plotted as a function of the ratio betweenthe authigenic precipitate (FAU) and basalt alteration (FAB) outputs. Two different sets ofisotope fractionation factors between the two outputs and seawater, which span theentire range of estimated fractionation factors, were used. In order to achieve a Tl isotopecomposition akin to the early Cenozoic FAU/FAB must have been at least a factor of 4higher than present day. Present day seawater has an isotope composition of ɛ205Tl ~−6(Nielsen et al., 2006b; Rehkämper et al., 2002).
305S.G. Nielsen et al. / Earth and Planetary Science Letters 278 (2009) 297–307
4.4. Seawater Tl isotope composition a tracer of marine organic carbonburial?
Based on our model it seems reasonable to infer that the output ofauthigenic Fe–Mn phases decreased dramatically relative to lowtemperature ocean crust alteration from the early Cenozoic to today(Fig. 7). In principle this could occur by either increasing hydrothermalcirculation in ocean crust (hence depositing more isotopically light Tl)or by diminishing authigenic Fe–Mn precipitation. Hydrothermalalteration of ocean crust is likely to be proportional to the rate of oceancrust production with stronger hydrothermal activity resulting fromhigher ocean crust production rates. Thus, to explain the observed Tlisotope record the early Cenozoic should have been characterized byvery low ocean crust production which then increased between~55 Ma and ~45 Ma (Fig. 4). There is no evidence in the geologicalrecord that this was the case. In fact, the early Cenozoic is commonlyconsidered to have seen ocean crust production rates higher thanpresent day (Kaiho and Saito, 1994; Xu et al., 2006), which would haveproduced a higher ε205Tl of seawater, the opposite towhat is observed.Other studies conclude that ocean crust production has remainedlargely constant throughout the Cenozoic (Cogne and Humler, 2004,2006). It therefore seems much more likely that the observed Tlisotope variations were driven mainly by a decrease in Fe–Mn depo-sition between ~55 Ma and ~45 Ma.
Authigenic Fe–Mnprecipitation is an oceanwide phenomenon andis probably controlled to a large extent by the availability of Fe andMnin the water column. In the current oceans this means that Fe–Mnprecipitation at continental margins is relatively limited (Krishnas-wami,1976; Thomson et al., 1984) because large portions of Fe andMnare utilised biologically and buried with organic matter (Fung et al.,2000). Assuming that the long-term average supply of Fe and Mn tothe oceans varies insignificantly, this implies that periods with overalllow organic carbon burial in the oceans should be characterised byhigher authigenic Fe–Mn fluxes as these elements are no longerutilised biologically. Based on these arguments it would be expectedthat there is a coupling between the Tl isotope composition ofseawater and the amount of marine organic carbon burial. Specificallyit would be predicted that the Paleocene period saw low marineorganic carbon burial (and hence high Fe–Mn oxide precipitationresulting in low ε205Tl of seawater) which gradually changed in the
early Eocene to higher organic carbon burial rates (lowering Fe–Mnoxide precipitation and increasing oceanic ε205Tl). Note that thischange in Fe–Mn oxide precipitation would not be recorded in thegrowth rates of Fe–Mn crusts themselves because the former is drivenby processes near continental margins whereas the latter isdominated by open ocean chemistry where Fe and Mn availability isdominated by inputs such as dust. Therefore, the generally lowproductivity and organic carbon burial rates in the open oceans, whereFe–Mn crusts are deposited, will have little effect on the availability ofFe and Mn in the water column and hence the crust growth rates.
The hypothesis of a causal link between Tl isotopes and marineorganic carbon burial may be further substantiated by the observationthat the early Eocene Tl isotope shift is virtually synchronous with theseawater sulfur (S) isotope shift (Fig. 8) recorded by marine barite(Kurtz et al., 2003; Paytan et al., 1998, 2004). The shape of the S and Tlisotope curves are similar through the Cenozoic providing evidencethat these two isotope systems largely responded to the same changesin the marine environment. The step change in the marine sulfur cycleis thought to have responded to a large spike in pyrite burial followedby a permanent change in overall marine pyrite burial rates (Kurtzet al., 2003). It has long been known that the C/S ratio of marine blackshale deposited in an oxic ocean environment is relatively invariant(Berner, 1984), which implies that a regime of high marine organiccarbon burial is followed by large amounts of sulphate reduction andpyrite burial. Hence, there should be a strong coupling of the marinesulfur and carbon cycles. Of course, the marine sulfur isotope curve(which is what displays a significant co-variation with Tl isotopes) isnot necessarily a straightforward expression of pyrite burial as themarine sulfur budget is also controlled by evaporitic precipitation ofgypsum and riverine input fluxes. However, for the early Cenozoic,where the marine sulfur isotope curve almost certainly was driven bypyrite burial (Kurtz et al., 2003), it is reasonable that the sulfur isotopecurve to a first approximation mirrors that of marine organic carbonburial. Following the conclusions of Kurtz et al. (2003) and Hiltinget al. (2008) we, therefore, infer that the Paleocene was characterisedby unusually low marine organic carbon burial. This might appear atodds with the high marine productivity inferred from the largepositive carbon isotope anomaly characteristic of that time interval(Corfield, 1994). It is, however, important to note that organic carbonburial is not occurring exclusively in themarine environment andmayalso have a significant terrestrial component (Hilting et al., 2008;
306 S.G. Nielsen et al. / Earth and Planetary Science Letters 278 (2009) 297–307
Kurtz et al., 2003). Terrestrial organic carbon burial is not associatedwith appreciable amounts of pyrite burial and therefore decouples theglobal carbon and sulfur cycles (Kurtz et al., 2003). Hence, the shape ofthemarine S isotope curve, as with the Tl record, provides evidence forlow marine organic carbon burial in the Paleocene, which increasedsubstantially in the early Eocene.
In detail, there are important discrepancies between the Tl and Sisotope curves (Fig. 8), which warrant further examination. Firstly, itcan be seen that the two curves display a somewhat different timing inthe late Cretaceous decline (Fig. 8). As outlined in Section 3.3 the agemodel for this portion of the Fe–Mn crusts is particularly uncertain,making a comparison very difficult. However, the relative rates ofdecrease are consistent with the very different ocean residence timesof S (~20 million yr) and Tl (~20 thousand yr), which, as observed(Fig. 8), would be expected to result in S isotopes lagging behind Tlbecause S is unlikely to be at steady state on time scales shorter thanthe ocean residence time. More surprisingly it appears that the EarlyEocene shift of S isotopes in seawater happensmore quickly than for Tlisotopes (Fig. 8). From the available data, it appears that the S isotopeshift was completed at ~50 Ma, approximately 5 million yr before Tlisotopes. Again, this comparison is hampered by the relativeinaccuracy of determining the Fe–Mn crust growth rates. The furtheraway a sample is from its closest age fix point the more uncertain isthe inferred age. The completion of the Tl isotope shift occurs exactlymidway between the Eocene/Oligocene and PETM (which additionallycarries its own age uncertainty, see Section 3.2) and there is thereforesignificant scope for altering the exact timing of the Tl isotope shift.
Alternatively, the difference in timing between the Tl and S isotoperecords could be a real feature. As discussed above, the S and C cyclescan be de-coupled by significant terrestrial organic carbon burial. Anadditional mechanism that detaches the S and C isotope systems is theoccurrence of widespread euxinic environments, which cause largeamounts of pyrite to formwithout requiring excessive marine organiccarbon burial (Kurtz et al., 2003). This particular scenario was invokedby Kurtz et al. (2003) for part of the early Eocene because the severepyrite burial fluxes they calculated for this period was not supportedby themoderate organic carbon burial fluxes produced by theirmodel.The organic carbon burial fluxes proposed by Kurtz et al. (2003) haverecently been reproduced in a separate study of the early Cenozoiccarbon cycle (Hilting et al., 2008). It is unknown what the effect ofeuxinic conditions would be on the Tl cycle, but assuming a negligiblereaction this would explain how Tl with a much shorter residencetime than S can display a more protracted isotope shift due to Tl onlyresponding to changes inmarine organic carbon burial, whereas sulfurisotopes were strongly influenced by a relatively short period ofwidespread euxinia.
5. Conclusions
We have constructed high resolution Tl isotope profiles throughtwo Fe–Mn crusts from the Pacific Ocean, which exhibit largesystematic changes from which we conclude the following:
1. Using a new Os isotope age calibration to determine the growthhistories for two crusts, the Tl isotope records display identicalvariation over the entire Cenozoic implying that the samples recorda signal of global change.
2. These changes are unlikely to reflect diagenetic alteration orvariable isotope fractionation between seawater and Fe–Mn crusts.Most likely the Tl isotope variations track the evolution of the Tlisotope composition of seawater through the last ~70–80millionyr.
3. The Tl isotope composition of seawater depends almost exclusivelyon the ratio between the two principal output fluxes of marine Tl.These are removal of thallium from seawater via scavenging byauthigenic Fe–Mn oxyhydroxide precipitation and uptake of Tlduring low temperature alteration of oceanic crust.
4. The low ε205Tl observed in Paleocene sections of crust is consistentwith a more than 4-fold increase of Fe–Mn oxide precipitationcompared with present day.
5. The Cenozoic Tl isotope seawater curve is very similar to the sulfurisotope seawater curve, with small lags in the sulfur curve resultingfrom the long residence time of sulfur being the main difference.
6. The close synchronicity of the two curves is consistent with anincrease in marine organic carbon burial occurring between~55 Ma and ~45 Ma, which caused an increase in pyrite burial(Kurtz et al., 2003) and caused drawdown of large amounts ofbiologically utilised Fe and Mn and thus a decrease in authigenicFe–Mn precipitation.
Acknowledgements
This paper benefited from suggestions and discussionswith C. Day, P.Halloran, G. Henderson, K. Hendry, S. Hesselbo, H. Jenkyns, M.Rehkämper, R. Rickaby and H. Williams. The thoughtful reviews of M.Frank, D. Schmidt and two anonymous referees are gratefully acknowl-edged. We thank B. Georg, A. Mason, C. Siebert and H. Williamsfor keeping laboratories running as smoothly as possible. S.G.N is fundedby a NERC fellowship.
Appendix A. Supplementary data
Supplementary data associated with this article can be found, inthe online version, at doi:10.1016/j.epsl.2008.12.010.
References
Baker, R.G.A., Rehkämper, M., Hinkley, T.K., Nielsen, S.G., Toutain, J.P., Submitted forpublication. Investigation of thallium fluxes from subaerial volcanism - Implications forthepresent andpastmassbalanceof thallium in theoceans.Geochim.Cosmochim.Acta.
Batley, G.E., Florence, T.M., 1975. Determination of thallium in natural waters by anodicstripping voltammetry. Electroanal. Chem. Interfac. Electrochem. 61, 205–211.
Berner, R.A., 1984. Sedimentary pyrite formation — an update. Geochim. Cosmochim.Acta 48, 605–615.
Bidoglio, G., Gibson, P.N., Ogorman, M., Roberts, K.J., 1993. X-Ray-absorption spectro-scopy investigation of surface redox transformations of thallium and chromium oncolloidal mineral oxides. Geochim. Cosmochim. Acta 57, 2389–2394.
Birck, J.L., Barman, M.R., Capmas, F., 1997. Re–Os isotopic measurements at thefemtomole level in natural samples. Geostand. Newsl. 21, 19–27.
Burton, K.W., 2006. Global weathering variations inferred from marine radiogenicisotope records. J. Geochem. Explor. 88, 262–265.
Burton, K.W., Lee, D.C., Christensen, J.N., Halliday, A.N., Hein, J.R., 1999. Actual timing ofneodymium isotopic variations recorded by Fe–Mn crusts in the western NorthAtlantic. Earth Planet. Sci. Lett. 171, 149–156.
Christensen, J.N., Halliday, A.N., Godfrey, L.V., Hein, J.R., Rea, D.K., 1997. Climate andocean dynamics and the lead isotopic records in Pacific ferromanganese crusts.Science 277, 913–918.
Chu, N.C., Johnson, C.M., Beard, B.L., German, C.R., Nesbitt, R.W., Frank, M., Bohn, M.,Kubik, P.W., Usui, A., Graham, I., 2006. Evidence for hydrothermal venting in Feisotope compositions of the deep Pacific Ocean through time. Earth Planet. Sci. Lett.245, 202–217.
Cogne, J.P., Humler, E., 2004. Temporal variation of oceanic spreading and crustalproduction rates during the last 180 My. Earth Planet. Sci. Lett. 227, 427–439.
Cogne, J.P., Humler, E., 2006. Trends and rhythms in global seafloor generation rate.Geochem. Geophys. Geosyst. 7.
Corfield, R.M., 1994. Paleocene oceans and climate — an isotopic perspective. Earth-Sci.Rev. 37, 225–252.
Dalai, T.K., Ravizza, G.E., Peucker-Ehrenbrink, B., 2006. The Late Eocene Os-187/Os-188excursion: chemostratigraphy, cosmic dust flux and the Early Oligocene glaciation.Earth Planet. Sci. Lett. 241, 477–492.
Depaolo, D.J., Ingram, B.L., 1985. High-resolution stratigraphy with strontium isotopes.Science 227, 938–941.
Frank, M., 2002. Radiogenic isotopes: tracers of past ocean circulation and erosionalinput. Rev. Geophys. 40 art. no.-1001.
Frank, M., O'Nions, R.K., Hein, J.R., Banakar, V.K., 1999. 60 Myr records of major elementsand Pb–Nd isotopes from hydrogenous ferromanganese crusts: reconstruction ofseawater paleochemistry. Geochim. Cosmochim. Acta 63, 1689–1708.
Fung, I.Y., Meyn, S.K., Tegen, I., Doney, S.C., John, J.G., Bishop, J.K.B., 2000. Iron supply anddemand in the upper ocean. Glob. Biogeochem. Cycles 14, 281–295.
Gannoun, A., Burton, K.W., Birck, J.L., Allegre, C., Lee, D.C., Halliday, A.N., Hein, J.R., 2000.A Cenozoic record of the osmium isotope composition of seawater deduced from anindividual hydrogenetic Fe–Mn crust from the central Pacific OceanGoldschmidt.Cambridge Publications, Oxford.
307S.G. Nielsen et al. / Earth and Planetary Science Letters 278 (2009) 297–307
Halbach, P., Segl, M., Puteanus, D., Mangini, A., 1983. Co-fluxes and growth-rates inferromanganese deposits from central pacific seamount areas. Nature 304,716–719.
Hein, J.R., Schulz, M.S., Kang, J.K., 1990. Insular and submarine ferromanganesemineralization of the Tonga–Lau region. Mar. Min. 9, 305–354.
Hein, J.R., Yeh, H.W., Gunn, S.H., Sliter, W.V., Benninger, L.M., Wang, C.H., 1993. 2 majorcenozoic episodes of phosphogenesis recorded in equatorial Pacific seamountdeposits. Paleoceanography 8, 293–311.
Hein, J.R., Koschinsky, A., Bau, M., Manheim, F.T., Kang, J.-K., Roberts, L., 2000. Cobalt-rich ferromanganese crusts in the Pacific. In: Cronan, D.S. (Ed.), Handbook ofMarineMineral Deposits. CRC Press, Boca Raton.
Hemming, N.G., Hanson, G.N., 1992. Boron isotopic composition and concentration inmodern marine carbonates. Geochim. Cosmochim. Acta 56, 537–543.
Henderson, G.M., Burton, K.W., 1999. Using (U-234/U-238) to assess diffusion rates ofisotope tracers in ferromanganese crusts. Earth Planet. Sci. Lett. 170, 169–179.
Hilting, A.K., Kump, L.R., Bralower, T.J., 2008. Variations in the oceanic vertical carbonisotope gradient and their implications for the Paleocene–Eocene biological pump.Paleoceanography 23, PA3222.
Johnson, J.W., Oelkers, E.H., Helgeson, H.C., 1992. SUPCRT92 — a software package forcalculating the standard molal thermodynamic properties of minerals, gases,aqueous species, and reactions from 1 bar to 5000 bar and 0 °C to 1000 °C. Comput.Geosci. 18, 899–947.
Jones, C.E., Jenkyns, H.C., 2001. Seawater strontium isotopes, oceanic anoxic events, andseafloor hydrothermal activity in the Jurassic and Cretaceous. Am. J. Sci. 301, 112–149.
Kaiho, K., Saito, S., 1994. Oceanic-crust production and climate during the last 100-Myr.Terra Nova 6, 376–384.
Klemm, V., 2006. Osmium isotope stratigraphy of marine ferromanganese crusts. ETH,Zurich.
Klemm, V., Levasseur, S., Frank, M., Hein, J.R., Halliday, A.N., 2005. Osmium isotopestratigraphy of a marine ferromanganese crust. Earth Planet. Sci. Lett. 238, 42–48.
Klemm, V., Reynolds, B., Frank, M., Pettke, T., Halliday, A.N., 2007. Cenozoic changes inatmospheric lead recorded in central Pacific ferromanganese crusts. Earth Planet.Sci. Lett. 253, 57–66.
Krishnaswami, S.,1976. Authigenic transition-elements in Pacific Pelagic Clays. Geochim.Cosmochim. Acta 40, 425–434.
Kurtz, A.C., Kump, L.R., Arthur, M.A., Zachos, J.C., Paytan, A., 2003. Early Cenozoicdecoupling of the global carbon and sulfur cycles. Paleoceanography 18.
Lee, D.C., Halliday, A.N., Hein, J.R., Burton, K.W., Christensen, J.N., Gunther, D., 1999.Hafnium isotope stratigraphy of ferromanganese crusts. Science 285, 1052–1054.
Levasseur, S., Frank, M., Hein, J.R., Halliday, A., 2004. The global variation in the ironisotope composition of marine hydrogenetic ferromanganese deposits: implica-tions for seawater chemistry? Earth Planet. Sci. Lett. 224, 91–105.
Ling, H.F., Burton, K.W., Onions, R.K., Kamber, B.S., vonBlanckenburg, F., Gibb, A.J., Hein, J.R.,1997. Evolution of Nd andPb isotopes inCentral Pacific seawater from ferromanganesecrusts. Earth Planet. Sci. Lett. 146, 1–12.
Millero, F.J., 2002. Seawater as an electrolyte. In: Gianuzza, A., Pelizetti, E., Sammatano, S.(Eds.), Chemistry of Marine Water and Sediments. Springer-Verlag.
Nielsen, S.G., Rehkämper, M., Baker, J., Halliday, A.N., 2004. The precise and accuratedetermination of thallium isotope compositions and concentrations for watersamples by MC-ICPMS. Chem. Geol. 204, 109–124.
Nielsen, S.G., Rehkämper,M., Porcelli, D., Andersson, P.S., Halliday, A.N., Swarzenski, P.W.,Latkoczy, C., Günther, D., 2005. The thallium isotope composition of the uppercontinental crust and rivers — an investigation of the continental sources ofdissolved marine thallium. Geochim. Cosmichim. Acta 69, 2007–2019.
Nielsen, S.G., Rehkämper, M., Norman,M.D., Halliday, A.N., Harrison, D., 2006a. Thalliumisotopic evidence for ferromanganese sediments in the mantle source of Hawaiianbasalts. Nature 439, 314–317.
Nielsen, S.G., Rehkämper, M., Teagle, D.A.H., Alt, J.C., Butterfield, D., Halliday, A.N.,2006b. Hydrothermal fluid fluxes calculated from the isotopic mass balance ofthallium in the ocean crust. Earth Planet. Sci. Lett. 251, 120–133.
Nielsen, S.G., Rehkämper, M., Brandon, A.D., Norman, M.D., Turner, S., O'Reilly, S.Y., 2007.Thallium isotopes in Iceland and Azores lavas — implications for the role of alteredcrust and mantle geochemistry. Earth Planet. Sci. Lett. 264, 332–345.
Nielsen, S.G., Peacock, C.L., Halliday, A.N., 2008. Investigation of Thallium isotopefractionationduring sorption toMnoxides. Geochim.Cosmochim.Acta 72, A681-A681.
Paytan, A., Kastner, M., Campbell, D., Thiemens, M.H., 1998. Sulfur isotopic compositionof Cenozoic seawater sulfate. Science 282, 1459–1462.
Paytan, A., Kastner, M., Campbell, D., Thiemens, M.H., 2004. Seawater sulfur isotopefluctuations in the cretaceous. Science 304, 1663–1665.
Peucker-Ehrenbrink, B., Ravizza, G., 2000. The marine osmium isotope record. TerraNova 12, 205–219.
Piotrowski, A.M., Lee, D.C., Christensen, J.N., Burton, K.W., Halliday, A.N., Hein, J.R.,Gunther, D., 2000. Changes in erosion and ocean circulation recorded in the Hfisotopic compositions of North Atlantic and Indian Ocean ferromanganese crusts.Earth Planet. Sci. Lett. 181, 315–325.
Ravizza, G., Peucker-Ehrenbrink, B., 2003. The marine Os-187/Os-188 record of theEocene–Oligocene transition: the interplay of weathering and glaciation. EarthPlanet. Sci. Lett. 210, 151–165.
Ravizza, G., Norris, R.N., Blusztajn, J., Aubry, M.P., 2001. An osmium isotope excursionassociated with the late Paleocene thermal maximum: evidence of intensifiedchemical weathering. Paleoceanography 16, 155–163.
Rehkämper, M., Halliday, A.N., 1999. The precise measurement of Tl isotopic compositionsby MC-ICPMS: application to the analysis of geological materials and meteorites.Geochim. Cosmochim. Acta 63, 935–944.
Rehkämper, M., Nielsen, S.G., 2004. The mass balance of dissolved thallium in theoceans. Mar. Chem. 85, 125–139.
Rehkämper, M., Frank, M., Hein, J.R., Porcelli, D., Halliday, A., Ingri, J., Liebetrau, V., 2002.Thallium isotope variations in seawater and hydrogenetic, diagenetic, andhydrothermal ferromanganese deposits. Earth Planet. Sci. Lett. 197, 65–81.
Rehkämper, M., Frank, M., Hein, J.R., Halliday, A., 2004. Cenozoic marine geochemistryof thallium deduced from isotopic studies of ferromanganese crusts and pelagicsediments. Earth Planet. Sci. Lett. 219, 77–91.
Rohl, U., Westerhold, T., Bralower, T.J., Zachos, J.C., 2007. On the duration of thePaleocene–Eocene thermal maximum (PETM). Geochem. Geophys. Geosyst. 8.
Sassani, D., Shock, E.L., 1998. Solubility and transport of platinum-group elements insupercritical fluids: summary and estimates of thermodynamic properties forruthenium, rhodium, palladium, and platinum solids, aqueous ions, and complexesto 1000 °C and 5 kbar. Geochim. Cosmochim. Acta 62, 2643–2671.
Schauble, E.A., 2007. Role of nuclear volume in driving equilibrium stable isotopefractionation of mercury, thallium, and other very heavy elements. Geochim.Cosmochim. Acta 71, 2170–2189.
Schedlbauer, O.F., Heumann, K.G., 2000. Biomethylation of thallium by bacteria and firstdetermination of biogenic dimethylthallium in the Ocean. Appl. Organometal.Chem. 14, 330–340.
Segl, M., Mangini, A., Bonani, G., Hofmann, H.J., Nessi, M., Suter, M., Wolfli, W., Friedrich,G., Pluger, W.L., Wiechowski, A., Beer, J., 1984. Be-10-dating of a manganese crustfrom Central North Pacific and implications for ocean palaeocirculation. Nature 309,540–543.
Shannon, R.D., 1976. Revised effective ionic radii and systematic studies of interatomicdistances in halides and chalcogenides. Acta Crystallogr. A32, 751–767.
Shvarov, Y.V., Bastrakov, E.N., 1999. HCh: a software package for geochemicalequilibrium modelling. User's guide.
Siebert, C., Nägler, T.F., von Blanckenburg, F., Kramers, J.D., 2003. Molybdenum isotoperecords as a potential new proxy for paleoceanography. Earth Planet. Sci. Lett. 211,159–171.
Sillen, L.G., 1964. Stability constants of metal-ion complexes. Spec. Publ. Chem. Soc. 25(Supplement No. 1).
Storey, M., Duncan, R.A., Swisher, C.C., 2007. Paleocene–Eocene thermal maximum andthe opening of the northeast Atlantic. Science 316, 587–589.
Sverjensky, D., Shock, E.L., Helgeson, H.C., 1997. Prediction of the thermodynamicproperties of aqueousmetal complexes to 1000 °C and 5 kbar. Geochim. Cosmochim.Acta 61, 1359–1412.
Thomson, J., Carpenter, M.S.N., Colley, S., Wilson, T.R.S., Elderfield, H., Kennedy, H., 1984.Metal accumulation rates in Northwest Atlantic pelagic sediments. Geochim.Cosmochim. Acta 48, 1935–1948.
van de Flierdt, T., Frank, M., Lee, D.-C., Halliday, A.N., 2002. Glacial weathering and thehafnium isotope composition of seawater. Earth Planet. Sci. Lett. 201, 639–647.
Westerhold, T., Rohl, U., Raffi, I., Fornaciari, E.,Monechi, S., Reale, V., Bowles, J., Evans, H.F.,2008. Astronomical calibration of the Paleocene time. Palaeogeogr. Palaeoclimatol.Palaeoecol. 257, 377–403.
Xu, X.Q., Lithgow-Bertelloni, C., Conrad, C.P., 2006. Global reconstructions of Cenozoicseafloor ages: implications for bathymetry and sea level. Earth Planet. Sci. Lett. 243,552–564.
Zachos, J., Pagani,M., Sloan, L., Thomas, E., Billups, K., 2001. Trends, rhythms, and aberrationsin global climate 65 Ma to present. Science 292, 686–693.
Copyright © 2022 FDOKUMEN