Deregulation of wholesale petrol prices: what happened to capital city petrol prices
Upload
independentCategory
view
0download
0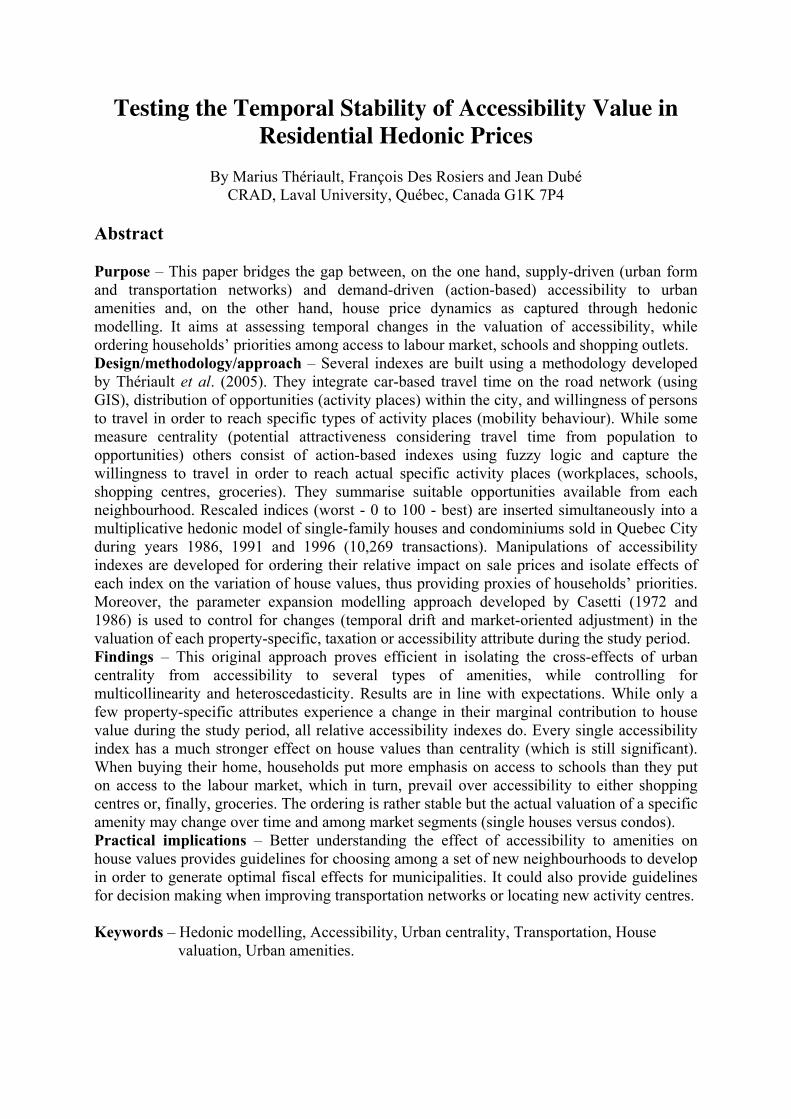
Testing the Temporal Stability of Accessibility Value in Residential Hedonic Prices
By Marius Thériault, François Des Rosiers and Jean Dubé
CRAD, Laval University, Québec, Canada G1K 7P4 Abstract Purpose – This paper bridges the gap between, on the one hand, supply-driven (urban form and transportation networks) and demand-driven (action-based) accessibility to urban amenities and, on the other hand, house price dynamics as captured through hedonic modelling. It aims at assessing temporal changes in the valuation of accessibility, while ordering households’ priorities among access to labour market, schools and shopping outlets. Design/methodology/approach – Several indexes are built using a methodology developed by Thériault et al. (2005). They integrate car-based travel time on the road network (using GIS), distribution of opportunities (activity places) within the city, and willingness of persons to travel in order to reach specific types of activity places (mobility behaviour). While some measure centrality (potential attractiveness considering travel time from population to opportunities) others consist of action-based indexes using fuzzy logic and capture the willingness to travel in order to reach actual specific activity places (workplaces, schools, shopping centres, groceries). They summarise suitable opportunities available from each neighbourhood. Rescaled indices (worst - 0 to 100 - best) are inserted simultaneously into a multiplicative hedonic model of single-family houses and condominiums sold in Quebec City during years 1986, 1991 and 1996 (10,269 transactions). Manipulations of accessibility indexes are developed for ordering their relative impact on sale prices and isolate effects of each index on the variation of house values, thus providing proxies of households’ priorities. Moreover, the parameter expansion modelling approach developed by Casetti (1972 and 1986) is used to control for changes (temporal drift and market-oriented adjustment) in the valuation of each property-specific, taxation or accessibility attribute during the study period. Findings – This original approach proves efficient in isolating the cross-effects of urban centrality from accessibility to several types of amenities, while controlling for multicollinearity and heteroscedasticity. Results are in line with expectations. While only a few property-specific attributes experience a change in their marginal contribution to house value during the study period, all relative accessibility indexes do. Every single accessibility index has a much stronger effect on house values than centrality (which is still significant). When buying their home, households put more emphasis on access to schools than they put on access to the labour market, which in turn, prevail over accessibility to either shopping centres or, finally, groceries. The ordering is rather stable but the actual valuation of a specific amenity may change over time and among market segments (single houses versus condos). Practical implications – Better understanding the effect of accessibility to amenities on house values provides guidelines for choosing among a set of new neighbourhoods to develop in order to generate optimal fiscal effects for municipalities. It could also provide guidelines for decision making when improving transportation networks or locating new activity centres. Keywords – Hedonic modelling, Accessibility, Urban centrality, Transportation, House
valuation, Urban amenities.
Marius Thériault, François Des Rosiers & Jean Dubé – Testing the temporal stability of accessibility value in residential hedonic prices
European Regional Science Association – 2006 Annual Conference – Volos, Greece 2
1. Introduction
Following an approach developed by Thériault et al. (2005), this research bridges the gap between, on the one hand, supply-driven (urban form and transportation networks) and demand-driven (action-based) accessibility to urban amenities and, on the other hand, house price dynamics as captured through hedonic modelling. It aims at assessing temporal changes in the valuation of accessibility, while ordering households’ priorities among access to labour market, schools and shopping outlets. An original methodology for integrating simultaneously several accessibility indexes within a global city-wide hedonic model of house values while controlling for multicollinearity is developed, applied to the city of Quebec and results are discussed in light of people’s valuation of accessibility to specific types of urban amenities. Moreover, a parameter expansion method developed by Casetti (1972 & 1986) to integrate space-related variations of property-specifics within hedonic models is also applied to tag any temporal drift and/or market-specific variation of property-specifics and accessibility indexes in Quebec City, from 1986 to 1996.
The hedonic modelling approach (Rosen, 1974) aims at explaining property prices on the basis of their physical and neighbourhood-related characteristics. When studying housing markets, its purpose is to evaluate the respective contribution of each attribute of the residential bundle to market value (Can 1990, Dubin 1998), using multiple regression analysis. While hedonic models have long proved their usefulness as an analytical device, previous research has shown that substantial portion of price variability remains unexplained (Anselin & Can, 1986; Dubin & Sung, 1987; Can, 1993). Moreover, the appropriate neighbourhood factors needed to improve hedonic models may change over time, among locations and between market segments, making it very difficult to integrate all significant factors within a unified spatio-temporal model for a given city. Finally, multicollinearity of model attributes, as well as structural heteroskedasticity, temporal and spatial autocorrelation among residuals is highly detrimental to the stability of regression coefficients (Anselin & Rey, 1991; Can & Megbolugbe, 1997; Basu & Thibodeau, 1998; Kestens et al., 2004 & 2006).
Casetti’s expansion method has been used in numerous geographical applications for investigating spatial and temporal drifts, especially in the study of migration and labour market transformation. Discussing issues of spatial autocorrelation in regression models, Anselin (1990, p. 186) suggests that: “With respect to estimation, the best-known approach is probably the spatial expansion method of Casetti (1972 & 1986), which introduces models of spatial drift in the regression coefficients.” Can (1990) was probably the first to use it in the context of hedonic modelling. Thériault et al. (2003) extended uses of this procedure, measuring the spatial drift of several neighbourhood quality indexes considering also nearest neighbours for the hedonic modelling of several housing attributes.
Accessibility to urban amenities is a complex concept which totally pervades land planning issues. While closely intertwined, accessibility and mobility notions are jointly needed to understand transportation and urban dynamics. According to Hanson (1995, p. 4): “Accessibility refers to the number of opportunities, also called activity sites, available within a certain distance or travel time. Mobility refers to the ability to move between different activity sites.” Therefore, mobility can be seen as the consequence of the spatial separation between land use types and, accessibility is highly dependent upon the specific context: availability of transportation means, spatial distribution of amenities, technology, personal values, economic and physical constrains (e.g. handicapped persons), sociological acceptability, weather, etc. Analysing relationships between demand (attractiveness of activity sites in terms of suitable goods and services), offer (spatial distribution of opportunities related to transportation networks and services) and behaviour (stated and revealed preferences of persons and households) clearly improves understanding of mobility, especially while jointly considering home location, mode choices/constrains and activity-trip chaining (Vandersmissen et al., 2003 & 2004).
However, when analysing mobility, accessibility and housing markets, perceptual dimensions, driven by preferences and actual behaviour of people, are at stake and depend on self valuation of time, ease of access to various types of services and ability/willingness to pay premium for a better home location, meaning making a higher bid on land value. These values and willingness define specific utility functions which are somewhat different for each household, but could likely be differentiated
Marius Thériault, François Des Rosiers & Jean Dubé – Testing the temporal stability of accessibility value in residential hedonic prices
European Regional Science Association – 2006 Annual Conference – Volos, Greece 3
among social groups. They are related to specific constraints of individuals and households, including economic status (employment status and income), motorization, family structure and life cycle. For example, a lone person has more freedom for choosing his home location than a dual-earner couple with children, since the latter needs more living area and must consider the overall needs of all family members while trying to minimise housing and travel costs simultaneously. The resulting negotiation affects home location choices and, by aggregation of individual decisions, housing markets as a whole.
Thus, from a theoretical perspective, we may argue that, for consumers, choosing home location is a long-term multi-criteria decision process during which efficiency of access to a large set of urban amenities plays an important role. Therefore, we can expect a complex bundle of accessibility criteria to be integrated in the home location decision in order to fulfil large set of needs: going to work (more complex for dual-earner couples), going to school for children, going to shopping facilities, buying some foods at the grocery, having leisure, accessing health services, etc. Obviously, all those amenities are not evenly distributed within the city; they do not even show similar spatial distributions, but can be accessed using a very limited and common set of transportation networks (walk, car, public transit, etc.). This is exactly where the issue arises for hedonic modelling; the purpose-specific accessibility indexes are mutually highly correlated (rely on the same networks) and generate strong multicollinearity when more that one or two indicators of centrality and/or accessibility are used concomitantly in regressions. Is it possible to overcome this issue in order to study how people rank and value specific accessibilities? This paper shows how it could be done.
In 1959, Hansen reported a strong correlation between a gravity-based centrality index and the distribution of population, jobs and shops in Washington. Research on the application of gravity models in urban studies thrived during the seventies (Curry, 1972; Johnston, 1973). Later, Fotheringham (1986) developed the behavioural theories needed to analyze competing destinations. Measuring centrality and accessibility improves our understanding about inequities and is paramount when implementing new facilities or equipments. Usually, accessibility is seen as an interaction potential mostly driven by socio-economic forces (Handy & Neimeier, 1997). Such a definition puts the main focus on consumption considering a cost/benefit ratio (utility theory) where travel expenses are counterbalanced by opportunities offered by each destination. Then, the accessibility potential of a location could be expressed as a function of the number of opportunities at each candidate destination considering the effect of distance (or travel time) between departure (home) and destination (activity) locations.
According to Tiefelsdorf (2003), important parts of the spatial heterogeneity in the distance decay function can be explained exclusively by spatial structure effects which should be controlled in order to obtain appropriate statistics. This heterogeneity in the distribution of objects in space and the truncation effects along edges of study areas induce issues in spatial analysis. Consequently, distance distributions have small means and positive skew in the centre of study areas, whereas the same parameters show larger means and negative skew on the margins. When considering travel time, distribution form is partly related to the position within the city and partly linked to the topological and hierarchical structure of the transportation networks. Those biases are common to all measures of distance (or travel time) and should be controlled when designing accessibility and centrality indexes.
Then, previous findings raise a four-fold issue. Accessibility is specific to each type of amenities (e.g. workplaces versus leisure places) and is not perceived in a homogeneous way by everybody (e.g. families and lone adults). Being significantly different (Thériault et al., 2005), those demands for accessibility likely have different marginal effects on location rent and are likely not to be summarized using only one or two centrality/accessibility indexes. However, the actual dominant method to assess the specific value of such externalities, that is hedonic modelling, is based on multiple regression analysis, which has strong limitations (multicollinearity issue) for the inclusion of several somewhat spatially correlated indexes. Moreover, are those accessibility valuations changing over time? Are there temporal drifts impeding their use for the long-term assessment of location rent? Presenting and discussing empirical investigation aimed at improving our ability to circumvent such methodological issues is the main purpose of this paper.
Marius Thériault, François Des Rosiers & Jean Dubé – Testing the temporal stability of accessibility value in residential hedonic prices
European Regional Science Association – 2006 Annual Conference – Volos, Greece 4
Section 2 presents a brief survey of the current literature on valuation of accessibility using hedonic modelling. Section 3 focuses on analyzing mobility behaviour of people using Origin-Destination (OD) surveys, modelling trips for estimating travel time and on measuring their elasticity on travel time to reach opportunities. It summarises procedures to compute indexes to assess centrality of residential neighbourhoods and specific accessibility to various types of opportunities, and presents a general strategy for integrating several accessibility indexes within a single hedonic model while avoiding multicollinearity issues.
Section 4 shows empirical results of jointly assessing various types of accessibility for the single-family housing market of Quebec City from 1986 to 1996. Considering 10,269 houses (7,478 detached houses, 1,768 row or attached houses, and 1,023 condominium apartment units) sold in 1986 (3,887), 1991 (4,111) and 1996 (2,271), the hedonic modelling procedure integrates several centrality and accessibility indexes, while searching for potential temporal drift or differences related to specific market segments. Considered opportunities include labour market, schools, shopping outlets (mostly shopping centres) and groceries.
Main findings from this research are analyzed and discussed in Section 5. Special emphasis is laid on the spatial structure of accessibility indices and strategies to avoid multicollinearity in hedonic modelling while combining several indices for ordering their effects on housing valuation. While spatial autocorrelation is still present in the model residuals, resorting to multiple indices allows for a deeper investigation of households’ strategy and willingness to pay for better accessibility to specific urban amenities.
Finally, Section 6 concludes the paper and provides suggestions for future research.
2. Literature review
Analysing accessibility requires a spatio-temporal framework that encompasses various aspects of individual behaviour relative to daily mobility patterns and to home location choices in the long term. It is composed of a large corpus of disaggregated models which are rooted in the spatio-temporal prism (Hägerstrand, 1970; Lenntorp, 1978), in micro-economy, in cognitive science, and in discrete choice models (Ettema & Timmermans, 1999). Aimed at studying individual behaviours, Hägerstrand’s time geography focuses on the feasible sets of activity-travel opportunities varying in time and space according to the actual location of departure, time window needed to realise the activity and the acceptable travel time to reach suitable sites. Afterwards, decisions are aggregated among groups of peoples or neighbourhoods, in order to model intra-urban traffic and transportation mode choices (Timmermans & Golledge, 1990).
Several urban models are based on the concept of centrality. In the monocentric city, the price of land is higher at the CBD (Alonso’s bid rent) and gradually decreases with distance according to a negative exponential function whose slope depends upon the supply of land available for development and the quality of the transportation network. According to McMillen (2003), decades of extensive urban sprawl in North American cities did not challenge the prominence of the centrality concept, as shown by his empirical study on Chicago. While several authors have stressed the salient effect of proximity to services and to urban externalities in the shaping of real estate values (Guntermann & Colwell, 1983; Colwell et al., 1985; Grieson & White, 1989; Sirpal, 1994; Des Rosiers et al., 1996 & 2001; Kestens et al., 2004), not all authors agree on the strategic influence of accessibility upon house prices and residential mobility (McGreal et al., 1999).
However, considering the complexity of the urban fabric and the polycentric pattern of most cities, using mere distances to the CBD falls short of measuring all relevant facets of accessibility (Jackson, 1979; Dubin & Sung, 1987; Hoch & Waddell, 1993). Although it could be argued that in modern cities, social gradients are progressively prevailing over access factors as major housing price determinants. However, the faulty specification of accessibility attributes may well explain their poor performances. Indeed, most of these studies actually resort to Euclidean and road distances or travel times to measure accessibility-related externalities although minimum travel time and minimum
Marius Thériault, François Des Rosiers & Jean Dubé – Testing the temporal stability of accessibility value in residential hedonic prices
European Regional Science Association – 2006 Annual Conference – Volos, Greece 5
walking distance are also used (Bateman et al., 2001). But, are distances or travel times alone sufficient to model accessibility?
In the long-term, several factors impact on residential location behaviour, which is highly related to household structure and cycles (Nijkamp et al., 1993). As social diversity is increasing within western cities, likelihood of simple decrease of housing prices gradient showing monocentric pattern is probably lowering. Distance from the CBD as the sole measure of access to employment and consumption opportunities becomes less relevant because households actually value access to places distributed at various locations within the city. For example, a recent study of shopping trip patterns in Quebec City (Biba et al., 2005) reported the rapid growth of market share for big boxes and power centres (remote locations close to motorways interchanges) competing with traditional shopping centres located close to the older neighbourhoods. Therefore, assessing accessibility requires the measurement of not only distance and travel time to a large set of amenities, but also considering various transportation modes and people’s preference sets. For Baltimore, Dubin and Sung (1987) have found that the influence range of suburban employment centres is limited but is affecting housing prices within a two kilometre radius. Then, considering the co-existence of many local activity centres in remote locations, estimating agglomeration-wide rent gradients may yield misleading results on the influence of centrality on housing prices.
Some studies use OD surveys to look at accessibility (mostly to the labour market). In his study on metropolitan Washington, D.C., Levinson (1996) analyzes commuter trips patterns and finds that, by balancing accessibility, the suburbanization of jobs maintains stability in commuting durations despite rising congestion, increasing trip lengths, and increased work and non-work trip making. In Quebec City, Vandersmissen et al. (2003) found travel time gradients from home to work varying within directional corridors mostly related to the motorways network. In Atlanta, Helling (1996) explores the effect of residential gravity accessibility by automobile to all employment in the metropolitan region on the quantity and nature of travel by men and women. He reports that while individuals and households living in more accessible neighbourhoods spend significantly less time in travel, this effect holds primarily for employed men. He concludes that accessibility effect on travel do not affect everyone and that, while gravity measures of accessibility may help planners predict the results of planned and unplanned changes when combined with other information, they do not predict travel behaviour adequately when used alone. For the Dallas-Fort Worth region (Texas), Srour et al. (2002) developed a model where a series of both general (centrality) and specific accessibility indices were related to property values for both single-family dwellings and commercial units. They conclude that usual centrality measures do not perform that well, while job accessibility indices impact positively on residential land values.
In Quebec City, Des Rosiers et al. (2000) have shown that simulated assessment of road distances and travel times could significantly improve hedonic modelling. Although only major service poles were used for that purpose, namely the CBD, main workplaces, schools and shopping centres, multicollinearity was highly detrimental to the appropriate estimation of accessibility-derived benefits. Using principal component analysis helps solving the problem while sorting out regional-level and neighbourhood-level accessibility contributions to house values. But even so, “physical or supply-driven” measures of accessibility based on distance and travel time may leave more “action-based or demand-driven”, and yet fundamental dimensions of mobility behaviour unaccounted for in the price determination process. Indeed, households’ trip patterns are subject to economic, family and age constraints which differ among market segments; hence the relevance of capturing their action-based, rather than mere physical, accessibility. Following this idea, Thériault et al. (2005) were using fuzzy logic to summarize the micro-spatial behaviour of trip durations from the Quebec metropolitan area OD survey of 2001. Taking into account various types of households and a large set of activity sites, this method allows estimation of the actual willingness-to-travel of urban dwellers, thereby building more subtle and comprehensive accessibility indices. Centrality and accessibility indexes developed for this previous paper are the basis for the current research and will be presented in the next section. Their integration in hedonic models was tested and found significant for all the activity purpose under examination. However, their mathematical specification impedes their simultaneous inclusion in a
Marius Thériault, François Des Rosiers & Jean Dubé – Testing the temporal stability of accessibility value in residential hedonic prices
European Regional Science Association – 2006 Annual Conference – Volos, Greece 6
single global hedonic model. Thus, improving accessibility index specification for hedonic modelling is also among the specific objectives of this paper.
3. Methodological approach
This section presents methods of assessing centrality and accessibility through indexes and their multi-criteria integration in hedonic price modelling, eventually considering relevant differences in the valuation of amenities in time and among market segments. Section 3.1 presents OD survey characteristics and procedures used to estimate travel time using a topological directional street network within geographical information system (GIS). Section 3.2 gives an overview of hypotheses to be tested in this paper. Section 3.3 is about the modelling of urban centrality and accessibility to urban amenities that will be integrated in a city-wide hedonic model of the single-family house transactions observed in Quebec City (Section 3.4) at three points in time (1986, 1991 and 1996). The rationale of considering three points in time is searching for any temporal drift in the valuation of accessibility and/or specific attributes of homes by the buyers during that period. That is, testing for change of preferences in the Quebec City single-family housing market during that decade.
3.1 Analysing people’s travel behaviour using OD surveys and transportation modelling
From September 18th to December 17th of 2001, the Ministry of Transport of Quebec (MTQ) and the Quebec City Transit Authority (RTC) were conducting an OD survey involving 68,121 persons living in 27,839 households and reporting 174,243 trips they made to reach activity sites during a typical week day (Monday to Friday). Each household has its home located on a map (GIS) using street addresses. Each person belongs to a household and is characterized by his/her age, gender, occupation and ownership of a car driver licence. A procedure was used in order to assign a role for each member of every household: lone adult, child (less than 16 years or less than 21 years and still at school), adults living in couple, and adult living in multi-generational (two adults with more than 15 years of difference of age) or living in multiple adults households. Analyzing combinations of roles, it was further possible to classify households: lone person, childless couple, two-parent family (father and mother with children), lone-parent family (father or mother with children), and other households.
The origin and destination addresses of each trip are located in GIS using geocoding methods yielding accurate spatial references (specific building or city block). Each trip specifies a purpose (activity), a transportation mode and a departure time. However, arrival time and trip duration were not taken down during the interview. Therefore, a computer procedure was developed (Thériault et al., 1999) in order to estimate the duration of trips. A GIS-operated topological street network made of 29,035 road segments defines a directional transportation graph providing speed and impedance (crossing time). A simulation procedure operated within TransCAD (transportation GIS) finds the best route (using the Dijkstra’s algorithm) and computes, for each trip, its total length (kilometres) and duration (minutes).
In the Quebec Metropolitan Area (QMA), trips using cars (driver or passenger) predominates over other modes (73.3% cars, 13.2% bus, 11.4% walk, 1.7% other modes). Then, we decided to use only car travel times for the mobility analyses. Considering that urban sprawl is prevailing in Quebec City (489,820 persons sparsely distributed over 548.8 square kilometres), we argue that when choosing their new neighbourhood, typical home buyers are mainly considering accessibility to amenities using cars. Moreover, with a motorway network totalling 21.7 kilometres per 100,000 inhabitants, the QMA is among the most heavily equipped cities of North-America. Among the 174,243 trips reported during the OD survey, 128,461 were made using cars. Of them, 29,602 car-based trips were originating from residential areas within Quebec City limits. Some trip purposes (to work, to school, to shopping, to grocery) were retained for computing statistics reported in Table 1. Other trips, including those for returning home or for driving someone else were excluded.
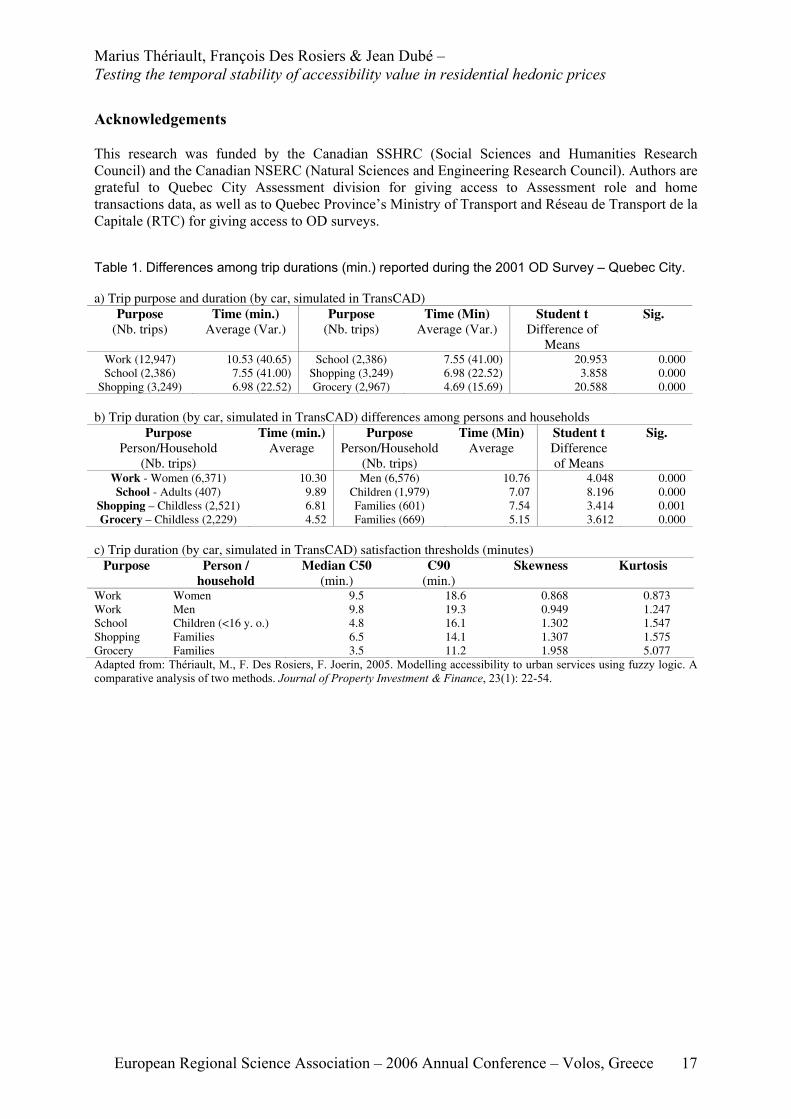
Average travel time for each trip purpose was computed and Student t tests were used to detect significant overall differences over their means (Table 1a). Distributions being slightly skewed, Wilcoxon signed ranks tests were made to confirm results of Student tests. As well, Student tests between average travel times were done for each trip purpose, considering various types of persons
Marius Thériault, François Des Rosiers & Jean Dubé – Testing the temporal stability of accessibility value in residential hedonic prices
European Regional Science Association – 2006 Annual Conference – Volos, Greece 7
(women versus men, adults versus children) and households (childless versus families). Summary results are reported in Table 1b, while more details are reported in Thériault et al. (2005).
Findings confirm that mean durations are substantially different in several instances: work-oriented trips namely (10.53 minutes) are much longer than trips to school (7.55), to shopping (6.98) and to grocery (4.69). The differences remain significant for each pair of amenities. Mean differences in trip duration with respect to individual and household profiles are generally weaker. The difference between women and men for work-oriented trips is congruent with previous findings in several North-American cities, but was steadily decreasing during the last decades in Quebec City (Vandersmissen et al., 2003). It is also clear that elasticity for longer trips to reach shops and groceries is higher for families than for childless households. This is likely related to the higher diversification of their needs implying longer trips to reach larger shops and big boxes. That is in line with previous findings of Biba et al. (2006) about shopping trips (discrete choice models for destinations) in QMA.
Observed differences on travel times being highly significant among purposes, persons or households, one may expect similar effects of the valuation of accessibility to corresponding opportunity sites by the same people when they choose residential location and buy their home. Thériault et al. (2005) already report findings in line with these expectations using a dataset of 952 single-family houses sold in Quebec City from 1993 to 1996. For this paper, we want to go a step further, considering a larger set of transactions (10,269) distributed over a decade, including a wider range of products (from houses to condominium apartments) and combining several accessibility features in one single hedonic model.
3.2 Hypotheses
The two main hypotheses of this research are:
[1] Willingness-to-travel to reach activity sites being significantly different among trip purposes, willingness-to-pay for better accessibility when buying a home is also significantly different among corresponding kinds of amenities, yielding several complementary valuations of accessibility.
[1a] Hedonic modelling can be used for measuring valuation differences among kinds of amenities and for ordering preferences of households.
[1b] Specific valuations of accessibility are different from (and complement) conventional centrality measurements.
[2] For a given city, these preferences of households and their ordering are rather stable over time (no significant temporal drift) and can be used to estimate location rent over the long term.
[2a] However, valuation of centrality and accessibility is likely to be different when considering some specific segments of the housing market (e.g. detached house versus condominium) because they belong to different household types (e.g. families versus lone persons or childless couples) showing weak, but still significant, differences in their willingness-to-travel.
[2b] Taking into consideration the general trend of housing prices within a city, if there is any residual temporal drift on the valuation of a housing attribute, it will more likely change the valuation of property specifics rather than accessibility to urban services because the former are more sensitive to fashion while the latter are more rooted to daily needs.
In order to test these hypotheses, a two-step procedure was using transportation simulation for estimating accessibility indexes for various kinds of amenities and to integrate them into hedonic modelling of the single-family housing market. The first step consisted in modelling urban centrality and accessibility from residential neighbourhoods to amenities using fuzzy logic, the purpose being to map differences of accessibility to urban services among neighbourhoods and types of activities (Section 3.3). GIS simulations were computing weighted sum of all satisfactory opportunities for each neighbourhood and accessibility indexes were built for each kind of amenity providing the ratio of the local sum of opportunities over the highest score found in the city (best location). Finally, modelling
Marius Thériault, François Des Rosiers & Jean Dubé – Testing the temporal stability of accessibility value in residential hedonic prices
European Regional Science Association – 2006 Annual Conference – Volos, Greece 8
the impact of centrality/accessibility on sale prices allows for implicitly measuring the readiness of property buyers to pay for accessibility to specific urban features (Section 3.4). At that step, several indexes of centrality and accessibility were jointly included in the hedonic model, eventually controlling for temporal drift and/or effect of market segmentation.
3.3 Modelling urban centrality and accessibility
This section summarise a modelling procedure already presented in Thériault et al. (2005).
In order to provide a classical assessment of centrality, a gravity-based model of interaction flows proposed by Tiefelsdorf (2003) was retained. This centrality index estimates the strength of the links between any pair of residential and activity places taking into consideration volumes of activity at each place (potentials in population/opportunities) and inverse distance (travel time by car) between locations (gravitational effect).
For actual modelling in GIS, each OD location was assigned to one cell in the 500 metres-radius hexagonal grid covering the entire QMA. This yielded 563 residential grid cells within Quebec City and 533 activity cells (workplaces and other amenities) within the QMA. Each cell-to-cell travel time was modelled in TransCAD using the street network, taking on the one hand, the local street corner closer to the largest number of houses sold between 1987 and 1996 for trip origin and, on the other hand, the local street corner closer to the activity place holding the largest expanded number of reported trips during the OD survey as the destination point. This ensures non-zero estimates of travel time even if residential and activity grid cells are the same. Moreover, in order to correctly estimate residential and activity potentials of each cell, the OD data were expanded (Thériault & Des Rosiers, 2004) in order to estimate the total population (Pi) and the total number of activity opportunities (Pj).
The formula used to compute centrality index appear in Table 2. Actual exponents used to weight effects were derived from empirical data. The regression model is highly significant (Adj. R Square = 0.207; F = 1113) yielding specific values for parameters λ (1.36567), p
oλ (0.09279), pdλ (0.15514)
and dλ (-0.31144). Last equation rescales M (estimated total potential flow) values between 0 and 100, using the city-wide highest local potential flow (most central location) as the denominator. Figure 1 displays a map of this centrality index (interaction potential) over the 500 metres-radius grid cells. Actual locations of the 10,269 transactions later used for hedonic modelling in Section 3.4 are displayed on this same map showing their dispersion all over residential neighbourhoods.
Perception of accessibility changes with the valuation each person puts on each activity and destination suitability. Therefore, travel time is a derived demand (Axhausen & Gärling, 1992). As pointed out by Kim & Kwan (2003), accessibility measurements should incorporate travel time thresholds because people adjust their willingness to travel according to the duration of both activities and trips. It is therefore necessary to consider “thresholds on activity participation time and travel time in order to identify a meaningful opportunity set when evaluating space-time accessibility.” (Kim & Kwan, 2003, p. 76). Developing a methodology associating trip duration thresholds (estimated from revealed or stated preferences) and physical simulation of best-suited routes can thus enhance measurement of accessibility. With this in mind, we define accessibility as the ease with which persons, living at a given location, can move to reach activities and services which they consider as most important.
The importance people give to activities can be derived from their actual travel behaviour and approximated using OD surveys. Table 1c provides information (median, 90th percentile, skewness and kurtosis) about the statistical distributions of travel time (minutes) for women and men going to work, for children going to school and for families doing shopping and grocery. Given the fact that departure from normal is moderate for all but one (grocery) distributions, median and 90th percentile can be used as thresholds to approximate the likeliness for some specific trip duration to be acceptable for a specific purpose and a specific group of persons. If a GIS-simulated trip duration is less than the median of observed trips during the OD survey, we qualify the associated opportunity destination as satisfactory; if the trip duration is higher than the 90th percentile, we consider that the associated service location is irrelevant; finally, for an in-between situation, we use fuzzy logic interpolation to
Marius Thériault, François Des Rosiers & Jean Dubé – Testing the temporal stability of accessibility value in residential hedonic prices
European Regional Science Association – 2006 Annual Conference – Volos, Greece 9
qualify the suitability of the associated destination. Table 2 presents the set of equations used to estimate the accessibility indexes. Again, the sum of raw opportunities (A: expanded number of trips for that specific purpose reported by activity place during the OD survey weighted using fuzzy logic) is normalised considering the best place in town (the most accessible cell for the given activity; it could be – and generally is – different among activities). Using such a procedure we obtain what we call action-based accessibility because it takes into consideration actual travel behaviour of a group of persons in order to approximate the likelihood they would perceive a given destination as practicable. It is a demand-driven approach taking into consideration the opportunities at each destination (offer-level).
For the purpose of this research, we developed four accessibility indexes (Table 2) and their associated maps. Accessibility to workplaces makes the average between similar indexes for women and men (Figure 1). It provides estimates of situation of each cell grid relative to the labour market. Accessibility to school is estimated using thresholds for children (Figure 2). Accessibility to shopping centres is computed using thresholds for families (Figure 3). And finally, accessibility to groceries is based on actual behaviour of families (Figure 4).
3.4 Integrating urban centrality and accessibility to amenities within hedonic modelling
Before integrating those centrality and accessibility indexes into hedonic modelling, it could be relevant to test for the significance of their differences among house types and for the existence of any temporal trend. Table 3a presents the distribution of transactions by year (1986, 1991, 1996) among housing types. Bungalows are single story single family detached units. Cottages have more than one above-ground floor and are detached units. Row-Attached housing is made of duplex and row houses. Condominiums are owner-occupied apartments located in multiple-family buildings. Table 3a displays average and standard deviation of sale price ($), centrality index and accessibility indexes for each pair of type of housing – transaction year.
Table 3b tests the significance of the differences of means (Student t test) along the time line, searching for temporal trends in sub-markets (bungalows, cottages, row-attached, condominium). Tests are made for each attribute (price, centrality and accessibility). There are very few trends except for the bungalow and cottage sub-markets between 1986 and 1991, and to a lesser extent between 1986 and 1996. It also appears that the sale price is more trended than accessibility or centrality. The non significant trend in price between 1991 and 1996 is mostly related to adverse economic context which has kept house values stable during that period.
Table 3c is searching for significant differences of means among housing types for 1986, 1991 and 1996. It appears that, except for the cottage and Row-Attached housing pairs, all types of housing have significant differences on their sale price, as well as on their centrality and accessibility indexes. This reflect differences on the spatial distribution of housing types and the fact that choosing a type of house is closely associated with choosing among a restricted set of accessibility patterns. For example, the spatial distribution of bungalows (suburbs) is very different from that of condominiums (close to old centre). In 1996, these two sub-markets gave significantly different accessibility features for closely similar prices. On the opposite, in 1996, cottages and row-attached housing were giving about the same accessibility for different prices. These preliminary results can not, by themselves, test for hypothesis 2a because other factors are not under control, but they support the likelihood of finding some difference of valuation among housing types since there is difference in their accessibility level. Conversely, there is a probable linkage between the demand for some specific housing types and household structure, each housing type providing a specific bundle of accessibility features, in-line with travel time elasticity of household members.
Table 4 presents descriptive statistics of the 10,269 housing units (single family house) sold in Quebec City during years 1986, 1991 and 1996. In order to obtain a suitable dataset for hedonic modelling, a filter was applied to the original database of all single-family transactions. Firstly, only bona fide sales were retained. Secondly, sale prices of less than $40,000 or more than $300,000 were rejected to avoid considering peculiar transactions. Finally, properties with more than 3,000 square metres of land or less than 40 square metres of living area were discarded to avoid disturbing final models with farms or

Marius Thériault, François Des Rosiers & Jean Dubé – Testing the temporal stability of accessibility value in residential hedonic prices
European Regional Science Association – 2006 Annual Conference – Volos, Greece 10
tiny pied-à-terre. Moreover, only one condominium unit transaction per year was retained for any given building in order to avoid over-sampling at some locations following the opening of new housing complexes. This had the effect of under-sampling this sub-market.
Due to this high variance on prices, a multiplicative form of the model was retained, with the logarithm of sale price as the dependent variable. The first set of attributes (Ln (LotSize) to Water/sewer Networks) consists of the property specifics previously found to have a significant impact on house values in this market (Des Rosiers et al., 2001; Thériault et al., 2003). The reference period extend to a decade, Number of Months after Dec. 1985 is used to assess the temporal variation on sale prices, which is modelled using a quadratic function, the squared term being centered on the mean of elapsed time (57.06369) to avoid multicollinearity between time parameters (Jaccard et al., 1990, p. 31). Differentials in tax burden are modelled using the overall, unstandardized taxation rate (Tax Rate) applied to residential properties. It accounts for both the base property tax rate and the pricing of local services. During the reference period, there was 13 different municipalities within the actual Quebec City limits (amalgamation in 2002), each one having a different tax rate ($/$100 of assessed value) every year. The last set of variables (Centrality Index to Condo * Rel. Acc. Shopping Centre versus Grocery) is made of centrality and accessibility indexes and transformations needed to avoid multicollinearity, to measure temporal drift and to test for sub-market peculiarities.
As previously stated, it is not possible to inject several accessibility indexes simultaneously in an hedonic model without generating strong disturbance in term of multicollinearity because there is a strong correlation among them. Table 5 displays bivariate correlations between sale price and centrality index (.088) or accessibility indexes (workplaces .200; schools .235; shopping centres .145; groceries .073). All these correlations are significant at the .01 level using a 2-tailed test. Conclusions cannot be put forward at this step, but it is worth noting that, except for groceries, all coefficients of accessibility outclass centrality. However, the problem of multicollinearity arises from the very strong correlation among accessibility indexes (from .851 to .966). As can be seen on Figures 2 to 5, they display similar spatial patterns because they are based on a single road network using identical impedance factors; the main differences arising from peculiar distribution of opportunities and specific suitability thresholds.
Therefore, for removing the overall spatial drift we will retain the Accessibility Index to Workplaces in the analysis (it is the most commonly used indicator in the literature) and compute the difference between other indexes and this one using a two-step procedure. Again to avoid multicollinearity, we firstly need to center each accessibility index on its average value (we use the mean of all properties as reported at the last line of Table 3a – Workplaces 65.4; Schools 47.4; Shopping centres 44.8; Groceries 41.4). This gives, for each grid cell, an estimate of local departure from the average housing market (+ better than average; – less than average). Secondly, each accessibility index is differentiated from Accessibility to Workplaces, yielding relative accessibility indexes which are quite less correlated among each other, poorly correlated with accessibility to workplaces, while significantly correlated with sale prices, and at a level that easily compete with the centrality index.
In fact, this two-step procedure clean up the common features from accessibility indexes highlighting their differential peculiarities. Figures 6 to 8 show maps of these relative accessibility indexes. Figure 6 depicts on its positive side locations where relative accessibility to school outclass accessibility to the labour market, and on its negative side, places where relative accessibility to the labour market is better than relative accessibility to schools. The value of the coefficient measures strength of the differences, the sign indicates which accessibility is relatively higher. While it is possible, with four types of amenities to compute six pairs of differentials (4-1 * 4-2), one can demonstrate that all information is exhausted when using one original variable plus three pairs. For the purpose of this research, we retained pairs of relative accessibility on the basis of their contribution to the understanding (and ordering) of valuation people put on accessibility to specific amenities. Looking at Table 4, it is worth noting that all accessibility indexes distributions are very close to normal (Skewness ranging from -.397 to .277; Kurtosis are from -.805 to -.048) while centrality index is a little more right skewed (.769) and leptokurtic, but still fairly close to the normal distribution.
Marius Thériault, François Des Rosiers & Jean Dubé – Testing the temporal stability of accessibility value in residential hedonic prices
European Regional Science Association – 2006 Annual Conference – Volos, Greece 11
Macro-economic trends, local labour market transformations, demographics and consumer’s tastes have a strong effect on the housing market and exert forces on prices that are related to exogenous effects. General trends on prices are both supply and demand oriented and could generally be captured using a polynomial linear function of elapsed time. However, due to changes in demand, some attributes may follow a more specific temporal tendency and there is a need to test for temporal drift. In this paper, we decided to restrict ourselves in the modelling of three specific time periods (1986, 1991 and 1996) in order to operate a simple test for detecting temporal drift between those years. We were using the Casetti’s expansion method for each of the hedonic attributes trying to find significant differences between coefficients of the extreme years and those of the middle year (1986 and 1996 versus 1991). Using dummies for each year, we generated an interaction between any of the significant attribute (property specifics, taxes, centrality and accessibility indexes) searching for significant temporal drift. Those interactions compute the differential of the given years against the general un-trended coefficient. Each temporal expansion was tested and only those having proved significant at the .05 level were retained in the hedonic model (Table 6) where significant drifts are highlighted with gray patterns. For example, while a second washroom generally adds about 3.6% to the value of a single family house, its effect was significantly lower (1.5%) in 1986 and 1996 (0.6%). Similarly, the internalization of municipal taxes in the value of property was found to be lower in 1986 (-8.8%) than in 1991 or 1996 (-3.2%), meaning that each increase of $1 per $100 of assessed value in tax rate has a lowering effect of, respectively, 8.8% (1986) and 3.2% (1991 and 1996) on house market values. It was possible to test those fiscal drifts thanks to the fact that during those years the territory was divided among 13 municipalities having autonomous and somehow competing fiscal policies.
Casetti’s expansion was also used to isolate the specific effects of the condominium sub-market which is attracting a very typical share of customers. We can see that if the added value of a second washroom is about 3.6% for the overall housing market, it accounts for an increase of 14% in the market price of a condominium, lowering at 11.9% in 1986 and 11% in 1996). One should understand that in a multiplicative model (Ln Sale Price) those expansions are computing partial differentials of people’s valuation over time gaps or between sub-markets.
4. Empirical results
As stated above, when making comparison between housing types, there are significant differences in terms of sale price, centrality and accessibility (Table 3c). Those differences hold from year to year in spite of the fact that temporal trends are not predominant (Table 3b). However, those bivariate tests are not controlling for the effect of other factors, hence the relevance of hedonic modelling for detecting temporal drift or market segmentation while controlling for concomitant effects on housing prices.
Table 6 presents coefficients of a multiplicative hedonic model of the sale price for more than 10,000 private homes (detached and attached houses; condominium apartments) sold in Quebec City during years 1986, 1991 and 1996. It combines property specifics, temporal trends, fiscal effects, centrality and accessibility to specific types of urban amenities. Considering the widespread diversity of the studied market in terms of spatial extension (more than 500 square kilometres), of temporal duration (a decade) and of types of properties, the overall performance is very good (Adjusted R-square is 0.746; standard error of estimate is at 17.3% and the F test is highly significant). Moreover, the multicollinearity of considered variables is well under control (VIF – variance inflation factors – are all less than 5 while most are below 2). The significance level of .05 was used to test significance of any single coefficient. During the modelling procedure, property specifics were included first, followed by temporal trend (Number of months after December 1985), taxation rate, centrality and accessibility. Afterwards, temporal drift was tested independently for each globally significant attribute. Finally, the condominium submarket was isolated.
Looking at beta coefficients (partial correlations), one can analyze the effects of each factor on the overall housing price and make a ranking of their strength. Among property specifics the most important features are: living area (.365), physical depreciation of buildings – apparent age (-.305 – elasticity coefficient of -.108) and lot size (.275 – elasticity coefficient of .137). Other property specifics, like the presence of a fireplace (.097), a finished basement (.071), high quality flooring
Marius Thériault, François Des Rosiers & Jean Dubé – Testing the temporal stability of accessibility value in residential hedonic prices
European Regional Science Association – 2006 Annual Conference – Volos, Greece 12
(.065), an excavated pool (.059) and a second washroom (.058), are highly significant but do not explain a large portion of price variance on the market. However, temporal trend is very important (.339 and -.146; number of months). Municipal taxation has a moderate effect on price variation within the agglomeration (-.073). Accessibility to the labour market is a strong determinant of housing prices (.230), closely followed by relative accessibility to schools (.186) and shopping centres (.165). Centrality (.044) and accessibility to groceries (.034) have weaker influence on prices. This supports our statement that accessibility is not really equivalent to centrality, especially for a mid-size agglomeration like Quebec City where there is low congestion on the road network and the opportunities are not concentrated in the old city core. They are mostly distributed along a central axis (from old city core to Sainte-Foy business district – a pattern originating from the 1960-70s) and sparsely dispersed around motorways interchanges (a pattern initiated during the 1980-90s).
Looking at regression coefficients (B), let us compare the consumer’s valuation of centrality and accessibility. Each point (between 0 and 100) of accessibility to the labour market adds 0.36% to the market value of a single-family housing, meaning that the best place in Quebec City (index of 100) imply a premium of about 36% on value. Normally, this would be totally internalized in land value because it is a location premium which has nothing to do with the building. For families with children, it is far more important to live close to several schools that close to the labour market. In fact, each point (between -12 and 18) of relative accessibility to school versus labour market adds 1% to the property value. This a compensation premium of proximity to school versus proximity to jobs. When negative (up to -12%) the meaning is that closeness to workplaces do not offset inconvenience of poor accessibility to schools; where positive (up to +18%) availability of schools compensates for remoteness from jobs. It appears natural that for condominium buyers (mostly childless households), the coefficient could be lower (.0076 = .0103-.0027). Accessibility to shopping centre is far lower-valued than accessibility to labour market and the former (shopping) do not even compensate for a drop in the latter (labour). In fact, in places where the accessibility to shopping centres dominates by 10 points the accessibility to jobs, the overall house values decrease by 7.3%; conversely, if the accessibility to jobs (centered over the whole city to avoid multicollinearity) dominates by 10 points, the housing values rise by 7.3%. This coefficient measures the exchange rate between those amenities, controlling for the average accessibility to each type of opportunity. The premium associated with the preference of labour market over shopping centres is far stronger for condominium buyers (+12.3% of increase for 10 points of discrepancy). Again, most property buyers favour shopping centres over choice/proximity to groceries (1.1% premium on value for 10 points of difference). Moreover, this preference on shopping centres against groceries is far higher for condominium buyers (+5.7% for 10 points). That is in line with expectations: families are more attracted by groceries (they need more foods) than condominium owners, although they both prefer access to shopping centres.
For this research, centrality is modelled using an interaction method taking into account the number of opportunities at service location, friction of distance (gravitational model based on travel time) and the number of customers living in each residential neighbourhood (approximating population density). The index ranges from 0 (remote area) to 100 (most central location). The location premium for the best location is 10.6%. That should be compared with the premium for best accessibility to the labour market (36%). Therefore, for Quebec City, not only the partial correlation of centrality with housing values is lower (.044 versus .230) than accessibility to the labour market, but its marginal effect is more than three times weaker.
Existence of significant temporal drift in the valuation of accessibility was tested using interactions with two dummies (Casetti’s expansion), one for 1986 and another for 1996. Only significant drifts are retained in Table 6. No significant drift was found for centrality index and for accessibility to the labour market. However, valuation of relative accessibility (differential between two sets of amenities) seems less stable in time. Preferences for schools over workplaces was weaker in 1986 (5% for 10 points) than in 1991-1996 (10% for 10 points). Preference for accessibility to jobs over shopping centres was steadily increasing during the decade: 4.1% per 10 points in 1986; 7.4% in 1991, and 8.9% in 1996. Finally, there was almost no preference between shopping centres and groceries in 1986 since coefficients cancel out (-.001204 + 0.001151).
Marius Thériault, François Des Rosiers & Jean Dubé – Testing the temporal stability of accessibility value in residential hedonic prices
European Regional Science Association – 2006 Annual Conference – Volos, Greece 13
Looking at property specifics, there are very few temporal drifts. The only significant changes in valuation are for location of property on street corners, second washrooms, hardwood stairs and double attached garage. Finally, the effect of taxation rate was much more detrimental to housing values in 1986 (-0.0878) than in 1991 and 1996 (-0.0320).
5. Analysing and discussing main findings
Empirical results fully support our first hypothesis: “willingness-to-pay for better accessibility when buying a home is significantly different among kinds of amenities, yielding several complementary valuations of accessibility.” The procedure we developed for this paper shows how those specific valuations of accessibility can be combined and compared in a unified hedonic model. Results are in line with findings of previous models built for the same city using different samples of transactions. For instance, Des Rosiers et al. (2000) have already shown, using a different method based on principal component analysis, that accessibility can be divided among two orthogonal indexes making the difference between regional-level and neighbourhood-level services. That is highly congruent with the findings of this research which goes further and specifically distinguishes among four types of amenities ranging from the regional-level (labour market) to the very local-level (groceries). The significant effect of spatial distribution of schools and shopping centres on single-family housing market was already demonstrated by Des Rosiers et al. (2001 & 1996) using Euclidean distance to the nearest amenity to assess the impact of values. The method presented here is much more comprehensive and takes into account any amenity which could be considered as a valid opportunity considering the observed behaviour of group of citizens having similar profiles. Such an improvement was already discussed in Thériault et al. (2005).
Findings support sub-hypothesis [1a]: “hedonic modelling is suitable for measuring differences of valuation among kinds of amenities and for ordering preferences of households”. To the best of our knowledge, this is the first research to successfully combine and order accessibility preferences of single-family house buyers within a unified hedonic model. For the sake of simplicity, we deliberately choose to restrict ourselves using only four types of amenities. The Quebec CMA OD survey provides information on more trip purpose (health care, restaurant, leisure, etc.), and given the mathematical properties of the relative accessibility indexes, we are convinced that it is feasible to include several other types of services without generating multicollinearity. The most difficult task will be to find out which amenity outclasses the next one. With four types of opportunities, there were only six differentials. We tested every combination and the actual signs of coefficients (should be positive) combined with partial autocorrelations (should be decreasing) were sufficient for ordering preferences. On this market, most households prefer accessibility to schools over the labour market, which in turn is more valued than shopping centres. Accessibility to groceries has the lowest priority. However, as stated above, buyers of very specific products may have different valuation of each type of amenities. But, for this research, the ordering was remaining stable. Is it the case for any city? Is it stable over decades? Further research is needed to improve one’s knowledge on that topic.
Findings also support sub-hypothesis [1b]: “specific valuation of accessibility complement conventional centrality measurement”. Not only the accessibility indexes developed in this paper do complement the centrality index, but they provide a far better explanation on the spatial variation of residential values. This is congruent with previous findings by Thériault et al. (2005).
The second hypothesis looks at temporal drifts, stating that: “preferences of households and their ordering are rather stable over time and can be used to estimate location rent over the long term”. Empirical results only partly support this hypothesis. On the one hand, it is true that the ordering of preferences did not change over the decade and that the valuation of accessibility to the labour market as well as the effect of centrality were exempt from temporal drift . On the other hand, the relative accessibility (aimed at differentiating between amenities) did show significant temporal drifts. Moreover, four significant differences for valuation of centrality or accessibility were found for the condominium sub-market, from a maximum of five. This clearly indicates that both valuation of centrality/accessibility and ordering of preferences are subject to change along with sub-markets, which are themselves closely linked to household types and life cycles. This gives some indication that
Marius Thériault, François Des Rosiers & Jean Dubé – Testing the temporal stability of accessibility value in residential hedonic prices
European Regional Science Association – 2006 Annual Conference – Volos, Greece 14
temporal drift will probably occur when analysing longer periods of time, especially along with population aging and increase of lone-person households. Thus, empirical results do not confirm, nor they do invalidate the second hypothesis. More research is needed before such a methodology could be used to estimate long-term (several decades) location rent.
Sub-hypothesis [2a] is supported by empirical experimentation: “Valuation of centrality and accessibility may be different when considering some specific segment of the housing market”. For the purpose of this research we tested for the condominium market only. Preliminary experiments were indicating slight differences among bungalows, cottages and row housing on the valuation of living area. However, those differences decreased below significance level when adding other property specifics. It is not clear if it is an indication of differential valuation, or a concomitant relationship of living area with other property features. For instance, smaller homes generally do not have a fireplace; having a second washrooms is somewhat related with living area and the likelihood of adding washrooms increases in larger multiple levels properties (cottages), etc. Furthermore, the fact that this sub-hypothesis holds for the comparison of the condominium sub-market with detached and attached single-family houses entails the possible rejection of hypothesis 2. As stated previously, the demand for higher density housing (condominium apartments) is linked to demographics (aging, household structure) but it is also dependent on larger scale socio-economic evolution like changes in transportation technology or increases in energy price which could have an effect on propensity to travel and people’s perception of accessibility. Those are phenomena that our dataset cannot integrate.
Finally, sub-hypothesis [2b] “if there is any temporal drift on the valuation of housing attribute, it will more likely change the valuation of property specifics rather than accessibility to urban services” should be interpreted with caution. Indeed, and in spite of the fact that some property attributes (corner lot, washrooms, hard wood stairs and double attached garage) display significant temporal drifts, empirical investigation for Quebec City shows by and large the reverse. Therefore, our premise stating that property specifics are more sensitive to fashion than accessibility because the latter are more rooted to daily needs is not supported by evidence. Here again, further research is needed to sort-out deciding factors.
6. Conclusion The original approach developed in this paper proves efficient in isolating the cross-effects of urban centrality from accessibility to several types of amenities, while controlling for multicollinearity. Application to the housing market of Quebec City for an entire decade (1986 to 1996) was very efficient to distinguish among centrality and various types of accessibility while testing for temporal trend and drifts. While only a few property-specific attributes experience a change in their marginal contribution, all relative accessibility indexes do. Every single accessibility index has a much stronger effect on house values than centrality (which is still significant). When buying a home, households put more emphasis on access to schools than they put on access to the labour market, which in turn, prevail over accessibility to either shopping centres or, finally, groceries. The ordering is rather stable but the actual valuation of a specific amenity may change over time and among market segments (single houses versus condos) impeding its potential use for long-term forecast of location rent.
However, better understanding the economic impact of accessibility to amenities provides guidelines for choosing among a set of new neighbourhoods to develop in order to generate optimal fiscal effects for municipalities. It could also provide guidelines for decision making when improving transportation networks or locating new activity centres. This alone provides ample justification for furthering this research topic.
This paper’s contribution to this area of research is two-fold. Firstly, to the best of our knowledge, it is the first successful attempt at combining several centrality and accessibility indexes in a single hedonic model aimed at ranking buyers’ preferences and their impact on housing values. Secondly, it is also the first attempt for assessing the stability of house location preferences (indirectly revealed by hedonic modelling) in both time and between market segments. Because it is ultimately linked with demographics, this last feature provides some means for forecasting evolution of housing demand in future. Considering its impact on valuation of accessibility, it gives planners some clues for estimating the effect on land value.
Marius Thériault, François Des Rosiers & Jean Dubé – Testing the temporal stability of accessibility value in residential hedonic prices
European Regional Science Association – 2006 Annual Conference – Volos, Greece 15
References
Anselin, L., 1990. Spatial dependence and spatial structural instability in applied regression analysis. Journal of Regional Science, 30(2): 185-207.
Anselin, L., A. Can, 1986. Model comparison and model validation issues in empirical work on urban density functions. Geographical Analysis, 18: 179-197.
Anselin, L., S. Rey, 1991. Properties of tests for spatial dependence in linear regression models. Geographical Analysis, 23(2): 112-131.
Axhausen, K. W., T. Gärling, 1992. Activity-based approaches to travel analysis: Conceptual frameworks, models, and research problems. Transport Reviews, 12: 323-341.
Basu, S., T. G. Thibodeau, 1998. Analysis of spatial autocorrelation in house prices. The Journal of Real Estate Finance and Economics, 17(1): 61-86.
Bateman, I., B. Day, I. Lake, A. Lovett, 2001. The Effect of Road Traffic on Residential Property Values: A Literature Review and Hedonic Pricing Study. Scottish Executive Development Department, Edinburgh, 207 pages.
Biba G., F. Des Rosiers F., M. Thériault, P. Villeneuve P., 2006. Big boxes versus traditional shopping centers: Looking at households’ shopping trip patterns. Journal of Real Estate Literature, 14(2): 177-204.
Can, A., 1990. The measurement of neighbourhood dynamics in urban house prices. Economic Geography, 66: 254-272.
Can, A., 1993. Specification and estimation of hedonic housing price models. Regional Science and Urban Economics, 22: 453-474.
Can, A., I. Megbolugbe, 1997. Spatial dependence and house price index construction. Journal of Real Estate Finance and Economics, 14: 203-222.
Casetti, E., 1972. Generating models by the expansion method: Applications to geographical research. Geographical Analysis, 4: 81-91.
Casetti, E., 1986. The dual expansion method: An application for evaluating the effects of population growth on development. IEEE Transactions on Systems, Man, and Cybernetics, 16: 29-39.
Colwell, P.F., S.S. Gujral, C. Coley, 1985. The impact of shopping centers on the value of surrounding properties. Real Estate Issues, 10(1): 35-39.
Curry, L., 1972. Gravity analysis of gravity flows. Regional Studies, 6: 131-147. Des Rosiers, F., A. Lagana, M. Thériault, M. Beaudoin, 1996. Shopping centers and house values: An
empirical investigation. Journal of Property Valuation and Investment, 14(4): 41-63. Des Rosiers, F., M. Thériault, P. Villeneuve, 2000. Sorting out access and neighbourhood factors in
hedonic price modelling. Journal of Property Investment & Finance, 18(3): 291-315. Des Rosiers, F., A. Lagana, M. Thériault, 2001. Size and proximity effects of primary schools on
surrounding house values, Journal of Property Research, 18(2): 149-168. Dubin, R. A., 1998. Predicting house prices using multiple listings data. The Journal of Real
Estate Finance and Economics, 17(1): 35-60. Dubin, R. A., C. H. Sung, 1987. Spatial variation in the price of housing: Rent gradients in non-
monocentric cities. Urban Studies, 24: 193-204. Ettema, D., H. Timmermans, 1999. Theories and models of activity pattern. In Ettema D. and
Timmermans H. (eds.) Activity based approaches to travel analysis. UK, Elsevier: 1-35. Fotheringham, S., 1986. Modelling hierarchical destination choice. Environment and Planning A,
18: 401-418. Grieson, R. E., J. R. White, 1989. The existence and capitalization of neighbourhood externalities: A
Reassessment. Journal of Urban Economics, 25(1): 68-76. Guntermann, K. L., P. F. Colwell, 1983. Property values and accessibility to primary schools. Real
Estate Appraiser and Analyst, 49(1): 62-68. Handy, S. L., D. A. Niemeier, 1997. Measuring accessibility: an exploration of issues and alternatives.
Environment and planning A, 29(7): 1175-1194. Hansen, W.G., 1959. How accessibility shapes land use. Journal of American Institute of Planners,
25: 73-76.

Marius Thériault, François Des Rosiers & Jean Dubé – Testing the temporal stability of accessibility value in residential hedonic prices
European Regional Science Association – 2006 Annual Conference – Volos, Greece 16
Hanson, S., 1995. Getting there: Urban transportation in context. In S. Hanson (Ed.) The Geography of Urban Transportation. New York, The Guilford Press, pp. 3-25.
Hoch, I., P. Waddell, 1993. Apartment rents: Another challenge to the monocentric model. Geographical Analysis, 25(1): 20-34.
Jaccard, J., R. Turrisi, C. K. Wan, 1990. Interaction Effects in Multiple Regression. New-bury Park, CA: Sage Publications Inc.
Jackson, J. R., 1979. Intra-urban variation in the price of housing. Journal of Urban Economics, 6: 464-479.
Johnston, R. J., 1973. On friction of distance and regression coefficients. Area, 5: 187-191. Kestens, Y., M. Thériault, F. Des Rosiers, 2004. Impact of surrounding land use and vegetation on
single family house prices. Environment and Planning B: Planning and Design, 31(4): 539-567. Kestens, Y., M. Thériault, F. Des Rosiers, 2006. Heterogeneity in hedonic modelling of house prices:
Looking at buyers’ household profiles. Journal of Geographical Systems, 8(1): 61-96. Kim, H. M, M. P. Kwan, 2003. Space-time accessibility measures: A geocomputational algorithm
with a focus on the feasible opportunity set and possible activity duration. Journal of Geographical Systems, 5(1): 71-91.
Lenntorp, B., 1978. A time-geographical simulation of activity programs. In Carlstein T., Parkes D. and Thrift N. (eds.) Timing Space and Spacing Time, Volume 2: Human Activity and Time Geography. London, Edward Arnold: 162-180
Levinson, D. M., 1998. Accessibility and the journey to work. Journal of Transport Geography, 6: 11-21.
McMillen, D.P., 2003. The return of centralization to Chicago: Using repeat sales to identify changes in house price distance gradients. Regional Science and Urban Economics, 33(3): 287-304.
Nijkamp, P., L. Van Wissen, A. M. Rima, 1993. A household life cycle model for residential relocation behaviour. Socio-Economic Planning Science, 27(1): 35-53.
Rosen, S., 1974. Hedonic prices and implicit markets: Product differentiation in pure competition. Journal of Political Economy 82: 34-55
Sirpal, R., 1994. Empirical modelling of the relative impacts of various sizes of shopping centers on the values of surrounding residential properties. Journal of Real Estate Research, 9(4): 487-505.
Thériault, M., M. H. Vandersmissen, M. Lee-Gosselin, D. Leroux, 1999. Modelling commuter trip length and duration within GIS: Application to an O-D survey. Journal for Geographic Information and Decision Analysis, 3(1): 41-55.
Thériault, M., F. Des Rosiers, P. Villeneuve, Y. Kestens, 2003. Modelling interactions of location with specific value of housing attributes. Journal of Property Management, 21(1): 25-62.
Thériault, M., F. Des Rosiers, 2004. Modelling perceived accessibility to urban amenities using fuzzy logic, transportation GIS and origin-destination surveys. In F. Toppen and P. Prastacos (Eds.) Proceedings of AGILE 2004 7th Conference on Geographic Information Science, Crete University Press, Heraklion, Greece, pp. 475-485.
Thériault, M., F. Des Rosiers, F. Joerin, 2005. Modelling accessibility to urban services using fuzzy logic. A comparative analysis of two methods. Journal of Property Investment & Finance, 23(1): 22-54.
Tiefelsdorf, M., 2003. Misspecification in interaction model distance decay relations: A spatial structure effect. Journal of Geographical Systems, 5: 25-50.
Timmermans, H., R. G. Golledge, 1990. Applications of behavioural research on spatial problems: preferences and choice. Progress in Human Geography, 14: 311-354.
Vandersmissen, M. H., P. Villeneuve, M. Thériault, 2003. Analyzing changes in urban form and commuting times. The Professional Geographer, 55(4): 446-463.
Vandersmissen, M. H., M. Thériault, P. Villeneuve, 2004. What about effective access to cars in motorized households? The Canadian Geographer, 48(4): 488-504.
Marius Thériault, François Des Rosiers & Jean Dubé – Testing the temporal stability of accessibility value in residential hedonic prices
European Regional Science Association – 2006 Annual Conference – Volos, Greece 17
Acknowledgements
This research was funded by the Canadian SSHRC (Social Sciences and Humanities Research Council) and the Canadian NSERC (Natural Sciences and Engineering Research Council). Authors are grateful to Quebec City Assessment division for giving access to Assessment role and home transactions data, as well as to Quebec Province’s Ministry of Transport and Réseau de Transport de la Capitale (RTC) for giving access to OD surveys. Table 1. Differences among trip durations (min.) reported during the 2001 OD Survey – Quebec City. a) Trip purpose and duration (by car, simulated in TransCAD)
Purpose (Nb. trips)
Time (min.) Average (Var.)
Purpose (Nb. trips)
Time (Min) Average (Var.)
Student t Difference of
Means
Sig.
Work (12,947) 10.53 (40.65) School (2,386) 7.55 (41.00) 20.953 0.000 School (2,386) 7.55 (41.00) Shopping (3,249) 6.98 (22.52) 3.858 0.000
Shopping (3,249) 6.98 (22.52) Grocery (2,967) 4.69 (15.69) 20.588 0.000 b) Trip duration (by car, simulated in TransCAD) differences among persons and households
Purpose Person/Household
(Nb. trips)
Time (min.) Average
Purpose Person/Household
(Nb. trips)
Time (Min) Average
Student t Difference of Means
Sig.
Work - Women (6,371) 10.30 Men (6,576) 10.76 4.048 0.000 School - Adults (407) 9.89 Children (1,979) 7.07 8.196 0.000
Shopping – Childless (2,521) 6.81 Families (601) 7.54 3.414 0.001 Grocery – Childless (2,229) 4.52 Families (669) 5.15 3.612 0.000
c) Trip duration (by car, simulated in TransCAD) satisfaction thresholds (minutes)
Purpose Person / household
Median C50 (min.)
C90 (min.)
Skewness Kurtosis
Work Women 9.5 18.6 0.868 0.873 Work Men 9.8 19.3 0.949 1.247 School Children (<16 y. o.) 4.8 16.1 1.302 1.547 Shopping Families 6.5 14.1 1.307 1.575 Grocery Families 3.5 11.2 1.958 5.077 Adapted from: Thériault, M., F. Des Rosiers, F. Joerin, 2005. Modelling accessibility to urban services using fuzzy logic. A comparative analysis of two methods. Journal of Property Investment & Finance, 23(1): 22-54.
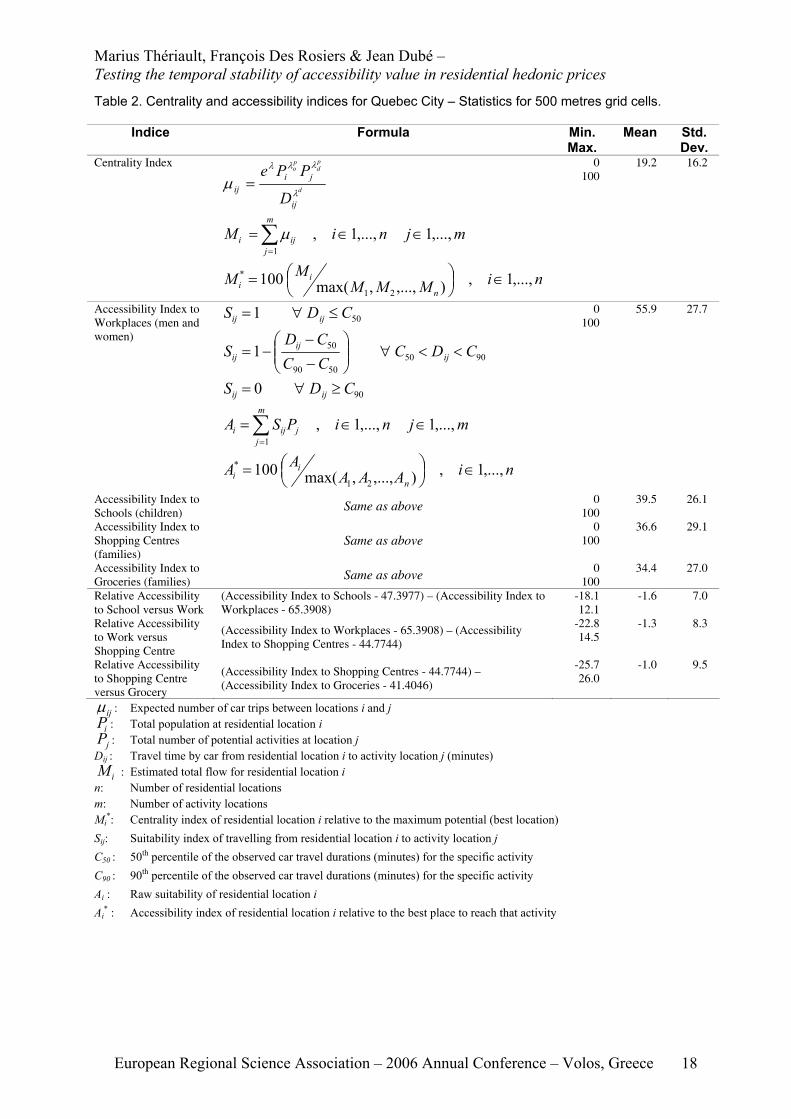
Marius Thériault, François Des Rosiers & Jean Dubé – Testing the temporal stability of accessibility value in residential hedonic prices
European Regional Science Association – 2006 Annual Conference – Volos, Greece 18
Table 2. Centrality and accessibility indices for Quebec City – Statistics for 500 metres grid cells.
Indice Formula Min. Max.
Mean Std. Dev.
Centrality Index
d
pd
po
ij
jiij
D
PPeλ
λλλ
μ =
mjniMm
jiji ,...,1,...,1,
1
∈∈=∑=
μ
niMMMMM
n
ii ,...,1,),...,,max(100
21
* ∈⎟⎠⎞⎜
⎝⎛=
0 100
19.2 16.2
Accessibility Index to Workplaces (men and women)
501 CDS ijij ≤∀=
90505090
501 CDCCCCD
S ijij
ij <<∀⎟⎟⎠
⎞⎜⎜⎝
⎛−−
−=
900 CDS ijij ≥∀=
mjniPSAm
jjiji ,...,1,...,1,
1
∈∈=∑=
niAAAAA
n
ii ,...,1,),...,,max(100
21
* ∈⎟⎠⎞⎜
⎝⎛=
0 100
55.9 27.7
Accessibility Index to Schools (children) Same as above
0 100
39.5 26.1
Accessibility Index to Shopping Centres (families)
Same as above 0
100 36.6 29.1
Accessibility Index to Groceries (families) Same as above 0
100 34.4 27.0
Relative Accessibility to School versus Work
(Accessibility Index to Schools - 47.3977) – (Accessibility Index to Workplaces - 65.3908)
-18.1 12.1
-1.6 7.0
Relative Accessibility to Work versus Shopping Centre
(Accessibility Index to Workplaces - 65.3908) – (Accessibility Index to Shopping Centres - 44.7744)
-22.8 14.5
-1.3 8.3
Relative Accessibility to Shopping Centre versus Grocery
(Accessibility Index to Shopping Centres - 44.7744) – (Accessibility Index to Groceries - 41.4046)
-25.7 26.0
-1.0 9.5
ijμ : Expected number of car trips between locations i and j
iP : Total population at residential location i
jP : Total number of potential activities at location j Dij : Travel time by car from residential location i to activity location j (minutes)
iM : Estimated total flow for residential location i n: Number of residential locations m: Number of activity locations Mi
*: Centrality index of residential location i relative to the maximum potential (best location) Sij: Suitability index of travelling from residential location i to activity location j C50 : 50th percentile of the observed car travel durations (minutes) for the specific activity C90 : 90th percentile of the observed car travel durations (minutes) for the specific activity Ai : Raw suitability of residential location i Ai
* : Accessibility index of residential location i relative to the best place to reach that activity
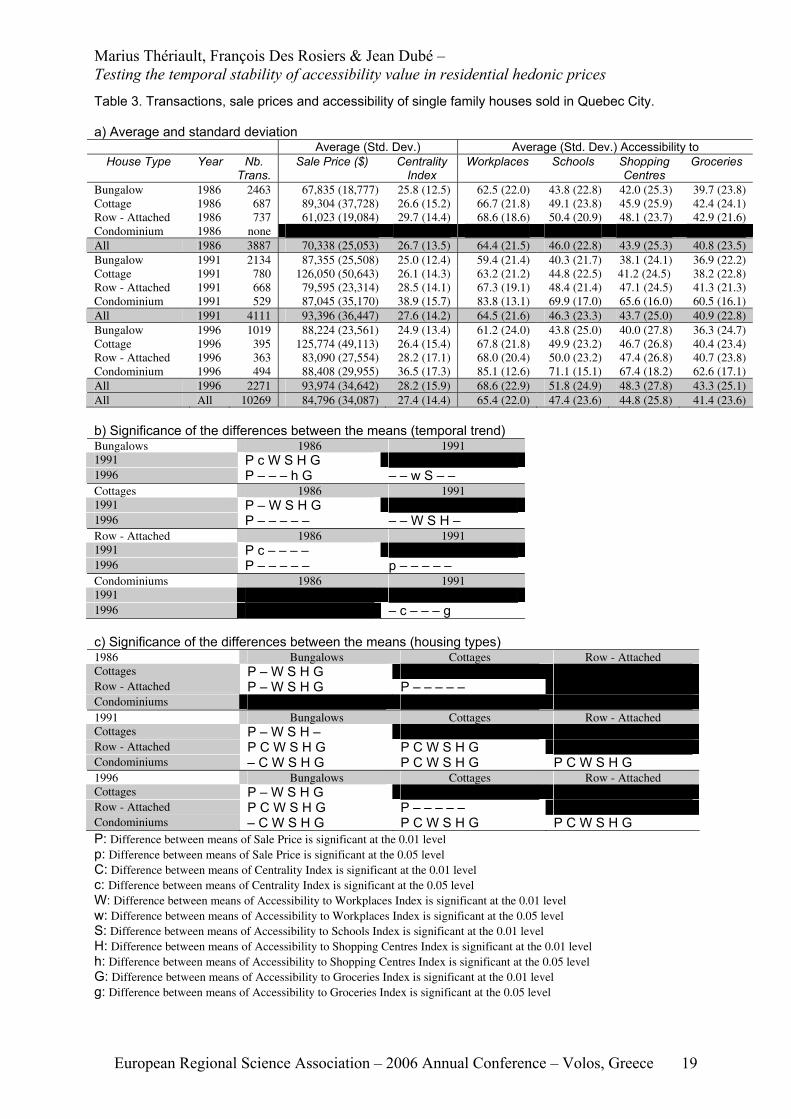
Marius Thériault, François Des Rosiers & Jean Dubé – Testing the temporal stability of accessibility value in residential hedonic prices
European Regional Science Association – 2006 Annual Conference – Volos, Greece 19
Table 3. Transactions, sale prices and accessibility of single family houses sold in Quebec City. a) Average and standard deviation
Average (Std. Dev.) Average (Std. Dev.) Accessibility to House Type Year Nb.
Trans. Sale Price ($) Centrality
Index Workplaces Schools Shopping
Centres Groceries
Bungalow 1986 2463 67,835 (18,777) 25.8 (12.5) 62.5 (22.0) 43.8 (22.8) 42.0 (25.3) 39.7 (23.8) Cottage 1986 687 89,304 (37,728) 26.6 (15.2) 66.7 (21.8) 49.1 (23.8) 45.9 (25.9) 42.4 (24.1) Row - Attached 1986 737 61,023 (19,084) 29.7 (14.4) 68.6 (18.6) 50.4 (20.9) 48.1 (23.7) 42.9 (21.6) Condominium 1986 none All 1986 3887 70,338 (25,053) 26.7 (13.5) 64.4 (21.5) 46.0 (22.8) 43.9 (25.3) 40.8 (23.5) Bungalow 1991 2134 87,355 (25,508) 25.0 (12.4) 59.4 (21.4) 40.3 (21.7) 38.1 (24.1) 36.9 (22.2) Cottage 1991 780 126,050 (50,643) 26.1 (14.3) 63.2 (21.2) 44.8 (22.5) 41.2 (24.5) 38.2 (22.8) Row - Attached 1991 668 79,595 (23,314) 28.5 (14.1) 67.3 (19.1) 48.4 (21.4) 47.1 (24.5) 41.3 (21.3) Condominium 1991 529 87,045 (35,170) 38.9 (15.7) 83.8 (13.1) 69.9 (17.0) 65.6 (16.0) 60.5 (16.1) All 1991 4111 93,396 (36,447) 27.6 (14.2) 64.5 (21.6) 46.3 (23.3) 43.7 (25.0) 40.9 (22.8) Bungalow 1996 1019 88,224 (23,561) 24.9 (13.4) 61.2 (24.0) 43.8 (25.0) 40.0 (27.8) 36.3 (24.7) Cottage 1996 395 125,774 (49,113) 26.4 (15.4) 67.8 (21.8) 49.9 (23.2) 46.7 (26.8) 40.4 (23.4) Row - Attached 1996 363 83,090 (27,554) 28.2 (17.1) 68.0 (20.4) 50.0 (23.2) 47.4 (26.8) 40.7 (23.8) Condominium 1996 494 88,408 (29,955) 36.5 (17.3) 85.1 (12.6) 71.1 (15.1) 67.4 (18.2) 62.6 (17.1) All 1996 2271 93,974 (34,642) 28.2 (15.9) 68.6 (22.9) 51.8 (24.9) 48.3 (27.8) 43.3 (25.1) All All 10269 84,796 (34,087) 27.4 (14.4) 65.4 (22.0) 47.4 (23.6) 44.8 (25.8) 41.4 (23.6) b) Significance of the differences between the means (temporal trend) Bungalows 1986 1991 1991 P c W S H G 1996 P – – – h G – – w S – – Cottages 1986 1991 1991 P – W S H G 1996 P – – – – – – – W S H – Row - Attached 1986 1991 1991 P c – – – – 1996 P – – – – – p – – – – – Condominiums 1986 1991 1991 1996 – c – – – g c) Significance of the differences between the means (housing types) 1986 Bungalows Cottages Row - Attached Cottages P – W S H G Row - Attached P – W S H G P – – – – – Condominiums 1991 Bungalows Cottages Row - Attached Cottages P – W S H – Row - Attached P C W S H G P C W S H G Condominiums – C W S H G P C W S H G P C W S H G 1996 Bungalows Cottages Row - Attached Cottages P – W S H G Row - Attached P C W S H G P – – – – – Condominiums – C W S H G P C W S H G P C W S H G P: Difference between means of Sale Price is significant at the 0.01 level p: Difference between means of Sale Price is significant at the 0.05 level C: Difference between means of Centrality Index is significant at the 0.01 level c: Difference between means of Centrality Index is significant at the 0.05 level W: Difference between means of Accessibility to Workplaces Index is significant at the 0.01 level w: Difference between means of Accessibility to Workplaces Index is significant at the 0.05 level S: Difference between means of Accessibility to Schools Index is significant at the 0.01 level H: Difference between means of Accessibility to Shopping Centres Index is significant at the 0.01 level h: Difference between means of Accessibility to Shopping Centres Index is significant at the 0.05 level G: Difference between means of Accessibility to Groceries Index is significant at the 0.01 level g: Difference between means of Accessibility to Groceries Index is significant at the 0.05 level
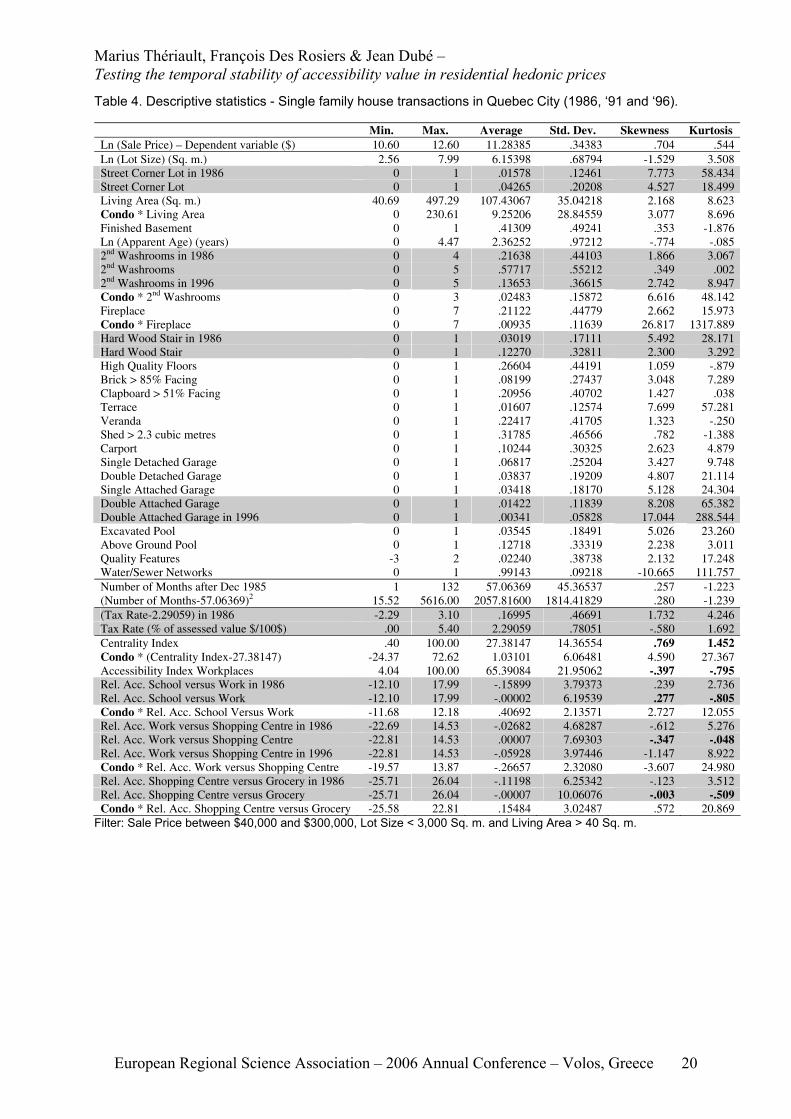
Marius Thériault, François Des Rosiers & Jean Dubé – Testing the temporal stability of accessibility value in residential hedonic prices
European Regional Science Association – 2006 Annual Conference – Volos, Greece 20
Table 4. Descriptive statistics - Single family house transactions in Quebec City (1986, ‘91 and ‘96).
Min. Max. Average Std. Dev. Skewness Kurtosis Ln (Sale Price) – Dependent variable ($) 10.60 12.60 11.28385 .34383 .704 .544 Ln (Lot Size) (Sq. m.) 2.56 7.99 6.15398 .68794 -1.529 3.508 Street Corner Lot in 1986 0 1 .01578 .12461 7.773 58.434 Street Corner Lot 0 1 .04265 .20208 4.527 18.499 Living Area (Sq. m.) 40.69 497.29 107.43067 35.04218 2.168 8.623 Condo * Living Area 0 230.61 9.25206 28.84559 3.077 8.696 Finished Basement 0 1 .41309 .49241 .353 -1.876 Ln (Apparent Age) (years) 0 4.47 2.36252 .97212 -.774 -.085 2nd Washrooms in 1986 0 4 .21638 .44103 1.866 3.067 2nd Washrooms 0 5 .57717 .55212 .349 .002 2nd Washrooms in 1996 0 5 .13653 .36615 2.742 8.947 Condo * 2nd Washrooms 0 3 .02483 .15872 6.616 48.142 Fireplace 0 7 .21122 .44779 2.662 15.973 Condo * Fireplace 0 7 .00935 .11639 26.817 1317.889 Hard Wood Stair in 1986 0 1 .03019 .17111 5.492 28.171 Hard Wood Stair 0 1 .12270 .32811 2.300 3.292 High Quality Floors 0 1 .26604 .44191 1.059 -.879 Brick > 85% Facing 0 1 .08199 .27437 3.048 7.289 Clapboard > 51% Facing 0 1 .20956 .40702 1.427 .038 Terrace 0 1 .01607 .12574 7.699 57.281 Veranda 0 1 .22417 .41705 1.323 -.250 Shed > 2.3 cubic metres 0 1 .31785 .46566 .782 -1.388 Carport 0 1 .10244 .30325 2.623 4.879 Single Detached Garage 0 1 .06817 .25204 3.427 9.748 Double Detached Garage 0 1 .03837 .19209 4.807 21.114 Single Attached Garage 0 1 .03418 .18170 5.128 24.304 Double Attached Garage 0 1 .01422 .11839 8.208 65.382 Double Attached Garage in 1996 0 1 .00341 .05828 17.044 288.544 Excavated Pool 0 1 .03545 .18491 5.026 23.260 Above Ground Pool 0 1 .12718 .33319 2.238 3.011 Quality Features -3 2 .02240 .38738 2.132 17.248 Water/Sewer Networks 0 1 .99143 .09218 -10.665 111.757 Number of Months after Dec 1985 1 132 57.06369 45.36537 .257 -1.223 (Number of Months-57.06369)2 15.52 5616.00 2057.81600 1814.41829 .280 -1.239 (Tax Rate-2.29059) in 1986 -2.29 3.10 .16995 .46691 1.732 4.246 Tax Rate (% of assessed value $/100$) .00 5.40 2.29059 .78051 -.580 1.692 Centrality Index .40 100.00 27.38147 14.36554 .769 1.452 Condo * (Centrality Index-27.38147) -24.37 72.62 1.03101 6.06481 4.590 27.367 Accessibility Index Workplaces 4.04 100.00 65.39084 21.95062 -.397 -.795 Rel. Acc. School versus Work in 1986 -12.10 17.99 -.15899 3.79373 .239 2.736 Rel. Acc. School versus Work -12.10 17.99 -.00002 6.19539 .277 -.805 Condo * Rel. Acc. School Versus Work -11.68 12.18 .40692 2.13571 2.727 12.055 Rel. Acc. Work versus Shopping Centre in 1986 -22.69 14.53 -.02682 4.68287 -.612 5.276 Rel. Acc. Work versus Shopping Centre -22.81 14.53 .00007 7.69303 -.347 -.048 Rel. Acc. Work versus Shopping Centre in 1996 -22.81 14.53 -.05928 3.97446 -1.147 8.922 Condo * Rel. Acc. Work versus Shopping Centre -19.57 13.87 -.26657 2.32080 -3.607 24.980 Rel. Acc. Shopping Centre versus Grocery in 1986 -25.71 26.04 -.11198 6.25342 -.123 3.512 Rel. Acc. Shopping Centre versus Grocery -25.71 26.04 -.00007 10.06076 -.003 -.509 Condo * Rel. Acc. Shopping Centre versus Grocery -25.58 22.81 .15484 3.02487 .572 20.869
Filter: Sale Price between $40,000 and $300,000, Lot Size < 3,000 Sq. m. and Living Area > 40 Sq. m.
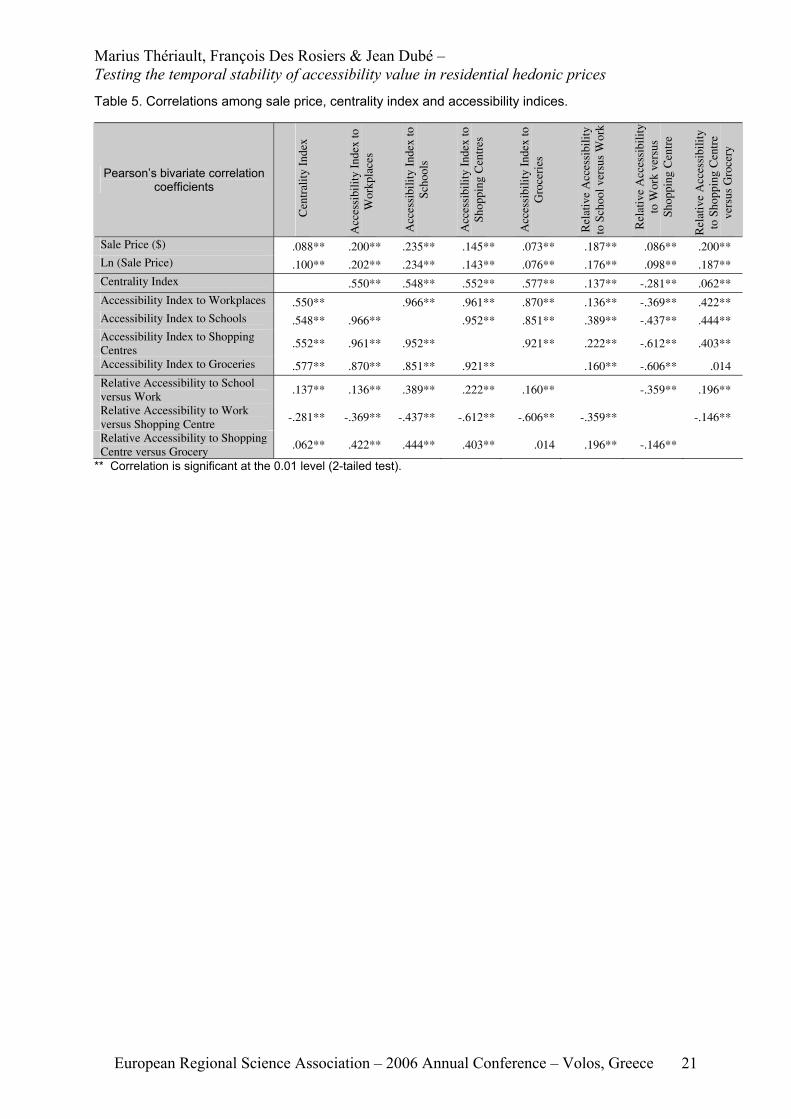
Marius Thériault, François Des Rosiers & Jean Dubé – Testing the temporal stability of accessibility value in residential hedonic prices
European Regional Science Association – 2006 Annual Conference – Volos, Greece 21
Table 5. Correlations among sale price, centrality index and accessibility indices.
Pearson’s bivariate correlation coefficients
Cen
tral
ity
Inde
x
Acc
essi
bilit
y In
dex
to
Wor
kpla
ces
Acc
essi
bilit
y In
dex
to
Scho
ols
Acc
essi
bilit
y In
dex
to
Shop
ping
Cen
tres
Acc
essi
bilit
y In
dex
to
Gro
ceri
es
Rel
ativ
e A
cces
sibi
lity
to
Sch
ool v
ersu
s W
ork
Rel
ativ
e A
cces
sibi
lity
to
Wor
k ve
rsus
Sh
oppi
ng C
entr
e
Rel
ativ
e A
cces
sibi
lity
to
Sho
ppin
g C
entr
e ve
rsus
Gro
cery
Sale Price ($) .088** .200** .235** .145** .073** .187** .086** .200** Ln (Sale Price) .100** .202** .234** .143** .076** .176** .098** .187** Centrality Index .550** .548** .552** .577** .137** -.281** .062** Accessibility Index to Workplaces .550** .966** .961** .870** .136** -.369** .422** Accessibility Index to Schools .548** .966** .952** .851** .389** -.437** .444** Accessibility Index to Shopping Centres
.552** .961** .952** .921** .222** -.612** .403**
Accessibility Index to Groceries .577** .870** .851** .921** .160** -.606** .014 Relative Accessibility to School versus Work .137** .136** .389** .222** .160** -.359** .196**
Relative Accessibility to Work versus Shopping Centre
-.281** -.369** -.437** -.612** -.606** -.359** -.146**
Relative Accessibility to Shopping Centre versus Grocery .062** .422** .444** .403** .014 .196** -.146**
** Correlation is significant at the 0.01 level (2-tailed test).
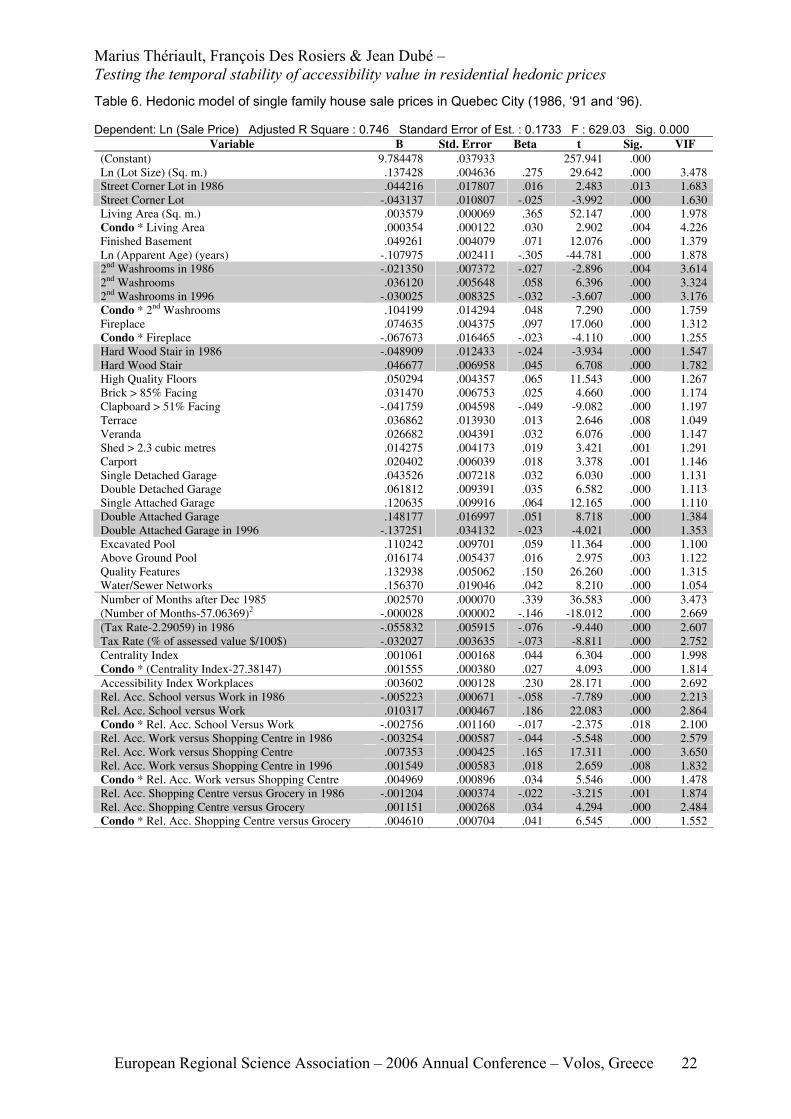
Marius Thériault, François Des Rosiers & Jean Dubé – Testing the temporal stability of accessibility value in residential hedonic prices
European Regional Science Association – 2006 Annual Conference – Volos, Greece 22
Table 6. Hedonic model of single family house sale prices in Quebec City (1986, ‘91 and ‘96). Dependent: Ln (Sale Price) Adjusted R Square : 0.746 Standard Error of Est. : 0.1733 F : 629.03 Sig. 0.000
Variable B Std. Error Beta t Sig. VIF (Constant) 9.784478 .037933 257.941 .000 Ln (Lot Size) (Sq. m.) .137428 .004636 .275 29.642 .000 3.478 Street Corner Lot in 1986 .044216 .017807 .016 2.483 .013 1.683 Street Corner Lot -.043137 .010807 -.025 -3.992 .000 1.630 Living Area (Sq. m.) .003579 .000069 .365 52.147 .000 1.978 Condo * Living Area .000354 .000122 .030 2.902 .004 4.226 Finished Basement .049261 .004079 .071 12.076 .000 1.379 Ln (Apparent Age) (years) -.107975 .002411 -.305 -44.781 .000 1.878 2nd Washrooms in 1986 -.021350 .007372 -.027 -2.896 .004 3.614 2nd Washrooms .036120 .005648 .058 6.396 .000 3.324 2nd Washrooms in 1996 -.030025 .008325 -.032 -3.607 .000 3.176 Condo * 2nd Washrooms .104199 .014294 .048 7.290 .000 1.759 Fireplace .074635 .004375 .097 17.060 .000 1.312 Condo * Fireplace -.067673 .016465 -.023 -4.110 .000 1.255 Hard Wood Stair in 1986 -.048909 .012433 -.024 -3.934 .000 1.547 Hard Wood Stair .046677 .006958 .045 6.708 .000 1.782 High Quality Floors .050294 .004357 .065 11.543 .000 1.267 Brick > 85% Facing .031470 .006753 .025 4.660 .000 1.174 Clapboard > 51% Facing -.041759 .004598 -.049 -9.082 .000 1.197 Terrace .036862 .013930 .013 2.646 .008 1.049 Veranda .026682 .004391 .032 6.076 .000 1.147 Shed > 2.3 cubic metres .014275 .004173 .019 3.421 .001 1.291 Carport .020402 .006039 .018 3.378 .001 1.146 Single Detached Garage .043526 .007218 .032 6.030 .000 1.131 Double Detached Garage .061812 .009391 .035 6.582 .000 1.113 Single Attached Garage .120635 .009916 .064 12.165 .000 1.110 Double Attached Garage .148177 .016997 .051 8.718 .000 1.384 Double Attached Garage in 1996 -.137251 .034132 -.023 -4.021 .000 1.353 Excavated Pool .110242 .009701 .059 11.364 .000 1.100 Above Ground Pool .016174 .005437 .016 2.975 .003 1.122 Quality Features .132938 .005062 .150 26.260 .000 1.315 Water/Sewer Networks .156370 .019046 .042 8.210 .000 1.054 Number of Months after Dec 1985 .002570 .000070 .339 36.583 .000 3.473 (Number of Months-57.06369)2 -.000028 .000002 -.146 -18.012 .000 2.669 (Tax Rate-2.29059) in 1986 -.055832 .005915 -.076 -9.440 .000 2.607 Tax Rate (% of assessed value $/100$) -.032027 .003635 -.073 -8.811 .000 2.752 Centrality Index .001061 .000168 .044 6.304 .000 1.998 Condo * (Centrality Index-27.38147) .001555 .000380 .027 4.093 .000 1.814 Accessibility Index Workplaces .003602 .000128 .230 28.171 .000 2.692 Rel. Acc. School versus Work in 1986 -.005223 .000671 -.058 -7.789 .000 2.213 Rel. Acc. School versus Work .010317 .000467 .186 22.083 .000 2.864 Condo * Rel. Acc. School Versus Work -.002756 .001160 -.017 -2.375 .018 2.100 Rel. Acc. Work versus Shopping Centre in 1986 -.003254 .000587 -.044 -5.548 .000 2.579 Rel. Acc. Work versus Shopping Centre .007353 .000425 .165 17.311 .000 3.650 Rel. Acc. Work versus Shopping Centre in 1996 .001549 .000583 .018 2.659 .008 1.832 Condo * Rel. Acc. Work versus Shopping Centre .004969 .000896 .034 5.546 .000 1.478 Rel. Acc. Shopping Centre versus Grocery in 1986 -.001204 .000374 -.022 -3.215 .001 1.874 Rel. Acc. Shopping Centre versus Grocery .001151 .000268 .034 4.294 .000 2.484 Condo * Rel. Acc. Shopping Centre versus Grocery .004610 .000704 .041 6.545 .000 1.552
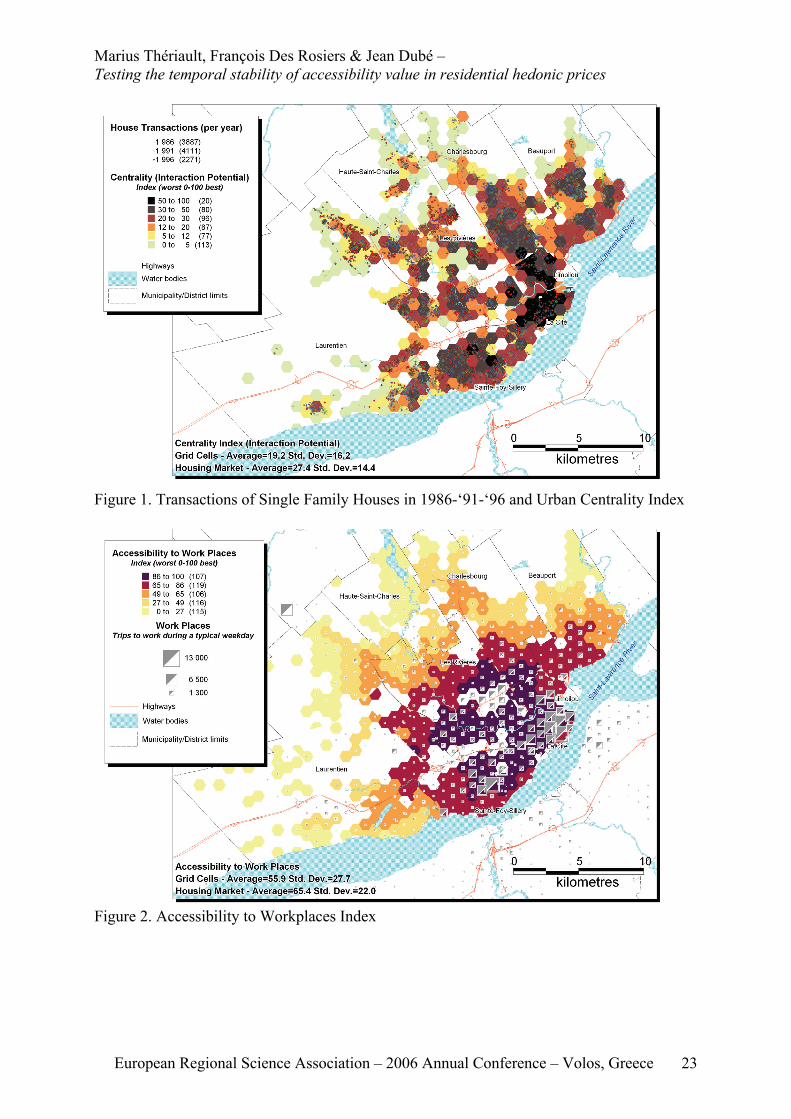
Marius Thériault, François Des Rosiers & Jean Dubé – Testing the temporal stability of accessibility value in residential hedonic prices
European Regional Science Association – 2006 Annual Conference – Volos, Greece 23
Figure 1. Transactions of Single Family Houses in 1986-‘91-‘96 and Urban Centrality Index
Figure 2. Accessibility to Workplaces Index
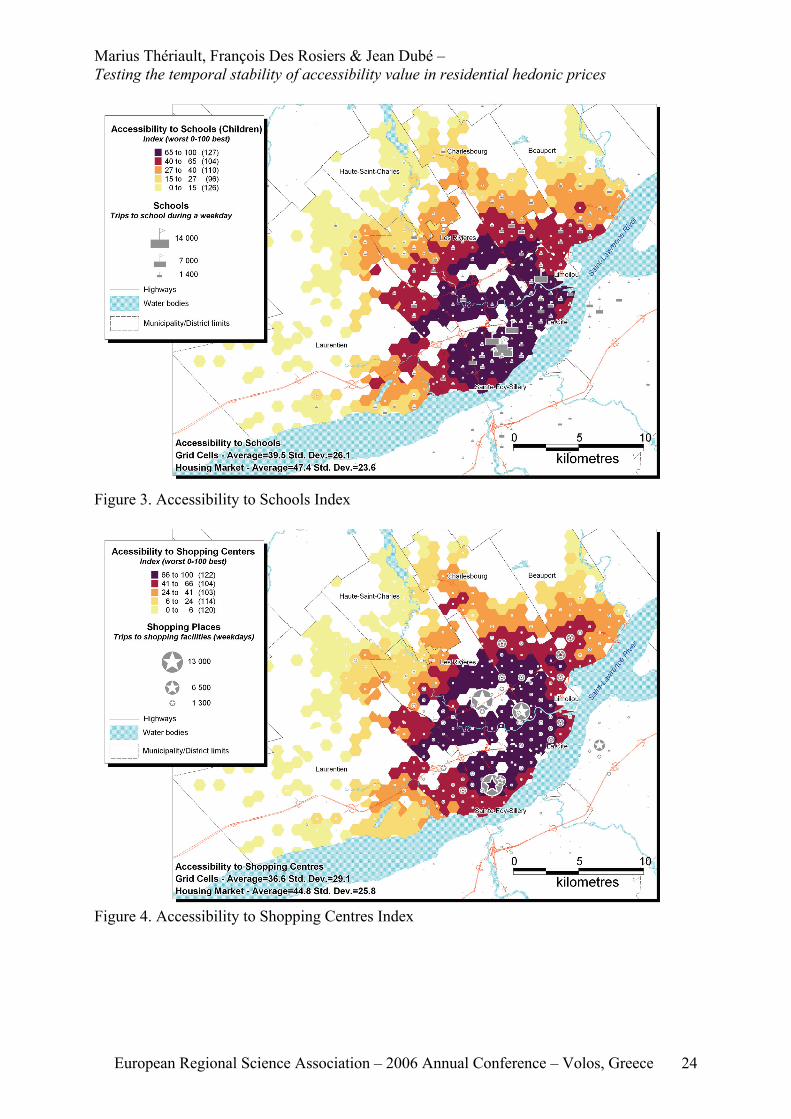
Marius Thériault, François Des Rosiers & Jean Dubé – Testing the temporal stability of accessibility value in residential hedonic prices
European Regional Science Association – 2006 Annual Conference – Volos, Greece 24
Figure 3. Accessibility to Schools Index
Figure 4. Accessibility to Shopping Centres Index
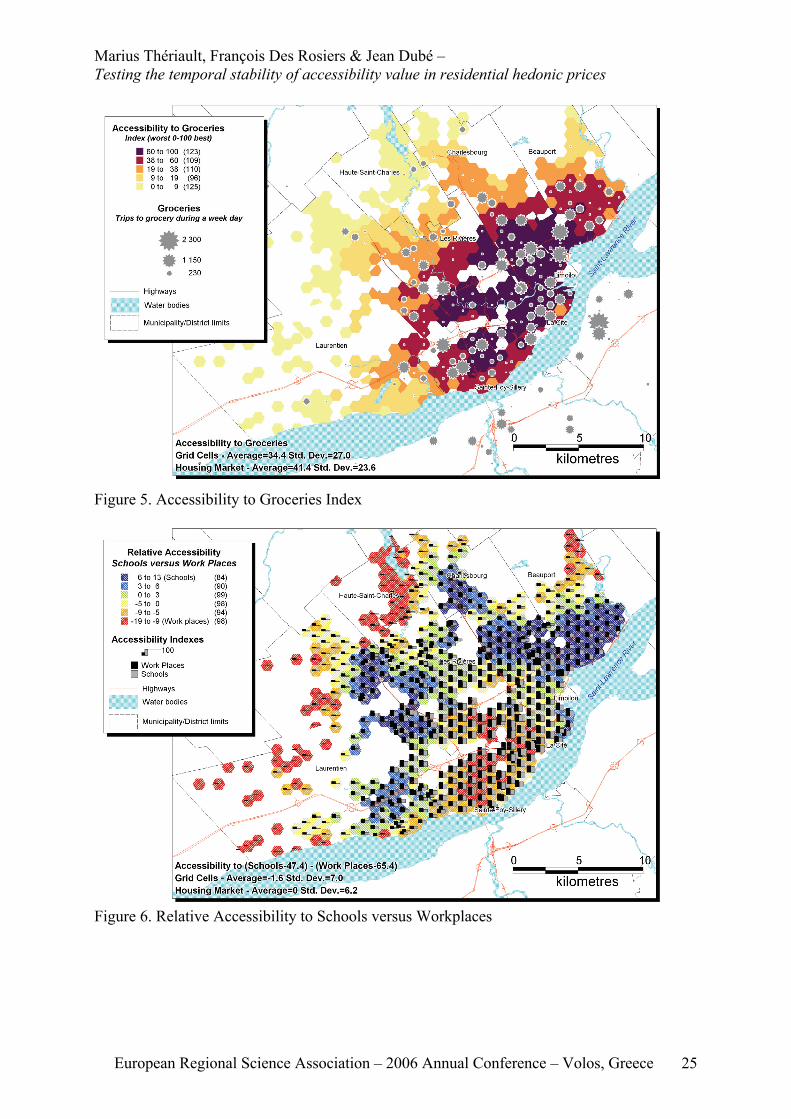
Marius Thériault, François Des Rosiers & Jean Dubé – Testing the temporal stability of accessibility value in residential hedonic prices
European Regional Science Association – 2006 Annual Conference – Volos, Greece 25
Figure 5. Accessibility to Groceries Index
Figure 6. Relative Accessibility to Schools versus Workplaces
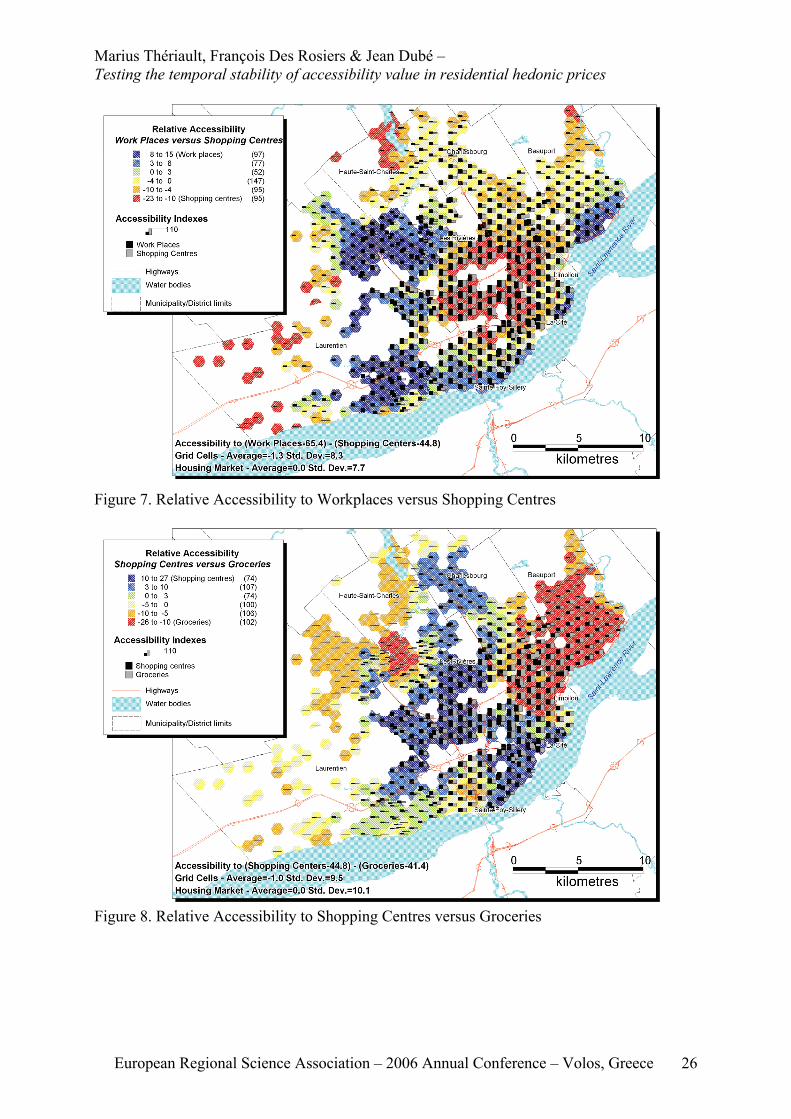
Marius Thériault, François Des Rosiers & Jean Dubé – Testing the temporal stability of accessibility value in residential hedonic prices
European Regional Science Association – 2006 Annual Conference – Volos, Greece 26
Figure 7. Relative Accessibility to Workplaces versus Shopping Centres
Figure 8. Relative Accessibility to Shopping Centres versus Groceries
Copyright © 2022 FDOKUMEN